Densities and Speed of Sound in Aqueous Ammonium Sulfate ...
103
Densities and Speed of Sound in Aqueous Ammonium Sulfate Solutions Containing Glycine or Alanine Mónia Andreia Rodrigues Martins Final Report Dissertation presented to the Escola Superior de Tecnologia e Gestão Instituto Politécnico de Bragança to obtain the degree of Master in Chemical Engineering September of 2012
-
Upload
khangminh22 -
Category
Documents
-
view
4 -
download
0
Transcript of Densities and Speed of Sound in Aqueous Ammonium Sulfate ...

Densities and Speed of Sound in Aqueous Ammonium Sulfate
Solutions Containing Glycine or Alanine
Mónia Andreia Rodrigues Martins
Final Report Dissertation presented to the
Escola Superior de Tecnologia e Gestão
Instituto Politécnico de Bragança
to obtain the degree of Master in
Chemical Engineering
September of 2012

Densities and Speed of Sound in Aqueous Ammonium Sulfate
Solutions Containing Glycine or Alanine
Mónia Andreia Rodrigues Martins
Final Report Dissertation presented to the
Escola Superior de Tecnologia e Gestão
Instituto Politécnico de Bragança
to obtain the degree of Master in
Chemical Engineering
Supervisor:
Simão Pedro de Almeida Pinho
Co-Supervisors:
Maria Olga de Amorim e Sá Ferreira
Ivan Cibulka
September of 2012

To my Grandparents

Acknowledgements
In this short but intense period I learned a lot, personally and professionally. I owe that
to some persons, to whom I thank.
First and foremost I offer my sincerest gratitude to Professor Simão Pinho for his
wisdom, friendship, teaching, excellent supervision, incentives, support and guidance
during the course of this project, for being available when I needed and for providing
me this unique and wonderful experience to study abroad.
I would also like to thank to my Co-Supervisor Ivan Cibulka and the Professor Lubos
Hnědkovský for their time, help in the laboratory activities, teaching, total dedication,
guidance and opinions provided. I also thank my Co-Supervisor Olga Ferreira for the
friendship, teaching and availability.
My grateful acknowledge to Escola Superior de Tecnologia e Gestão (ESTiG) directed
by Professor Albano Alves for the financial support and facilities given, and to the
Institute of Chemical Technology (ICT) for receiving me during these five months.
Finally, my special thanks to my parents, grandparents, brother and my friend Eliana for
all the encouragement and affection.
To all, Obrigada!

Abstract
The main objectives of this work are the measurement of the densities and speed of
sound in aqueous ammonium sulfate solutions containing glycine or alanine.
The study of mixtures containing charged electric species is of great relevance for the
chemical industry. In this work the new experimental information is combined with that
collected from the open literature in order to contribute for an understanding of the
forces that rule biologically important structures.
A systematic experimental program is implemented to measure the densities and speed
of sound in aqueous and in mixed aqueous solutions of ammonium sulfate, (0.1, 0.3,
0.7, 1.0, 1.3, and 2.0) mol·kg-1
, containing glycine or alanine, using a digital densimeter
at (278.15, 288.15, 298.15, 308.15, and 318.15) K.
Density data have been used to calculate the partial molar volumes at infinite dilution
which are evaluated and further used to obtain the corresponding transfer volumes for
amino acids. Hydration numbers, temperature dependence, and side chain group
contributions of amino acids have also been studied.
The parameters obtained from the volumetric study are used to understand various
mixing effects due to the interactions between amino acids and ammonium sulfate in
aqueous solutions. The data suggest that ion charged/hydrophilic group
interactions are predominant and applying the McMillan and Mayer formalism it was
concluded that they are mainly pair wise. According to Hepler (1969) all amino acids, in
water and in aqueous ammonium sulfate solutions, can be considered as a structure
breaking solutes. These results represent a step in building up an empirical database of
different volumetric parameters of protein functional groups in ammonium sulfate and
water.
Keywords: Amino Acid, Electrolyte, Partial Molar Volumes, Adiabatic
Compressibilities.
Resumo
Os principais objectivos deste trabalho são a medição da densidade e da velocidade do
som em soluções aquosas de sulfato de amónio contendo os aminoácidos glicina ou
alanina.
O estudo de misturas contendo espécies eléctricas carregadas é de grande relevância
para a indústria química. Neste trabalho a nova informação experimental é combinada
com informação recolhida na literatura de forma a contribuir para uma melhor
compreensão das forças que regem estruturas biológicas importantes.
Neste trabalho, foi implementado um programa experimental sistemático para medir as
densidades e a velocidade do som em água e em soluções aquosas de sulfato de amónio,
(0.1, 0.3, 0.7, 1.0, 1.3 e 2.0) mol·kg-1
, contendo glicina ou alanina, usando um
densímetro digital a (278.15, 288.15, 298.15, 308.15 e 318.15) K.
Os dados da densidade foram utilizados para calcular os volumes molares parciais a
diluição infinita, os quais foram avaliados e posteriormente utilizados para obter os
correspondentes volumes de transferência para os aminoácidos. Os números de
hidratação, a dependência com a temperatura e as contribuições de grupo da cadeia
lateral dos aminoácidos foram também estudados.
Os parâmetros obtidos a partir do estudo volumétrico foram utilizados para
compreender vários efeitos de mistura devido às interacções entre os aminoácidos e o
sulfato de amónio em soluções aquosas. Os dados de sugerem que as interacções
ião carregado/grupo hidrofílico são predominantes, e aplicando o formalismo de
McMillan e Mayer concluiu-se que elas são maioritariamente do tipo dupleto. De
acordo com Hepler (1969) ambos os aminoácidos, em água e em soluções aquosas de
sulfato de amónio, podem ser considerados como solutos que provocam a rutura da
solução. Estes resultados representam um passo na construção de uma base de dados
empírica de parâmetros volumétricos de diferentes grupos funcionais das proteínas, em
sulfato de amónio e água.
Palavras-chave: Aminoácidos, Electrólito, Volumes Molares Parciais,
Compressibilidades Adiabáticas.

Abstrakt
Hlavním cílem této práce je měření hustot a rychlostí zvuku ve vodných roztocích
síranu amonného obsahující glycin nebo alanin.
Studium směsí obsahujících nabité elektrické částice je velmi významné pro chemický
průmysl. V této práci jsou obsaženy nové informace podložené experimentem a údaji z
odborné literatury, které mohou přispět k pochopení sil, které působí na biologicky
důležité struktury.
Systematický experimentální program je založen na měření hustoty a rychlosti zvuku
vodných a smíšených vodných roztoků síranu amonného (0.1, 0.3, 0.7, 1.0, 1.3, a 2.0)
mol·kg-1
obsahujících glycin a alanin pomocí vibrační trubice digitálního hustoměru a
zvukové cely při teplotách (278.15, 288.15, 298.15, 308.15 a 318.15) K.
Údaje o hustotě byly použity pro výpočet parciálních molárních objemů při
nekonečném zředění, které dále slouží k získání odpovídajících přenosových objemů
aminokyselin. Dále byla zkoumána hydratační čísla, teplotní závislost a skupinové
příspěvky vedlejších řetězců aminokyselin.
Tyto parametry získané na základě studia objemových vlastností jsou použity k
pochopení různých směšovacích efektů, které jsou způsobeny interakcemi mezi
aminokyselinami a síranem amonným ve vodném prostředí. Tyto údaje o
naznačují, že interakce nabitý ion/hydrofilní skupina mají převládající vliv, a na základě
použití formalismu McMiliana a Mayera lze odvodit, že jsou převážně párové. Podle
Heplera (1969) mohou být všechny aminokyseliny ve vodě a vodných roztocích síranu
považovány za látky rozrušující strukturu. Tyto výsledky představují krok při budování
empirické databáze různých objemových parametrů proteinových skupin v síranu
amonném a vodě.
Klíčová slova: Aminokyselina, Elektrolyt, Parciální Molární Objemy, Adiabatické
Stlačitelnosti.

i
Contents
List of Figures ............................................................................................................................. iii
List of Tables ............................................................................................................................... v
List of Abbreviations ...................................................................................................................vi
1. Introduction ......................................................................................................................... 1
1.1 Importance and Motivation ........................................................................................ 1
1.2 Objectives ..................................................................................................................... 1
2. Thermodynamics of Amino Acids Solutions ..................................................................... 3
2.1 Introduction ................................................................................................................. 3
2.2 Production and Use of Amino Acids .......................................................................... 4
2.3 Amino Acids Chemistry .............................................................................................. 7
2.4 Review of Intermolecular Forces ............................................................................... 8
2.5 State of the Art........................................................................................................... 10
2.5.1 Experimental Methods ............................................................................................ 10
2.5.1.1 Density .................................................................................................................... 11
2.5.1.2 Speed of Sound ....................................................................................................... 13
2.5.2 Experimental Data .................................................................................................. 14
2.5.2.1 Water/Amino Acid.................................................................................................. 14
2.5.2.2 Water/Electrolyte/Amino Acid ............................................................................... 16
2.5.3 Modeling and Derived Properties ........................................................................... 18
2.5.3.1 Partial Molar Volumes ............................................................................................ 18
2.5.3.2 Partial Molar Adiabatic Compressibilities .............................................................. 20
2.5.3.3 Interpretation of Intermolecular Interactions .......................................................... 21
2.6 Conclusions ................................................................................................................ 26
3. Experimental Results ........................................................................................................ 28
3.1 Introduction ............................................................................................................... 28
3.2 Experimental Methodology ...................................................................................... 29
3.2.1 Substances .............................................................................................................. 29
3.2.2 Equipment Description ........................................................................................... 29
3.2.3 Procedure ................................................................................................................ 31
3.2.3.1 Solutions Preparation .............................................................................................. 32
3.2.3.2 Experimental Procedure .......................................................................................... 32
3.3 Experimental Measured Data .................................................................................. 36

Contents
ii
3.3.1 Water/Amino Acids Systems .................................................................................. 36
3.3.2 Ternary Systems ..................................................................................................... 38
3.4 Critical Analysis of the Results ................................................................................ 42
3.5 Conclusions ................................................................................................................ 46
4. Theoretical Analysis .......................................................................................................... 47
4.1 Introduction ............................................................................................................... 47
4.2 Co-sphere Overlap Model ........................................................................................ 47
4.3 Hydration Number .................................................................................................... 49
4.4 Temperature Effects ................................................................................................. 50
4.5 Group Contribution .................................................................................................. 52
4.6 Discussion and Interpretation .................................................................................. 54
5. Conclusions ........................................................................................................................ 58
5.1 Main Conclusions ...................................................................................................... 58
5.2 Suggestions for Future Work ................................................................................... 59
References ................................................................................................................................... 61
Appendices .................................................................................................................................. 71
Appendix A: The Chemistry of Amino Acids......................................................................... 71
Appendix B: Literature Review .............................................................................................. 72
Appendix C: Derivation of the Equation to Calculate the Partial Molar Volume ................... 76
Appendix D: Density Values ................................................................................................... 78
Appendix E: Speed of Sound Values ...................................................................................... 82
Appendix F: Ammonium Sulfate Densities Values ................................................................ 86
Appendix G: Example of Calculation of Adiabatic Compressibility through the Speed of
Sound....................................................................................................................................... 88

iii
List of Figures
Figure 2.1. Major application (food and feed ; health and hygiene ; agriculture and technical
application and textiles, packaging and housing ) and current market size of some L-amino
acids, adapted from Becker and Wittmann (2012). ....................................................................... 4
Figure 2.2. Basic structure of α-amino acids. ................................................................................ 7
Figure 2.3. Glycine, the simplest α-amino acid............................................................................. 7
Figure 2.4. Ion hydration co-sphere overlap, adapted from Krishnan et al. (2009). ................... 24
Figure 2.5. The structural interaction of two cospheres, adapted from Lin et al. (2006). ........... 25
Figure 3.1. Experimental apparatus: density and sound velocity meter DSA 5000 from Anton
Paar. ............................................................................................................................................. 30
Figure 3.2. Schematic representation of DSA 5000. ................................................................... 30
Figure 3.3. Distribution of the vials in carousel for 0.3 and 0.7 mol·kg-1
ammonium sulfate
containing glycine (XXGLYZZ where XX is salt molality and ZZ is amino acid molality). ..... 33
Figure 3.4. Partial molar volumes of amino acids in water a different temperatures. ................. 38
Figure 3.5. Partial molar volumes of glycine in water/(NH4)2SO4 solutions, depending on salt
molality, at different temperatures. ............................................................................................. 39
Figure 3.6. Partial molar volumes of alanine in water/(NH4)2SO4 solutions, depending on salt
molality, at different temperatures. ............................................................................................. 39
Figure 3.7. Partial molar volumes of glycine in water/(NH4)2SO4 solutions, depending on the
temperature, at different molalities. ............................................................................................ 41
Figure 3.8. Partial molar volumes of alanine in water/(NH4)2SO4 solutions, depending on the
temperature, at different molalities. ............................................................................................ 41
Figure 3.9. pH as function of amino acid and ammonium sulfate molalities (XXAAZZ where
XX is salt molality, ZZ is amino acid molality and AA the amino acid). ................................... 43
Figure 3.10. Comparison for the partial molar volumes of (a) glycine and (b) alanine in water
(reference values from Zhao, 2006). ........................................................................................... 43
Figure 3.11. Δρ/m2 of glycine at different temperatures and molalities in: (a) water and (b) 2.0
ammonium sulfate. ...................................................................................................................... 44
Figure 3.12. Δρ/m2 of alanine at different temperatures and molalities in: (a) 0.1 ammonium
sulfate and (b) 0.7 ammonium sulfate. ........................................................................................ 45
Figure 3.13. ρ of alanine in 1.3 ammonium sulfate at different temperatures and molalities. ... 45
Figure 3.14. Δρ/m2 for alanine aqueous solutions in 1.3 ammonium sulfate molality at different
temperatures. ............................................................................................................................... 45
Figure 4.1. Standard partial volumes of transfer at different molalities of ammonium sulfate
solution and temperatures in (a), (c) glycine and (b), (d) alanine. .............................................. 48

List of Figures
iv
Figure 4.2. Hydration numbers, for different molalities of ammonium sulfate solution at various
temperatures in (a), (c) glycine and (b), (d) alanine. ................................................................... 50
Figure 4.3. /cm
3·mol
-1·K
-1, in aqueous ammonium sulfate solutions at different
temperatures and molalities in (a) glycine and (b) alanine.......................................................... 52
Figure 4.4. /cm
3·mol
-1·K
-2, in aqueous ammonium sulfate solutions in glycine and
alanine. ........................................................................................................................................ 52
Figure 4.5. ( NH3
+,COO
-; -CH2-)/cm
3·mol
-1, in function of the molality of ammonium
sulfate at 298.15 K. ..................................................................................................................... 53
Figure 4.6. ( NH3
+,COO
-; -CH2-)/cm
3·mol
-1, in function of the temperature in 0.3
ammonium sulfate. ...................................................................................................................... 53
Figure 4.7. Volume of transfer at 1.0 molal of XXSO4 [XX=Mg, Na, (NH4)2] and 298.15 K in
function of the cation radius (Marcus, 1988) [ Mallick and Kishore (2006), Islam and Wadi
(2003) and this work]. .............................................................................................................. 53
Figure G.1. Δ(ρ2u
2)/m2 (kg
3·m
-3·s
-2·mol
-1) of glycine in water at different temperatures and
molalities. .................................................................................................................................... 87
Figure G.2 Δ(ρ2u
2)/m2 (kg
3·m
-3·s
-2·mol
-1) of alanine in 2.0 ammonium sulfate at different
temperatures and molalities. ........................................................................................................ 88

v
List of Tables
Table 2.1. Non-specific physical interactions, adapted from Leckband and Israelachvili (2001). 9
Table 3.1. Comparison of the partial molar volumes of amino acids in pure water.................... 37
Table 3.2. Partial molar volume, aV (kg2·m
-3·mol
-1) and r
2 for glycine and alanine in
water/ammonium sulfate solutions at different temperatures. .................................................... 40
Table 3.3. Ammonium sulfate densities (kg·m-3
) at different temperatures and molalities. ....... 44
Table 4.1. Standard partial volumes of transfer, /cm
3·mol
-1, for the amino acids from water
to different ammonium sulfate solutions at various temperatures............................................... 48
Table 4.2. Pair and triplet interactions coefficients, VXY, and VXYY, of glycine and alanine in
aqueous ammonium sulfate solutions. ........................................................................................ 49
Table 4.3. Hydration numbers for the amino acids at different molalities of ammonium sulfate
solution at several temperatures. ................................................................................................. 49
Table 4.4. Constants a, b and c of glycine and alanine in aqueous ammonium sulfate solutions at
different temperatures. ................................................................................................................ 51
Table 4.5. Contribution to the partial molar volumes from zwitterionic end groups (NH3+, COO
-
) and -CH2- in water and in aqueous ammonium sulfate solutions from T = (278.15 to 318.15)
K.. ................................................................................................................................................ 53
Table A.1. α-Amino acids found in proteins. .............................................................................. 71
Table B.2. Binary systems (AA+H2O). ....................................................................................... 72
Table B.2. Ternary systems (AA+salt+H2O). ............................................................................. 73
Table D.1. Density values measured for aqueous systems AA + H2O. ....................................... 78
Table D.2. Density values measured for ternary systems, AA + salt + H2O. .............................. 79
Table E.1. Speed of Sound values measured for aqueous systems, AA + H2O. ......................... 82
Table E.2. Speed of sound values measured for ternary systems, AA + salt + H2O. .................. 83
Table F.1. Ammonium sulfate densities values for glycine and alanine. .................................... 86
Table G.1. Values needed for the calculation of adiabatic compressibility of glycine in water. 88
Table G.2. Values needed for the calculation of adiabatic compressibility of alanine in 2.0
ammonium sulfate. ...................................................................................................................... 89
vi
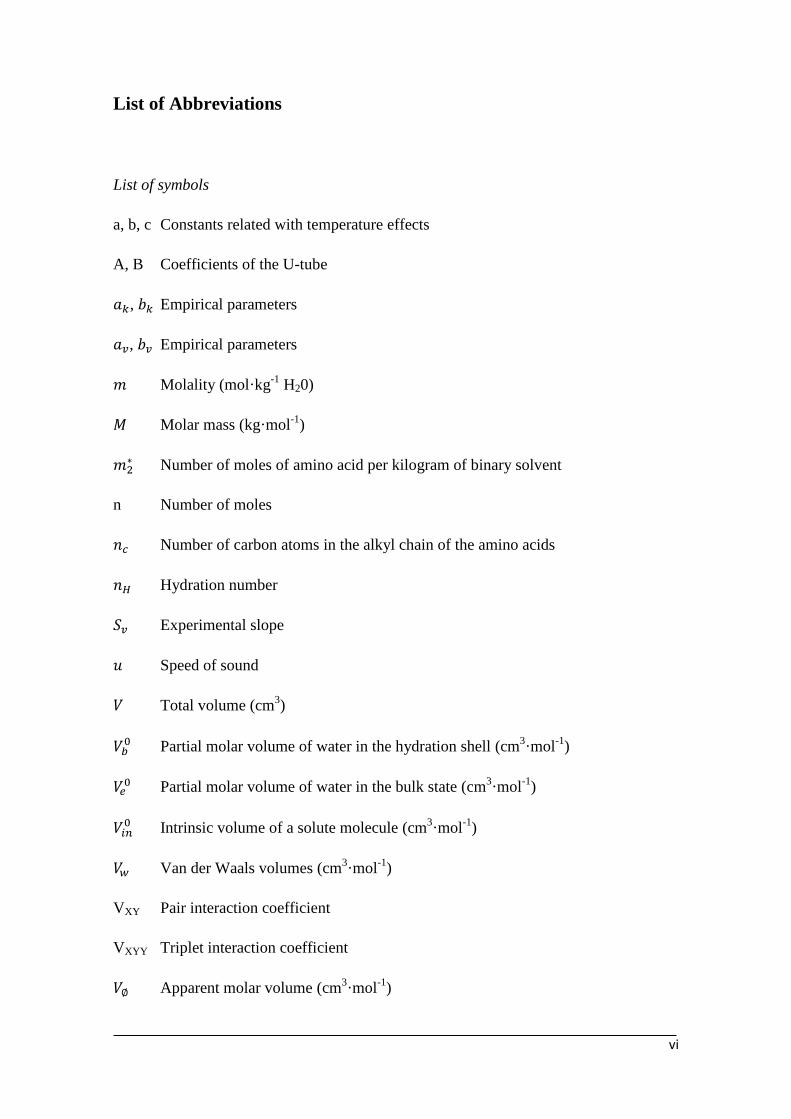
List of Abbreviations
List of symbols
a, b, c Constants related with temperature effects
A, B Coefficients of the U-tube
, Empirical parameters
, Empirical parameters
Molality (mol·kg-1
H20)
Molar mass (kg·mol-1
)
Number of moles of amino acid per kilogram of binary solvent
n Number of moles
Number of carbon atoms in the alkyl chain of the amino acids
Hydration number
Experimental slope
Speed of sound
Total volume (cm3)
Partial molar volume of water in the hydration shell (cm
3·mol
-1)
Partial molar volume of water in the bulk state (cm
3·mol
-1)
Intrinsic volume of a solute molecule (cm
3·mol
-1)
Van der Waals volumes (cm3·mol
-1)
VXY Pair interaction coefficient
VXYY Triplet interaction coefficient
Apparent molar volume (cm3·mol
-1)

List of Abbreviations
vii
Standard partial molar volume (cm
3·mol
-1)
Standard partial molar volume of transfer (cm
3·mol
-1)
Mass of the specie i (kg)
Greek Letters
Partial molar adiabatic compressibilities (cm
3·mol
-1·GPa
-1)
Densities of dry amino acids (g·cm-3
)
Change in density (g·cm-3
)
Density (g·cm-3
)
Oscillation period
Subscripts
B Binary
T Ternary
1 Water
2 Amino acid
3 Electrolyte
Abbreviations
AA Amino Acid

1
1. Introduction
1.1 Importance and Motivation
Amino acids are the main components of proteins, its building blocks, and became a
very important subject due to their biological and industrial importance. Amino acids
are used in a large variety of applications, mainly in food and chemical industries. Due
to their importance in biochemistry, the amino acids also strongly attracted the attention
of researchers to understand and describe their physical-chemical properties.
For researchers in biochemistry and biophysics the knowledge of thermodynamics
properties of molecules of biological interest is frequently of importance, both for
planning experiments and understanding molecular interactions. Among the various
thermodynamics properties, density and speed of sound measurements of high precision
have become significant toward investigating molecular interactions in solutions. In this
work, the new experimental information will contribute to better understand the forces
that rule biological important structures.
1.2 Objectives
The main objective of this thesis is to measure density and speed of sound of aqueous
ammonium sulfate solutions containing the amino acids glycine or alanine at five
different temperatures, using salt molalities up to two molal. Following, derived
properties such as partial molar volumes and hydration numbers are calculated to obtain
information concerning the interactions in solution.
In chapter 2 an introduction to the thermodynamics of amino acids solutions is given, as
well as their chemistry, production and main uses. A critical review of the available
information from the open literature, concerning experimental methods and data, is also
addressed. The derived properties, partial molar volumes and partial molar adiabatic
compressibilities are after discussed.
Chapter 3 deals with the experimental measurements of density and speed of sound. The
techniques chosen to perform the experimental measurements are presented and details
about the procedure as well.

Chapter 1. Introduction
2
The experimental results obtained for the density and speed of sound in water or in
aqueous ammonium sulfate solutions containing the amino acids glycine or alanine in
the temperature range between 278.15 and 318.15 are presented, from which the partial
molar volumes are calculated. A critical analysis of the data is also displayed.
The theoretical analysis is presented in chapter 4. The density data obtained in this work
were used to obtain the hydration numbers and the groups contribution. The Co-sphere
Overlap Model, the McMillan and Mayer formalism and the temperature effects are also
discussed.
In chapter 5 are presented the main conclusions derived from the present work and
suggestions for future work.

3
2. Thermodynamics of Amino Acids Solutions
2.1 Introduction
Amino acids are found in all living organisms on earth. Because of their biological and
industrial importance, their physical and chemical properties became a very important
studied subject.
The main reasons to study the thermodynamics properties of solutions containing amino
acids are directed towards problems in protein chemistry. Thermodynamic data on
proteins are generally provided by calorimetric and volumetric methods (Chalikian et
al., 1994). The volumetric approach is based on evaluation of the partial molar volumes,
expansibilities and adiabatic compressibilities of protein systems. For the researchers in
biochemistry and biophysics the knowledge of thermodynamics properties of molecular
of biological interest is frequently of importance, both in the planning of experiments
and in understanding molecular interactions.
In this chapter, some aspects about the production of amino acids are firstly presented;
since its discovery in animal and plant proteins in the nineteenth century, most amino
acids have been produced by extraction, after protein hydrolysis, enzymatic reaction or
fermentation (Kirk-Othmer Encyclopedia). It is also showed that amino acids are widely
used in industrial processes, particularly in food, feeds, chemical, medical,
pharmaceutical, and cosmetics industries. The chemistry of amino acids will be
considered due to the relationship between their properties, structure and biological
functions. In this concern, a review about intermolecular forces in biological systems is
also addressed. Finally, experimental techniques applied for the determinations of the
density and speed of sound, experimental data collected from the open literature and
theoretical analysis of derived properties (hydration numbers and transfer volumes)
concerning aqueous amino acids solutions, with or without ammonium sulfate, are
overviewed.

Chapter 2. Thermodynamics of Amino Acids Solutions
4
2.2 Production and Use of Amino Acids
All amino acids possible to be found in proteins can be produced and are currently
available commercially. Their uses are growing as they have own characteristic effects
in flavoring, nutrition and pharmacology.
The amino acid business is a multi-billion dollar enterprise. In 2003, the total annual
worldwide consumption of amino acids was estimated to be over 2 million tons
(Hermann, 2003). All amino acids are sold, albeit each in greatly different quantities.
Glutamic acid, lysine and methionine account for the majority, by weight, of amino
acids sold. The major producers of amino acids are based in Japan, the United States of
America, South Korea, China and Europe.
Figure 2.1. Major application (food and feed ; health and hygiene ; agriculture and technical
application and textiles, packaging and housing ) and current market size of some L-amino acids,
adapted from Becker and Wittmann (2012).
Currently, the amino acids are mainly manufactured by the fermentation method using
natural materials, similar to yogurt, beer, vinegar, soy sauce, etc. In this method the
microorganisms convert nutrients to various vital components necessary to themselves.
With the fermentation method, raw materials such as syrups are added to
microorganism culture media, and the proliferating microorganisms are allowed to
produce amino acids. Consecutive reactions by 10 to 30 kinds of enzymes are involved
in the process of fermentation, and various amino acids are produced as a result of these
reactions (Shiio and Nakamori, 1989). Glutamic acid and lysine are made by
fermentation. The amino acids which are produced by this method are mostly of the L-

Chapter 2. Thermodynamics of Amino Acids Solutions
5
form. The fermentation method has the advantage of mass production at low cost, which
was the great impetus for expanding the amino acid market (Kirk-Othmer
Encyclopedia).
In addition to the fermentation method, the enzymatic reaction and extraction methods
are used for producing amino acids. Some amino acids like DL-alanine, glycine and DL-
methionine are produced by chemical synthesis, of which, DL-alanine was the first
(Matoba et al., 1982 and Strecker, 1850). With the enzymatic reaction method, an amino
acid precursor is converted to the target amino acid using 1 or 2 enzymes. This enzyme
method allows the conversion to a specific amino acid without microbial growth, thus
eliminating the long process from glucose. This method comes into its own when the
amino acid precursor is supplied at low prices. L-alanine was produced from the
substrate L-aspartic acid through this method. With the extraction method, natural
proteins are degraded to various amino acids, but the amount of each amino acid
contained in the raw material proteins naturally restricts the yield and there are many
problems in the efficient isolations of the desired amino acid in the pure form. Choosing
between processes depends on available technology, costs of raw material, market
prices and sizes, and the environmental impact of the process itself.
Amino acids are used for a variety of applications in industry, but their main use is as
additives to animal feed (lysine, methionine, and threonine), flavor enhancers
(monosodium glutamic, serine, and aspartic acid) and as specialty nutrients in the
medical field. Aspects about the utilization and production of amino acids were
surveyed by Izumi et al. (1978). According to these authors, in the seventies, the most
important applications of amino acids included the fortification of plant food and feeds
by supplementation of the deficient essential amino acid(s). Apart from their uses in the
food industry, medical applications of amino acids (nutritional preparations and
therapeutic agents) were becoming increasingly important.
Nowadays the amino acids have an application area much more extensive, they are used
in feeds, food, medicine, cosmetics and in chemical industries. In animal nutrition,
amino acids are added to the feeds, when they are lacking, to improve the economical
growth of the animals without affecting their growth response. In Western Europe, for

Chapter 2. Thermodynamics of Amino Acids Solutions
6
example, L-threonine and L-lysine are usually added to the wheat and barley (Kirk-
Othmer Encyclopedia).
The food industry is also a major consumer of amino acids. Beyond their nutritive
value, each amino acid has its characteristic taste of sweetness, sourness, saltiness,
bitterness or umami, which is related to their structure (Schallenberger et al., 1973).
Glycine and alanine, the amino acids focused in this study, are slightly sweet. Glycine is
used for sweet jams and salted vegetables, sauce, vinegar and fruit juice. In foods for
humans, the flavor uses of amino acids, specially the artificial sweetener, represent the
dominant factor in total market value. Similar technology to that used for animal
nutrition is employed in the human nutrition industry to alleviate symptoms of mineral
deficiencies, such as anemia. Amino acids are major additives in dairy industry. The
other major use of amino acids is as buffers or acid correctors. Glycine is used as such
in wine and soft beverage. Likewise glycine also finds use as an anti-oxidant in e.g.
cream and cheese. Because glycine also retains the reproduction of bacteria, e.g. E.
coli., is used as an antiseptic agent for fish flakes (Kirk-Othmer Encyclopedia).
In the medicine field many amino acids have been used or studied for pharmaceutical
purposes, such as treating type I diabetes, lesions and wounds. They are used too in
pharmaceutical industry for the treatment of Parkinson's disease and depression related
disorders. Glycine is medically used in amino acid injection solution as nutritional
infusion and as a raw material for making L-Dopa, a pharmaceutical for treating
Parkinson's disease. Amino acids are also widely used in cosmetics because they and
their derivatives exhibit a controlling or buffering effect of pH variation in skin and a
bactericidal effect. Serine, for example, is one component of skin care cream or lotion.
Recently, as some amino acids (eg, L-glutamic acid, L-lysine, glycine, DL-alanine, DL-
methionine) have become less expensive chemical materials, they have been employed
in various application fields of industrial chemical. Poly(amino acids) as potential
source for biodegradable plastics is under research. The chelating ability of amino acids
has been used in fertilizers for agriculture to facilitate the delivery of minerals to plants
in order to correct mineral deficiencies, such as iron chlorosis. These fertilizers are also
used to prevent deficiencies from occurring and improving the overall health of the

Chapter 2. Thermodynamics of Amino Acids Solutions
7
plants (Ashmead, 1986). In the fertilizer industry glycine is used as a solvent for
removing CO2, and is also an intermediate in the production of pesticides.
2.3 Amino Acids Chemistry
Amino acids (AA) are defined as organic substances containing both amino and acid
groups. Among more than 300 AA in nature, only 20 of them (α-AA) serve as building
blocks of protein, of which 19 are α-amino acids and one is a cyclic α-amino acid
(proline). Contrary to plants and some microorganisms, animals and humans are only
capable of synthesizing 10 of the 20 naturally occurring amino acids. The rest must be
included in the diet; these amino acids are classified as essential. Because of variations
in their side chains, amino acids have remarkably different biochemical properties and
functions (Wu et al., 2007).
From a chemical viewpoint an amino acid is a base as well as an acid; i.e. it consists
both of an amino group and a carboxylic group. The amino acid is therefore an
ampholyte since it can react both as a base and as an acid. The most common amino
acids are the α-amino acids, which are amino acids where the amino group is located at
the α-carbon atom of the carboxylic group as shown in Figure 2.2. The α-carbon atom
(usually) has hydrogen and a side chain at the last two sites.
Figure 2.2. Basic structure of α-amino acids.
If the side chain is also an hydrogen, the compound is the simplest amino acid glycine,
as presented in Figure 2.3.
Figure 2.3. Glycine, the simplest α-amino acid.

Chapter 2. Thermodynamics of Amino Acids Solutions
8
Because of the chirality of the α-carbon atom the amino acids exist in two enantiomers.
They can be characterized by their ability to rotate light to the right (+) or to the left (-),
depending on the solvent and the degree of ionization. The DL-notation is
experimentally based, only. Except for glycine, all AA can have L- and D-isoforms.
When two amino acids are linked together by a peptide bond are called a dipeptide.
Continuing this process will eventually lead to the formation of protein (Morrison and
Boyd, 1992). Amino acids have a higher solubility in polar solvents (e.g. water,
ammonia) than in less polar solvents (e.g. ethanol, methanol, acetone). They are
crystalline solids with relatively high melting points. In aqueous solutions, the amino
acids are generally stable, at physiological pH, and they exist as neutral dipolar ions,
i.e., due to physiological conditions, the two terminals of amino acids are both charged;
positive charge (amino group ) and negative charge (carboxyl group, ),
therefore the molecules have the properties of zwitterion (Venkatesu et al., 2007). The
pH at which the dipolar ions do not migrate in an electric field is called the isoelectric
point, pI. It is the point at which the acid and the base action of the ampholyte is equal.
At this pH the concentration of zwitterion is maximum and those of cations and anions
are minimum and equal. Each amino acid has a particular isoelectric point. The twenty
amino acids, along with the respective structures, common names, and the customary
three-codes that abbreviate their names can be consulted in Table A.1.
2.4 Review of Intermolecular Forces
When molecules, atoms or ions approaching each other two phenomena may occur,
reaction or interaction. In chemical interactions molecules attract or repel each other,
without the occurrence of breakage and/or forming new chemical bonds such as in
reactions. The intermolecular interactions arise due to intermolecular forces, which are
essentially electrical and they make a molecule influence the behavior of other
molecules in their vicinity. The behavior of the intermolecular forces varies with the
inverse of the distance separating the molecules involved, i.e., interactions are stronger
for smaller separation distances between the molecules (Leckband and Israelachvili,
2001).
The intermolecular interactions and their understanding have a crucial importance in
biological systems and are closely related to the thermodynamic properties of liquids,

Chapter 2. Thermodynamics of Amino Acids Solutions
9
solids and gases. The molecules of life (DNA, RNA, proteins) are held in three-
dimensional structures through the intra and intermolecular interactions. Since the three-
dimensional molecular structure is responsible for specific biological activities of these
molecules, it is then clear the importance of understanding these interactions
(Chimankar et al., 2011).
A biological interaction is often very different from a chemical reaction or physical
change in a system. This is due, in part, to the high complexity of biological
macromolecules. Furthermore, the interactions between these compounds do not occur
linearly and they are dynamic because biological systems are never in thermodynamic
equilibrium. The complex biological interactions that often involve different molecules
or aggregate structures occur over long distances, and evolve over time which prevents
its rigorous understanding in terms of the fundamental laws of physics or even
chemistry (Leckband and Israelachvili, 2001).
The forces and interactions may be specific or non-specific. The non-specific forces are
those that arise from many different types of atoms, molecules, molecular groups or
surfaces, and which can be generally described in terms of a potential of generic
interaction or a force. The main physical forces that fall into this category are listed in
Table 2.1. The specific interactions arise when a unique combination of physical forces
or bonds between two molecules act together cooperatively in the space to originate a
connection (generally) strong, but non-covalent. These interactions usually arise from a
synergy of various geometries and bonds steric, ionic and directional (Leckband and
Israelachvili, 2001). The forces that stabilize protein structures are predominantly of a
non-covalent nature (Tanford, 1968).
Table 2.1. Non-specific physical interactions, adapted from Leckband and Israelachvili (2001). Name/type of interaction or bond Special features
van der Waals A force that exists between all bodies. Usually attractive,
but can be repulsive.
Electrostatic
(also Coulomb, ionic, double-layer)
A force that exists only between charged molecules (ions)
or surfaces. Can be attractive or repulsive.
Hydrogen bonding
A special electrostatic binding (attractive) interaction
involving positively charged H atoms covalently bound
to electronegative atoms. Directional.
Hydrophobic A special attractive interaction in water between inert, non-
polar molecules or surfaces.

Chapter 2. Thermodynamics of Amino Acids Solutions
10
A dependence on pH and/or ionic strength is the signature of electrostatic interaction.
The dominant element of a hydrogen bond is electrostatic interaction between hydrogen
atoms and highly electronegative atoms such as N, O and occasionally S. It is stronger
than van der Waals interactions but weaker than charge-charge interactions. Arguably,
hydrogen bonds are one of the major contributors to protein folding. It is difficult to
account for other interactions such as van der Waals that contribute significantly to
measure thermodynamic properties. The hydrophobic effect is another force that is
driven by solute solvent interactions and plays important role in protein stability. This
effect occurs because of the unfavorable interactions between water molecules and the
nonpolar groups of a protein (Leckband and Israelachvili, 2001).
In order to contribute to the understanding of molecular interactions in systems
containing biological molecules two thermodynamic properties were selected; partial
molar volumes and adiabatic compressibilities, whose relevance is presented in this
work.
2.5 State of the Art
The aim of this thesis is to study the thermodynamics properties of aqueous amino acids
solutions with or without a salt, because of their particular importance in biology.
Before start any experimental work is fundamental carry out a detailed literature review.
In this case it will help deciding the systems and conditions to perform the experimental
measurements, the type of experimental methods and analytical techniques to
implement. A literature search in terms of the experimental available data is needed, in
order to establish the experimental program. It is also necessary to review theoretical
interpretations already proposed and accepted by the scientific community.
2.5.1 Experimental Methods
In the following sections critical evaluation of the different measuring techniques of
density and sound speed is presented.

Chapter 2. Thermodynamics of Amino Acids Solutions
11
2.5.1.1 Density
For the density determination there are several experimental methods and devices used
like hydrodensitometry, pycnometry, hydrometer and digital density meters (hydrostatic
pressure-based instruments, vibrating element transducers, ultrasonic transducer,
radiation-based gauge). But the most widely used are pycnometry and densimetry
(Assael et al., 2011).
The hydrodensitometry is a method that measures the density of a solid sample by solid
volume determinations. Using a spring scale, the sample is weighed first in air and then
in water. This technique cannot easily be used to measure relative densities less than
one, because the sample will then float (Brožek et al., 1963).
Pycnometry technique, widely used due to its low cost, is currently in disuse because is
a somewhat imprecise method. In this technique is used a pycnometer to measure the
density. The pycnometer is a glass flask with a close-fitting ground glass stopper with a
capillary hole through it. This fine hole releases a spare liquid after closing a top-filled
pycnometer and allows for obtaining a given volume of measured and/or working liquid
with a low accuracy (Dhir, 2011). Before being used is calibrated using a working
liquid with well-known density, usually, double distilled water. To maintain the
temperature of the water uniform a thermostatic bath is used. The pycnometer is held
approximately 30 minutes in a water bath, for minimize the thermal fluctuation of the
density. The density of water at different temperatures required for the calibration can
be obtained using, for example, the standard equation proposed by Islam and Waris
(2004).
The relative density of a liquid can be measured using a hydrometer. This consists of a
bulb attached to a stalk of constant cross-sectional area. First the hydrometer is floated
in the reference liquid, and the displacement (the level of the liquid on the stalk) is
marked. The reference could be any liquid, but in practice it is usually water. The
hydrometer is then floated in a liquid of unknown density. The change in displacement
is noted. It is necessary that the hydrometer floats in both liquids. The application of
simple physical principles allows the relative density of the unknown liquid to be
calculated from the change in displacement (Ashwortha et al., 2001). In practice the
stalk of the hydrometer is pre-marked with graduations to facilitate this measurement.

Chapter 2. Thermodynamics of Amino Acids Solutions
12
Hydrometers may be calibrated for different uses, such as a lactometer for measuring
the density (creaminess) of milk, a saccharometer for measuring the density of sugar in
a liquid, or an alcoholometer for measuring higher levels of alcohol in spirits (Lorefice
and Malengo, 2006).
In the technique of densimetry is usual to use a densimeter digital commercialized by
the brands such as Anton PAAR, Metler-Toledo, Inter Alia, that can be calibrated with
n-heptane, aqueous solutions of sodium chloride, dry air, distilled water, etc. To
perform a measurement of density, accurately and reproducibly, it is necessary to
perform a water check every day before measurements, if it fail an adjustment of the
instrument constants is compulsory. The sample preparation should be done with care,
and the same way every time, and the filling of the measuring cell must be made
carefully and without bubbles. The use of automatic sample filling devices eliminates
filling errors due to the operator. After the measurement, the sample should be
immediately remove from the measuring cell. Cleaning the instrument regularly is also
an essential condition for a good measurement. The digital densimeters may have
implemented different technologies and methodologies. Some of them will be presented
below.
The hydrostatic pressure-based instruments technology relies upon the Pascal Principle
which states that the pressure difference between two points within a vertical column of
fluid is dependent upon the vertical distance between the two points, the density of the
fluid and the gravitational force. This technology is often used for tank gaging
applications as a convenient means of liquid level and density measure (Lipták, 2003).
The vibrating element transducers are instruments that require a vibrating element to be
placed in contact with the fluid of interest. The resonant frequency of the element is
measured and is related to the density of the fluid by a characterization that is dependent
upon the design of the element. One of the methodologies most used in this case is the
so called oscillating U-tube. In this method, the sample is introduced into a U-shaped
tube which is electronically excited to oscillate at a characteristic frequency. The
frequency characteristic changes depending on the density of the sample. Through a
precise determination of the characteristic frequency and a proper fit, can be determined
the density of the sample. Due to the great dependence of the density with temperature,
the measuring cell has to be thermostatically controlled with high precision. The

Chapter 2. Thermodynamics of Amino Acids Solutions
13
vibrating fork immersion probe is another good example of this technology. These
instruments are capable of measurement to 5 to 6 places beyond the decimal point at
temperatures between 0 and 80 °C and are used in the brewing, distilling,
pharmaceutical, petroleum and other industries (Lipták, 2003).
In ultrasonic transducer, ultrasonic waves are passed from a source, through the fluid of
interest, and into a detector which measures the acoustic spectroscopy of the waves.
Density can be inferred from the spectrum (Lipták, 2003).
In radiation-based gauge, radiation is passed from a source, through the fluid of interest,
and into a scintillation detector, or counter. As the fluid density increases, the detected
radiation counts will decrease. The source is typically the radioactive isotope cesium-
137, with a half-life of about 30 years. A key advantage for this technology is that the
instrument is not required to be in contact with the fluid—typically the source and
detector are mounted on the outside of tanks or piping (Lipták, 2003).
The high precision densimeters are able to correct viscosity and have a reference
oscillator which is very useful because it allows accurate results in a wide range of
temperatures using only one adjustment.
2.5.1.2 Speed of Sound
The most common techniques for measuring the speed of sound can be categorized as
variable-frequency fixed-cavity resonators, variable path-length fixed-frequency
interferometers, and time-of-flight methods. These methods can be selected given a
knowledge of the phase of the material and the geometry that can be employed (Assael
et al., 2011).
In principle, the measurements of a single resonance frequency of a known mode of
oscillation within a cavity of known dimension, or of a single time-of-flight over a
known distance, is sufficient to determine the speed of sound. To determine the speed of
sound from standing-wave measurements in either a cavity or interferometer requires
efficient reflection of sound at the interface between the medium and the wall of the
container and this is necessarily the case when the acoustic impedances (the product of
density and sound speed) of the medium differs greatly from that of the wall (Assael et
al., 2011).

Chapter 2. Thermodynamics of Amino Acids Solutions
14
For liquids there are essentially two methods that are used to determine the speed of
sound and these are variable path-length fixed-frequency interferometry and time-of-
flight measurements. The time-of-flight methods can be divided into single and multiple
path-length devices. A single path pulse echo apparatus that was modified by a
fractional uncertainty of < ±0.5 % typically operate at frequencies on the order of 10
MHz and can be operated at temperatures up to 2100 K and pressures up to 200 MPa,
although more typically at temperatures of less than 500 K. The path length is
determined by calibration measurement with water for which the sound speed is known
with sufficient precision. Time-of-flight measurements are often used for solids albeit
with methods, which differ from those adopted for liquids (Assael et al., 2011).
2.5.2 Experimental Data
Experimental data are essential in the development, design, and modeling of separation
process, in the following sections the information collected concerning the properties of
interest is briefly presented.
2.5.2.1 Water/Amino Acid
The study of density and speed of sound in aqueous solution of amino acids is of
paramount importance, as it provides information about the nature of molecular
interactions. Another important aim of such studies lies on the effects of amino acids on
the structure of water. The interactions of water with the various functional groups of
amino acids play a crucial role in determining the conformational stability of proteins
(Dhir, 2011).
In Table B.1 is presented a literature review of those properties in amino acids aqueous
solutions, highlighting the properties measured and the respective temperature ranges.
Some of these studies are focused below.
Rao et al. (1984) have described a method of estimating partial molar volumes of α-
amino acids in water, starting from the partial molar volume of glycine. For eleven
zwitterionic amino acids the estimated partial molar volumes are found to be in very
good agreement with the experimental values given in the literature. The method has

Chapter 2. Thermodynamics of Amino Acids Solutions
15
given good results for the ionic species of lysine and arginine but not for all species of
aspartic and glutamic acids.
Apparent molar volumes, expansibilities, and adiabatic compressibilities of a
homologous series of eight α,ω-aminocarboxylic acids within the temperature range 18-
55 ºC were measured by Chalikian et al. (1993). They found that at low temperatures,
water that hydrates CH2 groups in α,ω-amino acids is less compressible than bulk water,
while at high temperatures the opposite is true, and the water in the hydration shells of
aliphatic groups differs from water that hydrates charged groups, not only in the
absolute values of the density and the coefficient of adiabatic compressibility, but also
in the temperature dependences of these characteristics.
The densities and speeds of sound in dilute aqueous solutions of some the L-amino
acids, were measured at (5, 15, 25, 35, and 45) °C by Yasuda et al. (1998). Partial molar
volumes and partial molar isentropic compressibilities at infinite dilution were
evaluated and discussed. The partial molar volumes of all the amino acids studied
increase with increasing temperature and, furthermore, their curves obtained are always
concave downward. This feature is typical of aqueous electrolyte or hydrophilic
nonelectrolyte solutions (Hepler, 1969). In this work the authors also showed that
compressibility decreases steeply decreasing temperature; that is characteristic for dilute
aqueous mixtures, regardless of whether they are hydrophilic or hydrophobic solutes.
Recently, Zhao (2006) collected published standard molar volumes for a large number
of aqueous amino acids under atmospheric pressure. The consistency of different
sources was checked and a value is proposed at 298.15 K. However, for other
temperatures the information is scarce and present large variations. Nevertheless, his
review allowed to conclude that partial molar volumes of amino acids can be used to
calculate the volumes of amino acids residues. In its turn, these can be used to calculate
the partial molar volumes of peptides and proteins based on the group contribution
methods.
In 2010, Cibulka et al., published density in aqueous solutions of glycine and L-alanine,
at temperatures from 298 up to 443 K and at pressures in the range from (15 to 17)
MPa, and at 30 MPa. The partial molar volumes at infinite dilution were calculated
from these data. They conclude that zwitterions are by far the dominant solute species

Chapter 2. Thermodynamics of Amino Acids Solutions
16
and the change of the measured partial molar volumes due to the presence of other
species can be considered as negligible.
2.5.2.2 Water/Electrolyte/Amino Acid
The addition of electrolytes, to solutions of biologically important molecules such as
proteins, is known to influence their stability and affect their structure and configuration
(Singh and Banipal, 2008). A better understanding of the effect of electrolytes on the
thermodynamic properties of amino acids in aqueous solution is of vital importance
because such studies give useful information regarding protein unfolding and the extent
of hydrophobic interactions of nonpolar side chains (Enea and Jolicoeur, 1982). Salt-
protein interaction induced electrostatic forces are used to play a very important role in
modifying the protein structure by affecting properties like solubility, denaturation and
activity of enzymes (Chimankar et al., 2011).
The salt chosen to perform this work is ammonium sulfate. It is commonly used as its
solubility is so high that salt solutions with high ionic strength are allowed. The
solubility of proteins varies according to the ionic strength of the solution, and hence
according to the salt concentration. Since proteins differ markedly in their solubilities at
high ionic strength, salting-out is a very useful procedure to assist in the purification of
a given protein. The commonly used salt is ammonium sulfate, as it is very water
soluble, forms two ions high in the Hofmeister series, and has no adverse effects upon
enzyme activity. It is generally used as a saturated aqueous solution which is diluted to
the required concentration, expressed as a percentage concentration of the saturated
solution (a 100% solution).
The volumetric and other thermochemical properties of aqueous solutions of salts
containing amino acids (e.g. densities, viscosity, apparent molar volumes, apparent
molar heat capacities, partial molar volumes and compressibility) are important tools to
investigate the interaction between ionic salts and amino acids, and have also been
measured and reviewed by several researchers. These results lead to the conclusion that
some of the electrolytes can stabilize the biological important molecule i.e. proteins
(Chimankar et al., 2011). A compilation of some of these experimental works is
presented in Table B.2. A literature survey shows a considerable lack of information

Chapter 2. Thermodynamics of Amino Acids Solutions
17
and the majority of the data available is at 298.15 K only. Some of the most important
works are shown, focusing those involving the ions ( or
) studied in this work.
Ogawa et al. (1984) measured the density, speed of sound and viscosity of glycine, DL-
alanine, β-alanine, α-aminoisobutyric acid, L-serine and L-threonine in lithium, sodium
and potassium chlorides at 298.15 K. In this study was verified that threonine and serine
had unusual compressibilities. This was attributed to the fact that this both amino acids
have one OH group and consequently hydrogen-bond with water.
Wadi and Ramasami (1997) measured the density and the speed of sound of glycine and
DL-alanine in aqueous solutions of sodium sulfate at 288.15, 298.15 and 308.15 K.
From the analysis of the experimental data, it is found that the introduction of a methyl
group in glycine introduces hydrophobic hydrations in DL-alanine and decreases the
former pure hydrophilic hydrations. This is supported by the fact that the calculated
hydration numbers for DL-alanine are lower than the corresponding ones for glycine.
The dehydrating effect on the amino acids confirms the structure-making ability of
sodium sulfate.
Apparent molar volumes and adiabatic compressibilities of glycine, L-alanine and L-
valine in binary aqueous solutions of MgCl2 have been determined at 298.15 K from
precise density and sound speed measurements by Pal and Kumar (2005a). The results
have been used to estimate the number of water molecules hydrated to the amino acids.
This approach of relating the volume and compressibility behavior seems successful in
obtaining credible values for apparent hydration numbers when applied to amino acids
in aqueous salt solutions.
Concerning the measurements of amino acids density and speed of sound in water /
ammonium sulfate, no literature data was found, but electrolytes involving one of the
cation or anion with glycine or alanine are possible to find in the workers by Natarajan
et al. (1990), Wadi and Ramasami (1997), Islam and Wadi (2003), Singh and Kishore
(2003), Mallick and Kishore (2006), Sadeghi and Gholamireza (2011) and Sinha et al.
(2011).

Chapter 2. Thermodynamics of Amino Acids Solutions
18
2.5.3 Modeling and Derived Properties
Thermodynamic properties of amino acids, i.e., proteins in electrolyte solution, provide
information about solute-solvent interactions, those are important in understanding the
stability of proteins. Some of these interactions are found applicable in several
biochemical and physiological processes in a living cell (Millero et al., 1978).
Traditionally, thermodynamic models have not been widely used in the biotechnological
industry as is the case in the chemical industry, but it is becoming more prevalent
because of the increasing demand for computer aided design and optimization of
processes (Chimankar et al., 2011).
Understanding the various types of interactions operating between amino acids to
protein folding is an extremely difficult task that has been tried by number of theoretical
and experimental studies. Partial molar volumes derived from density and adiabatic
compressibilities derived from speed of sound, are examples of thermodynamic
properties that contribute to the understanding of molecular interactions in systems
containing biological molecules.
2.5.3.1 Partial Molar Volumes
Density is an important physical characteristic of matter and for pure substances it
depends on the temperature and pressure. Many applications or processes require a
precise knowledge of this property. As a curiosity it is added that the density has a long
history of application in fiscal measures related to quality control, particularly in the oil
and gas industries. Partial molar volume is a thermodynamic property that can be
derived from density. Information about partial molar volume has proved very useful in
the study of solute-solvent interactions in solutions. The concentration dependence of
volume reflects information about solute-solute interactions, which is helpful in
understanding complex biochemical systems.
The standart partial molar volume, , of a solute in solution can be defined as the
apparent volume occupied by one mole of a solute at infinite dilution. The partial molar
volume of a solute can be regarded as the sum of intrinsic volume plus volumetric
effects of solute-solvent interactions. The latter can be divided into different
contributions such as volume due to ion-solvent interaction (in case of ionic solutes) or

Chapter 2. Thermodynamics of Amino Acids Solutions
19
hydrogen bonding between solute and solvent molecules (in case of H-bonded solute-
solvent systems) or hydrophobic hydration (in case of hydrophobic solutes). The group
partial molar volume is also well suited for predicting partial molar volume of different
solutes.
Knowledge of partial molar volume of small molecules like salts, allows rough estimate
of how bonding or unspecific interaction would influence the overall partial molar
volume. This consideration does not influence complicated solvent interaction,
structural changes, etc. Characterization of volume data of a larger number of
compounds studied in the past have shown that hydrophilic group generally decrease
the molar volume because polar groups disrupt the water structure around a hydrophilic
group. It seems that several neighboring hydrophilic groups strengthen this volume
contraction.
Various concepts regarding molecular processes in solutions (solvation, electrostriction,
hydrophobic hydration, micellization and co-sphere overlap during solute-solute
interactions) to a large extent have been derived and interpreted from the partial molar
volume data of many compounds.
From the density measurements, the partial molar volume at infinite dilution (m2 → 0)
of the amino acids, (cm
3·mol
-1) in pure water can be calculated by:
(
) (2.1)
(2.2)
where and are the densities of the solution and pure water, and are the molar
mass and the molality of the amino acid, respectively, and and are empirical
constants obtained by fitting the experimental values in the form .
In ternary systems, AA + salt + water, partial molar volume at infinite dilution are
calculated using:
[
] (2.3)

Chapter 2. Thermodynamics of Amino Acids Solutions
20
(2.4)
where and are densities of the ternary and binary solutions (water/electrolyte) and
and are the molar mass and the molality of the salt, respectively. The
demonstration of the equation 2.3 is presented in Appendix C.
2.5.3.2 Partial Molar Adiabatic Compressibilities
Ultrasonic is a versatile non-destructive technique and highly useful for the
investigation of various physical properties such as residual stress, hardness, grain size
micro structure, elastic constant, etc. Recent developments have found use of ultrasonic
energy in medicine, engineering and agriculture. Ultrasonic study on the amino acids
with aqueous solution of electrolytes and non-electrolytes provides useful information
in understanding the behavior of liquid systems (Millero et al., 1978).
The compressibility is a volumetric property, derived from the speed of sound, that is
known to be a sensitive indicator of molecular interactions and can provide useful
information about these phenomena, particularly in cases when partial molar volume
data alone fail to provide an unequivocal interpretation of the results. The partial molar
adiabatic compressibility of a solute is a linear function of the first derivative of the
partial molar volume with pressure (Katriňák, 2012). It represents the apparent
compressibility of one mole of a solute at infinite dilution. Analogous to partial molar
volume, the partial molar adiabatic compressibility can be presented as the sum of the
intrinsic and hydration contributions. The intrinsic compressibility of a solute is a
measure of intramolecular interactions, while the hydration induced change in the
solvent compressibility, reflects the influence of the solute molecules on the solvent.
The most important and serious work is to determine the intrinsic compressibility of
globular proteins which is the most significant parameter to study the physical state of
the central of a protein molecule (Leyendekkers, 1986). There are three factors which
are contributing the overall partial compressibility of proteins in solution
(Leyendekkers, 1986): intrinsic, from the residue-residue interaction in the globule
interior; hydration, from surface atomic group-water interaction, and relaxational, from
the structural transformations accompanied by volume changes. Compressibility effect

Chapter 2. Thermodynamics of Amino Acids Solutions
21
of temperature on the various intermolecular interactions cannot be ignored which
ultimately effect the compressibilities (Makhatadze and Privalov, 1992).
The partial molar adiabatic compressibilities, (cm
3·mol
-1·GPa
-1), of the amino acids
solutions are determined using the following equations for binary systems:
(
) (2.5)
[ ]
(2.6)
where and are the speed of sound of the solution and the solvent, respectively, and
and are adjustable parameters fitted from experimental data.
For ternary systems the partial molar adiabatic compressibilities are calculated using:
[
] (2.7)
[ ]
(2.8)
where and are the speed of sound of the ternary and binary solutions
(water/electrolyte).
2.5.3.3 Interpretation of Intermolecular Interactions
The stabilization of biological macromolecules is commonly related to several non-
covalent interactions including hydrogen bonding, electrostatic and hydrophobic
interactions. These interactions are affected by the surrounding solutes and solvent of
macromolecules (Zhao, 2006). Especially, volumetric properties (such as standard
partial molar volumes and partial molar adiabatic compressibilities) as well as changes
in enthalpy and free energy in water and solutions of organic solvents or salts can
provide valuable clues for comprehending the protein unfolding and the hydrophobic
interactions of non-polar side chains.
The standard partial molar volumes of amino acids in solutions containing salts allow to
understand the effect of salt on the hydration of amino acids. These data are often

Chapter 2. Thermodynamics of Amino Acids Solutions
22
embedded with important information of solute hydrophobicity, hydration properties
and solute–solvent interactions (Romero and Negrete, 2004).
The criteria proposed by Hepler (1969), called hydrophobicity criteria, uses the partial
molar volume derivatives with temperature to reflect about the hydrophobicity of the
solute:
If and
, the solute is hydrophilic;
If and
, the solute is hydrophobic.
where is the so-called partial molar expansibility.
Taking into account these criteria, studies presented by Romero and Negrete (2004),
have suggested that hydrophilic interactions between water and amino acids are stronger
than the hydrophobic interactions, but they decrease with increasing length of the
hydrophobic chains. Meanwhile, since
, a negative
value of is associate with a structure-breaking solute and a positive one is
associated with a structure-making solute (Hepler, 1969).
The hydration numbers, , explicitly reveal the hydration degree of a solute in water.
Usually increases with the size of the amino acid in water, or solutions, and can be
calculated from the volumetric properties directly or from the second derivative of the
partial molar volume, or partial molar compressibility, with temperature (Zhao, 2006).
The hydration number can be calculated using the following equation:
⁄ (2.9)
where is the intrinsic volume of a solute molecule,
and are the partial molar
volumes of water in the bulk state and in the hydration shell of a solution. According to
Yan et al. (2004),
cm3.mol
-1 at 278.15, 288.15,
298.15 and 308.15 K, respectively. The value at 318.15 K can be obtained by
polynomial regression of order two, being -4.85 cm3·mol
-1. The intrinsic volumes of
amino acids are calculated through several methods: converting the densities of dry
amino acids using , where 0.7 is the packing density

Chapter 2. Thermodynamics of Amino Acids Solutions
23
for the molecule in an organic crystal and 0.634 is the packing density for the random
packed spheres, assuming they are equal to the partial molar volumes of equivalent
amides or substituting with van der Waals volumes , which can be estimated from
the group contribution methods (Zhao, 2006). The densities of dry amino acids can be
found in Berlin and Pallansch (1968).
Another important parameter usually used in the analysis of the data is the standard
partial molar volume of transfer, , which is defined as the difference between the
standard partial molar volume in solution to that in pure water.
(2.10)
Strongly hydrated ions have small values of (may even be negative). If the volume
of transfer is a positive value indicates that the hydration number of the amino acid is
reduced by the addition of cosolutes (Ogawa et al., 1984). Therefore, a high value of
means that the amino acid is more dehydrated in solution. Generally, the volume
of transfer increases with the salt concentration indicating that the high ionic strength
dehydrates amino acids (Yan et al., 2005). Zhao et al. (2006) noted that the volumes of
transfer are typically high in solutions containing strong ions (such as
) and usually low in solutions of weakly hydrated ions (such as
). Therefore, there are indications that suggest that the amino acids are
less hydrated in solutions containing strongly hydrated ions because these ions tend to
take more molecules of water to hydrate, leaving less water available to the amino acids.
In fact, the effect of dehydration of ions of amino acid is considered as one of the most
important reasons of salting-out of amino acids (Wang et al., 2000). Badarayani and
Kumar (2004a) suggested that ions experiencing hydrophilic hydration have stronger
effect on the amino acid hydration than those ions experiencing hydrophobic hydration.
The zwitterionic heads of amino acids are hydrated by hydrophilic hydration whereas its
apolar part is hydrated by hydrophobic hydration. Overlap of different hydrated spheres
of amino acids and cosolutes take place. As a result a water molecule mainly from the
hydrophobic hydration sphere gets out. The volume change during transfer is a good
indicator of these released water molecules due to different types of overlap among
hydration spheres (Das et al., 2004). Therefore, the co-sphere overlap model can be

Chapter 2. Thermodynamics of Amino Acids Solutions
24
used to rationalize the values in terms of solute-cosolute interactions (Siddique and
Naqvi, 2010). According to this model, when two solute particles come sufficiently
close together so that their co-spheres overlap, some co-sphere material is displaced
(Figure 2.4) and this is accompanied by the change in thermodynamic parameters
(Banipal et al., 2007a).
Figure 2.4. Ion hydration co-sphere overlap, adapted from Krishnan et al. (2009).
In ternary systems (amino acids + salt + water), the overlap of cosolute ions and amino
acids comes into play because of interactions between: (i) the (- , -COO
-) charged
ends of amino acids and ions of the cosolute, called ion-charged/hydrophilic group or
ion-ion interactions; (ii) the hydrophobic parts of the amino acids and cosolute ions or
the charged ends/hydrophilic parts of amino acids and the hydrophobic parts of the
cosolutes, called ion-hydrophobic group interactions; and (iii) the hydrophobic parts of
the amino acids and hydrophobic parts of ions of cosolutes, called hydrophobic-
hydrophobic group interactions (Siddique and Naqvi, 2010).
Thermodynamic investigations of amino acids in aqueous salt solutions identified the
significant hydration characteristics of the solutes such as (Aktar, 2007): (i) and
COO− terminals in these solutes are hydrated in an electrostatic manner and the
intervening backbone is hydrated, but depending on its nature; (ii) electrostriction of the
group is greater than that of the COO
− group by a factor of 10; and (iii) the overlap
of hydration co-spheres of terminal groups adjacent to the core results in a volume
change. Thus, thermodynamic properties of amino acids in aqueous electrolyte solutions
provide valuable information about solute–solvent and solute–solute interactions. The
changes in volume due to the various types of interactions above are summarized in
Figure 2.5.

Chapter 2. Thermodynamics of Amino Acids Solutions
25
Figure 2.5. The structural interaction of two cospheres, adapted from Lin et al. (2006).
According to this model, the ion-charged/hydrophilic group interactions result in
positive values, whereas ion-hydrophobic and hydrophobic-hydrophobic group
interactions result in negative values. If it is observed a positive
value for
amino acid throughout the concentration range of salt then the ion charged/ hydrophilic
group interactions are much stronger and dominate over the ion-hydrophobic and
hydrophobic-hydrophobic group interactions (Banipal et al., 2007a).
Zhao et al. (2006) proposed some explanations based on the co-sphere overlap model in
terms of solute-cosolute interactions, and suggested that strongly hydrated ions (such as
sulfate, acetate, butyrate, caproate and caprylate) have stronger interactions with polar
groups of ( and COO
-) amino acids causing dehydration of amino acids, implying
that weakly hydrated ions have weaker interactions with amino acids. However, it is
known that kosmotropic anions (such as ) do not salt-in the polar peptide group,
but rather salt out nonpolar groups of proteins.
In order to establish group-contribution methods to calculate thermodynamics properties
in amino acids aqueous solutions several authors present values for the contribution of
each group in the amino acids. In that regard the individual contributions of charged
groups and hydrophobic group to the standard partial molar volume
can be identified through the following linear relationship:
(2.11)

Chapter 2. Thermodynamics of Amino Acids Solutions
26
where is the number of carbon atoms in the alkyl chain of the amino acids.
Through linear regression calculations, the polar group contribution and hydrophobic
group contribution are obtained to analyze the interactions of (amino acid)–water and
(amino acid)–water–(other solute). Naturally the occurrence of groups such as OH in
serine or threonine can be incorporate in expressions of the same type as eq. 2.11.
Chalikian et al. (1993) also showed that the partial molar adiabatic compressibility ,
depends on the number of methylene groups, CH2, present in the molecule. The
hydrated methylene groups of substances which belong to classes with different
structures contribute equally to . These contributions are negative at low
temperatures and positive at temperatures above 30 º C. A negative value of at low
temperatures means that the water in the vicinity of hydration of the CH2 group is less
compressible than the bulk water. Rather, at high temperature bulk water
compressibility is less than the hydration shell of the methylene group.
2.6 Conclusions
The amino acid industry has grown to its present size as a result of technical innovations
in manufacturing methods and in applications. Questions about the physical principles
that control the biological mechanisms of association and the organization and stability
of biological structures led to the rapid development of various techniques of analyzing
intermolecular forces.
An extensive literature search on the available density and speed of sound data and
experimental methods was essential to establish the systematic experimental program,
and to choose the most appropriated techniques to measure the density and the speed of
sound of the amino acids in aqueous solutions containing electrolytes.
Some aqueous salt solutions with relevance in biochemical studies have been identified
in lacking enough experimental thermodynamic data. Furthermore, the available data
are scarce, in terms of the number of studied systems, and some rather old leaving
doubts about their quality. So, contributing to the very recent efforts within the
scientific community to extend the experimental database already available, systems
containing ammonium sulfate were chosen to perform new measurements.

Chapter 2. Thermodynamics of Amino Acids Solutions
27
Therefore, in this work measurements of density and speed of sound in aqueous
solutions of ammonium sulfate containing the amino acid glycine or alanine will be
performed, at five different temperatures. These data will allow the interpretation of the
physical-chemical of those solutions, using hydration numbers and transfer volumes,
among others. The experimental information obtained will also be combined with that
from the open literature in order to compare and understand the forces that rule
biologically important structures.

28
3. Experimental Results
3.1 Introduction
The development of more sophisticated and efficient processes for separation,
concentration and purification of valuable biomolecules such as peptides and proteins
have been a subject of main interest for the biochemical industry. Thermodynamic
studies of these compounds are of great interest to biochemist and biotechnologists, and
are needed for increasing the understanding of their phase equilibria and separation
behavior.
The extensive literature search on the available density and speed of sound data and
experimental methods (Chapter 2), was fundamental to establish a systematic
experimental program and to implement the most appropriated techniques to determine
the density and the speed of sound of the amino acids in aqueous solutions containing
electrolytes.
In this chapter, details of the experimental techniques, the analytical methods, the
procedure, and the experimental data are given, as well as a critical analysis of the
obtained data. Finally, some conclusions are drawn concerning this experimental study.
The experimental results are presented divided into two parts: density of the different
amino acids in pure water and in aqueous electrolyte solutions.
Density and speed of sound data was measured in a temperature range between 278.15
K and 318.15 K, at ambient pressure, and without pH adjustment. In this study the
amino acids used were alanine and glycine, because they differ in one methyl group.
The salt chosen was ammonium sulfate because it is one of the mostly used for protein
precipitation and curiously hardly ever studied (Yu and Ito, 2004), and a better
knowledge of its interactions with different amino acid functional groups is certainly an
interesting point for further studies on protein purification and precipitation. This
project was carried out at in the laboratories of the Institute of Chemical Technology -
Prague.

Chapter 3. Experimental Results
29
3.2 Experimental Methodology
In the following sections detailed information is given about the experimental
procedure. The apparatus chosen to perform the density and speed of sound
measurements was a digital density and sound velocity meter. This apparatus uses the
oscillating U-tube methodology and one sound-cell to measure both properties
simultaneously. This has been the apparatus most generally presented in the literature to
determine the density and the speed of sound since it is simple, accurate and presents
generally high reproducibility.
3.2.1 Substances
Glycine (99.7% purity) and DL-alanine (99% purity) were purchased from Merck, kept
at room temperature, and were used without further purification. Ammonium sulfate
[(NH4)2SO4, ≥ 99% purity] were obtained from Sigma Aldrich and was used without
further purification. However, it was oven-dried (T = 378.15 K) during at least 24h and
used after cooling at room temperature. The distilled water was cleaned in a milli-Q
ultra-pure water system from Millipore and was degassed before use by boiling for 60
minutes to avoid micro air bubbles in the solutions.
3.2.2 Equipment Description
The density and the speed of sound measurements in aqueous ammonium sulfate
solutions containing amino acids were performed by the Density and Sound Velocity
Analyzer DSA 5000 (Anton Paar, Graz, Austria), Figure 3.1.
A vibrating-tube densimeter with glass U-shaped tube and an additional cell (sound-
cell) for measurements of speed of sound are the main parts of the instrument. The
apparatus is equipped with a built-in thermostat allowing measurement in the
temperature range from 0 to 70 °C, at ambient pressure, and with a sample changer
which allows automatic loading up to 24 samples. The measurement uncertainty is
stated for both properties as 0.01% to 0.1%, with repeatabilities of 0.001 kg·m-3
in the
density, and 0.1 m·s-1
in the speed of sound measurement, and 0.001 ºC for temperature.
The principle of measurement by a vibrating-tube densimeter is based on the fact that
the frequency (period) of oscillations of a U-shaped tube fixed in a heavy base depends

Chapter 3. Experimental Results
30
on the total mass of the tube. It means that the frequency is a function of density of the
fluid inside the tube.
Figure 3.1. Experimental apparatus: density and sound velocity meter DSA 5000 from Anton Paar.
Schematically, in Figure 3.2 it is shown that continuous oscillations of the tube are
maintained by means of a driver D which electromagnetically forces the tube to
oscillate and which is controlled by an electronics E. At the same time the electronics
reprocesses the alternated electric signal which is produced by the moving tube in a
pick-up device P operating on either photoelectric or electromagnetic principle. In other
words, the vibrating-tube densimeter is the oscillator the frequency (period) of which is
determined by the mechanical element – the U-tube. The oscillation period is measured
by an electronic counter C.
Figure 3.2. Schematic representation of DSA 5000.

Chapter 3. Experimental Results
31
Assuming the harmonic oscillator model, a simple relation between density, , and
oscillation period, , can be derived,
(3.1)
where A and B are coefficients (constants for given temperature and pressure), which
are related to the mechanical and geometrical properties of the U-tube. The values of
these coefficients must be determined by a calibration procedure.
The calibration of the instrument is based on the measurement of oscillation periods for
two fluids with known densities. Most frequently, the fluids are water and air. Density
of liquid water (as a function of temperature), density of dry air (as a function of
temperature and pressure) and speed of sound in liquid water (as a function of
temperature) are stored in an internal memory of the instrument. All values required for
the calibration are automatically loaded from the memory according to the set
temperature and atmospheric pressure. Calibration is always performed at 20 °C. The
U-tube is cleaned, dried and filled with air and then with water. During this procedure
all necessary data are acquired and results of the calibration (coefficients A and B, and
data for speed of sound calibration) are stored in the instrument internal memory until
the next calibration is performed. For measurement at other temperatures, all calibration
parameters are automatically recalculated.
The following apparatus and instruments were used too in this study: electric oven
supplied by Binder, ultrasonic bath, Precisa 40SM-200A balance (resolution = 10-2
mg,
uncertainty = ±0.1 mg), Precisa 2200C SCS balance (resolution = 10 mg, estimated
uncertainty = ±2.10-2
%), stir plate with 12 positions, milli-Q ultra-pure water system
and a degassing system.
3.2.3 Procedure
The following section gives information about the solutions preparation and the
procedure to performance the measurements of density and speed of sound of aqueous
ammonium sulfate solutions containing amino acids.

Chapter 3. Experimental Results
32
3.2.3.1 Solutions Preparation
All the solutions were made on weight basis and prepared using degassed water or, at
least, partially degassed, otherwise bubbles of air can form in the liquid at elevated
temperatures. The materials were weighed on a Precisa 40SM-200A balance and on a
Precisa 2200C SCS balance. The solutions were prepared in standard flasks (1000 cm3
and 2000 cm3 for ammonium sulfate solutions). The flasks and all the material used
were cleaned with ultra-pure water and after that were dried in oven or at room
temperature. Magnetic stirrers are used in the mixing process.
Firstly the ammonium sulfate solutions were prepared using the Precisa 2200C SCS
balance. The weight of a cleaned and dried flask of 2000 cm3
was noted and the balance
tared; the required amount of the ammonium sulfate was added into it and the exact
weighed of the solute noted. Balance was tared again and the readjusted amount of
degassed water was then added and its exact weight was noted. The molality of the
resulting solution was calculated. The solution was placed on a stir plate until complete
dissolution of the ammonium sulfate. Ammonium sulfate solutions were prepared at the
molalities of 0.1, 0.3, 0.7, 1.0, 1.3 and 2.0.
For the preparation of ternary solutions the cleaned and dried flasks of 1000 cm3
were
placed in the Precisa 2200C SCS balance. The weight was noted and the balance tared.
The required amount of the amino acid was weighed in Precisa 40SM-200A balance, to
obtain a higher accuracy, for difference between the weight of the goblet with the amino
acid and the weight after dumping it in to the flask. Readjusted amount of ammonium
sulfate solutions was then added and the total weight noted. The molality of the
resulting solution was calculated. The solution is stirred to promote complete mixing. In
binary systems ammonium sulfate solution is replaced by degassed water. The molality
of amino acid varies between 0.05 and 0.5.
It is necessary to be very careful with the evaporation in solutions of ammonium sulfate,
keeping bottles well capped.
3.2.3.2 Experimental Procedure
The prepared mixtures are placed in an ultrasonic bath for 10 minutes and filled into
glass vials equipped with caps and silicone septa. Before that, the sample vials are

Chapter 3. Experimental Results
33
washed several times with the solution or water. These vials, together with vials
containing pure solvent and/or pure water, are inserted into the sample changer in series.
In Figure 3.3 is displayed one example of the distribution of the vials for glycine in
aqueous solutions of 0.3 and 0.7 mol·kg-1
ammonium sulfate.
Figure 3.3. Distribution of the vials in carousel for 0.3 and 0.7 mol·kg
-1 ammonium sulfate containing
glycine (XXGLYZZ where XX is salt molality and ZZ is amino acid molality).
Before start the measurements, the instrument is switched on for about 30 minutes.
Then if necessary, calibrate of the instrument according to the following procedure and
dry the measuring unit.
1. Fill a glass vial with acetone (approximately half of its volume) and put it into the
sample changer (carousel).
2. On the sample changer, press the <START> button. The feeder will start filling the
measuring cell.
3. When the filling is finished, press the <STOP> and then <0> button, and remove the
vial from the sample changer.
4. Attach the hose leading from the air pump to the lower end of the filling needle.
5. By turning in a counterclockwise direction, release the handle of the peristaltic pump.
Chapter 3. Experimental Results
34
6. Press the <PUMP> button on the front panel of the DSA 5000. The air pump will
blow air through the measuring cell and after 15 min will stop automatically. During
pumping “Pump” flashes on the instrument display.
7. After the cell is dry, wait until the display shows current density of air (its value
should be close to 0.0011 g·cm-3
).
8. Activate the calibration procedure using keys and menus: {Menu} [ ]; {adjustment}
[ ]; {adjust} [ ]; {d+vos(air,water)} [ ]; {OK}.
9. Enter current atmospheric pressure in mbar.
10. Wait until temperature is stabilized (“valid“ is displayed as the condition) and then
press the {OK} soft key.
11. Put a vial with demineralized water into the sample changer. Disconnect the air hose
from the filling needle, return back the handle of the peristaltic pump and press the
<START> button on the filling unit. The measuring cell will be filled with water.
Caution: Leave the air hose on the left side of the instrument; otherwise it could get into
the mechanical gear of the sample changer.
12. Wait until temperature is reached and then press the {OK} key for measurement of
the oscillation period.
13. Save the result of calibration by the {Save} soft key. Choose {NO} as response to
Print?
14. Finish the calibration procedure by the {OK} soft key.
After the calibration procedure is necessary to check the validity of the calibration by
the “water check” function throwing the following procedure:
1. Put a vial with demineralized water into the sample changer.
2. Activate the “water check” procedure using {Menu} and keys: {adjustment} [ ];
{watercheck} [ ]; {start watercheck}[ ].

Chapter 3. Experimental Results
35
3. Press the <START> button on the filling unit. After filling the cell wait until
temperature is reached.
4. If the measurement of density and speed of sound is within the permitted range the
display shows “water check: OK”. Save the result by the [Save] soft key. Choose [NO]
as response to Print?
5. Terminate the procedure by pressing the <STOP> and <0> buttons on the filling unit.
Densities and speed of sound of the mixtures are then measured by the instrument DSA
5000 at temperatures between 278.15 and 318.15 K according to the following
procedure.
1. Put the empty sample changer to its initial position by pressing the <STOP> and <0>
buttons.
2. Insert the vials with samples into the sample changer.
3. Use soft keys and the Enter key [ ] and from the instrument {Menu} on its display
select the following: {measurements settings} [ ]; {general settings} [ ]; {temp scan}
[ ]; {off} [ ]. Terminate the setting by the {Esc} soft key. Response {Yes} to the
question Save changes?
4. Return to the primary menu and set the experimental temperature {Menu} [ ];
{temperature setting} [ ]; {set temperature °C} [ ]; [ ]. Using the soft keys {Left,
Right} and arrows {Up, Down} set the desired temperature. Terminate the setting by
the {Esc} soft key. Response {Yes} to the question Save changes?
5. Finish the selection by the {Esc} soft key.
6. Press the <START> button on the sample changer to start measurements.
7. When the measurement cycle is finished and the sample changer returns to the initial
position, press the <STOP> button. Transfer the collected experimental data stored in
the instrument memory into the PC by activating the memory read-out program
installed on the PC.

Chapter 3. Experimental Results
36
This procedure is isothermal because different compositions are measured at the same
temperature. The measurements of pure water serve for the check of a possible
instrument drift. Values measured for water should not differ significantly (within few
units of the order 10-6
g·cm-3
).
During the experimental work another type of procedure was used in which the
solutions were injected continuously into the lower opening of the U-shaped vibrating
tube, until the excess liquid flowed out of the upper part. Liquid was filled in the tube
very slowly to enable a liquid to properly wet the walls of the sample tube. Care was
taken to avoid trapping of micro air bubbles. Disposable, polyethylene syringe of about
20 cm3 in volume was used for injecting the liquid into the U-tube. In the apparatus was
used the option “temperature scan” in which the temperatures are measured sequentially
without replacing the sample. This procedure is phetostatic because different
temperatures are measured at the same composition.
To prevent air-humidity condensation on densimeter parts when cooled down to low
temperatures, 278.15 and 288.15 K, the nitrogen at low flow rate was introduced into
the interior of the apparatus cover box.
pH measurements were also carried out during the measurements, using a digital pH
meter PHI 04, in order to evaluate possible chemical phenomena in the solutions.
3.3 Experimental Measured Data
The data of measured density are presented in appendix D and the calculated partial
molar volumes are reported in the following sections. Adiabatic compressibilities are
not shown for reasons explained in section 3.4. However, the speed of sound data is
compiled in Appendix E. The studied temperature range is between 278.15 and 318.15
K. The results are divided in binary and ternary aqueous amino acid systems.
3.3.1 Water/Amino Acids Systems
The measured values of the density of AA solutions, between 278.15 and 318.15 K,
expressed in grams per cubic centimeter, are reported in Table D.1. Concerning that
table is possible to observe that, for both amino acids the density decreases with the
increasing temperature and, at the same temperature and molality, the density of the

Chapter 3. Experimental Results
37
glycine solutions is larger than alanine solutions. Increasing the concentration of amino
acid, the density increases too. It is important to refer that, the values of the density for
all solutions are the result of an average of three independent measurements. Through
density measured values, partial molar volume ( ), expressed in cubic
centimeters per mole, of pure solutions were calculated using equations 2.1 and 2.2.
These values are reported in Table 3.1 and presented in the Figure 3.4. In the case of
partial molar volume, it increases with temperature for both amino acids and, at the
same temperature the partial molar volume of alanine is, as expected, bigger than that of
glycine. The trend is similar like show in Figure 3.4.
Table 3.1. Comparison of the partial molar volumes of amino acids in pure water. Amino
Acid
Temperature (Zhao, 2006)
(K) (cm3·mol
-1) (cm
3·mol
-1) (cm
3·mol
-1) (%)
Glycine
278.15 41.1, 41.9, 41.07, 41.25 41.33 41.18 -0.36
288.15 42.3, 42.5, 42.6, 42.29, 42.54, 42.4,
42.35, 42.48, 42.37 42.41 42.38 -0.07
298.15
42.9, 43.5, 43.19, 43.2, 43.25, 43.3,
43.18, 42.89, 43.16, 43.14, 43.26,
43.217, 43.199, 43.15, 42.54, 43.2,
43.27, 43.23, 43.24, 43.3, 43.2, 43.22,
43.62, 42.54, 43.12, 42.48
43.18 43.20 0.04
308.15
44.2, 43.81, 43.85, 43.8, 44.12, 43.9,
43.98, 41.7, 43.79, 44.95, 43.69, 44.52,
43.87
43.87 43.76 -0.25
318.15 44, 44.17, 44.15 44.11 44.15 0.09
Alanine
278.15 59.4, 58.64, 58.81 58.95 58.87 -0.14
288.15 60, 59.73, 60.1, 59.9, 59.89, 59.67,
59.77 59.85 59.79 -0.09
298.15
60.7, 60.52, 60.3, 60.6, 60.4, 60.23,
60.41, 60.5, 60.53, 60.609, 60.47,
60.36, 60.3, 60.45, 60.47, 60.43, 60.42,
60.19, 60.5, 60.49, 60.71, 60.8, 60.68,
60.74, 60.19, 60.4, 60.35, 60.37, 60.43,
60.92
60.48 60.46 -0.03
308.15 61.4, 60.96, 61.06, 60.9, 61.27, 60.44,
60.88, 61.01, 61, 61.99, 61.16 61.12 60.93 -0.32
318.15 61.46, 61.31, 61.46 61.41 61.29 -0.19
The amino acids studied have in common an amino and a carboxyl group but their side
chain is different. The chemical structure of the amino acids is depicted in Table A.1.
Glycine is the simplest amino acid with only two carbon atoms. Alanine has one –CH3
group more than glycine. A comparison of the densities of glycine and alanine shows
that the density in water decreases as the size of the hydrocarbon backbone increases.
For partial molar volumes, they increase with the size of the hydrocarbon backbone.

Chapter 3. Experimental Results
38
Figure 3.4. Partial molar volumes of amino acids in water a different temperatures.
3.3.2 Ternary Systems
In this section, the experimental measured density data of solutions containing the
amino acids, glycine and alanine, in aqueous systems of the electrolyte ammonium
sulfate (molality ranging from 0.1 to 2.0) at five temperatures, from 278.15 to 318.15 K,
is discussed and are presented in Table D.2. Like in the binary systems, the values of the
density are the result of an average of three independent measurements. The partial
molar volumes were calculated through density using the equations 2.3 and 2.4 and are
shown in Table 3.2 together with the parameter (equation 2.4) and a measure of the
linear regression quality (r2).
Figure 3.5 and 3.6 show the change of partial molar volume at different temperatures for
glycine and alanine, respectively. Examining the figures it is possible to observe a more
pronounced increase of the glycine and alanine partial molar volumes at low electrolyte
molality. Despite the alanine have one more hydrophobic -CH3 group than glycine the
behavior is similar. Comparing the results obtained at five different temperatures, a
similar effect of the ammonium sulfate concentration on the partial molar volume of
glycine and alanine is found, the partial molar volume increases with temperature
increasing. It is important to mention however the unexpected change observed in
Figure 3.6 at the salt molality near one. In fact, a small decrease is observed which must
be related with some unforeseen experimental deficiency. Due to the lack of time it was
not possible to repeat all the measurements at 1.0 molal ammonium sulfate solutions
containing alanine, but that will, for sure, be carried out in the near future. Figure 3.6
40.00
45.00
50.00
55.00
60.00
65.00
270 280 290 300 310 320
Vφ
0 (c
m3·m
ol-1
)
Temperature (K)
Glycine
Alanine

Chapter 3. Experimental Results
39
also demonstrate the difficulty to achieve consistent results as it is needed to approach
⁄ to infinite dilution which is, from a theoretical point of view, a mathematical
indetermination.
Figure 3.5. Partial molar volumes of glycine in water/(NH4)2SO4 solutions, depending on salt molality, at
different temperatures.
Figure 3.6. Partial molar volumes of alanine in water/(NH4)2SO4 solutions, depending on salt molality, at
different temperatures.
40.00
42.00
44.00
46.00
48.00
50.00
0.0 0.5 1.0 1.5 2.0
Vφ
0 (c
m3·m
ol-1
)
(NH4)2SO4 molality
278.15 K 288.15 K 298.15 K 308.15 K 318.15 K
58.00
60.00
62.00
64.00
66.00
0.0 0.5 1.0 1.5 2.0
Vφ
0 (c
m3·m
ol-1
)
(NH4)2SO4 molality
278.15 K 288.15 K 298.15 K 308.15 K 318.15 K

Chapter 3. Experimental Results
40
Table 3.2. Partial molar volume, aV (kg2·m
-3·mol
-1) and r
2 for glycine and alanine in water/ammonium sulfate solutions at different temperatures.
278.15 K
288.15 K
298.15 K
308.15 K
318.15 K
Amino
acid
Vφ0
aV r2
Vφ0
aV r2
Vφ0
aV r2
Vφ0
aV r2
Vφ0
aV r2
(cm3·mol
-1)
(cm
3·mol
-1)
(cm
3·mol
-1)
(cm
3·mol
-1)
(cm
3·mol
-1)
0.1 mol·kg-1
ammonium sulfate
Glycine 42.07 32.49 0.9991
43.13 31.44 0.9995
43.87 30.73 0.9992
44.41 30.24 0.9968
44.78 29.92 0.9925
Alanine 59.63 28.83 0.9923
60.45 28.04 0.9942
61.09 27.48 0.9925
61.52 27.16 0.9900
61.87 26.94 0.9915
0.3 mol·kg-1
ammonium sulfate
Glycine 43.41 30.16 0.9844
44.20 29.38 0.9969
44.84 28.79 0.9888
45.11 28.57 0.9626
45.56 28.18 0.9773
Alanine 60.75 26.50 0.9902
61.42 25.88 0.9920
61.95 25.43 0.9932
62.33 25.17 0.9862
62.66 24.99 0.9965
0.7 mol·kg-1
ammonium sulfate
Glycine 44.87 26.85 0.9604
45.59 26.15 0.9617
46.09 25.71 0.9640
46.41 25.46 0.9567
46.77 25.18 0.9294
Alanine 62.25 22.76 0.9899
62.77 22.31 0.9920
63.22 21.98 0.9969
63.44 21.89 0.8607
63.75 21.75 0.9945
1.0 mol·kg-1
ammonium sulfate
Glycine 46.02 24.40 0.9723
46.66 23.81 0.9769
47.17 23.37 0.9230
47.41 23.21 0.9147
47.70 23.01 0.9047
Alanine 62.31 21.18 0.9118
62.75 20.83 0.9064
63.10 20.60 0.9075
63.41 20.44 0.9112
63.71 20.31 0.9157
1.3 mol·kg-1
ammonium sulfate
Glycine 46.50 22.73 0.9300
47.08 22.21 0.9481
47.57 21.79 0.9563
47.83 21.62 0.9394
48.14 21.41 0.9212
Alanine 63.70 18.38 0.9837
63.95 18.24 0.9355
64.28 18.05 0.9543
64.49 18.00 0.9470
64.73 17.94 0.9657
2.0 mol·kg-1
ammonium sulfate
Glycine 47.85 18.91 0.9070
48.40 18.44 0.9177
48.73 18.21 0.7983
48.86 18.19 0.8338
49.20 17.97 0.8017
Alanine 64.88 14.36 0.8182 65.03 14.35 0.9395 65.25 14.29 0.8951 65.47 14.25 0.9450 65.67 14.24 0.9462

Chapter 3. Experimental Results
41
In a similar way, Figure 3.7 and 3.8 show the change of the partial molar volume with
the temperature, at different molalities of ammonium sulfate either, for glycine and
alanine, respectively. At all molalities, for both amino acids, the trend is the same. The
partial molar volume increases with electrolyte molality and with temperature.
Figure 3.7. Partial molar volumes of glycine in water/(NH4)2SO4 solutions, depending on the temperature,
at different molalities.
Figure 3.8. Partial molar volumes of alanine in water/(NH4)2SO4 solutions, depending on the temperature,
at different molalities.
40.00
42.00
44.00
46.00
48.00
50.00
268.2 278.2 288.2 298.2 308.2 318.2 328.2
Vφ
0 (c
m3·m
ol-1
)
T (K)
0.0 0.1 0.3 0.7 1.0 1.3 2.0
58.00
60.00
62.00
64.00
66.00
268.2 278.2 288.2 298.2 308.2 318.2 328.2
Vφ
0 (c
m3·m
ol-1
)
T (K)
0.0 0.1 0.3 0.7 1.0 1.3 2.0

Chapter 3. Experimental Results
42
3.4 Critical Analysis of the Results
After an extensive analysis of all data measured and that obtained by other authors it
was possible to draw conclusions regarding the substances and procedures, the
measurements and the results obtained.
A very small concentration range was used for AA’s (ranging up to 0.5 molal). Amino
acids are usually recommended in small quantities since it is intended to get close to
infinite dilution. At higher concentration non-ideal behavior of solutions would
dominate.
During the measurements of the solutions, two different procedures were applied in
order to try get better results. The first and most used, isothermal, wherein the solutions
were inserted into the sample changer in series and the second, phetostatic, in which the
solutions were injected continuously into the lower opening of the densimeter. The data
analysis revealed that the second procedure is not valid since the equipment is very
sensitive to changes in the pressure exerted on the syringe by the operator. It is also
more propitious to bubbles formation and takes much more time.
It is necessary to take into account that possible errors in density data may arise from
temperature fluctuations, presence of air bubbles in the solution, insufficient dialysis
time, high sample viscosity, high sample concentration, among others. In the
measurements carried out in this work the main difficulties were related with bubbles
formation and evaporation.
Additionally, in order to evaluate possible chemical phenomena in the solutions, pH
measurements were carried out in some solutions. The results are presented in Figure
3.9. The pH values range from 5.17 to 6.12. As the electrical point of glycine and
alanine in water are 5.97 and 6.00 (Greenstein and Winitz, 1961), respectively, it can be
concluded that the addition of salt does not significantly alter the pH, so it was not
possible to identify any chemical processes in solution.

Chapter 3. Experimental Results
43
Figure 3.9. pH as function of amino acid and ammonium sulfate molalities (XXAAZZ where XX is salt
molality, ZZ is amino acid molality and AA the amino acid).
The partial molar volumes of the amino acids in pure water reported in the literature
was reviewed and compared with the new data. Table 3.1 lists the information
compiled, the corresponding measured value from this work as well as the deviation to
the average. For both amino acids in this study, the deviation to the average is not
considerable. For alanine, at higher temperatures, the deviation to the average is more
evident, especially at 308.15 K; however the data available in literature is more limited.
The same happens for glycine at 278.15 K.
One schematically comparison between the partial molar volume measured in this work
and that one from references is shown in Figure 3.10. A highly satisfactory agreement is
found.
Figure 3.10. Comparison for the partial molar volumes of (a) glycine and (b) alanine in water (reference
values from Zhao, 2006).
5.0
5.2
5.4
5.6
5.8
6.0
6.2
0.0 0.1 0.2 0.3 0.4 0.5
pH
Amino Acid molality (ZZ)
03ALA
07ALA
20ALA
20GLY
41
42
43
44
45
41 42 43 44 45
Vo
lum
e fr
om
th
is w
ork
(cm
3·m
ol-1
)
Reference Volume (cm3·mol-1)
Glycine
(a)
58
59
60
61
62
58 59 60 61 62
Vo
lum
e fr
om
th
is w
ork
(cm
3·m
ol-1
)
Reference Volume (cm3·mol-1)
Alanine
(b)

Chapter 3. Experimental Results
44
In conclusion, generally, for binary systems (water + amino acid), a very satisfactory
agreement is found; with the few exceptions previously mentioned. For both amino
acids the number of data available in the literature decreases at temperatures above and
below 298.15 K and some are rather old. In those cases, the chemical purity and
accuracy of the experimental technique must have special awareness.
During the experimental work the density of ammonium sulfate solutions at different
temperatures and molalities was measured several times, as shown in Appendix F.
However in the data analysis were used the mean values, Table 3.3.
Table 3.3. Ammonium sulfate densities (kg·m-3
) at different temperatures and molalities. T (K)
278.15 288.15 298.15 308.15 318.15
0.1 1.008181 1.007059 1.004848 1.001746 0.997886
0.3 1.023476 1.021948 1.019470 1.016209 1.012266
0.7 1.051323 1.049183 1.046298 1.042798 1.038728
1.0 1.070293 1.067792 1.064697 1.061062 1.056925
1.3 1.087949 1.085179 1.081890 1.078139 1.073974
2.0 1.124496 1.121319 1.117777 1.113895 1.109681
In Figure 3.11 and 3.12 four typical examples of Δρ/m2 in function of the molality of the
amino acid at five different temperatures are represented. Through this figures it is
possible to calculate the values required for calculating the partial molar volume.
Based on the coefficient of determination (r2), it can be concluded that by increasing the
salt concentration the quality of data worsen. The same applies, generally, to the
temperatures 278.15 and 318.15 K, since it is more difficult to stabilize properly the
temperature in the densimeter.
Figure 3.11. Δρ/m2 of glycine at different temperatures and molalities in: (a) water and (b) 2.0
ammonium sulfate.
R² = 0.9995
R² = 0.9996
R² = 0.9995
R² = 0.9996
R² = 0.9995
29.0
30.0
31.0
32.0
33.0
34.0
0.0 0.1 0.2 0.3 0.4 0.5 0.6
Δρ
/m2 (
kg
2·m
-3·m
ol-1
)
m2
T = 278.15 K T = 288.15 K T = 298.15 K T = 308.15 K T = 318.15 K
(a)
R² = 0.9070
R² = 0.9177
R² = 0.7983
R² = 0.8338
R² = 0.8017
17.0
17.5
18.0
18.5
19.0
0.0 0.1 0.2 0.3 0.4 0.5 0.6
Δρ
/m2 (
kg
2·m
-3·m
ol-1
)
m2
T = 278.15 K T = 288.15 K T = 298.15 K T = 308.15 K T = 318.15 K
(b)

Chapter 3. Experimental Results
45
Figure 3.12. Δρ/m2 of alanine at different temperatures and molalities in: (a) 0.1 ammonium sulfate and
(b) 0.7 ammonium sulfate.
It is interesting to note that in the representation of density values as a function of the
molality of the amino acid the fit obtained is always almost perfect. However, and in
accordance to equations 2.2 and 2.4, in the representation of Δρ/m2 as a function of the
molality the trend obtained worsens, being even necessary to remove some experimental
points, as shown in Figure 3.13 and 3.14. It must be mentioned that, for all systems and
conditions, the density value measured for AA molality 0.05 was not considered in the
calculations. However, the situation show in Figure 3.14 is an unique case where at
278.15 K was necessary to eliminate the density measured at AA molalities of 0.10,
0.15 and 0.30.
Figure 3.13. ρ of alanine in 1.3 ammonium sulfate
at different temperatures and molalities.
Figure 3.14. Δρ/m2 for alanine aqueous solutions in
1.3 ammonium sulfate molality at different
temperatures.
The present study observed higher values for amino acids in ammonium sulfate as
compared with their values in water, which suggests that ion-ion interactions dominate
the ion-hydrophobic and hydrophobic-hydrophobic interactions. It is also found that
increases with increase in size of the alkyl chain of the amino acid.
R² = 0.9923
R² = 0.9942
R² = 0.9925
R² = 0.9900
R² = 0.9915
25.0
26.0
27.0
28.0
29.0
0.0 0.1 0.2 0.3 0.4 0.5 0.6
Δρ
/m2 (
kg
2·m
-3·m
ol-1
)
m2
T = 278.15 K T = 288.15 K T = 298.15 K T = 308.15 K T = 318.15 K
(a)
R² = 0.9899
R² = 0.9920
R² = 0.9969
R² = 0.8607
R² = 0.9945
20.5
21.0
21.5
22.0
22.5
23.0
0.0 0.1 0.2 0.3 0.4 0.5 0.6
Δρ
/m2 (
kg
2·m
-3·m
ol-1
)
m2
T = 278.15 K T = 288.15 K T = 298.15 K T = 308.15 K T = 318.15 K
(b)
R² = 0.9999
R² = 0.9999
R² = 0.9999
R² = 0.9999
R² = 0.9999
1070.0
1075.0
1080.0
1085.0
1090.0
1095.0
1100.0
0.0 0.1 0.2 0.3 0.4 0.5 0.6
ρ (
kg
·m-3
)
m2
T = 278.15 K T = 288.15 K T = 298.15 K T = 308.15 K T = 318.15 K
R² = 0.9837
R² = 0.9355
R² = 0.9543
R² = 0.9470
R² = 0.9657
17.0
17.2
17.4
17.6
17.8
18.0
18.2
18.4
0.0 0.1 0.2 0.3 0.4 0.5 0.6
Δρ
/m2 (k
g2·m
-3·m
ol-1
)
m2
T = 278.15 K T = 288.15 K T = 298.15 K T = 308.15 K T = 318.15 K

Chapter 3. Experimental Results
46
The values of the speed of sound were also measured for all solutions at all
temperatures, as mentioned above, and are presented in Appendix E even if their quality
does not allow the calculation of reliable compressibilities. Nevertheless this situation
can be accepted as normal since in the majority of the works researchers need to make
nine measurements to obtain one single valid point with very large standard deviation.
In this study, this procedure was impossible due to time constraints. In the Appendix G
one example of the procedure for calculating the adiabatic compressibilities through the
values of speed of sound is shown, even if none of those values are explored after.
3.5 Conclusions
The density and speed of sound in solutions containing the amino acids glycine and
alanine have been measured in water and in the system water/electrolyte [(NH4)2SO4] in
the temperature range 278.15 K - 318.15 K.
Concerning the measurement of densities and speed of sound in water and in aqueous
ammonium sulfate solutions containing amino acids one density and sound velocity
analyzer was used and two procedures were applied. The experimental technique in
which the solutions were injected continuously into the lower opening of the densimeter
proved to be less accurate.
The experimental results were compared with literature data, when possible. Generally,
the experimental results are in good agreement with the published data.
The new experimental data and all the experimental information concerning different
thermodynamic properties, compiled from the open literature, allowed the establishment
of a more extensive and reliable database, that is very important and crucial for the
improvement and development of the thermodynamic analysis. In the following chapter
some analysis derived from theoretical models will be presented.

47
4. Theoretical Analysis
4.1 Introduction
In the following sections results are analyzed through the co-sphere overlap model, the
hydration number, temperature effects, and group contribution approach. The solute-
solute and solute-solvent interactions are also discussed. The structure of the amino
acids support the results found. The data of the system alanine in ammonium sulfate 1.0
molal is not included in the analysis for reasons explained before.
4.2 Co-sphere Overlap Model
The co-sphere overlap model can be utilized to rationalize the standard partial volumes
of transfer in terms of solute-cosolute interactions. Since is, by definition, free of
solute–solute interactions, it provides information regarding solute–solvent interactions.
The values were calculated through equation 2.10, and are illustrated in Figure 4.1
and presented in Table 4.1.
Interaction coefficients have also been calculated on the basis of formalism proposed by
McMillan and Mayer (1945), which permits the formal separation of the effects due to
interactions between the pairs of solute molecules and those due to its interactions
between two or more solute molecules. According to this theory, the transfer parameter
can be expressed as:
(4.1)
where X stands for amino acids and Y stands for the cosolute. The VXY and VXYY are
the pair and triplet interaction coefficients from volumetric data which are given in
Table 4.2.
As can be seen in Figure 4.1, the values of for the both amino acids increase
monotonically with the molality of ammonium sulfate, indicating that high ionic
strength dehydrates amino acids, and decreases with temperature. An exception occurs
for glycine at 0.3 molal of ammonium sulfate solution. In fact, the change with
temperature is not monotonic, but is easy to realize that for low electrolyte molalities
lends to a plateau when increasing the temperature. Therefore, it can be within the

Chapter 4. Theoretical Analysis
48
uncertainly of the calculated values. It is also possible to state that standard partial
volumes of transfer are higher in glycine that in alanine. The trend is more evident when
the electrolyte molality is higher.
Table 4.1. Standard partial volumes of transfer, /cm
3·mol
-1, for the amino acids from water to
different ammonium sulfate solutions at various temperatures. Molality 0.1 0.3 0.7 1.0 1.3 2.0
T (K) Glycine
278.15 0.89 2.23 3.69 4.84 5.32 6.67
288.15 0.74 1.82 3.21 4.27 4.69 6.02
298.15 0.68 1.64 2.89 3.97 4.37 5.53
308.15 0.65 1.35 2.65 3.65 4.07 5.10
318.15 0.64 1.41 2.62 3.55 3.99 5.05
T (K) Alanine
278.15 0.76 1.88 3.38 - 4.83 6.01
288.15 0.66 1.62 2.98 - 4.16 5.24
298.15 0.63 1.49 2.75 - 3.82 4.79
308.15 0.59 1.41 2.51 - 3.56 4.54
318.15 0.58 1.37 2.45 - 3.44 4.38
Figure 4.1. Standard partial volumes of transfer at different molalities of ammonium sulfate solution and
temperatures in (a), (c) glycine and (b), (d) alanine.
0.00
2.00
4.00
6.00
8.00
0.0 0.5 1.0 1.5 2.0
Vφ
,tr0
(cm
3·m
ol-1
)
m(NH4)2SO4
278.15 K 288.15 K 298.15 K 308.15 K 318.15 K
(a)
0.00
2.00
4.00
6.00
8.00
0.0 0.5 1.0 1.5 2.0
Vφ
,tr0
(cm
3·m
ol-1
)
m(NH4)2SO4
278.15 K 288.15 K 298.15 K 308.15 K 318.15 K
(b)
0.00
2.00
4.00
6.00
8.00
270 280 290 300 310 320 330
Vφ
,tr0 (
cm3·m
ol-1
)
T (K)
0.1 0.3 0.7 1.0 1.3 2.0
(c)
0.00
2.00
4.00
6.00
8.00
270 280 290 300 310 320 330
Vφ
,tr0
(cm
3·m
ol-1
)
T (K)
0.1 0.3 0.7 1.3 2.0
(d)

Chapter 4. Theoretical Analysis
49
Table 4.2. Pair and triplet interactions coefficients, VXY, and VXYY, of glycine and alanine in aqueous
ammonium sulfate solutions. Glycine Alanine
T (K) VXY
(cm3·kg·mol
-2)
VXYY
(cm3·kg
2·mol
-3)
VXY
(cm3·kg·mol
-2)
VXYY
(cm3·kg
2·mol
-2)
278.15 3.1773 -0.5139 2.8551 -0.4589
288.15 2.7251 -0.4148 2.4752 -0.3965
298.15 2.5089 -0.3812 2.2891 -0.3712
308.15 2.2824 -0.3392 2.0981 -0.3279
318.15 2.2447 -0.3317 2.0418 -0.3227
Applying the McMillan and Mayer formalism to the data measured in this work, it was
always possible to find good correlation results (r2 > 0.982). The VXY parameter is
always positive, showing consistency with the previous analysis since VXY follows
glycine > alanine. VXYY is always negative for the both amino acids studied. The higher
VXY values than VXYY show that interactions between ammonium sulfate and amino
acids (glycine and alanine) are mainly pair wise, even if the magnitude of the triple
interaction can not be neglected.
4.3 Hydration Number
The hydration numbers, , which reveal the hydration degree of a solute in water, were
calculated through equation 2.9 and are presented in the Table 4.3 and Figure 4.2. The
intrinsic volume was calculated using the method of converting the densities of dry
amino acids.
Table 4.3. Hydration numbers for the amino acids at different molalities of ammonium sulfate solution at
several temperatures. Molality 0.0 0.1 0.3 0.7 1.0 1.3 2.0
T (K) Glycine
278.15 4.11 3.77 3.25 2.69 2.25 2.06 1.54
288.15 3.27 3.01 2.64 2.16 1.80 1.65 1.19
298.15 2.63 2.42 2.13 1.75 1.42 1.30 0.95
308.15 2.03 1.86 1.69 1.36 1.11 1.01 0.75
318.15 1.59 1.46 1.30 1.05 0.86 0.77 0.55
T (K) Alanine
278.15 4.95 4.66 4.23 3.65 - 3.10 2.64
288.15 4.12 3.90 3.56 3.10 - 2.69 2.32
298.15 3.42 3.23 2.97 2.59 - 2.26 1.97
308.15 2.71 2.56 2.35 2.08 - 1.82 1.57
318.15 2.16 2.04 1.87 1.65 - 1.45 1.25

Chapter 4. Theoretical Analysis
50
The hydration number increases with the size of the amino acid (alanine > glycine) in
water or in salt solutions, which is not in accordance with the results from Wadi and
Ramasami (1997) that studying the effect of sodium sulfate in the hydration of glycine
and alanine. The hydration number decreases with the increasing of concentration of
salt and temperature, which is a very expected result in agreement with most theories.
The calculated values for the number of hydration show larger differences at low
temperatures and low concentrations of ammonium sulfate.
Figure 4.2. Hydration numbers, for different molalities of ammonium sulfate solution at various
temperatures in (a), (c) glycine and (b), (d) alanine.
4.4 Temperature Effects
In this work the variation of with temperature can be expressed as:
(4.2)
where T is the temperature in Kelvin, and a, b, and c are constants.
0.00
1.00
2.00
3.00
4.00
5.00
0.0 0.5 1.0 1.5 2.0
nH
m(NH4)2SO4
278.15 K 288.15 K 298.15 K 308.15 K 318.15 K
(a)
0.00
1.00
2.00
3.00
4.00
5.00
6.00
0.0 0.5 1.0 1.5 2.0
nH
m(NH4)2SO4
278.15 K 288.15 K 298.15 K 308.15 K 318.15 K
(b)
0.00
1.00
2.00
3.00
4.00
5.00
270 280 290 300 310 320 330
nH
T (K)
0.0 0.1 0.3 0.7 1.0 1.3 2.0
(c)
0.00
1.00
2.00
3.00
4.00
5.00
6.00
270 280 290 300 310 320 330
nH
T (K)
0.0 0.1 0.3 0.7 1.3 2.0
(d)

Chapter 4. Theoretical Analysis
51
The partial molar expansibility at infinite dilution can be obtained by differentiating
equation (4.2) with respect to temperature:
(4.3)
and the derivative from the partial molar expansibility at infinite dilution in order to
temperature is given by:
(4.4)
The and
values for both the amino acids at different
temperatures and salt molalities were determined using equations 4.3 and 4.4. The
determination coefficient (r2) is always higher that 0.9797.
Table 4.4. Constants a, b and c of glycine and alanine in aqueous ammonium sulfate solutions at different
temperatures.
m(NH4)2SO4 0.0 0.1 0.3 0.7 1.0 1.3 2.0
Glycine
a -1.342E-03 -1.120E-03 -7.512E-04 -6.456E-04 -6.830E-04 -5.437E-04 -4.445E-04
b 8.736E-01 7.350E-01 5.001E-01 4.312E-01 4.483E-01 3.646E-01 2.966E-01
c -9.792E+01 -7.568E+01 -3.756E+01 -2.510E+01 -2.582E+01 -1.283E+01 -2.263E-01
Alanine
a -9.462E-04 -8.194E-04 -5.968E-04 -4.631E-04 - -1.054E-04 6.651E-05
b 6.241E-01 5.441E-01 4.034E-01 3.128E-01 - 8.888E-02 -1.938E-02
c -4.150E+01 -2.831E+01 -5.271E+00 1.109E+01 - 4.712E+01 6.511E+01
Analyzing Figure 4.3 it may be noted that the values of of glycine and
alanine in aqueous ammonium sulfate solutions decrease regularly with rising
temperature, except for alanine in 2.0 molal of ammonium sulfate where the
expansibilities increase regularly with temperature showing a change on the behavior of
the solute in solution. The effect of concentration of ammonium sulfate on
values does not follow a well defined trend. From the Figure 4.4 it is possible to verify
that the values of increase with increasing aqueous ammonium sulfate
solutions molality except for glycine at 1.0 molal. The is higher for glycine
than for alanine, although for happens the opposite.

Chapter 4. Theoretical Analysis
52
Figure 4.3.
/cm3·mol
-1·K
-1, in aqueous ammonium sulfate solutions at different temperatures
and molalities in (a) glycine and (b) alanine.
Figure 4.4.
/cm3·mol
-1·K
-2, in aqueous ammonium sulfate solutions in glycine and alanine.
4.5 Group Contribution
Group-contribution methods are also commonly used to calculate thermodynamics
properties in amino acids aqueous solutions. For that is necessary to present values for
the contribution of each group in the amino acids. In this case the individual
contributions of charged groups and hydrophobic group CH2-(Gly) are
presented in the Table 4.5. The contribution of the hydrophobic group CHCH3-(Ala) is
twice the contribution of CH2-(Gly), according with the relations proposed by Hakin et
al. (1994):
-0.04
0.00
0.04
0.08
0.12
0.16
270 280 290 300 310 320 330
(𝝏𝑽
𝟎/𝝏𝑻
) P
T (K)
0.0 0.1 0.3 0.7 1.0 1.3 2.0
(a)
-0.04
0.00
0.04
0.08
0.12
0.16
270 280 290 300 310 320 330
(𝝏𝑽
𝟎/𝝏𝑻
) P
T (K)
0.0 0.1 0.3 0.7 1.3 2.0
(b)
-0.0030
-0.0025
-0.0020
-0.0015
-0.0010
-0.0005
0.0000
0.0005
0.0 0.5 1.0 1.5 2.0
(𝝏𝟐 𝑽
𝟎/𝝏𝑻𝟐) 𝑷
m(NH4)2SO4
Glycine
Alanine

Chapter 4. Theoretical Analysis
53
(4.5)
(4.6)
Table 4.5. Contribution to the partial molar volumes from zwitterionic end groups (NH3+, COO
-) and -
CH2- in water and in aqueous ammonium sulfate solutions from T = (278.15 to 318.15) K.
0.0 0.1 0.3 0.7 1.3 2.0
T(K) NH3+, COO
-
278.15 23.50 24.52 26.07 27.48 29.30 30.82
288.15 24.97 25.81 26.99 28.42 30.20 31.78
298.15 25.93 26.66 27.72 28.96 30.86 32.20
308.15 26.59 27.30 27.89 29.38 31.16 32.25
318.15 27.00 27.70 28.46 29.80 31.55 32.73
-CH2-
278.15 17.68 17.56 17.34 17.38 17.20 17.03
288.15 17.41 17.32 17.21 17.18 16.88 16.63
298.15 17.26 17.21 17.11 17.13 16.71 16.53
308.15 17.17 17.11 17.22 17.03 16.66 16.61
318.15 17.15 17.09 17.10 16.98 16.59 16.47
Figure 4.5.
( ,COO
-; -CH2-)/cm
3·mol
-1, in
function of the molality of ammonium sulfate at
298.15 K.
Figure 4.6. (
,COO-; -CH2-)/cm
3·mol
-1, in
function of the temperature in 0.3 ammonium
sulfate.
As can be seen in Figure 4.5 and 4.6, followed the order (
, COO-) > (-CH2-).
The (
, COO-) group contribution for amino acids increases with an increase in
the concentration of ammonium sulfate and in temperature, while the (-CH2-)
contribution remains approximately constant. This means that ( , COO
-) group
contribution is more dependent on the molality, and temperature, and has a higher
contribution. Banerjee and Kishore (2005) and Islam and Wadi (2003) obtained the
15
20
25
30
35
40
0.0 0.5 1.0 1.5 2.0
Vφ
0
m(NH4)2SO4
15
17
19
21
23
25
27
29
31
278.2 288.2 298.2 308.2 318.2
Vφ
0
T (K)

Chapter 4. Theoretical Analysis
54
same results in the measurements of glycine and alanine in aqueous
tetraethylammonium bromide and sodium sulfate solutions, respectively. Generally the
group contribution (-CH2-) decrease with an increase in the temperature.
4.6 Discussion and Interpretation
In the ternary solutions evaluated the ions present in solution are and
from
ammonium sulfate, while AA’s present the charged groups .
Based on the previously discussed theoretical review is possible to obtain some
important conclusions for the systems under study.
In solution, the salt used in this work, dissociates into the anion sulfate that is a strong
ion and into the cation ammonium that is a weakly hydrated. It is know that strongly
hydrated ions have stronger interactions with polar groups of amino acids ( and
COO-) causing dehydration of amino acids, implying that weakly hydrated ions have
weaker interactions with amino acids. According to Zhao et al. (2006) volumes of
transfer are typically high in solutions containing strong ions and usually low in
solutions of weakly hydrated ions. In this case the strong ions dominate, that present
higher volumes of transfer. These are all positive which indicates that the hydration
number of the amino acid is reduced upon the addition of cosolutes, according with
Ogawa et al. (1984). At higher concentrations of ammonium sulfate the are more
pronounced, confirming the dehydration effect of the salt.
According to the co-sphere overlap model, if the are positive values the ion
charged/ hydrophilic group interactions are much stronger and dominate over the ion-
hydrophobic and hydrophobic-hydrophobic group interactions. So, in this ternary
system, the overlap of cosolute ions and amino acids comes into play because of
interactions between the (- , -COO
-) charged ends of amino acids and ions of the
cosolute. Naturally, like found by Aktar (2007) the interactions between
and the
ion are expected to predominate even if a more definitive conclusion can be
checked by molecular dynamics. In the case of the amino acids in study, glycine and
alanine, the charged head groups of COO- and
dominate the interactions. The
hydration spheres of glycine and alanine are mainly composed of charge-dipole forces.
Therefore, an overlap of co-spheres of glycine or alanine with that of exposed nonpolar

Chapter 4. Theoretical Analysis
55
groups would squeeze out some water mainly from the hydrophobic hydration spheres
of these nonpolar groups.
The values for glycine are higher than for alanine which indicates that replacement
of one –H atom of glycine with –CH3 group provides an increase tendency of
hydrophilic–hydrophobic and hydrophobic–hydrophobic group interactions, and as a
result, greater electrostriction of the solvent water is produced, leading to smaller values
of . In other words, the absence of hydrophobic hydration in glycine due to absence
of any methyl group (methyl group tightens the water molecules around itself) causes
glycine to be under a higher electrostriction effect than alanine and other amino acids
containing methyl groups.
The solution of amino acid in water shows an overall decrease in the volume of water.
This is due to the electrostriction of water by charged end groups of amino acids.
Addition of (NH4)2SO4 will affect the hydration spheres of charged end groups. As a
result of - COO
- and
- interactions, the hydrated water molecules are
allowed to relax to the bulk state and cause an increase in the volume. The increase in
the temperature favors the relaxation of water, increasing the volume. Some preliminary
studies of molecular dynamics suggest that -
interaction is more intense than
- COO
- interaction.
The hydration number decreases with the increasing of concentration of aqueous
solutions of ammonium sulfate. This means that the number of water molecules
hydrating amino acids decreases, further strengthening the predominance of
ionic/hydrophilic interactions in this system, i.e., due to interaction of charged end
groups and ions, water is relaxed in the bulk state.
At higher concentration of ammonium sulfate and at low temperature, the
values of alanine are low, favoring solute–solvent interactions. The effect is that
charged end-group of alanine influences electrostatically surrounding water molecules
(so-called electrostriction). As a result, the electrostricted water may be released from
the loose solvation layers of alanine by the increasing the temperature. The effect is that
the removal of water molecules favors alanine–ammonium sulfate interactions,

Chapter 4. Theoretical Analysis
56
indicating the structure-breaking effect of alanine in the high concentration region of
ammonium sulfate and at low temperature.
According to Hepler (1969), and his hydrophobicity criteria it is possible to reflect
about the hydrophobicity of the solute. For the both amino acids and almost all
concentrations and temperatures and
, so the solute
is hydrophilic. There are only few exceptions which are not defined by this criterion.
The obtained values are negative for both amino acids, except for alanine
at 318.15 K and 2.0 molal of aqueous ammonium sulfate solutions, which suggests that
studied amino acids are structure breakers in water as well as in aqueous ammonium
sulfate solutions. It is also possible to realize that as the concentration of ammonium
sulfate increases, the hydrophilic character of the solute is somehow modified (
becomes positive).
Confirming the findings presented so far, the larger value of (
, COO-) in
(NH4)2SO4 as compared to the value in water indicates that the interactions of the ions
of (NH4)2SO4 with the zwitterionic end groups ( , COO
-) of the amino acids are
stronger and increase with the concentration of (NH4)2SO4.
Larger values of (
, COO-) than
(CH2) indicate that the interactions of the ions
of ammonium sulfate with the zwitterionic groups of the amino acids dominate
compared to those of the hydrophobic group–(NH4)2SO4 interactions. In addition, the
difference in the molar masses of the ( , COO
-) and CH2 groups also accounts for
the larger values of the former.
In the literature there are no published studies involving measurements of density in
aqueous ammonium sulfate solutions containing the amino acids glycine or alanine.
However there are some studies involving the ions ammonium or sulfate. Based on
these it is possible to make some comparisons.
The densities of glycine and alanine were measured by Islam and Wadi (2003) in
aqueous sodium sulfate solutions, Mallick and Kishore (2006) in aqueous magnesium
sulfate solutions, Natarajan et al. (1990) in aqueous ammonium chloride solutions,
Sadeghi and Gholamireza (2011) in aqueous di-ammonium hydrogen citrate solutions

Chapter 4. Theoretical Analysis
57
and Sinha et al. (2011) measured densities of aqueous silver sulfate solutions containing
alanine. In all of these works the transfer volumes are in general positive, indicating the
predominance of the interactions of zwitterionic/hydrophilic groups of amino acids with
ions of the salt, and increase with the concentration of salt whereas increased
temperature has the opposite effect. According with Natarajan et al. (1990) an increase
in the volume of transfer with electrolyte concentration has been explained due to strong
interactions of and Cl
- with the charged centers of the zwitterions compared to ion-
nonpolar-group interaction. The interaction of and Cl
- ions with the amino acids is
located at the head groups (COO- and
). Due to these interactions, the
electrostriction of water caused by the charge centers of the amino acid will be reduced,
which results in an increase in volume. The decrease of the volume of transfer with the
temperature rise was explained by Sinha et al. (2011), due to more thermal agitation and
less electrostriction at higher temperatures. The hydration numbers decreases with
increasing concentration of salt. The number of water molecules hydrated to amino
acids decreases, further strengthening the predominance of ionic/hydrophilic
interactions in the systems. These results are in agreement with those obtained in this
work. An attempt was also tried to relate with the ionic radius of the cation in
sulfate solutions 1 molal at 298.15 K. Even if the number of systems is still small,
Figure 4.7 suggests that the transfer volume decreases with the radius of the cation.
Figure 4.7. Volume of transfer at 1.0 molal of XXSO4 [XX=Mg, Na, (NH4)2] and 298.15 K in function of
the cation radius (Marcus, 1988) [ Mallick and Kishore (2006), Islam and Wadi (2003) and this
work].
3.95
4.05
4.15
4.25
0.00 0.10 0.20
Vφ
,tr0
(cm
3·m
ol-1
)
Rion (nm)
Na+
Mg2+
NH4+

Chapter 5. Conclusions
58
5. Conclusions
5.1 Main Conclusions
A biotechnological production of amino acids is nowadays a prospect market due to
major successes in cost effective production and isolation of amino acids products. For
the design, optimization and scale-up of the separation processes the knowledge of
thermodynamics data is of extreme importance. Although it is possible to find in
literature a considerable number of both experimental and modeling work concerning
amino acid studies in pure water, the situation is not the same for aqueous amino acid
solutions with a salt where there is still a great lack of information. It was then evident
the absolute need to carry out further measurements in order to extend the experimental
database already available.
The density and the speed of sound of aqueous ammonium sulfate solutions containing
the amino acids glycine and alanine, has been measured in water and in the systems
water/electrolyte [(NH4)2SO4] in the temperature range between 278.15 K and 318.15
K. These values were measured using a digital densimeter (Anton Paar DSA 5000). The
solutions were prepared by mass (±0.1 mg) using distilled and degassed water. For each
electrolyte molality, the measurements were made sequentially, from the binary solution
to the highest amino acid concentration (up to 0.5 molal) at five different temperatures
(±0.1 K). The reproducibility of the measurements is estimated to be ±0.01 kg·m-3
, and
concerning the binary solutions the values agree well with literature values. A set of
accurate data, presenting around one thousand six hundred new density values were
measured from which seventy values of partial molar volumes were obtained. The
systematized experimental study developed in this work contributed, to study new
systems, while the temperature and composition ranges usually studied were extended.
In the present work, the partial molar volumes, volume of transfer, hydration numbers,
partial molar expansibilities and group contributions for glycine and alanine in aqueous
solutions of ammonium sulfate were calculated by density measurements at 278.15,
288.15, 298.15, 308.15 and 318.15 K.
Higher values observed for amino acids in the studied cosolute suggest that ion-
charged group interactions dominate over ion-non-polar group interactions. The

Chapter 5. Conclusions
59
volumes of transfer data suggest that ion charged/ hydrophilic group interactions are
predominant in the case of glycine and alanine. Applying the McMillan and Mayer
formalism was found that interactions between ammonium sulfate and amino acids are
mainly pair wise. The hydration numbers of the amino acids under investigation
decrease with temperature and this cause a dehydration effect on the amino acids. The
negative values indicate that, for both amino acids in water and in
ammonium sulfate, solutes are structure breakers. The contribution of the zwitterionic
( , COO
−) group to the value of the standard partial molar volume increases with
increasing concentration of ammonium sulfate. In general, the contribution of -CH2- and
other alkyl groups has a weak decreasing trend.
The satisfactory experimental results obtained in this work undoubtedly contributed for
the understanding of these complex systems, and also to those containing proteins,
peptides or antibiotics which certainly provide new insights for applications in the
industry.
5.2 Suggestions for Future Work
A systematic experimental study on the density and speed of sound of two amino acids
in aqueous solution with or without a salt, was been developed in order to contribute for
the fulfillment of the lack of information found in these fields. Naturally, the database is
far from being completed so it is fundamental to continue the experimental work
increasing the number of studied systems. Specifically, a huge lack of accurate
information still remains for the speed of sound of amino acids in aqueous electrolyte
solutions, which deserves an important effort due to its importance and contribute to
check the consistency of the results found from density data.
One particular suggestion for future work is the study of more systems under exactly the
same conditions but involving homo and heteropeptides of different size. Also, the
volumetric information for aqueous ammonium sulfate solution 1 molal, containing
alanine, should be checked.
From the theoretical point of view it will be important to study the data of different
systems in order to search for relations between the partial molar volumes and the
properties of the electrolyte.

Chapter 5. Conclusions
60
61
References
Akhtar, Y., Volumetric and Viscometric Behaviour of Amino Acids in Aqueous Metal
Electrolytes Solutions at 308 K, Fluid Phase Equilib., 258, 125-130 (2007).
Ashmead, H. D., Foliar Feeding of Plants with Amino Acid Chelates, Noyes
Publications (1986).
Ashwortha, J.; Keyesa, D.; Kirka, R.; Lessarda, R., Standard Procedure in the
Hydrometer Method for Particle Size Analysis, Commun. Soil Sci. Plant Anal., 32, 633-
642 (2001).
Assael, M. J.; Goodwin, A. R. H.; Stamatoudis, M.; Wakeham, W. A.; Will, S.,
Commonly Asked Questions in THERMODYNAMICS, CRC Press, 1st
edition (2011).
Badarayani, R.; Kumar, A., Ionic Interactions from Volumetric Investigations of L-
Alanine in NaBr, KCl, KBr and MgCl2 up to High Concentrations, Fluid Phase
Equilib., 201, 321-333 (2002).
Badarayani, R.; Kumar, A., Densities and Speed of Sound of Glycine in Concentrated
Aqueous NaBr, KCl, KBr and MgCl2 at T = 298.15 K, J. Chem. Thermodyn., 35, 897-
908 (2003a).
Badarayani, R.; Kumar, A., Effect of Temperature on the Volumetric Properties of the
L-Alanine (1) + KCl (2) + H2O (3) System, J. Chem. Eng. Data, 48, 664-668 (2003b).
Badarayani, R.; Kumar, A., Effect of Tetra-n-alkylammonium Bromides on the
Volumetric Properties of Glycine, L-Alanine and Glycylglycine at T=298.15 K, J.
Chem. Thermodyn., 36, 49-58 (2004a).
Badarayani, R.; Kumar, A., The Mixing Effect of Glycylglycine with KCl, KBr, and
Na2SO4 from Volumetric and Viscometric Investigations at 298.15 K, J. Sol. Chem., 33,
407-426 (2004b).
Badarayani, R.; Kumar, A., Viscometric Study of Glycine, L-Alanine, Glycylglycine in
Aqueous Tetra-n-alkylammonium Bromide Solutions at 298.15 K, J. Chem.
Thermodyn., 36, 983-991 (2004c).

References
62
Banerjee, T.; Kishore, N., Interactions of Some Amino Acids with Aqueous
Tetraethylammonium Bromide at 298.15 K: A Volumetric Approach, J. Sol. Chem., 34,
137-153 (2005).
Banipal, T. S.; Singh, G., Densities and Partial Molar Volumes of Some Amino Acids
and Diglycine in Aqueous n-Propanol Solutions at 25 ºC, J. Sol. Chem., 32, 997-1015
(2003).
Banipal, T. S.; Kaur, D.; Banipal, P. K.; Singh, G., Thermodynamic and Transport
Properties of L-Serine and L-Threonine in Aqueous Sodium Acetate and Magnesium
Acetate Solutions at T = 298.15 K, J. Chem. Thermodyn., 39, 371-384 (2007a).
Banipal, T. S.; Singh, K.; Banipal, P. K., Volumetric Investigations on Interactions of
Acidic/Basic Amino Acids with Sodium Acetate, Sodium Propionate and Sodium
Butyrate in Aqueous Solutions, J. Sol. Chem., 36, 1635-1667 (2007b).
Becker, J.; Wittmann, C., Systems and Synthetic Metabolic Engineering for Amino
Acid Production - The Heartbeat of Industrial Strain Development, Curr. Opin.
Biotechnol., 23, 1-9 (2012).
Berlin, E.; Pallansch, M. J., Densities of Several Proteins and L-Amino Acids in the Dry
State, J. Phys. Chem., 72, 1887-1889 (1968).
Bhat, R.; Ahluwalia, J. C., Partial Molar Heat Capacities and Volumes of Transfer of
Some Amino Acids and Peptides from Water to Aqueous Sodium Chloride Solutions at
298.15 K, J. Phys. Chem., 89, 1099-1105 (1985).
Brožek, J.; Grande, F.; Anderson, J. T., Keys, A., Densitometric Analysis of Body
Composition: Revision of Some Quantitative Assumptions, Ann. N.Y. Acad. Sci., 110,
113-140 (1963).
Chalikian, T. V.; Sarvazyan, A. P.; Breslauer, K. J., Hydration and Partial
Compressibility of Biological Compounds, Biophys. Chem., 51, 89-109 (1994).

References
63
Chalikian, T. V.; Sarvazyan, A. P.; Breslauer, K. J., Partial Molar Volumes,
Expansibilities, and Compressibilities of α,ω-Aminocarboxylic Acids in Aqueous
Solutions between 18 and 55 ºC, J. Phys. Chem., 97, 13017-13026 (1993).
Chimankar, O. P.; Shriwas, R.; Tabhane, V. A., Intermolecular Interaction Studies in
Some Amino Acids with Aqueous NaOH, J. Chem. Pharm. Res. 3, 587-596 (2011).
Cibulka, I.; Hnědkovský, L.; Šedlbauer, J., Partial Molar Volumes of Organic Solutes in
Water. XX. Glycine(aq) and L-Alanine(aq) at Temperatures (298 to 443) K and at
Pressures up to 30 MPa, J. Chem. Thermodyn., 42, 198-207 (2010).
Das, P.; Chatterjee, S.; Basumallick, I., Thermodynamic Studies on Amino Acid
Solvation in some Aqueous Alcohols, J. Chin. Chem. Soc., 51, 1-6 (2004).
Dhir, V., A Chemical Review in Adiabatic Compressibilities of various Protein Model
Compounds and Peptide in Aqueous Solutions of Various Electrolytes (Nitrates and
Halide) at Different Temperatures (288.15-318.15K) – An Approach, Int. J. Res.
Biochem. Biophys., 1, 28-123 (2011).
Enea, O.; Jolicoeur, C., Heat Capacities and Volumes of Several Oligopeptides in Urea-
Water Mixtures at 25 ºC. Some Implications for Protein Unfolding, J. Phys. Chem., 86,
3870-3881 (1982).
Greenstein, J. P.; Winitz, M., Chemistry of the Amino Acids, Volume 1, Wiley and Sons,
Inc., New York (1961).
Hakin, A. W.; Daisley D. C.; Delgado, L.; Liu, J. L.; Marriott, R. A.; Marty, J. L.;
Tompkins, G., Volumetric Properties of Glycine in Water at Elevated Temperatures and
Pressures Measured with a New Optically Driven Vibrating-Tube Densimeter, J. Chem.
Thermodyn., 30, 583-606 (1998).
Hakin, A. W.; Duck, M. M.; Marty, J. L.; Preuss, K. E., Some Thermodynamic
Properties of Aqueous Amino Acid Systems at 288.15, 298.15, 313.15 and 328.15 K:
Group Additivity Analyses of Standard-State Volumes and Heat Capacities, J. Chem.
Soc., 90, 2027-2035 (1994).

References
64
Hakin, A. W.; Liu, J. L.; Marriott, R. A., An Investigation of the Volumetric Properties
of L-Alanine and Sodium Bromide in Water at Elevated Temperatures and Pressures, J.
Chem. Thermodyn., 32, 1355-1380 (2000).
Hepler, L., Thermal Expansion and Structure in Water and Aqueous Solutions, Can. J.
Chem., 47, 4613-4617 (1969).
Hermann, T., Industrial Production of Amino Acids by Coryneform Bacteria, J.
Biotechnol., 104, 155-172 (2003).
Islam, M. N.; Wadi, R., Temperature Dependence of Apparent Molar Volumes and
Viscosity B-Coefficients of Amino Acids in Aqueous Sodium Sulfate Solutions from 15
to 35 ºC, Phys. Chem. Liq., 41, 533-544 (2003).
Islam, S.; Waris, B.N., Intermolecular/Interionic Interactions in Leucine–, NaCl–, and
KCl–Aqueous Urea Systems, Thermochim. Acta, 424, 165-174 (2004).
Izumi, Y.; Chibata, I.; Angew, T. I., Production and Utilization of Amino Acids, Chem.
Int . Ed. Engl., 17, 176-183 (1978).
Katriňák, T.; Hnědkovský, L.; Cibulka, I., Partial Molar Volumes and Partial Molar
Isentropic Compressions of Three Polyhydric Alcohols Derived from Propane at
Infinite Dilution in Water at Temperatures T = (278 to 318) K and Atmospheric
Pressure, J. Chem. Eng. Data, 57, 1152-1159 (2012).
Kirk-Othmer, Encyclopedia of Chemical Technology, John Wiley & Sons, 1999-2011.
Krishnan, C. V.; Garnett, M.; Hsiao, B. S.; Chu, B., Solute-Solvent Interactions from
Impedance Measurements: ‘π –way’ Conduction and Water Structure-Enforced Ion Pair
Formation in Aqueous Lidocaine Hydrochloride, Int. J. Electrochem. Sci., 4, 1085-1099
(2009).
Lark, B. S.; Patyar, P.; Banipal, T. S.; Kishore, N., Densities, Partial Molar Volumes,
and Heat Capacities of Glycine, L-Alanine, and L-Leucine in Aqueous Magnesium
Chloride Solutions at Different Temperatures, J. Chem. Eng. Data, 49, 553-565 (2004).

References
65
Leckband, D.; Israelachvili, J., Intermolecular Forces in Biology, Q. Rev. Biophys., 34,
105-267 (2001).
Leyendekkers, J. V., Solutions of Organic Solutes. 1. Volume and Compressibility of
Amino-Acids, J. Phys. Chem., 90, 5449-5455 (1986).
Lin, G.; Bian, P.; Lin, R., The Limiting Partial Molar Volume and Transfer Partial
Molar Volume of Glycylglycine in Aqueous Sodium Halide Solutions at 298.15 K and
308.15 K, J. Chem. Thermodyn., 38, 144-151 (2006).
Lipták, B. G., Instrument Engineers' Handbook Fourth Edition, Volume One-Process
Measurement and Analysis, CRC Press, 2003.
Lorefice, S.; Malengo, A., Calibration of hydrometers, Meas. Sci. Technol., 17 2560-
2566 (2006).
Makhatadze, G. I.; Privalov, P. L., Protein Interactions with Urea and Guanidinium
Chloride. A Calorimetric Study, J. Mol. Biol., 226, 491-505 (1992).
Mallick, B. C.; Kishore, N., Partial Molar Volumes of Some of α-Amino Acids in
Binary Aqueous Solutions of MgSO4·7H2O at 298.15 K, J. Sol. Chem., 35, 1441-1451
(2006).
Marcus, Y., Ionic Radii in Aqueous Solutions, Chem. Rev., 88, 1475-1498 (1988).
Marriott, R.; Hakin, A. W.; Liu, J. L.; Lutter, E., The Volumetric Properties of Aqueous
Solutions of Glycylglycine and L-Serine at Elevated Temperatures and Pressures, J.
Chem. Thermodyn., 33, 959-982 (2001).
Matoba, T.; Doi, E.; Yonezawa, D; Oste, R.; Nair, B. M., An Approach to Assessing the
Gastrointestinal Digestion of Rice and Wheat Proteins - Use of a Model System with
Pepsin, Pancreatin and Intracellular Peptidases, Agric. Biol. Chem., 46, 465-472 (1982).
McMillan, W. G.; Mayer, J., The Statistical Thermodynamics of Multicomponent
Systems, J. Chem. Phys., 13, 276-305 (1945).

References
66
Mendonça, A. F. S. S.; Magalhães, S. R. J.; Rodrigues, S. I. M.; Lampreia, I. M. S.,
Apparent Molar Volumes of Proline-Leucine Dipeptide in NaCl Aqueous Solutions at
318.15 K, J. Sol. Chem., 34, 25-32 (2005).
Mendonça, A.; Barbas, M.; Freitas, J.; Lampreia, I., Volumetric Study of Aqueous
Proline-Leucine Solutions from (283.15 to 318.15) K, J. Chem. Thermodyn., 36, 965-
969 (2004).
Millero, F. J.; Surdo, A. L.; Shin, C., The Apparent Molal Volumes and Adiabatic
Compressibilities of Aqueous Amino Acids at 25 ºC, J. Phys. Chem., 82, 784-792
(1978).
Morrison, R. T.; Boyd, R. N., Organic Chemistry, 6th
Edition, Prentice-Hall
International Edition, New Jersey (1992).
Munde, M. M.; Kishore, N., Volumetric Properties of Aqueous 2-Chloroethanol
Solutions and Volumes of Transfer of Some Amino Acids and Peptides from Water to
Aqueous 2-Chloroethanol Solutions, J. Sol. Chem., 32, 791-802 (2003).
Natarajan, M.; Wadi, R. K.; Gaur, H. C., Apparent Molar Volumes and Viscosities of
some α- and α,ω-Amino Acids in Aqueous Ammonium Chloride Solutions at 298.15 K,
J. Chem. Eng. Data, 35, 87-93 (1990).
Ogawa, T.; Mizutani, K.; Yasuda M., The Volume, Adiabatic Compressibility, and
Viscosity of Amino Acids in Aqueous Alkali-chloride Solutions, Bull. Chem. Soc. Jpn.,
57, 2064-2068 (1984).
Pal, A.; Kumar, S., Volumetric and Ultrasonic Studies of Some Amino Acids in Binary
Aqueous Solutions of MgCl2.6H2O at 298.15 K, J. Mol. Liq., 121, 148-155 (2005a).
Pal, A.; Kumar, S., Volumetric Studies of Some Amino Acids in Binary Aqueous
Solutions of MgCl2.6H2O at 288.15, and 308.15 K, J. Chem. Sci., 117, 267-273
(2005b).
Rao, M. V. R.; Atreyi, M.; Rajeswari, M. R., Estimation of Partial Molar Volumes of
α-Amino Acids in Water, J. Chem. Soc., 80, 2027-2032 (1984).

References
67
Riyazuddeen; Bansal, G. K., Intermolecular/Interionic Interactions in L-Leucine-, L-
Asparagine-, and Glycylglycine-Aqueous Electrolyte Systems, Thermochim. Acta, 445,
40-48 (2006).
Riyazuddeen; Basharat, R., Intermolecular/Interionic Interactions in L-Isoleucine-, L-
Proline-, and L-Glutamine-Aqueous Electrolyte Systems, J. Chem. Thermodyn., 38,
1684-1695 (2006).
Riyazuddeen; Khan, I., Effect of KCl and KNO3 on Partial Molal Volumes and Partial
Molal Compressibilities of Some Amino Acids at Different Temperature, Int. J.
Thermpohys., 30, 475-489 (2009).
Rodriguez, H.; Soto, A.; Arce, A.; Khoshkbarchi, M. K., Apparent Molar Volume,
Isentropic Compressibility, Refractive Index, and Viscosity of DL-Alanine in Aqueous
NaCl Solutions, J. Sol. Chem., 32, 53-63 (2003).
Romero, C. M.; Negrete, F., Effect of Temperature on Partial Molar Volumes and
Viscosities of Aqueous Solutions of α-DL-Aminobutyric Acid, DL-Norvaline and DL-
Norleucine, Phys. Chem. Liq., 42, 261-267 (2004).
Sadeghi, R.; Gholamireza, A., Thermodynamics of the Ternary Systems: (Water +
Glycine, L-Alanine and L-Serine + Di-ammonium Hydrogen Citrate) from Volumetric,
Compressibility, and (Vapour + Liquid) Equilibria Measurements, J. Chem.
Thermodyn., 43, 200-215 (2011).
Schallenberger, R. S.; Acree, T. E.; Lee, C. Y., Sweet Taste of D and L-Sugars and
Amino-Acids and Steric Nature of Their Chemo-Receptor Site, Nature, 221, 555-556
(1969).
Shen, J. L.; Li, Z. F.; Wang, B. H.; Zhang, Y. M., Partial Molar Volumes of Some
Amino Acids and a Peptide in Water, DMSO, NaCl, and DMSO/NaCl Aqueous
Solutions, J. Chem. Thermodyn., 32, 805-819 (2000).
Shiio; Nakamori, S., Fermentation Process Development of Industrial Organisms,
Marcel Dekker, New York, 1989.

References
68
Siddique, J. A.; Naqvi, S., Volumetric Behavior on Interactions of α-Amino Acids with
Sodium Acetate, Potassium Acetate, and Calcium Acetate in Aqueous Solutions, J.
Chem. Eng. Data, 55, 2930-2934 (2010).
Singh, G.; Banipal, T. S., Partial Molar Adiabatic Compressibilities and Viscosities of
Some Amino Acids in Aqueous Glycerol Solutions at 298.15 K, Ind. J. Chem., 47,
1355-1364 (2008).
Singh, S. K.; Kishore, N., Partial Molar Volumes of Amino Acids and Peptides in
Aqueous Salt Solutions at 25 ºC and a Correlation with Stability of Proteins in the
Presence of Salts, J. Sol. Chem. 32, 117-135 (2003).
Singh, S. K.; Kundu, A.; Kishore, N., Interactions of Some Amino Acids and Glycine
Peptides with Aqueous Sodium Dodecyl Sulfate and Cetyltrimethylammonium Bromide
at T = 298.15 K: A Volumetric Approach, J. Chem. Thermodyn., 36, 7-16 (2004).
Sinha, B.; Sarkar, A.; Roy, P. K.; Brahman, D., Physicochemical Properties of L-
Alanine in Aqueous Silver Sulfate Solutions at (298.15, 308.15, and 318.15) K, Int. J.
Thermophys., 32, 2062-2078 (2011).
Sorenson, E. C; Price, J. L.; McRae, B. R.; Woolley, E. M., Thermodynamics of Proton
Dissociations from Aqueous L-Proline: Apparent Molar Volumes and Apparent Molar
Heat Capacities of the Protonated Cationic, Zwitterionic, and Deprotonated Anionic
Forms at Temperatures from 278.15 K to 393.15 K and at the Pressure 0.35 MPa, J.
Chem. Thermodyn., 35, 529-553 (2003).
Soto, A.; Arce, A.; Khoshkbarchi, M. K., Thermodynamics of Diglycine and Triglycine
in Aqueous NaCl Solutions: Apparent Molar Volume, Isentropic Compressibility, and
Refractive Index, J. Sol. Chem., 33, 11-21 (2004).
Strecker, A., Ueber die Künstliche Bildung der Mitchsaüre und einen Neuen, dem
Glycocoll Homologen Körper, Ann. Chem. Pharm., 75, 27-45 (1850).
Tanford, C., Protein Desnaturation, Adv. Protein Chem., 23, 121-282 (1968).

References
69
Venkatesu, P.; Lee, M-J.; Lin, H., Densities of Aqueous Solutions Containing Model
Compounds of Amino Acids and Ionic Salts at T=298.15 K, J. Chem. Thermodyn., 39,
1206-1216 (2007).
Wadi, R. K.; Goyal, R. K., Temperature Dependence of Apparent Molar Volumes and
Viscosity B-Coefficients of Amino Acids in Aqueous Potassium Thiocyanate Solutions
from 15 to 35 ºC, J. Sol. Chem., 21, 163-170 (1992).
Wadi, R. K.; Ramasami, P., Partial Molal Volumes and Adiabatic Compressibilities of
Transfer of Glycine and DL-Alanine from Water to Aqueous Sodium Sulfate at 288.15,
298.15 and 308.15 K, J. Chem. Soc., 93, 243-247 (1997).
Wang, J.; Yan, Z.; Zhuo, K.; Liu, D., Standard Volumes of Transfer for some α-Amino
Acids from Water to Aqueous Sodium Acetate Solutions at 298.15 K, J. Phys. Chem.,
214, 333-345 (2000).
Wang, J.; Yan, Z.; Zhuo, K.; Lu, J., Partial Molar Volumes of Some α-Amino Acids in
Aqueous Sodium Acetate Solutions at 308.15 K, Biophys. Chem., 80, 179-188 (1999).
Wu, G.; Bazer, F. W.; Davis, T. A.; Jaeger, L. A.; Johnson, G. A.; Kim, S. W.; Knabe,
D. A.; Meininger, C. J.; Spencer, T. E.; Yin. Y. L., Important Roles for the Arginine
Family of Amino Acids in Swine Nutrition and Production, Livest Sci., 112, 8-22
(2007).
Yan, Z.; Wang, J.; Kong, W.; Lu, J., Effect of Temperature on Volumetric and
Viscosity Properties of Some α-Amino Acids in Aqueous Calcium Chloride Solutions,
Fluid Phase Equilib., 215, 143-150 (2004).
Yan, Z.; Wang, J.; Zhang, H.; Xuan, X., Volumetric and Viscosity Properties of α-
Amino Acids and Their Groups in Aqueous Sodium Caproate Solutions, J. Chem. Eng.
Data, 50, 1864-1870 (2005).
Yan, Z.; Wang, J.; Zheng, H.; Liu, D., Volumetric Properties of Some α-Amino Acids
in Aqueous Guanidine Hydrochioride at 5, 15, 25, and 35 °C, J. Sol. Chem., 27, 473-
483 (1998).

References
70
Yasuda, Y.; Tochio, N.; Sakurai, M.; Nitta, K., Partial Molar Volumes and Isentropic
Compressibilities of Amino Acids in Dilute Aqueous Solutions, J. Chem. Eng. Data,
43, 205-214 (1998).
Yu, H.; Ito, Y., Preparative Separation of Proteins Using Centrifugal Precipitation
Chromatography Based on Solubility in Ammonium Sulfate Solution, Prep. Biochem.
Biotechnol., 34, 1-12 (2004).
Yuan, Q.; Li, Z.-F.; Wang, B.-H., Partial Molar Volumes of L-Alanine, DL-Serine, DL-
Threonine, L-Histidine, Glycine, and Glycylglycine in Water, NaCl, and DMSO
Aqueous Solutions at T = 298.15 K, J. Chem. Thermodyn., 38, 20-33 (2006).
Zhao, H., Viscosity B-Coefficients and Standard Partial Molar Volumes of Amino
Acids, and their Roles in Interpreting the Protein (Enzyme) Stabilization, Biophys.
Chem., 122, 157-183 (2006), and references therein.

71
Appendices
Appendix A: The Chemistry of Amino Acids
Table A.1. α-Amino acids found in proteins.
Glycine (Gly)
Alanine (Ala)
Valine* (Val)
Leucine* (Leu)
Isoleucine* (Ile)
Methionine* (Met)
Proline (Pro)
Phenylalanine* (Phe)
Tryptophan* (Trp)
Serine (Ser)
Threonine* (Thr)
Cysteine (Cys)
Tyrosine (Tyr)
Asparagine (Asn)
Glutamine (Gln)
Aspartic Acid (Asp)
Glutamic Acid (Glu)
Arginine* (Arg)
Histidine* (His)
Lysine* (Lys)
*essencial amino acids

72
Appendix B: Literature Review
Table B.1. Binary systems (AA+H2O).
Amino acids Properties Temperatures (K) Reference
Glycine, DL-α-alanine, DL-α-amino-n-butyric acid, L-
valine, L-leucine and diglycine Density 298.15 Banipal and Singh, 2003
Glycine and β-alanine Density and speed of sound 291.15 to 328.15 Chalikian et al., 1993
Glycine and L-alanine Density 298 to 443 Cibulka et al., 2010
Glycine Density 397.39 to 473.16 Hakin et al., 1998
L-alanine Density 397 to 521 Hakin et al., 2000
Glycylglycine and L-serine Density 298 to 423 Marriott et al., 2001
Proline-leucine Density 283.15 to 318.15 Mendonça et al., 2004
Glycine, L-alanine, L-serine, L-glutamic acid, and L-
aspartic acid Density 308.15 Munde and Kishore, 2003
α- DL-aminobutyric acid, DL-norvaline and DL-
norleucine Density and viscosity
288.15, 293.15, 298.15
and 303.15 Romero and Negrete, 2004
L-asparagine, L-glutamine, L-histidine, L-aspartic, L-
glutamic acid, L-lysine, L-arginine and L-histidine Density and speed of sound
278.15, 288.15, 298.15,
308.15 and 318.15 Yasuda et al., 1998

Appendix B. Literature Review
73
Table B.2. Ternary systems (AA+salt+H2O).
Amino acids Salt Properties Temperatures (K) Reference
L-proline and L-glutamine Cu(NO3)2 and NiCl2 Density and viscosity 308 Akhtar, 2007
L-alanine NaBr, KCl, KBr and MgCl2 Density and speed of sound 298.15 Badarayani and Kumar,
2002
Glycine NaBr, KCl, KBr and MgCl2 Density and speed of sound 298.15 Badarayani and Kumar,
2003a
L-alanine KCl Density and speed of sound 283.15 to 313.15 Badarayani and Kumar,
2003b
Glycine, L-alanine and
glycylglycine
(CH3)4NBr, (C2H5)4NBr and
(C4H9)4NBr Density 298.15
Badarayani and Kumar,
2004a
Glycylglycine KCl, KBr and Na2SO4 Density, speed of sound and
viscosity 298.15
Badarayani and Kumar,
2004b
Glycine, L-alanine and
glycylglycine
(CH3)4NBr, (C2H5)4NBr and
(C4H9)4NBr Viscosity 298.15
Badarayani and Kumar,
2004c
Glycine, L-alanine, DL-α-amino-n-
butyric acid, L-valine and L-leucine C8H20BrN Density 298.15
Banerjee and Kishore,
2005
L-aspartic acid, L-glutamic acid, L-
lysine and L-arginine
NaCH3COO, NaC2H5COO
and NaC3H7COO Density
288.15, 298.15,
308.15 and 318.15 Banipal et al., 2007b
Glycine, alanine, DL-α-amino-n-
butyric acid, valine, leucine,
diglycine and glycylalanine
NaCl Heat capacity and density 298.15 Bhat and Ahluwalia, 1985
Glycine, DL-alanine, DL-α-
aminobutyric acid, DL-valine, β-
alanine, ϒ-aminobutyric acid and δ-
aminovaleric acid
Na2SO4 Density and viscosity 288.15, 298.15 and
308.15 Islam and Wadi, 2003
Glycine, L-alanine, and L-leucine MgCl2 Density 288.15, 298.15, and
308.15 Lark et al., 2004
Glycylglycine NaF, NaCl and NaBr Density 298.15 and 308.15 Lin et al., 2006

Appendix B. Literature Review
74
Continued
Glycine, alanine, α-amino-n-butyric
acid, valine and leucine MgSO4 Density 298.15 Mallick and Kishore, 2006
Proline-leucine dipeptide NaCl Density 318.15 Mendonça et al., 2005
Glycine, DL-α-alanine, DL-α-
aminobutyric acid, DL-norvaline,
DL-norleucine, β-alanine, ϒ-
aminobutyric acid, δ-aminovaleric
acid, ε-aminocaproic acid, L-serine,
L-threonine, DL-valine, L-glutamine,
DL-methionine and DL-
phenylalanine
NH4Cl Density and viscosity 298.15 Natarajan et al., 1990
Glycine, L-alanine, β-alanine, α-
aminoisobutyric acid, L-serine and
L-threonine
LiCl, NaCl and KCl Density, speed of sound and
viscosity 298.15 Ogawa et al., 1984
Glycine, L-alanine and L-valine MgCl2 Speed of sound and density 298.15 Pal and Kumar, 2005a
Glycine, L-alanine and L-valine MgCl2 Density 288.15 and 308.15 Pal and Kumar, 2005b
L-leucine, L-asparagine and
glycylglycine NaCl, NaNO3 and KNO3 Speed of sound and density 298.15 to 323.15
Riyazuddeen and Bansal,
2006
L-isoleucine, L-proline and L-
glutamine KCl, KNO3 and K2SO4 Speed of sound and density
303.15, 308.15,
313.15, 318.15 and
323.15
Riyazuddeen and Basharat,
2006
L-alanine, L-proline, L-valine, and L-
leucine KCl and KNO3 Density and speed of sound
298.15, 303.15,
308.15, 313.15,
318.15, and 323.15
Riyazuddeen and Khan,
2009
DL-alanine NaCl Density, speed of sound,
refractive index and viscosity 298.15 Rodríguez et al., 2003
Glycine, DL-alanine, DL-serine, DL-
threonine, L-histidine and
glycylglycine
NaCl Density 278.15, 288.15,
298.15 and 308.15 Shen et al., 2000

Appendix B. Literature Review
75
Continued
L-lysine monohydrochloride, L-
histidine and L-arginine
NaCH3COO, KCH3COO and
Ca(CH3COO)2 Density 303.15 to 323.15 Siddique and Naqvi, 2010
Glycine, L-alanine, L-leucine, L-
valine, L-serine, D,L-glutamic acid/
sodium salt, glycyl-glycine and
glycyl-glycylglycine
NaCH3COO, NaSCN and
Na2SO4 Density 298.15 Singh and Kishore, 2003
Glycine, alanine, valine, leucine and
lysine
NaCH3(CH2)11OSO3 and
BrC16H33N(CH3)3 Density 298.15 Singh et al., 2004
L-proline HCl and NaOH Density 278.15 to 368.15 Sorenson et al., 2003
Diglycine and triglycine NaCl Density and speed of sound 298.15 Soto et al., 2004
Glycine, DL-alanine, L-threonine, β-
alanine, ϒ-aminobutyric acid and ε-
aminocaproic acid
KSCN Density and viscosity 288.15, 298.15 and
308.15 Wadi and Goyal, 1992
Glycine and DL-alanine Na2SO4 Density and speed of sound 288.15, 298.15 and
308.15 Wadi and Ramasami, 1997
Glycine, DL-α-alanine, DL-α-amino-
n-butyric acid, DL-valine and DL-
leucine
NaCH3COO Density 308.15 Wang et al., 1999
Glycine, DL-alanine, DL-α-amino-n-
butyric acid, DL-valine, DL-leucine,
and L-serine
CH5N3.HCl Density 278.15, 288.15,
298.15 and 308.15 Yan et al., 1998
Glycine, DL-α-alanine, DL-α-
aminobutyric acid, DL-valine, DL-
leucine and L--serine
CaCl2 Density and viscosity 278.15, 288.15,
298.15 and 308.15 Yan et al., 2004
L-alanine, DL-serine, DL-threonine,
L-histidine, glycine and
glycylglycine
NaCl Density 298.15 Yuan et al., 2006

76
Appendix C: Derivation of the Equation to Calculate the Partial Molar Volume
By the definition, the apparent molar volume of the AA ( is:
(C.1)
where is the volume of the ternary system, is the solvent volume (water + salt)
and is the number of moles of amino acid.
Considering the mass of the specie i,
(C.2)
, and .
By the definition of molality,
(C.3)
(C.4)
By analogy,
(C.5)
Knowing that
( ⁄ )
( ⁄ )
(C.6)
Dividing by ,
(C.7)
(C.8)

Appendix C: Derivation of the Equation to Calculate the Partial Molar Volume
77
(C.9)
At infinite dilution , and .
Finally,
[
] (C.10)
If is the number of moles of amino acid per kilogram of binary solvent and not per
kilogram of water, the following formula can be used to calculate the apparent molar
volume:
(C.11)
and, the partial molar volume is calculate through:
(C.12)
where is an experimental slope.
It should be noted that in many publications studied the question of interpretation,
concerning the formula used and if was properly used arose. In fact, many times it is not
possible to understand if the concentration is expressed per kilogram of water or
kilogram of binary solvent (water + salt).

78
Appendix D: Density Values
Table D.1. Density values measured for aqueous systems AA + H2O. (g·cm
-3)
(mol·kg-1
) 278.15 K
288.15 K
298.15 K
308.15 K
318.15 K
Water + AA
Glycine
0.0000 0.999967
0.999103
0.997048
0.994033
0.990213
0.0500 1.001662
1.000726
0.998634
0.995591
0.991760
0.0967 1.003226
1.002237
1.000108
0.997043
0.993196
0.1500 1.004999
1.003950
1.001778
0.998688
0.994824
0.2000 1.006647
1.005542
1.003334
1.000218
0.996338
0.2996 1.009890
1.008679
1.006402
1.003236
0.999326
0.3952 1.012951
1.011645
1.009298
1.006091
1.002154
0.4999 1.016258
1.014846
1.012427
1.009177
1.005208
Alanine
0.0000 0.999967
0.999103
0.997048
0.994033
0.990213
0.0500 1.001505
1.000588
0.998498
0.995467
0.991639
0.1000 1.002998
1.002035
0.999916
0.996867
0.993028
0.1500 1.004476
1.003471
1.001323
0.998255
0.994406
0.2000 1.005941
1.004894
1.002717
0.999634
0.995771
0.3000 1.008835
1.007705
1.005474
1.002353
0.998469
0.4000 1.011683
1.010471
1.008184
1.005034
1.001124
0.5000 1.014473
1.013187
1.010849
1.007660
1.003732

Appendix D: Density Values
79
Table D.2. Density values measured for ternary systems, AA + salt + H2O. (g·cm
-3)
(mol·kg-1
) 278.15 K
288.15 K
298.15 K
308.15 K
318.15 K
0.1 mol·kg-1
ammonium sulfate
Glycine
0.0000 1.008181
1.007059
1.004848
1.001746
0.997886
0.0500 1.009788
1.008614
1.006368
1.003241
0.999368
0.1000 1.011396
1.010170
1.007891
1.004740
1.000851
0.1502 1.012994
1.011720
1.009405
1.006229
1.002327
0.2000 1.014573
1.013247
1.010901
1.007703
1.003782
0.3001 1.017705
1.016284
1.013871
1.010632
1.006679
0.3999 1.020781
1.019269
1.016789
1.013506
1.009530
0.4995 1.023808
1.022201
1.019668
1.016343
1.012341
Alanine
0.0000 1.008181
1.007059
1.004848
1.001746
0.997886
0.0500 1.009634
1.008474
1.006231
1.003114
0.999243
0.1000 1.011060
1.009862
1.007592
1.004459
1.000576
0.1500 1.012470
1.011234
1.008939
1.005792
1.001896
0.1996 1.013846
1.012575
1.010251
1.007086
1.003182
0.3000 1.016626
1.015283
1.012907
1.009710
1.005784
0.4000 1.019342
1.017925
1.015506
1.012278
1.008332
0.5000 1.022021
1.020533
1.018067
1.014810
1.010843
0.3 mol·kg-1
ammonium sulfate
Glycine
0.0000 1.023476
1.021948
1.019470
1.016209
1.012266
0.0500 1.024988
1.023417
1.020916
1.017620
1.013685
0.1000 1.026489
1.024878
1.022341
1.019035
1.015083
0.1500 1.027968
1.026321
1.023751
1.020456
1.016455
0.2000 1.029443
1.027750
1.025154
1.021815
1.017827
0.3000 1.032376
1.030592
1.027945
1.024567
1.020559
0.3999 1.035256
1.033398
1.030694
1.027232
1.023234
0.5000 1.038089
1.036161
1.033403
1.029976
1.025897
Alanine
0.0000 1.023476
1.021948
1.019470
1.016209
1.012266
0.0500 1.024777
1.023224
1.020724
1.017452
1.013493
0.0999 1.026083
1.024502
1.021980
1.018693
1.014728
0.1500 1.027393
1.025779
1.023236
1.019937
1.015959
0.1992 1.028653
1.027012
1.024448
1.021134
1.017155
0.2995 1.031230
1.029523
1.026919
1.023580
1.019580
0.4000 1.033772
1.032012
1.029363
1.025999
1.021976
0.5000 1.036244
1.034424
1.031741
1.028353
1.024313

Appendix D: Density Values
80
Continued
0.7 mol·kg-1
ammonium sulfate
Glycine
0.0000 1.051323
1.049183
1.046298
1.042798
1.038728
0.0500 1.052669
1.050496
1.047593
1.044070
1.040000
0.1000 1.054001
1.051797
1.048868
1.045339
1.041258
0.1499 1.055333
1.053091
1.050132
1.046595
1.042511
0.2000 1.056615
1.054344
1.051375
1.047816
1.043718
0.3000 1.059198
1.056868
1.053856
1.050275
1.046152
0.4000 1.061777
1.059390
1.056323
1.052720
1.048587
0.5000 1.064272
1.061840
1.058733
1.055096
1.050938
Alanine
0.0000 1.051323
1.049183
1.046298
1.042798
1.038728
0.0500 1.052443
1.050283
1.047388
1.043879
1.039797
0.1000 1.053578
1.051402
1.048491
1.044967
1.040888
0.1500 1.054706
1.052507
1.049577
1.046079
1.041951
0.2000 1.055811
1.053591
1.050651
1.047114
1.043012
0.3000 1.058016
1.055747
1.052785
1.049229
1.045115
0.3957 1.060097
1.057791
1.054797
1.051228
1.047098
0.5000 1.062325
1.059985
1.056961
1.053380
1.049227
1.0 mol·kg-1
ammonium sulfate
Glycine
0.0000 1.070293
1.067792
1.064697
1.061062
1.056925
0.0500 1.071508
1.068979
1.065865
1.062222
1.058078
0.1000 1.072734
1.070186
1.067046
1.063425
1.059217
0.1500 1.073949
1.071367
1.068210
1.064551
1.060370
0.2000 1.075138
1.072547
1.069374
1.065707
1.061523
0.3000 1.077519
1.074884
1.071669
1.067969
1.063764
0.4000 1.079887
1.077197
1.073949
1.070259
1.066025
0.5000 1.082224
1.079482
1.076203
1.072468
1.068221
Alanine
0.0000 1.070293
1.067792
1.064697
1.061062
1.056925
0.0500 1.071283
1.068790
1.065682
1.062033
1.057893
0.1000 1.072367
1.069858
1.066738
1.063084
1.058936
0.1501 1.073388
1.070859
1.067729
1.064066
1.059917
0.2000 1.074343
1.071802
1.068661
1.064994
1.060839
0.3000 1.076330
1.073761
1.070601
1.066913
1.062753
0.4000 1.078274
1.075674
1.072495
1.068795
1.064624
0.5000 1.080193
1.077571
1.074367
1.070652
1.066473

Appendix D: Density Values
81
Continued
1.3 mol·kg-1
ammonium sulfate
Glycine
0.0000 1.087949
1.085179
1.081890
1.078139
1.073974
0.0500 1.089087
1.086320
1.082992
1.079244
1.075066
0.1000 1.090222
1.087423
1.084091
1.080329
1.076135
0.1500 1.091360
1.088523
1.085173
1.081409
1.077212
0.1999 1.092443
1.089583
1.086220
1.082443
1.078232
0.2987 1.094575
1.091690
1.088311
1.084516
1.080292
0.4000 1.096779
1.093862
1.090436
1.086617
1.082381
0.5000 1.098900
1.095948
1.092521
1.088684
1.084429
Alanine
0.0000 1.087949
1.085179
1.081890
1.078139
1.073974
0.0500 1.088799
1.086034
1.082750
1.078992
1.074830
0.1000 1.089729
1.086949
1.083653
1.079892
1.075721
0.1500 1.090631
1.087846
1.084533
1.080774
1.076597
0.2000 1.091547
1.088748
1.085407
1.081641
1.077474
0.3000 1.093269
1.090459
1.087116
1.083350
1.079159
0.4000 1.095043
1.092205
1.088843
1.085073
1.080863
0.5000 1.096777
1.093916
1.090540
1.086745
1.082541
2.0 mol·kg-1
ammonium sulfate
Glycine
0.0000 1.124496
1.121319
1.117777
1.113895
1.109681
0.0500 1.125427
1.122233
1.118662
1.114782
1.110564
0.1000 1.126393
1.123172
1.119584
1.115702
1.111475
0.1500 1.127347
1.124120
1.120504
1.116607
1.112380
0.1998 1.128138
1.124903
1.121291
1.117394
1.113153
0.3000 1.129973
1.126723
1.123089
1.119178
1.114939
0.4000 1.131799
1.128496
1.124850
1.120921
1.116665
0.5049 1.133654
1.130338
1.126686
1.122763
1.118491
Alanine
0.0000 1.124496
1.121319
1.117777
1.113895
1.109681
0.0500 1.125145
1.121960
1.118392
1.114502
1.110300
0.1000 1.125884
1.122681
1.119110
1.115231
1.111022
0.1500 1.126590
1.123382
1.119802
1.115927
1.111712
0.2000 1.127325
1.124100
1.120526
1.116640
1.112422
0.3000 1.128694
1.125476
1.121896
1.118011
1.113797
0.4000 1.130103
1.126857
1.123256
1.119359
1.115135
0.5000 1.131445
1.128189
1.124591
1.120694
1.116470

82
Appendix E: Speed of Sound Values
Table E.1. Speed of Sound values measured for aqueous systems, AA + H2O. (m·s
-1)
(mol·kg-1
) 278.15 K
288.15 K
298.15 K
308.15 K
318.15 K
Water + AA
Glycine
0.0000 1426.17 1465.93 1496.70 1519.85 1536.45
0.0500 1429.44 1469.05 1499.75 1522.83 1539.44
0.0967 1432.25 1471.66 1502.20 1525.14 1541.68
0.1500 1435.45 1474.62 1504.97 1527.77 1544.22
0.2000 1438.42 1477.38 1507.56 1530.22 1546.56
0.2996 1444.27 1482.81 1512.67 1535.04 1551.16
0.3952 1449.82 1487.95 1517.48 1539.62 1555.51
0.4999 1455.81 1493.50 1522.69 1544.56 1560.23
Alanine
0.0000 1426.17 1465.93 1496.70 1519.85 1536.45
0.0500 1430.30 1469.95 1500.37 1523.38 1540.11
0.1000 1434.11 1473.45 1503.62 1526.42 1542.98
0.1500 1437.90 1476.92 1506.85 1529.44 1545.83
0.2000 1441.67 1480.36 1510.06 1532.43 1548.67
0.3000 1449.10 1487.20 1516.42 1538.39 1554.26
0.4000 1456.47 1493.95 1522.67 1544.26 1559.78
0.5000 1463.69 1500.61 1528.84 1550.01 1565.23

Appendix E. Speed of Sound Values
83
Table E.2. Speed of sound values measured for ternary systems, AA + salt + H2O. (m·s
-1)
(mol·kg-1
) 278.15 K
288.15 K
298.15 K
308.15 K
318.15 K
0.1 mol·kg-1
ammonium sulfate
Glycine
0.0000 1440.17 1479.34 1509.55 1532.29 1548.79
0.0500 1443.03 1481.92 1512.06 1534.66 1550.94
0.1000 1445.89 1484.57 1514.55 1537.03 1553.22
0.1502 1448.75 1487.24 1517.03 1539.38 1555.44
0.2000 1451.58 1489.85 1519.48 1541.70 1557.71
0.3001 1457.19 1495.06 1524.36 1546.32 1562.15
0.3999 1462.77 1500.22 1529.18 1550.88 1566.43
0.4995 1468.27 1505.32 1533.97 1555.41 1570.82
Alanine
0.0000 1440.17 1479.34 1509.55 1532.29 1548.79
0.0500 1443.88 1482.77 1512.69 1535.24 1551.65
0.1000 1447.56 1486.14 1515.83 1538.17 1554.39
0.1500 1451.20 1489.48 1518.93 1541.09 1557.13
0.1996 1454.77 1492.77 1521.97 1543.93 1559.81
0.3000 1462.00 1499.41 1528.11 1549.67 1565.19
0.4000 1469.11 1505.92 1534.16 1555.32 1570.51
0.5000 1476.15 1512.37 1540.13 1560.92 1575.77
0.3 mol·kg-1
ammonium sulfate
Glycine
0.0000 1465.65 1503.35 1532.29 1554.12 1569.73
0.0500 1468.48 1505.97 1534.74 1557.04 1572.03
0.1000 1471.19 1508.46 1537.08 1559.24 1574.17
0.1500 1473.86 1510.94 1539.40 1561.35 1576.25
0.2000 1476.54 1513.40 1541.71 1563.49 1578.35
0.3000 1481.91 1518.32 1546.33 1567.87 1582.56
0.3999 1487.19 1523.22 1550.93 1572.11 1586.68
0.5000 1492.43 1528.07 1555.40 1576.52 1590.80
Alanine
0.0000 1465.65 1503.35 1532.29 1554.12 1569.73
0.0500 1469.10 1506.46 1535.20 1556.84 1572.19
0.0999 1472.52 1509.63 1538.12 1559.58 1574.77
0.1500 1475.99 1512.81 1541.08 1562.34 1577.37
0.1992 1479.38 1515.90 1543.95 1565.02 1579.90
0.2995 1486.27 1522.21 1549.80 1570.48 1585.05
0.4000 1493.12 1528.50 1555.62 1575.91 1590.15
0.5000 1499.81 1534.62 1561.29 1581.24 1595.14
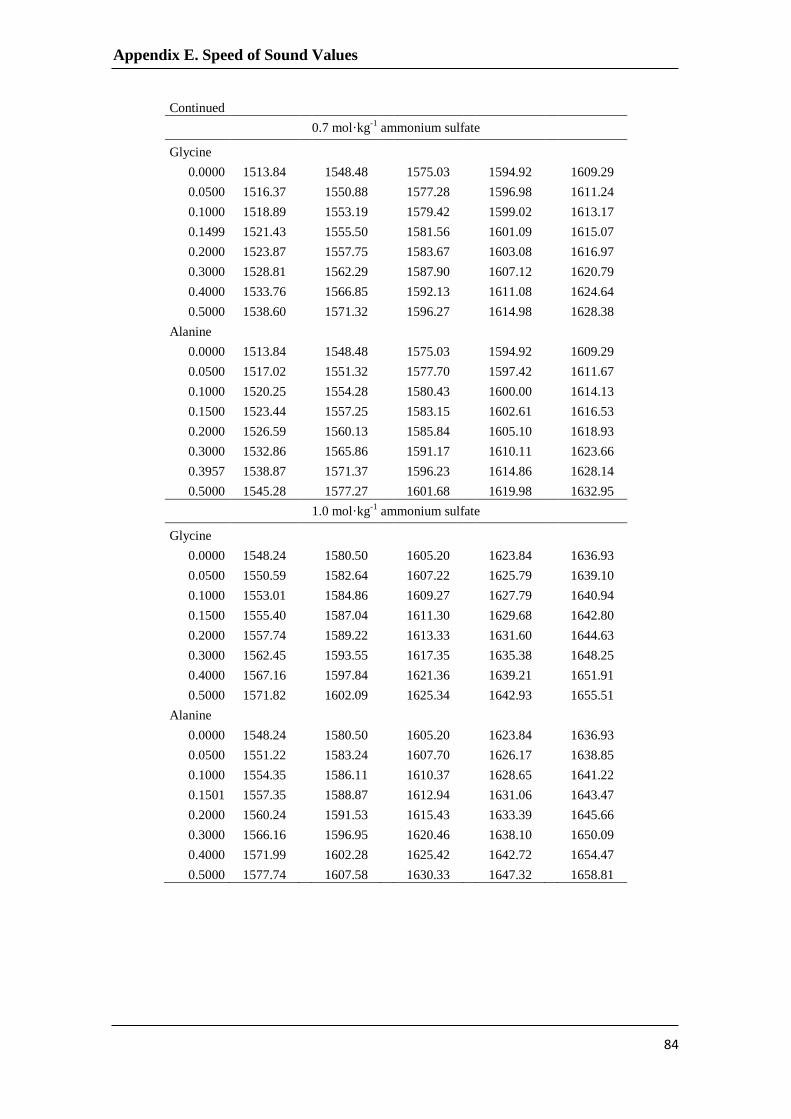
Appendix E. Speed of Sound Values
84
Continued
0.7 mol·kg-1
ammonium sulfate
Glycine
0.0000 1513.84 1548.48 1575.03 1594.92 1609.29
0.0500 1516.37 1550.88 1577.28 1596.98 1611.24
0.1000 1518.89 1553.19 1579.42 1599.02 1613.17
0.1499 1521.43 1555.50 1581.56 1601.09 1615.07
0.2000 1523.87 1557.75 1583.67 1603.08 1616.97
0.3000 1528.81 1562.29 1587.90 1607.12 1620.79
0.4000 1533.76 1566.85 1592.13 1611.08 1624.64
0.5000 1538.60 1571.32 1596.27 1614.98 1628.38
Alanine
0.0000 1513.84 1548.48 1575.03 1594.92 1609.29
0.0500 1517.02 1551.32 1577.70 1597.42 1611.67
0.1000 1520.25 1554.28 1580.43 1600.00 1614.13
0.1500 1523.44 1557.25 1583.15 1602.61 1616.53
0.2000 1526.59 1560.13 1585.84 1605.10 1618.93
0.3000 1532.86 1565.86 1591.17 1610.11 1623.66
0.3957 1538.87 1571.37 1596.23 1614.86 1628.14
0.5000 1545.28 1577.27 1601.68 1619.98 1632.95
1.0 mol·kg-1
ammonium sulfate
Glycine
0.0000 1548.24 1580.50 1605.20 1623.84 1636.93
0.0500 1550.59 1582.64 1607.22 1625.79 1639.10
0.1000 1553.01 1584.86 1609.27 1627.79 1640.94
0.1500 1555.40 1587.04 1611.30 1629.68 1642.80
0.2000 1557.74 1589.22 1613.33 1631.60 1644.63
0.3000 1562.45 1593.55 1617.35 1635.38 1648.25
0.4000 1567.16 1597.84 1621.36 1639.21 1651.91
0.5000 1571.82 1602.09 1625.34 1642.93 1655.51
Alanine
0.0000 1548.24 1580.50 1605.20 1623.84 1636.93
0.0500 1551.22 1583.24 1607.70 1626.17 1638.85
0.1000 1554.35 1586.11 1610.37 1628.65 1641.22
0.1501 1557.35 1588.87 1612.94 1631.06 1643.47
0.2000 1560.24 1591.53 1615.43 1633.39 1645.66
0.3000 1566.16 1596.95 1620.46 1638.10 1650.09
0.4000 1571.99 1602.28 1625.42 1642.72 1654.47
0.5000 1577.74 1607.58 1630.33 1647.32 1658.81

Appendix E. Speed of Sound Values
85
Continued
1.3 mol·kg-1
ammonium sulfate
Glycine
0.0000 1581.52 1611.66 1634.34 1651.48 1663.55
0.0500 1583.95 1614.25 1636.51 1653.54 1665.45
0.1000 1586.24 1616.32 1638.46 1655.38 1667.20
0.1500 1588.54 1618.40 1640.39 1657.21 1669.03
0.1999 1590.73 1620.42 1642.27 1658.98 1670.71
0.2987 1595.05 1624.42 1646.03 1662.51 1674.11
0.4000 1599.54 1628.57 1649.85 1666.12 1677.57
0.5000 1603.88 1632.57 1653.62 1669.68 1680.92
Alanine
0.0000 1581.52 1611.66 1634.34 1651.48 1663.55
0.0500 1584.09 1613.75 1636.49 1653.48 1665.51
0.1000 1586.93 1616.37 1638.91 1655.75 1667.65
0.1500 1589.70 1618.93 1641.29 1657.99 1669.77
0.2000 1592.53 1621.51 1643.66 1660.20 1671.89
0.3000 1597.91 1626.51 1648.31 1664.56 1675.99
0.4000 1603.41 1631.55 1652.98 1668.93 1680.10
0.5000 1608.82 1636.50 1657.58 1673.23 1684.15
2.0 mol·kg-1
ammonium sulfate
Glycine
0.0000 1653.70 1678.71 1697.45 1711.59 1721.48
0.0500 1655.77 1681.02 1699.39 1713.40 1723.19
0.1000 1657.81 1682.87 1701.10 1715.02 1724.76
0.1500 1659.83 1684.73 1702.81 1716.61 1726.32
0.1998 1661.50 1686.28 1704.28 1718.01 1727.65
0.3000 1665.39 1689.85 1707.63 1721.16 1730.70
0.4000 1669.23 1693.36 1710.91 1724.22 1733.65
0.5049 1673.18 1697.00 1714.33 1727.48 1736.77
Alanine
0.0000 1653.70 1678.71 1697.45 1711.59 1721.48
0.0500 1655.78 1680.34 1699.17 1713.20 1722.99
0.1000 1658.20 1682.54 1701.24 1715.16 1724.91
0.1500 1660.53 1684.72 1703.25 1717.06 1726.71
0.2000 1662.92 1686.92 1705.30 1718.99 1728.55
0.3000 1667.46 1691.17 1709.26 1722.72 1732.10
0.4000 1672.09 1695.41 1713.20 1726.41 1735.57
0.5000 1676.55 1699.55 1717.07 1730.04 1739.01

86
Appendix F: Ammonium Sulfate Densities Values
Table F.1. Ammonium sulfate densities values for glycine and alanine. Glycine
T (K) m(NH4)2SO4 ρ (g·m-3
)
T (K) m(NH4)2SO4 ρ (g·m-3
)
T (K) m(NH4)2SO4 ρ (g·m-3
)
278.15 0.1 1.008162
288.15 0.7 1.049193
308.15 2.0 1.113914
278.15 0.1 1.008170
288.15 0.7 1.049217
318.15 2.0 1.109673
278.15 0.1 1.008176
298.15 0.7 1.046302
318.15 2.0 1.109716
288.15 0.1 1.007043
298.15 0.7 1.046314
278.15 2.0 1.124454
288.15 0.1 1.007047
298.15 0.7 1.046319
278.15 2.0 1.124487
288.15 0.1 1.007051
308.15 0.7 1.042798
278.15 2.0 1.124472
298.15 0.1 1.004836
308.15 0.7 1.042808
278.15 2.0 1.124489
298.15 0.1 1.004838
308.15 0.7 1.042822
278.15 2.0 1.124484
298.15 0.1 1.004840
318.15 0.7 1.038737
278.15 2.0 1.124500
308.15 0.1 1.001734
318.15 0.7 1.038756
278.15 2.0 1.124550
308.15 0.1 1.001734
318.15 0.7 1.038749
288.15 2.0 1.121296
308.15 0.1 1.001736
278.15 1.0 1.070308
288.15 2.0 1.121327
318.15 0.1 0.997879
288.15 1.0 1.067817
288.15 2.0 1.121313
318.15 0.1 0.997876
298.15 1.0 1.064722
288.15 2.0 1.121329
318.15 0.1 0.997876
308.15 1.0 1.061094
288.15 2.0 1.121325
318.15 0.1 0.997879
318.15 1.0 1.056945
288.15 2.0 1.121340
318.15 0.1 0.997876
278.15 1.0 1.070308
288.15 2.0 1.121393
318.15 0.1 0.997876
288.15 1.0 1.067773
298.15 2.0 1.117764
278.15 0.3 1.023483
298.15 1.0 1.064679
298.15 2.0 1.117797
278.15 0.3 1.023487
308.15 1.0 1.061041
298.15 2.0 1.117781
278.15 0.3 1.023502
318.15 1.0 1.056914
298.15 2.0 1.117797
288.15 0.3 1.021951
278.15 1.3 1.087948
298.15 2.0 1.117794
288.15 0.3 1.021956
278.15 1.3 1.087998
298.15 2.0 1.117809
288.15 0.3 1.021969
288.15 1.3 1.085197
298.15 2.0 1.117861
298.15 0.3 1.019477
288.15 1.3 1.085235
308.15 2.0 1.113879
298.15 0.3 1.019479
298.15 1.3 1.081916
308.15 2.0 1.113913
298.15 0.3 1.019484
298.15 1.3 1.081931
308.15 2.0 1.113898
308.15 0.3 1.016218
308.15 1.3 1.078173
308.15 2.0 1.113915
308.15 0.3 1.016221
308.15 1.3 1.078190
308.15 2.0 1.113908
308.15 0.3 1.016216
318.15 1.3 1.073995
308.15 2.0 1.113924
318.15 0.3 1.012273
318.15 1.3 1.074018
308.15 2.0 1.113977
318.15 0.3 1.012279
278.15 2.0 1.124514
318.15 2.0 1.109663
318.15 0.3 1.012284
278.15 2.0 1.124544
318.15 2.0 1.109695
318.15 0.3 1.016202
288.15 2.0 1.121318
318.15 2.0 1.109680
278.15 0.7 1.051315
288.15 2.0 1.121354
318.15 2.0 1.109697
278.15 0.7 1.051332
298.15 2.0 1.117766
318.15 2.0 1.109692
278.15 0.7 1.051366
298.15 2.0 1.117794
318.15 2.0 1.109707
288.15 0.7 1.049188
308.15 2.0 1.113880
318.15 2.0 1.109759

Appendix F: Ammonium Sulfate Densities Values
87
Continued
Alanine
T (K) m(NH4)2SO4 ρ (g·m-3
)
T (K) m(NH4)2SO4 ρ (g·m-3
)
T (K) m(NH4)2SO4 ρ (g·m-3
)
278.15 0.1 1.008197
278.15 0.7 1.051310
288.15 1.3 1.085125
278.15 0.1 1.008201
288.15 0.7 1.049152
288.15 1.3 1.085157
288.15 0.1 1.007072
288.15 0.7 1.049166
298.15 1.3 1.081847
288.15 0.1 1.007083
298.15 0.7 1.046274
298.15 1.3 1.081867
298.15 0.1 1.004861
298.15 0.7 1.046280
308.15 1.3 1.078090
298.15 0.1 1.004864
308.15 0.7 1.042775
308.15 1.3 1.078101
308.15 0.1 1.001762
308.15 0.7 1.042787
318.15 1.3 1.073930
308.15 0.1 1.001763
318.15 0.7 1.038694
318.15 1.3 1.073951
318.15 0.1 0.997900
318.15 0.7 1.038703
278.15 2.0 1.124472
318.15 0.1 0.997901
278.15 0.7 1.051320
278.15 2.0 1.124492
278.15 0.3 1.023445
288.15 0.7 1.049187
288.15 2.0 1.121241
278.15 0.3 1.023462
298.15 0.7 1.046308
288.15 2.0 1.121271
288.15 0.3 1.021926
308.15 0.7 1.042803
298.15 2.0 1.117683
288.15 0.3 1.021940
318.15 0.7 1.038725
298.15 2.0 1.117698
298.15 0.3 1.019453
278.15 1.0 1.070262
308.15 2.0 1.113803
298.15 0.3 1.019458
288.15 1.0 1.067786
308.15 2.0 1.113831
308.15 0.3 1.016194
298.15 1.0 1.064689
318.15 2.0 1.109591
308.15 0.3 1.016196
308.15 1.0 1.061051
318.15 2.0 1.109623
318.15 0.3 1.012245
318.15 1.0 1.056917
298.15 2.0 1.117774
318.15 0.3 1.012251
278.15 1.3 1.087910
298.15 2.0 1.117779
278.15 0.7 1.051291
278.15 1.3 1.087939

88
Appendix G: Example of Calculation of Adiabatic Compressibility through the
Speed of Sound
In order to calculate the partial molar adiabatic compressibilities it is necessary to
represent ⁄ in function of molality of the amino acid to obtain the
parameter , according with equation 2.6 to binary systems and 2.8 to ternary systems.
With the parameter , the speed of sound and density of the solvent, and using
equation 2.5 and 2.7 for binary and ternary systems, respectively, it is possible to
calculate the adiabatic compressibility. In the following figures and tables two examples
of this procedure is shown.
Figure G.1. Δ(ρ
2u
2)/m2 (kg
3·m
-3·s
-2·mol
-1) of glycine in water at different temperatures and molalities.
Table G.1. Values needed for the calculation of adiabatic compressibility of glycine in water. T (K) (kg·m
-3) (m·s
-1) (kg
3·m
-4·s
-2·mol
-1)
(cm3·mol
-1·GPa
-1)
278.15 999.967 1426.17 0.3121 -38.5
288.15 999.103 1465.93 0.3054 -31.4
298.15 997.048 1496.70 0.3001 -26.8
308.15 994.033 1519.85 0.2948 -23.7
318.15 990.213 1536.45 0.2901 -21.7
∆[(𝜌𝑢)2 ]/𝑚2 = -0.007𝑚2 + 0.3121
R² = 0.9414
∆[(𝜌𝑢)2 ]/𝑚2 = -0.0055𝑚2 + 0.3054
R² = 0.8519
∆[(𝜌𝑢)2 ]/𝑚2 = -0.0064𝑚2 + 0.3001
R² = 0.9753
∆[(𝜌𝑢)2 ]/𝑚2 = -0.0067𝑚2 + 0.2948
R² = 0.9305
∆[(𝜌𝑢)2 ]/𝑚2 = -0.0074𝑚2 + 0.2901
R² = 0.874
0.2800
0.2850
0.2900
0.2950
0.3000
0.3050
0.3100
0.3150
0.0 0.1 0.2 0.3 0.4 0.5 0.6
Δ(ρ
2u
2)/
m2
m2
T = 278.15 K T = 288.15 K T = 298.15 K T = 308.15 K T = 318.15 K

Appendix G: Example of Calculation of Adiabatic Compressibility through the
Speed of Sound
89
Figure G.2. Δ(ρ
2u
2)/m2 (kg
3·m
-3·s
-2·mol
-1) of alanine in 2.0 ammonium sulfate at different temperatures
and molalities.
Table G.2. Values needed for the calculation of adiabatic compressibility of alanine in 2.0 ammonium
sulfate. T (K) (kg·m
-3) (m·s
-1) (kg
3·m
-4·s
-2·mol
-1)
(cm3·mol
-1·GPa
-1)
278.15 1124.482 1653.510 0.1884 10.0
288.15 1121.256 1678.170 0.1895 10.0
298.15 1117.691 1697.150 0.1850 10.5
308.15 1113.817 1711.325 0.1791 11.0
318.15 1109.607 1721.240 0.1749 11.3
As can be seen from the examples presented in the case of glycine in water the obtained
values can be considered as acceptable. However, in the case of alanine in 2.0
ammonium sulfate a valid relation of ⁄ as a function of the molality of the
amino acid was not found. Then, the adiabatic compressibility values calculated are not
reliable. The same happened to all other solutions with sulfate concentrations between
0.1 and 2.0, and for both amino acids.
∆[(𝜌𝑢)2 ]/𝑚2 = 0.0092m2 + 0.1884
R² = 0.2256
∆[(𝜌𝑢)2 ]/𝑚2 = -0.0024xm2+ 0.1895
R² = 0.1108
∆[(𝜌𝑢)2 ]/𝑚2 = -0.0031m2 + 0.185
R² = 0.2122
∆[(𝜌𝑢)2 ]/𝑚2 = 7E-05m2+ 0.1791
R² = 4E-05
∆[(𝜌𝑢)2 ]/𝑚2 = -0.0056m2+ 0.1769
R² = 0.2996
0.1700
0.1750
0.1800
0.1850
0.1900
0.1950
0.0 0.1 0.2 0.3 0.4 0.5 0.6
Δ(ρ
2u
2)/
m2
m2
T = 278.15 K T = 288.15 K T = 298.15 K T = 308.15 K T = 318.15 K