Sulfate Removal from Water
14
Water Qual. Res. J. Canada, 2003 Volume 38, No. 1, 169–182 Copyright © 2003, CAWQ * Corresponding author; [email protected] Sulfate Removal from Water ASHREF DARBI, 1 THIRUVENKATACHARI VIRARAGHAVAN, 1 * YEE-CHUNG JIN, 1 LARRY BRAUL 2 AND DARRELL CORKAL 3 1 Faculty of Engineering, University of Regina, Regina, Saskatchewan S4S 0A2 2 Agriculture and Agri-Food Canada, Regina, Saskatchewan 3 Agriculture and Agri-Food Canada, Saskatoon, Saskatchewan Sulfate occurs naturally in groundwater. Concerns regarding the health effects from sulfate in drinking water have been raised because of reports that diarrhea may be associated with water that contains high levels of sulfate. In the live- stock production industry, there is a concern that high levels of sulfate in water can adversely affect productivity. Different methods can be used to remove sul- fate from water. Proven technologies are ion-exchange, nanofiltration, reverse osmosis, and electrodialysis. A few earlier studies have shown that the use of bentonite/kaolinite for sulfate removal has produced encouraging results. Experimental work was undertaken to examine in detail the feasibility of such processes. Laboratory studies using bentonite showed poor or no removal in the case of high sulfate water. Ion exchange and nanofiltration were found to be very effective in removing sulfate. Ion exchange is likely to be more reliable than nanofiltration because of the sensitivity of the nanofiltration process to total dissolved solids and biofouling. Key words: sulfate removal, drinking water, bentonite, ion exchange, nanofil- tration Introduction Sulfate occurs naturally in groundwater. Sulfate ions present in water in high concentrations may cause temporary and acute effects on humans and animals, including diarrhea. The United States Environmental Protection Agency (U.S. EPA) has proposed a maximum allowable con- centration of 500 mg/L for sulfate in drinking water in order to avoid any health concern regarding human consumption. A secondary maxi- mum allowable concentration for sulfate has been set at 250 mg/L (U.S. EPA 1994). It is understood that approximately 30% of groundwater in Saskatchewan exceeds a sulfate concentration of 1000 mg/L (Shaheen and Sketchell 1998), the maximum objective level for livestock watering set by the Saskatchewan Environment and Resource Management. In some cases, sulfate concentrations are reported to be as high as 3000 mg/L. It is believed that the removal of sulfates from drinking water will lead to a healthier livestock and a more productive herd. On the other hand, sulfate
-
Upload
independent -
Category
Documents
-
view
3 -
download
0
Transcript of Sulfate Removal from Water
Water Qual. Res. J. Canada, 2003Volume 38, No. 1, 169–182Copyright © 2003, CAWQ
* Corresponding author; [email protected]
Sulfate Removal from Water
ASHREF DARBI,1 THIRUVENKATACHARI VIRARAGHAVAN,1* YEE-CHUNG JIN,1 LARRY BRAUL2 AND DARRELL CORKAL3
1Faculty of Engineering, University of Regina, Regina, Saskatchewan S4S 0A22Agriculture and Agri-Food Canada, Regina, Saskatchewan3Agriculture and Agri-Food Canada, Saskatoon, Saskatchewan
Sulfate occurs naturally in groundwater. Concerns regarding the health effectsfrom sulfate in drinking water have been raised because of reports that diarrheamay be associated with water that contains high levels of sulfate. In the live-stock production industry, there is a concern that high levels of sulfate in watercan adversely affect productivity. Different methods can be used to remove sul-fate from water. Proven technologies are ion-exchange, nanofiltration, reverseosmosis, and electrodialysis. A few earlier studies have shown that the use ofbentonite/kaolinite for sulfate removal has produced encouraging results.Experimental work was undertaken to examine in detail the feasibility of suchprocesses. Laboratory studies using bentonite showed poor or no removal inthe case of high sulfate water. Ion exchange and nanofiltration were found to bevery effective in removing sulfate. Ion exchange is likely to be more reliablethan nanofiltration because of the sensitivity of the nanofiltration process tototal dissolved solids and biofouling.
Key words: sulfate removal, drinking water, bentonite, ion exchange, nanofil-tration
Introduction
Sulfate occurs naturally in groundwater. Sulfate ions present in waterin high concentrations may cause temporary and acute effects on humansand animals, including diarrhea. The United States EnvironmentalProtection Agency (U.S. EPA) has proposed a maximum allowable con-centration of 500 mg/L for sulfate in drinking water in order to avoidany health concern regarding human consumption. A secondary maxi-mum allowable concentration for sulfate has been set at 250 mg/L (U.S.EPA 1994).
It is understood that approximately 30% of groundwater inSaskatchewan exceeds a sulfate concentration of 1000 mg/L (Shaheen andSketchell 1998), the maximum objective level for livestock watering set bythe Saskatchewan Environment and Resource Management. In somecases, sulfate concentrations are reported to be as high as 3000 mg/L. It isbelieved that the removal of sulfates from drinking water will lead to ahealthier livestock and a more productive herd. On the other hand, sulfate
170 DARBI ET AL.
is a necessary constituent in the bodies of humans and other animals. Inhumans, serum sulfate levels range from 24 to 36.5 mg/L. Sulfate isinvolved in many biochemical activities including the production of chon-droitin sulfate and sulfation of exogenous chemicals.
Three cases from Saskatchewan were reported with infants experi-encing gastroenteritis with diarrhea and dehydration upon ingestingwater that had high levels of sulfate (650–1150 mg/L) (Chien et al. 1968).Diarrhea subsided in all infants when different water sources with lowersulfate concentrations were used (Backer 2000). Members of an expertworkshop on sulfate concluded that there was not enough scientific evi-dence to support a regulation creating a Maximum Contaminant Level(MCL) for sulfate in drinking water (Backer et al. 2001).
In the livestock production industry, there is a concern that high levelsof sulfate in drinking water can adversely affect productivity. A study con-ducted by Veenhuizen et al. (1992) on nursery pigs given drinking watercontaining sodium or magnesium sulfate at 600, 1200, and 1800 mg/L ofsulfate for 28 days, showed that pigs drinking high sulfate water had ahigher frequency of non-pathogenic diarrhea than the controls (i.e., pigsdrinking water with 54 mg/L naturally occurring sulfate) (Backer 2000). Italso showed that sulfate levels in excess of 500 mg/L can cause laxativeeffects on young animals, with cattle becoming more resistant within sev-eral weeks (J. Cory, Prairie Farm Rehabilitation Administration, Regina,Sask., pers. comm.). Levels of sulfate greater than 300 to 600 mg/L cancause chronic diarrhea, electrolyte imbalance, and possible death.
Different treatment technologies have been investigated for sulfateremoval. Proven technologies for the removal of sulfate from drinkingwater include ion exchange, nanofiltration, reverse osmosis and electro-dialysis (Table 1). In addition, several studies have been reported on theuse of bentonite/kaolinite adsorption for sulfate removal. While such
Table 1. Different sulfate removal technologies (Marhaba and Washington 1997)
Treatment technology Description
Reverse osmosis/nanofiltration Water is forced under pressure through a porous membrane designed to remove ions from the water
Ion exchange Inorganics are removed by passing water over cation and anion exchangers, replacing cations and anions with H+ or Cl- or OH-
Electrodialysis Direct current is applied across a body of water separated into vertical layers alterna-tively permeable to cations and anions
SULFATE REMOVAL FROM WATER 171
studies have reported mixed results, an optimized system based on ben-tonite adsorption would have a significant economic advantage over theother technologies.
A study conducted by Rao and Sridharan (1984) on the adsorption ofsulfate by kaolinite found that sulfate was adsorbed at positive and neu-tral sites with the displacement of OH2 and OH- groups. Adsorption ofsulfate occurred significantly at positive sites at low concentrationswhereas on increasing the solution concentration, the proportion of sul-fate adsorption at the neutral site increased. The level of positive chargeon the clay surface apparently governs the form of surface bonding. Atlow anion saturation, sulfate was adsorbed on kaolinite as a divalent ion.At a higher solution concentration, the surface favours the adsorption ofthe monovalent ions and thus sulfates formed are in both monodentateand bidentate complexes.
The objectives of this study were to examine in detail the feasibili-ty of using bentonite to remove sulfate from groundwater; and to com-pare sulfate removal using bentonite with ion exchange and nanofiltra-tion processes.
Materials and Methods
The removal of sulfate from water was investigated using varioustreatment methods. Removal of sulfate through adsorption was examinedusing different concentrations of bentonite. Three types of test water (tapwater spiked with sulfate, and groundwater from Leroy and SwiftCurrent in Saskatchewan) were used in the experiments. Sulfate-spikedtap water was prepared by weighing a known amount of calcium sulfateor magnesium sulfate and adding this amount to the tap water to obtainthe desired sulfate concentration. Final sulfate concentrations were mea-sured by Dionex before starting the experiments. Groundwater samplesfrom Leroy and Swift Current were collected by the Prairie FarmRehabilitation Administration (PFRA) in February 2001, transported tothe University of Regina in an open van and stored in a refrigerator at 4°C.All adsorption experiments with bentonite were repeated three timesusing tap water spiked with sulfate. In addition, ion exchange andnanofiltration techniques were investigated to examine the removal capa-bilities through these systems. Ion exchange and nanofiltration experi-ments were repeated three times for each water type used. Duplicate sam-ples were collected for each analysis. Average values were used in dataanalysis. The characteristics of groundwater samples from Leroy andSwift Current provided by PFRA are shown in Table 2.
Adsorption of Sulfate to Bentonite
Sulfate adsorption studies were conducted under different ben-tonite concentrations. Bentonite was obtained from Canadian ClayProducts, Wilcox, Saskatchewan. Different concentrations of sulfate

172 DARBI ET AL.
were used in the study. Calcium sulfate was dissolved using tap water.Batch isotherm studies with bentonite concentrations of 400, 500, 600,700, 800, 900, and 1000 mg/L were performed at 23 ± 1°C. Bentonite wasweighed and placed in 250-mL Erlenmeyer flasks. The flasks were thenfilled to 100 mL with calcium sulfate solution and covered with parafilmwax. The mixtures were placed in a gyratory shaker, at 200 rpm, for 15,30, 45, 60, 75, 90, 115, 120, 180, and 240 minutes. pH values were mea-sured prior to, and at the end of the contact period, using a Hannamodel 1024 pH meter. At the end of each contact time, the bottle reactorwas removed and 40 mL of the mixture was decanted into a centrifugetube for analysis. The mixture was centrifuged for 15 minutes at 6000rpm to separate the bentonite from the solution. The supernatant wasdiluted 1:10 with distilled water and analyzed for sulfate using a DionexIon Chromatograph.
Sulfate Removal by Ion Exchange
Column experiments were conducted to examine sulfate removal byan anion exchange resin. A high capacity, type 2 ionic resin (ASB 2) wasused for all column experiments (Sybron Chemicals Inc., Birmingham,New Jersey). Bead size distribution of the ionic resin ranged between 0.3to 1.2 mm with a particle density of approximately 1.11 g/mL. Totalexchange capacity, as CaCO3, was 1.4 eq/L or 30.6 kg/ft3. Water contentof the ASB 2 resin was between 38 and 45%.
The column apparatus consisted of an acrylic column, 90 cm longand 1 cm internal diameter (ID) with two butyl rubber stoppers used asend caps. The resin was packed to a height of 80 cm. The end caps weremachined with a small hole, 0.64 cm in diameter, to allow for influent andeffluent discharge. A glass filter was placed above the bottom end cap toprevent resins from leaving the column. Silicon tubing (Nalgene) wasused to connect the input reservoir to the column. The effective volumepacking was measured gravimetrically for each individual packing. Tap
Table 2. Characteristics of water samples
HardnessCl- NO3
--N SO4-- (mg/L Conductivity TDS
Sample pH (mg/L) (mg/L) (mg/L) as CaCO3) µS/cm (mg/L)
Tap water 7.5 18 0 185–200 232 534 230
Leroy 7.2 295 15 2280 2735 — 3750(groundwater)
Swift Current 7.7 112 18 3665 3700 6200 —(groundwater)
SULFATE REMOVAL FROM WATER 173
water spiked with sulfate and Leroy and Swift Current groundwater wereused in ion exchange column experiments.
The column was flooded with 20 L of tap water containing1000 mg/L of sulfate, using a peristaltic pump (Cole Parmer). Magnesiumsulfate was used instead of calcium sulfate because a high concentrationof calcium sulfate will cause a high-turbidity solution. High-turbiditywater will form scale on the membrane and affect the capacity of the resin.Saturation of the column was achieved by a down-flow gradient of75 mL/min, which maintained a constant head of 1 cm above the anionresin. The effluent was collected in scintillation vials after the first 60 minand every 30 min thereafter for 4 h, when breakthrough was observed.
Nanofiltration
Nanofiltration is a pressure-driven membrane process with perfor-mance characteristics between reverse osmosis and ultrafiltration. Thetheoretical pore size of the membrane is 1 nm. A nanofiltration unit wasobtained from Water Group with Filmtec 2.5” nanofiltration elements,model NF 90-1812-HF. The unit was designed for home use and smallproduction.
Spiked tap water using magnesium sulfate with different initial con-centrations was used at two different pressures of 40 and 80 psi. Initialconcentrations varying from 916 to 5363 mg/L were used in the runs.Sampling was conducted during the initial, intermediate, and final stagesof the experimental procedure. Groundwater samples from Leroy andSwift Current were also examined using nanofiltration.
Results and Discussion
Sulfate Adsorption to Bentonite
Figure 1 illustrates the concentration of sulfate using different ben-tonite concentrations of 400, 500, 600, 700, 800, and 900 mg/L. There wasno significant reduction in sulfate concentration at these bentonite con-centrations. Bentonite did not appear to possess any adsorption capacityfor sulfate. The results showed that the change in sulfate concentrationwas marginal during the four-hour study period. Table 3 also shows thatduring a two-hour study, bentonite leached sulfate into water.Commercial-and laboratory-grade bentonites were used in these experi-ments. The commercial-grade bentonite leached more sulfate than the lab-oratory-grade bentonite. Since the commercial-grade bentonite used inthe studies would have leached some sulfate into the water, it is likely thatany marginal adsorption by bentonite may be offset by this leaching.
Ion Exchange
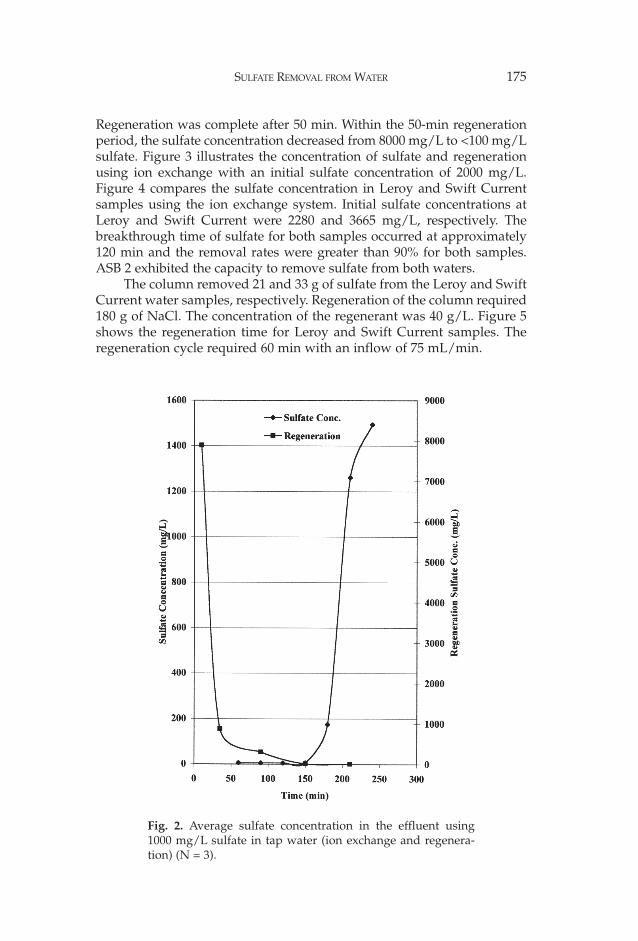
Figure 2 illustrates the concentration of sulfate and regeneration byion exchange using spiked tap water with sulfate concentration of

Table 3. Sulfate leaching from lab and commercial bentonite
Initial sulfate, Commercial bentonite Laboratory-grade mg/L sulfate, mg/L bentonite sulfate, mg/L
25 166 12225 139 121
174 DARBI ET AL.
1000 mg/L. Effluent samples were taken every 30 min until breakthroughoccurred. Breakthrough is defined as the concentration of sulfate passingthrough the column when the absorbent has been saturated with time. Thebreakthrough of sulfate occurred after 150 min. Sodium chloride at a con-centration of 5% was used with tap water to regenerate the column.
Fig. 1. Average sulfate concentrations in the effluent usingdifferent concentrations of bentonite (400, 500, 600, 700, 800,and 900 mg/L) (N = 3).
SULFATE REMOVAL FROM WATER 175
Regeneration was complete after 50 min. Within the 50-min regenerationperiod, the sulfate concentration decreased from 8000 mg/L to <100 mg/Lsulfate. Figure 3 illustrates the concentration of sulfate and regenerationusing ion exchange with an initial sulfate concentration of 2000 mg/L.Figure 4 compares the sulfate concentration in Leroy and Swift Currentsamples using the ion exchange system. Initial sulfate concentrations atLeroy and Swift Current were 2280 and 3665 mg/L, respectively. Thebreakthrough time of sulfate for both samples occurred at approximately120 min and the removal rates were greater than 90% for both samples.ASB 2 exhibited the capacity to remove sulfate from both waters.
The column removed 21 and 33 g of sulfate from the Leroy and SwiftCurrent water samples, respectively. Regeneration of the column required180 g of NaCl. The concentration of the regenerant was 40 g/L. Figure 5shows the regeneration time for Leroy and Swift Current samples. Theregeneration cycle required 60 min with an inflow of 75 mL/min.
Fig. 2. Average sulfate concentration in the effluent using1000 mg/L sulfate in tap water (ion exchange and regenera-tion) (N = 3).

176 DARBI ET AL.
Nanofiltration
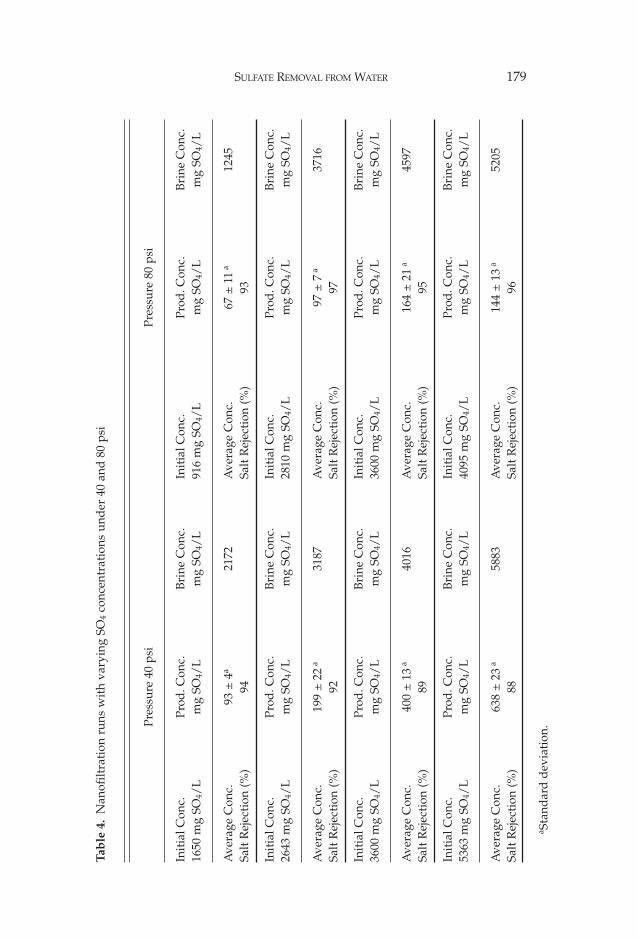
Two different pressures of 40 and 80 psi were applied. Low, mediumand high sulfate concentrations were used in the runs (see Table 4). It canbe seen from the table that the sulfate removal efficiency increased withan increase in applied pressure.
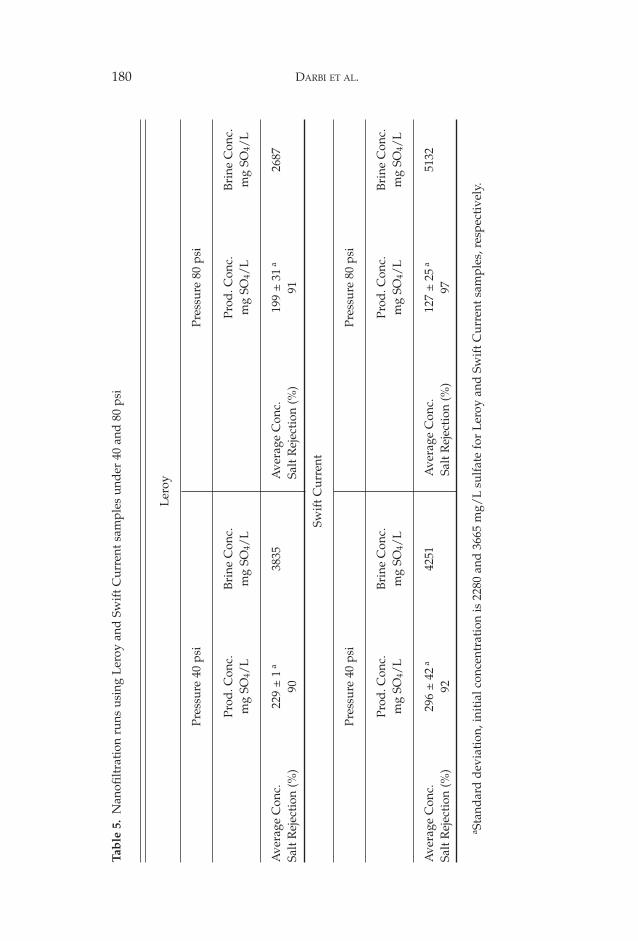
Salt rejection also increased with applied pressure. In both situations,the reduction of sulfate was effective using the nanofiltration system.Under high applied pressure of 80 psi, the removal efficiency was greaterwhen compared to 40 psi. Table 5 shows high sulfate removal for bothLeroy and Swift Current samples. It was found that the amount of saltrejection was higher at 80 psi than at 40 psi. The results shown in Table 5confirm the excellent rejection of sulfate with an average rejection of 93%.Table 6 compares the percentage removal of sulfate by the three technolo-gies. Nanofiltration, while exhibiting slightly higher removal efficiencies,possesses several disadvantages, including lowered removal of sulfatesunder high TDS in water and membrane fouling from heavy metals such
Fig. 3. Average sulfate concentration in the effluent using2000 mg/L sulfate in tap water (ion exchange and regenera-tion) (N = 3).

SULFATE REMOVAL FROM WATER 177
as iron, and bacteria (American Water Works Association 1990). The mostrestrictive factor in nanofiltration is scaling by CaSO4. Acidification isrequired to overcome mineral scaling on membranes (American WaterWorks Association 1990). Further studies are required to examine theeffect of raw water quality parameters on sulfate removal in the context ofwater supplies studied.
Conclusions and Recommendations
Ion exchange and nanofiltration are the two best available technolo-gies for sulfate removal, and are also proven technologies used for desali-nation of seawater and brackish water (American Water WorksAssociation 1990). This study showed that ion exchange is the recom-mended option in removing sulfate from water. Although high amountsof salt are required to regenerate the column, ion exchange appears to bethe most beneficial compared to nanofiltration. More detailed studies are
Fig. 4. Average sulfate concentration in the effluent usingLeroy and Swift Current samples (ion exchange) (N = 3).

178 DARBI ET AL.
needed to examine sulfate adsorption by bentonite or kaolinite. In thisstudy sulfate concentration appeared to increase in all the experiments.These results are in contrast to studies by other investigators, whoclaimed success with bentonite especially when sulfate concentrationswere low (less than 50 mg/L).
Fig. 5. Regeneration of high capacity, type 2 ionic resin(ASB 2) using sodium chloride.
SULFATE REMOVAL FROM WATER 179
Tab
le 4
.N
anof
iltra
tion
run
s w
ith
vary
ing
SO4
conc
entr
atio
ns u
nder
40
and
80
psi
Pres
sure
40
psi
Pres
sure
80
psi
Init
ial C
onc.
Prod
. Con
c.
Bri
ne C
onc.
In
itia
l Con
c.Pr
od. C
onc.
B
rine
Con
c.
1650
mg
SO4/
Lm
g SO
4/L
mg
SO4/
L91
6 m
g SO
4/L
mg
SO4/
Lm
g SO
4/L
Ave
rage
Con
c.93
±4a
2172
Ave
rage
Con
c.67
±11
a12
45Sa
lt R
ejec
tion
(%
)94
Salt
Rej
ecti
on (
%)
93
Init
ial C
onc.
Prod
. Con
c.
Bri
ne C
onc.
In
itia
l Con
c.Pr
od. C
onc.
B
rine
Con
c.
2643
mg
SO4/
Lm
g SO
4/L
mg
SO4/
L28
10 m
g SO
4/L
mg
SO4/
Lm
g SO
4/L
Ave
rage
Con
c.19
9 ±
22a
3187
Ave
rage
Con
c.97
±7
a37
16Sa
lt R
ejec
tion
(%
)92
Salt
Rej
ecti
on (
%)
97
Init
ial C
onc.
Prod
. Con
c.
Bri
ne C
onc.
In
itia
l Con
c.Pr
od. C
onc.
B
rine
Con
c.
3600
mg
SO4/
Lm
g SO
4/L
mg
SO4/
L36
00m
g SO
4/L
mg
SO4/
Lm
g SO
4/L
Ave
rage
Con
c.40
0 ±
13a
4016
Ave
rage
Con
c.16
4 ±
21a
4597
Salt
Rej
ecti
on (
%)
89Sa
lt R
ejec
tion
(%
)95
Init
ial C
onc.
Prod
. Con
c.
Bri
ne C
onc.
In
itia
l Con
c.Pr
od. C
onc.
B
rine
Con
c.
5363
mg
SO4/
Lm
g SO
4/L
mg
SO4/
L40
95m
g SO
4/L
mg
SO4/
Lm
g SO
4/L
Ave
rage
Con
c.63
8 ±
23a
5883
Ave
rage
Con
c.14
4 ±
13a
5205
Salt
Rej
ecti
on (
%)
88Sa
lt R
ejec
tion
(%
)96
a Sta
ndar
d d
evia
tion
.
180 DARBI ET AL.
Tab
le 5
.N
anof
iltra
tion
run
s us
ing
Ler
oy a
nd S
wif
t Cur
rent
sam
ples
und
er 4
0 an
d 8
0 ps
i
Ler
oy
Pres
sure
40
psi
Pres
sure
80
psi
Prod
. Con
c.
Bri
ne C
onc.
Pr
od. C
onc.
B
rine
Con
c.
mg
SO4/
Lm
g SO
4/L
mg
SO4/
Lm
g SO
4/L
Ave
rage
Con
c.22
9 ±
1a
3835
Ave
rage
Con
c.19
9 ±
31a
2687
Salt
Rej
ecti
on (
%)
90Sa
lt R
ejec
tion
(%
)91
Swif
t Cur
rent
Pres
sure
40
psi
Pres
sure
80
psi
Prod
. Con
c.
Bri
ne C
onc.
Pr
od. C
onc.
B
rine
Con
c.
mg
SO4/
Lm
g SO
4/L
mg
SO4/
Lm
g SO
4/L
Ave
rage
Con
c.29
6 ±
42a
4251
Ave
rage
Con
c.12
7 ±
25a
5132
Salt
Rej
ecti
on (
%)
92Sa
lt R
ejec
tion
(%
)97
a Sta
ndar
d d
evia
tion
, ini
tial
con
cent
rati
on is
228
0 an
d 3
665
mg/
Lsu
lfat
e fo
r L
eroy
and
Sw
ift C
urre
nt s
ampl
es, r
espe
ctiv
ely.

SULFATE REMOVAL FROM WATER 181
Tab
le 6
.Pe
rcen
tage
rem
oval
com
pari
son
of th
e th
ree
tech
nolo
gies
Ion-
exch
ange
Nan
ofilt
rati
on a
t 80
psi
Ben
toni
te a
dso
rpti
on
Wat
erSp
iked
tap
Swif
t Sp
iked
tap
Swif
t Sp
iked
tap
used
wat
er
Ler
oyC
urre
ntw
ater
Ler
oyC
urre
ntw
ater
Sulf
ate
tem
oval
≅90%
≅90%
≅94%
97%
a91
%97
%N
il95
%b
a At c
once
ntra
tion
of
2810
mg
SO4–
– .b A
t con
cent
rati
on o
f 36
00 m
g SO
4–– .

182 DARBI ET AL.
References
American Water Works Association. 1990. Water quality and treatment: a hand-book of community water supply. 4th Edition.
Backer LC. 2000. Assessing the acute gastrointestinal effects of ingesting natural-ly occurring high levels of sulfate in drinking water. Crit. Rev. Clinic. Lab.Sci. 37:389–400.
Backer LC, Esteban E, Rubin CH, Kieszak S, Mcgeehin MA. 2001. Assessingacute diarrhea from sulphate in drinking water. J. Am. Water Works Assoc.93:76–84.
Chien L, Robertson H, Gerrard JW. 1968. Infantile gastroenteritis due to waterwith high sulphate content. Can. Med. Assoc. J. 99:102–104.
Cory J. Water quality and cattle performance. Range Management Division, PrairieFarm Rehabilitation Administration, Regina, Saskatchewan. Pers. comm.
Marhaba TF, Washington MB. 1997. Sulfate removal from drinking water. InProceedings CSCE/ASCE Environmental Engineering conference.Edmonton, Alberta, Canada.
Rao SM, Sridharan A. 1984. Mechanism of sulfate adsorption by kaolinite. ClaysClay Miner. 32:414–418.
Shaheen N, Sketchell J. 1998. Groundwater chemistry program pilot project. SaskWater, Moose Jaw, Saskatchewan.
U.S. EPA. 1994. Sulfate. Proposed Rule, Federal Register, 59:243:65578 (Dec. 20, 1994).Veenhuizen MF, Shurson GC, Kohler EM. 1992. Effect of concentration and source
on nursery pig performance and health. J. Am. Vet. Med. Ass. 201:1203–1208.