Ammonia removal from water using microporous hollow fibers
14
Journal of Membrane Science, 51 (1990) 127-140 Elsevier Science Publishers B.V., Amsterdam 127 AMMONIA REMOVAL FROM WATER USING MICROPOROUS HOLLOW FIBERS MICHAEL J. SEMMENS Department of Civil and Mineral Engineering, University of Minnesota, Mineapolis, MN 55455 (U.S.A.) D.M. FOSTER and E.L. CUSSLER Department of Chemical Engineering and Materials Science, University of Minnesota, Minneapolis, MN 55455 (U.S.A.) (Received August 14,1989; accepted in revised form January 23,199O) Summary Ammonia can be rapidly removed using microporous, hydrophobic hollow fibers. The removal can be influenced by resistances in the feed solution and across the hollow fiber membrane. This removal, related to a non-linear combination of these resistances, is consistent with a theory developed in the paper. Introduction Hollow fibers can be used to rapidly remove volatile contaminants from water [l-4]. The hollow fibers used are commonly microporous and hydrophobic. When the impure water is pumped through the fibers’ lumen, the volatile com- ponents evaporate and diffuse through the gas-filled pores. The volatile com- ponents are then swept away by a sweep gas, sucked away by a vacuum, or reacted with a second aqueous solution. The hollow fibers provide fast contam- inant removal because they have a large surface area per volume. This large area is often the key to any fast separation. In addition, because diffusion through the gas-filled pores is quick, the hollow fibers rarely dramatically impede the transport, For example, earlier studies by Semmens et al. [5] on volatile organic carbon removal indicate that the overall transfer coefficients for membrane stripping are dramatically higher than those associated with conventional air stripping. This paper investigates the use of hollow fibers for removing ammonia from water. Ammonia is a frequent contaminant in both municipal and industrial wastes. Concentrations may be as high as 40 mg/l in municipal wastes and in excess of 500 mg/l in wastes from industries such as coking, ferro-alloy pro- duction, coal gasification, and petroleum refining. 0376-7388/90/$03.50 0 1990 Elsevier Science Publishers B.V.
Transcript of Ammonia removal from water using microporous hollow fibers
Journal of Membrane Science, 51 (1990) 127-140 Elsevier Science Publishers B.V., Amsterdam
127
AMMONIA REMOVAL FROM WATER USING MICROPOROUS HOLLOW FIBERS
MICHAEL J. SEMMENS
Department of Civil and Mineral Engineering, University of Minnesota, Mineapolis, MN 55455 (U.S.A.)
D.M. FOSTER and E.L. CUSSLER
Department of Chemical Engineering and Materials Science, University of Minnesota, Minneapolis, MN 55455 (U.S.A.)
(Received August 14,1989; accepted in revised form January 23,199O)
Summary
Ammonia can be rapidly removed using microporous, hydrophobic hollow fibers. The removal can be influenced by resistances in the feed solution and across the hollow fiber membrane. This removal, related to a non-linear combination of these resistances, is consistent with a theory developed in the paper.
Introduction
Hollow fibers can be used to rapidly remove volatile contaminants from water [l-4]. The hollow fibers used are commonly microporous and hydrophobic. When the impure water is pumped through the fibers’ lumen, the volatile com- ponents evaporate and diffuse through the gas-filled pores. The volatile com- ponents are then swept away by a sweep gas, sucked away by a vacuum, or reacted with a second aqueous solution. The hollow fibers provide fast contam- inant removal because they have a large surface area per volume. This large area is often the key to any fast separation. In addition, because diffusion through the gas-filled pores is quick, the hollow fibers rarely dramatically impede the transport, For example, earlier studies by Semmens et al. [5] on volatile organic carbon removal indicate that the overall transfer coefficients for membrane stripping are dramatically higher than those associated with conventional air stripping.
This paper investigates the use of hollow fibers for removing ammonia from water. Ammonia is a frequent contaminant in both municipal and industrial wastes. Concentrations may be as high as 40 mg/l in municipal wastes and in excess of 500 mg/l in wastes from industries such as coking, ferro-alloy pro- duction, coal gasification, and petroleum refining.
0376-7388/90/$03.50 0 1990 Elsevier Science Publishers B.V.

128
Conventional air stripping for ammonium removal exploits the volatility of free ammonia. Typically the pH of the waste stream is adjusted to approxi- mately 11 in order to convert the majority of NH,+ to dissolved NH3 which is then readily stripped in a conventional packed tower. Simple stripping has been criticized for releasing the ammonia to the atmosphere, and has been plagued by calcium carbonate precipitation and the resulting fouling of the packing materials [ 61. One possible modification of the stripping process in- volves a closed loop with air recycled between the air stripper and an acid scrubbing tower. In this system, ammonia is not vented to the atmosphere but is absorbed and neutralized by the sulfuric acid to make (NH,),SO,. Even in this closed loop process, the use of high pH still leads to CaCO, precipitation, fouling, and sludge disposal problems.
The use of hollow fibers with an acid stripping solution imitates the closed loop air stripping system with a single fiber contactor replacing two stripping towers and the air blowing equipment. The hollow fiber contactors will be just as susceptible to CaCO, precipitation if they are operated at pH 11. We hope the greater speed of the fiber process will make ammonia removal possible at lower pH, and hence avoid these problems.
We begin our investigation by deriving a general theory for stripping ioniz- able volatile contaminants from buffered solutions contained within hollow fibers. After describing our experiments with these fibers, we compare our ex- perimental results for ammonia with the theory. Finally, we discuss the impli- cations of the results.
Theory
The mass transfer of ammonia both in hollow fibers and in conventional mass transfer equipment is complicated by ionization [ 71. Ammonia in aqueous solution obviously exists both as dissolved molecules of NH, and as ions of NH,+. Molecules of NH3 can be directly removed at the membrane interface; but ions of NH,+ must first react with hydroxide before they can be removed. The reaction with hydroxide is a fast chemical step whose kinetics rarely affect the rates of ammonia removal. However, the diffusion of hydroxide near the membrane surface isn’t always fast, so the local absence of hydroxide may sometimes inhibit ammonia removal. While this retarded ammonia removal is described in terms of an unbuffered solution, a similar retardation is possible in a buffered solution. For example, for a phosphate buffer, the ammonium ion may react with HPOi- near the membrane surface to produce free ammonia and H,PO; . The ammonia can be removed, the HPOi- may be locally de- pleted, inhibiting the release of more ammonia. Again, the mass transfer of the ammonia is complicated by ionization.
We want to estimate the effects of these ionizations. To do so, we begin by

129
assuming that the various species present are in equilibria. For the cases above, this implies the equilibria:
NH,+H,O=NH,+ +OH- (11
or:
NH, +H2PO~ =NH,+ +HPO;-
In either case, these equations imply the relation:
(2)
~2~3 =K~cI (3)
where cl, c2, and c3 are respectively the concentrations of ammonia, ammo- nium, and either hydroxide or HPO;- . Note we are implying that water or H2P04 is present in excess. Note also that Kb may not be simply the Kb of ammonia, but may include the effects of buffer.
We can describe the total mass transfer of ammonia in these solutions using a film theory modified by non-linear chemical reaction [ES]. In such a theory, each solute concentration can be described by a mass balance near the mem- brane surface:
2
O=D; ++r
2
CkDz 2
--r 2
2
O=DQ 3
--r 2
(41
in which D is the diffusion coefficient and r is the rate of formation of free ammonia. We have assumed that all species have the same diffusion coefficient to avoid electrostatic coupling between ions and multicomponent diffusion ef- fects; we will return to this point later in this paper. In addition, we should stress that the reaction rate r is usually non-zero even though the reaction is very fast. It is non-zero because diffusion continually supplies new reagents
[f31- These mass balances are subject to the boundary conditions that:
z=o Cl +c2 =c
c3 =c30
(7)
(8)
z=l cl=cl~
dc2 dc3 o -_=-=
dzdz
(9)
(10)

130
in which c is the total concentration of ammonia and ammonium, c30 is the bulk concentration of hydroxide or HPOZ- and cil is the free ammonia concen- tration at the membrane interface. Note that eqn. (10) states that ions can’t leave the liquid without first reacting.
We want to find the flux of ammonia out of the solution. We begin to find this flux by subtracting eqn. (5 ) from eqn. (6)) integrating, using eqn. ( 10) to show that the integration constant is zero, integrating again, and combining again with eqns. (3) and (7) to find:
c, -c2 =c30 -c20
KbC =c30 -
& + C30
(11)
We now use this result and eqn. (3) to find c2 as a function of c1 anywhere within the system:
(12)
Two limits of this result are reassuring. First, when the system is unbuffered, cs equals c2, c is zero, and eqn. (12) becomes:
c,=$G (13)
consistent with eqn. (3 ) . Second when the system is highly buffered, c30 >> czo, cequals cZo, and eqn. (12) reduces to:
&Cl -~ c2 -
c30
again consistent with our expectations. We next add eqns. (4) and (5) and integrate twice to find:
J=yho +c,o -c11--c21)
(14)
(15)
where the integration constant J represents the total flux of ammonia and ammonium. Combination with eqns. (7) and ( 12) gives:
J=k,(,,,,-;[ ,/?$&l]) (16)
in which kF ( = D/Z) is the mass transfer coefficient in the feed solution. We can not use eqn. (15) to analyze our experiments because the interfacial

131
concentration cl1 is not known. However, we do know that when the ammonia concentration in the sweep solution is near zero:
J=kMCIl (17)
We can thus combine eqns. (16) and (17) to find cn, and insert the results into eqn. (17) to find, after some algebra:
J=kc (18)
where the overall mass transfer coefficient k is given by:
in which:
(19)
(20)
(21)
Equation (19) is the desired result, giving the overall coefficient k as a function of other experimentally accessible parameters in the process. To clarify the physical significance of eqn. (19)) we consider two limits in more detail. The first limit is that of an unbuffered solution; not surprisingly, the second limit can include a highly buffered solution.
In the unbuffered first limit, where cand hence 8 equal zero, eqn. (19) easily becomes:
(22)
This result is identical with that derived and verified earlier for stripping un- buffered sulfur dioxide solutions [ 31. It has two interesting special cases. The first occurs when qi is large, consistent with, for example, weak ionization and hence usually small K,,. When qi is large, eqn. (22) becomes:
&$+& F M
(23)
The overall mass transfer resistance sensibly becomes the usual sum of the resistances in series. The second interesting special case occurs at small qi,

132
suggesting, for example, strong ionization and hence large &. Now eqn. (22) reduces to:
1 & iz=lzMc
(24)
Mass transfer depends only on a weighted form of the membrane coefficient. The second important limit of eqn. (19) occurs when 0 is non-zero and:
(25)
This can occur in a highly buffered solution. In this case, eqn. (19) reduces to:
(26)
Like eqn. (22)) this result has two interesting special cases. The first occurs in a buffered solution when the concentration of base is much higher than the concentration of ammonium, i.e. when C= c30 >> c20. In this case:
(27)
a result derived on a more limited basis by several other groups [g-11]. This special case, which is of significant practical importance, predicts that the overall mass transfer coefficient k will be independent of the total ammonia concentration, and will vary as shown with the base concentration (or with the pH ). Both of these predictions will be checked experimentally.
The second special case of eqn. (26) occurs in a buffered solution when the concentration of base is much less than the concentration of ammonium, i.e. when C= - czo. Note that this implies that 0, like C; is negative. In this case, we may observe a curious result. Since kF varies with the cube root of feed flow u, we expect that k -’ should be proportional to u - 1’3. The intercept on this plot, which is proportional to k M, will be negative if (1 +Kb/C) is negative. This surprising prediction may explain the negative intercepts occasionally ob- served experimentally [ 31.
Experimental
All chemicals were reagent grade (Fisher) and were used as received. Solu- tions containing ammonia were made by adding measured weights of ammo- nium sulfate to distilled water. The solutions were buffered with bicarbonate or borate and pH was adjusted with sulfuric acid or sodium hydroxide. In ex- periments conducted with large concentrations of ammonium, the pH was maintained during the experiment by the controlled addition of base.
133
The hydrophobic hollow fiber was microporous polypropylene, of 400 pm internal diameter and 30 pm wall thickness (Hoechst-Celanese Separations Products, Charlotte, NC). The fiber walls were 35% voids, largely of 0.03 pm pores. The fibers were made into modules containing 119 fibers 16.5 cm long. Further details are given elsewhere [ 4,101.
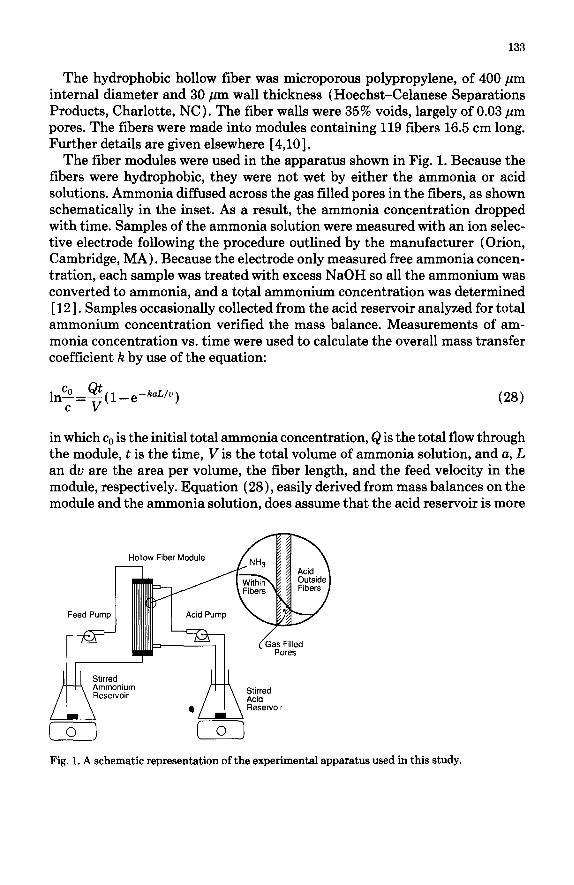
The fiber modules were used in the apparatus shown in Fig. 1. Because the fibers were hydrophobic, they were not wet by either the ammonia or acid solutions. Ammonia diffused across the gas filled pores in the fibers, as shown schematically in the inset. As a result, the ammonia concentration dropped with time. Samples of the ammonia solution were measured with an ion selec- tive electrode following the procedure outlined by the manufacturer (Orion, Cambridge, MA). Because the electrode only measured free ammonia concen- tration, each sample was treated with excess NaOH so all the ammonium was converted to ammonia, and a total ammonium concentration was determined [ 121. Samples occasionally collected from the acid reservoir analyzed for total ammonium concentration verified the mass balance. Measurements of am- monia concentration vs. time were used to calculate the overall mass transfer coefficient k by use of the equation:
ln!!?_t(l e-kaL/u) c-v -
in which co is the initial total ammonia concentration, Q is the total flow through the module, t is the time, V is the total volume of ammonia solution, and a, L an du are the area per volume, the fiber length, and the feed velocity in the module, respectively. Equation (28)) easily derived from mass balances on the module and the ammonia solution, does assume that the acid reservoir is more
Fig. 1. A schematic representation of the experimental apparatus used in this study.

134
than big enough to neutralize all the ammonia. More complete equations not making this assumption are given elsewhere [ 13,141.
Results
The goal of this paper is to measure and correlate ammonia removal using a hollow fiber module. This goal is most easily achieved by analyzing the data in terms of the mass transfer coefficients. That these coefficients can be calcu- lated from eqn. (28) is shown by the data in Fig. 2. In this figure, the logarithm of the total ammonia concentration in the reservoir is seen to vary linearly with time. The slope on this plot, given by the quantity in parentheses in eqn. (28)) is used to calculate the overall mass transfer coefficient k.
The data in Fig. 2 illustrate advantages and disadvantages of our experi- ments. On the one hand, the data show good reproducibility. These data are also consistent with those measured in the acid reservoir rather than the am- monia reservoir, i.e. the mass balance holds to within one percent. On the other hand, the mass transfer coefficient is calculated from the slope of the raw data. Such implicit differentiation of data inevitably leads to larger experimental errors. In addition, note that the ammonia removal is small, about ten percent of the feed. We could easily have removed more ammonia by using a slower velocity or a module of larger area. Had we done so, however, we risk the slope of the line in Fig. 2 becoming independent of the mass transfer coefficient, and just equaling Q/V (cf. eqn. 28).
We now turn to three groups of experiments designed to test the theory derived above. In the first group, we measure the effect on k of the total am- monia concentration in buffered solutions. In the second group, we report the effect on k of hydroxide concentration in buffered, rapidly flowing solutions. In the third group, we measure this effect vs. slow feed flow, again in buffered solutions. Because the unbuffered limits of this theory have been explored else- where [ 31, we do not test these limits here.
The overall mass transfer coefficient k is largely independent of the total
0 20 40 60
Time, min.
Fig. 2. Total ammonium concentration with time. The semilogarithmic variation suggested by
eqn. (28) allows the calculation of the mass transfer coefficient 12.

135
ammonia concentration c, as shown in Fig. 3. The measurements in this first group are at 25 “C! and a velocity of 0.020 m/set. They are at a pH of 8.2, so the concentration of ammonium is more than ten times the concentration of free ammonia. Three of the four results in Fig. 3 are within ? 10%; the fourth is about 20% lower; variations like these are characteristic of measurements of mass transfer coefficients. In a similar vein, measurements of 12 were indepen- dent of the concentration in the acid reservoir.
The values of k are a strong function of pH, as shown in Fig. 4. The data in this second group of experiments were obtained at a total ammonia concentra- tion of 140 mg/l, but at a high flow rate of 0.44 m/set. In Fig. 4, the mass transfer coefficient increases almost an order of magnitude as the pH is in- creased from 8 to 12. This change is somewhat obscured by plotting the recip- rocal of k vs. the reciprocal of the hydroxide concentration. We have used this form to test the theory above, particularly the limit given in eqn. (27). The data support this limit. The intercept and slope in Fig. 4 can be compared with
1 o-5
k? 2%
v)
Es $ J ‘6 m
1 .P E 0 FE $8 00
10~’ jl: 1 10 100 1000
Initial Total Concentration, mg/L
Fig. 3. The influence of the total ammonia concentration in the feed on the observed overall mass transfer coefficient R
Fig. 4. The reciprocal of the overall mass transfer coefficient vs. base concentration. The observed linear relationship is predicted by eqn. (27).

136
Fig. 5. The reciprocal of the mass transfer coefficient vs. feed velocity. The solid line is predicted by eqn. (27).
those estimated from eqn. (27) and correlations in the literature [ 4,151. To do this, we assume the diffusion coefficient in the liquid is 1.6 x 10m5 cm/set [ 81, and the velocity and module geometry are those given above to find kF is 0.004 cm/set. We also estimate the Knudsen diffusion coefficient in the gas-filled pores is 0.040 cm2/sec [8], the Henry’s law constant is about 1.8~ 10P3, and the tortuosity in the membrane is 3, giving IzM equal to 0.0027 cm/set. Using these values, we predict that the intercept in Fig. 4 should be 0.23, compared to the experimental value of about 0.25. We predict the slope is 0.37, near the experimental value of 0.4. Thus predictions and experiments agree closely.
Finally, we find that the mass transfer coefficient varies little with feed flow, as shown in Fig. 5. While these data were taken at an average pH of 8.2, they scatter because the pH varied by ‘_ 0.15. The solid line shown on this figure is not a best fit of the result, but rather a prediction using eqn. (25 ), correlations in the literature [4,15], and the values given above for Fig. 4. Again, predic- tions and experiments seem consistent. We turn now to the implications of these results.
Discussion
The practical value of hollow fiber contactors comes from their large surface area per volume, not from an altered mass transfer coefficient k. Conventional packing used in most gas treating has an area per volume around 200 m-l; hollow fibers can routinely offer twenty times greater area per volume [ 41. In addition, fiber modules are not compromised by loading or flooding [ 21. They can operate at very large or very small flow rates impossible using conventional packed towers. At the same time, the mass transfer coefficient in hollow fiber modules is often somewhat smaller than that in conventional packed towers. There are two reasons for this. First, the fluid flow within the fiber lumen is usually laminar, without the turbulent eddies which often enhance conven-

137
tional mass transfer [ 71. Second, hollow fiber modules do have the additional mass transfer resistance of the membrane [ 31.
In the cases studied to date, the major increase in area effected by hollow fiber modules is more than enough to justify the smaller decrease in the mass transfer coefficient. If this is so, why do we stress measurements of the mass transfer coefficient? We do so because the values of the mass transfer coeffi- cient k dramatically influence the optimal design of hollow fiber contactors [4,14]. This is especially true for ammonia, where k may be affected both by the feed conditions and by the fibers’ properties. This situation is more com- plex than most other systems, which are largely independent of membrane properties. In addition, because the hollow fiber geometry is better defined, our ammonia results can give a more exact general understanding of mass transfer with chemical reaction.
The mass transfer coefficients for ammonia measured in this work support the theory for ammonia stripping derived above. They are consistent with the two limits for highly and moderately buffered solutions. In these limits eqn. (19) reduces to eqn. (22) and (27). The coefficients in this case show the appropriate variation with solution pH, with feed flow, and with total ammonia concentration. Each of these cases merits discussion.
The analysis of ammonia transfer given above identifies two dimensionless groups, 13 and qi, which characterize the ammonia supplied to the membrane by chemical reaction and by diffusion. The physical significance of the dimen- sionless concentration t9 is the easier. In an unbuffered system, 8 is propor- tional to the proton concentration; for a system buffered with phosphate, bo- rate, or bicarbonate, 8 represents the excess buffer relative to the total ammonia concentration.
The physical significance of the second dimensionless variable in the theory above is best understood as the product Oqi. This product can be separated into two parts. The first part, C/K, represents the ratio of the free ammonia avail- able for transfer; the second part, ( kM/kF + 1) includes the relative importance of the diffusional resistances. The product Oqi therefore provides a crude ratio of the ammonia supplied for transfer by chemical reaction to that supplied by diffusion, and it characterizes the relative importance of these mechanisms in the transfer process.
This analysis is supported by our data in three important ways. First, the variation of k with base concentration shown in Fig. 4 is consistent with eqn. (27). This variation occurs because the concentration of NH: is depressed at high pH. As a result free ammonia (NH,) can be more directly removed. In- terestingly, eqn. (27) shows that the pH affects the membrane’s mass transfer coefficient kM, but not the feed’s coefficient Kr. This is different than the vari- ation suggested by other less complete theories, which correct either the overall coefficient [9] or the feed coefficient [ 10,ll ] .
Second, the variation of k with flow is observed and predicted to be small, as shown in Fig. 5. Such a small variation is atypical, dramatically different from

138
other systems which verify the expected variation with feed flow [4,5,10,14]. The small variation observed here reflects the high ammonia solubility in water, and hence the unusually small Henry’s law coefficient.
Third, the coefficient lz does not vary with the total ammonium concentra- tion, at least at the flow rate used in Fig. 3. This is consistent with eqn. (25). Equation (27) predicts an effect of ammonium concentration but only if the flow rates are very slow. Very slow flowrates were not tested in our experiments.
At the same time, our theory is limited by the assumptions made in its der- ivation. The most obvious of these is the physical geometry of the film theory used in eqns. (4)- (10) [ 7,8]. Penetration and surface renewal theories do give similar results to the film theory, so we believe that dramatic improvements on this basis are unlikely. A more serious assumption is that all species have the same diffusion coefficient, which is wrong by a factor of five. In removing this assumption, we should expect multicomponent diffusion coefficients caused by electrostatic coupling [ 81, a major complication which seems unjustified by the accuracy of our data. Similarly, we have not tried to combine our theory with that for sulfur dioxide stripping [ 31, because the results, while general, are algebraically ponderous. To us, it seems better to focus specifically on the fast ammonia removal and the accurate design possible with hollow fiber modules.
Finally, we should stress that the theory used here applies to ammonia strip- ping in general, and not just in a hollow fiber module. This theory should be generally applicable if the membrane resistance &l is replaced by the total resistance out of the feed phase. In conventional equipment, this would be reciprocal of the gas phase mass transfer coefficient.
Acknowledgements
This work was partially supported by the Hoechst Celanese Corporation, by the Hoechst Celanese Corporation, by the National Science Foundation (CTS- 89-12634), and by the Legislative Commission on Minnesota Resources.
List of symbols
a fiber surface area per volume c total bulk ammonia concentration (eqn. 7) Cl, c2, c3 concentrations of ammonia, ammonium and base, respectively
(eqn. 3 1 d fiber diameter D diffusion coefficient J total ammonia flux (eqn. 15) k overall mass transfer coefficient (eqn. 18)
139
Kb 1 L
Q 6 r
t
V
V 2
8
mass transfer coefficients in the feed and across the membrane, re- spectively (eqns. 16 and 17) equilibrium constant (eqn. 3 ) film thickness (eqn. 9) fiber length volumetric feed flow dimensionless mass transfer rate (eqn. 21) rate of free ammonia production time feed velocity feed reservoir volume distance normal to membrane surface measured from the outside of the liquid film.
dimensionless concentration (eqn. 20)
References
1 M. Imai, S. Furusaki and T. Miyauchi, Separation of volatile materials by gas membranes, Ind. Eng. Chem. Proc., 21 (1982) 421.
2 Zhang, Qi, and E.L. Cussler, Microporous hollow fibers for gas absorption. I. Mass transfer in the liquid, II. Mass Transfer Across the Membrane, J. Membrane Sci., 23 (1985) 321-345.
3 Zhang, Qi and E.L. Cussler, Hollow fiber gas membranes, AIChE J., 31 (1985) 1548. 4 M.-C. Yang and E.L. Cussler, Designing hollow fiber contactors, AIChE J., 32 (1986) 1910. 5 M.J. Semmens, R. Qin and A. Zander, Volatile organics separation from water using micro-
porous hollow fiber membranes, J. Am. Water Works Assoc., 81 (1989) 162. 6 U.S.E.P.A. Technology Transfer, Process design manual for nitrogen control, 8, October 1975. 7 G. Astarita, D.W. Savage and A. Bisio, Gas Treating with Industrial Solvents, Wiley, New
York, NY, 1983. 8 E.L. Cussler, Diffusion, Cambridge, Univ. Press, London, 1984. 9 K.J. Howe and D. Lawler, Acid-base reactions in gas transfer: A mathematical approach, J.
Am. Water Works Assoc., 81 (1989) 61. 10 C.F. Kenfield, R. &in, M.J. Semmens and E.L. Cussler, Cyanide recovery across hollow fiber
gas membranes, Environ. Sci. Technol., 22 (1988) 1151. 11 Y.Y. Chang, Cyanide recovery from metal plating wastewaters using microporous mem-
branes, M.Sc.Thesis, University of Minnesota, Minneapolis, MN, 1988. 12 W. Stumm and J.J. Morgan, Aquatic Chemistry, 2nd edn., Wiley, New York, NY, 1970. 13 L. Dahuron and E.L. Cussler, Protein extractions with hollow fibers, AIChE J., 34 (1988)
130. 14 M.-C. Yang and E.L. Cussler, Artificial gills, J. Membrane Sci., 42 (1989) 273. 15 E.N. Sieder and G.E. Tate, Heat transfer and pressure drop in tubes, Ind. Eng. Chem., 28
(1936) 1429. 16 T.P. O’Farrell, D.F. Bishop and A.F. Cassel, Nitrogen removal by ammonia stripping, EPA
Report No. 670/2-73-040, September 1973.

140
Appendix
As an example illustrating the design of a membrane contactor for ammonia removal we will compare our results with packed tower experiments made at the Blue Plains pilot plant [ 161. These experiments used a water flow of 24 gpm/ft’ cross section of tower, an air flow of 300 ft3 per gallon of water, a pH of 11, and a tower length of 24 feet. Under these conditions, the experiments show that 80% of the ammonia fed can be removed.
In our case, we expect that the ammonia concentration is given by [ 2,4] :
&LkaL c- v
(A-1 1
where c0 and c are the entering and exit concentrations of ammonia. Because we capture the ammonia with acid, we need no air flow, and so save pumping costs. If the module is half filled with hollow fibers, we can find a and v [8]:
4 4 100
‘=ct= (400X lop4 crn)=TGT
In addition:
(A-2)
(A-3)
From Fig. 4 or from either eqn. (27) or eqn. (19), we expect k is about 1.3 x low3 cm/set. Thus for a 24 foot module, we predict (co/c) will be 105; i.e. we will remove over 99.999% of the ammonia. To remove 80% of the ammonia, we need a module only 40 cm long. Clearly, such efficient removal will avoid the present need to run at pH 11 and avoid the cost of such an immense air flow.