CCQM-K117 - Ammonia in nitrogen - BIPM
59
1 International Comparison CCQM-K117 – Ammonia in nitrogen Adriaan M.H. van der Veen 1 , Janneke I. T. van Wijk 1 , Kimberly Harris 2 , Cassie Goodman 2 , Joseph Hodges 2 , Shinji Uehara 3 , Ji Hwang Kang 4 , Yong Doo Kim 4 , Dal Ho Kim 4 , Sangil Lee 4 , David R. Worton 5 , Sam Bartlett 5 , Sivan Van Aswegen 5 , Paul J. Brewer 5 , Olga.V. Efremova 6 , Tiqiang Zhang 7 , Defa Wang 7 , Qiao Han 7 , Zhou Zeyi 7 , Maitane Iturrate-Garcia 8 , Céline Pascale 8 , Bernhard Niederhauser 8 1 Van Swinden Laboratorium (VSL), Chemistry Group, Thijsseweg 11, 2629 JA Delft, the Netherlands 2 National Institute of Standards and Technology (NIST), Gas Metrology Group 100 Bureau Drive Building 301, Gaithersburg, MD 20899-3574, United States of America 3 Chemicals Evaluation and Research Institute, Japan (CERI), 1600, Shimo-Takano, Sugito-machi, Kitakatsushika-gun, Saitama 345-0043, Japan 4 Korea Research Institute of Standards and Science (KRISS), Gas Metrology Group, 267 Gajeong-ro Yuseong- gu, Daejeon 34113, Republic of Korea 5 National Physical Laboratory (NPL), Teddington, Middlesex, TW11 0LW, United Kingdom 6 D.I. Mendeleyev Institute for Metrology (VNIIM), Department of State Standards in the field of Physical Chemical Measurements, 19, Moskovsky Prospekt, 198005 St-Petersburg, Russia 7 National Institute of Metrology (NIM), No. 18 beiSan Huan Dong Road, 100029 Beijing, China 8 Federal Institute of Metrology (METAS), Lindenweg 50, CH-3003 Bern-Wabern, Switzerland Field Amount of substance Subject Comparison of ammonia in nitrogen (track C) Table of contents Field........................................................................................................................................................................................ 1 Subject ................................................................................................................................................................................... 1 Table of contents............................................................................................................................................................... 1 1 Introduction ........................................................................................................................................................ 2 2 Design and organisation of the key comparison .................................................................................. 2 2.1 Participants ................................................................................................................................................ 2 2.2 Measurement standards ....................................................................................................................... 2 2.3 Measurement protocol .......................................................................................................................... 3 2.4 Schedule....................................................................................................................................................... 3 2.5 Measurement equation ......................................................................................................................... 3 2.6 Measurement methods.......................................................................................................................... 6 2.7 Degrees of equivalence.......................................................................................................................... 6 3 Results ................................................................................................................................................................... 6 3.1 Stability and homogeneity of the transfer standards ............................................................... 6 3.2 Key comparison reference value and degrees-of-equivalence ...........................................10 4 Supported CMC claims ..................................................................................................................................11 5 Discussion and conclusions ........................................................................................................................11 References .........................................................................................................................................................................12 Coordinators .....................................................................................................................................................................13 Project reference.............................................................................................................................................................13 Completion date ..............................................................................................................................................................13 Annex A : Measurement reports...............................................................................................................................14
-
Upload
khangminh22 -
Category
Documents
-
view
1 -
download
0
Transcript of CCQM-K117 - Ammonia in nitrogen - BIPM

1
International Comparison CCQM-K117 ndash Ammonia in nitrogen
Adriaan MH van der Veen1 Janneke I T van Wijk1 Kimberly Harris2 Cassie Goodman2 Joseph Hodges2 Shinji Uehara3 Ji Hwang Kang4 Yong Doo Kim4 Dal Ho Kim4 Sangil Lee4 David R Worton5 Sam Bartlett5 Sivan Van Aswegen5 Paul J Brewer5 OlgaV Efremova6 Tiqiang Zhang7 Defa Wang7 Qiao Han7 Zhou Zeyi7 Maitane Iturrate-Garcia8 Ceacuteline Pascale8 Bernhard Niederhauser8
1Van Swinden Laboratorium (VSL) Chemistry Group Thijsseweg 11 2629 JA Delft the Netherlands 2National Institute of Standards and Technology (NIST) Gas Metrology Group 100 Bureau Drive Building 301 Gaithersburg MD 20899-3574 United States of America 3 Chemicals Evaluation and Research Institute Japan (CERI) 1600 Shimo-Takano Sugito-machi Kitakatsushika-gun Saitama 345-0043 Japan
4Korea Research Institute of Standards and Science (KRISS) Gas Metrology Group 267 Gajeong-ro Yuseong-gu Daejeon 34113 Republic of Korea 5National Physical Laboratory (NPL) Teddington Middlesex TW11 0LW United Kingdom 6DI Mendeleyev Institute for Metrology (VNIIM) Department of State Standards in the field of Physical Chemical Measurements 19 Moskovsky Prospekt 198005 St-Petersburg Russia 7National Institute of Metrology (NIM) No 18 beiSan Huan Dong Road 100029 Beijing China 8Federal Institute of Metrology (METAS) Lindenweg 50 CH-3003 Bern-Wabern Switzerland
Field Amount of substance
Subject Comparison of ammonia in nitrogen (track C)
Table of contents Field 1
Subject 1
Table of contents 1
1 Introduction 2
2 Design and organisation of the key comparison 2
21 Participants 2 22 Measurement standards 2 23 Measurement protocol 3 24 Schedule 3 25 Measurement equation 3 26 Measurement methods 6 27 Degrees of equivalence 6
3 Results 6
31 Stability and homogeneity of the transfer standards 6 32 Key comparison reference value and degrees-of-equivalence 10
4 Supported CMC claims 11
5 Discussion and conclusions 11
References 12
Coordinators 13
Project reference13
Completion date 13
Annex A Measurement reports 14
2
Measurement report CERI 14 Measurement report VNIIM 20 Measurement report VSL 24 Measurement report METAS 30 Measurement report KRISS 38 Measurement report NIM43 Measurement report NIST 48 Measurement report NPL 56
1 Introduction This key comparison is a comparison to evaluate specific competences of NMIs (track C key comparisons) Ammonia is an important compound in chemical industry It is widely used and is the basis for producing other compounds containing nitrogen Ammonia is also very hazardous and consequently emissions of ammonia need to be controlled and monitored In the past years several National Metrology Institutes have developed facilities for the preparation of Primary Standard gas Mixtures (PSMs) dynamically generated ammonia mixtures and facilities for comparing and certifying gas mixtures containing ammonia This key comparison is a repeat of the CCQM-K46 [1]
For this key comparison a binary mixture of ammonia in nitrogen has been chosen at an amount-of-substance fraction level of 14 micromol mol-1 The key comparison design follows that of the key comparisons using gas mixtures that are prepared gravimetrically as transfer standards [2][3]
2 Design and organisation of the key comparison
21 Participants
Table 1 lists the participants in this key comparison
Table 1 List of participants
Acronym Country Institute
CERI JP Chemicals Evaluation and Research Institute Saitama Japan
METAS CH Federal Institute of Metrology METAS Bern-Wabern Switzerland
KRISS KR Korea Research Institute of Standards and Science Daejeon Republic of Korea
NIST US National Institute of Standards and Technology Gaithersburg MD United States of America
NIM CN National Institute of Metrology Beijing China
NPL GB National Physical Laboratory Teddington United Kingdom
VNIIIM RU DI Mendeleyev Institute for Metrology St Petersburg Russia
VSL NL Van Swinden Laboratorium Delft the Netherlands
22 Measurement standards
A set of mixtures was prepared gravimetrically by an external party in 50 L aluminium cylinders The filling pressure in the cylinders was approximately 150 bar The transfer standards were prepared with a nominal amount fraction ammonia of 14 micromol mol-1 The transfer standards were assessed for stability and homogeneity Prior to shipment to the participating national metrology institutes (NMIs) the set of mixtures was analysed by VSL and then by NIST After return the set of mixtures was analysed by NIST and then by VSL These data were used to
3
1) Assess the stability of the ammonia amount fraction over time
2) Compute the differences in the ammonia amount fraction between the mixtures
The first assessment comprised the evaluation of the slope of a straight line fitted to the four data points and to assess it for significance [4] After this assessment the ammonia amount fraction was calculated for each mixture and the differences were calculated using a fixed effects model These corrections were applied to the reported results prior to calculating a consensus value which was then used to calculate the key comparison reference values for each of the travelling standards
23 Measurement protocol
The cylinders for this comparison were bought by VSL but all NMIs paid for their own cylinder which could be collected from VSL after the final stability measurements These stability measurements have been performed by VSL-NIST-NIST-VSL The participantsrsquo measurements took place between the two NIST stability measurements The rationale of having two NMIs to perform stability study is their difference in preparing their measurement standards VSL used gravimetry and dilution using thermal mass flow controllers [5] and NIST used permeation [6]
The measurement protocol requested each laboratory to perform at least 3 measurements with their own calibrations The replicates leading to a measurement were to be carried out under repeatability conditions The protocol informed the participants about the nominal amount fraction ranges The participants were also requested to submit a summary of their uncertainty evaluation used for calculating the uncertainty of their result
24 Schedule
The schedule of this key comparison was as follows (table 2)
Table 2 Key comparison schedule
Date Stage
December 2014 Agreement of draft protocol April 2014 Registration of participants October 2017 Final protocol available November 2017 Expected delivery date of mixtures at VSL Nov 2017 ndash Sep 2018 October 2018
Homogeneity and stability study at VSL and NIST Dispatch of mixtures
Nov 2018 ndash Jun 2019 July 2019 July 2019
Measurements by participants Cylinders to be returned to NIST Report received by VSL
Aug 2019 ndash Dec 2019 October 2019 February 2020
Continuation of the stability study by NIST and VSL Preliminary results available Participants can collect their own mixture from VSL
March 2020 Draft A report available April 2021 Draft B report available
25 Measurement equation
The evaluation of the data from this key comparison was performed by establishing a consensus value from the results reported by the participants In this calculation effects from stability and homogeneity were addressed As explained in section 23 four measurements were taken at different times to enable assessing the stability of the transfer standards After this assessment amount fractions were computed for the transfer standards These amount fractions were subsequently used to calculate the differences due to batch inhomogeneity of the set of transfer standards Only the gas mixtures that had been used in the key comparison were included A fixed
4
effects model was used to calculate these differences [7] This model is identical to the model used in procedure A (the weighted mean) [8]
The consensus value was calculated after correcting the participantsrsquo results for the differences between the transfer standards The consensus value was calculated using a weighted median [9][10] and procedure B [8] which involves using a Monte Carlo method to propagate the uncertainty The key comparison reference value for each transfer standard was defined as
119910KCRV119894 = 119910WMed + 119890119894
where 119910WMed denotes the weighted median and 119890119894 the deviation in the amount fraction of transfer standard i as computed from the homogeneity study This approach enables presenting the results including the KCRV and the degrees-of-equivalence in a fashion that is used in most key comparisons in the gas analysis area
In detail the calculations performed were as follows Given for each component the following data
1 the amount fraction 119910lab119894 and associated expanded uncertainty 119880lab119894 with coverage factor 119896lab119894 for laboratories 119894 = 1 hellip 119873
2 the amount fraction 119910119895 and associated standard uncertainty 119906(119910119895) for measurements 119895 =
1 hellip 119872 from the homogeneity and stability study
the following calculations were performed To assess the stability of the mixtures for each mixture the following steps were taken
‒ A weighted least squares fit using a straight line to the 119905119895 119910119895 for 1198951 hellip 119872 where 119905119895 denotes
the time and 119910119895 the amount fraction in the mixture as weights the inverse of the variances
1199062(119910119895) were used
‒ Assess whether 1198861 le 119906(1198861) where 1198861 denotes the slope of the straight line and 119906(1198861) the associated standard uncertainty
‒ If the slope is significant check the data and evaluation
‒ If the slope is not significant fit the data using a meta-analysis model to compute a mean amount fraction and standard uncertainty 119906()
The meta-analysis was performed using the DerSimonian-Laird model [11][12] The calculations were performed in R [13] using the metafor package [14] The differences 119890119894 were computed from the 119894 and associated standard uncertainties 119906(119894) The fixed effects model defines these differences as
119890119894 = 119894 minus WM
where WM denotes the weighted mean computed from the 119894 and associated standard uncertainties 119906(119894) [7] The standard uncertainty associated with 119890119894 was computed as [8]
1199062(119890119894) = 1199062(119894) minus 1199062(WM)
where the minus sign arises due the covariance between 119894 and WM
The key comparison was based on a weighted median [9][10] as consensus value Given ordered measured values 119910primelab119894 corrected for the differences in ammonia amount fractions between the
transfer standards with weights 119908prime119894 the weighted median is the element ℓ satisfying
5
sum 119908prime119894
ℓminus1
119894prime=1
le 05 and sum 119908prime119894
119873
119894prime=ℓ
le 05
where
119908119894 = (119880lab1198942 119896lab119894
2 + 1199062(119890119894))minus1
and
119908prime119894 = 119908119894 sdot [sum 119908119895
119873
119895=1
]
minus1
to ensure that sum 119908119894 prime119894 = 1
This estimator is used in the procedure B [8] to obtain the consensus value and degrees-of-equivalence This approach was required as the reported data did not satisfy the criterion to use procedure A which requires that the data set passes a consistency test
The use of the weighted median is a refinement in comparison with the evaluation procedure used for CCQM-K112 (Biogas) Procedure B is implemented using the Monte Carlo method of GUM
Supplement 2 (GUM-S2) [16] using 119872MCM = 106 samples The steps are as follows
1 Draw a series of measured values 119911lab119894 sim 119873(119910lab119894
119880lab119894119896lab119894) for 119894 = 1 hellip 119873
2 Draw a series of measured values 119911119894 sim 119873(119894 119906(
119894)) for 119894 = 1 hellip 119873
3 Compute 120549119911119894 = 119911119894 minus 119911WM where 119911WM denotes the weighted mean
4 Compute 119911primelab119894 = 119911lab119894 minus Δ119911119894
5 Compute the weighted median 119911WMed using corrected values 119911primelab119894 and weights 119908119894prime
6 Compute 119911KCRVi = 119911WMed + Δ119911119894
7 Compute the difference 120575119894 = 119911lab119894 minus 119911KCRV119894
The output from this Monte Carlo procedure was used to compute [17]
‒ The deviations 119890119894 as the mean of the Δ119911119894 and its associated standard uncertainty as the
standard deviation of the Δ119911119894
‒ The KCRVs 119910KCRV119894 as the mean of the 119911KCRV119894 and its associated standard uncertainty as the standard deviation of the 119911KCRV119894
‒ The differences with respect to the KCRV 119889119894 as the mean of the 120575119894 and the 95 coverage interval as the probabilistically symmetric interval of the 120575119894 the standard uncertainty is obtained by calculating the standard deviation of the 120575119894
This procedure ensures that
‒ Corrections are made for the differences in composition of the transfer standards through
the 119890119894
‒ Most weight is given in the formation of the median to the measured values with the smallest uncertainty
‒ Effects of covariances between the 119890119894 are taken into account
6
26 Measurement methods
The measurement methods used by the participants are described in annex A of this report A summary of these methods the dates of measurement and reporting and the way in which metrological traceability has been established is given in Table 3
Table 3 Summary of calibration methods and metrological traceability
Laboratory code
Measurements Calibration Traceability Matrix standards
Measurement technique
VNIIM 4 April ndash 5 June 2019 Single point calibration
Own standards (ISO 6142)
Nitrogen Chromatography-mass spectrometry
NPL 16-17 May 2019 Bracketing Own standards (ISO 6142)
Nitrogen NDIR1
VSL 7-13 March 2019 ISO 6143 Own standards (ISO 6142)
Nitrogen Photo-Acoustic
CERI 13-March ndash 4 April 2019 Multipoint calibration
Own standards (ISO 6142)
Nitrogen NDIR and FTIR2
KRISS 28-30 January 2019 Single point Own standards Nitrogen NDIR
NIST 23-25 October 2018 ISO 6143 Own standards Nitrogen Chemiluminescence
METAS 11-14 March 2019 Bracketing Own standards Nitrogen CRDS3
NIM 23-26 April 2019 Bracketing Own standards (ISO 6142)
Nitrogen FTIR
27 Degrees of equivalence
A unilateral degree of equivalence in key comparisons is defined as
119889119894 = 119910lab119894 minus 119910KCRVi (1)
and the uncertainty associated with the difference di at 95 level of confidence
Given that procedure B has been used with a weighted median as estimator for the KCRV there is no closed form for the evaluation of the standard uncertainty associated with the difference 119889119894 Instead the Monte Carlo method of GUM Supplement 2 [16] was used to calculate this performance metric The approach could readily be extended to calculate bilateral degrees-of-equivalence
3 Results
31 Stability and homogeneity of the transfer standards
The results of the stability and homogeneity study of the transfer standards are summarised in Figure 1 The measurements taken by the NMIs took place between the second and third data point VNIIM did not manage to deliver its transfer standard in a timely fashion to the coordinating laboratories so it was omitted from the third series of analyses
The results shown in Figure 1 demonstrate the stability of the amount fraction ammonia over the period that the measurements of the NMIs took place The last measurement result (around 850 d) is for some of the transfer standards somewhat higher than the other results This is probably attributable to an effect in the calibration or operation of the setup used for these analyses and has no meaning for the stability assessment The amount fraction ammonia is known to increase
1 Non-dispersive infrared spectroscopy 2 Fourier-transform infrared spectroscopy 3 Cavity ringdown spectroscopy
7
as the pressure of the calibration gas mixture in the cylinder decreases The pressures in the transfer standards was widely different during the last measurement and the said effect concerned all mixtures (also the spare ones) so that it can be assumed that the effect is not due to the pressure in the cylinder
To further process the data taking into account that the last results may be slightly biased the differences in amount fraction of the transfer standards have been computed first before combining these (Figure 2)
100 200 300 400 500 600 700 800 900
132
134
136
138
140
142
144
146
148
y (
microm
olm
ol)
time (d)
NIST
100 200 300 400 500 600 700 800 900
132
134
136
138
140
142
144
146
148
y (
microm
olm
ol)
time (d)
CERI
100 200 300 400 500 600 700 800 900
132
134
136
138
140
142
144
146
148
y (
microm
olm
ol)
time (d)
NPL
100 200 300 400 500 600 700 800 900
132
134
136
138
140
142
144
146
148
y (
microm
olm
ol)
time (d)
KRISS
100 200 300 400 500 600 700 800 900
132
134
136
138
140
142
144
146
148
y (
microm
olm
ol)
time (d)
NIM
100 200 300 400 500 600 700 800 900
132
134
136
138
140
142
144
146
148
y (
microm
olm
ol)
time (d)
VSL
8
100 200 300 400 500 600 700 800 900
132
134
136
138
140
142
144
146
148y (
microm
olm
ol)
time (d)
METAS
100 200 300 400 500 600 700 800 900
132
134
136
138
140
142
144
146
148
y (
microm
olm
ol)
time (d)
VNIIM
Figure 1 Stability study data of the transfer standards used in CCQM-K117 The uncertainty bars indicate expanded uncertainties
100 200 300 400 500 600 700 800 900
-06
-04
-02
00
02
04
06
08
Δy (
microm
olm
ol)
time (d)
NIST
100 200 300 400 500 600 700 800 900
-06
-04
-02
00
02
04
06
08
Δy (
microm
olm
ol)
time (d)
CERI
100 200 300 400 500 600 700 800 900
-06
-04
-02
00
02
04
06
08
Δy (
microm
olm
ol)
time (d)
NPL
100 200 300 400 500 600 700 800 900
-06
-04
-02
00
02
04
06
08
Δy (
microm
olm
ol)
time (d)
KRISS
100 200 300 400 500 600 700 800 900
-06
-04
-02
00
02
04
06
08
Δy (
microm
olm
ol)
time (d)
NIM
100 200 300 400 500 600 700 800 900
-06
-04
-02
00
02
04
06
08
Δy (
microm
olm
ol)
time (d)
VSL
9
100 200 300 400 500 600 700 800 900
-06
-04
-02
00
02
04
06
08Δ
y (
microm
olm
ol)
time (d)
METAS
100 200 300 400 500 600 700 800 900
-06
-04
-02
00
02
04
06
08
Δy (
microm
olm
ol)
time (d)
VNIIM
Figure 2 Deviations from the weighted mean of the amount fraction ammonia of the transfer standards used in CCQM-K117 The uncertainty bars indicate expanded uncertainties
A complication was the missing datum for the transfer standard of VNIIM The implication of this missing data point is that the weighted mean computed for the third data set would be inconsistent with the others The missing data point was replaced by a value of 0055 micromol mol-1 which is consistent with the other three data points for this transfer standard and the standard uncertainty was taken as the pooled standard uncertainty from the other cylinders The aim was to minimise the effect on the outcome of the stability study assessment The deviations with respect to the weighted mean from the homogeneity and stability study are summarised in Table 4
Table 4 Deviations from the weighted mean of the amount fraction ammonia (micromol mol-1) as obtained in the stability and homogeneity study
Mixture NMI Δy U(Δy) Δy U(Δy) Δy U(Δy) Δy U(Δy)
5904173 NIST -004 009 -004 010 006 018 001 013
5904216 CERI 000 014 005 010 006 020 009 013
5904237 NPL 001 018 001 010 002 013 005 013
5904238 KRISS -029 009 -025 009 -019 013 -023 013
5904239 NIM -017 011 -013 009 -012 011 -021 013
5904242 VSL 057 010 050 010 059 018 057 014
5904243 METAS -013 009 -015 009 -004 011 -027 013
5904245 VNIIM 006 008 006 010 005 015 006 013
The results of the stability study assessment are summarised in Table 5 The slope a1 is given in 10-6 micromol mol-1 d-1 U- and U+ denote respectively the lower and upper limit of the 95 coverage interval of the slope The regression was performed using the function lm in R [13] All mixtures
passed the stability test Then using the DerSimonian-Laird model [11][12] followed by a fixed effects model the deviations ei and their standard uncertainties were computed (see also Table 5) Only for one data set a non-zero value for the excess standard deviation τ is obtained The data set of transfer standard 5904243 was also evaluated using the four amount fractions determined in the stability study This evaluation revealed that the four data points were much better on a straight line resulting in a substantially smaller standard uncertainty and hence also the qualification that there was a significant trend Looking at the dispersion of the data of the other transfer standards about their straight lines it was concluded that the small dispersion for this mixture was not representative for the performance in the entire study Also the data did not reveal that this transfer standard would behave differently from the others (see also Figure 1 and Figure 2)
Table 5 Stability assessment and deviations of the amount fraction ammonia for the transfer standards used in CCQM-K117 (micromol mol-1)
10
Mixture Lab a1 u(a1) U_( a1) U+( a1) Stable τ ei u(ei)
5904173 NIST 99 42 -82 280 TRUE 0 -0020 0028
5904216 CERI 51 56 -189 291 TRUE 0 0051 0032
5904237 NPL 42 23 -55 139 TRUE 0 0019 0031
5904238 KRISS 55 68 -238 349 TRUE 0 -0249 0027
5904239 NIM -54 67 -342 234 TRUE 0 -0151 0027
5904242 VSL 101 54 -131 334 TRUE 0 0548 0030
5904243 METAS -16 174 -765 733 TRUE 0064 -0142 0041
5904245 VNIIM -9 10 -54 36 TRUE 0 0061 0026
32 Key comparison reference value and degrees-of-equivalence
The results reported by the participants are given in Table 6 and Figure 3 The expanded uncertainty associated with the KCRV is generally smaller than that of the results submitted by the participants There is a small influence of the uncertainty associated with the corrections made for the differences between the amount fractions ammonia of the transfer standards
Table 6 Reported results in CCQM-K117 (ylab) and the key comparison reference values expressed in micromol mol-1
Lab Mixture ylab U(ylab) klab yKCRV u(yKCRV) U(yKCRV)
NIST 5904173 1364 02 2 13743 0056 0110
CERI 5904216 1386 018 2 13814 0056 0110
NPL 5904237 138 04 2 13782 0058 0114
KRISS 5904238 1357 015 2 13514 0053 0104
NIM 5904239 1385 02 2 13612 0057 0111
VSL 5904242 1428 014 2 14310 0052 0102
METAS 5904243 1294 013 2 13621 0065 0127
VNIIM 5904245 1441 023 2 13824 0056 0111
NIST CERI NPL KRISS NIM VSL METAS VNIIM
125
130
135
140
145
150
y (
microm
olm
ol)
Lab
Figure 3 Reported results in CCQM-K117 the uncertainty bars indicate expanded uncertainties
11
NIST CERI NPL KRISS NIM VSL METAS VNIIM
-10
-05
00
05
10d
(micro
mo
lm
ol)
Lab
Figure 4 Degrees-of-equivalence
In Figure 4 and Table 7 the degrees-of-equivalence are shown Two submitted results are clearly discrepant (METAS and VNIIM) and one result is just inconsistent with the KCRV (NIM) The results in this key comparison do not show the discrepancies between the various methods of realising measurement standards as observed in CCQM-K46 [1]
Table 7 Degrees of equivalence (micromol mol-1)
Lab Mixture 119941119946 119958(119941119946) 119932(119941119946) NIST 5904173 -0103 0105 0204 CERI 5904216 0046 0090 0185 NPL 5904237 0018 0203 0402 KRISS 5904238 0056 0073 0146 NIM 5904239 0238 0114 0223 VSL 5904242 -0030 0061 0127 METAS 5904243 -0681 0092 0180 VNIIM 5904245 0586 0128 0251
4 Supported CMC claims The results of this key comparison can be used to support CMC claims for mixtures in nitrogen and air in the amount of substance fractions between 10 micromolmol and 1000 micromolmol
The way in which this key comparison supports CMC claims is described in more detail in the ldquoGAWG strategy for comparisons and CMC claimsrdquo [19] The extrapolation scheme for CMCs does not apply for this key comparison beyond the amount fraction interval stated
5 Discussion and conclusions The results in this Track C key comparison on 14 micromol mol-1 ammonia in nitrogen are acceptable Five of the eight NMIs demonstrate equivalence with the KCRV A discrepancy between static gravimetry on one hand and other methods for realising the national standards for ammonia in nitrogen was not observed in this key comparison This was one of the features in the data of the previous key comparison (CCQM-K46)
12
References [1] AMH van der Veen G Nieuwenkamp RM Wessel M Maruyama Gwi Suk Heo Yong-doo
Kim Dong Min Moon B Niederhauser M Quintilii MJT Milton MG Cox PM Harris FR
Guenther GC Rhoderick LA Konopelko YA Kustikov VV Pankratov DN Selukov VA
Petrov EV Gromova ldquoInternational comparison CCQM-K46 Ammonia in nitrogenrdquo
Metrologia 47 (2010) Tech Suppl 08023
[2] International Organization for Standardization ldquoISO 6142-1 Gas analysis - Preparation of
calibration gas mixtures - Gravimetric methodsrdquo ISO Geneva 2015
[3] International Organization for Standardization ldquoISO 19229 Gas analysis - Gas analysis mdash
Purity analysis and the treatment of purity datardquo ISO Geneva 2019
[4] ISO Guide 35 Reference materials ndash Guidance for characterization and assessment of
homogeneity and stability ISO International Organization for Standardization Geneva
Switzerland 2017 Fourth edition
[5] International Organization for Standardization ldquoISO 6145-7 Gas analysis mdash Preparation
of calibration gas mixtures using dynamic methods mdash Part 7 Thermal mass-flow
controllersrdquo ISO Geneva 2018
[6] International Organization for Standardization ldquoISO 6145-10 Gas analysis mdash Preparation
of calibration gas mixtures using dynamic volumetric methods mdash Part 10 Permeation
methodrdquo ISO Geneva 2002
[7] G Schwarzer JR Carpenter and G Ruumlcker ldquoMeta-Analysis with R (Use R)rdquo Springer
2015
[8] MG Cox The evaluation of key comparison data Metrologia 39(6)589ndash595 dec 2002
[9] F Y Edgeworth On observations relating to several quantities Hermathena 6(13)279ndash
285 1887
[10] FY Edgeworth XXII On a new method of reducing observations relating to several
quantities The London Edinburgh and Dublin Philosophical Magazine and Journal of
Science 25(154)184ndash191 mar 1888
[11] R DerSimonian and N Laird Meta-analysis in clinical trials Controlled Clinical Trials
7(3)177ndash188 1986
[12] R DerSimonian and R Kacker Random-effects model for meta-analysis of clinical trials
An update Contemporary Clinical Trials 28(2)105ndash114 feb 2007
[13] R Core Team R A Language and Environment for Statistical Computing R Foundation for
Statistical Computing Vienna Austria 2020 Version 403
[14] Wolfgang Viechtbauer Conducting meta-analyses in R with the metafor package Journal
of Statistical Software 36(3)1ndash48 2010
[15] AMH van der Veen ET Zalewska DR van Osselen TE Fernaacutendez C Goacutemez J Beraacutenek
RJ Oudwater DC Sobrinho MC Brum CR Augusto J Fuumlkouml T Buumlki Z Nagyneacute Szilaacutegyi
PJ Brewer ML Downey RJC Brown M Valkova Z Durisova K Arrhenius B
Magnusson H Yaghooby T Tarhan E Engin LA Konopelko TA Popova MN Pir OV
13
Efremova Final Report international comparison CCQM-K112 Biogas Metrologia
57(1A)08011ndash08011 jan 2020
[16] BIPM IEC IFCC ILAC ISO IUPAC IUPAP OIML Supplement 2 to the lsquoGuide to the
Expression of Uncertainty in Measurementrsquo ndash Extension to any number of output
quantities JCGM 1022011 BIPM 2011
[17] BIPM IEC IFCC ILAC ISO IUPAC IUPAP OIML Supplement 1 to the lsquoGuide to the
Expression of Uncertainty in Measurementrsquo ndash Propagation of distributions using a Monte
Carlo method JCGM 1012008 BIPM 2008
[18] BIPM IEC IFCC ISO IUPAC IUPAP OIML ldquoEvaluation of measurement data mdash Guide to
the expression of uncertainty in measurementrdquo first edition GUM1995 with minor
corrections JCGM 1002008 BIPM 2008
[19] PJ Brewer AMH van der Veen ldquoGAWG strategy for comparisons and CMC claimsrdquo CCQM
Gas Analysis Working Group April 2016
Coordinators VSL Department of Chemistry Mass Pressure and Viscosity Janneke IT van Wijk Thijsseweg 11 2629 JA Delft the Netherlands Phone +31 15 269 1679 E-mail jvwijkvslnl
NIST Kimberly Harris 100 Bureau Drive Gaithersburg MD 20899 USA Phone +1-00-301-975-3905 E-mail Kimberlyharrisnistgov
Project reference CCQM-K117
Completion date March 2020
14
Annex A Measurement reports
Measurement report CERI
Cylinder number 5904216
Measurement 1
Component Date (ddmmyy)
Result (molmol)
Standard deviation (molmol)
number of replicates
Instrument
Ammonia 3132019 137598 007754 3 NDIR
Measurement 2
Component Date (ddmmyy)
Result (molmol)
Standard deviation (molmol)
number of replicates
Instrument
Ammonia 3142019 138916 002410 3 NDIR
Measurement 3
Component Date (ddmmyy)
Result (molmol)
Standard deviation (molmol)
number of replicates
Instrument
Ammonia 3212019 137468 004045 3 NDIR
Measurement 4
Component Date (ddmmyy)
Result (molmol)
Standard deviation (molmol)
number of replicates
Instrument
Ammonia 3222019 138174 004919 3 NDIR
Measurement 5
Component Date (ddmmyy)
Result (molmol)
Standard deviation (molmol)
number of replicates
Instrument
Ammonia 3232019 138747 003962 3 NDIR
Measurement 6
Component Date (ddmmyy)
Result (molmol)
Standard deviation (molmol)
number of replicates
Instrument
Ammonia 3282019 138619 001719 3 FTIR
Measurement 7
Component Date (ddmmyy)
Result (molmol)
Standard deviation (molmol)
number of replicates
Instrument
Ammonia 3292019 139026 003857 3 FTIR
15
Measurement 8
Component Date (ddmmyy)
Result (molmol)
Standard deviation (molmol)
number of replicates
Instrument
Ammonia 3312019 139186 002403 3 FTIR
Measurement 9
Component Date (ddmmyy)
Result (molmol)
Standard deviation (molmol)
number of replicates
Instrument
Ammonia 442019 138399 006825 3 NDIR
Results
Component Result (molmol)
Expanded uncertainty
(molmol)
Coverage factor
Ammonia 1386 018 2
Result was the weighted mean of NDIR data set mean and FTIR data set mean which was calculated using formula1) below
119910 = sum 119882119894119883119894
119901
119894=1
sum 119882119894
119901
119894=1
frasl
where y= weighted mean Xi= each data set mean Wi= 1ui2 ui= standards uncertainty for the value Xi p= number of data set mean Calibration Standards -Method of preparation ISO 6142-12)
16
1 500 μmolmol NH3 in N2
R1 35 μmolmol NH3 in N2
R2 20 μmolmol NH3 in N2
R3 12 μmolmol NH3 in N2
N2
005 molmol NH3 in N2
Pure NH3
-Weighing data (12 μmolmol NH3 in N2) 1) Evacuated cylinder - Tare cylinder 5678 g 2) Cylinder filled with 005 molmol NH3 in N2 - Tare cylinder 16732 g 3) Cylinder filled with nitrogen - Tare cylinder 1 343304 g -Purity tables (composition) of the parent gases
Purity table of NH3
Component Analytical value (μmolmol)
Distribution Mole fraction (μmolmol)
Standard Uncertainty (μmolmol)
N2 le 100 Rectangular 50 2887
O2 le 100 Rectangular 50 2887
CO le 100 Rectangular 50 2887
CO2 le 100 Rectangular 50 2887
NH3 - - 999 800 5774
Purity table of nitrogen
Component Analytical value (μmolmol)
Distribution Mole fraction (μmolmol)
Standard Uncertainty (μmolmol)
CO le 0003 Rectangular 0001 5 0000 866
CO2 le 0003 Rectangular 0001 5 0000 866
Methane le 0003 Rectangular 0001 5 0000 866
17
Non methane hydro carbon (NMHC)
le 0003 Rectangular 0001 5 0000 866
SO2 le 0002 Rectangular 0001 0000 577
NOx le 0002 Rectangular 0001 0000 577
N2 - - 999 999992 0001 915
Each mole fraction of impurity in nitrogen is adequately low Therefore the molar mass of dilution gas wasnrsquot affected from the impurities -Verification measure We prepared two R3 Standards The gas standards were compared by FTIR Difference between gravimetric value and measurement value is one of the uncertainty sources of the gas standard Instrument Calibration We used two instruments for NH3 measurements Non-dispersive Infrared analyser (Type CGT-7000 Make Shimadzu corporation) and Fourier Transform Infrared Spectroscopy analyser (Type MATRIX-MG5 Make Bruker corporation) Calibration method and value assignment The instruments were calibrated using three gravimetrically prepared standards ranging in concentration from 35 molmol to 12 molmol Analytical scheme was R1 ndashR2 ndash CCQM sample ndash R3 This scheme was repeated 3-times in a day These measurements were carried out for 9-day Quadratic calibration model was chosen to the data Concentration of standards
Component Concentration ( molmol )
R1 R2 R3
NH3 3537 2002 1241
18
Uncertainty evaluation NDIR analysis
Source of uncertainty
Estimate xi
Value +-
Method of evaluation (type A or typeB)
Assumed probability distribution
Divisor
Standard uncertainty
u(xi)
Sensitivity coefficient
|ci|
Contribution
uⅰ(y)
Measurement
1382 μmolmol
0086 22 μmolmol
A ― 1 0086 22 μmolmol
1 0086 22 μmolmol
Verification 1241 μmolmol
0096 39 μmolmol
A ― 1 0096 39 μmolmol
1114 0107 4 μmolmol
R1 3537 μmolmol
0009 479 μmolmol
A ― 1 0009 479 μmolmol
0026 37 0000 2500 μmolmol
R2 2002 μmolmol
0006 401 μmolmol
A ― 1 0006 401 μmolmol
0267 2 0001 710 μmolmol
R3 1241 μmolmol
0004 483 μmolmol
A ― 1 0004 483 μmolmol
0758 5 0003 400 μmolmol
total 0137 8
μmolmol
FTIR analysis
Source of uncertainty
Estimate xi
Value +-
Method of evaluation (type A or typeB)
Assumed probability distribution
Divisor
Standard uncertainty
u(xi)
Sensitivity coefficient
|ci|
Contribution
uⅰ(y)
Measurement
1389 μmolmol
0035 07 μmolmol
A ― 1 0035 07 μmolmol
1 0035 07 μmolmol
Verification 1241 μmolmol
0096 39 μmolmol
A ― 1 0096 39 μmolmol
1119 0107 9 μmolmol
R1 3537 μmolmol
0009 479 μmolmol
A ― 1 0009 479 μmolmol
0023 21 0000 2200 μmolmol
R2 2002 μmolmol
0006 401 μmolmol
A ― 1 0006 401 μmolmol
0270 3 0001 730 μmolmol
R3 1241 μmolmol
0004 483 μmolmol
A ― 1 0004 483 μmolmol
0752 9 0003 375 μmolmol
total 0113 5
μmolmol
19
Source of uncertainty
Estimate xi
Standard uncertainty
u(xi)
Sensitivity coefficient
|ci|
Contribution
uⅰ(y)
NDIR analysis
1382 μmolmol
0137 8 μmolmol
04043 0055 71 μmolmol
FTIR analysis
1389 μmolmol
0113 5 μmolmol
05957 0067 61 μmolmol
total 0087 61
μmolmol
Combined uncertainty 0087 61 μmolmol Coverage factor 2 Expanded uncertainty 018 molmol References 1) International Organization for Standardization ISO Guide 352017 Reference materials -- Guidance for characterization and assessment of homogeneity and stability
2) International Organization for Standardization ISO 6142-12015 Gas analysis -- Preparation of calibration gas mixtures -- Part 1 Gravimetric method for Class I mixtures
20
Measurement report VNIIM
Cylinder number 5904245
Measurement 1
Component Date (ddmmyy)
Result (micromolmol)
Standard deviation ( relative)
number of replicates
Ammonia 04042019 1456 08 10
Measurement 2
Component Date (ddmmyy)
Result (micromolmol)
Standard deviation ( relative)
number of replicates
Ammonia 04042019 1429 10 4x10
Measurement 3
Component Date (ddmmyy)
Result (micromolmol)
Standard deviation ( relative)
number of replicates
Ammonia 04042019 1437 06 4x10
Measurement 4
Component Date (ddmmyy)
Result (micromolmol)
Standard deviation ( relative)
number of replicates
Ammonia 21052019 1442 05 4x10
Results
Component Date (ddmmyy)
Result (micromolmol)
Expanded uncertainty (micromolmol)
Coverage factor
Ammonia 05062019 1441 023 2
Calibration standards
Calibration gas mixtures were prepared in accordance with [1] Preparation was carried out from pure substances in 3 dilution stages 1-st stage ndash 3 mixtures NH3N2 ndashlevel 33 2-nd stage ndash 3 mixtures NH3N2 ndashlevel 570 μmolmol 3-rd stage ndash 4 mixtures NH3N2 ndash level 12-15 μmolmol All the mixtures were prepared in Luxfer cylinders (V=5 dm3) with Aculife4+Aculife3 coating
21
Characteristics of pure substances used for preparation of the calibration standards are shown in the tables 1 and 2
Table 1 Purity table for N2 Monoblock Main component N2 Mole fraction 999998572
Component Mole fraction μmolmol
Standard uncertainty μmolmol
Ar 0916 0011
O2 00015 00009
CO2 00025 00014
H2 00025 00014
CH4 00025 00014
CO 00025 00014
H2O 050 005
Table 2 Purity table for NH3
Cylinder 666 Main component NH3 Mole fraction 999963
Component Mole fraction μmolmol Standard uncertainty μmolmol
C2H5OH 0160 0020
C2H7N 018 006
C3H9N 12 3
C4H8 [1-butene] 026 003
C6H6 00062 00016
C7H8 (toluene)] 040 005
C8H10 (ethylbenzene) 00018 00002
CH3OH 0140 0020
CO 72 12
CO2 00190 00020
H2O 150 20
N2 180 020
O2 00200 00020
o-C8H10 (о- xylene) 000120 000015
m-C8H10 (m- xylene) +p-C8H10 (p- xylene )
00056 00007
Verification measurements for the 1-st stage premixtures (33 ) were carried out by means of FTIR spectrometer FSM 1201 (Russia) uver01 rel Measurement for the 2-st stage premixtures (570 μmolmol) were carried out by means of UV-Vis-NIR spectrophotometer Cary 5000 (Agilent) uver03 rel Verification measurements for the final mixtures were carried out by Chromato-mass-spect-rometry uver 07 rel
22
All verification measurements consisted of checking consistency between the batch of similar prepared mixtures The values of ammonia amount of substance fraction in the calibration gas mixtures and their standard uncertainties are shown in the table 3 Table 3
Cylinder
number Component
Mole fraction (micromolmol)
Standard uncertainty due to
weighing and purity
(micromolmol)
D648608 NH3 12073 0011
D648609 NH3 13098 0012
D648610 NH3 14072 0013
D648618 NH3 14491 0015
Instrumentation
The instrument used for the measurements of the ammonia content in the comparison mixture (cylinder 5904245) is Chromato-mass-spectrometer laquoChromatec-Crystal 5000raquo (Russia)
Operating mode
Chromatographic column Rxi -1ms (Restek) Cat 43802 (20 m x 015 mmID x 20 microm)
Carrier gas High purity Helium 999999
Pressure at the inlet of the column
360 kPa
Carrier gas flow rate 11 mlmin
Split 150
Column oven temperature 160degС
SIM mz=17
Ionization mode EI
Ionization energy 70 eV
Sample volume 025 ml
Calibration method and value assignment
Single point calibration method was used to determine ammonia mole fraction in the
comparison gas mixture
Measurement sequence was in the order standardi - sample -ndash standardi
Each of the 4 measurement results was received under repeatability conditions with the
different calibration standards (table 3) Each of these 4 results is the mean from 4 series and
each series consisted of 10 sub-measurements
23
The amount of substance fraction for a sub-measurement was calculated according to the
formula 2)AA(
ACС
stst
xstx
+=
where Cx and Cst ndash amount of substance fractions of ammonia in the comparison and calibration mixtures Ax ndash analytical signal of ammonia in the comparison gas mixture
stAprime and stA primeprime analytical signals of ammonia in the calibration standard before and after
measurement of the comparison mixture Temperature corrections were not applied due to use of above-mentioned measurement
sequence Uncertainty evaluation
Uncertainty table Uncertainty source
Xi
Estimate
xi
molmol
Assumed
distribution
Standard
uncertainty
u(xi)
molmol
Sensitivity
coefficient
ci
Contribution to
standard
uncertainty
ui(y) molmol
Calibration standards
(weighing + purity)
14491 Normal 0015 0995 0015
Scatter of the results 1441 Normal 0116 1 0116
Combined standard uncertainty 0117 molmol
Coverage factor k=2
Expanded uncertainty 0234 molmol
Relative expanded uncertainty 16
References
[1] International Organization for Standardization ISO 61422001 Gas analysis ndash Preparation of calibration gas mixtures - Gravimetric methods 2nd edition
24
Measurement report VSL
Cylinder number 5904242
Measurement 1
Component Date (ddmmyy)
Result (micromolmol)
Standard deviation ( relative)
number of replicates
Ammonia 07-03-2019 14271 096 1
Measurement 2
Component Date (ddmmyy)
Result (micromolmol)
Standard deviation ( relative)
number of replicates
Ammonia 12-03-2019 14336 062 1
Measurement 34
Component Date (ddmmyy)
Result (micromolmol)
Standard deviation ( relative)
number of replicates
Ammonia 13-03-2019 14226 096 1
Results
Component Date (ddmmyy)
Result (micromolmol)
Expanded uncertainty (micromolmol)
Coverage factor
Ammonia 13-03-2019 1428 014 2
Calibration standards
The standards used by VSL are prepared gravimetrically but the gravimetric value is only used for amount fractions above 1000 micromolmol These mixtures are measured against each other to confirm internal consistency Mixture with a lower amount fraction are certified against PSMs in the range between 1000 and 5000 micromolmol A calibration curve is made using dynamic dilution with Thermal Mass Flow controllers and a certified value is assigned using ISO6143 The rational behind this scheme are the results from the European research project MetNH3 which showed that adsorption of ammonia on the internal cylinder surface was cylinder dependent and could be quantified [1] To eliminate stability effects the mixtures used in the assignment of the K117 cylinder were certified in a period of 2 months before or after the measurements of the K117 mixture
The gasses used for the preparation of the mixtures are Nitrogen 60 quality and Ammonia 40 quality For the purity table of the Ammonia manufacturer specifications are used except for the water impurity As it was not possible to assign a value to water in the pure Ammonia due to interference the water amount in a 5 ammonia in nitrogen mixture was measured and recalculated for the pure ammonia This amount is probably excessive but the difference between
4 If more than three measurements are taken please copy and insert a table of the appropriate format as necessary
25
no water and the assigned value gives a change in composition of only 006 rel The gravimetric preparation itself has an uncertainty of 0026 rel
26
27
Instrumentation
The instrument used to perform the measurements is an Innova 1412 Photo Acoustic analyser The mixtures were connected to the analyser using the method given in fig1 This ensures that there is no influence of individual pressure reducing valves as only on reducer is used in connection with 1 MFC The mixtures are connected over night and all lines as checked for leakage The cylinders to which to assign a value are not diluted (N2 flow zero) while the calibration standards are diluted to create the response curve The total flow is 1500 ml and the individual dilution flows are measured with a BIOS Drycal flowmeter
28
Fig 1- applying 2 multi position valves to connect multiple cylinders using 1 reducer and MFC
Calibration method and value assignment
Ten individual responses of the mixtures are collected and the average taken after 30 minutes flushing of the analyser The calibration curve and the assigned value are determined using ISO6143 To ensure that the mixing of the gas flows was not affected by the use of two MFCs the same dilutions were also measured using mol mixtures of O2 in N2 and measured against Oxygen PSMs on a Servomex paramagnetic analyzer
Uncertainty evaluation
Uncertainty component U U
Purity of ammonia 003
Gravimetric Preparation (first dilution) 0026
Gravimetric preparation (second dilution) 0026
Assignment certified values to calibration standards
0201
Dilution of calibration standards to range 10-17 micromolmol
0201
Value assignment according to ISO6143 030
Assigned value 050 1
1These values are added together because the dilution is a systematic effect and cannot be averaged out
29
References
[1] Janneke IT van Wijk etal Primary ammonia reference materials fulfilling EU quality data Gas Analysis 2017
30
Measurement report METAS
Cylinder number 5904243
Measurement 1
Component Date (ddmmyy)
Result (micromolmol)
Standard deviation ( relative)
number of replicates
Ammonia 11032019
14032019
1293 048 2
Measurement 2
Component Date (ddmmyy)
Result (micromolmol)
Standard deviation ( relative)
number of replicates
Ammonia 12032019 1300 049 1
Measurement 3
Component Date (ddmmyy)
Result (micromolmol)
Standard deviation ( relative)
number of replicates
Ammonia 12032019
14032019
1293 048 2
Measurement 4
Component Date (ddmmyy)
Result (micromolmol)
Standard deviation ( relative)
number of replicates
Ammonia 12032019
14032019
1293 048 2
Measurement 5
Component Date (ddmmyy)
Result (micromolmol)
Standard deviation ( relative)
number of replicates
Ammonia 12032019
13032019
1289 049 2
31
Results
Component Date (ddmmyy)
Result (micromolmol)
Expanded uncertainty (micromolmol)
Coverage factor
Ammonia 140319 1294 013 2
Calibration standards
We generated dynamically the calibration standards (permeation method [1]) using one of the METAS primary magnetic suspension balances (MSB Rubotherm GmbH Germany) a NH3 permeation unit of 9998 purity (Fine Metrology Srls Italy) and nitrogen 60 as matrix and dilution gas (Fig1) Total matrix and dilution gas flows were measured by calibrated flow meters placed before and after the MSB permeation chamber (Red-y GSC-B9TT-BB23 Voumlgtlin Instruments Switzerland)
Fig 1 Permeation system to generate the NH3 reference gas mixtures used to calibrate the analysers
The permeation rate ndash (3113 plusmn 27) ngmin (k = 2) at 48degC and 2600 hPa minus was estimated as the mass loss of the permeation unit during a period of 137 hours after a 3-day stabilization period within the MSB Calibration standards were produced using the first dilution system of the magnetic suspension balance (Fig 1) Different flow rates within the range between 10 L and 52 L were led to the mixing tee as shown in Fig 1 Calibration standard values were estimated using Eq 1
X NH3 = ((qmC PU (VMN2MNH3)) qv) + Xres NH3 [Eq 1]
where
XNH3 NH3 calibration standard (nmolmol) qmC permeation rate (gmin) PU purity of the permeation unit (09998) VM molar volume of the matrixdilution gas (mLmol) MNH3 molar mass of NH3 (gmol) qv total gas flow (matrix + dilution mLmin) XresNH3 residual amount fraction of NH3 in the matrixdilution gas (nmolmol)
Each calibration standard was generated for 90 minutes the first 60 minutes were considered the stabilization time of the system and the last 30 minutes the measuring period
Instrumentation
32
We used two calibrated NH3 analysers based on cavity ring-down spectrometry for this key comparison G2103 (SN 1283-AEDS-2035) and G1103t (SN 127-CPVU-AF004) (Picarro Inc CA USA) Cavity and sampling handling of the analyser G2103 are coated with SilcoNert 2000 The minimum sample flow rates of the analysers were 08 slm (G1103t) and 18 slm (G2103) We placed a distribution tee at the supply inlet of the analysers to ensure overflow The gas mixtures were fed to one end of the distribution tee through a coated tube (SilcoNert 2000 18) and a particle filter The particle filter in G2103 analyser was a coated in-line-filter with nominal pore dimension of 05 microm (SS-4F-05 Swagelok) The particle filter in G1003t analyser was a PFTE membrane filter with nominal pore dimension of 5 microm within a PFA filter holder (TE 47 supporting fabric PES Whatman Switzerland) We connected the other end of the distribution tee to a flowmeter (serie 1350 Wisag AG Switzerland) the overflow was then fed to the exhaust tube G2103 and G1003t analysers recorded reading values every 1 and 3 seconds respectively
Calibration method and value assignment
We let the two NH3 analysers running for 24 hours with nitrogen 60 for stabilization purposes before calibrating them For both analysers nitrogen 60 was concentration zero We produced 5 calibration standards between 79 and 212 nmolmol to calibrate G2103 and 4 calibration standards between 81 and 404 nmolmol to calibrate G1103t For each calibration standard the amount fraction value read by the analyser was the average reading of the last-30 minutes of generation
We obtained one calibration curve per analyser [Eq 2] by linear regression using the least square method [2] Table 1 includes values of the calibration curve parameters for each analyser
Xread = a + b Xgen [Eq 2]
where
Xread average analyser readings of the last 30 minutes of generation (nmolmol) a intercept of the linear regression (nmolmol) b slope of the linear regression Xgen average of the amount fraction generated by the permeation method during the last
30 minutes of generation (nmolmol)
Table 1 Calibration curve parameters of the used NH3-analysers
Analyser Intercept (a) (nmolmol)
Slope (b) Number of observations
G2103 0714 10056 518
G1103t 0057 09996 1988
In order to assign the transfer standard value we generated several gas mixtures within the calibration range of the analysers by diluting the transfer standard We used a dilution system (Fig 2) formed by a compact pressure regulator (KCP1GRM2D1P20000 Swagelok Company OH USA) two critical orifices (LNI Swissgas SA Switzerland) two pressure controllers (Bronkhorst High-Tech BV the Netherlands) one mass flow controller (GSC Red-y Voumltglin Instruments GmbH Switzerland) All the listed elements as well as the tubing of the dilution system were coated (SilcoNert 2000 SilcoTek Corporation PA USA) All the flows of the dilution system (ie critical orifices MFC) were calibrated with the primary volumetric standard of METAS
33
Fig 2 Dilution system for the transfer standard using a cascade of critical orifices
We used a lab water bath to keep the critical orifices at 220degC We monitored the water temperature with a calibrated NTC thermistor connected to a multimeter (Almemo 2390-5 Ahlborn Mess- und Regelungstechnik GmbH Germany) Pressure before the critical orifices was kept at 900 bar with the pressure reduction valve After the first critical orifice we regulated the pressure at 400 bar using one of the pressure controllers The dilution gas (N2 60) was led at different flow rates to the mixing tee located after the cascade of critical orifices through the mass flow controller We regulated the pressure after the mixing coil at 100 bar
We generated each gas mixture for 120 minutes 80 minutes of system stabilization (including analysers) and 40 minutes of measurement For the first gas mixture generated we increased the time up to 360 minutes to account for stabilization time of the critical orifices (240 minutes) We performed 5 measurements with two replicates each except for the second measurement (one replicate) The first replicate of each measurement took place before the homogenization of the transfer standard which happened on 13032019 for 4 hours The temperature in the lab during the measurements was (200 plusmn 10)degC
The amount fractions read by the analysers were corrected using the calibration equation to estimate the amount fraction generated by the dilution system (Eq 3)
XNH3 = (Xread - a) b [Eq 3]
where
XNH3 amount fraction generated by the dilution system (nmolmol)
Xread amount fraction read by the analysers (nmolmol)
a intercept of the linear regression (nmolmol) (Table 1)
b slope of the linear regression (Table 1)
We estimated the amount fraction of NH3 in the transfer standard for each replicate (Eq 4)
Xcyli = (XNH3 (qvMFC + qvco) qvco) + XresNH3 [Eq 4]
where
Xcylij NH3 amount fraction in transfer standard estimated during measurement i (i = 1hellip5)
replicate j (i = 1 2) (nmolmol)
XNH3 NH3 amount fraction generated by the dilution system (nmolmol)
qvMFC diluting gas flow (mLmin)
qvco transfer standard flow through the critical orifices (mLmin)
XresNH3 residual NH3 amount fraction in the diluting gas (nmolmol)
The resulting amount fraction values of each pair of replicates were average to get a single value per
measurement
The final amount fraction value assigned to the transfer standard was the average of the five
measurements (Eq 5)
34
Xcyl5904243 = ((Xcylm1 + Xcylm2 + Xcylm3 + Xcylm4 + Xcylm5) 5 ) 10-3 [Eq 5]
where
Xcyl5904243 NH3 amount fraction assigned to the transfer standard 5904243 (micromolmol)
Xcylm1 NH3 amount fraction estimated in measurement 1 (average 2 replicates) (nmolmol)
Xcylm2 NH3 amount fraction estimated in measurement 2 (nmolmol) Xcylm3 NH3 amount fraction estimated in measurement 3 (average 2 replicates)
(nmolmol) Xcylm4 NH3 amount fraction estimated in measurement 4 (average 2 replicates)
(nmolmol) Xcylm5 NH3 amount fraction estimated in measurement 5 (average 2 replicates)
(nmolmol) Uncertainty evaluation
We evaluated the measurement uncertainty for this key comparison using the software GUM Workbench Pro (version 241 Metrodata GmbH Germany sn 05-24-00002020-0) The uncertainty propagation through the calculation followed the GUM rules [3] The main contributions to the combined standard uncertainty were the slope dispersion of the temporal mass loss of the permeation unit and the standard uncertainties of the flow measurements of the critical orifices used in the dilution system
Model equations
Uncertainty contribution of the magnetic suspension balance qm(m1m2t1t2SC) = ((((m1 - NP1) Kkalread1) - ((m2 - NP2) Kkalread2)) Kkal (t2 - t1)) SC 10^9
Kkal = Kalhigh-Kallow
Kkalread1 = Kalhighread1 - Kallowread1
Kkalread2 = Kalhighread2 - Kallowread2
Uncertainty contribution of the permeation unit used to generate reference gas mixtures to calibrate the
analysers
qmC = qm(m1Cm2Ct1Ct2CSC)
Uncertainty contribution of the reference gas mixtures VMN2 = 1000 (2 MN) dN2
MNH3 = MN + 3 MH
XMSB(qmC PU VMN2 MNH3 qv XresNH3)= ((qmCPU(VMN2MNH3))qv) + XresNH3
Example for G1103t analyser X0MSBe = 0 + XresNH3 0 ppb
X1MSBe = XMSB(qmC PU VMN2 MNH3 qv1e XresNH3)
[hellip]
X4MSBe = XMSB(qmC PU VMN2 MNH3 qv4e XresNH3)
Xgenemean = (X0MSBe + X1MSBe + X2MSBe + X3MSBe + X4MSBe) 5
Xreademean = (X0eread + X1eread + X2eread + X3eread + X4eread) 5
Linear regression of the calibration least square method Xread = a + b Xgen
Example for G1103t analyser be = pe qe
pe = (X0MSBe - Xgenemean) (X0eread - Xreademean) + (X1MSBe - Xgenemean) (X1eread - Xreademean) +
(X2MSBe - Xgenemean) (X2eread - Xreademean) + (X3MSBe - Xgenemean) (X3eread - Xreademean) +
(X4MSBe - Xgenemean) (X4eread - Xreademean)
qe = (X0MSBe - Xgenemean)^2 + (X1MSBe - Xgenemean)^2 + (X2MSBe - Xgenemean)^2 + (X3MSBe - Xgenemean)^2 +
(X4MSBe - Xgenemean)^2
ae = Xreademean - be Xgenemean
35
Uncertainty contribution of the dilution system used to generate the calibration standards XNH3(Xread a b) = (Xread - a) b
Measurement 1
X11NH3 = XNH3(Xread11 ae be)
X12NH3 = XNH3(Xread12 ae be)
[hellip]
Measurement 5 X51NH3 = XNH3(Xread51 am bm)
X52NH3 = XNH3(Xread52 am bm)
Xcyl(XNH3 qvMFC qvco XresidualNH3) = (XNH3 (qvMFC + qvco) qvco ) + XresNH3
Example Measurement 1
Xcylm11= Xcyl(X11NH3 qvMFCdil11 qvco XresNH3)
Xcylm12 = Xcyl(X12NH3 qvMFCdil12 qvco XresNH3)
Xcylm1 = ((Xcylm11 + Xcylm12) 2) 1000
Amount fraction NH3 in gas cylinder to calibrate Xcyl5904243 = ((Xcylm1 + Xcylm2 + Xcylm3 + Xcylm4 + Xcylm5) 5)
Quantity Unit Definition
NP1 g uncertainty contribution of the zero point correction correction of lift change at time 1 due to atmospheric pressure variation
Kkalread1 g differences between the readings of the calibration masses during time 1
NP2 g uncertainty contribution of the zero point correction correction of lift change at time 2 due to atmospheric pressure variation
Kkalread2 g differences between the readings of the calibration masses during time 2
Kkal g mass difference between the calibration masses according to certificate
Kalhigh g heavy calibration mass
Kallow g light calibration mass
Kalhighread1
g balance reading of heavy calibration mass at time 1
Kallowread1
g balance reading of light calibration mass at time 1
Kalhighread2
g balance reading of heavy calibration mass at time 2
Kallowread2
g balance reading of light calibration mass at time 2
qmC ngmin permeation rate at 48degC and 2600 hPa
m1C g permeator mass at time 1
m2C g permeator mass at time 2
t1C min time1
t2C min time2
SC uncertainty contribution of the slope dispersion (relative standard deviation of single measurement) VMN2 mLmo
l molar volume N2 (dilution gas)
MN gmol N atomic mass
dN2 gL density N2 (dilution gas)
MNH3 gmol NH3 molar mass
MH gmol H atomic mass
X0MSBe ppb calibration amount fraction (0 ppb) (G1103t analyser)
XresNH3 ppb residual NH3 in dilution gas
XiMSBe ppb calibration amount fraction i (i = 1 hellip 4) (G1103t analyser)
PU purity of the permeator (from 0 to 1)
qvie mLmin
flow MFM (dil1) calibration point i (i = 1 hellip 4) (G1103t analyser)
Xgenemean ppb average amount fraction NH3 generated for calibration G1103t analyser
Xreademean ppb average amount fraction NH3 read by G1103t analyser
36
Quantity Unit Definition
Xieread ppb read amount fraction i (i = 0 hellip 4) (G1103t analyser)
Xreadmmea
n ppb average amount fraction NH3 read by G2103 analyser
Ximread ppb read amount fraction i (i = 0 hellip 5) (G2103 analyser)
be slope of the linear regression (G1103t analyser)
ae ppb intercept of the linear regression (G1103t analyser)
XijNH3 ppb amount fraction ij (i = 1 hellip 5 j = 1 2) generated for calibration gas cylinder
Xreadij ppb amount fraction read by the analyser during the generation of XijNH3
Xcylmij ppb amount fraction estimated in measurement i (i = 1hellip5) replicate j (j = 1 2)
qvMFCdilij mLmin
average flow MFC measurement 1 i (i = 1hellip5) replicate j (j = 1 2)
qvco mLmin
flow critical orifices dilution system
Xcylmi ppm average amount fraction NH3 measurement i (replicates 1 and 2)
Xcyl5904243 ppm amount fraction NH3 in cylinder intercomparison CCQM-K117 (average 5 measurements)
Uncertainty budget of the amount fraction NH3 in cylinder 5904243
Quantity Value Standard
Uncertainty
Distribution Sensitivity
Coefficient
Uncertainty
Contribution
Index
NP1 00 g 289middot10-9 g rectangular -5000 -15middot10-3 ppm 00
NP2 00 g 289middot10-9 g rectangular 5000 15middot10-3 ppm 00
Kalhigh 299923070 g 250middot10-6 g normal 059 15middot10-6 ppm 00
Kallow 79516970 g 200middot10-6 g normal -059 -12middot10-6 ppm 00
m1C 22667813150 g 289middot10-9 g rectangular 5000 15middot10-3 ppm 00
m2C 22665248260 g 289middot10-9 g rectangular -5000 -15middot10-3 ppm 00
t1C 42990500 min 00250 min normal 16middot10-3 39middot10-6 ppm 00
t2C 125393200 min 00250 min normal -16middot10-3 -39middot10-6 ppm 00
SC 100000 440middot10-3 normal 13 0057 ppm 844
MN 14006855 gmol 174middot10-6 gmol triangular 016 28middot10-6 ppm 00
dN2 1250100 gL 150middot10-6 gL normal -10 -15middot10-3 ppm 00
MH 10079750 gmol 551middot10-6 gmol triangular -23 -130middot10-6 ppm 00
XresNH3 0300 ppb 0122 ppb triangular 010 0013 ppm 42
PU 09998000 816middot10-6 triangular 13 11middot10-3 ppm 00
qv1e 505412 mLmin 505 mLmin normal -210middot10-6 -11middot10-3 ppm 00
qv2e 283349 mLmin 283 mLmin normal -610middot10-6 -17middot10-3 ppm 00
qv3e 182734 mLmin 183 mLmin normal -13middot10-3 -23middot10-3 ppm 01
qv4e 101334 mLmin 101 mLmin normal -26middot10-3 -26middot10-3 ppm 02
qv1m 517612 mLmin 518 mLmin normal -120middot10-6 -600middot10-6 ppm 00
qv2m 432371 mLmin 432 mLmin normal -170middot10-6 -720middot10-6 ppm 00
qv3m 334264 mLmin 334 mLmin normal -280middot10-6 -930middot10-6 ppm 00
qv4m 233309 mLmin 233 mLmin normal -560middot10-6 -13middot10-3 ppm 00
qv5m 192960 mLmin 193 mLmin normal -820middot10-6 -16middot10-3 ppm 00
X0eread 04070 ppb 00148 ppb normal -0015 -220middot10-6 ppm 00
X1eread 831070 ppb 00203 ppb normal -0013 -270middot10-6 ppm 00
X2eread 1468460 ppb 00192 ppb normal -0012 -230middot10-6 ppm 00
X3eread 2258690 ppb 00496 ppb normal -0010 -510middot10-6 ppm 00
X4eread 407316 ppb 0120 ppb normal -65middot10-3 -780middot10-6 ppm 00
X0mread 029100 ppb 794middot10-3 ppb normal -77middot10-3 -61middot10-6 ppm 00
37
Quantity Value Standard
Uncertainty
Distribution Sensitivity
Coefficient
Uncertainty
Contribution
Index
X1mread 792370 ppb 00108 ppb normal -76middot10-3 -82middot10-6 ppm 00
X2mread 951300 ppb 00126 ppb normal -76middot10-3 -96middot10-6 ppm 00
X3mread 12311600 ppb 911middot10-3 ppb normal -76middot10-3 -69middot10-6 ppm 00
X4mread 1758460 ppb 00230 ppb normal -75middot10-3 -170middot10-6 ppm 00
X5mread 2123110 ppb 00223 ppb normal -75middot10-3 -170middot10-6 ppm 00
Xread11 1234340 ppb 00118 ppb normal 0011 120middot10-6 ppm 00
Xread12 1221120 ppb 00119 ppb normal 0011 130middot10-6 ppm 00
Xread21 1088070 ppb 00122 ppb normal 0024 290middot10-6 ppm 00
Xread31 2232720 ppb 00132 ppb normal 58middot10-3 77middot10-6 ppm 00
Xread32 2224780 ppb 00139 ppb normal 58middot10-3 81middot10-6 ppm 00
Xread41 12120000 ppb 416middot10-3 ppb normal 0011 44middot10-6 ppm 00
Xread42 12149700 ppb 408middot10-3 ppb normal 0011 43middot10-6 ppm 00
Xread51 10690500 ppb 398middot10-3 ppb normal 0012 48middot10-6 ppm 00
Xread52 10637900 ppb 429middot10-3 ppb normal 0012 52middot10-6 ppm 00
qvMFCdil11 220138 mLmin 220 mLmin normal 590middot10-6 13middot10-3 ppm 00
qvco 208600 mLmin 00313 mLmin normal -061 -0019 ppm 97
qvMFCdil12 220140 mLmin 220 mLmin normal 580middot10-6 13middot10-3 ppm 00
qvMFCdil21 250173 mLmin 250 mLmin normal 10middot10-3 26middot10-3 ppm 02
qvMFCdil31 120028 mLmin 120 mLmin normal 11middot10-3 13middot10-3 ppm 00
qvMFCdil32 120028 mLmin 120 mLmin normal 11middot10-3 13middot10-3 ppm 00
qvMFCdil41 220139 mLmin 220 mLmin normal 580middot10-6 13middot10-3 ppm 00
qvMFCdil42 220138 mLmin 220 mLmin normal 580middot10-6 13middot10-3 ppm 00
qvMFCdil51 250172 mLmin 250 mLmin normal 510middot10-6 13middot10-3 ppm 00
qvMFCdil52 250171 mLmin 250 mLmin normal 510middot10-6 13middot10-3 ppm 00
Xcyl5904243 129369 ppm 00618 ppm
References
[1] ISO 6145-102002 Gas analysis ndash Preparation of calibration gas mixtures using dynamic volumetric methods ndash Part 10 Permeation method
[2] Cantrell CA (2008) Technical Note Review of methods for linear least-squares fitting of data and application to atmospheric chemistry problems Atmospheric Chemistry and Physics 8 5477 ndash 5487
[3] Joint Committee for Guides in Metrology Evaluation of measurement data ndash Guide to the expression of uncertainty in measurement (GUM) JCGM 1002008 httpswwwbipmorgutilscommondocumentsjcgmJCGM_100_2008_Epdf
38
Measurement report KRISS
Cylinder number D597002
Measurement 1
Component Date (ddmmyy)
Result (micromolmol)
Standard deviation ( relative)
number of replicates
Ammonia 280119 1355 03 3
Measurement 2
Component Date (ddmmyy)
Result (micromolmol)
Standard deviation ( relative)
number of replicates
Ammonia 290119 1360 04 3
Measurement 35
Component Date (ddmmyy)
Result (micromolmol)
Standard deviation ( relative)
number of replicates
Ammonia 300119 1356 01 3
Results
Component Date (ddmmyy)
Result (micromolmol)
Expanded uncertainty (micromolmol)
Coverage factor
Ammonia 1357 015 2
Calibration standards
‒ Method of preparation
Gas mixtures were prepared gravimetrically and their masses were determined using an automated top-pan balance (XP26003L Mettler Toledo) with 26 kg capacity and 1 mg resolution
‒ Weighing data
Primary reference gas mixtures which were used to analyse a key comparison sample were prepared with 3-step dilutions from a pure material to a range of from about 10 μmolmol to about 17 μmolmol
5 If more than three measurements are taken please copy and insert a table of the appropriate format as necessary
39
Gravimetric preparation hierarchy
‒ Purity tables (composition) of the parent gases
Components Amount fraction (μmolmol)
Distribution Standard uncertainty (μmolmol)
Analytical methods
He 05 Rectangular 029 MS
Ar 05 Rectangular 029 MS
N₂ 587 Normal 117 GCDID
H₂ 05 Rectangular 029 GCDID
O₂ 05 Rectangular 029 GCDID
CO₂ 342 Normal 068 GCDID
CO 05 Rectangular 029 GCDID amp FTIR
H₂O 272 Normal 815 FTIR
CH₄ 05 Rectangular 029 GCDID amp FTIR
THC 469 Normal 094 GCFID
NO 25 Rectangular 144 FTIR
NO₂ 25 Rectangular 144 FTIR
N₂O 25 Rectangular 144 FTIR
NH₃ 999704 9031
‒ Physical adsorption loss
In order to estimate physical adsorption loss onto the internal surface of a sample cylinder at about 13 μmolmol using cylinder-to-cylinder division method (Lee et al 2017) a newly prepare primary reference gas mixture (Performax D716756) was divided into another new cylinder (Performax D716790) and then analysed against each other Results from multiple analysis show that a response ratio (daughter to mother) is significantly less than 1 which indicates physical adsorption loss occurred during or a short time after the preparation Therefore gravimetrically determined amount fractions
20000 μmolmol
ME5696
NH₃
500 μmolmol
D746900
NH₃
500 μmolmol
D746904
NH₃
500 μmolmol
D746907
NH₃
500 μmolmol
D746901
NH₃
9997 cmolmol
NH₃
20000 μmolmol
MD2562
NH₃
136 μmolmol
D716752
NH₃
135 μmolmol
D716756
NH₃
164 μmolmol
D726465
NH₃
107 μmolmol
D716787
NH₃
135 μmolmol
NH₃
Physical adsorption loss
6L AL Luxfer
10L AL Luxfer
10L Performax
Pure NH₃
40
and their uncertainties are recalculated to account the physical adsorption loss on the cylinder internal surface
Results from Cylinder-to-cylinder division
‒ Verification measures
Primary reference gas mixtures were analysed to verify their gravimetric preparation using NDIR analyser (ULTRAMAT 6 Siemens) Results show that primary reference gas mixtures agree well within their associated uncertainties of about 1 (k = 2)
Results from verification measurement
Instrumentation
A NDIR gas analyser was used to verify primary reference gas mixtures and analyse a sample for this key comparison
Calibration method and value assignment uncertainty evaluation
A sample for this comparison was analysed against a KRISS primary reference gas mixture (D716752) using a NDIR gas analyser The sample analysis has done by alternating between the gas mixtures (ie PRMKRISS ndash PRMKC ndash PRMKRISS ndash PRMKC ndash PRMKRISS ndash PRMKC ndash PRMKRISS) at three different days The amount fraction of the KC sample cylinder is determined by the following equation for each measurement
119909119870119862119894119895 = 119909119870119877119868119878119878 times 119877119894119895
0973
096
097
098
099
100
101R
esp
on
se r
atio
(dau
ghte
rm
oth
er)
D716787 D726465 D716752 D716756
1000 1004 1005 1000
1000
1004 1005
1000
097
098
099
100
101
102
103
No
rmal
ize
d s
en
siti
vity
NH₃ (10 micromolmol - 17 micromolmol)
41
119906(119909119870119862119894119895) = 119909119870119862119894119895 times radic(119906(119909119870119877119868119878119878
119909119870119877119868119878119878)
2
+ (119906(119877119894119895)
119877119894119895)
2
where 119909119870119862119894119895 is the amount fraction of KC gas mixture 119909119870119877119868119878119878 is the amount fraction of KRISS
PRM and 119877119894119895 is the analyserrsquos response ratio of 15 repeated measurements (ie response of
PRMKC to response of PRMKRISS) At three different days (i=1 2 3) three repeated measurements (j= 1 2 3) have been conducted The total number of measurements are 9 for three days
average 1st analysis 2nd analysis
3rd analysis
1st day measurement 1199091198701198621119886119907119892 11990911987011986211 11990911987011986212 11990911987011986213
2nd day measurement 1199091198701198621119886119907119892 11990911987011986221 11990911987011986222 11990911987011986223
3rd day measurement 1199091198701198621119886119907119892 11990911987011986231 11990911987011986232 11990911987011986233
Reported final results 119961119922119914119943 119958(119961119922119914119943)
119909119870119862119894119886119907119892 =1199091198701198621198941 + 1199091198701198621198942 + 1199091198701198621198943
3
119909119870119862119891 =1199091198701198621119886119907119892 + 1199091198701198622119886119907119892 + 1199091198701198623119886119907119892
3
Uncertainty budget of reported final results (119961119922119914119943)
Uncertainty component
Standard uncertainty
μmolmol
Contribution to uncertainty
Analytical repeatability
0033 187
Analytical reproducibility
0014 36
KRISS PRM 0067 777
Combined 0076
Important note
The pressure of the key comparison sample cylinder was checked as about 250 psig prior its analysis The residual pressure was checked as 200 psig after the analysis and returned to NIST
References
42
Lee et al 2017 Determination of physical adsorption loss of primary standard gas mixtures in cylinders using cylinder-to-cylinder division Metrologia 54 L26
43
Measurement report NIM
Cylinder number 5904239
Measurement 1
Component Date (ddmmyy)
Result (micromolmol)
Standard deviation ( relative)
number of replicates
Ammonia 23042019 1394 052 4
Measurement 2
Component Date (ddmmyy)
Result (micromolmol)
Standard deviation ( relative)
number of replicates
Ammonia 24042019 1385 026 4
Measurement 36
Component Date (ddmmyy)
Result (micromolmol)
Standard deviation ( relative)
number of replicates
Ammonia 25042019 1389 081 4
Measurement 4
Component Date (ddmmyy)
Result (micromolmol)
Standard deviation ( relative)
number of replicates
Ammonia 26042019 1374 033 4
Results
Component Date (ddmmyy)
Result (micromolmol)
Expanded uncertainty (micromolmol)
Coverage factor
Ammonia 26042019 1385 020 2
1 Calibration standards
11 Preparation method and cylinder treatment
The standards were prepared by gravimetric method all the cylinders used were pumped to lower than 1times10-4 Pa a 65 heating temperature was set and lasted for more than 8 hours to remove moisture in cylinders at the same time
12 Filling and weighing
Three steps were selected to fill gas to targeted concentration from pure ammonia and pure nitrogen
6 If more than three measurements are taken please copy and insert a table of the appropriate format as necessary
44
The first step pure NH3 and pure N2 were added into cylinder to gain mole fraction of 2 mol∙mol-
1
The second step 2 mol∙mol-1 NH3N2 was further diluted by nitrogen to reach a more lower concentration of 300 μmol∙mol-1
The third stepthe two standards were finally prepared by diluting 300 μmol∙mol-1 NH3N2
The typical amount of gas filled in each step is presented in Fig 1 The balance used is Metter XP26003L capacity 26 kg Readability 1 mg A substitution method (A-B-A) was selected when weighing here A represents reference cylinder B represents sample cylinder
Concentrationrsquos calculation equation is according to ISO 6142
=
=
=
=
=
P
A
n
i
iAi
A
P
A
n
i
iAi
AAi
i
Mx
m
Mx
mx
x
1
1
1
1
)(
)(
Figure 1 Three filling steps with added gas weight each
13 Purity data of parent gases
Purity data of parent gases N2 and NH3 are shown in Table 1 and Table 2 with the analysis method for common impurity components
300μmolmol NH3N2
c=29999 μmol∙mol-1
2 NH3N2
c=19985 mol∙mol-1
Pure NH3
N2 +1142846g
NH3+14168g
N2 +1138826 g
2NH3N2+17218g
g
N2 + 647420 g
003NH3N2+ 31529g
N2 + 660249 g
003NH3N2+30963
g
1396 μmol∙mol-1 NH3N2
1346 μmol∙mol-1 NH3N2
45
Table 1 Purity of N2
Component Method Mole fraction (μmol∙mol-1)
Distribution Uncertainty (μmol∙mol-1)
O2 Oxygen Analyzer 0030 Rectangular 0014
Ar GC-PDHID 500 Normal 29
H2 GC-PDHID 005 Rectangular 003
H2O CRDs 010 Rectangular 006
CO GC-PDHID 0030 Rectangular 0014
CO2 GC-PDHID 0010 Rectangular 0006
CH4 GC-PDHID 0030 Rectangular 0014
N2 - 9999497 - 29
Table 2 Purity of NH3
Component Method Mole fraction (μmol∙mol-1)
Distribution Uncertainty (μmol∙mol-1)
Ar GC-PDHID 0350 Normal 0035
O2 GC-PDHID 079 Normal 008
THC (CH4) GC-PDHID 0010 Rectangular 0006
H2O - 10 Rectangular 06
N2 GC-PDHID 17 Normal 05
NH3 - 9999962 - 08
14 Verification of standards
In the verification measurements the two intermediate mixed gases of 300μmol∙mol-1 NH3N2 obtained from two different filling route were verified through FTIR one cylinder was chose as standard with which the other cylinder was calibrated the results showed the these two cylinders have good consistency their difference between gravimetric mole fraction and the calibrated mole fraction was smaller than 01 Similarly for the final standards each concentration point (135 μmol∙mol-1 and 139 μmol∙mol-1) was prepared two cylinders the differences between each two cylinders were both smaller than 02
2 Instrumentation
The main instrument used in this comparison is FT-IR Spectrometer with the trade name MultiGasTM analyzer (Models 2032 MKS company) which equipped with necessary components for this kind of instrument The detector is mercury-cadmium-telluride (MCT) which is cooled by a thermo-electrically mode The sample cell has a path length of 511m The resolution is 1 cm-1 the scan number for each spectrum was set at 120 with a total scan time of 1 minute To obtain a
46
clean background the whole system was purged by high-purity nitrogen of which the flow was set at 200 mL∙min-1 for sample cell and 800 mL∙min-1 for other parts of the spectrometer Besides the temperature for the sample cell was kept at 357 and its inner pressure was equal to the ambient atmospheric pressure Two absorption regions (3166~3285) cm-1 and (3409~3475) cm-
1 were selected to determinate the targeted analyte while the reading was obtained through automatically integrating by the instrument itself
3 Calibration method and value assignment
As for the calibration of the comparison sample two-points calibration method was used As shown in Figure 2 standard 1 represents the lower concentration point 1346 μmol∙mol-1 NH3N2 and standard 2 represents the higher concentration point 1396 μmol∙mol-1 NH3N2 When sampling the flow was kept at 200 mL∙min-1 and lasted for at least 1 hour to make reading stabilization The assigned value was calculated in the following formulae
( )
( )( )2 1
0 1 0 1
2 1
C CC C R R
R R
minus= + minus
minus
Here C0 represents the mole fraction of the comparison sample C1 represents the mole fraction of the standard 1 at lower concentration point C2 represents the mole fraction of the standard 2 at higher concentration point R0 represents the instrument reading from the comparison sample R1 represents the instrument reading from the standard 1 at lower concentration point R2 represents the instrument reading from the standard 2 at higher concentration point
Figure 2 Measurement setup
Uncertainty evaluation
The contributions to combined standard uncertainty were from preparation of
gravimetric method repeatability of verification in one day and in different days 2
2
2
1
2
ververprepc uuuu ++=
Here u means relative standard uncertainty
uc Combined uncertainty of assigned concentration value of NH3 in the comparison
cylinder
uprep Uncertainty from gravimetrical preparation
uver1 Uncertainty from repeatability of verification in one day
uver2 Uncertainty from repeatability of verification in different 4 days
V-4
Multi-Channel
Valve
Outlet
Comparison Sample
Standard 1
Standard 2
FT-IR
Spectrometer
MFC
47
Table 3 Uncertainty budget
Source of uncertainty uprep uver1 uver2
Relative standard uncertainty 03 05 04
Relative expanded uncertainty 15 ( k=2 )
48
Measurement report NIST
Cylinder number 5904173
Measurement 1
Component Date (ddmmyy)
Result (micromolmol)
Standard uncertainty (micromolmol)
number of replicates
Ammonia 231018 1360 021 6
Measurement 2
Component Date (ddmmyy)
Result (micromolmol)
Standard uncertainty (micromolmol)
number of replicates
Ammonia 231018 1360 032 6
Measurement 3
Component Date (ddmmyy)
Result (micromolmol)
Standard uncertainty (micromolmol)
number of replicates
Ammonia 231018 1362 019 6
Measurement 4
Component Date (ddmmyy)
Result (micromolmol)
Standard uncertainty (micromolmol)
number of replicates
Ammonia 241018 1370 024 6
Measurement 5
Component Date (ddmmyy)
Result (micromolmol)
Standard uncertainty (micromolmol)
number of replicates
Ammonia 241018 1367 025 6
Measurement 6
Component Date (ddmmyy)
Result (micromolmol)
Standard uncertainty (micromolmol)
number of replicates
Ammonia 241018 1370 042 6
Results
Component Date (ddmmyy)
Result (micromolmol)
Expanded uncertainty (micromolmol)
Coverage factor
Ammonia 251018 1364 020 k=2
Calibration standards
Since NIST does not house primary standard mixtures (PSMs) of NH3 in the amount-of-substance fraction range of 10 micromolmol ndash 30 micromolmol standards were prepared by use of a permeation device system (PDS) Permeation tubes were purchased that were 65 cm in length with a nominal permeation rate of 2860 ngmin plusmn 15 at 34ordm C Four permeation tubes were inserted into the
49
permeation device system (PDS) which was setup in continuous-weighing-mode in compliance with ISO 6145 Part 10 [1] and internal procedures The mass of the four NH3 permeation tubes was measured every fifteen minutes using a Rubotherm magnetic suspension balance The mass resolution of the balance is 0001 mg The total gas flow from the PDS was measured by a DH Instruments (DHI) MolBloc (1E3 Series) flow meter to an uncertainty of 01 relative The MolBoc had been previously calibrated by flowing known masses of nitrogen across the flow meter following internal procedures See figure 1 for permeation schematic setup The gas flow over the permeation tubes was kept constant at 800 mlmin By varying the dilution gas flow a suite of NH3 standards could be produced on demand A permeation rate in g min-1 was determined for the mean amount-of-substance fraction to be analyzed using equation 1 and was converted to mol min-1 using equation 2 Permeation Rate (g min-1) (Eq 1)
Permeation Rate (mol min-1) (Eq 2)
qm Perm Rate (g min-1)
M Molar Mass of Ammonia (g)
Figure 2 Schematic of the basic elements of the Permeation Device System
qm Permeation Rate (g min-1)
m Mass (g)
t time (min)
119902m = 119904119897119900119901119890 |Δ119898
Δ119905| sdot 106
119902m =119902m
119872
50
Impurity Analysis The purchased tubes were stated to be ge 99999 pure from the manufacturer The dilution gas used for generating the standard was N2 nominal purity was ge 99999 Impurity data was obtained for the permeation tubes from the manufacturer and were stated to be
Component Amount-of-substance fraction
Carbon Dioxide lt 1 micromolmol Carbon Monoxide lt 01 micromolmol Methane lt 01 micromolmol Water lt 2 micromolmol
Impurity data for the gas generated by the permeation tubes was obtained by diverting the gas flow stream from the permeation device system to a Nicolet Nexus 670 fourier-transform infrared spectroscopy (FTIR) instrument with a mercury cadmium telluride (MCT) detector The FTIR was also equipped with a 15L Specac 10 meter fixed path length Cyclone gas cell The gas cell was filled with dilution gas in this case nitrogen and a background was obtained A second analysis of the nitrogen was obtained to verify that a background subtraction was occurring and that there was no ammonia present in the matrix gas The gas cell was then filled with the unknown gas sample to 800 torr and vacuum evacuated This purge cycle was repeated six times After the sixth evacuation cycle the gas was set to continuously flow while maintaining a cell pressure of 760 torr Six spectra were then collected at 256 scans with a resolution of 05 cm-1 and averaged together See Figure 2 for comparative spectra of the matrix gas and perm tube flow Impurities were evaluated from the resulting spectra with nothing measurable being detected above baseline therefore the purity of the permeation tubes is the stated ge 99999
51
Figure 2 Nitrogen background and perm tube gas spectra
Instrumentation The ammonia (NH3) component of the unkown sample (Cylinder 5904173) was analyzed by chemiluminescence (Eco Physics Model CLD 844) Delivery pressure (10 psig) to the analyzer was controlled by a high purity stainless steel two stage regulator dedicated to ammonia service (DIN14) The regulator was purged for one hour at a sample gas flow rate of approximately 300 mLmin before data analysis was conducted From this sample flow an analysis range was established based on the nominal amount-of-substance fraction from the cylinder The analyzer was purged (at a flow of approximately 300 mlmin) for five minutes before sample data was collected
Calibration method and value assignment
Six calibration curves were produced (see table 1) from the standards that were prepared by use of the PDS for the submitted CCQM-K117 sample in the range of 10-15 umolmol The CCQM-K117 submitted sample was used as the analytical control for the curves The ammonia amount-of-substance fraction for the submitted CCQM-K117 sample was predicted from the calibration curves Sample selection of control or the on-demand standard (from the PDS) was achieved by using a Computer Operated Gas Analysis System (COGAS) This COGAS was configured so that the control was always flowing as either 300 mLmin to the analyzer (when the standard from the PDS flowed to vent) or 100 mLmin to vent (when the standard from the PDS was flowing to the analyzer) The analytical sequence was control standard 1 standard 2 control standard 3 et cetera until all six standards had been bracketed by the control Each data point is an average of 60 readings taken at 1s intervals with 6 replicate measurements recorded for each The sequence was repeated six times with the order of the standards being randomized in each set collected in the same manner to give six independent curves from which the amount-of-substance fraction could be determined
52
Each analytical sequence of control standard standard control was corrected for linear instrument drift by using equation 3 The corrected instrument response for each control in the sequence was then ratioed to each sample response in the sequence (Eq 4) (Eq 3)
(Eq 4)
r Ratio
SRi Average ith Sample Response (molmol)
A Control Drift Correction (molmol) The average flow was also calculated for each sample response and was then converted to a molar flow volume using equation 5 (Eq 5)
ṅn Molar Flow for associated sample number in sequence (mmol min-1)
Q Average Flow (mL min-1)
Vm Molar Volume (L mol-1)
The amount-of-substance fraction for each on demand standard was then calculated utilizing equation 6 (Eq 6)
C Amount-of-subtance fraction (molmol)
qm Perm Rate (mol min-1)
ṅ Molar Flow (mol min-1)
n Sample number in sequence
The resulting data was then analyzed using the NIST GenLine program which is an ISO 6143-compliant generalized least squares regression The average ratio and standard error where plotted on the x-axis and the gravimetric amount-of-substance fraction and uncertainty were
A Control Drift Correction (molmol)
CR1 Average of repeat responses Control Response 1 (molmol)
CR2 Average of repeat responses Control Response 2 (molmol)
N Number of Samples in sequence
n Sample number in sequence
119860 = 119862R1 +(119862R2 minus 119862R1)
(119873 minus 1)sdot (119899 minus 1)
119903 =119878R119894
119860
119899 =119876
119907m
119862 = (119902119898
ṅ119899) sdot 1000
53
plotted on the y-axis for each on demand standard amount-of-substance fraction In each case all PSMs passed the u-test The ammonia amount-of-substance fraction for the submitted CCQM-K117 sample was determined for a response ratio of 10000 in equation 7 using the A and B values from each set of curve data from table 1 The NIST assigned value for the CCQM-K117 sample was then calculated by generating one amount-of-substance fraction response from a linear fit curve by combining all curve data points in one final curve giving a combined value assignment (table 2) f(r) = A r + B (Eq 7)
f(r) Predicted Concentration (molmol)
r Response ratio A Slope B y-intercept
Table 1 Individual Ammonia Calibration Curves The stated uncertainties are not expanded (k =1) (range 100 to 150 micromolmol in increments of 10 micromolmol) Permeation tubes at 34OC and a permeation rate of 12 microgmin
Measurement Slope (A) Intercept (B) Predicted Control (micromolmol) (k =1)
1 122455 plusmn 15408 13569 plusmn 14097 1360 plusmn 021
2 122519 plusmn 14630 13524 plusmn 11885 1360 plusmn 032
3 123157 plusmn 12953 13073 plusmn 11870 1362 plusmn 019
4 124359 plusmn 10768 12611 plusmn 08787 1370 plusmn 024
5 124096 plusmn 14992 12617 plusmn 13165 1367 plusmn 025
6 124333 plusmn 19089 12715 plusmn 15777 1370 plusmn 042
Table 2 Combined Ammonia Calibration Curve The stated uncertainties are expanded (k =2) (range 100 to 150 micromolmol in increments of 10 micromolmol) Permeation tubes at 34 degC and a permeation rate of 12 microgmin
CCQM ndash K117 Slope (A) Intercept (B) Predicted Amount of Substance Fraction (micromolmol) (k =2)
5904173 122783 plusmn 05433 13621 plusmn 04723 1364 plusmn 020
Uncertainty evaluation
All measured data and calculations for the final amount-of-substance fraction of ammonia have been reviewed for sources of systematic and random errors The following uncertainties were considered contributors to the overall uncertainty of the assigned value of the sample
54
The uncertainty in the permeation rate was determined using the LINEST function in excel (Eq 8) Excel calculated this as the uncertainty of the slope of the line from the calculation of the permeation rate
(Eq 8)
qm Perm Rate (g min-1)
The uncertainty in the instrument response for the controls and samples of each analysis sequence was determined by taking the standard deviation of the total number of responses and dividing by the square root of the number of responses in the standard deviation (Eq 9)
119906(119877) =119904
radic119873 (Eq 9)
R Instrument response
s Standard Deviation
N Number of responses in standard deviation
The uncertainty in the calculated ratio of the sample to control was also calculated The uncertainty was found by taking the square root of the sum of the squares of the two bracketing controls and sample for which the ratio was being calculated (Eq 10)
119906119903 = radic1199062(1198621198771) + 1199062(119904119877119899) + 1199062(1198621198772) (Eq 10)
The uncertainty of the
flow rates for each set of responses was also calculated in the same manner as the instrument response uncertainty by taking the standard deviation of the total number of responses and dividing by the square root of the number of responses in the standard deviation (Eq 11)
119906(119876119899) =119904
radic119873 (Eq 11)
119876119899 Average flow for response
s Standard Deviation
N Number of responses in standard deviation
As in the previous calculations the average flow uncertainty was then calculated as a molar flow uncertainty and was found by using equation 12 (Eq 12)
u(qm) = LINEST function slope uncertainty
uCR1 Uncertainty of repeat responses for control 1
uCR2 Uncertainty of repeat responses for control 2
uSRn Uncertainty of repeat responses for sample in the nth position
119906(119899) = radic1199062(119876) + 1199062(119907m)
55
ṅn Molar Flow for associated sample number in sequence (mol min-1)
Q Average Flow (mL min-1)
Vm Molar Volume (L mol-1)
The uncertainty of the predicted concentration for each of the on-demand standards generated by the permeation system was also calculated This was done by taking the square root of the sum of the squares of the calculated molar flow rate uncertainty and the permeation rate uncertainty that was found with the LINEST function (Eq 13) (Eq 13)
qm Perm Rate (mol min-1)
ṅ Molar Flow (mmol min-1)
n Sample number in sequence
Finally the combined relative uncertainty was calculated from the ratio uncertainty and the uncertainty of the standard concentrations were put into the NIST Genline software with their respective values and the overall uncertainty was calculated when the linear least squares regression was run The relative expanded uncertainty U is given by U = k u where k is the coverage factor and is equal to 2 The true value of the ammonia amount-of-substance fraction is asserted to lie in the intervals defined in Table 2 with a level of confidence of approximately 95 [2]
References
[1] International Organization for Standardization International Standard ISO 6145-102002(E) Geneva [2] Guide to Expression of Uncertainty in Measurement ISBN 92-67-10188-9 1st Ed ISO Geneva
Switzerland 1993
119906(119862) = radic1199062(119899) + 1199062(119902m)
56
Measurement report NPL
Cylinder number 5904237
Measurement 1
Component Date (ddmmyy)
Result (micromolmol)
Standard deviation ( relative)
number of replicates
Ammonia 1652019 1404 301 4
Measurement 2
Component Date (ddmmyy)
Result (micromolmol)
Standard deviation ( relative)
number of replicates
Ammonia 1752019 1372 215 2
Measurement 37
Component Date (ddmmyy)
Result (micromolmol)
Standard deviation ( relative)
number of replicates
Ammonia 1752019 1373 214 2
Results
Component Date (ddmmyy)
Result (micromolmol)
Expanded uncertainty (micromolmol)
Coverage factor
Ammonia 17052019 1380 040 2
Calibration standards
Two NPL primary reference materials (NPL PRMs) of nominally 14 micromol mol-1 ammonia in nitrogen were prepared in accordance with ISO 6142-1 from one source of pure ammonia The purity of the source of ammonia (gas phase) was analysed and determined to be gt 99999 The NPL PRMs were prepared in BOC-supplied 10 litre cylinders that had undergone BOCs SPECTRA-SEAL passivation Additionally each cylinder was conditioned prior to use using an NPL proprietary treatment Mixtures were prepared in one stage by dilution of nominally 100 micromol mol-1 ammonia in nitrogen mixtures either by direct filling (NPL 2626) or by exchange dilution (NPL 2555) [Brewer et al 2019] followed by the addition of nitrogen (direct filling) The nominally 100 micromol mol-1 ammonia in nitrogen mixtures were prepared by dilution of nominally 2000 micromol mol-1 ammonia in nitrogen mixtures which were in turn prepared by dilution of a nominally 20 mmol mol-1 ammonia in nitrogen mixture Both mixtures were used in determining the amount fraction of the CCQM K117 mixture The amount fractions of the two NPL PRMs (NPL 2626 and NPL 2555) are 1398 plusmn 004 and 1395 plusmn 008 micromol mol-1 respectively (uncertainties from gravimetry only are stated as expanded (k=2) uncertainties)
7 If more than three measurements are taken please copy and insert a table of the appropriate format as necessary
57
Purity tables for the ammonia and nitrogen used are provided below
Table 1 ndash Ammonia purity table
Component Amount Fraction (micromolmol) Expanded Uncertainty (micromolmol)
NH3 9999960 22
N2 15 18
H2O 05 06
CxHy 05 06
O2 05 06
CO 05 06
CO2 05 06
Table 2 ndash Nitrogen purity table
Component Amount Fraction (micromolmol) Expanded Uncertainty (micromolmol)
N2 9999995 17
Ar 050 010
O2 0005 0005
H2O 00050 00040
CxHy 00050 0010
CH4 00010 00020
H2 00010 00020
NO 00005 00005
SO2 00005 00005
CO 000030 000030
Instrumentation
The amount fraction of ammonia was measured using an ABB AO2020 non-dispersive infrared spectrometer (NDIR) set to a measurement range of 0 ndash 100 micromol mol-1
Calibration method and value assignment
Before measuring any gas mixtures the analyser response to the balance gas (nitrogen) was recorded The analyser response to an NPL in house calibration standard (NPL 2626 or NPL 2555) was recorded for at least ten minutes followed by the CCQM-K117 mixture (cylinder 5904237) for a ten-minute period This sequence was repeated between two and four times Finally the analyser response to the balance gas was recorded at the end of the sequence To minimise the
58
effects of analyser drift the mean analyser response to the balance gas before and after the comparison was used to apply a balance gas correction The amount fraction of ammonia in the CCQM-K117 mixture was then determined by multiplying the ratio of the analyser response of the CCQM-K117 mixture and the calibration standard (both were corrected for the analyser response to the balance gas) by the gravimetric amount fraction of ammonia within the calibration standard used Samples were introduced into the analyser at atmospheric pressure using a low volume gas regulator (excess flow was passed to a vent) Cylinders were maintained at a laboratory temperature of 20 plusmn 3degC
Uncertainty evaluation
The ratio of the NDIR instrument response from the CCQM-K117 mixture (Vunk - Vzero) and the NPL PRM (Vstd ndash Vzero) is calculated by
119903 = (119881119906119899119896 minus 119881119911119890119903119900
119881119904119905119889 minus 119881119911119890119903119900)
And the average ratio (r) is calculated by
=sum 119903
119899
Where n is the number of ratios The amount fraction of the ammonia in the CCQM-K117 mixture xu is calculated by
119909119906 = 119909119904
Where xs is the amount fraction of ammonia in the NPL PRM The standard uncertainty of the measurand u(xu) is calculated by
119906(119909119906)
119909119906= radic
119906(119909119904)2
1199091199042
+119906()2
2
The table which follows details the uncertainty analysis for an example measurement
unit example value
standard unc
Sensitivity coefficient
unc contribution
unc type
distribution
xs umolmol 1400 024 098 023 A normal
- 098 001 1400 018 A normal
xu umolmol 1372
u(xu) umolmol 029
U(xu) umolmol 059
The standard uncertainty of xs includes both the uncertainties of the gravimetric preparation and of the subsequent analytical validation The analytical validation dominates this uncertainty For NPL 2626 this also includes an additional uncertainty associated with adsorptive loss of ammonia
59
to the cylinder wall during preparation Our best estimate of this effect imposes a measurement uncertainty of 03 molmol (absolute) consistent with our previous work in CCQM-K46 To obtain the final result for the comparison a weighted average taking into account the associated uncertainties was determined from the three measurement results The following table shows the calculation of the final results and its uncertainty
unit value standard unc
Sensitivity coefficient
unc contribution
unc type
distribution
x1 umolmol 1404 042 033 012 A normal
x2 umolmol 1372 029 033 010 A normal
x3 umolmol 1373 029 033 010 A normal
xf umolmol 138
u(xf) umolmol 020
U(xf) umolmol 040
Where x1-x3 is the measurement number and xf is the final value of the amount fraction of ammonia in the CCQM-K117 mixture
Reference
Brewer P J Brown R J C Mussell Webber E B van Aswegen S Ward M K M Hill-Pearce R E Worton D R Breakthrough in Negating the Impact of Adsorption in Gas Reference Materials Analytical Chemistry 2019 91 (8) 5310-5315 doi101021acsanalchem9b00175

2
Measurement report CERI 14 Measurement report VNIIM 20 Measurement report VSL 24 Measurement report METAS 30 Measurement report KRISS 38 Measurement report NIM43 Measurement report NIST 48 Measurement report NPL 56
1 Introduction This key comparison is a comparison to evaluate specific competences of NMIs (track C key comparisons) Ammonia is an important compound in chemical industry It is widely used and is the basis for producing other compounds containing nitrogen Ammonia is also very hazardous and consequently emissions of ammonia need to be controlled and monitored In the past years several National Metrology Institutes have developed facilities for the preparation of Primary Standard gas Mixtures (PSMs) dynamically generated ammonia mixtures and facilities for comparing and certifying gas mixtures containing ammonia This key comparison is a repeat of the CCQM-K46 [1]
For this key comparison a binary mixture of ammonia in nitrogen has been chosen at an amount-of-substance fraction level of 14 micromol mol-1 The key comparison design follows that of the key comparisons using gas mixtures that are prepared gravimetrically as transfer standards [2][3]
2 Design and organisation of the key comparison
21 Participants
Table 1 lists the participants in this key comparison
Table 1 List of participants
Acronym Country Institute
CERI JP Chemicals Evaluation and Research Institute Saitama Japan
METAS CH Federal Institute of Metrology METAS Bern-Wabern Switzerland
KRISS KR Korea Research Institute of Standards and Science Daejeon Republic of Korea
NIST US National Institute of Standards and Technology Gaithersburg MD United States of America
NIM CN National Institute of Metrology Beijing China
NPL GB National Physical Laboratory Teddington United Kingdom
VNIIIM RU DI Mendeleyev Institute for Metrology St Petersburg Russia
VSL NL Van Swinden Laboratorium Delft the Netherlands
22 Measurement standards
A set of mixtures was prepared gravimetrically by an external party in 50 L aluminium cylinders The filling pressure in the cylinders was approximately 150 bar The transfer standards were prepared with a nominal amount fraction ammonia of 14 micromol mol-1 The transfer standards were assessed for stability and homogeneity Prior to shipment to the participating national metrology institutes (NMIs) the set of mixtures was analysed by VSL and then by NIST After return the set of mixtures was analysed by NIST and then by VSL These data were used to
3
1) Assess the stability of the ammonia amount fraction over time
2) Compute the differences in the ammonia amount fraction between the mixtures
The first assessment comprised the evaluation of the slope of a straight line fitted to the four data points and to assess it for significance [4] After this assessment the ammonia amount fraction was calculated for each mixture and the differences were calculated using a fixed effects model These corrections were applied to the reported results prior to calculating a consensus value which was then used to calculate the key comparison reference values for each of the travelling standards
23 Measurement protocol
The cylinders for this comparison were bought by VSL but all NMIs paid for their own cylinder which could be collected from VSL after the final stability measurements These stability measurements have been performed by VSL-NIST-NIST-VSL The participantsrsquo measurements took place between the two NIST stability measurements The rationale of having two NMIs to perform stability study is their difference in preparing their measurement standards VSL used gravimetry and dilution using thermal mass flow controllers [5] and NIST used permeation [6]
The measurement protocol requested each laboratory to perform at least 3 measurements with their own calibrations The replicates leading to a measurement were to be carried out under repeatability conditions The protocol informed the participants about the nominal amount fraction ranges The participants were also requested to submit a summary of their uncertainty evaluation used for calculating the uncertainty of their result
24 Schedule
The schedule of this key comparison was as follows (table 2)
Table 2 Key comparison schedule
Date Stage
December 2014 Agreement of draft protocol April 2014 Registration of participants October 2017 Final protocol available November 2017 Expected delivery date of mixtures at VSL Nov 2017 ndash Sep 2018 October 2018
Homogeneity and stability study at VSL and NIST Dispatch of mixtures
Nov 2018 ndash Jun 2019 July 2019 July 2019
Measurements by participants Cylinders to be returned to NIST Report received by VSL
Aug 2019 ndash Dec 2019 October 2019 February 2020
Continuation of the stability study by NIST and VSL Preliminary results available Participants can collect their own mixture from VSL
March 2020 Draft A report available April 2021 Draft B report available
25 Measurement equation
The evaluation of the data from this key comparison was performed by establishing a consensus value from the results reported by the participants In this calculation effects from stability and homogeneity were addressed As explained in section 23 four measurements were taken at different times to enable assessing the stability of the transfer standards After this assessment amount fractions were computed for the transfer standards These amount fractions were subsequently used to calculate the differences due to batch inhomogeneity of the set of transfer standards Only the gas mixtures that had been used in the key comparison were included A fixed
4
effects model was used to calculate these differences [7] This model is identical to the model used in procedure A (the weighted mean) [8]
The consensus value was calculated after correcting the participantsrsquo results for the differences between the transfer standards The consensus value was calculated using a weighted median [9][10] and procedure B [8] which involves using a Monte Carlo method to propagate the uncertainty The key comparison reference value for each transfer standard was defined as
119910KCRV119894 = 119910WMed + 119890119894
where 119910WMed denotes the weighted median and 119890119894 the deviation in the amount fraction of transfer standard i as computed from the homogeneity study This approach enables presenting the results including the KCRV and the degrees-of-equivalence in a fashion that is used in most key comparisons in the gas analysis area
In detail the calculations performed were as follows Given for each component the following data
1 the amount fraction 119910lab119894 and associated expanded uncertainty 119880lab119894 with coverage factor 119896lab119894 for laboratories 119894 = 1 hellip 119873
2 the amount fraction 119910119895 and associated standard uncertainty 119906(119910119895) for measurements 119895 =
1 hellip 119872 from the homogeneity and stability study
the following calculations were performed To assess the stability of the mixtures for each mixture the following steps were taken
‒ A weighted least squares fit using a straight line to the 119905119895 119910119895 for 1198951 hellip 119872 where 119905119895 denotes
the time and 119910119895 the amount fraction in the mixture as weights the inverse of the variances
1199062(119910119895) were used
‒ Assess whether 1198861 le 119906(1198861) where 1198861 denotes the slope of the straight line and 119906(1198861) the associated standard uncertainty
‒ If the slope is significant check the data and evaluation
‒ If the slope is not significant fit the data using a meta-analysis model to compute a mean amount fraction and standard uncertainty 119906()
The meta-analysis was performed using the DerSimonian-Laird model [11][12] The calculations were performed in R [13] using the metafor package [14] The differences 119890119894 were computed from the 119894 and associated standard uncertainties 119906(119894) The fixed effects model defines these differences as
119890119894 = 119894 minus WM
where WM denotes the weighted mean computed from the 119894 and associated standard uncertainties 119906(119894) [7] The standard uncertainty associated with 119890119894 was computed as [8]
1199062(119890119894) = 1199062(119894) minus 1199062(WM)
where the minus sign arises due the covariance between 119894 and WM
The key comparison was based on a weighted median [9][10] as consensus value Given ordered measured values 119910primelab119894 corrected for the differences in ammonia amount fractions between the
transfer standards with weights 119908prime119894 the weighted median is the element ℓ satisfying
5
sum 119908prime119894
ℓminus1
119894prime=1
le 05 and sum 119908prime119894
119873
119894prime=ℓ
le 05
where
119908119894 = (119880lab1198942 119896lab119894
2 + 1199062(119890119894))minus1
and
119908prime119894 = 119908119894 sdot [sum 119908119895
119873
119895=1
]
minus1
to ensure that sum 119908119894 prime119894 = 1
This estimator is used in the procedure B [8] to obtain the consensus value and degrees-of-equivalence This approach was required as the reported data did not satisfy the criterion to use procedure A which requires that the data set passes a consistency test
The use of the weighted median is a refinement in comparison with the evaluation procedure used for CCQM-K112 (Biogas) Procedure B is implemented using the Monte Carlo method of GUM
Supplement 2 (GUM-S2) [16] using 119872MCM = 106 samples The steps are as follows
1 Draw a series of measured values 119911lab119894 sim 119873(119910lab119894
119880lab119894119896lab119894) for 119894 = 1 hellip 119873
2 Draw a series of measured values 119911119894 sim 119873(119894 119906(
119894)) for 119894 = 1 hellip 119873
3 Compute 120549119911119894 = 119911119894 minus 119911WM where 119911WM denotes the weighted mean
4 Compute 119911primelab119894 = 119911lab119894 minus Δ119911119894
5 Compute the weighted median 119911WMed using corrected values 119911primelab119894 and weights 119908119894prime
6 Compute 119911KCRVi = 119911WMed + Δ119911119894
7 Compute the difference 120575119894 = 119911lab119894 minus 119911KCRV119894
The output from this Monte Carlo procedure was used to compute [17]
‒ The deviations 119890119894 as the mean of the Δ119911119894 and its associated standard uncertainty as the
standard deviation of the Δ119911119894
‒ The KCRVs 119910KCRV119894 as the mean of the 119911KCRV119894 and its associated standard uncertainty as the standard deviation of the 119911KCRV119894
‒ The differences with respect to the KCRV 119889119894 as the mean of the 120575119894 and the 95 coverage interval as the probabilistically symmetric interval of the 120575119894 the standard uncertainty is obtained by calculating the standard deviation of the 120575119894
This procedure ensures that
‒ Corrections are made for the differences in composition of the transfer standards through
the 119890119894
‒ Most weight is given in the formation of the median to the measured values with the smallest uncertainty
‒ Effects of covariances between the 119890119894 are taken into account
6
26 Measurement methods
The measurement methods used by the participants are described in annex A of this report A summary of these methods the dates of measurement and reporting and the way in which metrological traceability has been established is given in Table 3
Table 3 Summary of calibration methods and metrological traceability
Laboratory code
Measurements Calibration Traceability Matrix standards
Measurement technique
VNIIM 4 April ndash 5 June 2019 Single point calibration
Own standards (ISO 6142)
Nitrogen Chromatography-mass spectrometry
NPL 16-17 May 2019 Bracketing Own standards (ISO 6142)
Nitrogen NDIR1
VSL 7-13 March 2019 ISO 6143 Own standards (ISO 6142)
Nitrogen Photo-Acoustic
CERI 13-March ndash 4 April 2019 Multipoint calibration
Own standards (ISO 6142)
Nitrogen NDIR and FTIR2
KRISS 28-30 January 2019 Single point Own standards Nitrogen NDIR
NIST 23-25 October 2018 ISO 6143 Own standards Nitrogen Chemiluminescence
METAS 11-14 March 2019 Bracketing Own standards Nitrogen CRDS3
NIM 23-26 April 2019 Bracketing Own standards (ISO 6142)
Nitrogen FTIR
27 Degrees of equivalence
A unilateral degree of equivalence in key comparisons is defined as
119889119894 = 119910lab119894 minus 119910KCRVi (1)
and the uncertainty associated with the difference di at 95 level of confidence
Given that procedure B has been used with a weighted median as estimator for the KCRV there is no closed form for the evaluation of the standard uncertainty associated with the difference 119889119894 Instead the Monte Carlo method of GUM Supplement 2 [16] was used to calculate this performance metric The approach could readily be extended to calculate bilateral degrees-of-equivalence
3 Results
31 Stability and homogeneity of the transfer standards
The results of the stability and homogeneity study of the transfer standards are summarised in Figure 1 The measurements taken by the NMIs took place between the second and third data point VNIIM did not manage to deliver its transfer standard in a timely fashion to the coordinating laboratories so it was omitted from the third series of analyses
The results shown in Figure 1 demonstrate the stability of the amount fraction ammonia over the period that the measurements of the NMIs took place The last measurement result (around 850 d) is for some of the transfer standards somewhat higher than the other results This is probably attributable to an effect in the calibration or operation of the setup used for these analyses and has no meaning for the stability assessment The amount fraction ammonia is known to increase
1 Non-dispersive infrared spectroscopy 2 Fourier-transform infrared spectroscopy 3 Cavity ringdown spectroscopy
7
as the pressure of the calibration gas mixture in the cylinder decreases The pressures in the transfer standards was widely different during the last measurement and the said effect concerned all mixtures (also the spare ones) so that it can be assumed that the effect is not due to the pressure in the cylinder
To further process the data taking into account that the last results may be slightly biased the differences in amount fraction of the transfer standards have been computed first before combining these (Figure 2)
100 200 300 400 500 600 700 800 900
132
134
136
138
140
142
144
146
148
y (
microm
olm
ol)
time (d)
NIST
100 200 300 400 500 600 700 800 900
132
134
136
138
140
142
144
146
148
y (
microm
olm
ol)
time (d)
CERI
100 200 300 400 500 600 700 800 900
132
134
136
138
140
142
144
146
148
y (
microm
olm
ol)
time (d)
NPL
100 200 300 400 500 600 700 800 900
132
134
136
138
140
142
144
146
148
y (
microm
olm
ol)
time (d)
KRISS
100 200 300 400 500 600 700 800 900
132
134
136
138
140
142
144
146
148
y (
microm
olm
ol)
time (d)
NIM
100 200 300 400 500 600 700 800 900
132
134
136
138
140
142
144
146
148
y (
microm
olm
ol)
time (d)
VSL
8
100 200 300 400 500 600 700 800 900
132
134
136
138
140
142
144
146
148y (
microm
olm
ol)
time (d)
METAS
100 200 300 400 500 600 700 800 900
132
134
136
138
140
142
144
146
148
y (
microm
olm
ol)
time (d)
VNIIM
Figure 1 Stability study data of the transfer standards used in CCQM-K117 The uncertainty bars indicate expanded uncertainties
100 200 300 400 500 600 700 800 900
-06
-04
-02
00
02
04
06
08
Δy (
microm
olm
ol)
time (d)
NIST
100 200 300 400 500 600 700 800 900
-06
-04
-02
00
02
04
06
08
Δy (
microm
olm
ol)
time (d)
CERI
100 200 300 400 500 600 700 800 900
-06
-04
-02
00
02
04
06
08
Δy (
microm
olm
ol)
time (d)
NPL
100 200 300 400 500 600 700 800 900
-06
-04
-02
00
02
04
06
08
Δy (
microm
olm
ol)
time (d)
KRISS
100 200 300 400 500 600 700 800 900
-06
-04
-02
00
02
04
06
08
Δy (
microm
olm
ol)
time (d)
NIM
100 200 300 400 500 600 700 800 900
-06
-04
-02
00
02
04
06
08
Δy (
microm
olm
ol)
time (d)
VSL
9
100 200 300 400 500 600 700 800 900
-06
-04
-02
00
02
04
06
08Δ
y (
microm
olm
ol)
time (d)
METAS
100 200 300 400 500 600 700 800 900
-06
-04
-02
00
02
04
06
08
Δy (
microm
olm
ol)
time (d)
VNIIM
Figure 2 Deviations from the weighted mean of the amount fraction ammonia of the transfer standards used in CCQM-K117 The uncertainty bars indicate expanded uncertainties
A complication was the missing datum for the transfer standard of VNIIM The implication of this missing data point is that the weighted mean computed for the third data set would be inconsistent with the others The missing data point was replaced by a value of 0055 micromol mol-1 which is consistent with the other three data points for this transfer standard and the standard uncertainty was taken as the pooled standard uncertainty from the other cylinders The aim was to minimise the effect on the outcome of the stability study assessment The deviations with respect to the weighted mean from the homogeneity and stability study are summarised in Table 4
Table 4 Deviations from the weighted mean of the amount fraction ammonia (micromol mol-1) as obtained in the stability and homogeneity study
Mixture NMI Δy U(Δy) Δy U(Δy) Δy U(Δy) Δy U(Δy)
5904173 NIST -004 009 -004 010 006 018 001 013
5904216 CERI 000 014 005 010 006 020 009 013
5904237 NPL 001 018 001 010 002 013 005 013
5904238 KRISS -029 009 -025 009 -019 013 -023 013
5904239 NIM -017 011 -013 009 -012 011 -021 013
5904242 VSL 057 010 050 010 059 018 057 014
5904243 METAS -013 009 -015 009 -004 011 -027 013
5904245 VNIIM 006 008 006 010 005 015 006 013
The results of the stability study assessment are summarised in Table 5 The slope a1 is given in 10-6 micromol mol-1 d-1 U- and U+ denote respectively the lower and upper limit of the 95 coverage interval of the slope The regression was performed using the function lm in R [13] All mixtures
passed the stability test Then using the DerSimonian-Laird model [11][12] followed by a fixed effects model the deviations ei and their standard uncertainties were computed (see also Table 5) Only for one data set a non-zero value for the excess standard deviation τ is obtained The data set of transfer standard 5904243 was also evaluated using the four amount fractions determined in the stability study This evaluation revealed that the four data points were much better on a straight line resulting in a substantially smaller standard uncertainty and hence also the qualification that there was a significant trend Looking at the dispersion of the data of the other transfer standards about their straight lines it was concluded that the small dispersion for this mixture was not representative for the performance in the entire study Also the data did not reveal that this transfer standard would behave differently from the others (see also Figure 1 and Figure 2)
Table 5 Stability assessment and deviations of the amount fraction ammonia for the transfer standards used in CCQM-K117 (micromol mol-1)
10
Mixture Lab a1 u(a1) U_( a1) U+( a1) Stable τ ei u(ei)
5904173 NIST 99 42 -82 280 TRUE 0 -0020 0028
5904216 CERI 51 56 -189 291 TRUE 0 0051 0032
5904237 NPL 42 23 -55 139 TRUE 0 0019 0031
5904238 KRISS 55 68 -238 349 TRUE 0 -0249 0027
5904239 NIM -54 67 -342 234 TRUE 0 -0151 0027
5904242 VSL 101 54 -131 334 TRUE 0 0548 0030
5904243 METAS -16 174 -765 733 TRUE 0064 -0142 0041
5904245 VNIIM -9 10 -54 36 TRUE 0 0061 0026
32 Key comparison reference value and degrees-of-equivalence
The results reported by the participants are given in Table 6 and Figure 3 The expanded uncertainty associated with the KCRV is generally smaller than that of the results submitted by the participants There is a small influence of the uncertainty associated with the corrections made for the differences between the amount fractions ammonia of the transfer standards
Table 6 Reported results in CCQM-K117 (ylab) and the key comparison reference values expressed in micromol mol-1
Lab Mixture ylab U(ylab) klab yKCRV u(yKCRV) U(yKCRV)
NIST 5904173 1364 02 2 13743 0056 0110
CERI 5904216 1386 018 2 13814 0056 0110
NPL 5904237 138 04 2 13782 0058 0114
KRISS 5904238 1357 015 2 13514 0053 0104
NIM 5904239 1385 02 2 13612 0057 0111
VSL 5904242 1428 014 2 14310 0052 0102
METAS 5904243 1294 013 2 13621 0065 0127
VNIIM 5904245 1441 023 2 13824 0056 0111
NIST CERI NPL KRISS NIM VSL METAS VNIIM
125
130
135
140
145
150
y (
microm
olm
ol)
Lab
Figure 3 Reported results in CCQM-K117 the uncertainty bars indicate expanded uncertainties
11
NIST CERI NPL KRISS NIM VSL METAS VNIIM
-10
-05
00
05
10d
(micro
mo
lm
ol)
Lab
Figure 4 Degrees-of-equivalence
In Figure 4 and Table 7 the degrees-of-equivalence are shown Two submitted results are clearly discrepant (METAS and VNIIM) and one result is just inconsistent with the KCRV (NIM) The results in this key comparison do not show the discrepancies between the various methods of realising measurement standards as observed in CCQM-K46 [1]
Table 7 Degrees of equivalence (micromol mol-1)
Lab Mixture 119941119946 119958(119941119946) 119932(119941119946) NIST 5904173 -0103 0105 0204 CERI 5904216 0046 0090 0185 NPL 5904237 0018 0203 0402 KRISS 5904238 0056 0073 0146 NIM 5904239 0238 0114 0223 VSL 5904242 -0030 0061 0127 METAS 5904243 -0681 0092 0180 VNIIM 5904245 0586 0128 0251
4 Supported CMC claims The results of this key comparison can be used to support CMC claims for mixtures in nitrogen and air in the amount of substance fractions between 10 micromolmol and 1000 micromolmol
The way in which this key comparison supports CMC claims is described in more detail in the ldquoGAWG strategy for comparisons and CMC claimsrdquo [19] The extrapolation scheme for CMCs does not apply for this key comparison beyond the amount fraction interval stated
5 Discussion and conclusions The results in this Track C key comparison on 14 micromol mol-1 ammonia in nitrogen are acceptable Five of the eight NMIs demonstrate equivalence with the KCRV A discrepancy between static gravimetry on one hand and other methods for realising the national standards for ammonia in nitrogen was not observed in this key comparison This was one of the features in the data of the previous key comparison (CCQM-K46)
12
References [1] AMH van der Veen G Nieuwenkamp RM Wessel M Maruyama Gwi Suk Heo Yong-doo
Kim Dong Min Moon B Niederhauser M Quintilii MJT Milton MG Cox PM Harris FR
Guenther GC Rhoderick LA Konopelko YA Kustikov VV Pankratov DN Selukov VA
Petrov EV Gromova ldquoInternational comparison CCQM-K46 Ammonia in nitrogenrdquo
Metrologia 47 (2010) Tech Suppl 08023
[2] International Organization for Standardization ldquoISO 6142-1 Gas analysis - Preparation of
calibration gas mixtures - Gravimetric methodsrdquo ISO Geneva 2015
[3] International Organization for Standardization ldquoISO 19229 Gas analysis - Gas analysis mdash
Purity analysis and the treatment of purity datardquo ISO Geneva 2019
[4] ISO Guide 35 Reference materials ndash Guidance for characterization and assessment of
homogeneity and stability ISO International Organization for Standardization Geneva
Switzerland 2017 Fourth edition
[5] International Organization for Standardization ldquoISO 6145-7 Gas analysis mdash Preparation
of calibration gas mixtures using dynamic methods mdash Part 7 Thermal mass-flow
controllersrdquo ISO Geneva 2018
[6] International Organization for Standardization ldquoISO 6145-10 Gas analysis mdash Preparation
of calibration gas mixtures using dynamic volumetric methods mdash Part 10 Permeation
methodrdquo ISO Geneva 2002
[7] G Schwarzer JR Carpenter and G Ruumlcker ldquoMeta-Analysis with R (Use R)rdquo Springer
2015
[8] MG Cox The evaluation of key comparison data Metrologia 39(6)589ndash595 dec 2002
[9] F Y Edgeworth On observations relating to several quantities Hermathena 6(13)279ndash
285 1887
[10] FY Edgeworth XXII On a new method of reducing observations relating to several
quantities The London Edinburgh and Dublin Philosophical Magazine and Journal of
Science 25(154)184ndash191 mar 1888
[11] R DerSimonian and N Laird Meta-analysis in clinical trials Controlled Clinical Trials
7(3)177ndash188 1986
[12] R DerSimonian and R Kacker Random-effects model for meta-analysis of clinical trials
An update Contemporary Clinical Trials 28(2)105ndash114 feb 2007
[13] R Core Team R A Language and Environment for Statistical Computing R Foundation for
Statistical Computing Vienna Austria 2020 Version 403
[14] Wolfgang Viechtbauer Conducting meta-analyses in R with the metafor package Journal
of Statistical Software 36(3)1ndash48 2010
[15] AMH van der Veen ET Zalewska DR van Osselen TE Fernaacutendez C Goacutemez J Beraacutenek
RJ Oudwater DC Sobrinho MC Brum CR Augusto J Fuumlkouml T Buumlki Z Nagyneacute Szilaacutegyi
PJ Brewer ML Downey RJC Brown M Valkova Z Durisova K Arrhenius B
Magnusson H Yaghooby T Tarhan E Engin LA Konopelko TA Popova MN Pir OV
13
Efremova Final Report international comparison CCQM-K112 Biogas Metrologia
57(1A)08011ndash08011 jan 2020
[16] BIPM IEC IFCC ILAC ISO IUPAC IUPAP OIML Supplement 2 to the lsquoGuide to the
Expression of Uncertainty in Measurementrsquo ndash Extension to any number of output
quantities JCGM 1022011 BIPM 2011
[17] BIPM IEC IFCC ILAC ISO IUPAC IUPAP OIML Supplement 1 to the lsquoGuide to the
Expression of Uncertainty in Measurementrsquo ndash Propagation of distributions using a Monte
Carlo method JCGM 1012008 BIPM 2008
[18] BIPM IEC IFCC ISO IUPAC IUPAP OIML ldquoEvaluation of measurement data mdash Guide to
the expression of uncertainty in measurementrdquo first edition GUM1995 with minor
corrections JCGM 1002008 BIPM 2008
[19] PJ Brewer AMH van der Veen ldquoGAWG strategy for comparisons and CMC claimsrdquo CCQM
Gas Analysis Working Group April 2016
Coordinators VSL Department of Chemistry Mass Pressure and Viscosity Janneke IT van Wijk Thijsseweg 11 2629 JA Delft the Netherlands Phone +31 15 269 1679 E-mail jvwijkvslnl
NIST Kimberly Harris 100 Bureau Drive Gaithersburg MD 20899 USA Phone +1-00-301-975-3905 E-mail Kimberlyharrisnistgov
Project reference CCQM-K117
Completion date March 2020
14
Annex A Measurement reports
Measurement report CERI
Cylinder number 5904216
Measurement 1
Component Date (ddmmyy)
Result (molmol)
Standard deviation (molmol)
number of replicates
Instrument
Ammonia 3132019 137598 007754 3 NDIR
Measurement 2
Component Date (ddmmyy)
Result (molmol)
Standard deviation (molmol)
number of replicates
Instrument
Ammonia 3142019 138916 002410 3 NDIR
Measurement 3
Component Date (ddmmyy)
Result (molmol)
Standard deviation (molmol)
number of replicates
Instrument
Ammonia 3212019 137468 004045 3 NDIR
Measurement 4
Component Date (ddmmyy)
Result (molmol)
Standard deviation (molmol)
number of replicates
Instrument
Ammonia 3222019 138174 004919 3 NDIR
Measurement 5
Component Date (ddmmyy)
Result (molmol)
Standard deviation (molmol)
number of replicates
Instrument
Ammonia 3232019 138747 003962 3 NDIR
Measurement 6
Component Date (ddmmyy)
Result (molmol)
Standard deviation (molmol)
number of replicates
Instrument
Ammonia 3282019 138619 001719 3 FTIR
Measurement 7
Component Date (ddmmyy)
Result (molmol)
Standard deviation (molmol)
number of replicates
Instrument
Ammonia 3292019 139026 003857 3 FTIR
15
Measurement 8
Component Date (ddmmyy)
Result (molmol)
Standard deviation (molmol)
number of replicates
Instrument
Ammonia 3312019 139186 002403 3 FTIR
Measurement 9
Component Date (ddmmyy)
Result (molmol)
Standard deviation (molmol)
number of replicates
Instrument
Ammonia 442019 138399 006825 3 NDIR
Results
Component Result (molmol)
Expanded uncertainty
(molmol)
Coverage factor
Ammonia 1386 018 2
Result was the weighted mean of NDIR data set mean and FTIR data set mean which was calculated using formula1) below
119910 = sum 119882119894119883119894
119901
119894=1
sum 119882119894
119901
119894=1
frasl
where y= weighted mean Xi= each data set mean Wi= 1ui2 ui= standards uncertainty for the value Xi p= number of data set mean Calibration Standards -Method of preparation ISO 6142-12)
16
1 500 μmolmol NH3 in N2
R1 35 μmolmol NH3 in N2
R2 20 μmolmol NH3 in N2
R3 12 μmolmol NH3 in N2
N2
005 molmol NH3 in N2
Pure NH3
-Weighing data (12 μmolmol NH3 in N2) 1) Evacuated cylinder - Tare cylinder 5678 g 2) Cylinder filled with 005 molmol NH3 in N2 - Tare cylinder 16732 g 3) Cylinder filled with nitrogen - Tare cylinder 1 343304 g -Purity tables (composition) of the parent gases
Purity table of NH3
Component Analytical value (μmolmol)
Distribution Mole fraction (μmolmol)
Standard Uncertainty (μmolmol)
N2 le 100 Rectangular 50 2887
O2 le 100 Rectangular 50 2887
CO le 100 Rectangular 50 2887
CO2 le 100 Rectangular 50 2887
NH3 - - 999 800 5774
Purity table of nitrogen
Component Analytical value (μmolmol)
Distribution Mole fraction (μmolmol)
Standard Uncertainty (μmolmol)
CO le 0003 Rectangular 0001 5 0000 866
CO2 le 0003 Rectangular 0001 5 0000 866
Methane le 0003 Rectangular 0001 5 0000 866
17
Non methane hydro carbon (NMHC)
le 0003 Rectangular 0001 5 0000 866
SO2 le 0002 Rectangular 0001 0000 577
NOx le 0002 Rectangular 0001 0000 577
N2 - - 999 999992 0001 915
Each mole fraction of impurity in nitrogen is adequately low Therefore the molar mass of dilution gas wasnrsquot affected from the impurities -Verification measure We prepared two R3 Standards The gas standards were compared by FTIR Difference between gravimetric value and measurement value is one of the uncertainty sources of the gas standard Instrument Calibration We used two instruments for NH3 measurements Non-dispersive Infrared analyser (Type CGT-7000 Make Shimadzu corporation) and Fourier Transform Infrared Spectroscopy analyser (Type MATRIX-MG5 Make Bruker corporation) Calibration method and value assignment The instruments were calibrated using three gravimetrically prepared standards ranging in concentration from 35 molmol to 12 molmol Analytical scheme was R1 ndashR2 ndash CCQM sample ndash R3 This scheme was repeated 3-times in a day These measurements were carried out for 9-day Quadratic calibration model was chosen to the data Concentration of standards
Component Concentration ( molmol )
R1 R2 R3
NH3 3537 2002 1241
18
Uncertainty evaluation NDIR analysis
Source of uncertainty
Estimate xi
Value +-
Method of evaluation (type A or typeB)
Assumed probability distribution
Divisor
Standard uncertainty
u(xi)
Sensitivity coefficient
|ci|
Contribution
uⅰ(y)
Measurement
1382 μmolmol
0086 22 μmolmol
A ― 1 0086 22 μmolmol
1 0086 22 μmolmol
Verification 1241 μmolmol
0096 39 μmolmol
A ― 1 0096 39 μmolmol
1114 0107 4 μmolmol
R1 3537 μmolmol
0009 479 μmolmol
A ― 1 0009 479 μmolmol
0026 37 0000 2500 μmolmol
R2 2002 μmolmol
0006 401 μmolmol
A ― 1 0006 401 μmolmol
0267 2 0001 710 μmolmol
R3 1241 μmolmol
0004 483 μmolmol
A ― 1 0004 483 μmolmol
0758 5 0003 400 μmolmol
total 0137 8
μmolmol
FTIR analysis
Source of uncertainty
Estimate xi
Value +-
Method of evaluation (type A or typeB)
Assumed probability distribution
Divisor
Standard uncertainty
u(xi)
Sensitivity coefficient
|ci|
Contribution
uⅰ(y)
Measurement
1389 μmolmol
0035 07 μmolmol
A ― 1 0035 07 μmolmol
1 0035 07 μmolmol
Verification 1241 μmolmol
0096 39 μmolmol
A ― 1 0096 39 μmolmol
1119 0107 9 μmolmol
R1 3537 μmolmol
0009 479 μmolmol
A ― 1 0009 479 μmolmol
0023 21 0000 2200 μmolmol
R2 2002 μmolmol
0006 401 μmolmol
A ― 1 0006 401 μmolmol
0270 3 0001 730 μmolmol
R3 1241 μmolmol
0004 483 μmolmol
A ― 1 0004 483 μmolmol
0752 9 0003 375 μmolmol
total 0113 5
μmolmol
19
Source of uncertainty
Estimate xi
Standard uncertainty
u(xi)
Sensitivity coefficient
|ci|
Contribution
uⅰ(y)
NDIR analysis
1382 μmolmol
0137 8 μmolmol
04043 0055 71 μmolmol
FTIR analysis
1389 μmolmol
0113 5 μmolmol
05957 0067 61 μmolmol
total 0087 61
μmolmol
Combined uncertainty 0087 61 μmolmol Coverage factor 2 Expanded uncertainty 018 molmol References 1) International Organization for Standardization ISO Guide 352017 Reference materials -- Guidance for characterization and assessment of homogeneity and stability
2) International Organization for Standardization ISO 6142-12015 Gas analysis -- Preparation of calibration gas mixtures -- Part 1 Gravimetric method for Class I mixtures
20
Measurement report VNIIM
Cylinder number 5904245
Measurement 1
Component Date (ddmmyy)
Result (micromolmol)
Standard deviation ( relative)
number of replicates
Ammonia 04042019 1456 08 10
Measurement 2
Component Date (ddmmyy)
Result (micromolmol)
Standard deviation ( relative)
number of replicates
Ammonia 04042019 1429 10 4x10
Measurement 3
Component Date (ddmmyy)
Result (micromolmol)
Standard deviation ( relative)
number of replicates
Ammonia 04042019 1437 06 4x10
Measurement 4
Component Date (ddmmyy)
Result (micromolmol)
Standard deviation ( relative)
number of replicates
Ammonia 21052019 1442 05 4x10
Results
Component Date (ddmmyy)
Result (micromolmol)
Expanded uncertainty (micromolmol)
Coverage factor
Ammonia 05062019 1441 023 2
Calibration standards
Calibration gas mixtures were prepared in accordance with [1] Preparation was carried out from pure substances in 3 dilution stages 1-st stage ndash 3 mixtures NH3N2 ndashlevel 33 2-nd stage ndash 3 mixtures NH3N2 ndashlevel 570 μmolmol 3-rd stage ndash 4 mixtures NH3N2 ndash level 12-15 μmolmol All the mixtures were prepared in Luxfer cylinders (V=5 dm3) with Aculife4+Aculife3 coating
21
Characteristics of pure substances used for preparation of the calibration standards are shown in the tables 1 and 2
Table 1 Purity table for N2 Monoblock Main component N2 Mole fraction 999998572
Component Mole fraction μmolmol
Standard uncertainty μmolmol
Ar 0916 0011
O2 00015 00009
CO2 00025 00014
H2 00025 00014
CH4 00025 00014
CO 00025 00014
H2O 050 005
Table 2 Purity table for NH3
Cylinder 666 Main component NH3 Mole fraction 999963
Component Mole fraction μmolmol Standard uncertainty μmolmol
C2H5OH 0160 0020
C2H7N 018 006
C3H9N 12 3
C4H8 [1-butene] 026 003
C6H6 00062 00016
C7H8 (toluene)] 040 005
C8H10 (ethylbenzene) 00018 00002
CH3OH 0140 0020
CO 72 12
CO2 00190 00020
H2O 150 20
N2 180 020
O2 00200 00020
o-C8H10 (о- xylene) 000120 000015
m-C8H10 (m- xylene) +p-C8H10 (p- xylene )
00056 00007
Verification measurements for the 1-st stage premixtures (33 ) were carried out by means of FTIR spectrometer FSM 1201 (Russia) uver01 rel Measurement for the 2-st stage premixtures (570 μmolmol) were carried out by means of UV-Vis-NIR spectrophotometer Cary 5000 (Agilent) uver03 rel Verification measurements for the final mixtures were carried out by Chromato-mass-spect-rometry uver 07 rel
22
All verification measurements consisted of checking consistency between the batch of similar prepared mixtures The values of ammonia amount of substance fraction in the calibration gas mixtures and their standard uncertainties are shown in the table 3 Table 3
Cylinder
number Component
Mole fraction (micromolmol)
Standard uncertainty due to
weighing and purity
(micromolmol)
D648608 NH3 12073 0011
D648609 NH3 13098 0012
D648610 NH3 14072 0013
D648618 NH3 14491 0015
Instrumentation
The instrument used for the measurements of the ammonia content in the comparison mixture (cylinder 5904245) is Chromato-mass-spectrometer laquoChromatec-Crystal 5000raquo (Russia)
Operating mode
Chromatographic column Rxi -1ms (Restek) Cat 43802 (20 m x 015 mmID x 20 microm)
Carrier gas High purity Helium 999999
Pressure at the inlet of the column
360 kPa
Carrier gas flow rate 11 mlmin
Split 150
Column oven temperature 160degС
SIM mz=17
Ionization mode EI
Ionization energy 70 eV
Sample volume 025 ml
Calibration method and value assignment
Single point calibration method was used to determine ammonia mole fraction in the
comparison gas mixture
Measurement sequence was in the order standardi - sample -ndash standardi
Each of the 4 measurement results was received under repeatability conditions with the
different calibration standards (table 3) Each of these 4 results is the mean from 4 series and
each series consisted of 10 sub-measurements
23
The amount of substance fraction for a sub-measurement was calculated according to the
formula 2)AA(
ACС
stst
xstx
+=
where Cx and Cst ndash amount of substance fractions of ammonia in the comparison and calibration mixtures Ax ndash analytical signal of ammonia in the comparison gas mixture
stAprime and stA primeprime analytical signals of ammonia in the calibration standard before and after
measurement of the comparison mixture Temperature corrections were not applied due to use of above-mentioned measurement
sequence Uncertainty evaluation
Uncertainty table Uncertainty source
Xi
Estimate
xi
molmol
Assumed
distribution
Standard
uncertainty
u(xi)
molmol
Sensitivity
coefficient
ci
Contribution to
standard
uncertainty
ui(y) molmol
Calibration standards
(weighing + purity)
14491 Normal 0015 0995 0015
Scatter of the results 1441 Normal 0116 1 0116
Combined standard uncertainty 0117 molmol
Coverage factor k=2
Expanded uncertainty 0234 molmol
Relative expanded uncertainty 16
References
[1] International Organization for Standardization ISO 61422001 Gas analysis ndash Preparation of calibration gas mixtures - Gravimetric methods 2nd edition
24
Measurement report VSL
Cylinder number 5904242
Measurement 1
Component Date (ddmmyy)
Result (micromolmol)
Standard deviation ( relative)
number of replicates
Ammonia 07-03-2019 14271 096 1
Measurement 2
Component Date (ddmmyy)
Result (micromolmol)
Standard deviation ( relative)
number of replicates
Ammonia 12-03-2019 14336 062 1
Measurement 34
Component Date (ddmmyy)
Result (micromolmol)
Standard deviation ( relative)
number of replicates
Ammonia 13-03-2019 14226 096 1
Results
Component Date (ddmmyy)
Result (micromolmol)
Expanded uncertainty (micromolmol)
Coverage factor
Ammonia 13-03-2019 1428 014 2
Calibration standards
The standards used by VSL are prepared gravimetrically but the gravimetric value is only used for amount fractions above 1000 micromolmol These mixtures are measured against each other to confirm internal consistency Mixture with a lower amount fraction are certified against PSMs in the range between 1000 and 5000 micromolmol A calibration curve is made using dynamic dilution with Thermal Mass Flow controllers and a certified value is assigned using ISO6143 The rational behind this scheme are the results from the European research project MetNH3 which showed that adsorption of ammonia on the internal cylinder surface was cylinder dependent and could be quantified [1] To eliminate stability effects the mixtures used in the assignment of the K117 cylinder were certified in a period of 2 months before or after the measurements of the K117 mixture
The gasses used for the preparation of the mixtures are Nitrogen 60 quality and Ammonia 40 quality For the purity table of the Ammonia manufacturer specifications are used except for the water impurity As it was not possible to assign a value to water in the pure Ammonia due to interference the water amount in a 5 ammonia in nitrogen mixture was measured and recalculated for the pure ammonia This amount is probably excessive but the difference between
4 If more than three measurements are taken please copy and insert a table of the appropriate format as necessary
25
no water and the assigned value gives a change in composition of only 006 rel The gravimetric preparation itself has an uncertainty of 0026 rel
26
27
Instrumentation
The instrument used to perform the measurements is an Innova 1412 Photo Acoustic analyser The mixtures were connected to the analyser using the method given in fig1 This ensures that there is no influence of individual pressure reducing valves as only on reducer is used in connection with 1 MFC The mixtures are connected over night and all lines as checked for leakage The cylinders to which to assign a value are not diluted (N2 flow zero) while the calibration standards are diluted to create the response curve The total flow is 1500 ml and the individual dilution flows are measured with a BIOS Drycal flowmeter
28
Fig 1- applying 2 multi position valves to connect multiple cylinders using 1 reducer and MFC
Calibration method and value assignment
Ten individual responses of the mixtures are collected and the average taken after 30 minutes flushing of the analyser The calibration curve and the assigned value are determined using ISO6143 To ensure that the mixing of the gas flows was not affected by the use of two MFCs the same dilutions were also measured using mol mixtures of O2 in N2 and measured against Oxygen PSMs on a Servomex paramagnetic analyzer
Uncertainty evaluation
Uncertainty component U U
Purity of ammonia 003
Gravimetric Preparation (first dilution) 0026
Gravimetric preparation (second dilution) 0026
Assignment certified values to calibration standards
0201
Dilution of calibration standards to range 10-17 micromolmol
0201
Value assignment according to ISO6143 030
Assigned value 050 1
1These values are added together because the dilution is a systematic effect and cannot be averaged out
29
References
[1] Janneke IT van Wijk etal Primary ammonia reference materials fulfilling EU quality data Gas Analysis 2017
30
Measurement report METAS
Cylinder number 5904243
Measurement 1
Component Date (ddmmyy)
Result (micromolmol)
Standard deviation ( relative)
number of replicates
Ammonia 11032019
14032019
1293 048 2
Measurement 2
Component Date (ddmmyy)
Result (micromolmol)
Standard deviation ( relative)
number of replicates
Ammonia 12032019 1300 049 1
Measurement 3
Component Date (ddmmyy)
Result (micromolmol)
Standard deviation ( relative)
number of replicates
Ammonia 12032019
14032019
1293 048 2
Measurement 4
Component Date (ddmmyy)
Result (micromolmol)
Standard deviation ( relative)
number of replicates
Ammonia 12032019
14032019
1293 048 2
Measurement 5
Component Date (ddmmyy)
Result (micromolmol)
Standard deviation ( relative)
number of replicates
Ammonia 12032019
13032019
1289 049 2
31
Results
Component Date (ddmmyy)
Result (micromolmol)
Expanded uncertainty (micromolmol)
Coverage factor
Ammonia 140319 1294 013 2
Calibration standards
We generated dynamically the calibration standards (permeation method [1]) using one of the METAS primary magnetic suspension balances (MSB Rubotherm GmbH Germany) a NH3 permeation unit of 9998 purity (Fine Metrology Srls Italy) and nitrogen 60 as matrix and dilution gas (Fig1) Total matrix and dilution gas flows were measured by calibrated flow meters placed before and after the MSB permeation chamber (Red-y GSC-B9TT-BB23 Voumlgtlin Instruments Switzerland)
Fig 1 Permeation system to generate the NH3 reference gas mixtures used to calibrate the analysers
The permeation rate ndash (3113 plusmn 27) ngmin (k = 2) at 48degC and 2600 hPa minus was estimated as the mass loss of the permeation unit during a period of 137 hours after a 3-day stabilization period within the MSB Calibration standards were produced using the first dilution system of the magnetic suspension balance (Fig 1) Different flow rates within the range between 10 L and 52 L were led to the mixing tee as shown in Fig 1 Calibration standard values were estimated using Eq 1
X NH3 = ((qmC PU (VMN2MNH3)) qv) + Xres NH3 [Eq 1]
where
XNH3 NH3 calibration standard (nmolmol) qmC permeation rate (gmin) PU purity of the permeation unit (09998) VM molar volume of the matrixdilution gas (mLmol) MNH3 molar mass of NH3 (gmol) qv total gas flow (matrix + dilution mLmin) XresNH3 residual amount fraction of NH3 in the matrixdilution gas (nmolmol)
Each calibration standard was generated for 90 minutes the first 60 minutes were considered the stabilization time of the system and the last 30 minutes the measuring period
Instrumentation
32
We used two calibrated NH3 analysers based on cavity ring-down spectrometry for this key comparison G2103 (SN 1283-AEDS-2035) and G1103t (SN 127-CPVU-AF004) (Picarro Inc CA USA) Cavity and sampling handling of the analyser G2103 are coated with SilcoNert 2000 The minimum sample flow rates of the analysers were 08 slm (G1103t) and 18 slm (G2103) We placed a distribution tee at the supply inlet of the analysers to ensure overflow The gas mixtures were fed to one end of the distribution tee through a coated tube (SilcoNert 2000 18) and a particle filter The particle filter in G2103 analyser was a coated in-line-filter with nominal pore dimension of 05 microm (SS-4F-05 Swagelok) The particle filter in G1003t analyser was a PFTE membrane filter with nominal pore dimension of 5 microm within a PFA filter holder (TE 47 supporting fabric PES Whatman Switzerland) We connected the other end of the distribution tee to a flowmeter (serie 1350 Wisag AG Switzerland) the overflow was then fed to the exhaust tube G2103 and G1003t analysers recorded reading values every 1 and 3 seconds respectively
Calibration method and value assignment
We let the two NH3 analysers running for 24 hours with nitrogen 60 for stabilization purposes before calibrating them For both analysers nitrogen 60 was concentration zero We produced 5 calibration standards between 79 and 212 nmolmol to calibrate G2103 and 4 calibration standards between 81 and 404 nmolmol to calibrate G1103t For each calibration standard the amount fraction value read by the analyser was the average reading of the last-30 minutes of generation
We obtained one calibration curve per analyser [Eq 2] by linear regression using the least square method [2] Table 1 includes values of the calibration curve parameters for each analyser
Xread = a + b Xgen [Eq 2]
where
Xread average analyser readings of the last 30 minutes of generation (nmolmol) a intercept of the linear regression (nmolmol) b slope of the linear regression Xgen average of the amount fraction generated by the permeation method during the last
30 minutes of generation (nmolmol)
Table 1 Calibration curve parameters of the used NH3-analysers
Analyser Intercept (a) (nmolmol)
Slope (b) Number of observations
G2103 0714 10056 518
G1103t 0057 09996 1988
In order to assign the transfer standard value we generated several gas mixtures within the calibration range of the analysers by diluting the transfer standard We used a dilution system (Fig 2) formed by a compact pressure regulator (KCP1GRM2D1P20000 Swagelok Company OH USA) two critical orifices (LNI Swissgas SA Switzerland) two pressure controllers (Bronkhorst High-Tech BV the Netherlands) one mass flow controller (GSC Red-y Voumltglin Instruments GmbH Switzerland) All the listed elements as well as the tubing of the dilution system were coated (SilcoNert 2000 SilcoTek Corporation PA USA) All the flows of the dilution system (ie critical orifices MFC) were calibrated with the primary volumetric standard of METAS
33
Fig 2 Dilution system for the transfer standard using a cascade of critical orifices
We used a lab water bath to keep the critical orifices at 220degC We monitored the water temperature with a calibrated NTC thermistor connected to a multimeter (Almemo 2390-5 Ahlborn Mess- und Regelungstechnik GmbH Germany) Pressure before the critical orifices was kept at 900 bar with the pressure reduction valve After the first critical orifice we regulated the pressure at 400 bar using one of the pressure controllers The dilution gas (N2 60) was led at different flow rates to the mixing tee located after the cascade of critical orifices through the mass flow controller We regulated the pressure after the mixing coil at 100 bar
We generated each gas mixture for 120 minutes 80 minutes of system stabilization (including analysers) and 40 minutes of measurement For the first gas mixture generated we increased the time up to 360 minutes to account for stabilization time of the critical orifices (240 minutes) We performed 5 measurements with two replicates each except for the second measurement (one replicate) The first replicate of each measurement took place before the homogenization of the transfer standard which happened on 13032019 for 4 hours The temperature in the lab during the measurements was (200 plusmn 10)degC
The amount fractions read by the analysers were corrected using the calibration equation to estimate the amount fraction generated by the dilution system (Eq 3)
XNH3 = (Xread - a) b [Eq 3]
where
XNH3 amount fraction generated by the dilution system (nmolmol)
Xread amount fraction read by the analysers (nmolmol)
a intercept of the linear regression (nmolmol) (Table 1)
b slope of the linear regression (Table 1)
We estimated the amount fraction of NH3 in the transfer standard for each replicate (Eq 4)
Xcyli = (XNH3 (qvMFC + qvco) qvco) + XresNH3 [Eq 4]
where
Xcylij NH3 amount fraction in transfer standard estimated during measurement i (i = 1hellip5)
replicate j (i = 1 2) (nmolmol)
XNH3 NH3 amount fraction generated by the dilution system (nmolmol)
qvMFC diluting gas flow (mLmin)
qvco transfer standard flow through the critical orifices (mLmin)
XresNH3 residual NH3 amount fraction in the diluting gas (nmolmol)
The resulting amount fraction values of each pair of replicates were average to get a single value per
measurement
The final amount fraction value assigned to the transfer standard was the average of the five
measurements (Eq 5)
34
Xcyl5904243 = ((Xcylm1 + Xcylm2 + Xcylm3 + Xcylm4 + Xcylm5) 5 ) 10-3 [Eq 5]
where
Xcyl5904243 NH3 amount fraction assigned to the transfer standard 5904243 (micromolmol)
Xcylm1 NH3 amount fraction estimated in measurement 1 (average 2 replicates) (nmolmol)
Xcylm2 NH3 amount fraction estimated in measurement 2 (nmolmol) Xcylm3 NH3 amount fraction estimated in measurement 3 (average 2 replicates)
(nmolmol) Xcylm4 NH3 amount fraction estimated in measurement 4 (average 2 replicates)
(nmolmol) Xcylm5 NH3 amount fraction estimated in measurement 5 (average 2 replicates)
(nmolmol) Uncertainty evaluation
We evaluated the measurement uncertainty for this key comparison using the software GUM Workbench Pro (version 241 Metrodata GmbH Germany sn 05-24-00002020-0) The uncertainty propagation through the calculation followed the GUM rules [3] The main contributions to the combined standard uncertainty were the slope dispersion of the temporal mass loss of the permeation unit and the standard uncertainties of the flow measurements of the critical orifices used in the dilution system
Model equations
Uncertainty contribution of the magnetic suspension balance qm(m1m2t1t2SC) = ((((m1 - NP1) Kkalread1) - ((m2 - NP2) Kkalread2)) Kkal (t2 - t1)) SC 10^9
Kkal = Kalhigh-Kallow
Kkalread1 = Kalhighread1 - Kallowread1
Kkalread2 = Kalhighread2 - Kallowread2
Uncertainty contribution of the permeation unit used to generate reference gas mixtures to calibrate the
analysers
qmC = qm(m1Cm2Ct1Ct2CSC)
Uncertainty contribution of the reference gas mixtures VMN2 = 1000 (2 MN) dN2
MNH3 = MN + 3 MH
XMSB(qmC PU VMN2 MNH3 qv XresNH3)= ((qmCPU(VMN2MNH3))qv) + XresNH3
Example for G1103t analyser X0MSBe = 0 + XresNH3 0 ppb
X1MSBe = XMSB(qmC PU VMN2 MNH3 qv1e XresNH3)
[hellip]
X4MSBe = XMSB(qmC PU VMN2 MNH3 qv4e XresNH3)
Xgenemean = (X0MSBe + X1MSBe + X2MSBe + X3MSBe + X4MSBe) 5
Xreademean = (X0eread + X1eread + X2eread + X3eread + X4eread) 5
Linear regression of the calibration least square method Xread = a + b Xgen
Example for G1103t analyser be = pe qe
pe = (X0MSBe - Xgenemean) (X0eread - Xreademean) + (X1MSBe - Xgenemean) (X1eread - Xreademean) +
(X2MSBe - Xgenemean) (X2eread - Xreademean) + (X3MSBe - Xgenemean) (X3eread - Xreademean) +
(X4MSBe - Xgenemean) (X4eread - Xreademean)
qe = (X0MSBe - Xgenemean)^2 + (X1MSBe - Xgenemean)^2 + (X2MSBe - Xgenemean)^2 + (X3MSBe - Xgenemean)^2 +
(X4MSBe - Xgenemean)^2
ae = Xreademean - be Xgenemean
35
Uncertainty contribution of the dilution system used to generate the calibration standards XNH3(Xread a b) = (Xread - a) b
Measurement 1
X11NH3 = XNH3(Xread11 ae be)
X12NH3 = XNH3(Xread12 ae be)
[hellip]
Measurement 5 X51NH3 = XNH3(Xread51 am bm)
X52NH3 = XNH3(Xread52 am bm)
Xcyl(XNH3 qvMFC qvco XresidualNH3) = (XNH3 (qvMFC + qvco) qvco ) + XresNH3
Example Measurement 1
Xcylm11= Xcyl(X11NH3 qvMFCdil11 qvco XresNH3)
Xcylm12 = Xcyl(X12NH3 qvMFCdil12 qvco XresNH3)
Xcylm1 = ((Xcylm11 + Xcylm12) 2) 1000
Amount fraction NH3 in gas cylinder to calibrate Xcyl5904243 = ((Xcylm1 + Xcylm2 + Xcylm3 + Xcylm4 + Xcylm5) 5)
Quantity Unit Definition
NP1 g uncertainty contribution of the zero point correction correction of lift change at time 1 due to atmospheric pressure variation
Kkalread1 g differences between the readings of the calibration masses during time 1
NP2 g uncertainty contribution of the zero point correction correction of lift change at time 2 due to atmospheric pressure variation
Kkalread2 g differences between the readings of the calibration masses during time 2
Kkal g mass difference between the calibration masses according to certificate
Kalhigh g heavy calibration mass
Kallow g light calibration mass
Kalhighread1
g balance reading of heavy calibration mass at time 1
Kallowread1
g balance reading of light calibration mass at time 1
Kalhighread2
g balance reading of heavy calibration mass at time 2
Kallowread2
g balance reading of light calibration mass at time 2
qmC ngmin permeation rate at 48degC and 2600 hPa
m1C g permeator mass at time 1
m2C g permeator mass at time 2
t1C min time1
t2C min time2
SC uncertainty contribution of the slope dispersion (relative standard deviation of single measurement) VMN2 mLmo
l molar volume N2 (dilution gas)
MN gmol N atomic mass
dN2 gL density N2 (dilution gas)
MNH3 gmol NH3 molar mass
MH gmol H atomic mass
X0MSBe ppb calibration amount fraction (0 ppb) (G1103t analyser)
XresNH3 ppb residual NH3 in dilution gas
XiMSBe ppb calibration amount fraction i (i = 1 hellip 4) (G1103t analyser)
PU purity of the permeator (from 0 to 1)
qvie mLmin
flow MFM (dil1) calibration point i (i = 1 hellip 4) (G1103t analyser)
Xgenemean ppb average amount fraction NH3 generated for calibration G1103t analyser
Xreademean ppb average amount fraction NH3 read by G1103t analyser
36
Quantity Unit Definition
Xieread ppb read amount fraction i (i = 0 hellip 4) (G1103t analyser)
Xreadmmea
n ppb average amount fraction NH3 read by G2103 analyser
Ximread ppb read amount fraction i (i = 0 hellip 5) (G2103 analyser)
be slope of the linear regression (G1103t analyser)
ae ppb intercept of the linear regression (G1103t analyser)
XijNH3 ppb amount fraction ij (i = 1 hellip 5 j = 1 2) generated for calibration gas cylinder
Xreadij ppb amount fraction read by the analyser during the generation of XijNH3
Xcylmij ppb amount fraction estimated in measurement i (i = 1hellip5) replicate j (j = 1 2)
qvMFCdilij mLmin
average flow MFC measurement 1 i (i = 1hellip5) replicate j (j = 1 2)
qvco mLmin
flow critical orifices dilution system
Xcylmi ppm average amount fraction NH3 measurement i (replicates 1 and 2)
Xcyl5904243 ppm amount fraction NH3 in cylinder intercomparison CCQM-K117 (average 5 measurements)
Uncertainty budget of the amount fraction NH3 in cylinder 5904243
Quantity Value Standard
Uncertainty
Distribution Sensitivity
Coefficient
Uncertainty
Contribution
Index
NP1 00 g 289middot10-9 g rectangular -5000 -15middot10-3 ppm 00
NP2 00 g 289middot10-9 g rectangular 5000 15middot10-3 ppm 00
Kalhigh 299923070 g 250middot10-6 g normal 059 15middot10-6 ppm 00
Kallow 79516970 g 200middot10-6 g normal -059 -12middot10-6 ppm 00
m1C 22667813150 g 289middot10-9 g rectangular 5000 15middot10-3 ppm 00
m2C 22665248260 g 289middot10-9 g rectangular -5000 -15middot10-3 ppm 00
t1C 42990500 min 00250 min normal 16middot10-3 39middot10-6 ppm 00
t2C 125393200 min 00250 min normal -16middot10-3 -39middot10-6 ppm 00
SC 100000 440middot10-3 normal 13 0057 ppm 844
MN 14006855 gmol 174middot10-6 gmol triangular 016 28middot10-6 ppm 00
dN2 1250100 gL 150middot10-6 gL normal -10 -15middot10-3 ppm 00
MH 10079750 gmol 551middot10-6 gmol triangular -23 -130middot10-6 ppm 00
XresNH3 0300 ppb 0122 ppb triangular 010 0013 ppm 42
PU 09998000 816middot10-6 triangular 13 11middot10-3 ppm 00
qv1e 505412 mLmin 505 mLmin normal -210middot10-6 -11middot10-3 ppm 00
qv2e 283349 mLmin 283 mLmin normal -610middot10-6 -17middot10-3 ppm 00
qv3e 182734 mLmin 183 mLmin normal -13middot10-3 -23middot10-3 ppm 01
qv4e 101334 mLmin 101 mLmin normal -26middot10-3 -26middot10-3 ppm 02
qv1m 517612 mLmin 518 mLmin normal -120middot10-6 -600middot10-6 ppm 00
qv2m 432371 mLmin 432 mLmin normal -170middot10-6 -720middot10-6 ppm 00
qv3m 334264 mLmin 334 mLmin normal -280middot10-6 -930middot10-6 ppm 00
qv4m 233309 mLmin 233 mLmin normal -560middot10-6 -13middot10-3 ppm 00
qv5m 192960 mLmin 193 mLmin normal -820middot10-6 -16middot10-3 ppm 00
X0eread 04070 ppb 00148 ppb normal -0015 -220middot10-6 ppm 00
X1eread 831070 ppb 00203 ppb normal -0013 -270middot10-6 ppm 00
X2eread 1468460 ppb 00192 ppb normal -0012 -230middot10-6 ppm 00
X3eread 2258690 ppb 00496 ppb normal -0010 -510middot10-6 ppm 00
X4eread 407316 ppb 0120 ppb normal -65middot10-3 -780middot10-6 ppm 00
X0mread 029100 ppb 794middot10-3 ppb normal -77middot10-3 -61middot10-6 ppm 00
37
Quantity Value Standard
Uncertainty
Distribution Sensitivity
Coefficient
Uncertainty
Contribution
Index
X1mread 792370 ppb 00108 ppb normal -76middot10-3 -82middot10-6 ppm 00
X2mread 951300 ppb 00126 ppb normal -76middot10-3 -96middot10-6 ppm 00
X3mread 12311600 ppb 911middot10-3 ppb normal -76middot10-3 -69middot10-6 ppm 00
X4mread 1758460 ppb 00230 ppb normal -75middot10-3 -170middot10-6 ppm 00
X5mread 2123110 ppb 00223 ppb normal -75middot10-3 -170middot10-6 ppm 00
Xread11 1234340 ppb 00118 ppb normal 0011 120middot10-6 ppm 00
Xread12 1221120 ppb 00119 ppb normal 0011 130middot10-6 ppm 00
Xread21 1088070 ppb 00122 ppb normal 0024 290middot10-6 ppm 00
Xread31 2232720 ppb 00132 ppb normal 58middot10-3 77middot10-6 ppm 00
Xread32 2224780 ppb 00139 ppb normal 58middot10-3 81middot10-6 ppm 00
Xread41 12120000 ppb 416middot10-3 ppb normal 0011 44middot10-6 ppm 00
Xread42 12149700 ppb 408middot10-3 ppb normal 0011 43middot10-6 ppm 00
Xread51 10690500 ppb 398middot10-3 ppb normal 0012 48middot10-6 ppm 00
Xread52 10637900 ppb 429middot10-3 ppb normal 0012 52middot10-6 ppm 00
qvMFCdil11 220138 mLmin 220 mLmin normal 590middot10-6 13middot10-3 ppm 00
qvco 208600 mLmin 00313 mLmin normal -061 -0019 ppm 97
qvMFCdil12 220140 mLmin 220 mLmin normal 580middot10-6 13middot10-3 ppm 00
qvMFCdil21 250173 mLmin 250 mLmin normal 10middot10-3 26middot10-3 ppm 02
qvMFCdil31 120028 mLmin 120 mLmin normal 11middot10-3 13middot10-3 ppm 00
qvMFCdil32 120028 mLmin 120 mLmin normal 11middot10-3 13middot10-3 ppm 00
qvMFCdil41 220139 mLmin 220 mLmin normal 580middot10-6 13middot10-3 ppm 00
qvMFCdil42 220138 mLmin 220 mLmin normal 580middot10-6 13middot10-3 ppm 00
qvMFCdil51 250172 mLmin 250 mLmin normal 510middot10-6 13middot10-3 ppm 00
qvMFCdil52 250171 mLmin 250 mLmin normal 510middot10-6 13middot10-3 ppm 00
Xcyl5904243 129369 ppm 00618 ppm
References
[1] ISO 6145-102002 Gas analysis ndash Preparation of calibration gas mixtures using dynamic volumetric methods ndash Part 10 Permeation method
[2] Cantrell CA (2008) Technical Note Review of methods for linear least-squares fitting of data and application to atmospheric chemistry problems Atmospheric Chemistry and Physics 8 5477 ndash 5487
[3] Joint Committee for Guides in Metrology Evaluation of measurement data ndash Guide to the expression of uncertainty in measurement (GUM) JCGM 1002008 httpswwwbipmorgutilscommondocumentsjcgmJCGM_100_2008_Epdf
38
Measurement report KRISS
Cylinder number D597002
Measurement 1
Component Date (ddmmyy)
Result (micromolmol)
Standard deviation ( relative)
number of replicates
Ammonia 280119 1355 03 3
Measurement 2
Component Date (ddmmyy)
Result (micromolmol)
Standard deviation ( relative)
number of replicates
Ammonia 290119 1360 04 3
Measurement 35
Component Date (ddmmyy)
Result (micromolmol)
Standard deviation ( relative)
number of replicates
Ammonia 300119 1356 01 3
Results
Component Date (ddmmyy)
Result (micromolmol)
Expanded uncertainty (micromolmol)
Coverage factor
Ammonia 1357 015 2
Calibration standards
‒ Method of preparation
Gas mixtures were prepared gravimetrically and their masses were determined using an automated top-pan balance (XP26003L Mettler Toledo) with 26 kg capacity and 1 mg resolution
‒ Weighing data
Primary reference gas mixtures which were used to analyse a key comparison sample were prepared with 3-step dilutions from a pure material to a range of from about 10 μmolmol to about 17 μmolmol
5 If more than three measurements are taken please copy and insert a table of the appropriate format as necessary
39
Gravimetric preparation hierarchy
‒ Purity tables (composition) of the parent gases
Components Amount fraction (μmolmol)
Distribution Standard uncertainty (μmolmol)
Analytical methods
He 05 Rectangular 029 MS
Ar 05 Rectangular 029 MS
N₂ 587 Normal 117 GCDID
H₂ 05 Rectangular 029 GCDID
O₂ 05 Rectangular 029 GCDID
CO₂ 342 Normal 068 GCDID
CO 05 Rectangular 029 GCDID amp FTIR
H₂O 272 Normal 815 FTIR
CH₄ 05 Rectangular 029 GCDID amp FTIR
THC 469 Normal 094 GCFID
NO 25 Rectangular 144 FTIR
NO₂ 25 Rectangular 144 FTIR
N₂O 25 Rectangular 144 FTIR
NH₃ 999704 9031
‒ Physical adsorption loss
In order to estimate physical adsorption loss onto the internal surface of a sample cylinder at about 13 μmolmol using cylinder-to-cylinder division method (Lee et al 2017) a newly prepare primary reference gas mixture (Performax D716756) was divided into another new cylinder (Performax D716790) and then analysed against each other Results from multiple analysis show that a response ratio (daughter to mother) is significantly less than 1 which indicates physical adsorption loss occurred during or a short time after the preparation Therefore gravimetrically determined amount fractions
20000 μmolmol
ME5696
NH₃
500 μmolmol
D746900
NH₃
500 μmolmol
D746904
NH₃
500 μmolmol
D746907
NH₃
500 μmolmol
D746901
NH₃
9997 cmolmol
NH₃
20000 μmolmol
MD2562
NH₃
136 μmolmol
D716752
NH₃
135 μmolmol
D716756
NH₃
164 μmolmol
D726465
NH₃
107 μmolmol
D716787
NH₃
135 μmolmol
NH₃
Physical adsorption loss
6L AL Luxfer
10L AL Luxfer
10L Performax
Pure NH₃
40
and their uncertainties are recalculated to account the physical adsorption loss on the cylinder internal surface
Results from Cylinder-to-cylinder division
‒ Verification measures
Primary reference gas mixtures were analysed to verify their gravimetric preparation using NDIR analyser (ULTRAMAT 6 Siemens) Results show that primary reference gas mixtures agree well within their associated uncertainties of about 1 (k = 2)
Results from verification measurement
Instrumentation
A NDIR gas analyser was used to verify primary reference gas mixtures and analyse a sample for this key comparison
Calibration method and value assignment uncertainty evaluation
A sample for this comparison was analysed against a KRISS primary reference gas mixture (D716752) using a NDIR gas analyser The sample analysis has done by alternating between the gas mixtures (ie PRMKRISS ndash PRMKC ndash PRMKRISS ndash PRMKC ndash PRMKRISS ndash PRMKC ndash PRMKRISS) at three different days The amount fraction of the KC sample cylinder is determined by the following equation for each measurement
119909119870119862119894119895 = 119909119870119877119868119878119878 times 119877119894119895
0973
096
097
098
099
100
101R
esp
on
se r
atio
(dau
ghte
rm
oth
er)
D716787 D726465 D716752 D716756
1000 1004 1005 1000
1000
1004 1005
1000
097
098
099
100
101
102
103
No
rmal
ize
d s
en
siti
vity
NH₃ (10 micromolmol - 17 micromolmol)
41
119906(119909119870119862119894119895) = 119909119870119862119894119895 times radic(119906(119909119870119877119868119878119878
119909119870119877119868119878119878)
2
+ (119906(119877119894119895)
119877119894119895)
2
where 119909119870119862119894119895 is the amount fraction of KC gas mixture 119909119870119877119868119878119878 is the amount fraction of KRISS
PRM and 119877119894119895 is the analyserrsquos response ratio of 15 repeated measurements (ie response of
PRMKC to response of PRMKRISS) At three different days (i=1 2 3) three repeated measurements (j= 1 2 3) have been conducted The total number of measurements are 9 for three days
average 1st analysis 2nd analysis
3rd analysis
1st day measurement 1199091198701198621119886119907119892 11990911987011986211 11990911987011986212 11990911987011986213
2nd day measurement 1199091198701198621119886119907119892 11990911987011986221 11990911987011986222 11990911987011986223
3rd day measurement 1199091198701198621119886119907119892 11990911987011986231 11990911987011986232 11990911987011986233
Reported final results 119961119922119914119943 119958(119961119922119914119943)
119909119870119862119894119886119907119892 =1199091198701198621198941 + 1199091198701198621198942 + 1199091198701198621198943
3
119909119870119862119891 =1199091198701198621119886119907119892 + 1199091198701198622119886119907119892 + 1199091198701198623119886119907119892
3
Uncertainty budget of reported final results (119961119922119914119943)
Uncertainty component
Standard uncertainty
μmolmol
Contribution to uncertainty
Analytical repeatability
0033 187
Analytical reproducibility
0014 36
KRISS PRM 0067 777
Combined 0076
Important note
The pressure of the key comparison sample cylinder was checked as about 250 psig prior its analysis The residual pressure was checked as 200 psig after the analysis and returned to NIST
References
42
Lee et al 2017 Determination of physical adsorption loss of primary standard gas mixtures in cylinders using cylinder-to-cylinder division Metrologia 54 L26
43
Measurement report NIM
Cylinder number 5904239
Measurement 1
Component Date (ddmmyy)
Result (micromolmol)
Standard deviation ( relative)
number of replicates
Ammonia 23042019 1394 052 4
Measurement 2
Component Date (ddmmyy)
Result (micromolmol)
Standard deviation ( relative)
number of replicates
Ammonia 24042019 1385 026 4
Measurement 36
Component Date (ddmmyy)
Result (micromolmol)
Standard deviation ( relative)
number of replicates
Ammonia 25042019 1389 081 4
Measurement 4
Component Date (ddmmyy)
Result (micromolmol)
Standard deviation ( relative)
number of replicates
Ammonia 26042019 1374 033 4
Results
Component Date (ddmmyy)
Result (micromolmol)
Expanded uncertainty (micromolmol)
Coverage factor
Ammonia 26042019 1385 020 2
1 Calibration standards
11 Preparation method and cylinder treatment
The standards were prepared by gravimetric method all the cylinders used were pumped to lower than 1times10-4 Pa a 65 heating temperature was set and lasted for more than 8 hours to remove moisture in cylinders at the same time
12 Filling and weighing
Three steps were selected to fill gas to targeted concentration from pure ammonia and pure nitrogen
6 If more than three measurements are taken please copy and insert a table of the appropriate format as necessary
44
The first step pure NH3 and pure N2 were added into cylinder to gain mole fraction of 2 mol∙mol-
1
The second step 2 mol∙mol-1 NH3N2 was further diluted by nitrogen to reach a more lower concentration of 300 μmol∙mol-1
The third stepthe two standards were finally prepared by diluting 300 μmol∙mol-1 NH3N2
The typical amount of gas filled in each step is presented in Fig 1 The balance used is Metter XP26003L capacity 26 kg Readability 1 mg A substitution method (A-B-A) was selected when weighing here A represents reference cylinder B represents sample cylinder
Concentrationrsquos calculation equation is according to ISO 6142
=
=
=
=
=
P
A
n
i
iAi
A
P
A
n
i
iAi
AAi
i
Mx
m
Mx
mx
x
1
1
1
1
)(
)(
Figure 1 Three filling steps with added gas weight each
13 Purity data of parent gases
Purity data of parent gases N2 and NH3 are shown in Table 1 and Table 2 with the analysis method for common impurity components
300μmolmol NH3N2
c=29999 μmol∙mol-1
2 NH3N2
c=19985 mol∙mol-1
Pure NH3
N2 +1142846g
NH3+14168g
N2 +1138826 g
2NH3N2+17218g
g
N2 + 647420 g
003NH3N2+ 31529g
N2 + 660249 g
003NH3N2+30963
g
1396 μmol∙mol-1 NH3N2
1346 μmol∙mol-1 NH3N2
45
Table 1 Purity of N2
Component Method Mole fraction (μmol∙mol-1)
Distribution Uncertainty (μmol∙mol-1)
O2 Oxygen Analyzer 0030 Rectangular 0014
Ar GC-PDHID 500 Normal 29
H2 GC-PDHID 005 Rectangular 003
H2O CRDs 010 Rectangular 006
CO GC-PDHID 0030 Rectangular 0014
CO2 GC-PDHID 0010 Rectangular 0006
CH4 GC-PDHID 0030 Rectangular 0014
N2 - 9999497 - 29
Table 2 Purity of NH3
Component Method Mole fraction (μmol∙mol-1)
Distribution Uncertainty (μmol∙mol-1)
Ar GC-PDHID 0350 Normal 0035
O2 GC-PDHID 079 Normal 008
THC (CH4) GC-PDHID 0010 Rectangular 0006
H2O - 10 Rectangular 06
N2 GC-PDHID 17 Normal 05
NH3 - 9999962 - 08
14 Verification of standards
In the verification measurements the two intermediate mixed gases of 300μmol∙mol-1 NH3N2 obtained from two different filling route were verified through FTIR one cylinder was chose as standard with which the other cylinder was calibrated the results showed the these two cylinders have good consistency their difference between gravimetric mole fraction and the calibrated mole fraction was smaller than 01 Similarly for the final standards each concentration point (135 μmol∙mol-1 and 139 μmol∙mol-1) was prepared two cylinders the differences between each two cylinders were both smaller than 02
2 Instrumentation
The main instrument used in this comparison is FT-IR Spectrometer with the trade name MultiGasTM analyzer (Models 2032 MKS company) which equipped with necessary components for this kind of instrument The detector is mercury-cadmium-telluride (MCT) which is cooled by a thermo-electrically mode The sample cell has a path length of 511m The resolution is 1 cm-1 the scan number for each spectrum was set at 120 with a total scan time of 1 minute To obtain a
46
clean background the whole system was purged by high-purity nitrogen of which the flow was set at 200 mL∙min-1 for sample cell and 800 mL∙min-1 for other parts of the spectrometer Besides the temperature for the sample cell was kept at 357 and its inner pressure was equal to the ambient atmospheric pressure Two absorption regions (3166~3285) cm-1 and (3409~3475) cm-
1 were selected to determinate the targeted analyte while the reading was obtained through automatically integrating by the instrument itself
3 Calibration method and value assignment
As for the calibration of the comparison sample two-points calibration method was used As shown in Figure 2 standard 1 represents the lower concentration point 1346 μmol∙mol-1 NH3N2 and standard 2 represents the higher concentration point 1396 μmol∙mol-1 NH3N2 When sampling the flow was kept at 200 mL∙min-1 and lasted for at least 1 hour to make reading stabilization The assigned value was calculated in the following formulae
( )
( )( )2 1
0 1 0 1
2 1
C CC C R R
R R
minus= + minus
minus
Here C0 represents the mole fraction of the comparison sample C1 represents the mole fraction of the standard 1 at lower concentration point C2 represents the mole fraction of the standard 2 at higher concentration point R0 represents the instrument reading from the comparison sample R1 represents the instrument reading from the standard 1 at lower concentration point R2 represents the instrument reading from the standard 2 at higher concentration point
Figure 2 Measurement setup
Uncertainty evaluation
The contributions to combined standard uncertainty were from preparation of
gravimetric method repeatability of verification in one day and in different days 2
2
2
1
2
ververprepc uuuu ++=
Here u means relative standard uncertainty
uc Combined uncertainty of assigned concentration value of NH3 in the comparison
cylinder
uprep Uncertainty from gravimetrical preparation
uver1 Uncertainty from repeatability of verification in one day
uver2 Uncertainty from repeatability of verification in different 4 days
V-4
Multi-Channel
Valve
Outlet
Comparison Sample
Standard 1
Standard 2
FT-IR
Spectrometer
MFC
47
Table 3 Uncertainty budget
Source of uncertainty uprep uver1 uver2
Relative standard uncertainty 03 05 04
Relative expanded uncertainty 15 ( k=2 )
48
Measurement report NIST
Cylinder number 5904173
Measurement 1
Component Date (ddmmyy)
Result (micromolmol)
Standard uncertainty (micromolmol)
number of replicates
Ammonia 231018 1360 021 6
Measurement 2
Component Date (ddmmyy)
Result (micromolmol)
Standard uncertainty (micromolmol)
number of replicates
Ammonia 231018 1360 032 6
Measurement 3
Component Date (ddmmyy)
Result (micromolmol)
Standard uncertainty (micromolmol)
number of replicates
Ammonia 231018 1362 019 6
Measurement 4
Component Date (ddmmyy)
Result (micromolmol)
Standard uncertainty (micromolmol)
number of replicates
Ammonia 241018 1370 024 6
Measurement 5
Component Date (ddmmyy)
Result (micromolmol)
Standard uncertainty (micromolmol)
number of replicates
Ammonia 241018 1367 025 6
Measurement 6
Component Date (ddmmyy)
Result (micromolmol)
Standard uncertainty (micromolmol)
number of replicates
Ammonia 241018 1370 042 6
Results
Component Date (ddmmyy)
Result (micromolmol)
Expanded uncertainty (micromolmol)
Coverage factor
Ammonia 251018 1364 020 k=2
Calibration standards
Since NIST does not house primary standard mixtures (PSMs) of NH3 in the amount-of-substance fraction range of 10 micromolmol ndash 30 micromolmol standards were prepared by use of a permeation device system (PDS) Permeation tubes were purchased that were 65 cm in length with a nominal permeation rate of 2860 ngmin plusmn 15 at 34ordm C Four permeation tubes were inserted into the
49
permeation device system (PDS) which was setup in continuous-weighing-mode in compliance with ISO 6145 Part 10 [1] and internal procedures The mass of the four NH3 permeation tubes was measured every fifteen minutes using a Rubotherm magnetic suspension balance The mass resolution of the balance is 0001 mg The total gas flow from the PDS was measured by a DH Instruments (DHI) MolBloc (1E3 Series) flow meter to an uncertainty of 01 relative The MolBoc had been previously calibrated by flowing known masses of nitrogen across the flow meter following internal procedures See figure 1 for permeation schematic setup The gas flow over the permeation tubes was kept constant at 800 mlmin By varying the dilution gas flow a suite of NH3 standards could be produced on demand A permeation rate in g min-1 was determined for the mean amount-of-substance fraction to be analyzed using equation 1 and was converted to mol min-1 using equation 2 Permeation Rate (g min-1) (Eq 1)
Permeation Rate (mol min-1) (Eq 2)
qm Perm Rate (g min-1)
M Molar Mass of Ammonia (g)
Figure 2 Schematic of the basic elements of the Permeation Device System
qm Permeation Rate (g min-1)
m Mass (g)
t time (min)
119902m = 119904119897119900119901119890 |Δ119898
Δ119905| sdot 106
119902m =119902m
119872
50
Impurity Analysis The purchased tubes were stated to be ge 99999 pure from the manufacturer The dilution gas used for generating the standard was N2 nominal purity was ge 99999 Impurity data was obtained for the permeation tubes from the manufacturer and were stated to be
Component Amount-of-substance fraction
Carbon Dioxide lt 1 micromolmol Carbon Monoxide lt 01 micromolmol Methane lt 01 micromolmol Water lt 2 micromolmol
Impurity data for the gas generated by the permeation tubes was obtained by diverting the gas flow stream from the permeation device system to a Nicolet Nexus 670 fourier-transform infrared spectroscopy (FTIR) instrument with a mercury cadmium telluride (MCT) detector The FTIR was also equipped with a 15L Specac 10 meter fixed path length Cyclone gas cell The gas cell was filled with dilution gas in this case nitrogen and a background was obtained A second analysis of the nitrogen was obtained to verify that a background subtraction was occurring and that there was no ammonia present in the matrix gas The gas cell was then filled with the unknown gas sample to 800 torr and vacuum evacuated This purge cycle was repeated six times After the sixth evacuation cycle the gas was set to continuously flow while maintaining a cell pressure of 760 torr Six spectra were then collected at 256 scans with a resolution of 05 cm-1 and averaged together See Figure 2 for comparative spectra of the matrix gas and perm tube flow Impurities were evaluated from the resulting spectra with nothing measurable being detected above baseline therefore the purity of the permeation tubes is the stated ge 99999
51
Figure 2 Nitrogen background and perm tube gas spectra
Instrumentation The ammonia (NH3) component of the unkown sample (Cylinder 5904173) was analyzed by chemiluminescence (Eco Physics Model CLD 844) Delivery pressure (10 psig) to the analyzer was controlled by a high purity stainless steel two stage regulator dedicated to ammonia service (DIN14) The regulator was purged for one hour at a sample gas flow rate of approximately 300 mLmin before data analysis was conducted From this sample flow an analysis range was established based on the nominal amount-of-substance fraction from the cylinder The analyzer was purged (at a flow of approximately 300 mlmin) for five minutes before sample data was collected
Calibration method and value assignment
Six calibration curves were produced (see table 1) from the standards that were prepared by use of the PDS for the submitted CCQM-K117 sample in the range of 10-15 umolmol The CCQM-K117 submitted sample was used as the analytical control for the curves The ammonia amount-of-substance fraction for the submitted CCQM-K117 sample was predicted from the calibration curves Sample selection of control or the on-demand standard (from the PDS) was achieved by using a Computer Operated Gas Analysis System (COGAS) This COGAS was configured so that the control was always flowing as either 300 mLmin to the analyzer (when the standard from the PDS flowed to vent) or 100 mLmin to vent (when the standard from the PDS was flowing to the analyzer) The analytical sequence was control standard 1 standard 2 control standard 3 et cetera until all six standards had been bracketed by the control Each data point is an average of 60 readings taken at 1s intervals with 6 replicate measurements recorded for each The sequence was repeated six times with the order of the standards being randomized in each set collected in the same manner to give six independent curves from which the amount-of-substance fraction could be determined
52
Each analytical sequence of control standard standard control was corrected for linear instrument drift by using equation 3 The corrected instrument response for each control in the sequence was then ratioed to each sample response in the sequence (Eq 4) (Eq 3)
(Eq 4)
r Ratio
SRi Average ith Sample Response (molmol)
A Control Drift Correction (molmol) The average flow was also calculated for each sample response and was then converted to a molar flow volume using equation 5 (Eq 5)
ṅn Molar Flow for associated sample number in sequence (mmol min-1)
Q Average Flow (mL min-1)
Vm Molar Volume (L mol-1)
The amount-of-substance fraction for each on demand standard was then calculated utilizing equation 6 (Eq 6)
C Amount-of-subtance fraction (molmol)
qm Perm Rate (mol min-1)
ṅ Molar Flow (mol min-1)
n Sample number in sequence
The resulting data was then analyzed using the NIST GenLine program which is an ISO 6143-compliant generalized least squares regression The average ratio and standard error where plotted on the x-axis and the gravimetric amount-of-substance fraction and uncertainty were
A Control Drift Correction (molmol)
CR1 Average of repeat responses Control Response 1 (molmol)
CR2 Average of repeat responses Control Response 2 (molmol)
N Number of Samples in sequence
n Sample number in sequence
119860 = 119862R1 +(119862R2 minus 119862R1)
(119873 minus 1)sdot (119899 minus 1)
119903 =119878R119894
119860
119899 =119876
119907m
119862 = (119902119898
ṅ119899) sdot 1000
53
plotted on the y-axis for each on demand standard amount-of-substance fraction In each case all PSMs passed the u-test The ammonia amount-of-substance fraction for the submitted CCQM-K117 sample was determined for a response ratio of 10000 in equation 7 using the A and B values from each set of curve data from table 1 The NIST assigned value for the CCQM-K117 sample was then calculated by generating one amount-of-substance fraction response from a linear fit curve by combining all curve data points in one final curve giving a combined value assignment (table 2) f(r) = A r + B (Eq 7)
f(r) Predicted Concentration (molmol)
r Response ratio A Slope B y-intercept
Table 1 Individual Ammonia Calibration Curves The stated uncertainties are not expanded (k =1) (range 100 to 150 micromolmol in increments of 10 micromolmol) Permeation tubes at 34OC and a permeation rate of 12 microgmin
Measurement Slope (A) Intercept (B) Predicted Control (micromolmol) (k =1)
1 122455 plusmn 15408 13569 plusmn 14097 1360 plusmn 021
2 122519 plusmn 14630 13524 plusmn 11885 1360 plusmn 032
3 123157 plusmn 12953 13073 plusmn 11870 1362 plusmn 019
4 124359 plusmn 10768 12611 plusmn 08787 1370 plusmn 024
5 124096 plusmn 14992 12617 plusmn 13165 1367 plusmn 025
6 124333 plusmn 19089 12715 plusmn 15777 1370 plusmn 042
Table 2 Combined Ammonia Calibration Curve The stated uncertainties are expanded (k =2) (range 100 to 150 micromolmol in increments of 10 micromolmol) Permeation tubes at 34 degC and a permeation rate of 12 microgmin
CCQM ndash K117 Slope (A) Intercept (B) Predicted Amount of Substance Fraction (micromolmol) (k =2)
5904173 122783 plusmn 05433 13621 plusmn 04723 1364 plusmn 020
Uncertainty evaluation
All measured data and calculations for the final amount-of-substance fraction of ammonia have been reviewed for sources of systematic and random errors The following uncertainties were considered contributors to the overall uncertainty of the assigned value of the sample
54
The uncertainty in the permeation rate was determined using the LINEST function in excel (Eq 8) Excel calculated this as the uncertainty of the slope of the line from the calculation of the permeation rate
(Eq 8)
qm Perm Rate (g min-1)
The uncertainty in the instrument response for the controls and samples of each analysis sequence was determined by taking the standard deviation of the total number of responses and dividing by the square root of the number of responses in the standard deviation (Eq 9)
119906(119877) =119904
radic119873 (Eq 9)
R Instrument response
s Standard Deviation
N Number of responses in standard deviation
The uncertainty in the calculated ratio of the sample to control was also calculated The uncertainty was found by taking the square root of the sum of the squares of the two bracketing controls and sample for which the ratio was being calculated (Eq 10)
119906119903 = radic1199062(1198621198771) + 1199062(119904119877119899) + 1199062(1198621198772) (Eq 10)
The uncertainty of the
flow rates for each set of responses was also calculated in the same manner as the instrument response uncertainty by taking the standard deviation of the total number of responses and dividing by the square root of the number of responses in the standard deviation (Eq 11)
119906(119876119899) =119904
radic119873 (Eq 11)
119876119899 Average flow for response
s Standard Deviation
N Number of responses in standard deviation
As in the previous calculations the average flow uncertainty was then calculated as a molar flow uncertainty and was found by using equation 12 (Eq 12)
u(qm) = LINEST function slope uncertainty
uCR1 Uncertainty of repeat responses for control 1
uCR2 Uncertainty of repeat responses for control 2
uSRn Uncertainty of repeat responses for sample in the nth position
119906(119899) = radic1199062(119876) + 1199062(119907m)
55
ṅn Molar Flow for associated sample number in sequence (mol min-1)
Q Average Flow (mL min-1)
Vm Molar Volume (L mol-1)
The uncertainty of the predicted concentration for each of the on-demand standards generated by the permeation system was also calculated This was done by taking the square root of the sum of the squares of the calculated molar flow rate uncertainty and the permeation rate uncertainty that was found with the LINEST function (Eq 13) (Eq 13)
qm Perm Rate (mol min-1)
ṅ Molar Flow (mmol min-1)
n Sample number in sequence
Finally the combined relative uncertainty was calculated from the ratio uncertainty and the uncertainty of the standard concentrations were put into the NIST Genline software with their respective values and the overall uncertainty was calculated when the linear least squares regression was run The relative expanded uncertainty U is given by U = k u where k is the coverage factor and is equal to 2 The true value of the ammonia amount-of-substance fraction is asserted to lie in the intervals defined in Table 2 with a level of confidence of approximately 95 [2]
References
[1] International Organization for Standardization International Standard ISO 6145-102002(E) Geneva [2] Guide to Expression of Uncertainty in Measurement ISBN 92-67-10188-9 1st Ed ISO Geneva
Switzerland 1993
119906(119862) = radic1199062(119899) + 1199062(119902m)
56
Measurement report NPL
Cylinder number 5904237
Measurement 1
Component Date (ddmmyy)
Result (micromolmol)
Standard deviation ( relative)
number of replicates
Ammonia 1652019 1404 301 4
Measurement 2
Component Date (ddmmyy)
Result (micromolmol)
Standard deviation ( relative)
number of replicates
Ammonia 1752019 1372 215 2
Measurement 37
Component Date (ddmmyy)
Result (micromolmol)
Standard deviation ( relative)
number of replicates
Ammonia 1752019 1373 214 2
Results
Component Date (ddmmyy)
Result (micromolmol)
Expanded uncertainty (micromolmol)
Coverage factor
Ammonia 17052019 1380 040 2
Calibration standards
Two NPL primary reference materials (NPL PRMs) of nominally 14 micromol mol-1 ammonia in nitrogen were prepared in accordance with ISO 6142-1 from one source of pure ammonia The purity of the source of ammonia (gas phase) was analysed and determined to be gt 99999 The NPL PRMs were prepared in BOC-supplied 10 litre cylinders that had undergone BOCs SPECTRA-SEAL passivation Additionally each cylinder was conditioned prior to use using an NPL proprietary treatment Mixtures were prepared in one stage by dilution of nominally 100 micromol mol-1 ammonia in nitrogen mixtures either by direct filling (NPL 2626) or by exchange dilution (NPL 2555) [Brewer et al 2019] followed by the addition of nitrogen (direct filling) The nominally 100 micromol mol-1 ammonia in nitrogen mixtures were prepared by dilution of nominally 2000 micromol mol-1 ammonia in nitrogen mixtures which were in turn prepared by dilution of a nominally 20 mmol mol-1 ammonia in nitrogen mixture Both mixtures were used in determining the amount fraction of the CCQM K117 mixture The amount fractions of the two NPL PRMs (NPL 2626 and NPL 2555) are 1398 plusmn 004 and 1395 plusmn 008 micromol mol-1 respectively (uncertainties from gravimetry only are stated as expanded (k=2) uncertainties)
7 If more than three measurements are taken please copy and insert a table of the appropriate format as necessary
57
Purity tables for the ammonia and nitrogen used are provided below
Table 1 ndash Ammonia purity table
Component Amount Fraction (micromolmol) Expanded Uncertainty (micromolmol)
NH3 9999960 22
N2 15 18
H2O 05 06
CxHy 05 06
O2 05 06
CO 05 06
CO2 05 06
Table 2 ndash Nitrogen purity table
Component Amount Fraction (micromolmol) Expanded Uncertainty (micromolmol)
N2 9999995 17
Ar 050 010
O2 0005 0005
H2O 00050 00040
CxHy 00050 0010
CH4 00010 00020
H2 00010 00020
NO 00005 00005
SO2 00005 00005
CO 000030 000030
Instrumentation
The amount fraction of ammonia was measured using an ABB AO2020 non-dispersive infrared spectrometer (NDIR) set to a measurement range of 0 ndash 100 micromol mol-1
Calibration method and value assignment
Before measuring any gas mixtures the analyser response to the balance gas (nitrogen) was recorded The analyser response to an NPL in house calibration standard (NPL 2626 or NPL 2555) was recorded for at least ten minutes followed by the CCQM-K117 mixture (cylinder 5904237) for a ten-minute period This sequence was repeated between two and four times Finally the analyser response to the balance gas was recorded at the end of the sequence To minimise the
58
effects of analyser drift the mean analyser response to the balance gas before and after the comparison was used to apply a balance gas correction The amount fraction of ammonia in the CCQM-K117 mixture was then determined by multiplying the ratio of the analyser response of the CCQM-K117 mixture and the calibration standard (both were corrected for the analyser response to the balance gas) by the gravimetric amount fraction of ammonia within the calibration standard used Samples were introduced into the analyser at atmospheric pressure using a low volume gas regulator (excess flow was passed to a vent) Cylinders were maintained at a laboratory temperature of 20 plusmn 3degC
Uncertainty evaluation
The ratio of the NDIR instrument response from the CCQM-K117 mixture (Vunk - Vzero) and the NPL PRM (Vstd ndash Vzero) is calculated by
119903 = (119881119906119899119896 minus 119881119911119890119903119900
119881119904119905119889 minus 119881119911119890119903119900)
And the average ratio (r) is calculated by
=sum 119903
119899
Where n is the number of ratios The amount fraction of the ammonia in the CCQM-K117 mixture xu is calculated by
119909119906 = 119909119904
Where xs is the amount fraction of ammonia in the NPL PRM The standard uncertainty of the measurand u(xu) is calculated by
119906(119909119906)
119909119906= radic
119906(119909119904)2
1199091199042
+119906()2
2
The table which follows details the uncertainty analysis for an example measurement
unit example value
standard unc
Sensitivity coefficient
unc contribution
unc type
distribution
xs umolmol 1400 024 098 023 A normal
- 098 001 1400 018 A normal
xu umolmol 1372
u(xu) umolmol 029
U(xu) umolmol 059
The standard uncertainty of xs includes both the uncertainties of the gravimetric preparation and of the subsequent analytical validation The analytical validation dominates this uncertainty For NPL 2626 this also includes an additional uncertainty associated with adsorptive loss of ammonia
59
to the cylinder wall during preparation Our best estimate of this effect imposes a measurement uncertainty of 03 molmol (absolute) consistent with our previous work in CCQM-K46 To obtain the final result for the comparison a weighted average taking into account the associated uncertainties was determined from the three measurement results The following table shows the calculation of the final results and its uncertainty
unit value standard unc
Sensitivity coefficient
unc contribution
unc type
distribution
x1 umolmol 1404 042 033 012 A normal
x2 umolmol 1372 029 033 010 A normal
x3 umolmol 1373 029 033 010 A normal
xf umolmol 138
u(xf) umolmol 020
U(xf) umolmol 040
Where x1-x3 is the measurement number and xf is the final value of the amount fraction of ammonia in the CCQM-K117 mixture
Reference
Brewer P J Brown R J C Mussell Webber E B van Aswegen S Ward M K M Hill-Pearce R E Worton D R Breakthrough in Negating the Impact of Adsorption in Gas Reference Materials Analytical Chemistry 2019 91 (8) 5310-5315 doi101021acsanalchem9b00175
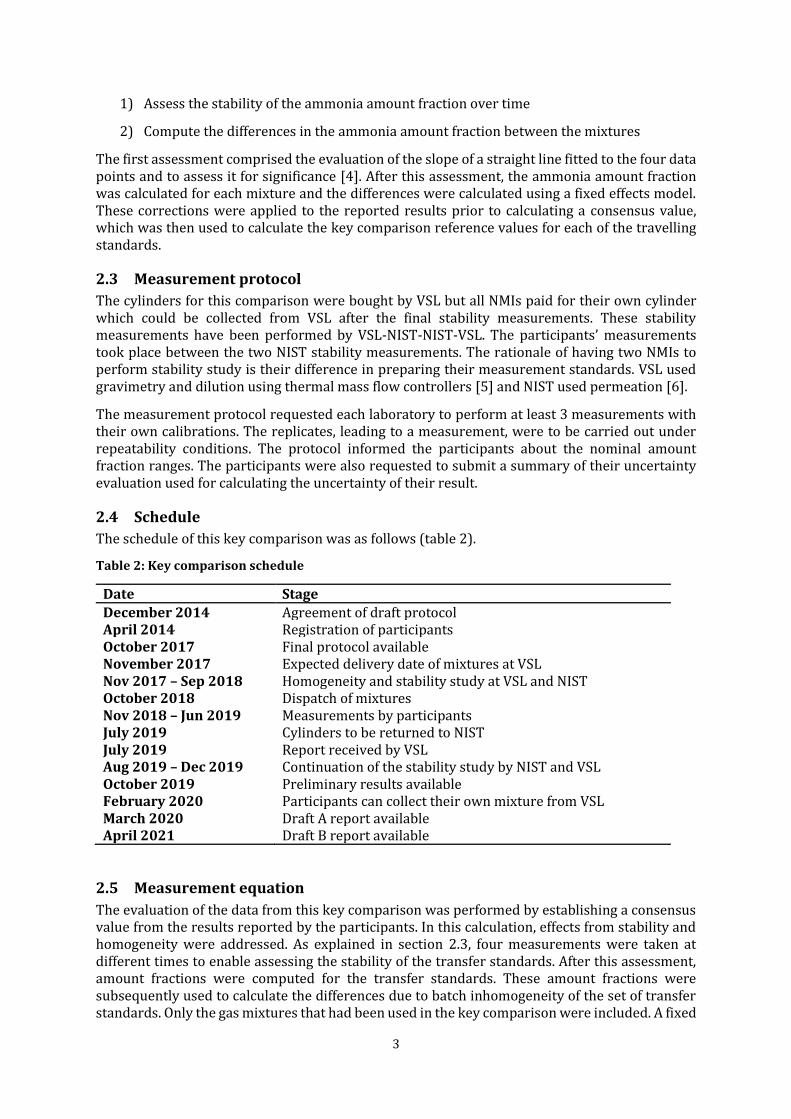
3
1) Assess the stability of the ammonia amount fraction over time
2) Compute the differences in the ammonia amount fraction between the mixtures
The first assessment comprised the evaluation of the slope of a straight line fitted to the four data points and to assess it for significance [4] After this assessment the ammonia amount fraction was calculated for each mixture and the differences were calculated using a fixed effects model These corrections were applied to the reported results prior to calculating a consensus value which was then used to calculate the key comparison reference values for each of the travelling standards
23 Measurement protocol
The cylinders for this comparison were bought by VSL but all NMIs paid for their own cylinder which could be collected from VSL after the final stability measurements These stability measurements have been performed by VSL-NIST-NIST-VSL The participantsrsquo measurements took place between the two NIST stability measurements The rationale of having two NMIs to perform stability study is their difference in preparing their measurement standards VSL used gravimetry and dilution using thermal mass flow controllers [5] and NIST used permeation [6]
The measurement protocol requested each laboratory to perform at least 3 measurements with their own calibrations The replicates leading to a measurement were to be carried out under repeatability conditions The protocol informed the participants about the nominal amount fraction ranges The participants were also requested to submit a summary of their uncertainty evaluation used for calculating the uncertainty of their result
24 Schedule
The schedule of this key comparison was as follows (table 2)
Table 2 Key comparison schedule
Date Stage
December 2014 Agreement of draft protocol April 2014 Registration of participants October 2017 Final protocol available November 2017 Expected delivery date of mixtures at VSL Nov 2017 ndash Sep 2018 October 2018
Homogeneity and stability study at VSL and NIST Dispatch of mixtures
Nov 2018 ndash Jun 2019 July 2019 July 2019
Measurements by participants Cylinders to be returned to NIST Report received by VSL
Aug 2019 ndash Dec 2019 October 2019 February 2020
Continuation of the stability study by NIST and VSL Preliminary results available Participants can collect their own mixture from VSL
March 2020 Draft A report available April 2021 Draft B report available
25 Measurement equation
The evaluation of the data from this key comparison was performed by establishing a consensus value from the results reported by the participants In this calculation effects from stability and homogeneity were addressed As explained in section 23 four measurements were taken at different times to enable assessing the stability of the transfer standards After this assessment amount fractions were computed for the transfer standards These amount fractions were subsequently used to calculate the differences due to batch inhomogeneity of the set of transfer standards Only the gas mixtures that had been used in the key comparison were included A fixed
4
effects model was used to calculate these differences [7] This model is identical to the model used in procedure A (the weighted mean) [8]
The consensus value was calculated after correcting the participantsrsquo results for the differences between the transfer standards The consensus value was calculated using a weighted median [9][10] and procedure B [8] which involves using a Monte Carlo method to propagate the uncertainty The key comparison reference value for each transfer standard was defined as
119910KCRV119894 = 119910WMed + 119890119894
where 119910WMed denotes the weighted median and 119890119894 the deviation in the amount fraction of transfer standard i as computed from the homogeneity study This approach enables presenting the results including the KCRV and the degrees-of-equivalence in a fashion that is used in most key comparisons in the gas analysis area
In detail the calculations performed were as follows Given for each component the following data
1 the amount fraction 119910lab119894 and associated expanded uncertainty 119880lab119894 with coverage factor 119896lab119894 for laboratories 119894 = 1 hellip 119873
2 the amount fraction 119910119895 and associated standard uncertainty 119906(119910119895) for measurements 119895 =
1 hellip 119872 from the homogeneity and stability study
the following calculations were performed To assess the stability of the mixtures for each mixture the following steps were taken
‒ A weighted least squares fit using a straight line to the 119905119895 119910119895 for 1198951 hellip 119872 where 119905119895 denotes
the time and 119910119895 the amount fraction in the mixture as weights the inverse of the variances
1199062(119910119895) were used
‒ Assess whether 1198861 le 119906(1198861) where 1198861 denotes the slope of the straight line and 119906(1198861) the associated standard uncertainty
‒ If the slope is significant check the data and evaluation
‒ If the slope is not significant fit the data using a meta-analysis model to compute a mean amount fraction and standard uncertainty 119906()
The meta-analysis was performed using the DerSimonian-Laird model [11][12] The calculations were performed in R [13] using the metafor package [14] The differences 119890119894 were computed from the 119894 and associated standard uncertainties 119906(119894) The fixed effects model defines these differences as
119890119894 = 119894 minus WM
where WM denotes the weighted mean computed from the 119894 and associated standard uncertainties 119906(119894) [7] The standard uncertainty associated with 119890119894 was computed as [8]
1199062(119890119894) = 1199062(119894) minus 1199062(WM)
where the minus sign arises due the covariance between 119894 and WM
The key comparison was based on a weighted median [9][10] as consensus value Given ordered measured values 119910primelab119894 corrected for the differences in ammonia amount fractions between the
transfer standards with weights 119908prime119894 the weighted median is the element ℓ satisfying
5
sum 119908prime119894
ℓminus1
119894prime=1
le 05 and sum 119908prime119894
119873
119894prime=ℓ
le 05
where
119908119894 = (119880lab1198942 119896lab119894
2 + 1199062(119890119894))minus1
and
119908prime119894 = 119908119894 sdot [sum 119908119895
119873
119895=1
]
minus1
to ensure that sum 119908119894 prime119894 = 1
This estimator is used in the procedure B [8] to obtain the consensus value and degrees-of-equivalence This approach was required as the reported data did not satisfy the criterion to use procedure A which requires that the data set passes a consistency test
The use of the weighted median is a refinement in comparison with the evaluation procedure used for CCQM-K112 (Biogas) Procedure B is implemented using the Monte Carlo method of GUM
Supplement 2 (GUM-S2) [16] using 119872MCM = 106 samples The steps are as follows
1 Draw a series of measured values 119911lab119894 sim 119873(119910lab119894
119880lab119894119896lab119894) for 119894 = 1 hellip 119873
2 Draw a series of measured values 119911119894 sim 119873(119894 119906(
119894)) for 119894 = 1 hellip 119873
3 Compute 120549119911119894 = 119911119894 minus 119911WM where 119911WM denotes the weighted mean
4 Compute 119911primelab119894 = 119911lab119894 minus Δ119911119894
5 Compute the weighted median 119911WMed using corrected values 119911primelab119894 and weights 119908119894prime
6 Compute 119911KCRVi = 119911WMed + Δ119911119894
7 Compute the difference 120575119894 = 119911lab119894 minus 119911KCRV119894
The output from this Monte Carlo procedure was used to compute [17]
‒ The deviations 119890119894 as the mean of the Δ119911119894 and its associated standard uncertainty as the
standard deviation of the Δ119911119894
‒ The KCRVs 119910KCRV119894 as the mean of the 119911KCRV119894 and its associated standard uncertainty as the standard deviation of the 119911KCRV119894
‒ The differences with respect to the KCRV 119889119894 as the mean of the 120575119894 and the 95 coverage interval as the probabilistically symmetric interval of the 120575119894 the standard uncertainty is obtained by calculating the standard deviation of the 120575119894
This procedure ensures that
‒ Corrections are made for the differences in composition of the transfer standards through
the 119890119894
‒ Most weight is given in the formation of the median to the measured values with the smallest uncertainty
‒ Effects of covariances between the 119890119894 are taken into account
6
26 Measurement methods
The measurement methods used by the participants are described in annex A of this report A summary of these methods the dates of measurement and reporting and the way in which metrological traceability has been established is given in Table 3
Table 3 Summary of calibration methods and metrological traceability
Laboratory code
Measurements Calibration Traceability Matrix standards
Measurement technique
VNIIM 4 April ndash 5 June 2019 Single point calibration
Own standards (ISO 6142)
Nitrogen Chromatography-mass spectrometry
NPL 16-17 May 2019 Bracketing Own standards (ISO 6142)
Nitrogen NDIR1
VSL 7-13 March 2019 ISO 6143 Own standards (ISO 6142)
Nitrogen Photo-Acoustic
CERI 13-March ndash 4 April 2019 Multipoint calibration
Own standards (ISO 6142)
Nitrogen NDIR and FTIR2
KRISS 28-30 January 2019 Single point Own standards Nitrogen NDIR
NIST 23-25 October 2018 ISO 6143 Own standards Nitrogen Chemiluminescence
METAS 11-14 March 2019 Bracketing Own standards Nitrogen CRDS3
NIM 23-26 April 2019 Bracketing Own standards (ISO 6142)
Nitrogen FTIR
27 Degrees of equivalence
A unilateral degree of equivalence in key comparisons is defined as
119889119894 = 119910lab119894 minus 119910KCRVi (1)
and the uncertainty associated with the difference di at 95 level of confidence
Given that procedure B has been used with a weighted median as estimator for the KCRV there is no closed form for the evaluation of the standard uncertainty associated with the difference 119889119894 Instead the Monte Carlo method of GUM Supplement 2 [16] was used to calculate this performance metric The approach could readily be extended to calculate bilateral degrees-of-equivalence
3 Results
31 Stability and homogeneity of the transfer standards
The results of the stability and homogeneity study of the transfer standards are summarised in Figure 1 The measurements taken by the NMIs took place between the second and third data point VNIIM did not manage to deliver its transfer standard in a timely fashion to the coordinating laboratories so it was omitted from the third series of analyses
The results shown in Figure 1 demonstrate the stability of the amount fraction ammonia over the period that the measurements of the NMIs took place The last measurement result (around 850 d) is for some of the transfer standards somewhat higher than the other results This is probably attributable to an effect in the calibration or operation of the setup used for these analyses and has no meaning for the stability assessment The amount fraction ammonia is known to increase
1 Non-dispersive infrared spectroscopy 2 Fourier-transform infrared spectroscopy 3 Cavity ringdown spectroscopy
7
as the pressure of the calibration gas mixture in the cylinder decreases The pressures in the transfer standards was widely different during the last measurement and the said effect concerned all mixtures (also the spare ones) so that it can be assumed that the effect is not due to the pressure in the cylinder
To further process the data taking into account that the last results may be slightly biased the differences in amount fraction of the transfer standards have been computed first before combining these (Figure 2)
100 200 300 400 500 600 700 800 900
132
134
136
138
140
142
144
146
148
y (
microm
olm
ol)
time (d)
NIST
100 200 300 400 500 600 700 800 900
132
134
136
138
140
142
144
146
148
y (
microm
olm
ol)
time (d)
CERI
100 200 300 400 500 600 700 800 900
132
134
136
138
140
142
144
146
148
y (
microm
olm
ol)
time (d)
NPL
100 200 300 400 500 600 700 800 900
132
134
136
138
140
142
144
146
148
y (
microm
olm
ol)
time (d)
KRISS
100 200 300 400 500 600 700 800 900
132
134
136
138
140
142
144
146
148
y (
microm
olm
ol)
time (d)
NIM
100 200 300 400 500 600 700 800 900
132
134
136
138
140
142
144
146
148
y (
microm
olm
ol)
time (d)
VSL
8
100 200 300 400 500 600 700 800 900
132
134
136
138
140
142
144
146
148y (
microm
olm
ol)
time (d)
METAS
100 200 300 400 500 600 700 800 900
132
134
136
138
140
142
144
146
148
y (
microm
olm
ol)
time (d)
VNIIM
Figure 1 Stability study data of the transfer standards used in CCQM-K117 The uncertainty bars indicate expanded uncertainties
100 200 300 400 500 600 700 800 900
-06
-04
-02
00
02
04
06
08
Δy (
microm
olm
ol)
time (d)
NIST
100 200 300 400 500 600 700 800 900
-06
-04
-02
00
02
04
06
08
Δy (
microm
olm
ol)
time (d)
CERI
100 200 300 400 500 600 700 800 900
-06
-04
-02
00
02
04
06
08
Δy (
microm
olm
ol)
time (d)
NPL
100 200 300 400 500 600 700 800 900
-06
-04
-02
00
02
04
06
08
Δy (
microm
olm
ol)
time (d)
KRISS
100 200 300 400 500 600 700 800 900
-06
-04
-02
00
02
04
06
08
Δy (
microm
olm
ol)
time (d)
NIM
100 200 300 400 500 600 700 800 900
-06
-04
-02
00
02
04
06
08
Δy (
microm
olm
ol)
time (d)
VSL
9
100 200 300 400 500 600 700 800 900
-06
-04
-02
00
02
04
06
08Δ
y (
microm
olm
ol)
time (d)
METAS
100 200 300 400 500 600 700 800 900
-06
-04
-02
00
02
04
06
08
Δy (
microm
olm
ol)
time (d)
VNIIM
Figure 2 Deviations from the weighted mean of the amount fraction ammonia of the transfer standards used in CCQM-K117 The uncertainty bars indicate expanded uncertainties
A complication was the missing datum for the transfer standard of VNIIM The implication of this missing data point is that the weighted mean computed for the third data set would be inconsistent with the others The missing data point was replaced by a value of 0055 micromol mol-1 which is consistent with the other three data points for this transfer standard and the standard uncertainty was taken as the pooled standard uncertainty from the other cylinders The aim was to minimise the effect on the outcome of the stability study assessment The deviations with respect to the weighted mean from the homogeneity and stability study are summarised in Table 4
Table 4 Deviations from the weighted mean of the amount fraction ammonia (micromol mol-1) as obtained in the stability and homogeneity study
Mixture NMI Δy U(Δy) Δy U(Δy) Δy U(Δy) Δy U(Δy)
5904173 NIST -004 009 -004 010 006 018 001 013
5904216 CERI 000 014 005 010 006 020 009 013
5904237 NPL 001 018 001 010 002 013 005 013
5904238 KRISS -029 009 -025 009 -019 013 -023 013
5904239 NIM -017 011 -013 009 -012 011 -021 013
5904242 VSL 057 010 050 010 059 018 057 014
5904243 METAS -013 009 -015 009 -004 011 -027 013
5904245 VNIIM 006 008 006 010 005 015 006 013
The results of the stability study assessment are summarised in Table 5 The slope a1 is given in 10-6 micromol mol-1 d-1 U- and U+ denote respectively the lower and upper limit of the 95 coverage interval of the slope The regression was performed using the function lm in R [13] All mixtures
passed the stability test Then using the DerSimonian-Laird model [11][12] followed by a fixed effects model the deviations ei and their standard uncertainties were computed (see also Table 5) Only for one data set a non-zero value for the excess standard deviation τ is obtained The data set of transfer standard 5904243 was also evaluated using the four amount fractions determined in the stability study This evaluation revealed that the four data points were much better on a straight line resulting in a substantially smaller standard uncertainty and hence also the qualification that there was a significant trend Looking at the dispersion of the data of the other transfer standards about their straight lines it was concluded that the small dispersion for this mixture was not representative for the performance in the entire study Also the data did not reveal that this transfer standard would behave differently from the others (see also Figure 1 and Figure 2)
Table 5 Stability assessment and deviations of the amount fraction ammonia for the transfer standards used in CCQM-K117 (micromol mol-1)
10
Mixture Lab a1 u(a1) U_( a1) U+( a1) Stable τ ei u(ei)
5904173 NIST 99 42 -82 280 TRUE 0 -0020 0028
5904216 CERI 51 56 -189 291 TRUE 0 0051 0032
5904237 NPL 42 23 -55 139 TRUE 0 0019 0031
5904238 KRISS 55 68 -238 349 TRUE 0 -0249 0027
5904239 NIM -54 67 -342 234 TRUE 0 -0151 0027
5904242 VSL 101 54 -131 334 TRUE 0 0548 0030
5904243 METAS -16 174 -765 733 TRUE 0064 -0142 0041
5904245 VNIIM -9 10 -54 36 TRUE 0 0061 0026
32 Key comparison reference value and degrees-of-equivalence
The results reported by the participants are given in Table 6 and Figure 3 The expanded uncertainty associated with the KCRV is generally smaller than that of the results submitted by the participants There is a small influence of the uncertainty associated with the corrections made for the differences between the amount fractions ammonia of the transfer standards
Table 6 Reported results in CCQM-K117 (ylab) and the key comparison reference values expressed in micromol mol-1
Lab Mixture ylab U(ylab) klab yKCRV u(yKCRV) U(yKCRV)
NIST 5904173 1364 02 2 13743 0056 0110
CERI 5904216 1386 018 2 13814 0056 0110
NPL 5904237 138 04 2 13782 0058 0114
KRISS 5904238 1357 015 2 13514 0053 0104
NIM 5904239 1385 02 2 13612 0057 0111
VSL 5904242 1428 014 2 14310 0052 0102
METAS 5904243 1294 013 2 13621 0065 0127
VNIIM 5904245 1441 023 2 13824 0056 0111
NIST CERI NPL KRISS NIM VSL METAS VNIIM
125
130
135
140
145
150
y (
microm
olm
ol)
Lab
Figure 3 Reported results in CCQM-K117 the uncertainty bars indicate expanded uncertainties
11
NIST CERI NPL KRISS NIM VSL METAS VNIIM
-10
-05
00
05
10d
(micro
mo
lm
ol)
Lab
Figure 4 Degrees-of-equivalence
In Figure 4 and Table 7 the degrees-of-equivalence are shown Two submitted results are clearly discrepant (METAS and VNIIM) and one result is just inconsistent with the KCRV (NIM) The results in this key comparison do not show the discrepancies between the various methods of realising measurement standards as observed in CCQM-K46 [1]
Table 7 Degrees of equivalence (micromol mol-1)
Lab Mixture 119941119946 119958(119941119946) 119932(119941119946) NIST 5904173 -0103 0105 0204 CERI 5904216 0046 0090 0185 NPL 5904237 0018 0203 0402 KRISS 5904238 0056 0073 0146 NIM 5904239 0238 0114 0223 VSL 5904242 -0030 0061 0127 METAS 5904243 -0681 0092 0180 VNIIM 5904245 0586 0128 0251
4 Supported CMC claims The results of this key comparison can be used to support CMC claims for mixtures in nitrogen and air in the amount of substance fractions between 10 micromolmol and 1000 micromolmol
The way in which this key comparison supports CMC claims is described in more detail in the ldquoGAWG strategy for comparisons and CMC claimsrdquo [19] The extrapolation scheme for CMCs does not apply for this key comparison beyond the amount fraction interval stated
5 Discussion and conclusions The results in this Track C key comparison on 14 micromol mol-1 ammonia in nitrogen are acceptable Five of the eight NMIs demonstrate equivalence with the KCRV A discrepancy between static gravimetry on one hand and other methods for realising the national standards for ammonia in nitrogen was not observed in this key comparison This was one of the features in the data of the previous key comparison (CCQM-K46)
12
References [1] AMH van der Veen G Nieuwenkamp RM Wessel M Maruyama Gwi Suk Heo Yong-doo
Kim Dong Min Moon B Niederhauser M Quintilii MJT Milton MG Cox PM Harris FR
Guenther GC Rhoderick LA Konopelko YA Kustikov VV Pankratov DN Selukov VA
Petrov EV Gromova ldquoInternational comparison CCQM-K46 Ammonia in nitrogenrdquo
Metrologia 47 (2010) Tech Suppl 08023
[2] International Organization for Standardization ldquoISO 6142-1 Gas analysis - Preparation of
calibration gas mixtures - Gravimetric methodsrdquo ISO Geneva 2015
[3] International Organization for Standardization ldquoISO 19229 Gas analysis - Gas analysis mdash
Purity analysis and the treatment of purity datardquo ISO Geneva 2019
[4] ISO Guide 35 Reference materials ndash Guidance for characterization and assessment of
homogeneity and stability ISO International Organization for Standardization Geneva
Switzerland 2017 Fourth edition
[5] International Organization for Standardization ldquoISO 6145-7 Gas analysis mdash Preparation
of calibration gas mixtures using dynamic methods mdash Part 7 Thermal mass-flow
controllersrdquo ISO Geneva 2018
[6] International Organization for Standardization ldquoISO 6145-10 Gas analysis mdash Preparation
of calibration gas mixtures using dynamic volumetric methods mdash Part 10 Permeation
methodrdquo ISO Geneva 2002
[7] G Schwarzer JR Carpenter and G Ruumlcker ldquoMeta-Analysis with R (Use R)rdquo Springer
2015
[8] MG Cox The evaluation of key comparison data Metrologia 39(6)589ndash595 dec 2002
[9] F Y Edgeworth On observations relating to several quantities Hermathena 6(13)279ndash
285 1887
[10] FY Edgeworth XXII On a new method of reducing observations relating to several
quantities The London Edinburgh and Dublin Philosophical Magazine and Journal of
Science 25(154)184ndash191 mar 1888
[11] R DerSimonian and N Laird Meta-analysis in clinical trials Controlled Clinical Trials
7(3)177ndash188 1986
[12] R DerSimonian and R Kacker Random-effects model for meta-analysis of clinical trials
An update Contemporary Clinical Trials 28(2)105ndash114 feb 2007
[13] R Core Team R A Language and Environment for Statistical Computing R Foundation for
Statistical Computing Vienna Austria 2020 Version 403
[14] Wolfgang Viechtbauer Conducting meta-analyses in R with the metafor package Journal
of Statistical Software 36(3)1ndash48 2010
[15] AMH van der Veen ET Zalewska DR van Osselen TE Fernaacutendez C Goacutemez J Beraacutenek
RJ Oudwater DC Sobrinho MC Brum CR Augusto J Fuumlkouml T Buumlki Z Nagyneacute Szilaacutegyi
PJ Brewer ML Downey RJC Brown M Valkova Z Durisova K Arrhenius B
Magnusson H Yaghooby T Tarhan E Engin LA Konopelko TA Popova MN Pir OV
13
Efremova Final Report international comparison CCQM-K112 Biogas Metrologia
57(1A)08011ndash08011 jan 2020
[16] BIPM IEC IFCC ILAC ISO IUPAC IUPAP OIML Supplement 2 to the lsquoGuide to the
Expression of Uncertainty in Measurementrsquo ndash Extension to any number of output
quantities JCGM 1022011 BIPM 2011
[17] BIPM IEC IFCC ILAC ISO IUPAC IUPAP OIML Supplement 1 to the lsquoGuide to the
Expression of Uncertainty in Measurementrsquo ndash Propagation of distributions using a Monte
Carlo method JCGM 1012008 BIPM 2008
[18] BIPM IEC IFCC ISO IUPAC IUPAP OIML ldquoEvaluation of measurement data mdash Guide to
the expression of uncertainty in measurementrdquo first edition GUM1995 with minor
corrections JCGM 1002008 BIPM 2008
[19] PJ Brewer AMH van der Veen ldquoGAWG strategy for comparisons and CMC claimsrdquo CCQM
Gas Analysis Working Group April 2016
Coordinators VSL Department of Chemistry Mass Pressure and Viscosity Janneke IT van Wijk Thijsseweg 11 2629 JA Delft the Netherlands Phone +31 15 269 1679 E-mail jvwijkvslnl
NIST Kimberly Harris 100 Bureau Drive Gaithersburg MD 20899 USA Phone +1-00-301-975-3905 E-mail Kimberlyharrisnistgov
Project reference CCQM-K117
Completion date March 2020
14
Annex A Measurement reports
Measurement report CERI
Cylinder number 5904216
Measurement 1
Component Date (ddmmyy)
Result (molmol)
Standard deviation (molmol)
number of replicates
Instrument
Ammonia 3132019 137598 007754 3 NDIR
Measurement 2
Component Date (ddmmyy)
Result (molmol)
Standard deviation (molmol)
number of replicates
Instrument
Ammonia 3142019 138916 002410 3 NDIR
Measurement 3
Component Date (ddmmyy)
Result (molmol)
Standard deviation (molmol)
number of replicates
Instrument
Ammonia 3212019 137468 004045 3 NDIR
Measurement 4
Component Date (ddmmyy)
Result (molmol)
Standard deviation (molmol)
number of replicates
Instrument
Ammonia 3222019 138174 004919 3 NDIR
Measurement 5
Component Date (ddmmyy)
Result (molmol)
Standard deviation (molmol)
number of replicates
Instrument
Ammonia 3232019 138747 003962 3 NDIR
Measurement 6
Component Date (ddmmyy)
Result (molmol)
Standard deviation (molmol)
number of replicates
Instrument
Ammonia 3282019 138619 001719 3 FTIR
Measurement 7
Component Date (ddmmyy)
Result (molmol)
Standard deviation (molmol)
number of replicates
Instrument
Ammonia 3292019 139026 003857 3 FTIR
15
Measurement 8
Component Date (ddmmyy)
Result (molmol)
Standard deviation (molmol)
number of replicates
Instrument
Ammonia 3312019 139186 002403 3 FTIR
Measurement 9
Component Date (ddmmyy)
Result (molmol)
Standard deviation (molmol)
number of replicates
Instrument
Ammonia 442019 138399 006825 3 NDIR
Results
Component Result (molmol)
Expanded uncertainty
(molmol)
Coverage factor
Ammonia 1386 018 2
Result was the weighted mean of NDIR data set mean and FTIR data set mean which was calculated using formula1) below
119910 = sum 119882119894119883119894
119901
119894=1
sum 119882119894
119901
119894=1
frasl
where y= weighted mean Xi= each data set mean Wi= 1ui2 ui= standards uncertainty for the value Xi p= number of data set mean Calibration Standards -Method of preparation ISO 6142-12)
16
1 500 μmolmol NH3 in N2
R1 35 μmolmol NH3 in N2
R2 20 μmolmol NH3 in N2
R3 12 μmolmol NH3 in N2
N2
005 molmol NH3 in N2
Pure NH3
-Weighing data (12 μmolmol NH3 in N2) 1) Evacuated cylinder - Tare cylinder 5678 g 2) Cylinder filled with 005 molmol NH3 in N2 - Tare cylinder 16732 g 3) Cylinder filled with nitrogen - Tare cylinder 1 343304 g -Purity tables (composition) of the parent gases
Purity table of NH3
Component Analytical value (μmolmol)
Distribution Mole fraction (μmolmol)
Standard Uncertainty (μmolmol)
N2 le 100 Rectangular 50 2887
O2 le 100 Rectangular 50 2887
CO le 100 Rectangular 50 2887
CO2 le 100 Rectangular 50 2887
NH3 - - 999 800 5774
Purity table of nitrogen
Component Analytical value (μmolmol)
Distribution Mole fraction (μmolmol)
Standard Uncertainty (μmolmol)
CO le 0003 Rectangular 0001 5 0000 866
CO2 le 0003 Rectangular 0001 5 0000 866
Methane le 0003 Rectangular 0001 5 0000 866
17
Non methane hydro carbon (NMHC)
le 0003 Rectangular 0001 5 0000 866
SO2 le 0002 Rectangular 0001 0000 577
NOx le 0002 Rectangular 0001 0000 577
N2 - - 999 999992 0001 915
Each mole fraction of impurity in nitrogen is adequately low Therefore the molar mass of dilution gas wasnrsquot affected from the impurities -Verification measure We prepared two R3 Standards The gas standards were compared by FTIR Difference between gravimetric value and measurement value is one of the uncertainty sources of the gas standard Instrument Calibration We used two instruments for NH3 measurements Non-dispersive Infrared analyser (Type CGT-7000 Make Shimadzu corporation) and Fourier Transform Infrared Spectroscopy analyser (Type MATRIX-MG5 Make Bruker corporation) Calibration method and value assignment The instruments were calibrated using three gravimetrically prepared standards ranging in concentration from 35 molmol to 12 molmol Analytical scheme was R1 ndashR2 ndash CCQM sample ndash R3 This scheme was repeated 3-times in a day These measurements were carried out for 9-day Quadratic calibration model was chosen to the data Concentration of standards
Component Concentration ( molmol )
R1 R2 R3
NH3 3537 2002 1241
18
Uncertainty evaluation NDIR analysis
Source of uncertainty
Estimate xi
Value +-
Method of evaluation (type A or typeB)
Assumed probability distribution
Divisor
Standard uncertainty
u(xi)
Sensitivity coefficient
|ci|
Contribution
uⅰ(y)
Measurement
1382 μmolmol
0086 22 μmolmol
A ― 1 0086 22 μmolmol
1 0086 22 μmolmol
Verification 1241 μmolmol
0096 39 μmolmol
A ― 1 0096 39 μmolmol
1114 0107 4 μmolmol
R1 3537 μmolmol
0009 479 μmolmol
A ― 1 0009 479 μmolmol
0026 37 0000 2500 μmolmol
R2 2002 μmolmol
0006 401 μmolmol
A ― 1 0006 401 μmolmol
0267 2 0001 710 μmolmol
R3 1241 μmolmol
0004 483 μmolmol
A ― 1 0004 483 μmolmol
0758 5 0003 400 μmolmol
total 0137 8
μmolmol
FTIR analysis
Source of uncertainty
Estimate xi
Value +-
Method of evaluation (type A or typeB)
Assumed probability distribution
Divisor
Standard uncertainty
u(xi)
Sensitivity coefficient
|ci|
Contribution
uⅰ(y)
Measurement
1389 μmolmol
0035 07 μmolmol
A ― 1 0035 07 μmolmol
1 0035 07 μmolmol
Verification 1241 μmolmol
0096 39 μmolmol
A ― 1 0096 39 μmolmol
1119 0107 9 μmolmol
R1 3537 μmolmol
0009 479 μmolmol
A ― 1 0009 479 μmolmol
0023 21 0000 2200 μmolmol
R2 2002 μmolmol
0006 401 μmolmol
A ― 1 0006 401 μmolmol
0270 3 0001 730 μmolmol
R3 1241 μmolmol
0004 483 μmolmol
A ― 1 0004 483 μmolmol
0752 9 0003 375 μmolmol
total 0113 5
μmolmol
19
Source of uncertainty
Estimate xi
Standard uncertainty
u(xi)
Sensitivity coefficient
|ci|
Contribution
uⅰ(y)
NDIR analysis
1382 μmolmol
0137 8 μmolmol
04043 0055 71 μmolmol
FTIR analysis
1389 μmolmol
0113 5 μmolmol
05957 0067 61 μmolmol
total 0087 61
μmolmol
Combined uncertainty 0087 61 μmolmol Coverage factor 2 Expanded uncertainty 018 molmol References 1) International Organization for Standardization ISO Guide 352017 Reference materials -- Guidance for characterization and assessment of homogeneity and stability
2) International Organization for Standardization ISO 6142-12015 Gas analysis -- Preparation of calibration gas mixtures -- Part 1 Gravimetric method for Class I mixtures
20
Measurement report VNIIM
Cylinder number 5904245
Measurement 1
Component Date (ddmmyy)
Result (micromolmol)
Standard deviation ( relative)
number of replicates
Ammonia 04042019 1456 08 10
Measurement 2
Component Date (ddmmyy)
Result (micromolmol)
Standard deviation ( relative)
number of replicates
Ammonia 04042019 1429 10 4x10
Measurement 3
Component Date (ddmmyy)
Result (micromolmol)
Standard deviation ( relative)
number of replicates
Ammonia 04042019 1437 06 4x10
Measurement 4
Component Date (ddmmyy)
Result (micromolmol)
Standard deviation ( relative)
number of replicates
Ammonia 21052019 1442 05 4x10
Results
Component Date (ddmmyy)
Result (micromolmol)
Expanded uncertainty (micromolmol)
Coverage factor
Ammonia 05062019 1441 023 2
Calibration standards
Calibration gas mixtures were prepared in accordance with [1] Preparation was carried out from pure substances in 3 dilution stages 1-st stage ndash 3 mixtures NH3N2 ndashlevel 33 2-nd stage ndash 3 mixtures NH3N2 ndashlevel 570 μmolmol 3-rd stage ndash 4 mixtures NH3N2 ndash level 12-15 μmolmol All the mixtures were prepared in Luxfer cylinders (V=5 dm3) with Aculife4+Aculife3 coating
21
Characteristics of pure substances used for preparation of the calibration standards are shown in the tables 1 and 2
Table 1 Purity table for N2 Monoblock Main component N2 Mole fraction 999998572
Component Mole fraction μmolmol
Standard uncertainty μmolmol
Ar 0916 0011
O2 00015 00009
CO2 00025 00014
H2 00025 00014
CH4 00025 00014
CO 00025 00014
H2O 050 005
Table 2 Purity table for NH3
Cylinder 666 Main component NH3 Mole fraction 999963
Component Mole fraction μmolmol Standard uncertainty μmolmol
C2H5OH 0160 0020
C2H7N 018 006
C3H9N 12 3
C4H8 [1-butene] 026 003
C6H6 00062 00016
C7H8 (toluene)] 040 005
C8H10 (ethylbenzene) 00018 00002
CH3OH 0140 0020
CO 72 12
CO2 00190 00020
H2O 150 20
N2 180 020
O2 00200 00020
o-C8H10 (о- xylene) 000120 000015
m-C8H10 (m- xylene) +p-C8H10 (p- xylene )
00056 00007
Verification measurements for the 1-st stage premixtures (33 ) were carried out by means of FTIR spectrometer FSM 1201 (Russia) uver01 rel Measurement for the 2-st stage premixtures (570 μmolmol) were carried out by means of UV-Vis-NIR spectrophotometer Cary 5000 (Agilent) uver03 rel Verification measurements for the final mixtures were carried out by Chromato-mass-spect-rometry uver 07 rel
22
All verification measurements consisted of checking consistency between the batch of similar prepared mixtures The values of ammonia amount of substance fraction in the calibration gas mixtures and their standard uncertainties are shown in the table 3 Table 3
Cylinder
number Component
Mole fraction (micromolmol)
Standard uncertainty due to
weighing and purity
(micromolmol)
D648608 NH3 12073 0011
D648609 NH3 13098 0012
D648610 NH3 14072 0013
D648618 NH3 14491 0015
Instrumentation
The instrument used for the measurements of the ammonia content in the comparison mixture (cylinder 5904245) is Chromato-mass-spectrometer laquoChromatec-Crystal 5000raquo (Russia)
Operating mode
Chromatographic column Rxi -1ms (Restek) Cat 43802 (20 m x 015 mmID x 20 microm)
Carrier gas High purity Helium 999999
Pressure at the inlet of the column
360 kPa
Carrier gas flow rate 11 mlmin
Split 150
Column oven temperature 160degС
SIM mz=17
Ionization mode EI
Ionization energy 70 eV
Sample volume 025 ml
Calibration method and value assignment
Single point calibration method was used to determine ammonia mole fraction in the
comparison gas mixture
Measurement sequence was in the order standardi - sample -ndash standardi
Each of the 4 measurement results was received under repeatability conditions with the
different calibration standards (table 3) Each of these 4 results is the mean from 4 series and
each series consisted of 10 sub-measurements
23
The amount of substance fraction for a sub-measurement was calculated according to the
formula 2)AA(
ACС
stst
xstx
+=
where Cx and Cst ndash amount of substance fractions of ammonia in the comparison and calibration mixtures Ax ndash analytical signal of ammonia in the comparison gas mixture
stAprime and stA primeprime analytical signals of ammonia in the calibration standard before and after
measurement of the comparison mixture Temperature corrections were not applied due to use of above-mentioned measurement
sequence Uncertainty evaluation
Uncertainty table Uncertainty source
Xi
Estimate
xi
molmol
Assumed
distribution
Standard
uncertainty
u(xi)
molmol
Sensitivity
coefficient
ci
Contribution to
standard
uncertainty
ui(y) molmol
Calibration standards
(weighing + purity)
14491 Normal 0015 0995 0015
Scatter of the results 1441 Normal 0116 1 0116
Combined standard uncertainty 0117 molmol
Coverage factor k=2
Expanded uncertainty 0234 molmol
Relative expanded uncertainty 16
References
[1] International Organization for Standardization ISO 61422001 Gas analysis ndash Preparation of calibration gas mixtures - Gravimetric methods 2nd edition
24
Measurement report VSL
Cylinder number 5904242
Measurement 1
Component Date (ddmmyy)
Result (micromolmol)
Standard deviation ( relative)
number of replicates
Ammonia 07-03-2019 14271 096 1
Measurement 2
Component Date (ddmmyy)
Result (micromolmol)
Standard deviation ( relative)
number of replicates
Ammonia 12-03-2019 14336 062 1
Measurement 34
Component Date (ddmmyy)
Result (micromolmol)
Standard deviation ( relative)
number of replicates
Ammonia 13-03-2019 14226 096 1
Results
Component Date (ddmmyy)
Result (micromolmol)
Expanded uncertainty (micromolmol)
Coverage factor
Ammonia 13-03-2019 1428 014 2
Calibration standards
The standards used by VSL are prepared gravimetrically but the gravimetric value is only used for amount fractions above 1000 micromolmol These mixtures are measured against each other to confirm internal consistency Mixture with a lower amount fraction are certified against PSMs in the range between 1000 and 5000 micromolmol A calibration curve is made using dynamic dilution with Thermal Mass Flow controllers and a certified value is assigned using ISO6143 The rational behind this scheme are the results from the European research project MetNH3 which showed that adsorption of ammonia on the internal cylinder surface was cylinder dependent and could be quantified [1] To eliminate stability effects the mixtures used in the assignment of the K117 cylinder were certified in a period of 2 months before or after the measurements of the K117 mixture
The gasses used for the preparation of the mixtures are Nitrogen 60 quality and Ammonia 40 quality For the purity table of the Ammonia manufacturer specifications are used except for the water impurity As it was not possible to assign a value to water in the pure Ammonia due to interference the water amount in a 5 ammonia in nitrogen mixture was measured and recalculated for the pure ammonia This amount is probably excessive but the difference between
4 If more than three measurements are taken please copy and insert a table of the appropriate format as necessary
25
no water and the assigned value gives a change in composition of only 006 rel The gravimetric preparation itself has an uncertainty of 0026 rel
26
27
Instrumentation
The instrument used to perform the measurements is an Innova 1412 Photo Acoustic analyser The mixtures were connected to the analyser using the method given in fig1 This ensures that there is no influence of individual pressure reducing valves as only on reducer is used in connection with 1 MFC The mixtures are connected over night and all lines as checked for leakage The cylinders to which to assign a value are not diluted (N2 flow zero) while the calibration standards are diluted to create the response curve The total flow is 1500 ml and the individual dilution flows are measured with a BIOS Drycal flowmeter
28
Fig 1- applying 2 multi position valves to connect multiple cylinders using 1 reducer and MFC
Calibration method and value assignment
Ten individual responses of the mixtures are collected and the average taken after 30 minutes flushing of the analyser The calibration curve and the assigned value are determined using ISO6143 To ensure that the mixing of the gas flows was not affected by the use of two MFCs the same dilutions were also measured using mol mixtures of O2 in N2 and measured against Oxygen PSMs on a Servomex paramagnetic analyzer
Uncertainty evaluation
Uncertainty component U U
Purity of ammonia 003
Gravimetric Preparation (first dilution) 0026
Gravimetric preparation (second dilution) 0026
Assignment certified values to calibration standards
0201
Dilution of calibration standards to range 10-17 micromolmol
0201
Value assignment according to ISO6143 030
Assigned value 050 1
1These values are added together because the dilution is a systematic effect and cannot be averaged out
29
References
[1] Janneke IT van Wijk etal Primary ammonia reference materials fulfilling EU quality data Gas Analysis 2017
30
Measurement report METAS
Cylinder number 5904243
Measurement 1
Component Date (ddmmyy)
Result (micromolmol)
Standard deviation ( relative)
number of replicates
Ammonia 11032019
14032019
1293 048 2
Measurement 2
Component Date (ddmmyy)
Result (micromolmol)
Standard deviation ( relative)
number of replicates
Ammonia 12032019 1300 049 1
Measurement 3
Component Date (ddmmyy)
Result (micromolmol)
Standard deviation ( relative)
number of replicates
Ammonia 12032019
14032019
1293 048 2
Measurement 4
Component Date (ddmmyy)
Result (micromolmol)
Standard deviation ( relative)
number of replicates
Ammonia 12032019
14032019
1293 048 2
Measurement 5
Component Date (ddmmyy)
Result (micromolmol)
Standard deviation ( relative)
number of replicates
Ammonia 12032019
13032019
1289 049 2
31
Results
Component Date (ddmmyy)
Result (micromolmol)
Expanded uncertainty (micromolmol)
Coverage factor
Ammonia 140319 1294 013 2
Calibration standards
We generated dynamically the calibration standards (permeation method [1]) using one of the METAS primary magnetic suspension balances (MSB Rubotherm GmbH Germany) a NH3 permeation unit of 9998 purity (Fine Metrology Srls Italy) and nitrogen 60 as matrix and dilution gas (Fig1) Total matrix and dilution gas flows were measured by calibrated flow meters placed before and after the MSB permeation chamber (Red-y GSC-B9TT-BB23 Voumlgtlin Instruments Switzerland)
Fig 1 Permeation system to generate the NH3 reference gas mixtures used to calibrate the analysers
The permeation rate ndash (3113 plusmn 27) ngmin (k = 2) at 48degC and 2600 hPa minus was estimated as the mass loss of the permeation unit during a period of 137 hours after a 3-day stabilization period within the MSB Calibration standards were produced using the first dilution system of the magnetic suspension balance (Fig 1) Different flow rates within the range between 10 L and 52 L were led to the mixing tee as shown in Fig 1 Calibration standard values were estimated using Eq 1
X NH3 = ((qmC PU (VMN2MNH3)) qv) + Xres NH3 [Eq 1]
where
XNH3 NH3 calibration standard (nmolmol) qmC permeation rate (gmin) PU purity of the permeation unit (09998) VM molar volume of the matrixdilution gas (mLmol) MNH3 molar mass of NH3 (gmol) qv total gas flow (matrix + dilution mLmin) XresNH3 residual amount fraction of NH3 in the matrixdilution gas (nmolmol)
Each calibration standard was generated for 90 minutes the first 60 minutes were considered the stabilization time of the system and the last 30 minutes the measuring period
Instrumentation
32
We used two calibrated NH3 analysers based on cavity ring-down spectrometry for this key comparison G2103 (SN 1283-AEDS-2035) and G1103t (SN 127-CPVU-AF004) (Picarro Inc CA USA) Cavity and sampling handling of the analyser G2103 are coated with SilcoNert 2000 The minimum sample flow rates of the analysers were 08 slm (G1103t) and 18 slm (G2103) We placed a distribution tee at the supply inlet of the analysers to ensure overflow The gas mixtures were fed to one end of the distribution tee through a coated tube (SilcoNert 2000 18) and a particle filter The particle filter in G2103 analyser was a coated in-line-filter with nominal pore dimension of 05 microm (SS-4F-05 Swagelok) The particle filter in G1003t analyser was a PFTE membrane filter with nominal pore dimension of 5 microm within a PFA filter holder (TE 47 supporting fabric PES Whatman Switzerland) We connected the other end of the distribution tee to a flowmeter (serie 1350 Wisag AG Switzerland) the overflow was then fed to the exhaust tube G2103 and G1003t analysers recorded reading values every 1 and 3 seconds respectively
Calibration method and value assignment
We let the two NH3 analysers running for 24 hours with nitrogen 60 for stabilization purposes before calibrating them For both analysers nitrogen 60 was concentration zero We produced 5 calibration standards between 79 and 212 nmolmol to calibrate G2103 and 4 calibration standards between 81 and 404 nmolmol to calibrate G1103t For each calibration standard the amount fraction value read by the analyser was the average reading of the last-30 minutes of generation
We obtained one calibration curve per analyser [Eq 2] by linear regression using the least square method [2] Table 1 includes values of the calibration curve parameters for each analyser
Xread = a + b Xgen [Eq 2]
where
Xread average analyser readings of the last 30 minutes of generation (nmolmol) a intercept of the linear regression (nmolmol) b slope of the linear regression Xgen average of the amount fraction generated by the permeation method during the last
30 minutes of generation (nmolmol)
Table 1 Calibration curve parameters of the used NH3-analysers
Analyser Intercept (a) (nmolmol)
Slope (b) Number of observations
G2103 0714 10056 518
G1103t 0057 09996 1988
In order to assign the transfer standard value we generated several gas mixtures within the calibration range of the analysers by diluting the transfer standard We used a dilution system (Fig 2) formed by a compact pressure regulator (KCP1GRM2D1P20000 Swagelok Company OH USA) two critical orifices (LNI Swissgas SA Switzerland) two pressure controllers (Bronkhorst High-Tech BV the Netherlands) one mass flow controller (GSC Red-y Voumltglin Instruments GmbH Switzerland) All the listed elements as well as the tubing of the dilution system were coated (SilcoNert 2000 SilcoTek Corporation PA USA) All the flows of the dilution system (ie critical orifices MFC) were calibrated with the primary volumetric standard of METAS
33
Fig 2 Dilution system for the transfer standard using a cascade of critical orifices
We used a lab water bath to keep the critical orifices at 220degC We monitored the water temperature with a calibrated NTC thermistor connected to a multimeter (Almemo 2390-5 Ahlborn Mess- und Regelungstechnik GmbH Germany) Pressure before the critical orifices was kept at 900 bar with the pressure reduction valve After the first critical orifice we regulated the pressure at 400 bar using one of the pressure controllers The dilution gas (N2 60) was led at different flow rates to the mixing tee located after the cascade of critical orifices through the mass flow controller We regulated the pressure after the mixing coil at 100 bar
We generated each gas mixture for 120 minutes 80 minutes of system stabilization (including analysers) and 40 minutes of measurement For the first gas mixture generated we increased the time up to 360 minutes to account for stabilization time of the critical orifices (240 minutes) We performed 5 measurements with two replicates each except for the second measurement (one replicate) The first replicate of each measurement took place before the homogenization of the transfer standard which happened on 13032019 for 4 hours The temperature in the lab during the measurements was (200 plusmn 10)degC
The amount fractions read by the analysers were corrected using the calibration equation to estimate the amount fraction generated by the dilution system (Eq 3)
XNH3 = (Xread - a) b [Eq 3]
where
XNH3 amount fraction generated by the dilution system (nmolmol)
Xread amount fraction read by the analysers (nmolmol)
a intercept of the linear regression (nmolmol) (Table 1)
b slope of the linear regression (Table 1)
We estimated the amount fraction of NH3 in the transfer standard for each replicate (Eq 4)
Xcyli = (XNH3 (qvMFC + qvco) qvco) + XresNH3 [Eq 4]
where
Xcylij NH3 amount fraction in transfer standard estimated during measurement i (i = 1hellip5)
replicate j (i = 1 2) (nmolmol)
XNH3 NH3 amount fraction generated by the dilution system (nmolmol)
qvMFC diluting gas flow (mLmin)
qvco transfer standard flow through the critical orifices (mLmin)
XresNH3 residual NH3 amount fraction in the diluting gas (nmolmol)
The resulting amount fraction values of each pair of replicates were average to get a single value per
measurement
The final amount fraction value assigned to the transfer standard was the average of the five
measurements (Eq 5)
34
Xcyl5904243 = ((Xcylm1 + Xcylm2 + Xcylm3 + Xcylm4 + Xcylm5) 5 ) 10-3 [Eq 5]
where
Xcyl5904243 NH3 amount fraction assigned to the transfer standard 5904243 (micromolmol)
Xcylm1 NH3 amount fraction estimated in measurement 1 (average 2 replicates) (nmolmol)
Xcylm2 NH3 amount fraction estimated in measurement 2 (nmolmol) Xcylm3 NH3 amount fraction estimated in measurement 3 (average 2 replicates)
(nmolmol) Xcylm4 NH3 amount fraction estimated in measurement 4 (average 2 replicates)
(nmolmol) Xcylm5 NH3 amount fraction estimated in measurement 5 (average 2 replicates)
(nmolmol) Uncertainty evaluation
We evaluated the measurement uncertainty for this key comparison using the software GUM Workbench Pro (version 241 Metrodata GmbH Germany sn 05-24-00002020-0) The uncertainty propagation through the calculation followed the GUM rules [3] The main contributions to the combined standard uncertainty were the slope dispersion of the temporal mass loss of the permeation unit and the standard uncertainties of the flow measurements of the critical orifices used in the dilution system
Model equations
Uncertainty contribution of the magnetic suspension balance qm(m1m2t1t2SC) = ((((m1 - NP1) Kkalread1) - ((m2 - NP2) Kkalread2)) Kkal (t2 - t1)) SC 10^9
Kkal = Kalhigh-Kallow
Kkalread1 = Kalhighread1 - Kallowread1
Kkalread2 = Kalhighread2 - Kallowread2
Uncertainty contribution of the permeation unit used to generate reference gas mixtures to calibrate the
analysers
qmC = qm(m1Cm2Ct1Ct2CSC)
Uncertainty contribution of the reference gas mixtures VMN2 = 1000 (2 MN) dN2
MNH3 = MN + 3 MH
XMSB(qmC PU VMN2 MNH3 qv XresNH3)= ((qmCPU(VMN2MNH3))qv) + XresNH3
Example for G1103t analyser X0MSBe = 0 + XresNH3 0 ppb
X1MSBe = XMSB(qmC PU VMN2 MNH3 qv1e XresNH3)
[hellip]
X4MSBe = XMSB(qmC PU VMN2 MNH3 qv4e XresNH3)
Xgenemean = (X0MSBe + X1MSBe + X2MSBe + X3MSBe + X4MSBe) 5
Xreademean = (X0eread + X1eread + X2eread + X3eread + X4eread) 5
Linear regression of the calibration least square method Xread = a + b Xgen
Example for G1103t analyser be = pe qe
pe = (X0MSBe - Xgenemean) (X0eread - Xreademean) + (X1MSBe - Xgenemean) (X1eread - Xreademean) +
(X2MSBe - Xgenemean) (X2eread - Xreademean) + (X3MSBe - Xgenemean) (X3eread - Xreademean) +
(X4MSBe - Xgenemean) (X4eread - Xreademean)
qe = (X0MSBe - Xgenemean)^2 + (X1MSBe - Xgenemean)^2 + (X2MSBe - Xgenemean)^2 + (X3MSBe - Xgenemean)^2 +
(X4MSBe - Xgenemean)^2
ae = Xreademean - be Xgenemean
35
Uncertainty contribution of the dilution system used to generate the calibration standards XNH3(Xread a b) = (Xread - a) b
Measurement 1
X11NH3 = XNH3(Xread11 ae be)
X12NH3 = XNH3(Xread12 ae be)
[hellip]
Measurement 5 X51NH3 = XNH3(Xread51 am bm)
X52NH3 = XNH3(Xread52 am bm)
Xcyl(XNH3 qvMFC qvco XresidualNH3) = (XNH3 (qvMFC + qvco) qvco ) + XresNH3
Example Measurement 1
Xcylm11= Xcyl(X11NH3 qvMFCdil11 qvco XresNH3)
Xcylm12 = Xcyl(X12NH3 qvMFCdil12 qvco XresNH3)
Xcylm1 = ((Xcylm11 + Xcylm12) 2) 1000
Amount fraction NH3 in gas cylinder to calibrate Xcyl5904243 = ((Xcylm1 + Xcylm2 + Xcylm3 + Xcylm4 + Xcylm5) 5)
Quantity Unit Definition
NP1 g uncertainty contribution of the zero point correction correction of lift change at time 1 due to atmospheric pressure variation
Kkalread1 g differences between the readings of the calibration masses during time 1
NP2 g uncertainty contribution of the zero point correction correction of lift change at time 2 due to atmospheric pressure variation
Kkalread2 g differences between the readings of the calibration masses during time 2
Kkal g mass difference between the calibration masses according to certificate
Kalhigh g heavy calibration mass
Kallow g light calibration mass
Kalhighread1
g balance reading of heavy calibration mass at time 1
Kallowread1
g balance reading of light calibration mass at time 1
Kalhighread2
g balance reading of heavy calibration mass at time 2
Kallowread2
g balance reading of light calibration mass at time 2
qmC ngmin permeation rate at 48degC and 2600 hPa
m1C g permeator mass at time 1
m2C g permeator mass at time 2
t1C min time1
t2C min time2
SC uncertainty contribution of the slope dispersion (relative standard deviation of single measurement) VMN2 mLmo
l molar volume N2 (dilution gas)
MN gmol N atomic mass
dN2 gL density N2 (dilution gas)
MNH3 gmol NH3 molar mass
MH gmol H atomic mass
X0MSBe ppb calibration amount fraction (0 ppb) (G1103t analyser)
XresNH3 ppb residual NH3 in dilution gas
XiMSBe ppb calibration amount fraction i (i = 1 hellip 4) (G1103t analyser)
PU purity of the permeator (from 0 to 1)
qvie mLmin
flow MFM (dil1) calibration point i (i = 1 hellip 4) (G1103t analyser)
Xgenemean ppb average amount fraction NH3 generated for calibration G1103t analyser
Xreademean ppb average amount fraction NH3 read by G1103t analyser
36
Quantity Unit Definition
Xieread ppb read amount fraction i (i = 0 hellip 4) (G1103t analyser)
Xreadmmea
n ppb average amount fraction NH3 read by G2103 analyser
Ximread ppb read amount fraction i (i = 0 hellip 5) (G2103 analyser)
be slope of the linear regression (G1103t analyser)
ae ppb intercept of the linear regression (G1103t analyser)
XijNH3 ppb amount fraction ij (i = 1 hellip 5 j = 1 2) generated for calibration gas cylinder
Xreadij ppb amount fraction read by the analyser during the generation of XijNH3
Xcylmij ppb amount fraction estimated in measurement i (i = 1hellip5) replicate j (j = 1 2)
qvMFCdilij mLmin
average flow MFC measurement 1 i (i = 1hellip5) replicate j (j = 1 2)
qvco mLmin
flow critical orifices dilution system
Xcylmi ppm average amount fraction NH3 measurement i (replicates 1 and 2)
Xcyl5904243 ppm amount fraction NH3 in cylinder intercomparison CCQM-K117 (average 5 measurements)
Uncertainty budget of the amount fraction NH3 in cylinder 5904243
Quantity Value Standard
Uncertainty
Distribution Sensitivity
Coefficient
Uncertainty
Contribution
Index
NP1 00 g 289middot10-9 g rectangular -5000 -15middot10-3 ppm 00
NP2 00 g 289middot10-9 g rectangular 5000 15middot10-3 ppm 00
Kalhigh 299923070 g 250middot10-6 g normal 059 15middot10-6 ppm 00
Kallow 79516970 g 200middot10-6 g normal -059 -12middot10-6 ppm 00
m1C 22667813150 g 289middot10-9 g rectangular 5000 15middot10-3 ppm 00
m2C 22665248260 g 289middot10-9 g rectangular -5000 -15middot10-3 ppm 00
t1C 42990500 min 00250 min normal 16middot10-3 39middot10-6 ppm 00
t2C 125393200 min 00250 min normal -16middot10-3 -39middot10-6 ppm 00
SC 100000 440middot10-3 normal 13 0057 ppm 844
MN 14006855 gmol 174middot10-6 gmol triangular 016 28middot10-6 ppm 00
dN2 1250100 gL 150middot10-6 gL normal -10 -15middot10-3 ppm 00
MH 10079750 gmol 551middot10-6 gmol triangular -23 -130middot10-6 ppm 00
XresNH3 0300 ppb 0122 ppb triangular 010 0013 ppm 42
PU 09998000 816middot10-6 triangular 13 11middot10-3 ppm 00
qv1e 505412 mLmin 505 mLmin normal -210middot10-6 -11middot10-3 ppm 00
qv2e 283349 mLmin 283 mLmin normal -610middot10-6 -17middot10-3 ppm 00
qv3e 182734 mLmin 183 mLmin normal -13middot10-3 -23middot10-3 ppm 01
qv4e 101334 mLmin 101 mLmin normal -26middot10-3 -26middot10-3 ppm 02
qv1m 517612 mLmin 518 mLmin normal -120middot10-6 -600middot10-6 ppm 00
qv2m 432371 mLmin 432 mLmin normal -170middot10-6 -720middot10-6 ppm 00
qv3m 334264 mLmin 334 mLmin normal -280middot10-6 -930middot10-6 ppm 00
qv4m 233309 mLmin 233 mLmin normal -560middot10-6 -13middot10-3 ppm 00
qv5m 192960 mLmin 193 mLmin normal -820middot10-6 -16middot10-3 ppm 00
X0eread 04070 ppb 00148 ppb normal -0015 -220middot10-6 ppm 00
X1eread 831070 ppb 00203 ppb normal -0013 -270middot10-6 ppm 00
X2eread 1468460 ppb 00192 ppb normal -0012 -230middot10-6 ppm 00
X3eread 2258690 ppb 00496 ppb normal -0010 -510middot10-6 ppm 00
X4eread 407316 ppb 0120 ppb normal -65middot10-3 -780middot10-6 ppm 00
X0mread 029100 ppb 794middot10-3 ppb normal -77middot10-3 -61middot10-6 ppm 00
37
Quantity Value Standard
Uncertainty
Distribution Sensitivity
Coefficient
Uncertainty
Contribution
Index
X1mread 792370 ppb 00108 ppb normal -76middot10-3 -82middot10-6 ppm 00
X2mread 951300 ppb 00126 ppb normal -76middot10-3 -96middot10-6 ppm 00
X3mread 12311600 ppb 911middot10-3 ppb normal -76middot10-3 -69middot10-6 ppm 00
X4mread 1758460 ppb 00230 ppb normal -75middot10-3 -170middot10-6 ppm 00
X5mread 2123110 ppb 00223 ppb normal -75middot10-3 -170middot10-6 ppm 00
Xread11 1234340 ppb 00118 ppb normal 0011 120middot10-6 ppm 00
Xread12 1221120 ppb 00119 ppb normal 0011 130middot10-6 ppm 00
Xread21 1088070 ppb 00122 ppb normal 0024 290middot10-6 ppm 00
Xread31 2232720 ppb 00132 ppb normal 58middot10-3 77middot10-6 ppm 00
Xread32 2224780 ppb 00139 ppb normal 58middot10-3 81middot10-6 ppm 00
Xread41 12120000 ppb 416middot10-3 ppb normal 0011 44middot10-6 ppm 00
Xread42 12149700 ppb 408middot10-3 ppb normal 0011 43middot10-6 ppm 00
Xread51 10690500 ppb 398middot10-3 ppb normal 0012 48middot10-6 ppm 00
Xread52 10637900 ppb 429middot10-3 ppb normal 0012 52middot10-6 ppm 00
qvMFCdil11 220138 mLmin 220 mLmin normal 590middot10-6 13middot10-3 ppm 00
qvco 208600 mLmin 00313 mLmin normal -061 -0019 ppm 97
qvMFCdil12 220140 mLmin 220 mLmin normal 580middot10-6 13middot10-3 ppm 00
qvMFCdil21 250173 mLmin 250 mLmin normal 10middot10-3 26middot10-3 ppm 02
qvMFCdil31 120028 mLmin 120 mLmin normal 11middot10-3 13middot10-3 ppm 00
qvMFCdil32 120028 mLmin 120 mLmin normal 11middot10-3 13middot10-3 ppm 00
qvMFCdil41 220139 mLmin 220 mLmin normal 580middot10-6 13middot10-3 ppm 00
qvMFCdil42 220138 mLmin 220 mLmin normal 580middot10-6 13middot10-3 ppm 00
qvMFCdil51 250172 mLmin 250 mLmin normal 510middot10-6 13middot10-3 ppm 00
qvMFCdil52 250171 mLmin 250 mLmin normal 510middot10-6 13middot10-3 ppm 00
Xcyl5904243 129369 ppm 00618 ppm
References
[1] ISO 6145-102002 Gas analysis ndash Preparation of calibration gas mixtures using dynamic volumetric methods ndash Part 10 Permeation method
[2] Cantrell CA (2008) Technical Note Review of methods for linear least-squares fitting of data and application to atmospheric chemistry problems Atmospheric Chemistry and Physics 8 5477 ndash 5487
[3] Joint Committee for Guides in Metrology Evaluation of measurement data ndash Guide to the expression of uncertainty in measurement (GUM) JCGM 1002008 httpswwwbipmorgutilscommondocumentsjcgmJCGM_100_2008_Epdf
38
Measurement report KRISS
Cylinder number D597002
Measurement 1
Component Date (ddmmyy)
Result (micromolmol)
Standard deviation ( relative)
number of replicates
Ammonia 280119 1355 03 3
Measurement 2
Component Date (ddmmyy)
Result (micromolmol)
Standard deviation ( relative)
number of replicates
Ammonia 290119 1360 04 3
Measurement 35
Component Date (ddmmyy)
Result (micromolmol)
Standard deviation ( relative)
number of replicates
Ammonia 300119 1356 01 3
Results
Component Date (ddmmyy)
Result (micromolmol)
Expanded uncertainty (micromolmol)
Coverage factor
Ammonia 1357 015 2
Calibration standards
‒ Method of preparation
Gas mixtures were prepared gravimetrically and their masses were determined using an automated top-pan balance (XP26003L Mettler Toledo) with 26 kg capacity and 1 mg resolution
‒ Weighing data
Primary reference gas mixtures which were used to analyse a key comparison sample were prepared with 3-step dilutions from a pure material to a range of from about 10 μmolmol to about 17 μmolmol
5 If more than three measurements are taken please copy and insert a table of the appropriate format as necessary
39
Gravimetric preparation hierarchy
‒ Purity tables (composition) of the parent gases
Components Amount fraction (μmolmol)
Distribution Standard uncertainty (μmolmol)
Analytical methods
He 05 Rectangular 029 MS
Ar 05 Rectangular 029 MS
N₂ 587 Normal 117 GCDID
H₂ 05 Rectangular 029 GCDID
O₂ 05 Rectangular 029 GCDID
CO₂ 342 Normal 068 GCDID
CO 05 Rectangular 029 GCDID amp FTIR
H₂O 272 Normal 815 FTIR
CH₄ 05 Rectangular 029 GCDID amp FTIR
THC 469 Normal 094 GCFID
NO 25 Rectangular 144 FTIR
NO₂ 25 Rectangular 144 FTIR
N₂O 25 Rectangular 144 FTIR
NH₃ 999704 9031
‒ Physical adsorption loss
In order to estimate physical adsorption loss onto the internal surface of a sample cylinder at about 13 μmolmol using cylinder-to-cylinder division method (Lee et al 2017) a newly prepare primary reference gas mixture (Performax D716756) was divided into another new cylinder (Performax D716790) and then analysed against each other Results from multiple analysis show that a response ratio (daughter to mother) is significantly less than 1 which indicates physical adsorption loss occurred during or a short time after the preparation Therefore gravimetrically determined amount fractions
20000 μmolmol
ME5696
NH₃
500 μmolmol
D746900
NH₃
500 μmolmol
D746904
NH₃
500 μmolmol
D746907
NH₃
500 μmolmol
D746901
NH₃
9997 cmolmol
NH₃
20000 μmolmol
MD2562
NH₃
136 μmolmol
D716752
NH₃
135 μmolmol
D716756
NH₃
164 μmolmol
D726465
NH₃
107 μmolmol
D716787
NH₃
135 μmolmol
NH₃
Physical adsorption loss
6L AL Luxfer
10L AL Luxfer
10L Performax
Pure NH₃
40
and their uncertainties are recalculated to account the physical adsorption loss on the cylinder internal surface
Results from Cylinder-to-cylinder division
‒ Verification measures
Primary reference gas mixtures were analysed to verify their gravimetric preparation using NDIR analyser (ULTRAMAT 6 Siemens) Results show that primary reference gas mixtures agree well within their associated uncertainties of about 1 (k = 2)
Results from verification measurement
Instrumentation
A NDIR gas analyser was used to verify primary reference gas mixtures and analyse a sample for this key comparison
Calibration method and value assignment uncertainty evaluation
A sample for this comparison was analysed against a KRISS primary reference gas mixture (D716752) using a NDIR gas analyser The sample analysis has done by alternating between the gas mixtures (ie PRMKRISS ndash PRMKC ndash PRMKRISS ndash PRMKC ndash PRMKRISS ndash PRMKC ndash PRMKRISS) at three different days The amount fraction of the KC sample cylinder is determined by the following equation for each measurement
119909119870119862119894119895 = 119909119870119877119868119878119878 times 119877119894119895
0973
096
097
098
099
100
101R
esp
on
se r
atio
(dau
ghte
rm
oth
er)
D716787 D726465 D716752 D716756
1000 1004 1005 1000
1000
1004 1005
1000
097
098
099
100
101
102
103
No
rmal
ize
d s
en
siti
vity
NH₃ (10 micromolmol - 17 micromolmol)
41
119906(119909119870119862119894119895) = 119909119870119862119894119895 times radic(119906(119909119870119877119868119878119878
119909119870119877119868119878119878)
2
+ (119906(119877119894119895)
119877119894119895)
2
where 119909119870119862119894119895 is the amount fraction of KC gas mixture 119909119870119877119868119878119878 is the amount fraction of KRISS
PRM and 119877119894119895 is the analyserrsquos response ratio of 15 repeated measurements (ie response of
PRMKC to response of PRMKRISS) At three different days (i=1 2 3) three repeated measurements (j= 1 2 3) have been conducted The total number of measurements are 9 for three days
average 1st analysis 2nd analysis
3rd analysis
1st day measurement 1199091198701198621119886119907119892 11990911987011986211 11990911987011986212 11990911987011986213
2nd day measurement 1199091198701198621119886119907119892 11990911987011986221 11990911987011986222 11990911987011986223
3rd day measurement 1199091198701198621119886119907119892 11990911987011986231 11990911987011986232 11990911987011986233
Reported final results 119961119922119914119943 119958(119961119922119914119943)
119909119870119862119894119886119907119892 =1199091198701198621198941 + 1199091198701198621198942 + 1199091198701198621198943
3
119909119870119862119891 =1199091198701198621119886119907119892 + 1199091198701198622119886119907119892 + 1199091198701198623119886119907119892
3
Uncertainty budget of reported final results (119961119922119914119943)
Uncertainty component
Standard uncertainty
μmolmol
Contribution to uncertainty
Analytical repeatability
0033 187
Analytical reproducibility
0014 36
KRISS PRM 0067 777
Combined 0076
Important note
The pressure of the key comparison sample cylinder was checked as about 250 psig prior its analysis The residual pressure was checked as 200 psig after the analysis and returned to NIST
References
42
Lee et al 2017 Determination of physical adsorption loss of primary standard gas mixtures in cylinders using cylinder-to-cylinder division Metrologia 54 L26
43
Measurement report NIM
Cylinder number 5904239
Measurement 1
Component Date (ddmmyy)
Result (micromolmol)
Standard deviation ( relative)
number of replicates
Ammonia 23042019 1394 052 4
Measurement 2
Component Date (ddmmyy)
Result (micromolmol)
Standard deviation ( relative)
number of replicates
Ammonia 24042019 1385 026 4
Measurement 36
Component Date (ddmmyy)
Result (micromolmol)
Standard deviation ( relative)
number of replicates
Ammonia 25042019 1389 081 4
Measurement 4
Component Date (ddmmyy)
Result (micromolmol)
Standard deviation ( relative)
number of replicates
Ammonia 26042019 1374 033 4
Results
Component Date (ddmmyy)
Result (micromolmol)
Expanded uncertainty (micromolmol)
Coverage factor
Ammonia 26042019 1385 020 2
1 Calibration standards
11 Preparation method and cylinder treatment
The standards were prepared by gravimetric method all the cylinders used were pumped to lower than 1times10-4 Pa a 65 heating temperature was set and lasted for more than 8 hours to remove moisture in cylinders at the same time
12 Filling and weighing
Three steps were selected to fill gas to targeted concentration from pure ammonia and pure nitrogen
6 If more than three measurements are taken please copy and insert a table of the appropriate format as necessary
44
The first step pure NH3 and pure N2 were added into cylinder to gain mole fraction of 2 mol∙mol-
1
The second step 2 mol∙mol-1 NH3N2 was further diluted by nitrogen to reach a more lower concentration of 300 μmol∙mol-1
The third stepthe two standards were finally prepared by diluting 300 μmol∙mol-1 NH3N2
The typical amount of gas filled in each step is presented in Fig 1 The balance used is Metter XP26003L capacity 26 kg Readability 1 mg A substitution method (A-B-A) was selected when weighing here A represents reference cylinder B represents sample cylinder
Concentrationrsquos calculation equation is according to ISO 6142
=
=
=
=
=
P
A
n
i
iAi
A
P
A
n
i
iAi
AAi
i
Mx
m
Mx
mx
x
1
1
1
1
)(
)(
Figure 1 Three filling steps with added gas weight each
13 Purity data of parent gases
Purity data of parent gases N2 and NH3 are shown in Table 1 and Table 2 with the analysis method for common impurity components
300μmolmol NH3N2
c=29999 μmol∙mol-1
2 NH3N2
c=19985 mol∙mol-1
Pure NH3
N2 +1142846g
NH3+14168g
N2 +1138826 g
2NH3N2+17218g
g
N2 + 647420 g
003NH3N2+ 31529g
N2 + 660249 g
003NH3N2+30963
g
1396 μmol∙mol-1 NH3N2
1346 μmol∙mol-1 NH3N2
45
Table 1 Purity of N2
Component Method Mole fraction (μmol∙mol-1)
Distribution Uncertainty (μmol∙mol-1)
O2 Oxygen Analyzer 0030 Rectangular 0014
Ar GC-PDHID 500 Normal 29
H2 GC-PDHID 005 Rectangular 003
H2O CRDs 010 Rectangular 006
CO GC-PDHID 0030 Rectangular 0014
CO2 GC-PDHID 0010 Rectangular 0006
CH4 GC-PDHID 0030 Rectangular 0014
N2 - 9999497 - 29
Table 2 Purity of NH3
Component Method Mole fraction (μmol∙mol-1)
Distribution Uncertainty (μmol∙mol-1)
Ar GC-PDHID 0350 Normal 0035
O2 GC-PDHID 079 Normal 008
THC (CH4) GC-PDHID 0010 Rectangular 0006
H2O - 10 Rectangular 06
N2 GC-PDHID 17 Normal 05
NH3 - 9999962 - 08
14 Verification of standards
In the verification measurements the two intermediate mixed gases of 300μmol∙mol-1 NH3N2 obtained from two different filling route were verified through FTIR one cylinder was chose as standard with which the other cylinder was calibrated the results showed the these two cylinders have good consistency their difference between gravimetric mole fraction and the calibrated mole fraction was smaller than 01 Similarly for the final standards each concentration point (135 μmol∙mol-1 and 139 μmol∙mol-1) was prepared two cylinders the differences between each two cylinders were both smaller than 02
2 Instrumentation
The main instrument used in this comparison is FT-IR Spectrometer with the trade name MultiGasTM analyzer (Models 2032 MKS company) which equipped with necessary components for this kind of instrument The detector is mercury-cadmium-telluride (MCT) which is cooled by a thermo-electrically mode The sample cell has a path length of 511m The resolution is 1 cm-1 the scan number for each spectrum was set at 120 with a total scan time of 1 minute To obtain a
46
clean background the whole system was purged by high-purity nitrogen of which the flow was set at 200 mL∙min-1 for sample cell and 800 mL∙min-1 for other parts of the spectrometer Besides the temperature for the sample cell was kept at 357 and its inner pressure was equal to the ambient atmospheric pressure Two absorption regions (3166~3285) cm-1 and (3409~3475) cm-
1 were selected to determinate the targeted analyte while the reading was obtained through automatically integrating by the instrument itself
3 Calibration method and value assignment
As for the calibration of the comparison sample two-points calibration method was used As shown in Figure 2 standard 1 represents the lower concentration point 1346 μmol∙mol-1 NH3N2 and standard 2 represents the higher concentration point 1396 μmol∙mol-1 NH3N2 When sampling the flow was kept at 200 mL∙min-1 and lasted for at least 1 hour to make reading stabilization The assigned value was calculated in the following formulae
( )
( )( )2 1
0 1 0 1
2 1
C CC C R R
R R
minus= + minus
minus
Here C0 represents the mole fraction of the comparison sample C1 represents the mole fraction of the standard 1 at lower concentration point C2 represents the mole fraction of the standard 2 at higher concentration point R0 represents the instrument reading from the comparison sample R1 represents the instrument reading from the standard 1 at lower concentration point R2 represents the instrument reading from the standard 2 at higher concentration point
Figure 2 Measurement setup
Uncertainty evaluation
The contributions to combined standard uncertainty were from preparation of
gravimetric method repeatability of verification in one day and in different days 2
2
2
1
2
ververprepc uuuu ++=
Here u means relative standard uncertainty
uc Combined uncertainty of assigned concentration value of NH3 in the comparison
cylinder
uprep Uncertainty from gravimetrical preparation
uver1 Uncertainty from repeatability of verification in one day
uver2 Uncertainty from repeatability of verification in different 4 days
V-4
Multi-Channel
Valve
Outlet
Comparison Sample
Standard 1
Standard 2
FT-IR
Spectrometer
MFC
47
Table 3 Uncertainty budget
Source of uncertainty uprep uver1 uver2
Relative standard uncertainty 03 05 04
Relative expanded uncertainty 15 ( k=2 )
48
Measurement report NIST
Cylinder number 5904173
Measurement 1
Component Date (ddmmyy)
Result (micromolmol)
Standard uncertainty (micromolmol)
number of replicates
Ammonia 231018 1360 021 6
Measurement 2
Component Date (ddmmyy)
Result (micromolmol)
Standard uncertainty (micromolmol)
number of replicates
Ammonia 231018 1360 032 6
Measurement 3
Component Date (ddmmyy)
Result (micromolmol)
Standard uncertainty (micromolmol)
number of replicates
Ammonia 231018 1362 019 6
Measurement 4
Component Date (ddmmyy)
Result (micromolmol)
Standard uncertainty (micromolmol)
number of replicates
Ammonia 241018 1370 024 6
Measurement 5
Component Date (ddmmyy)
Result (micromolmol)
Standard uncertainty (micromolmol)
number of replicates
Ammonia 241018 1367 025 6
Measurement 6
Component Date (ddmmyy)
Result (micromolmol)
Standard uncertainty (micromolmol)
number of replicates
Ammonia 241018 1370 042 6
Results
Component Date (ddmmyy)
Result (micromolmol)
Expanded uncertainty (micromolmol)
Coverage factor
Ammonia 251018 1364 020 k=2
Calibration standards
Since NIST does not house primary standard mixtures (PSMs) of NH3 in the amount-of-substance fraction range of 10 micromolmol ndash 30 micromolmol standards were prepared by use of a permeation device system (PDS) Permeation tubes were purchased that were 65 cm in length with a nominal permeation rate of 2860 ngmin plusmn 15 at 34ordm C Four permeation tubes were inserted into the
49
permeation device system (PDS) which was setup in continuous-weighing-mode in compliance with ISO 6145 Part 10 [1] and internal procedures The mass of the four NH3 permeation tubes was measured every fifteen minutes using a Rubotherm magnetic suspension balance The mass resolution of the balance is 0001 mg The total gas flow from the PDS was measured by a DH Instruments (DHI) MolBloc (1E3 Series) flow meter to an uncertainty of 01 relative The MolBoc had been previously calibrated by flowing known masses of nitrogen across the flow meter following internal procedures See figure 1 for permeation schematic setup The gas flow over the permeation tubes was kept constant at 800 mlmin By varying the dilution gas flow a suite of NH3 standards could be produced on demand A permeation rate in g min-1 was determined for the mean amount-of-substance fraction to be analyzed using equation 1 and was converted to mol min-1 using equation 2 Permeation Rate (g min-1) (Eq 1)
Permeation Rate (mol min-1) (Eq 2)
qm Perm Rate (g min-1)
M Molar Mass of Ammonia (g)
Figure 2 Schematic of the basic elements of the Permeation Device System
qm Permeation Rate (g min-1)
m Mass (g)
t time (min)
119902m = 119904119897119900119901119890 |Δ119898
Δ119905| sdot 106
119902m =119902m
119872
50
Impurity Analysis The purchased tubes were stated to be ge 99999 pure from the manufacturer The dilution gas used for generating the standard was N2 nominal purity was ge 99999 Impurity data was obtained for the permeation tubes from the manufacturer and were stated to be
Component Amount-of-substance fraction
Carbon Dioxide lt 1 micromolmol Carbon Monoxide lt 01 micromolmol Methane lt 01 micromolmol Water lt 2 micromolmol
Impurity data for the gas generated by the permeation tubes was obtained by diverting the gas flow stream from the permeation device system to a Nicolet Nexus 670 fourier-transform infrared spectroscopy (FTIR) instrument with a mercury cadmium telluride (MCT) detector The FTIR was also equipped with a 15L Specac 10 meter fixed path length Cyclone gas cell The gas cell was filled with dilution gas in this case nitrogen and a background was obtained A second analysis of the nitrogen was obtained to verify that a background subtraction was occurring and that there was no ammonia present in the matrix gas The gas cell was then filled with the unknown gas sample to 800 torr and vacuum evacuated This purge cycle was repeated six times After the sixth evacuation cycle the gas was set to continuously flow while maintaining a cell pressure of 760 torr Six spectra were then collected at 256 scans with a resolution of 05 cm-1 and averaged together See Figure 2 for comparative spectra of the matrix gas and perm tube flow Impurities were evaluated from the resulting spectra with nothing measurable being detected above baseline therefore the purity of the permeation tubes is the stated ge 99999
51
Figure 2 Nitrogen background and perm tube gas spectra
Instrumentation The ammonia (NH3) component of the unkown sample (Cylinder 5904173) was analyzed by chemiluminescence (Eco Physics Model CLD 844) Delivery pressure (10 psig) to the analyzer was controlled by a high purity stainless steel two stage regulator dedicated to ammonia service (DIN14) The regulator was purged for one hour at a sample gas flow rate of approximately 300 mLmin before data analysis was conducted From this sample flow an analysis range was established based on the nominal amount-of-substance fraction from the cylinder The analyzer was purged (at a flow of approximately 300 mlmin) for five minutes before sample data was collected
Calibration method and value assignment
Six calibration curves were produced (see table 1) from the standards that were prepared by use of the PDS for the submitted CCQM-K117 sample in the range of 10-15 umolmol The CCQM-K117 submitted sample was used as the analytical control for the curves The ammonia amount-of-substance fraction for the submitted CCQM-K117 sample was predicted from the calibration curves Sample selection of control or the on-demand standard (from the PDS) was achieved by using a Computer Operated Gas Analysis System (COGAS) This COGAS was configured so that the control was always flowing as either 300 mLmin to the analyzer (when the standard from the PDS flowed to vent) or 100 mLmin to vent (when the standard from the PDS was flowing to the analyzer) The analytical sequence was control standard 1 standard 2 control standard 3 et cetera until all six standards had been bracketed by the control Each data point is an average of 60 readings taken at 1s intervals with 6 replicate measurements recorded for each The sequence was repeated six times with the order of the standards being randomized in each set collected in the same manner to give six independent curves from which the amount-of-substance fraction could be determined
52
Each analytical sequence of control standard standard control was corrected for linear instrument drift by using equation 3 The corrected instrument response for each control in the sequence was then ratioed to each sample response in the sequence (Eq 4) (Eq 3)
(Eq 4)
r Ratio
SRi Average ith Sample Response (molmol)
A Control Drift Correction (molmol) The average flow was also calculated for each sample response and was then converted to a molar flow volume using equation 5 (Eq 5)
ṅn Molar Flow for associated sample number in sequence (mmol min-1)
Q Average Flow (mL min-1)
Vm Molar Volume (L mol-1)
The amount-of-substance fraction for each on demand standard was then calculated utilizing equation 6 (Eq 6)
C Amount-of-subtance fraction (molmol)
qm Perm Rate (mol min-1)
ṅ Molar Flow (mol min-1)
n Sample number in sequence
The resulting data was then analyzed using the NIST GenLine program which is an ISO 6143-compliant generalized least squares regression The average ratio and standard error where plotted on the x-axis and the gravimetric amount-of-substance fraction and uncertainty were
A Control Drift Correction (molmol)
CR1 Average of repeat responses Control Response 1 (molmol)
CR2 Average of repeat responses Control Response 2 (molmol)
N Number of Samples in sequence
n Sample number in sequence
119860 = 119862R1 +(119862R2 minus 119862R1)
(119873 minus 1)sdot (119899 minus 1)
119903 =119878R119894
119860
119899 =119876
119907m
119862 = (119902119898
ṅ119899) sdot 1000
53
plotted on the y-axis for each on demand standard amount-of-substance fraction In each case all PSMs passed the u-test The ammonia amount-of-substance fraction for the submitted CCQM-K117 sample was determined for a response ratio of 10000 in equation 7 using the A and B values from each set of curve data from table 1 The NIST assigned value for the CCQM-K117 sample was then calculated by generating one amount-of-substance fraction response from a linear fit curve by combining all curve data points in one final curve giving a combined value assignment (table 2) f(r) = A r + B (Eq 7)
f(r) Predicted Concentration (molmol)
r Response ratio A Slope B y-intercept
Table 1 Individual Ammonia Calibration Curves The stated uncertainties are not expanded (k =1) (range 100 to 150 micromolmol in increments of 10 micromolmol) Permeation tubes at 34OC and a permeation rate of 12 microgmin
Measurement Slope (A) Intercept (B) Predicted Control (micromolmol) (k =1)
1 122455 plusmn 15408 13569 plusmn 14097 1360 plusmn 021
2 122519 plusmn 14630 13524 plusmn 11885 1360 plusmn 032
3 123157 plusmn 12953 13073 plusmn 11870 1362 plusmn 019
4 124359 plusmn 10768 12611 plusmn 08787 1370 plusmn 024
5 124096 plusmn 14992 12617 plusmn 13165 1367 plusmn 025
6 124333 plusmn 19089 12715 plusmn 15777 1370 plusmn 042
Table 2 Combined Ammonia Calibration Curve The stated uncertainties are expanded (k =2) (range 100 to 150 micromolmol in increments of 10 micromolmol) Permeation tubes at 34 degC and a permeation rate of 12 microgmin
CCQM ndash K117 Slope (A) Intercept (B) Predicted Amount of Substance Fraction (micromolmol) (k =2)
5904173 122783 plusmn 05433 13621 plusmn 04723 1364 plusmn 020
Uncertainty evaluation
All measured data and calculations for the final amount-of-substance fraction of ammonia have been reviewed for sources of systematic and random errors The following uncertainties were considered contributors to the overall uncertainty of the assigned value of the sample
54
The uncertainty in the permeation rate was determined using the LINEST function in excel (Eq 8) Excel calculated this as the uncertainty of the slope of the line from the calculation of the permeation rate
(Eq 8)
qm Perm Rate (g min-1)
The uncertainty in the instrument response for the controls and samples of each analysis sequence was determined by taking the standard deviation of the total number of responses and dividing by the square root of the number of responses in the standard deviation (Eq 9)
119906(119877) =119904
radic119873 (Eq 9)
R Instrument response
s Standard Deviation
N Number of responses in standard deviation
The uncertainty in the calculated ratio of the sample to control was also calculated The uncertainty was found by taking the square root of the sum of the squares of the two bracketing controls and sample for which the ratio was being calculated (Eq 10)
119906119903 = radic1199062(1198621198771) + 1199062(119904119877119899) + 1199062(1198621198772) (Eq 10)
The uncertainty of the
flow rates for each set of responses was also calculated in the same manner as the instrument response uncertainty by taking the standard deviation of the total number of responses and dividing by the square root of the number of responses in the standard deviation (Eq 11)
119906(119876119899) =119904
radic119873 (Eq 11)
119876119899 Average flow for response
s Standard Deviation
N Number of responses in standard deviation
As in the previous calculations the average flow uncertainty was then calculated as a molar flow uncertainty and was found by using equation 12 (Eq 12)
u(qm) = LINEST function slope uncertainty
uCR1 Uncertainty of repeat responses for control 1
uCR2 Uncertainty of repeat responses for control 2
uSRn Uncertainty of repeat responses for sample in the nth position
119906(119899) = radic1199062(119876) + 1199062(119907m)
55
ṅn Molar Flow for associated sample number in sequence (mol min-1)
Q Average Flow (mL min-1)
Vm Molar Volume (L mol-1)
The uncertainty of the predicted concentration for each of the on-demand standards generated by the permeation system was also calculated This was done by taking the square root of the sum of the squares of the calculated molar flow rate uncertainty and the permeation rate uncertainty that was found with the LINEST function (Eq 13) (Eq 13)
qm Perm Rate (mol min-1)
ṅ Molar Flow (mmol min-1)
n Sample number in sequence
Finally the combined relative uncertainty was calculated from the ratio uncertainty and the uncertainty of the standard concentrations were put into the NIST Genline software with their respective values and the overall uncertainty was calculated when the linear least squares regression was run The relative expanded uncertainty U is given by U = k u where k is the coverage factor and is equal to 2 The true value of the ammonia amount-of-substance fraction is asserted to lie in the intervals defined in Table 2 with a level of confidence of approximately 95 [2]
References
[1] International Organization for Standardization International Standard ISO 6145-102002(E) Geneva [2] Guide to Expression of Uncertainty in Measurement ISBN 92-67-10188-9 1st Ed ISO Geneva
Switzerland 1993
119906(119862) = radic1199062(119899) + 1199062(119902m)
56
Measurement report NPL
Cylinder number 5904237
Measurement 1
Component Date (ddmmyy)
Result (micromolmol)
Standard deviation ( relative)
number of replicates
Ammonia 1652019 1404 301 4
Measurement 2
Component Date (ddmmyy)
Result (micromolmol)
Standard deviation ( relative)
number of replicates
Ammonia 1752019 1372 215 2
Measurement 37
Component Date (ddmmyy)
Result (micromolmol)
Standard deviation ( relative)
number of replicates
Ammonia 1752019 1373 214 2
Results
Component Date (ddmmyy)
Result (micromolmol)
Expanded uncertainty (micromolmol)
Coverage factor
Ammonia 17052019 1380 040 2
Calibration standards
Two NPL primary reference materials (NPL PRMs) of nominally 14 micromol mol-1 ammonia in nitrogen were prepared in accordance with ISO 6142-1 from one source of pure ammonia The purity of the source of ammonia (gas phase) was analysed and determined to be gt 99999 The NPL PRMs were prepared in BOC-supplied 10 litre cylinders that had undergone BOCs SPECTRA-SEAL passivation Additionally each cylinder was conditioned prior to use using an NPL proprietary treatment Mixtures were prepared in one stage by dilution of nominally 100 micromol mol-1 ammonia in nitrogen mixtures either by direct filling (NPL 2626) or by exchange dilution (NPL 2555) [Brewer et al 2019] followed by the addition of nitrogen (direct filling) The nominally 100 micromol mol-1 ammonia in nitrogen mixtures were prepared by dilution of nominally 2000 micromol mol-1 ammonia in nitrogen mixtures which were in turn prepared by dilution of a nominally 20 mmol mol-1 ammonia in nitrogen mixture Both mixtures were used in determining the amount fraction of the CCQM K117 mixture The amount fractions of the two NPL PRMs (NPL 2626 and NPL 2555) are 1398 plusmn 004 and 1395 plusmn 008 micromol mol-1 respectively (uncertainties from gravimetry only are stated as expanded (k=2) uncertainties)
7 If more than three measurements are taken please copy and insert a table of the appropriate format as necessary
57
Purity tables for the ammonia and nitrogen used are provided below
Table 1 ndash Ammonia purity table
Component Amount Fraction (micromolmol) Expanded Uncertainty (micromolmol)
NH3 9999960 22
N2 15 18
H2O 05 06
CxHy 05 06
O2 05 06
CO 05 06
CO2 05 06
Table 2 ndash Nitrogen purity table
Component Amount Fraction (micromolmol) Expanded Uncertainty (micromolmol)
N2 9999995 17
Ar 050 010
O2 0005 0005
H2O 00050 00040
CxHy 00050 0010
CH4 00010 00020
H2 00010 00020
NO 00005 00005
SO2 00005 00005
CO 000030 000030
Instrumentation
The amount fraction of ammonia was measured using an ABB AO2020 non-dispersive infrared spectrometer (NDIR) set to a measurement range of 0 ndash 100 micromol mol-1
Calibration method and value assignment
Before measuring any gas mixtures the analyser response to the balance gas (nitrogen) was recorded The analyser response to an NPL in house calibration standard (NPL 2626 or NPL 2555) was recorded for at least ten minutes followed by the CCQM-K117 mixture (cylinder 5904237) for a ten-minute period This sequence was repeated between two and four times Finally the analyser response to the balance gas was recorded at the end of the sequence To minimise the
58
effects of analyser drift the mean analyser response to the balance gas before and after the comparison was used to apply a balance gas correction The amount fraction of ammonia in the CCQM-K117 mixture was then determined by multiplying the ratio of the analyser response of the CCQM-K117 mixture and the calibration standard (both were corrected for the analyser response to the balance gas) by the gravimetric amount fraction of ammonia within the calibration standard used Samples were introduced into the analyser at atmospheric pressure using a low volume gas regulator (excess flow was passed to a vent) Cylinders were maintained at a laboratory temperature of 20 plusmn 3degC
Uncertainty evaluation
The ratio of the NDIR instrument response from the CCQM-K117 mixture (Vunk - Vzero) and the NPL PRM (Vstd ndash Vzero) is calculated by
119903 = (119881119906119899119896 minus 119881119911119890119903119900
119881119904119905119889 minus 119881119911119890119903119900)
And the average ratio (r) is calculated by
=sum 119903
119899
Where n is the number of ratios The amount fraction of the ammonia in the CCQM-K117 mixture xu is calculated by
119909119906 = 119909119904
Where xs is the amount fraction of ammonia in the NPL PRM The standard uncertainty of the measurand u(xu) is calculated by
119906(119909119906)
119909119906= radic
119906(119909119904)2
1199091199042
+119906()2
2
The table which follows details the uncertainty analysis for an example measurement
unit example value
standard unc
Sensitivity coefficient
unc contribution
unc type
distribution
xs umolmol 1400 024 098 023 A normal
- 098 001 1400 018 A normal
xu umolmol 1372
u(xu) umolmol 029
U(xu) umolmol 059
The standard uncertainty of xs includes both the uncertainties of the gravimetric preparation and of the subsequent analytical validation The analytical validation dominates this uncertainty For NPL 2626 this also includes an additional uncertainty associated with adsorptive loss of ammonia
59
to the cylinder wall during preparation Our best estimate of this effect imposes a measurement uncertainty of 03 molmol (absolute) consistent with our previous work in CCQM-K46 To obtain the final result for the comparison a weighted average taking into account the associated uncertainties was determined from the three measurement results The following table shows the calculation of the final results and its uncertainty
unit value standard unc
Sensitivity coefficient
unc contribution
unc type
distribution
x1 umolmol 1404 042 033 012 A normal
x2 umolmol 1372 029 033 010 A normal
x3 umolmol 1373 029 033 010 A normal
xf umolmol 138
u(xf) umolmol 020
U(xf) umolmol 040
Where x1-x3 is the measurement number and xf is the final value of the amount fraction of ammonia in the CCQM-K117 mixture
Reference
Brewer P J Brown R J C Mussell Webber E B van Aswegen S Ward M K M Hill-Pearce R E Worton D R Breakthrough in Negating the Impact of Adsorption in Gas Reference Materials Analytical Chemistry 2019 91 (8) 5310-5315 doi101021acsanalchem9b00175
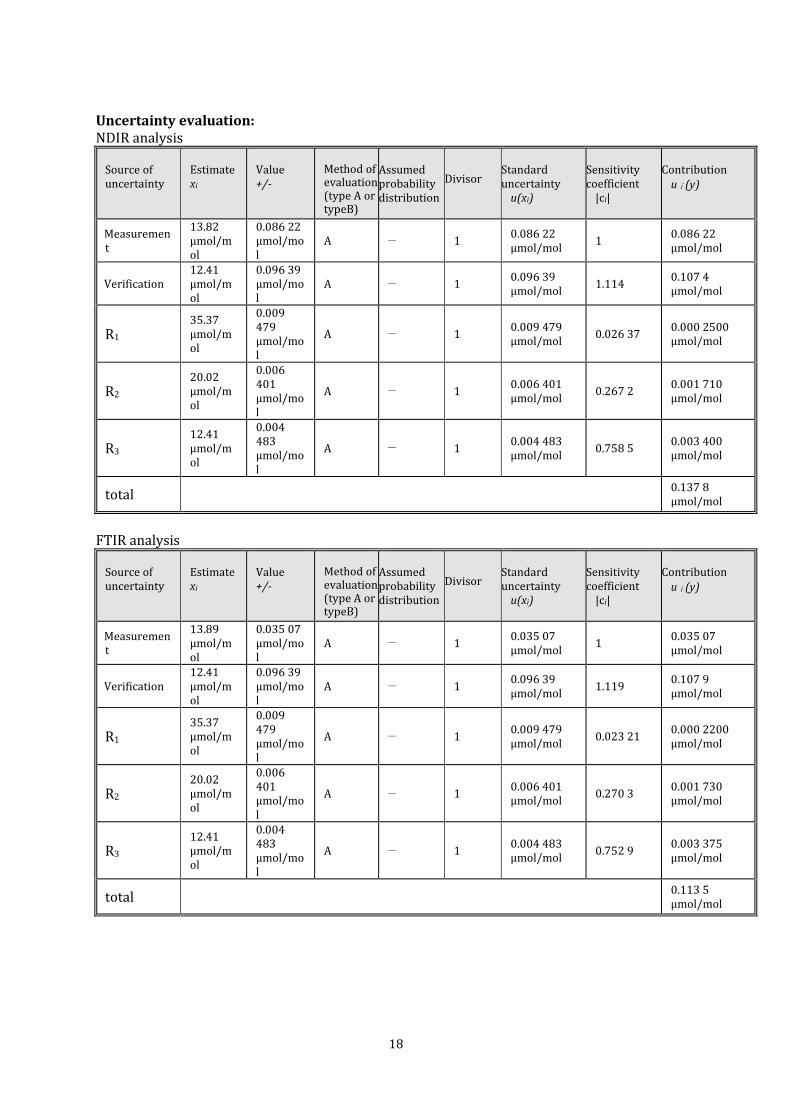
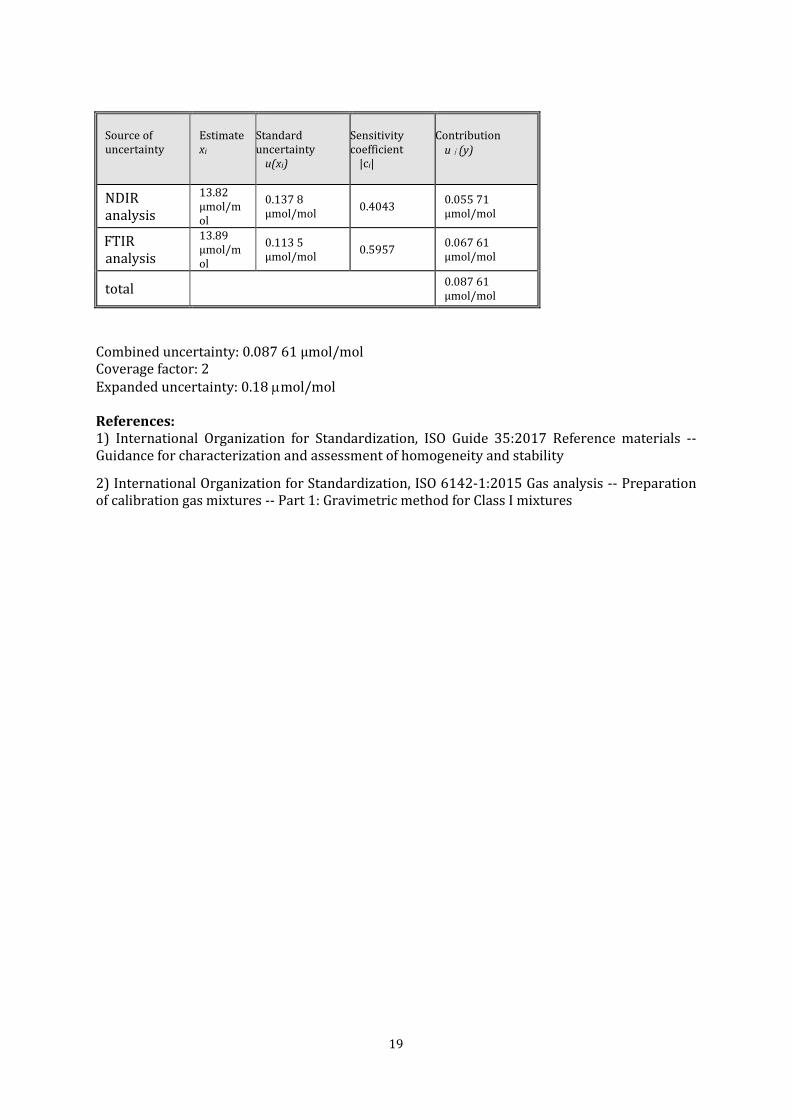
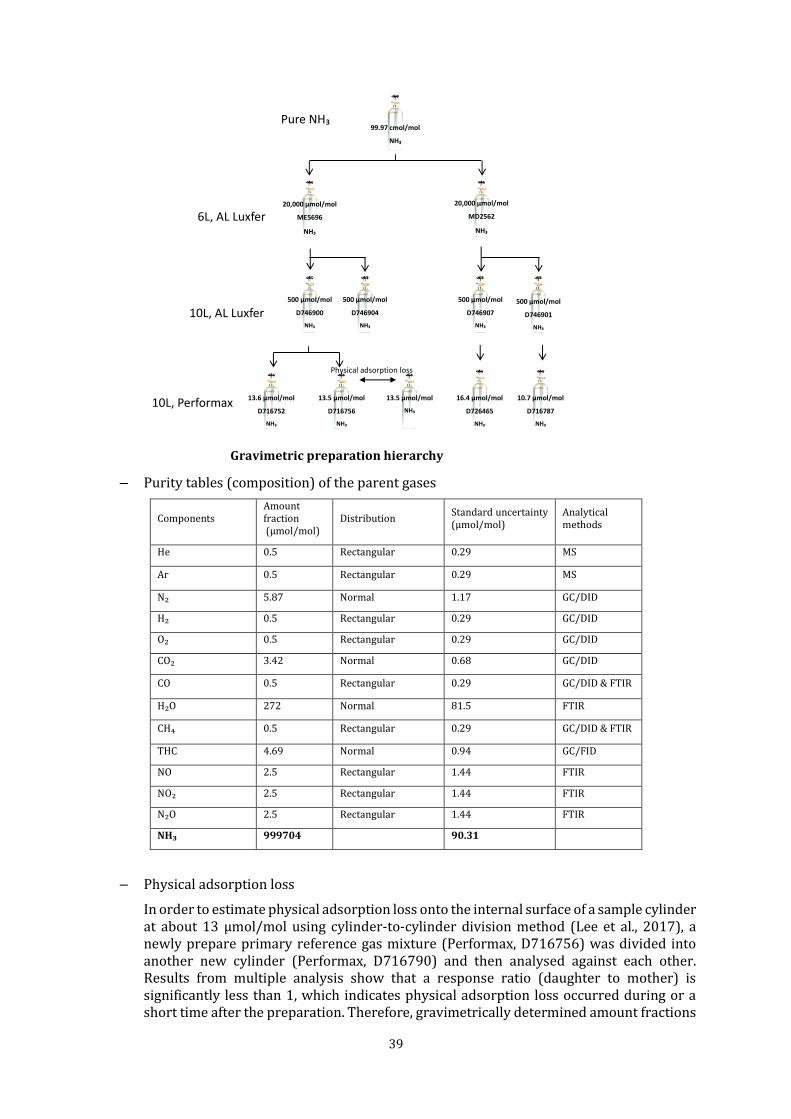
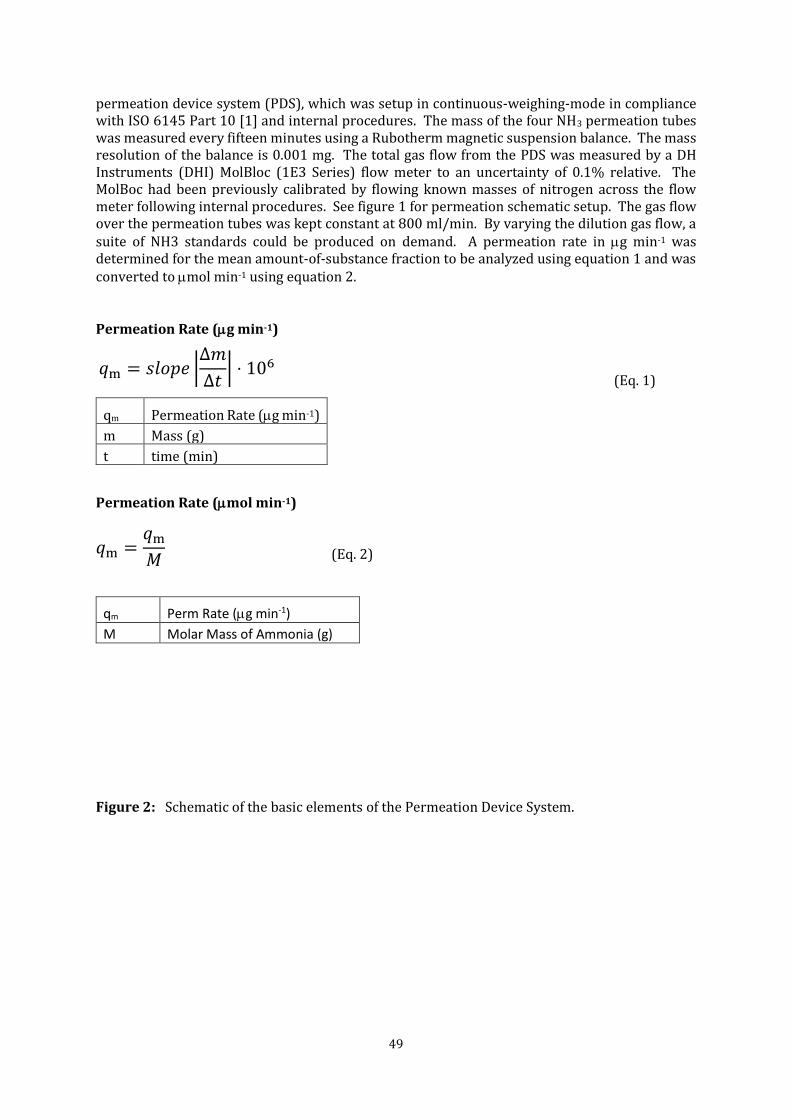