Mechanisms of Permeation and Selectivity in Calcium Channels
Upload
independentCategory
view
2download
0
Journal of Membrane Science 320 (2008) 42–56
Contents lists available at ScienceDirect
Journal of Membrane Science
journa l homepage: www.e lsev ier .com/ locate /memsci
Permeation of gases through microporous silica hollow-fiber membranes:Application of the transition-site model
Philip Molyneux ∗
Macrophile Associates, 33 Shaftesbury Avenue, Radcliffe-on-Trent, Nottingham NG12 2NH, UK
a r t i c l e i n f o
Article history:Received 29 September 2007Received in revised form 1 February 2008Accepted 2 March 2008Available online 18 March 2008
a b s t r a c t
In a previous paper [P. Molyneux, “Transition-site” model for the permeation of gases and vapors throughcompact films of polymers, J. Appl. Polym. Sci. 79 (2001) 981–1024] a transition-site model (TSM) for theactivated permeation of gases through compact amorphous solids was developed and applied to organicpolymers; the present paper examines the applicability of the TSM to permeation through microporoussilica. The basis of the TSM theory for amorphous solids in general is outlined; the present extension to
Keywords:Activation energyHollow-fiber membranesMicroporous silicaMolecular sieving
inorganic glasses has revealed that the transition sites (TS) of this theory, which are the three-dimensionalsaddle-points critical in the molecular sieving action, equate to the doorways long recognized in per-meation through amorphous silica and other inorganic glasses. The TSM, which views permeation as aprimary process, is contrasted with the conventional sorption–diffusion model (SDM) for permeation. It ispointed out that in the SDM, the widely accepted analysis into two apparently distinct factors – sorption
n (kirbed, and
r �D,e ins
llow fiisticepar
Permeability theoryTransition-site doorways
(equilibrium) and diffusiosince both involve the sotwo states: as the free gas– (unperturbed) diamete(entropy increment) for th[J.D. Way, D.L. Roberts, Ho29–41; J.D. Way, A mechanReport submitted to U.S. D
Mines, Golden, CO, 1993, wwwHassan, J.D. Way, P.M. Thoen, Amembrane, J. Membr. Sci. 104membranes (developed by PPGC2H4, over the temperature rathese gases (excepting He) lead�, 0.43 nN; �, 1.7 pN K−1; thesepolymers. Some “secondary efinteractions at the doorway. Thperature. This study confirmssieving for this type of inorgan1. Introduction
The migration of gases in and through solids has many prac-tical and theoretical implications, particularly in the use of filmsas barriers, and in separation processes [1,2]. In these processes,we can distinguish permeation as the transfer of the gas through alayer of the solid; solubility or sorption as the equilibrium process
∗ Tel.: +44 115 933 4813; fax: +44 115 933 4813.E-mail address: [email protected].
0376-7388/$ – see front matter © 2008 Elsevier B.V. All rights reserved.doi:10.1016/j.memsci.2008.03.001
netic) – has the fundamental flaw that these factors are not independent,state. By contrast, the TSM focuses on the permeant molecule in onlyas inserted in a doorway D; hence the characteristics of these doorways
spacing �, and the thermodynamic parameters � (force constant) and �ertion process – can be evaluated. The theory is applied to literature databer inorganic membranes for gas separations, Sep. Sci. Technol. 27 (1992)
study of molecular sieving inorganic membranes for gas separations, Finaltment of Energy under contract DE-FG06-92-ER14290, Colorado School of.osti.gov/bridge/servlets/purl/10118702-ZAx4Au/native/1011872.pdf; M.H..C. Dillon, Single component and mixed gas transport in silica hollow fiber(1995) 27–42] on the permeation through microporous silica hollow-fiber
Industries Inc.) of the nine gases: Ar, He, H2, N2, O2, CO, CO2, CH4 and
nge 25–200 ◦C. The derived Arrhenius parameters for the permeation ofto estimates of the four doorway-parameters: �D, 125 pm; �, ca. 30 nm;values lie within the ranges of those obtained with the glassy organic
fects”, shown particularly by CO and CO2, are interpreted as host–gueste behavior of He is anomalous, the permeation rising linearly with tem-
that the TSM may be applied to gas permeation by activated molecularic membrane.
© 2008 Elsevier B.V. All rights reserved.
between the gas and that held within by the solid; and diffu-sion as the movement of the sorbed gas molecules within thesolid.
In current thought, the primacy in migration is given to diffusion[3–6]. With solubility as the equilibrium-based process, perme-ation is then viewed as the composite of solubility and diffusion,leading to the sorption–diffusion model (SDM). By contrast, in aprevious paper [7] dealing with migration of gases and vaporsin organic polymers, a model is presented which gives primacyto permeation; this was termed the transition-site model (TSM).In the present paper this model is applied to simple gases per-
bran
P. Molyneux / Journal of Memmeating through a microporous form of amorphous silica, usingliterature data on hollow-fiber membranes. Because of the nov-
elty and unusual approach of the TSM, it is useful to firstly outlinethe theory and its general application (Sections 2.1–2.5), and thenthe results of its application to organic polymers (Sections 2.6–2.7),before considering its specific application to permeation throughsilica (Section 3). The values of absolute entropy and moleculardiameter required in the treatment of the experimental data arealso discussed (Appendixes A and B).2. The transition-site model for permeation
2.1. Lattice picture of the migration process
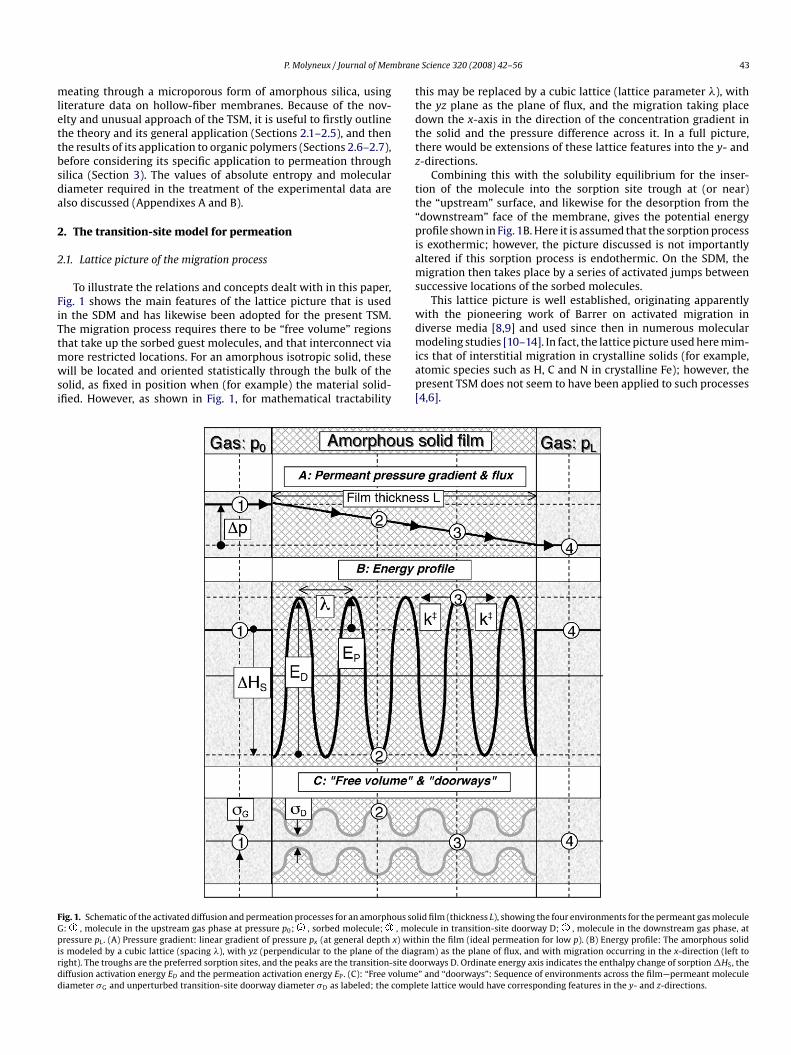
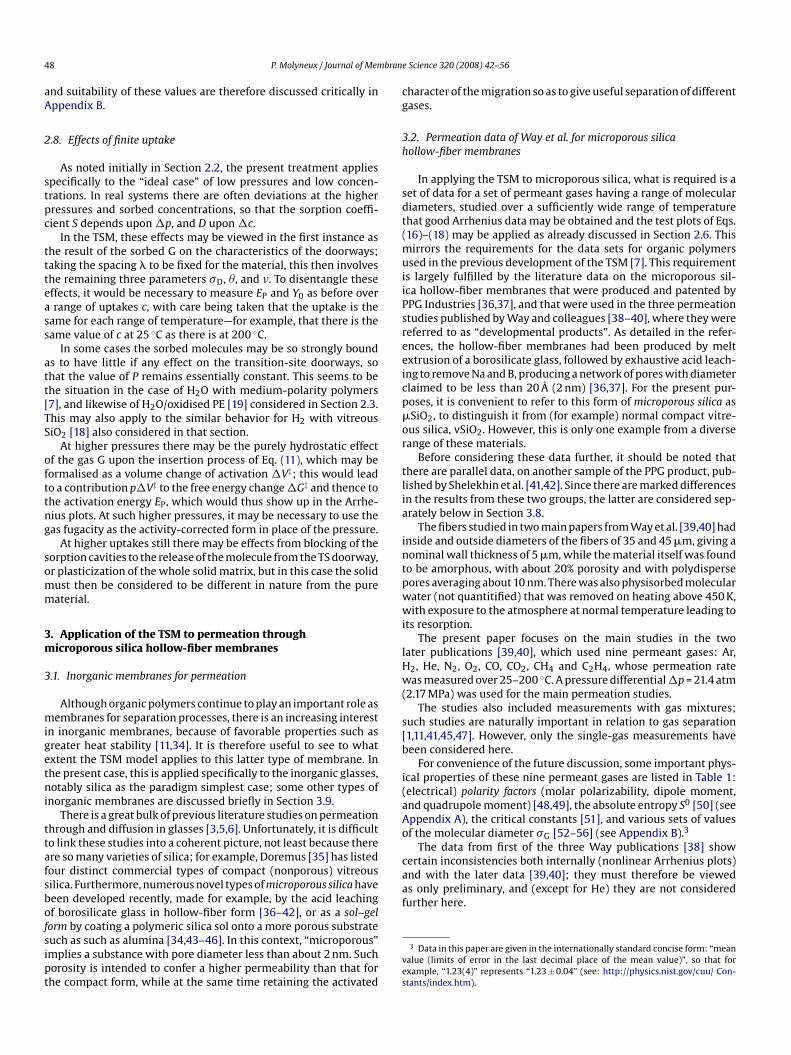
To illustrate the relations and concepts dealt with in this paper,Fig. 1 shows the main features of the lattice picture that is usedin the SDM and has likewise been adopted for the present TSM.The migration process requires there to be “free volume” regionsthat take up the sorbed guest molecules, and that interconnect viamore restricted locations. For an amorphous isotropic solid, thesewill be located and oriented statistically through the bulk of thesolid, as fixed in position when (for example) the material solid-ified. However, as shown in Fig. 1, for mathematical tractability
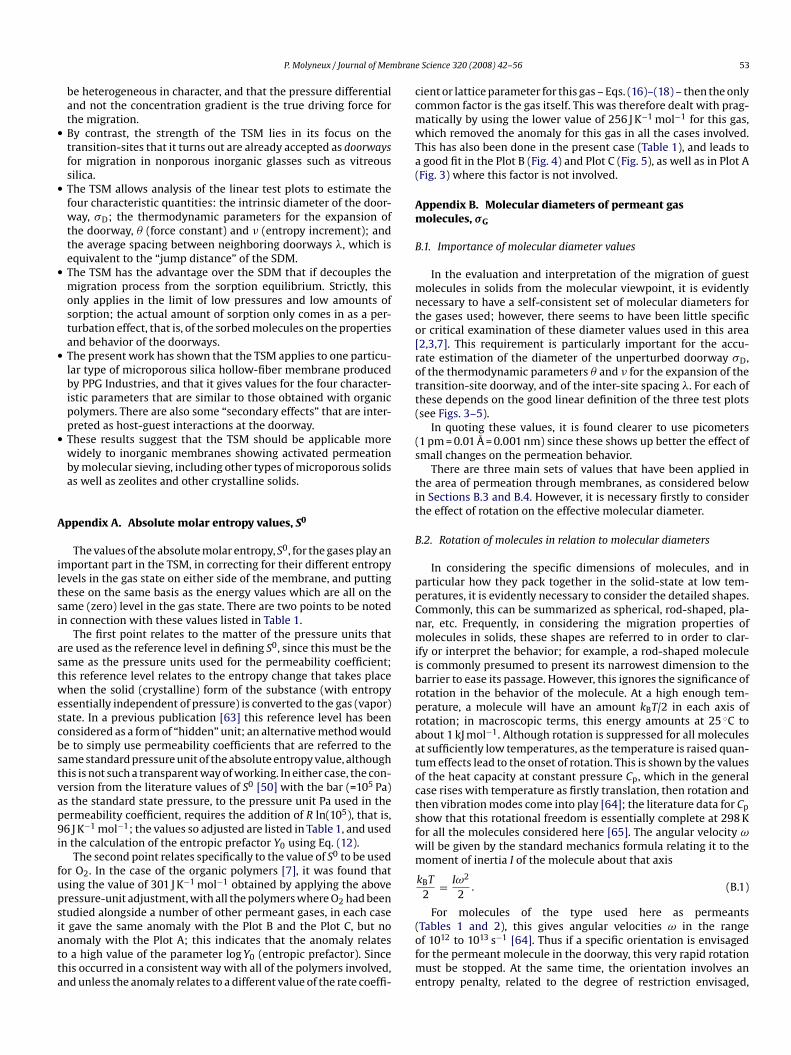
Fig. 1. Schematic of the activated diffusion and permeation processes for an amorphous soG: , molecule in the upstream gas phase at pressure p0; , sorbed molecule; , molpressure pL. (A) Pressure gradient: linear gradient of pressure px (at general depth x) witis modeled by a cubic lattice (spacing �), with yz (perpendicular to the plane of the diagright). The troughs are the preferred sorption sites, and the peaks are the transition-site dodiffusion activation energy ED and the permeation activation energy EP. (C): “Free volumediameter �G and unperturbed transition-site doorway diameter �D as labeled; the compl
e Science 320 (2008) 42–56 43
this may be replaced by a cubic lattice (lattice parameter �), withthe yz plane as the plane of flux, and the migration taking place
down the x-axis in the direction of the concentration gradient inthe solid and the pressure difference across it. In a full picture,there would be extensions of these lattice features into the y- andz-directions.Combining this with the solubility equilibrium for the inser-tion of the molecule into the sorption site trough at (or near)the “upstream” surface, and likewise for the desorption from the“downstream” face of the membrane, gives the potential energyprofile shown in Fig. 1B. Here it is assumed that the sorption processis exothermic; however, the picture discussed is not importantlyaltered if this sorption process is endothermic. On the SDM, themigration then takes place by a series of activated jumps betweensuccessive locations of the sorbed molecules.
This lattice picture is well established, originating apparentlywith the pioneering work of Barrer on activated migration indiverse media [8,9] and used since then in numerous molecularmodeling studies [10–14]. In fact, the lattice picture used here mim-ics that of interstitial migration in crystalline solids (for example,atomic species such as H, C and N in crystalline Fe); however, thepresent TSM does not seem to have been applied to such processes[4,6].
lid film (thickness L), showing the four environments for the permeant gas moleculeecule in transition-site doorway D; , molecule in the downstream gas phase, athin the film (ideal permeation for low p). (B) Energy profile: The amorphous solidram) as the plane of flux, and with migration occurring in the x-direction (left toorways D. Ordinate energy axis indicates the enthalpy change of sorption �HS, the” and “doorways”: Sequence of environments across the film—permeant moleculeete lattice would have corresponding features in the y- and z-directions.
bran
44 P. Molyneux / Journal of MemIn parallel with the energy profile shown in Fig. 1, there mustalso be an entropy profile; this is seldom considered, but evidentlymust be taken into account to give the true, free energy descrip-tion of the processes involved. In this case, the profile would havetroughs where molecules are restricted; a further difference is thatin contrast to the energy situation where the energy level is zero forall dilute gases, in the case of entropy the starting levels would bedifferent following the absolute entropies of the gases considered.This has to be taken into account in interpreting the van’t Hoff andArrhenius prefactors as discussed below. In previous cases whereentropy effects have been considered [9,10,14], they have dealt onlywith the diffusive jump process.
2.2. General relations
On the basis of “ideal conditions” that is, low pressure p ofthe permeant gas and low concentration c of dissolved perme-ant, the three determining parameters—the Henry’s Law solubilitycoefficient, S,1 the diffusion coefficient D, and the permeabilitycoefficient P are related [2] by
P = DS. (1)
It is this equation that is used as the basis for the conventionalSDM, which considers that permeation must be a composite quan-tity, depending on both the sorptive and the diffusive properties ofthe system.
In considering the molecular bases of these processes, thetemperature dependence of the three parameters is of particularimportance. These generally take the similar van’t Hoff (sorption)and Arrhenius (permeation and diffusion) forms. In the light of Eq.(1), this gives for the corresponding prefactors
P0 = S0D0 (2)
and for the energy quantities
EP = �HS + ED (3)
where EP and ED the activation energies for permeation and diffu-sion, and �HS is the isosteric enthalpy change of sorption.
In Eq. (3), if the sorption process is exothermic (so that
�HS is negative), then the value of the permeation activationenergy EP becomes the difference between the numerical valuesof �HS and ED; for example, in the case of H2O with poly(ethylmethacrylate) (PEMA), the studies of Stannett and Williams [15]gave �HS = −34 kJ mol−1 (exothermic) and ED = 36 kJ mol−1 so thatEP = 2 kJ mol−1 (compare Fig. 1B).As a general point, inasmuch as each permeant has spe-cific Arrhenius and van’t Hoff parameters, the plots for differentpermeants may cross. This is particularly important with theincreasing emphasis on the use of membranes over wide tempera-ture ranges. For example, the recent work of Wilks and Rezac [16]showed, for the competitive permeation of CO2 and H2 throughpoly(dimethylsiloxane) (PDMS) membranes, that the selectivityfactor is 4.2 at 35 ◦C (CO2 faster), but that this has fallen to 0.8 (H2faster) at 200 ◦C. Thus the comparison of the permeation behav-ior at a single temperature is not sufficient to elucidate migrationbehavior.
Furthermore, any molecular interpretation should seek toexplain and correlate not only the activation energy, but also theprefactor. In particular, using the TSM [7], valuable information is
1 This symbol for solubility coefficient, used here in conformity with customarypractice, should not be confused with that for entropy (S0, etc.) used later in thepaper.
e Science 320 (2008) 42–56
obtained from P0 on the entropy effects in the migration process,and on the spacing � between transition-sites (Fig. 1).
A more general point in connection with these energy levels isthat they allow the permeation activation energy EP to be zero ornegative if ED becomes equal to or less than �HS, so long as ED hasa positive value as required for the jump process.
2.3. Critique of the sorption–diffusion model (SDM) for analyzingpermeation
The conventional and widely accepted belief is that permeationmust be considered as composite, that is, the resultant of sorption(equilibrium) and diffusion (kinetic) effects. This seems to be sup-ported, for example, by the form of Eq. (1), and by the simplicity ofthe units for diffusion coefficient (m2 s−1) compared with those forpermeability coefficient (mol m m−2 s−1 Pa−1).
However, as detailed in the previous paper [7], there are a num-ber of instances where permeation is a simpler process than wouldbe expected if it were the composite of independent effects. In thissection, this is taken a step further by showing that, despite thealmost universal view that diffusion must be considered as the pri-mary process in solid-state migration, there are a number of aspectsthat raise doubts as to its validity for this purpose. These may beconsidered under three headings.
2.3.1. The sorption and diffusion processes are not independentThe primary point of weakness of the SDM arises in the uni-
versally assumed analysis of permeation into the two assumedlydistinct aspects, sorption (equilibrium factor) and diffusion (kineticfactor). Any analysis of a physical or chemical process requires thatthe proposed component effects are independent; for example, inanalyzing the factors controlling the volume of a fixed amount of anideal gas, these two factors would be the pressure and the (absolute)temperature, each of which may be varied independently. However,in the case of the SDM, the two coefficients S and D are clearly notindependent, since they both involve the sorption state. For thesorption coefficient S relates to the equilibrium between the gasstate and the sorption state; while the diffusion coefficient D relatesto the ease of a jump from the sorption state across the interveningbarrier (doorway), or (on transition-state theory) to the equilibriumbetween the sorption state and the transition state (Fig. 1B).
Of course, this is not to argue against the classical picture ofpermeation being a sequence of processes that we call “sorption”,“diffusion” and “desorption”; nor is it to argue with the mathemat-
ical validity of Eq. (1). But neither of these leads to, or necessarilyrequires, the conventional SDM analysis.2.3.2. The sorption sites are heterogeneousConsidering the sorption of a single simple-molecule permeant
in an amorphous solid, such as an organic polymer, or an inorganicglass, because of the disordered molecular structure of the hostmatrix, the permeant molecules will be held in a variety of sitesand locations. For example, the variation of solubility and partialmolar volume with uptake indicates a Gaussian distribution for thesorption sites both with glassy organic polymers [17a] and withvitreous silica [17b]. It is therefore evident that the starting pointfor the diffusive jump (Fig. 1) is not well defined.
2.3.3. It is the pressure gradient and not the concentrationgradient that is the true driving force for transport
The deficiencies in taking the concentration gradient as thedriving force, are seen from the molecular viewpoint, when wecompare the behavior of two permeants O2 and H2O, which havesimilar molecular diameters (293 pm and 289 pm from criticalconstants—see Appendix A and Ref. [7]), in a polar polymer such as

bran
P. Molyneux / Journal of MemPEMA [15]. For a given partial pressure of the penetrant, the uptakeof the H2O is much greater than that of the O2 because the H2O willhydrogen bond to the ester groups in the polymer chains. However,for the same concentration gradient, the actual amount of H2O freefor diffusion will be much smaller than that for the O2, because ofthis hydrogen bonding. Thus the use of the concentration gradientclearly does not represent the true driving force for the migrationprocess.
In this example, where the structures and interactions for thesolid and the migrant molecule are well established, the molecularbasis is self-evident, but it must apply more generally where theseforces may not be well understood.
These objections do not apply when we consider the pressuregradient as the driving force, since this is a true measure of thegradient of chemical activity (Fig. 1A). The present TSM uses thispicture, and shows how this gradient may be linked to the migrationprocess.
The validity of the pressure gradient as the driving forceis revealed in numerous cases where, when the conditions arechanged, the values of D and S vary markedly but that of P remainsessentially constant. Since the sorbed state enters in opposite waysin the sorption and diffusion processes, its effect cancels out inpermeation.
For example, considering a case with the same permeant in thesame solid at different pressure and concentration levels, Rundgrenet al. have shown recently [18] with H2/vitreous silica at 550 ◦C, thatwhen the upstream pressure was varied up to 0.12 MPa, the valueof P remained essentially constant (±10%) although the value of Sdecreased by a factor of approximately three while that of the dif-fusion coefficient D correspondingly increased by the same factor.
Much the same effect can apply to the same permeant in differ-ent solids, as with the case of H2O in moderately polar polymerspreviously discussed [7]. A striking example of this type of effectis shown in the work of McCall et al. [19] on the permeation ofH2O through poly(ethylene) (PE) films that had been air-oxidizedin processing to varying extents, leading to the incorporation ofhydrophilic groups on the polymer chains; such oxidation up to3% combined oxygen gave a 50-fold increase in the sorption coeffi-cient S compared with the starting PE, but an essentially equivalentdecrease in the diffusion coefficient D, so that the permeabilitycoefficient P was essentially unchanged (±20%) by the oxidation.
The above arguments apply not just to organic polymers or vit-reous silica from which the examples have been chosen, but to anysystem where the SDM analysis is currently used.
2.4. Analysis of the jump process
In the field of migration through organic polymers, little atten-tion has been paid to the nature of the peak on the path of thejump, with greater attention being paid to the “free volume” whichrelates to the environment of the sorption sites [2]; however, thepreviously developed TSM [7] focuses particularly on the state ofthe permeant molecule at this peak. It turns out, that in the fieldof migration in inorganic glasses, these transition sites have beenrecognized for over half a century, and were termed doorways [20],a name that has been retained since [21–25]. It is therefore conve-nient to use term doorway (D) interchangeably with transition-site(TS) in the rest of the paper.
A simple analysis of the jump process further highlights thesignificance of the TS doorway. Firstly, if we apply the Principleof Microscopic Reversibility to a jump, it follows that the reverseprocess must also be acceptable as a jump; thus on the averagethe jump will be symmetrical about the midpoint. Secondly, therequirement for activation of the molecules to enable the jump totake place indicates the presence of an energy barrier, which would
e Science 320 (2008) 42–56 45
be located on the average at this midpoint. Finally, because of theBoltzmann factor exp(−E/RT) that controls the fraction of perme-ant molecules with the required excess energy E, in making thejump the penetrant molecule will expend the minimum amount ofenergy necessary for a successful jump, that is, barely passing overthe central point. This location is the transition-site doorway D,which has the nature of a three-dimensional saddle-point (Fig. 1Band C).
2.5. Derivation of equation for permeability coefficient on theTSM
The present TSM is then a direct application of the well-established standard theory of the transition state (also termed theactivated complex) for chemical reactions [26]. For an elementarychemical reaction, there is postulated to be equilibrium betweenthe starting reactants and those in the transition state, this beingthe position of maximum potential energy on the lowest energypath from the reactant to the products; this transition state thenconverts into the products of the reaction (or may revert to thereactants). For example, for the transfer of the atom B between thespecies A and BC, the two-step sequence involved is:
A + B − CReactants
� [A· · ·B· · ·C]Transition state
‡ � [A − B + C]Products
. (4)
Although this picture is well accepted for reactions in the gasphase, there is some hesitation in applying it to processes in con-densed phases. However, it is well established as the explanation ofthe primary salt effect for reactions in aqueous solution, that is, theeffect on the rates of reactions between ions in solution of added“neutral salt” (an electrolyte with non-common ions); here it is thenet charge on the transition state that is important, and this state isevidently sufficiently long-lived for the Debye–Huckel ionic atmo-sphere from the added neutral salt to be established [26]. Moreover,the theory has been applied successfully in considering perme-ation in physiological systems [27], while the concept of “transitionstate analogs” in now widely used in enzyme chemistry [28]. Morespecifically, this type of picture was used some time ago to inter-pret quantum effects in the permeation of “light” gases (He, H2,D2) through organic polymers [10], and more recently to similarsystems using molecular dynamics simulations [29].
With permeation through an amorphous solid, the pressure dif-ference �p across the layer of solid also corresponds to a gradient ofpartial pressure of the gas within the solid, representing a gradient
of chemical activity across the layer. For the ideal case under presentdiscussion (dilute gases, and dilute solutions of the penetrant inthe solid, so that there is no “plasticization” or other modificationof the host solid by sorbed permeant), this gradient will be linear(Fig. 1A). Concretely, the partial pressure at any level would be thatwithin a microscopic cavity at that level; alternatively, it would bethe pressure realized if the solid were sliced through in the yz-planeat that level, the two parts slightly separated, and the permeationflux resumed. This does not mean that there are actual free per-meant molecules in the solid, but simply that any depth x can beassigned its value of the partial pressure px.Applying these concepts to the cubic lattice picture having lat-tice parameter � (Fig. 1), the occupancy of doorways at depth x iscontrolled by the insertion equilibrium:
G(x) + D(x) � [GD(x)]‡ (5)
where D(x) is an unoccupied doorway at the depth x, GD(x) is anoccupied doorway at that depth (labeled with the double cross “‡”to show its analogy with the transition state in Eq. (4)), and G(x)relates to the partial pressure at that level as already discussed.The rate of loss of G from the occupied doorways (downstream or
bran
initial state, that of the free gas, with reference energy of zero for
46 P. Molyneux / Journal of Mem
upstream—Fig. 1B) is then taken to be controlled by the standardtransition-state rate coefficient k‡ ≡ kBT/h where kB is the Boltz-mann constant and h is the Planck constant [26]. On the TSM, itis this gradient of occupied sites [GD(x)]‡ that gives rise to theobserved flux in the downstream direction.
This then leads [7] to an expression for the flux that correctlyincorporates its experimentally observed proportionality to thearea, the pressure difference across the film, and the reciprocal ofthe film thickness. The permeability coefficient P then becomes
P =(
kBT
eh�NA
)exp(�S‡) exp
(−�U‡
RT
)(6)
where e is the exponential number, NA the Avogadro constant, �S‡
the entropy change for the insertion of a mole of the gas G into amole of the doorways D according to Eq. (5), and �U‡ is the internalenergy change for this same process. The Arrhenius prefactor andthe activation energy then become
P0 =(
kBT
eh�NA
)exp
(�S‡
R
)(7)
EP = �U‡. (8)
Considering Eq. (7), evidently the prefactor P0 is not expectedto be truly temperature independent since the expression has thefactor T in front, but over narrow temperature ranges the variationis much less than that of the exponential factor, so that it is per-missible to use the average temperature in applying this equation.In any case, there may also be a further complicating effect fromchanges in �S‡ with temperature.
The entropy of activation �S‡ can be expressed in terms of theentropies of the “reactants” and “products” for the insertion process(5) as
�S‡ = S(GD) − S(D) − S0(G) (9)
where S(GD) is the entropy of 1 mol of occupied doorways, S(D) thatof the occupied sites, and S0(G) is the absolute molar entropy of thegas. Substituting in Eq. (7) and rearranging gives
P0 exp[(S0(G)/R)] =(
kBT
eh�NA
)exp
{[(S(GD) − S(D)]
R
}. (10)
It is convenient to define a quantity Y, the entropic coefficient,
relating the original permeability coefficient P and the absoluteentropy byY ≡ P exp[(S0(G)/R)]. (11)
Correspondingly, for the limiting case of 1/T → 0, this defines theentropic prefactor Y0 as
Y0 ≡ P0 exp[(S0(G))/R]. (12)
This last expression is used in evaluating Y0 from permeationexperiments, as discussed below. In these expressions for Y and Y0,the units of pressure implicit in the absolute entropy and explicit inthe permeability coefficient have to be brought into concordance,as discussed in Appendix A.
Substituting from Eq. (12) in Eq. (10) and taking logs gives
log Y0 = log(
kBT
ehNA
)− log � + (log e)
{[S(GD) − S(D)]
R
}. (13)
As discussed below, this relation is useful in making estimatesof the doorway spacing �.
Reverting to Eq. (8), the permeation activation EP is revealed asthe internal energy change �U‡ to insert the molecule of G into thedoorway D (Eq. (5) and Fig. 1C). Likewise, the entropy difference
e Science 320 (2008) 42–56
[(S(GD) − S(D)] in Eqs. (9), (10) and (13) is the equivalent entropychange for this same process.
It is useful to analyze the value of EP into three presumablyindependent contributions to the insertion process of Eq. (5):
EP = EMM + Eex − EMG (14)
where EMM is the energy to overcome any noncovalent interactionsbetween the host matrix (M) across the unperturbed doorway aper-ture, Eex is the energy to expand the matrix by the insertion ofthe (presumably) larger gas molecule G (taken to be a incompress-ible sphere), and EMG is the energy released from any interactions(presumably, noncovalent) between the molecule of G and the sur-rounding host matrix in the doorway.2 The first contribution, EMM,is neglected here, and this is supported by the fact that the door-ways are later deduced to have a diameter greater than 100 pm(Section 3.5).
In previous analyses of this process as applied to silica andderived inorganic glasses, attention has been focused on the secondcontribution Eex. In its earliest development the doorway was con-sidered as a spherical cavity, but this was later replaced [20] by thesomewhat more realistic picture of a cylindrical cavity; this wouldthen lead, using the mechanics of elasticity for the expansion of athick-walled pipe, to the relation
Eex = �G�D(�G − �D)2
4(15)
where G is the shear modulus of the bulk solid, �D the diameter ofthe unperturbed doorway, and �G is the diameter of the permeantmolecule (see Fig. 1C). However, this commonly applied formula-tion [18,20–25] suffers from two defects: firstly, the doorway wouldbe saddle-shaped (Fig. 1C), rather having parallel sides as Eq. (15)requires; and secondly, there is no reason to believe that the elasticbehavior of the solid at the molecular level (relating to the rotationand flexion of individual bonds) follows that for the bulk solid asdefined by the shear modulus G.
In many previous formulations [10,18,20–25,29], Eex has beenequated to the activation energy for diffusion, which ignores thepart played by the sorption enthalpy in the diffusive jump process(Fig. 1B).
Summarizing, in contrast to the diffusive jump picture, in theTSM the permeation activation energy is referred to a well defined
any gas (Fig. 1B); however, the prefactor P0 has to be adjusted for thedifferent absolute entropies of different gases to give the entropicprefactor Y0 according to Eq. (12).
2.6. Application of the TSM to experimental data for organicpolymers
In the previous application of the TSM to organic polymers [7], itwas tested on the collected literature data [30] for the permeationof a variety of gases (ranging from He to SF6) with 16 amorphous orsemi-crystalline polymers using three test plots, involving the twoparameters EP and log Y0 together with the permeant gas moleculardiameter �G:
Plot A: EP versus �GPlot B: log Y0 versus �GPlot C: log Y0 versus EP.
Previously [7] there had been four test plots, with the first ofthese (“Case 1”) a direct plot of the original Arrhenius parame-
2 Kirchheim has shown the importance of this site expansion energy term Eex forthe sorption of gases both by organic polymers [17a] and by vitreous silica [17b].
bran
depicted by Fig. 1C.
P. Molyneux / Journal of Mem
ters, that is, log P0 versus EP, but in view of the better theoreticalbasis for the entropy-adjusted form log Y0, this first plot is not nowconsidered to be useful.
With certain exceptions [7], these three test plots were foundto be essentially linear, and may be fitted to the respective conven-tional forms
Plot A : EP = m1�G + c1 (16)
Plot B : log Y0 = m2�G + c2 (17)
Plot C : log Y0 = m3EP + c3. (18)
In the context of the present paper, and to anticipate thediscussion on microporous silica in Section 3 below, theseplots are exemplified by Figs. 3–5, respectively, below (Section3.4).
Before continuing with the interpretation of these Eqs. (16)–(18),it should be emphasized that their linearity does not follow directlyfrom the theory, neither is it in any sense an integral part of it. Itshould also be evident that these are not three independent equa-tions, since they involve only three independent variables; thisleads to the parameters for the third equation as
m3 = m2
m1(19)
c3 = (c2m1 − c1m2)m1
. (20)
As noted above, with the organic polymers not all the sys-tems from the literature conformed to these linear relations ofEqs. (16)–(18). In the case of the permeants G, the commonestanomalies were seen [7] with the two permeants CO2 and H2O.The anomalies were in most cases only seen in the Plot A andPlot C, and not in the Plot B (see Eqs. (16)–(18)), indicating thatthis is related to an anomaly specifically in the permeation activa-tion energy EP, with this value being lower than expected fromthe behavior of other gases; this seems to be the cause of CO2being a relatively “fast” gas in permeation [1,7]. At the time ofthe previous publication [7] no clarification could be given ofthis effect with CO2. However, re-evaluation of this data [31]indicates that there an essentially constant energy anomaly (lowEP) of 18(5) kJ mol−1 for the organic polymers studied with thispermeant, with little if any correlation of the individual valueswith such parameters as the cohesive energy density of the poly-mer, or the enthalpy change of sorption �HS of CO2 into the
bulk polymer. It seems that this effect results from to an ener-getically favorable interaction between the quadrupole momentof CO2 molecule at the transition site doorway and the polargroups in the surrounding host matrix. This is thus an exampleof the matrix-permeant energy contribution EMG towards EP inEq. (21). This interpretation is supported by the fact that CO2 iswell known to interact in a specific way with the bulk matrix ofmany polymers [32,33]. This effect is also seen with silica (Sec-tion 3 below) and is discussed further there. A similar energyanomaly occurs with H2O [7], where parallel interactions couldoccur due to polar interactions, or possibly hydrogen bonding, atthe transition site doorway; this would also explain why H2O isalso characterized as a “fast” gas (vapor) in membrane separationprocesses [1].2.7. Interpretation of the linear plots
The simplest explanation of these linear relations in Eqs.(16)–(18) seems to be as follows.
In the first place, the linear relation of Eq. (16) (Plot A) indi-cates that with increase in molecular diameter �G there is a parallel
e Science 320 (2008) 42–56 47
increase in the internal energy change �U‡, shown to be equal tothe activation energy EP (Eq. (8)), to insert the molecule of G intothe doorway D (Fig. 1). Focusing on the expansion contribution Eex
in Eq. (14), if we follow this linear plot back down to its intersec-tion point with the x-axis (EP = 0), this point then represents thecondition where there is no energy required, that is, the moleculeexactly fits into the doorway (see Fig. 3 below Section 3.4). Thisindicates that for the set of permeant molecules considered, thereare a fixed number of pre-existing doorways of diameter �D thatcontrol the migration of the permeant molecules through the hostmedium. The energy dependence of Eq. (16) may then be put morespecifically in the form
EP = �(�G − �D) (21)
where the coefficient � is the force constant for the expansion of thedoorways for this host solid.
Likewise, the second linear relation Eq. (10) (Plot B) shows thatthere is correspondingly a linear increase in the entropy of thematrix at the doorway when the molecule is inserted, due to theexpansion by the inserted molecule (see Fig. 4 below Section 3.4);this follows because log Y0 is directly related to the entropy change[(S(GD) − S(D)] by Eq. (13), and the first two terms on the right handside of this equation are independent of �G. This may be put in themore specific form:
log Y0 = log Yz + �(log e)(�G − �D)R
(22)
where the coefficient � is the corresponding entropy increment forthe doorway expansion process for that solid, and Yz is the limitingvalue of Y0 for �G = �D.
These two parameters � and � therefore define the thermody-namics of the expansion process. They are unusual in that, in thecase of the energy change, because this increases linearly with theexpansion, this represent a constant force being exerted by the door-way, rather than an increasing force as might be expected for abulk solid with constant elastic modulus. In particular, it is in con-trast with the form of Eq. (15) that is derived from the mechanicsof elasticity for a cylindrical cavity in the bulk solid; however, thedefects of this approach have already been noted in the discus-sion of this equation. Speculatively, the linear behavior may arisefrom the transition-site doorways being asymmetric (transverselyelliptical or slot-shaped) rather than being symmetric (circular) as
This same Plot B also provides a method to obtain an estimateof the doorway-spacing parameter �, which equivalent to the jumplength of the diffusion model (Fig. 1). Considering Eq. (13) for log Y0,the limit EP = 0 corresponds to �G = �D, with the gas molecule G justfitting into the doorway, there will be no perturbation of the door-way by the penetrant; so that not only will there be zero energychange but there will also be zero entropy change, that is theentropy term on the right of Eq. (13) will be zero; this correspondsto the value of log Yz from Eq. (22). Thus Eq. (13) gives
log Yz = log(
kBT
ehNA
)− log � (23)
from which in principle the value of � may be estimated since allthe other quantities in this equation are known.
Considering the third linear relation, Eq. (18) (Plot C), as alreadynoted its linear form follows directly from Eqs. (16) and (17) (seeFig. 5 below Section 3.4).
The goodness of fit of these linear Eqs. (16) and (17) dependsnecessarily on well-defined values of the molecular diameter �G,both with these organic polymers and with the inorganic amor-phous solid, silica, considered in Section 3 of this paper. The sources
bran
later publications [39,40], which used nine permeant gases: Ar,H2, He, N2, O2, CO, CO2, CH4 and C2H4, whose permeation ratewas measured over 25–200 ◦C. A pressure differential �p = 21.4 atm(2.17 MPa) was used for the main permeation studies.
48 P. Molyneux / Journal of Mem
and suitability of these values are therefore discussed critically inAppendix B.
2.8. Effects of finite uptake
As noted initially in Section 2.2, the present treatment appliesspecifically to the “ideal case” of low pressures and low concen-trations. In real systems there are often deviations at the higherpressures and sorbed concentrations, so that the sorption coeffi-cient S depends upon �p, and D upon �c.
In the TSM, these effects may be viewed in the first instance asthe result of the sorbed G on the characteristics of the doorways;taking the spacing � to be fixed for the material, this then involvesthe remaining three parameters �D, �, and �. To disentangle theseeffects, it would be necessary to measure EP and Y0 as before overa range of uptakes c, with care being taken that the uptake is thesame for each range of temperature—for example, that there is thesame value of c at 25 ◦C as there is at 200 ◦C.
In some cases the sorbed molecules may be so strongly boundas to have little if any effect on the transition-site doorways, sothat the value of P remains essentially constant. This seems to bethe situation in the case of H2O with medium-polarity polymers[7], and likewise of H2O/oxidised PE [19] considered in Section 2.3.This may also apply to the similar behavior for H2 with vitreousSiO2 [18] also considered in that section.
At higher pressures there may be the purely hydrostatic effectof the gas G upon the insertion process of Eq. (11), which may beformalised as a volume change of activation �V‡; this would leadto a contribution p�V‡ to the free energy change �G‡ and thence tothe activation energy EP, which would thus show up in the Arrhe-nius plots. At such higher pressures, it may be necessary to use thegas fugacity as the activity-corrected form in place of the pressure.
At higher uptakes still there may be effects from blocking of thesorption cavities to the release of the molecule from the TS doorway,or plasticization of the whole solid matrix, but in this case the solidmust then be considered to be different in nature from the purematerial.
3. Application of the TSM to permeation throughmicroporous silica hollow-fiber membranes
3.1. Inorganic membranes for permeation
Although organic polymers continue to play an important role asmembranes for separation processes, there is an increasing interestin inorganic membranes, because of favorable properties such asgreater heat stability [11,34]. It is therefore useful to see to whatextent the TSM model applies to this latter type of membrane. Inthe present case, this is applied specifically to the inorganic glasses,notably silica as the paradigm simplest case; some other types ofinorganic membranes are discussed briefly in Section 3.9.
There is a great bulk of previous literature studies on permeationthrough and diffusion in glasses [3,5,6]. Unfortunately, it is difficultto link these studies into a coherent picture, not least because thereare so many varieties of silica; for example, Doremus [35] has listedfour distinct commercial types of compact (nonporous) vitreoussilica. Furthermore, numerous novel types of microporous silica havebeen developed recently, made for example, by the acid leachingof borosilicate glass in hollow-fiber form [36–42], or as a sol–gelform by coating a polymeric silica sol onto a more porous substratesuch as such as alumina [34,43–46]. In this context, “microporous”implies a substance with pore diameter less than about 2 nm. Suchporosity is intended to confer a higher permeability than that forthe compact form, while at the same time retaining the activated
e Science 320 (2008) 42–56
character of the migration so as to give useful separation of differentgases.
3.2. Permeation data of Way et al. for microporous silicahollow-fiber membranes
In applying the TSM to microporous silica, what is required is aset of data for a set of permeant gases having a range of moleculardiameters, studied over a sufficiently wide range of temperaturethat good Arrhenius data may be obtained and the test plots of Eqs.(16)–(18) may be applied as already discussed in Section 2.6. Thismirrors the requirements for the data sets for organic polymersused in the previous development of the TSM [7]. This requirementis largely fulfilled by the literature data on the microporous sil-ica hollow-fiber membranes that were produced and patented byPPG Industries [36,37], and that were used in the three permeationstudies published by Way and colleagues [38–40], where they werereferred to as “developmental products”. As detailed in the refer-ences, the hollow-fiber membranes had been produced by meltextrusion of a borosilicate glass, followed by exhaustive acid leach-ing to remove Na and B, producing a network of pores with diameterclaimed to be less than 20 A (2 nm) [36,37]. For the present pur-poses, it is convenient to refer to this form of microporous silica as�SiO2, to distinguish it from (for example) normal compact vitre-ous silica, vSiO2. However, this is only one example from a diverserange of these materials.
Before considering these data further, it should be noted thatthere are parallel data, on another sample of the PPG product, pub-lished by Shelekhin et al. [41,42]. Since there are marked differencesin the results from these two groups, the latter are considered sep-arately below in Section 3.8.
The fibers studied in two main papers from Way et al. [39,40] hadinside and outside diameters of the fibers of 35 and 45 �m, giving anominal wall thickness of 5 �m, while the material itself was foundto be amorphous, with about 20% porosity and with polydispersepores averaging about 10 nm. There was also physisorbed molecularwater (not quantitified) that was removed on heating above 450 K,with exposure to the atmosphere at normal temperature leading toits resorption.
The present paper focuses on the main studies in the two
The studies also included measurements with gas mixtures;such studies are naturally important in relation to gas separation[1,11,41,45,47]. However, only the single-gas measurements havebeen considered here.
For convenience of the future discussion, some important phys-ical properties of these nine permeant gases are listed in Table 1:(electrical) polarity factors (molar polarizability, dipole moment,and quadrupole moment) [48,49], the absolute entropy S0 [50] (seeAppendix A), the critical constants [51], and various sets of valuesof the molecular diameter �G [52–56] (see Appendix B).3
The data from first of the three Way publications [38] showcertain inconsistencies both internally (nonlinear Arrhenius plots)and with the later data [39,40]; they must therefore be viewedas only preliminary, and (except for He) they are not consideredfurther here.
3 Data in this paper are given in the internationally standard concise form: “meanvalue (limits of error in the last decimal place of the mean value)”, so that forexample, “1.23(4)” represents “1.23 ± 0.04” (see: http://physics.nist.gov/cuu/ Con-stants/index.htm).
P. Molyneux / Journal of Membrane Science 320 (2008) 42–56 49
ith th
consta
re—semol−
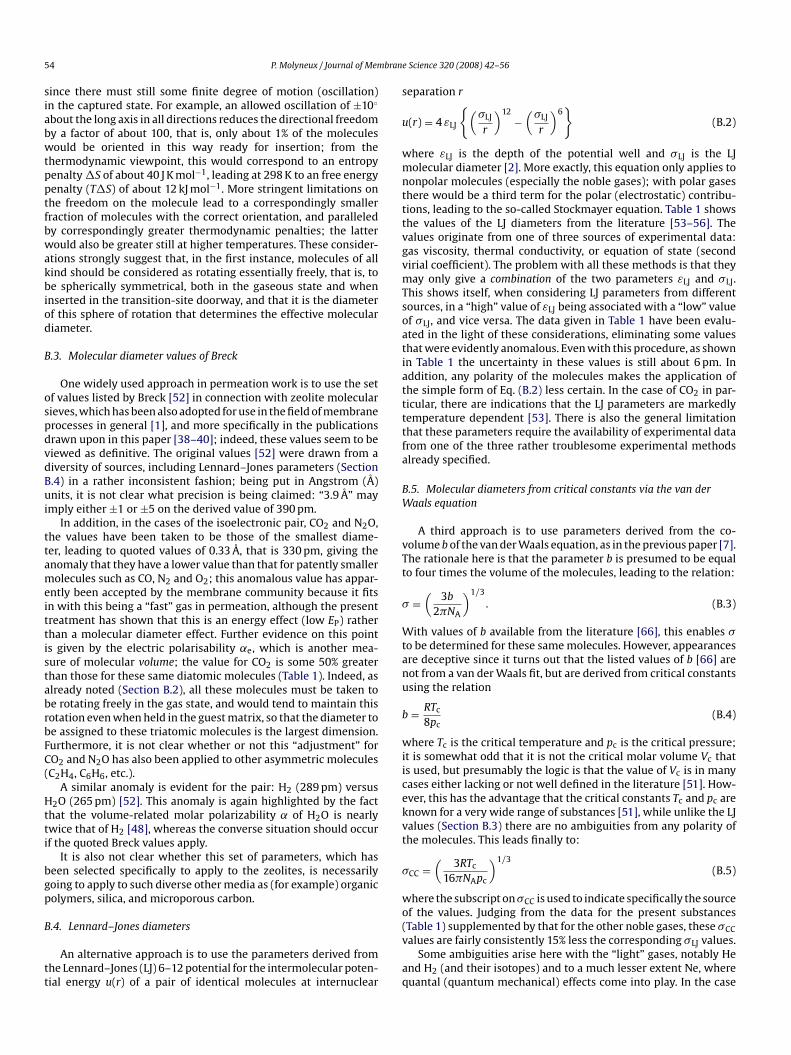
Table 1Physical and molecular properties for the gases G that were studied as permeants w
G Polarity factors S0d Critical
˛ea pe
b Qec pc
Ar 1.00 0 nd 251 4.87H2 0.49 0 1.7 227 1.29He 0.13 0 nd 222 0.23N2 1.03 0 −4.7 288 3.39O2 0.94 0 nd 256g 5.04CO 1.18 0.4 −9.5 294 3.50CO2 1.51 0 −14.3 310 7.38CH4 1.47 0 nd 282 4.60C2H4 2.52 0 13.1 315 5.04
a Molar electric polarisability (cm3 mol−1) [48,49].b Electric dipole moment (C m) × 1030 [49].c Electric quadrupole moment (C m2) × 1040 [49].d Absolute entropy at 298 K (J K−1 mol−1) [50], adjusted to 1 Pa as standard pressue Critical constants: pressure pc (MPa), temperature Tc (K), molar volume Vc (cm3
f
Molecular diameter values (pm) with sources: Breck [52], Lennard–Jones (LJ) [53–56]g Oxygen – special value of S0 – see Appendix A.3.3. Permeability coefficients and the Arrhenius plots
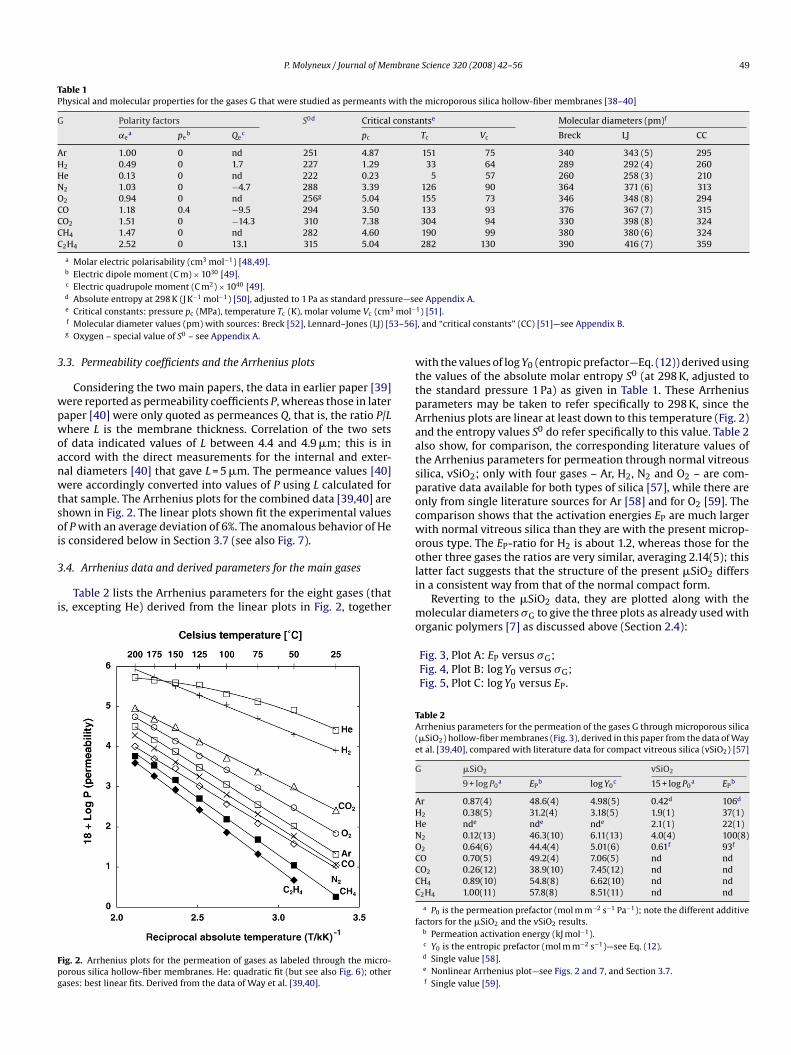
Considering the two main papers, the data in earlier paper [39]were reported as permeability coefficients P, whereas those in laterpaper [40] were only quoted as permeances Q, that is, the ratio P/Lwhere L is the membrane thickness. Correlation of the two setsof data indicated values of L between 4.4 and 4.9 �m; this is inaccord with the direct measurements for the internal and exter-nal diameters [40] that gave L = 5 �m. The permeance values [40]were accordingly converted into values of P using L calculated forthat sample. The Arrhenius plots for the combined data [39,40] areshown in Fig. 2. The linear plots shown fit the experimental valuesof P with an average deviation of 6%. The anomalous behavior of Heis considered below in Section 3.7 (see also Fig. 7).
3.4. Arrhenius data and derived parameters for the main gases
Table 2 lists the Arrhenius parameters for the eight gases (thatis, excepting He) derived from the linear plots in Fig. 2, together
Fig. 2. Arrhenius plots for the permeation of gases as labeled through the micro-porous silica hollow-fiber membranes. He: quadratic fit (but see also Fig. 6); othergases: best linear fits. Derived from the data of Way et al. [39,40].
e microporous silica hollow-fiber membranes [38–40]
ntse Molecular diameters (pm)f
Tc Vc Breck LJ CC
151 75 340 343 (5) 29533 64 289 292 (4) 260
5 57 260 258 (3) 210126 90 364 371 (6) 313155 73 346 348 (8) 294133 93 376 367 (7) 315304 94 330 398 (8) 324190 99 380 380 (6) 324282 130 390 416 (7) 359
e Appendix A.1) [51]., and “critical constants” (CC) [51]—see Appendix B.
with the values of log Y0 (entropic prefactor—Eq. (12)) derived usingthe values of the absolute molar entropy S0 (at 298 K, adjusted tothe standard pressure 1 Pa) as given in Table 1. These Arrhenius
parameters may be taken to refer specifically to 298 K, since theArrhenius plots are linear at least down to this temperature (Fig. 2)and the entropy values S0 do refer specifically to this value. Table 2also show, for comparison, the corresponding literature values ofthe Arrhenius parameters for permeation through normal vitreoussilica, vSiO2; only with four gases – Ar, H2, N2 and O2 – are com-parative data available for both types of silica [57], while there areonly from single literature sources for Ar [58] and for O2 [59]. Thecomparison shows that the activation energies EP are much largerwith normal vitreous silica than they are with the present microp-orous type. The EP-ratio for H2 is about 1.2, whereas those for theother three gases the ratios are very similar, averaging 2.14(5); thislatter fact suggests that the structure of the present �SiO2 differsin a consistent way from that of the normal compact form.Reverting to the �SiO2 data, they are plotted along with themolecular diameters �G to give the three plots as already used withorganic polymers [7] as discussed above (Section 2.4):
Fig. 3, Plot A: EP versus �G;Fig. 4, Plot B: log Y0 versus �G;Fig. 5, Plot C: log Y0 versus EP.
Table 2Arrhenius parameters for the permeation of the gases G through microporous silica(�SiO2) hollow-fiber membranes (Fig. 3), derived in this paper from the data of Wayet al. [39,40], compared with literature data for compact vitreous silica (vSiO2) [57]
G �SiO2 vSiO2
9 + log P0a EP
b log Y0c 15 + log P0
a EPb
Ar 0.87(4) 48.6(4) 4.98(5) 0.42d 106d
H2 0.38(5) 31.2(4) 3.18(5) 1.9(1) 37(1)He nde nde nde 2.1(1) 22(1)N2 0.12(13) 46.3(10) 6.11(13) 4.0(4) 100(8)O2 0.64(6) 44.4(4) 5.01(6) 0.61f 93f
CO 0.70(5) 49.2(4) 7.06(5) nd ndCO2 0.26(12) 38.9(10) 7.45(12) nd ndCH4 0.89(10) 54.8(8) 6.62(10) nd ndC2H4 1.00(11) 57.8(8) 8.51(11) nd nd
a P0 is the permeation prefactor (mol m m−2 s−1 Pa−1); note the different additivefactors for the �SiO2 and the vSiO2 results.
b Permeation activation energy (kJ mol−1).c Y0 is the entropic prefactor (mol m m−2 s−1)—see Eq. (12).d Single value [58].e Nonlinear Arrhenius plot—see Figs. 2 and 7, and Section 3.7.f Single value [59].

50 P. Molyneux / Journal of Membrane Science 320 (2008) 42–56
Fig. 3. Plot A—permeation activation energy EP versus molecular diameter �G forgases through the PPG microporous silica hollow-fiber membranes. Key: © six gasesas labeled – the straight line is least-squares fit for this set; ♦ CO2; � CO2 – inter-polated value, with the broken line indicating the energy anomaly �EP; � CO; �He—extrapolated EP value. The extrapolation of the linear fit to EP = 0 gives the esti-mate of the (unperturbed) doorway diameter �D as labeled. Derived from the dataof Way et al. [39,40].
The molecular diameters values �G used here are the “criti-cal constant” values �CC listed in the last column of Table 1 (seeAppendix B), as previously used with the organic polymers [7]. Ineach case the three plots are essentially linear, as previously seenwith the organic polymers [7]. The original papers [39,40] gavesimilar plots to the present Plot A, using the Breck values [52] formolecular diameter (see Table 1 and Appendix B), and also notedthe essential linearity.
Again, as with the organic polymers [7], deviations are seen withCO2, as discussed in Section 3.6 below; however, closer examina-tion of the data indicated that the behavior of CO is also anomalous,
Fig. 4. Plot B—log Y0 (entropic prefactor) versus molecular diameter �G for permeantgases with the PPG microporous silica hollow-fiber membranes. Key: ©; six gasesas labeled – the straight line is least-squares fit for this set; ♦ CO2; � CO; �: He –extrapolated log Y0. The extrapolation of the linear fit to EP = 0 is labeled with theestimate of the (unperturbed) doorway diameter �D from Fig. 3. Derived from thedata of Way et al. [39,40].
Fig. 5. Plot C—log Y0 (entropic prefactor) versus permeation activation energy EP,for permeant gases with the PPG microporous silica hollow-fiber membranes. Key:© six gases as labeled – the straight line is least-squares fit for this set; ♦ CO2; � CO;�: He – extrapolated (see Figs. 3 and 4). Derived from the data of Way et al. [39,40].
in that in the case of Plot B (Fig. 4) omitting this permeant as well asCO2 gives a very good linear fit, with any deviations for the remain-ing six permeants (H2, Ar, O2, N2, CH4 and C2H4) similar to thosesuggested by the Arrhenius plots (Table 2). This indicates that, atleast with this set, the log Y0 values are well defined; this indicatesin turn that the EP values are also well defined, and that any devia-tions in the Plot A (Fig. 3) and Plot C (Fig. 5) from linear correlationsrepresent systematic effects. The good linear fit in Plot B (Fig. 4)also indicates that the �G values for these six permeants are welldefined, supporting the self-consistency of the “critical constant”values �CC used here and derived as discussed in Appendix B.4.
It is therefore convenient to divide the interpretation of thedata into the primary effects, relating to the (average) straight linesin the test plots, and the secondary effects, relating to systematicdeviations from these linear correlations.
3.5. Primary effects: H2, Ar, O2, N2, CH4, C2H4
Considering the primary effects, the behavior of this group ofsix gases relates mainly to the expansion of the SiO2 matrix, corre-sponding to the energy contribution Eex of Eq. (14), the data fromthe three linear Plots A–C results indicate, as discussed for theorganic polymers in Section 2.7, that the permeation of this setof six gases involves a single fixed set of doorways with defineddiameter and defined spacing. The linear increase of EP and log Y0results from the energy and entropy effects of inserting increas-ingly large permeant molecules to expand the silica matrix at theTS doorway (Fig. 1).4 Using Eqs. (21) and (22) gives the values of thefour characteristic parameters for the TS doorways listed in Table 3.
These values are similar to those seen with the organic poly-mers [7], although in the latter case the thermodynamic parametersin particular show a wide range of values because of the diver-sity of polymers considered. As with the organic polymers, theseparameters must be considered average values.
It will be noted that these expansion effects are seen for perme-ants ranging in size and molecular complexity from H2 up to C2H4,
4 See footnote 2.
bran
P. Molyneux / Journal of MemTable 3Parameters for the transition-site doorways in the permeation of gases through thePPG samples of �SiO2 studied by Way et al. [39,40]a
Name Symbol Value Units Figure Equation
Unperturbed diameter �D 125(10) pm 3 (21)Force constant � 0.43(7) nN 3 (21)Entropy increment � 1.7(2) pN K−1 4 (22)Doorway spacing � 30(�4) nm 4 (22)
a “Primary effect” data from the linear fits in the Figures specified for the six gases:Ar, H2, N2, O2, CH4, C2H4—see Section 3.5.
and including the intrinsically spherical (Ar) as well as the intrin-sically planar (C2H4). This also shows the value of studying a widenumber and range of permeants, since it allows for a few to turnout to be markedly anomalous (here, He, CO and CO2) while stillallowing sufficient remaining to define the main effects.
3.6. Secondary effects
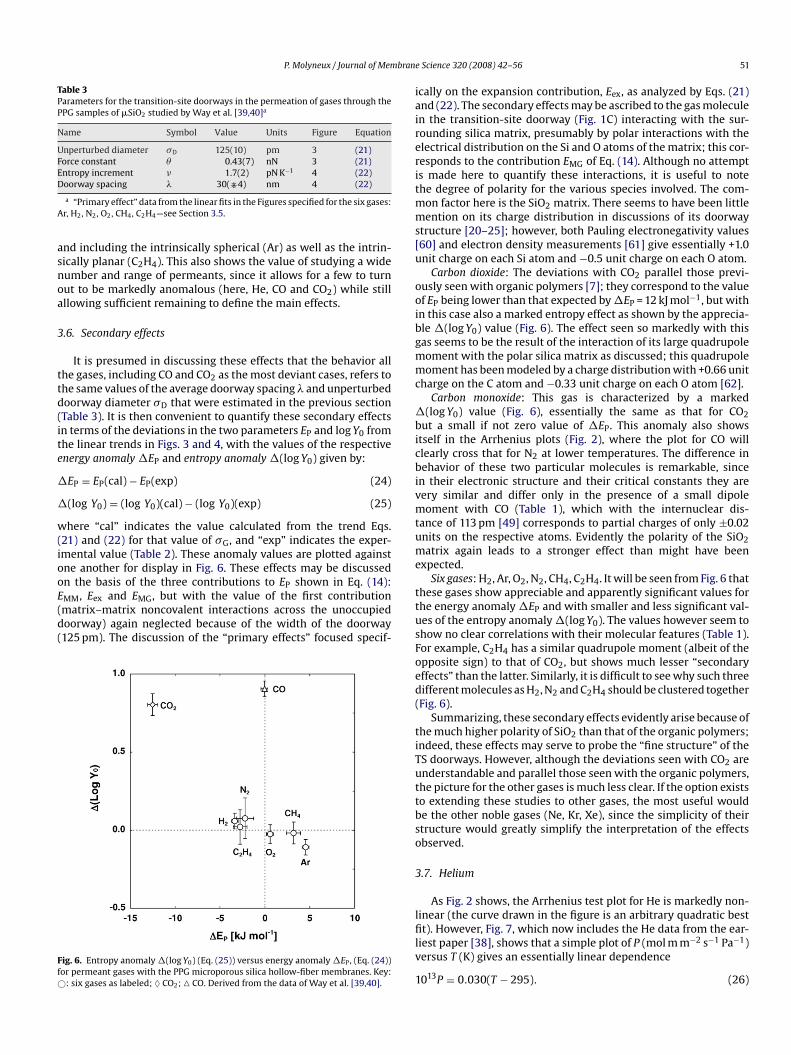
It is presumed in discussing these effects that the behavior allthe gases, including CO and CO2 as the most deviant cases, refers tothe same values of the average doorway spacing � and unperturbeddoorway diameter �D that were estimated in the previous section(Table 3). It is then convenient to quantify these secondary effectsin terms of the deviations in the two parameters EP and log Y0 fromthe linear trends in Figs. 3 and 4, with the values of the respectiveenergy anomaly �EP and entropy anomaly �(log Y0) given by:
�EP = EP(cal) − EP(exp) (24)
�(log Y0) = (log Y0)(cal) − (log Y0)(exp) (25)
where “cal” indicates the value calculated from the trend Eqs.(21) and (22) for that value of �G, and “exp” indicates the exper-imental value (Table 2). These anomaly values are plotted againstone another for display in Fig. 6. These effects may be discussedon the basis of the three contributions to EP shown in Eq. (14):EMM, Eex and EMG, but with the value of the first contribution(matrix–matrix noncovalent interactions across the unoccupieddoorway) again neglected because of the width of the doorway(125 pm). The discussion of the “primary effects” focused specif-
Fig. 6. Entropy anomaly �(log Y0) (Eq. (25)) versus energy anomaly �EP, (Eq. (24))for permeant gases with the PPG microporous silica hollow-fiber membranes. Key:©: six gases as labeled; ♦ CO2; � CO. Derived from the data of Way et al. [39,40].
e Science 320 (2008) 42–56 51
ically on the expansion contribution, Eex, as analyzed by Eqs. (21)and (22). The secondary effects may be ascribed to the gas moleculein the transition-site doorway (Fig. 1C) interacting with the sur-rounding silica matrix, presumably by polar interactions with theelectrical distribution on the Si and O atoms of the matrix; this cor-responds to the contribution EMG of Eq. (14). Although no attemptis made here to quantify these interactions, it is useful to notethe degree of polarity for the various species involved. The com-mon factor here is the SiO2 matrix. There seems to have been littlemention on its charge distribution in discussions of its doorwaystructure [20–25]; however, both Pauling electronegativity values[60] and electron density measurements [61] give essentially +1.0unit charge on each Si atom and −0.5 unit charge on each O atom.
Carbon dioxide: The deviations with CO2 parallel those previ-ously seen with organic polymers [7]; they correspond to the valueof EP being lower than that expected by �EP = 12 kJ mol−1, but within this case also a marked entropy effect as shown by the apprecia-ble �(log Y0) value (Fig. 6). The effect seen so markedly with thisgas seems to be the result of the interaction of its large quadrupolemoment with the polar silica matrix as discussed; this quadrupolemoment has been modeled by a charge distribution with +0.66 unitcharge on the C atom and −0.33 unit charge on each O atom [62].
Carbon monoxide: This gas is characterized by a marked�(log Y0) value (Fig. 6), essentially the same as that for CO2but a small if not zero value of �EP. This anomaly also showsitself in the Arrhenius plots (Fig. 2), where the plot for CO willclearly cross that for N2 at lower temperatures. The difference inbehavior of these two particular molecules is remarkable, sincein their electronic structure and their critical constants they arevery similar and differ only in the presence of a small dipolemoment with CO (Table 1), which with the internuclear dis-tance of 113 pm [49] corresponds to partial charges of only ±0.02units on the respective atoms. Evidently the polarity of the SiO2matrix again leads to a stronger effect than might have beenexpected.
Six gases: H2, Ar, O2, N2, CH4, C2H4. It will be seen from Fig. 6 thatthese gases show appreciable and apparently significant values forthe energy anomaly �EP and with smaller and less significant val-ues of the entropy anomaly �(log Y0). The values however seem toshow no clear correlations with their molecular features (Table 1).For example, C2H4 has a similar quadrupole moment (albeit of theopposite sign) to that of CO2, but shows much lesser “secondaryeffects” than the latter. Similarly, it is difficult to see why such threedifferent molecules as H2, N2 and C2H4 should be clustered together
(Fig. 6).Summarizing, these secondary effects evidently arise because ofthe much higher polarity of SiO2 than that of the organic polymers;indeed, these effects may serve to probe the “fine structure” of theTS doorways. However, although the deviations seen with CO2 areunderstandable and parallel those seen with the organic polymers,the picture for the other gases is much less clear. If the option existsto extending these studies to other gases, the most useful wouldbe the other noble gases (Ne, Kr, Xe), since the simplicity of theirstructure would greatly simplify the interpretation of the effectsobserved.
3.7. Helium
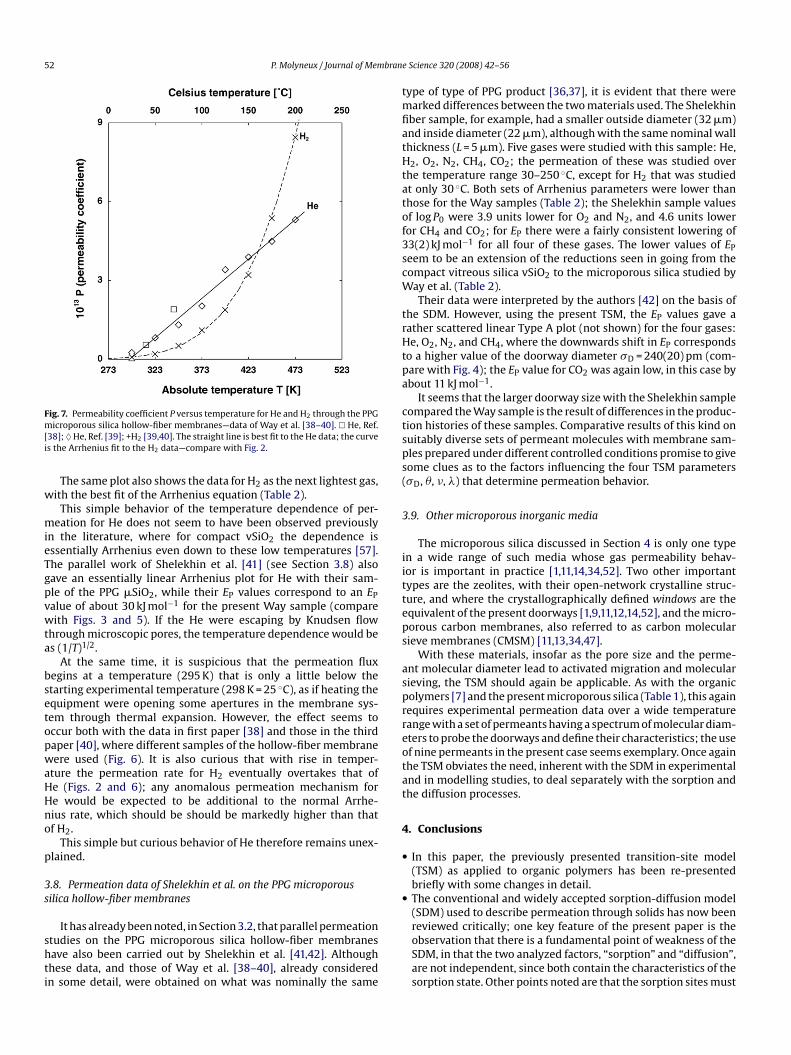
As Fig. 2 shows, the Arrhenius test plot for He is markedly non-linear (the curve drawn in the figure is an arbitrary quadratic bestfit). However, Fig. 7, which now includes the He data from the ear-liest paper [38], shows that a simple plot of P (mol m m−2 s−1 Pa−1)versus T (K) gives an essentially linear dependence
1013P = 0.030(T − 295). (26)
52 P. Molyneux / Journal of Membran
polymers [7] and the present microporous silica (Table 1), this again
Fig. 7. Permeability coefficient P versus temperature for He and H2 through the PPGmicroporous silica hollow-fiber membranes—data of Way et al. [38–40]. � He, Ref.[38]; ♦ He, Ref. [39]; +H2 [39,40]. The straight line is best fit to the He data; the curveis the Arrhenius fit to the H2 data—compare with Fig. 2.
The same plot also shows the data for H2 as the next lightest gas,with the best fit of the Arrhenius equation (Table 2).
This simple behavior of the temperature dependence of per-meation for He does not seem to have been observed previouslyin the literature, where for compact vSiO2 the dependence isessentially Arrhenius even down to these low temperatures [57].The parallel work of Shelekhin et al. [41] (see Section 3.8) alsogave an essentially linear Arrhenius plot for He with their sam-ple of the PPG �SiO2, while their EP values correspond to an EPvalue of about 30 kJ mol−1 for the present Way sample (comparewith Figs. 3 and 5). If the He were escaping by Knudsen flowthrough microscopic pores, the temperature dependence would beas (1/T)1/2.
At the same time, it is suspicious that the permeation fluxbegins at a temperature (295 K) that is only a little below thestarting experimental temperature (298 K = 25 ◦C), as if heating the
equipment were opening some apertures in the membrane sys-tem through thermal expansion. However, the effect seems tooccur both with the data in first paper [38] and those in the thirdpaper [40], where different samples of the hollow-fiber membranewere used (Fig. 6). It is also curious that with rise in temper-ature the permeation rate for H2 eventually overtakes that ofHe (Figs. 2 and 6); any anomalous permeation mechanism forHe would be expected to be additional to the normal Arrhe-nius rate, which should be should be markedly higher than thatof H2.This simple but curious behavior of He therefore remains unex-plained.
3.8. Permeation data of Shelekhin et al. on the PPG microporoussilica hollow-fiber membranes
It has already been noted, in Section 3.2, that parallel permeationstudies on the PPG microporous silica hollow-fiber membraneshave also been carried out by Shelekhin et al. [41,42]. Althoughthese data, and those of Way et al. [38–40], already consideredin some detail, were obtained on what was nominally the same
e Science 320 (2008) 42–56
type of type of PPG product [36,37], it is evident that there weremarked differences between the two materials used. The Shelekhinfiber sample, for example, had a smaller outside diameter (32 �m)and inside diameter (22 �m), although with the same nominal wallthickness (L = 5 �m). Five gases were studied with this sample: He,H2, O2, N2, CH4, CO2; the permeation of these was studied overthe temperature range 30–250 ◦C, except for H2 that was studiedat only 30 ◦C. Both sets of Arrhenius parameters were lower thanthose for the Way samples (Table 2); the Shelekhin sample valuesof log P0 were 3.9 units lower for O2 and N2, and 4.6 units lowerfor CH4 and CO2; for EP there were a fairly consistent lowering of33(2) kJ mol−1 for all four of these gases. The lower values of EPseem to be an extension of the reductions seen in going from thecompact vitreous silica vSiO2 to the microporous silica studied byWay et al. (Table 2).
Their data were interpreted by the authors [42] on the basis ofthe SDM. However, using the present TSM, the EP values gave arather scattered linear Type A plot (not shown) for the four gases:He, O2, N2, and CH4, where the downwards shift in EP correspondsto a higher value of the doorway diameter �D = 240(20) pm (com-pare with Fig. 4); the EP value for CO2 was again low, in this case byabout 11 kJ mol−1.
It seems that the larger doorway size with the Shelekhin samplecompared the Way sample is the result of differences in the produc-tion histories of these samples. Comparative results of this kind onsuitably diverse sets of permeant molecules with membrane sam-ples prepared under different controlled conditions promise to givesome clues as to the factors influencing the four TSM parameters(�D, �, �, �) that determine permeation behavior.
3.9. Other microporous inorganic media
The microporous silica discussed in Section 4 is only one typein a wide range of such media whose gas permeability behav-ior is important in practice [1,11,14,34,52]. Two other importanttypes are the zeolites, with their open-network crystalline struc-ture, and where the crystallographically defined windows are theequivalent of the present doorways [1,9,11,12,14,52], and the micro-porous carbon membranes, also referred to as carbon molecularsieve membranes (CMSM) [11,13,34,47].
With these materials, insofar as the pore size and the perme-ant molecular diameter lead to activated migration and molecularsieving, the TSM should again be applicable. As with the organic
requires experimental permeation data over a wide temperaturerange with a set of permeants having a spectrum of molecular diam-eters to probe the doorways and define their characteristics; the useof nine permeants in the present case seems exemplary. Once againthe TSM obviates the need, inherent with the SDM in experimentaland in modelling studies, to deal separately with the sorption andthe diffusion processes.
4. Conclusions
• In this paper, the previously presented transition-site model(TSM) as applied to organic polymers has been re-presentedbriefly with some changes in detail.
• The conventional and widely accepted sorption-diffusion model(SDM) used to describe permeation through solids has now beenreviewed critically; one key feature of the present paper is theobservation that there is a fundamental point of weakness of theSDM, in that the two analyzed factors, “sorption” and “diffusion”,are not independent, since both contain the characteristics of thesorption state. Other points noted are that the sorption sites must
bran
P. Molyneux / Journal of Membe heterogeneous in character, and that the pressure differentialand not the concentration gradient is the true driving force forthe migration.
• By contrast, the strength of the TSM lies in its focus on thetransition-sites that it turns out are already accepted as doorwaysfor migration in nonporous inorganic glasses such as vitreoussilica.
• The TSM allows analysis of the linear test plots to estimate thefour characteristic quantities: the intrinsic diameter of the door-way, �D; the thermodynamic parameters for the expansion ofthe doorway, � (force constant) and � (entropy increment); andthe average spacing between neighboring doorways �, which isequivalent to the “jump distance” of the SDM.
• The TSM has the advantage over the SDM that if decouples themigration process from the sorption equilibrium. Strictly, thisonly applies in the limit of low pressures and low amounts ofsorption; the actual amount of sorption only comes in as a per-turbation effect, that is, of the sorbed molecules on the propertiesand behavior of the doorways.
• The present work has shown that the TSM applies to one particu-lar type of microporous silica hollow-fiber membrane producedby PPG Industries, and that it gives values for the four character-istic parameters that are similar to those obtained with organicpolymers. There are also some “secondary effects” that are inter-preted as host-guest interactions at the doorway.
• These results suggest that the TSM should be applicable morewidely to inorganic membranes showing activated permeationby molecular sieving, including other types of microporous solidsas well as zeolites and other crystalline solids.
Appendix A. Absolute molar entropy values, S0
The values of the absolute molar entropy, S0, for the gases play animportant part in the TSM, in correcting for their different entropylevels in the gas state on either side of the membrane, and puttingthese on the same basis as the energy values which are all on thesame (zero) level in the gas state. There are two points to be notedin connection with these values listed in Table 1.
The first point relates to the matter of the pressure units thatare used as the reference level in defining S0, since this must be thesame as the pressure units used for the permeability coefficient;this reference level relates to the entropy change that takes placewhen the solid (crystalline) form of the substance (with entropy
essentially independent of pressure) is converted to the gas (vapor)state. In a previous publication [63] this reference level has beenconsidered as a form of “hidden” unit; an alternative method wouldbe to simply use permeability coefficients that are referred to thesame standard pressure unit of the absolute entropy value, althoughthis is not such a transparent way of working. In either case, the con-version from the literature values of S0 [50] with the bar (=105 Pa)as the standard state pressure, to the pressure unit Pa used in thepermeability coefficient, requires the addition of R ln(105), that is,96 J K−1 mol−1; the values so adjusted are listed in Table 1, and usedin the calculation of the entropic prefactor Y0 using Eq. (12).The second point relates specifically to the value of S0 to be usedfor O2. In the case of the organic polymers [7], it was found thatusing the value of 301 J K−1 mol−1 obtained by applying the abovepressure-unit adjustment, with all the polymers where O2 had beenstudied alongside a number of other permeant gases, in each caseit gave the same anomaly with the Plot B and the Plot C, but noanomaly with the Plot A; this indicates that the anomaly relatesto a high value of the parameter log Y0 (entropic prefactor). Sincethis occurred in a consistent way with all of the polymers involved,and unless the anomaly relates to a different value of the rate coeffi-
e Science 320 (2008) 42–56 53
cient or lattice parameter for this gas – Eqs. (16)–(18) – then the onlycommon factor is the gas itself. This was therefore dealt with prag-matically by using the lower value of 256 J K−1 mol−1 for this gas,which removed the anomaly for this gas in all the cases involved.This has also been done in the present case (Table 1), and leads toa good fit in the Plot B (Fig. 4) and Plot C (Fig. 5), as well as in Plot A(Fig. 3) where this factor is not involved.
Appendix B. Molecular diameters of permeant gasmolecules, �G
B.1. Importance of molecular diameter values
In the evaluation and interpretation of the migration of guestmolecules in solids from the molecular viewpoint, it is evidentlynecessary to have a self-consistent set of molecular diameters forthe gases used; however, there seems to have been little specificor critical examination of these diameter values used in this area[2,3,7]. This requirement is particularly important for the accu-rate estimation of the diameter of the unperturbed doorway �D,of the thermodynamic parameters � and � for the expansion of thetransition-site doorway, and of the inter-site spacing �. For each ofthese depends on the good linear definition of the three test plots(see Figs. 3–5).
In quoting these values, it is found clearer to use picometers(1 pm = 0.01 A = 0.001 nm) since these shows up better the effect ofsmall changes on the permeation behavior.
There are three main sets of values that have been applied inthe area of permeation through membranes, as considered belowin Sections B.3 and B.4. However, it is necessary firstly to considerthe effect of rotation on the effective molecular diameter.
B.2. Rotation of molecules in relation to molecular diameters
In considering the specific dimensions of molecules, and inparticular how they pack together in the solid-state at low tem-peratures, it is evidently necessary to consider the detailed shapes.Commonly, this can be summarized as spherical, rod-shaped, pla-nar, etc. Frequently, in considering the migration properties ofmolecules in solids, these shapes are referred to in order to clar-ify or interpret the behavior; for example, a rod-shaped moleculeis commonly presumed to present its narrowest dimension to thebarrier to ease its passage. However, this ignores the significance ofrotation in the behavior of the molecule. At a high enough tem-
perature, a molecule will have an amount kBT/2 in each axis ofrotation; in macroscopic terms, this energy amounts at 25 ◦C toabout 1 kJ mol−1. Although rotation is suppressed for all moleculesat sufficiently low temperatures, as the temperature is raised quan-tum effects lead to the onset of rotation. This is shown by the valuesof the heat capacity at constant pressure Cp, which in the generalcase rises with temperature as firstly translation, then rotation andthen vibration modes come into play [64]; the literature data for Cpshow that this rotational freedom is essentially complete at 298 Kfor all the molecules considered here [65]. The angular velocity ωwill be given by the standard mechanics formula relating it to themoment of inertia I of the molecule about that axis
kBT
2= Iω2
2. (B.1)
For molecules of the type used here as permeants(Tables 1 and 2), this gives angular velocities ω in the rangeof 1012 to 1013 s−1 [64]. Thus if a specific orientation is envisagedfor the permeant molecule in the doorway, this very rapid rotationmust be stopped. At the same time, the orientation involves anentropy penalty, related to the degree of restriction envisaged,
bran
54 P. Molyneux / Journal of Memsince there must still some finite degree of motion (oscillation)in the captured state. For example, an allowed oscillation of ±10◦
about the long axis in all directions reduces the directional freedomby a factor of about 100, that is, only about 1% of the moleculeswould be oriented in this way ready for insertion; from thethermodynamic viewpoint, this would correspond to an entropypenalty �S of about 40 J K mol−1, leading at 298 K to an free energypenalty (T�S) of about 12 kJ mol−1. More stringent limitations onthe freedom on the molecule lead to a correspondingly smallerfraction of molecules with the correct orientation, and paralleledby correspondingly greater thermodynamic penalties; the latterwould also be greater still at higher temperatures. These consider-ations strongly suggest that, in the first instance, molecules of allkind should be considered as rotating essentially freely, that is, tobe spherically symmetrical, both in the gaseous state and wheninserted in the transition-site doorway, and that it is the diameterof this sphere of rotation that determines the effective moleculardiameter.
B.3. Molecular diameter values of Breck
One widely used approach in permeation work is to use the setof values listed by Breck [52] in connection with zeolite molecularsieves, which has been also adopted for use in the field of membraneprocesses in general [1], and more specifically in the publicationsdrawn upon in this paper [38–40]; indeed, these values seem to beviewed as definitive. The original values [52] were drawn from adiversity of sources, including Lennard–Jones parameters (SectionB.4) in a rather inconsistent fashion; being put in Angstrom (A)units, it is not clear what precision is being claimed: “3.9 A” mayimply either ±1 or ±5 on the derived value of 390 pm.
In addition, in the cases of the isoelectronic pair, CO2 and N2O,the values have been taken to be those of the smallest diame-ter, leading to quoted values of 0.33 A, that is 330 pm, giving theanomaly that they have a lower value than that for patently smallermolecules such as CO, N2 and O2; this anomalous value has appar-ently been accepted by the membrane community because it fitsin with this being a “fast” gas in permeation, although the presenttreatment has shown that this is an energy effect (low EP) ratherthan a molecular diameter effect. Further evidence on this pointis given by the electric polarisability ˛e, which is another mea-sure of molecular volume; the value for CO2 is some 50% greaterthan those for these same diatomic molecules (Table 1). Indeed, asalready noted (Section B.2), all these molecules must be taken to
be rotating freely in the gas state, and would tend to maintain thisrotation even when held in the guest matrix, so that the diameter tobe assigned to these triatomic molecules is the largest dimension.Furthermore, it is not clear whether or not this “adjustment” forCO2 and N2O has also been applied to other asymmetric molecules(C2H4, C6H6, etc.).A similar anomaly is evident for the pair: H2 (289 pm) versusH2O (265 pm) [52]. This anomaly is again highlighted by the factthat the volume-related molar polarizability ˛ of H2O is nearlytwice that of H2 [48], whereas the converse situation should occurif the quoted Breck values apply.
It is also not clear whether this set of parameters, which hasbeen selected specifically to apply to the zeolites, is necessarilygoing to apply to such diverse other media as (for example) organicpolymers, silica, and microporous carbon.
B.4. Lennard–Jones diameters
An alternative approach is to use the parameters derived fromthe Lennard–Jones (LJ) 6–12 potential for the intermolecular poten-tial energy u(r) of a pair of identical molecules at internuclear
e Science 320 (2008) 42–56
separation r
u(r) = 4 εLJ
{(�LJ
r
)12−
(�LJ
r
)6}
(B.2)
where εLJ is the depth of the potential well and �LJ is the LJmolecular diameter [2]. More exactly, this equation only applies tononpolar molecules (especially the noble gases); with polar gasesthere would be a third term for the polar (electrostatic) contribu-tions, leading to the so-called Stockmayer equation. Table 1 showsthe values of the LJ diameters from the literature [53–56]. Thevalues originate from one of three sources of experimental data:gas viscosity, thermal conductivity, or equation of state (secondvirial coefficient). The problem with all these methods is that theymay only give a combination of the two parameters εLJ and �LJ.This shows itself, when considering LJ parameters from differentsources, in a “high” value of εLJ being associated with a “low” valueof �LJ, and vice versa. The data given in Table 1 have been evalu-ated in the light of these considerations, eliminating some valuesthat were evidently anomalous. Even with this procedure, as shownin Table 1 the uncertainty in these values is still about 6 pm. Inaddition, any polarity of the molecules makes the application ofthe simple form of Eq. (B.2) less certain. In the case of CO2 in par-ticular, there are indications that the LJ parameters are markedlytemperature dependent [53]. There is also the general limitationthat these parameters require the availability of experimental datafrom one of the three rather troublesome experimental methodsalready specified.
B.5. Molecular diameters from critical constants via the van derWaals equation
A third approach is to use parameters derived from the co-volume b of the van der Waals equation, as in the previous paper [7].The rationale here is that the parameter b is presumed to be equalto four times the volume of the molecules, leading to the relation:
� =(
3b
2�NA
)1/3
. (B.3)
With values of b available from the literature [66], this enables �to be determined for these same molecules. However, appearancesare deceptive since it turns out that the listed values of b [66] arenot from a van der Waals fit, but are derived from critical constantsusing the relation
b = RTc
8pc(B.4)
where Tc is the critical temperature and pc is the critical pressure;it is somewhat odd that it is not the critical molar volume Vc thatis used, but presumably the logic is that the value of Vc is in manycases either lacking or not well defined in the literature [51]. How-ever, this has the advantage that the critical constants Tc and pc areknown for a very wide range of substances [51], while unlike the LJvalues (Section B.3) there are no ambiguities from any polarity ofthe molecules. This leads finally to:
�CC =(
3RTc
16�NApc
)1/3(B.5)
where the subscript on �CC is used to indicate specifically the sourceof the values. Judging from the data for the present substances(Table 1) supplemented by that for the other noble gases, these �CCvalues are fairly consistently 15% less the corresponding �LJ values.
Some ambiguities arise here with the “light” gases, notably Heand H2 (and their isotopes) and to a much lesser extent Ne, wherequantal (quantum mechanical) effects come into play. In the case

P. Molyneux / Journal of Membrane Science 320 (2008) 42–56 55
of the noble gases (He, Ne, Ar, Kr, Xe), this is evidently cause ofthe anomaly, that Ne has a smaller derived value of �CC than He,although the values thereafter increase smoothly for Ne–Xe. How-ever, these directly calculated values were found to be satisfactoryin the previous application of the TSM model to organic polymers[7], while quantal effects are themselves present in the perme-ation of gases through amorphous media, for example with organicpolymers [10]. In the present case the �CC values for He and H2given in Table 1 have been adjusted by using the linear relationthat is observed between �CC and ˛1/3, where � is the volume-dimensioned molar polarizability as also listed in Table 1.
In the present work with microporous silica, it is these �CC val-ues, as listed in the last column of Table 1, that have been used asthe molecular diameter �G in the test plots of Figs. 3 and 4, and inthe calculation of the derived parameters for the doorways listedin Table 3.
Nomenclature
b van der Waals co-volume (m3 mol−1)D diffusion coefficient (m2 s−1)D location of a doorway (transition-site)D0 diffusion prefactor (m2 s−1)Eex energy to expand the TS doorway by the inserted G
molecule (J mol−1)ED activation energy for diffusion (J mol−1)EP activation energy for permeation (J mol−1)EMG energy of noncovalent interaction between the
inserted G molecule and the TS doorway matrix(J mol−1)
EMM energy of noncovalent interactions across the unoc-cupied TS doorway (J mol−1)
�EP energy anomaly Eq. (24) (kJ mol−1)G bulk shear modulus (Pa)G permeant gas moleculeh Planck constant (6.626 × 10⁻³⁴ J s)�HS isosteric sorption enthalpy change (kJ mol−1)kB Boltzmann constant (1.381 × 10⁻²³ J K−1)k‡ transition-state rate constant (s−1)L membrane thickness (m)nd no data/not determinedNA Avogadro constant (6.022 × 10²³ molecules mol−1)p pressure (Pa)pc critical pressure (Pa)pe electric dipole moment (C m)P permeability coefficient (mol m m−2 s−1 Pa−1)P0 permeation prefactor (mol m m−2 s−1 Pa−1)PE poly(ethylene)PEMA poly(ethyl methacrylate)�p pressure difference across the membrane (Pa)Q permeance (mol m−2 s−1 Pa−1)Qe electric quadrupole moment (C m2)R gas constant (8.3145 J K−1 mol−1)S sorption (solubility) coefficient (mol m−3 Pa−1)SDM sorption-diffusion model for permeationS(D) entropy of 1 mol of unoccupied TS doorways
(J K−1 mol−1)S(GD) entropy of 1 mol of TS doorways occupied by the gas
G (J K−1 mol−1)S0 sorption prefactor (mol m−3 Pa−1)S0(G) absolute molar entropy of gas G (reference pressure
1 Pa) (J K−1 mol−1 <Pa>)
�S‡ molar entropy change for insertion of G into a TSdoorway (J K−1 mol−1)
T absolute temperature (K)Tc critical temperature (K)TS transition-site (doorway)TSM transition-site model for permeation�U‡ molar internal energy change for insertion of G into
a TS doorway (J mol−1)Vc critical molar volume (m3 mol−1)x general membrane depth in the direction of perme-
ation (m)Y entropic coefficient Eq. (18) (mol m m−2 s−1)
−2 −1
[
[
[
[
Y0 entropic prefactor Eq. (19) (mol m m s )�(log Y0) entropy anomaly (Eq. (25))� times-or-divided-by
Greek letters˛e molar electric polarisability (m3 mol−1)εLJ Lennard–Jones energy parameter (J)� force constant for expansion of a TS doorway (N)� (average) spacing between neighboring TS door-
ways (m)� entropy-change coefficient for expansion of a TS
doorway (N K−1)� molecular (kinetic, collision) diameter (m)�D diameter of an unoccupied TS doorway (m)�G molecular diameter of the permeant gas G (m)�CC value of � estimated from critical constants
(Appendix B) (m)�LJ Lennard–Jones molecular diameter (Appendix B)
(m)
References
[1] J.D. Henry, et al., Gas-separation membranes, in: R.H. Perry, D.W. Green (Eds.),Perry’s Chemical Engineers’ Handbook, McGraw-Hill, New York, 1997, pp. 22-61–22-67.
[2] Yu. Yampolski, B.D. Freeman, I. Pinnau (Eds.), Materials Science of Membranesfor Gas and Vapor Separation, Wiley, New York, 2006.
[3] R.H. Doremus, Diffusion of Reactive Molecules in Solids and Melts, Wiley, NewYork, 2002.
[4] C.P. Flynn, Point Defects and Diffusion, Clarendon Press, Oxford, 1972.[5] J.E. Shelby, Handbook of Gas Diffusion in Solids and Melts, ASM International,
Materials Park, OH, 1996.[6] P. Shewmon, Diffusion in Solids, The Minerals, Metals & Materials Society (TMS),
Warrendale, PA, 1989.[7] P. Molyneux, “Transition-site” model for the permeation of gases and vapors
through compact films of polymers, J. Appl. Polym. Sci. 79 (2001) 981–1024.[8] R.M. Barrer, Activated diffusion in membranes, Trans. Faraday Soc. 35 (1939)
644–656.[9] R.M. Barrer, Porous crystal membranes, J. Chem. Soc., Faraday Trans. 86 (1990)
1123–1130.10] H.L. Frisch, C.E. Rogers, Quantum isotope effect in permeation, J. Chem. Phys.
40 (1964) 2293–2298.[11] A. Singh, W.J. Koros, Significance of entropic selectivity for advanced gas sepa-
ration membranes, Ind. Eng. Chem. Res. 35 (1996) 1231–1234.12] A.J. Burggraaf, Single gas permeation of thin zeolite (MFI) membranes: theory
and analysis of experimental observations, J. Membr. Sci. 155 (1999) 45–65.13] J. Gilron, A. Soffer, Knudsen diffusion in microporous carbon membranes with
molecular sieving character, J. Membr. Sci. 209 (2002) 339–352.[14] P. Bahukudumbi, D.M. Ford, Molecular modeling study of the permeability-
selectivity trade-off in polymeric and microporous membranes, Ind. Eng. Chem.Res. 45 (2006) 5640–5648.
15] V. Stannett, J.L. Williams, The permeability of poly(ethyl methacrylate) to gasesand water vapor, J. Polym. Sci. C3 (1965) 45–59.
[16] B. Wilks, M.E. Rezac, Properties of rubbery polymers for the recovery of hydro-gen sulfide from gasification gases, J. Appl. Polym. Sci. 85 (2002) 2436–2444.
[17] (a) R. Kirchheim, Partial molar volume of small molecules in glassy polymers,J. Polym. Sci. Part B: Polym. Phys. 31 (1993) 1373–1382;(b) R. Kirchheim, Solubility of gases in vitreous silica described by a distributionof dissolution energies, J. Am. Ceram. Soc. 84 (2001) 2699–2701.

bran
[
[
[
[
[
[
[[
[
[
[
[
[
[
[
[
[
[
[
[
[
[
[
[
[
[
[
[
[
[(6–12) potential, in: Molecular Theory of Gases and Liquids, Wiley, New York,
56 P. Molyneux / Journal of Mem
[18] J. Rundgren, Q. Dong, G. Hultquist, Concentration-dependent diffusion ofhydrogen in vitreous silica, J. Appl. Phys. 100 (2006) 104902-1–104902-5.
[19] D.W. McCall, D.C. Douglass, L.L. Blyler, G.E. Johnson, L.W. Jelinski, H.E. Blair,Solubility and diffusion of water in low-density polyethylene, Macromolecules17 (1984) 1644–1649.
20] O.L. Anderson, D.A. Stuart, Calculation of activation energy of ionic conductivityin silica glasses by classical methods, J. Am. Ceram. Soc. 37 (1954) 573–580.
[21] D.K. McElfresh, D.G. Howitt, Activation enthalpy for diffusion in glass, J. Am.Ceram. Soc. 69 (1986) C-237–C-238.
22] S.L. Chan, S.R. Elliott, Interstices, diffusion doorways and free volume percola-tion studies of a dense random packed atomic structure, J. Non-Cryst. Solids124 (1990) 23–33.
23] D.K. McElfresh, D.G. Howitt, A structure based model for diffusion in glass andthe determination of diffusion constants in silica, J. Non-Cryst. Solids 124 (1990)174–180.
24] S.L. Chan, S.R. Elliott, Theoretical study of the interstice statistics of the oxygensublattice in vitreous SiO2, Phys. Rev. B 43 (1991) 4423–4432.
25] S.L. Chan, S.R. Elliott, Calculation of diffusion activation energies in cova-lent solids: application to vitreous silica, J. Phys. Condens. Matter 3 (1991)1269–1280.
26] P.W. Atkins, Activated complex theory, in: Physical Chemistry, Oxford Univer-sity Press, 1978, pp. 906–916.
27] P.C. Jordan, Ion permeation and kinetics, J. Gen. Physiol. 114 (1999) 601–604.28] V.L. Schramm, Enzymatic transition states and enzyme transition state analog
design, Annu. Rev. Biochem. 67 (1998) 693–720.29] A.A. Gray-Wheale, R.H. Henchman, R.G. Gilbert, M.L. Greenfield, D.N.
Theodorou, Transition-state theory model for the diffusion coefficients of smallpenetrants in glassy polymers, Macromolecules 30 (1997) 7296–7306.
30] S. Pauly, Permeability and diffusion data, in: E.H. Brandrup, E.H. Immergut(Eds.), Polymer Handbook, Wiley, New York, 1999, pp. VI/543–VI/569.
[31] P. Molyneux, unpublished work.32] S.G. Kazarian, M.F. Vincent, F.V. Bright, C.L. Liotta, C.A. Eckert, Specific inter-
molecular interactions of carbon dioxide with polymers, J. Am. Chem. Soc. 118
(1996) 1729–1736.33] S.P. Nalawade, F. Picchioni, J.H. Marsman, D.W. Grijpma, J. Feijen, L.P.B.M.Janssen, Intermolecular interactions between carbon dioxide and the carbonylgroups of polylactides and poly(�-caprolcatone), J. Control. Release 116 (2006)e38–e40.
34] R.S.A. de Lange, K. Keizer, A.J. Burggraaf, Analysis and theory of gas transportin microporous sol–gel derived ceramic membranes, J. Membr. Sci. 104 (1995)81–100.
35] R.H. Doremus, Various types of fused silica, in: Diffusion of Reactive Moleculesin Solids and Melts, Wiley, New York, 2002, p. 75.
36] J.J. Hammel, W.J. Robertson, W.P. Marshall, H.W. Barch, B. Daas, M.A. Smoot, R.P.Beaver/PPG Industries, Inc., Process of gas enrichment with porous siliceous-containing material, U.S. Patent 4,842,620 (June 27, 1989).
37] J.J. Hammel/PPG Industries, Inc., Porous inorganic siliceous-containing gasenriching material and process of manufacture and use, U.S. Patent 4,853,001(August 1, 1989).
38] J.D. Way, D.L. Roberts, Hollow fiber inorganic membranes for gas separations,Sep. Sci. Technol. 27 (1992) 29–41.
39] J.D. Way, A mechanistic study of molecular sieving inorganic membranes forgas separations, Final Report submitted to U.S. Department of Energy undercontract DE-FG06-92-ER14290, Colorado School of Mines, Golden, CO, 1993,www.osti.gov/bridge/servlets/purl/10118702-ZAx4Au/native/1011872.pdf.
40] M.H. Hassan, J.D. Way, P.M. Thoen, A.C. Dillon, Single component and mixed gastransport in silica hollow fiber membrane, J. Membr. Sci. 104 (1995) 27–42.
[41] A.B. Shelekhin, A.G. Dixon, Y.H. Ma, Adsorption, permeation, and diffusion ofgases in microporous membranes. Part II. Permeation of gases in microporousgas membranes, J. Membr. Sci. 75 (1992) 233–244.
[
[
[
[
[
[[
[
[
[[[
e Science 320 (2008) 42–56
42] A.B. Shelekhin, A.G. Dixon, Y.H. Ma, Theory of gas diffusion and permeation ininorganic molecular-sieve membranes, AIChE J. 41 (1995) 58–67.
43] R.M. de Vos, H. Verweij, Improved performance of silica membranes for gasseparation, J. Membr. Sci. 143 (1998) 37–51.
44] R.M. de Vos, H. Verweij, High-selectivity, high-flux silica membranes for gasseparation, Science 279 (1998) 1710–1711.
45] M.C. Duke, J.C. Diniz da Costa, G.Q. Lu, P.G. Gray, Modeling hydrogen separa-tion in high temperature silica membranes systems, AIChE J. 52 (2006) 1729–1735.
46] J.M.D. MacElroy, S.P. Friedman, N.A. Seaton, On the origin of transportresistances within carbon molecular sieves, Chem. Eng. Sci. 54 (1999)1015–1027.
[47] T.A. Peters, J. Fontalvo, M.A.G. Vorstman, N.E. Benes, R.A. van Dam, Z.A.E.P.Vroon, E.L.J. van Soest-Vercammen, J.T.F. Keurentjes, Hollow fibre microporoussilica membranes for gas separation and pervaporation: synthesis, perfor-mance and stability, J. Membr. Sci. 248 (2005) 73–80.
48] J.H. Hildebrand, R.L. Scott, Intermolecular forces, in: The Solubility of Nonelec-trolytes, Dover, New York, 1964, pp. 48–61.
49] R.D. Johnson III (Ed.), NIST Computational Chemistry Comparison and Bench-mark Database [CCCBDB], NIST Standard Reference Database Number 101,Release August 12, 2005, http://srdata.nist.gov/cccbdb.
50] Standard thermodynamic properties of chemical substances, in: D.R. Lide, H.P.R.Frederickse (Eds.), CRC Handbook of Chemistry and Physics, CRC Press, BocaRaton, FL, 1996–1997, pp. 5-4–5-60.
[51] R.C. Reid, J.M. Prausnitz, B.E. Poling, Property data bank, in: The Properties ofGases and Liquids, McGraw-Hill, New York, 1986, pp. 656–732.
52] D.W. Breck, The molecular sieve effect, in: Zeolite Molecular Sieves: Structure,Chemistry, and Use, Wiley, New York, 1974, pp. 633–637.
53] S.V. Churakov, M. Gottschalk, Perturbation theory based equation of state forpolar molecular fluids. Part I. Pure fluids, Geochim. Cosmochim. Acta 67 (2003)2397–2414.
54] J.O. Hirschfelder, C.F. Curtiss, R.B. Bird, Force constants for the Lennard–Jones
1954, pp. 1110–1113.55] F.M. Mourits, F.H.A. Rummens, A critical evaluation of Lennard–Jones and Stock-
mayer potential parameters and some correlation methods, Can. J. Chem. 55(1977) 3007–3020.
56] R.A. Svehla, Estimated Viscosities and Thermal Conductivities of Gases at HighTemperatures, Technical Report R-132, National Aeronautics and Space Admin-istration, Washington, DC, 1962.
57] J.E. Shelby, Permeation and diffusion in inorganic glasses, in: Handbook of GasDiffusion in Solids and Melts, ASM International, Materials Park, OH, 1996, pp.15–53.
58] W.G. Perkins, D.R. Begeal, Diffusion and permeation of He, Ne, Ar, Kr, and D2
through silicon oxide thin films, J. Chem. Phys. 54 (1971) 1683–1694.59] F.J. Norton, Permeation of gaseous oxygen through vitreous silica, Nature 191
(1961) 701.60] L. Pauling, The nature of silicon–oxygen bonds, Am. Miner. 65 (1980) 321–323.61] R.F. Stewart, M.A. Whitehead, G. Donnay, The ionicity of the Si–O bond in low-
quartz, Am. Miner. 65 (1980) 324–326.62] J.G. Harris, K.H. Yung, Carbon dioxide’s liquid–vapor coexistence curve and crit-
ical properties as predicted by a simple molecular model, J. Phys. Chem. 99(1995) 12021–12024.
63] P. Molyneux, The dimensions of logarithmic quantities, J. Chem. Educ. 68 (1991)467–469.
64] P.W. Atkins, Physical Chemistry, Oxford University Press, 1978.65] G. Aylward, T. Findlay, SI Chemical Data, Wiley, Brisbane, 1998.66] van der Waals constants for gases, in: D.R. Lide, H.P.R. Frederickse (Eds.), CRC
Handbook of Chemistry and Physics, CRC Press, Boca Raton, FL, 1996–1997, pp.6-47–6-51.
Copyright © 2022 FDOKUMEN