Permeation, diffusion, and solution of cyclopropane in silicone rubber
Upload
khangminh22Category
view
2download
0
Skin Permeation Enhancement in Aqueous Solution: Correlation With Equilibrium Enhancer Concentration and Octanol/Water Partition Coefficient
S. Kevin Li1,∗, Correspondence information about the author S. Kevin Li Email the author S. Kevin Li
,
Doungdaw Chantasart2
PlumX Metrics
DOI: https://doi.org/10.1016/j.xphs.2018.08.014
|
Article Info
• Abstract
• Full Text
• Images
• References
• Supplemental Materials
Article Outline
I. Introduction II. Experimental
A. Model and Equation B. Data Collection and Analysis
III. Results and Discussion A. Correlations Between Enhancement Factor and Enhancer Concentration B. Correlations Between Enhancement Factor and Enhancer Concentration With Koct C. Enhancement Factor, Enhancer Concentration, and Koct for Each Enhancer Class D. Comparison Between HMS and HEM Enhancement Factors and Data Regression Analyses E. Enhancer Concentration and Koct to Predict Skin Permeation Enhancement F. Considerations for Using Enhancer Concentration and Koct as Predictors of Skin Permeation
Enhancement IV. Conclusion V. Supplementary Data VI. References
Jump to Section

Abstract
The effectiveness of skin penetration enhancers and the enhancer concentration required for effective
skin permeation enhancement are difficult to predict. A comprehensive quantitative structure-
enhancement relationship of chemical penetration enhancers for skin permeation is not currently
available. The present study (a) investigated the relationship between skin permeation enhancement and
chemical enhancer concentration and (b) examined a simple quantitative structure-enhancement
relationship for predicting skin permeation enhancement to guide enhancer formulation development. In
the present analysis, data from previous skin permeation studies that used the symmetric/equilibrium
configuration and skin parallel pathway model were summarized to determine the relationship between
enhancement factor and enhancer concentration. Under the equilibrium conditions, semilogarithmic linear
relationships between enhancement factor (E) and enhancer aqueous concentration (C) were observed
and an enhancer potency parameter (α) was defined. A correlation between the potency parameter α and
enhancer octanol/water partition coefficient (Koct) was obtained. The enhancement factor relationship
was derived: Log E = 0.32 ∙ C ∙ Koct. The results suggest that a “threshold” of (C ∙ Koct) > 0.5 M is
required to induce effective skin permeation enhancement under these conditions. Consistent with the
analyses in previous studies, the data suggest that octanol represents the skin barrier microenvironment
for the penetration enhancers.
Keywords:
skin, permeability, transdermal, transport, chemical enhancer, flux enhancement, structure-activity
relationship, quantitative structure-enhancement relationship (QSER)
Jump to Section
Introduction
Chemical penetration enhancers for topical and transdermal drug delivery have been studied extensively
in the past several decades.1, 2, 3 Typical enhancer studies, particularly in the pharmaceutical industry,
have been skin permeation screening to match potential enhancers with drug candidates in transdermal
or dermatological formulations. In these studies, the enhancers were evaluated when the test enhancer
solutions with the drug were applied on the stratum corneum (SC) whereas the dermis side was in
contact with the receiver solution that was usually buffered saline. Although this experimental approach is
adequate in assessing the effects of skin penetration enhancers on the delivery of a particular drug and
mimics the practical situation of skin delivery in practice, some aspects of enhancer mechanisms could
not be systematically evaluated. Previous studies on the quantitative structure-enhancement relationship
(QSER) of chemical enhancers have improved our knowledge in the field of skin penetration
enhancers,3, 4, 5 but the effects of these chemicals are still not easy to predict. Among these studies, a
systematic approach was to investigate the mechanisms of action of skin penetration enhancers (a) under

symmetric and equilibrium conditions (i.e., same enhancer conditions in the donor and receiver chambers
in equilibrium with the SC), (b) with corrections for the changes in the chemical potential (activity) of the
permeant in the enhancer solution with respect to that in the buffer solution (the control) to assess the
effects of permeant activity alteration upon skin permeation in the presence of the enhancers, and (c) with
model analyses to delineate the effects of permeation enhancement on transport across the lipoidal and
pore transport pathways and only the lipoidal pathway was assessed.6, 7
In this systematic and mechanistic approach,6, 7 different from the asymmetric enhancer configuration (the
test enhancer solution on the SC side and buffered saline on the dermis side), the symmetric and
equilibrium conditions avoid the complex situation of an enhancer concentration gradient across the skin,
in which the local permeation enhancement varies with the position within the membrane that makes
mechanistic analyses of the data difficult. The correction of the changes in thermodynamic activities of the
permeant in the enhancer solution with respect to that in the buffer solution (the control) when the
thermodynamic activity of the permeant is altered in the presence of the enhancers allows direct
comparison of flux enhancement at the same permeant thermodynamic activity. The parallel pathway
model of lipoidal and pore transport pathways provides the framework to delineate the effects of the
chemical enhancers on these 2 distinct pathways for understanding the mechanisms of the enhancers,
particularly, the mechanism of action of chemical enhancers on the lipoidal pathway of the SC in skin
permeation. With these strategies, the permeability enhancement factor, the ratio of the permeant flux
with the enhancer solution to that of the control (without the enhancer), was calculated, and the enhancer
concentrations to induce 10× flux enhancement at the same permeant thermodynamic activity (E = 10
concentrations) were determined. These enhancer concentrations were then compared to establish
QSER of the chemical penetration enhancers. The results in these previous studies showed that the
concentrations of the enhancers to induce 10× enhancement were related to the lipophilicities of the
enhancers and the intrinsic potencies of these enhancers were relatively similar. However, enhancer
concentrations other than E = 10 (and E = 4 in some cases) have not been analyzed.
Another method to evaluate skin penetration enhancers under the skin-enhancer equilibrium condition,
particularly for highly lipophilic enhancers, was the direct equilibration of the skin with the liquid enhancers
(or enhancers dissolved in an organic solvent) and subsequent skin transport experiments with buffered
saline as donor and receiver solutions in the diffusion cells.8, 9 This approach was based on the
assumption that the depletion of the enhancers from the skin to the aqueous solution in the diffusion cell
chambers was minimal, and essentially constant enhancer concentration could be maintained in the SC
due to the high lipophilicity of the enhancers. The direct equilibration approach provided the condition that
the enhancers in the SC were always at saturation with the solution in the diffusion cell chamber.
Otherwise, due to the low aqueous solubilities and extensive depletion of highly lipophilic enhancers in
the aqueous phase in the diffusion chamber, the equilibrium condition would be difficult to achieve. Or, an
aqueous reservoir system (e.g., micelles or cyclodextrins) for the enhancers in the diffusion cell would be
required, and the assessment of the interactions between the reservoir system and skin would be
needed.10, 11 Employing the direct equilibration enhancer approach, a series of studies were completed to
investigate QSER of highly lipophilic chemical enhancers and determine the maximum enhancement
effects of the enhancers when the SC was saturated with the enhancers (i.e., at enhancer solubility in the
SC lipids and the thermodynamic activity equivalent to the enhancer pure state).8, 9
The present study collected data from the previous skin permeation studies of penetration enhancers that
used the symmetric/equilibrium configuration and skin parallel pathway model and then analyzed the data
to derive a relationship between skin permeation enhancement factor and enhancer concentration. The
objectives were to (a) investigate the relationship between skin permeation enhancement and chemical
enhancer concentration for QSER and (b) examine a QSER of enhancer concentration and octanol/water
partition coefficient to predict skin permeation enhancement. An important goal was to provide guidance
to semiquantitatively predict permeation enhancement of the SC lipoidal pathway under the influence of
the chemical enhancers using enhancer concentrations and the general physiochemical properties of the
enhancers such as Koct. The “threshold” enhancer concentration required to induce permeation
enhancement was also investigated.
Jump to Section
Experimental Jump to Section
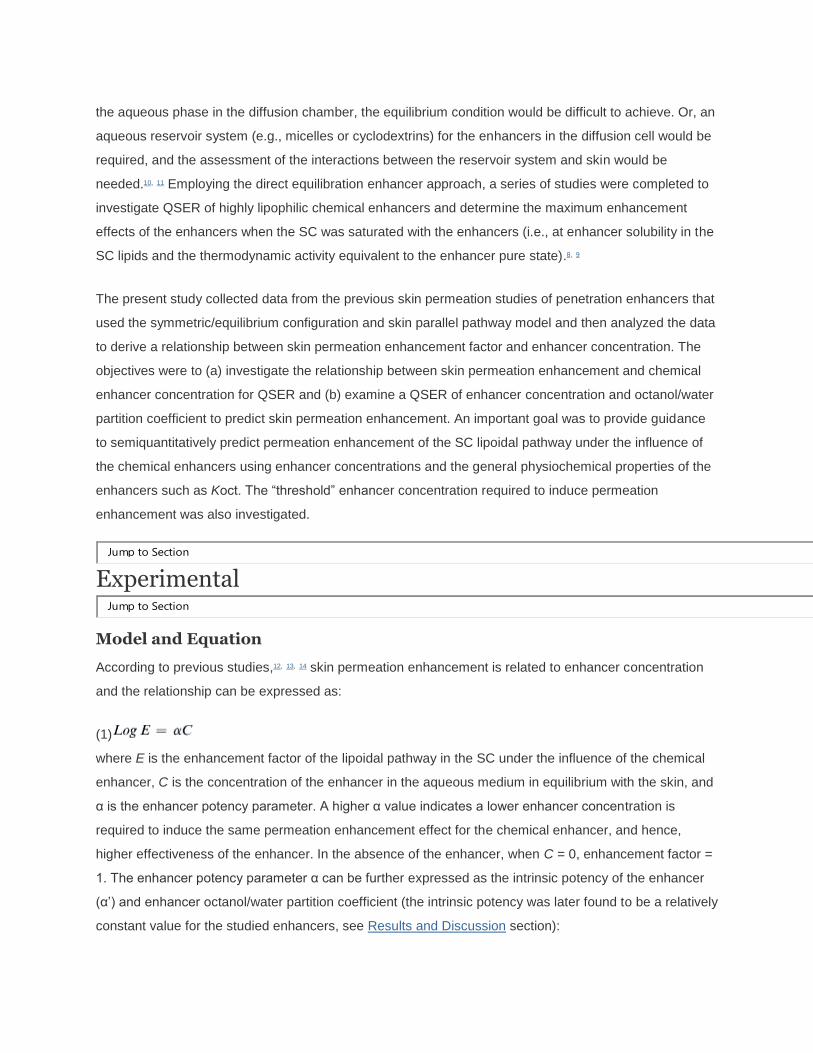
Model and Equation
According to previous studies,12, 13, 14 skin permeation enhancement is related to enhancer concentration
and the relationship can be expressed as:
(1)
where E is the enhancement factor of the lipoidal pathway in the SC under the influence of the chemical
enhancer, C is the concentration of the enhancer in the aqueous medium in equilibrium with the skin, and
α is the enhancer potency parameter. A higher α value indicates a lower enhancer concentration is
required to induce the same permeation enhancement effect for the chemical enhancer, and hence,
higher effectiveness of the enhancer. In the absence of the enhancer, when C = 0, enhancement factor =
1. The enhancer potency parameter α can be further expressed as the intrinsic potency of the enhancer
(α’) and enhancer octanol/water partition coefficient (the intrinsic potency was later found to be a relatively
constant value for the studied enhancers, see Results and Discussion section):

(2)
where Koct is the octanol/water partition coefficient of the enhancer and n is the coefficient of the linear
free energy relationship between the SC lipid microenvironment and octanol, similar to the relationships
commonly used for isotropic solvents.15 The coefficient accounts for the difference between the polarities
of the environment in octanol and SC lipid microenvironment for the partitioning of the enhancer. To
assess the effect of enhancer lipophilicity on its potency, parameters n and α’ were obtained using:
(3)
As solute partitioning into lipid bilayer is also related to bilayer free volume and solute molecular
size,16enhancer molecular weight (MW) can affect its partitioning into SC lipid lamella. Including the effect
of MW on enhancer partitioning into SC lipid microenvironment, the effect of MW can be described as
follows:
(4)
where β is the coefficient for MW and γ is constant.
Jump to Section
Data Collection and Analysis
Enhancement factor data were collected from previous studies of chemical penetration enhancers that
used the symmetric/equilibrium configuration and skin parallel pathway model. Only data meeting these
experimental criteria were used. These penetration enhancers have logarithm of octanol/water partition
coefficient (Log Koct) ranging from −1 to 5 and MW from 46 to 320 Da. Data of short-chain alkanols were
obtained from skin permeation studies of hydrocortisone, β-estradiol, and estrone across hairless mouse
skin (HMS) by Ghanem et al. and Kim et al.12, 13 Data of pyrrolidones were obtained from Yoneto
et al.17 using corticosterone and HMS in a similar experimental setting. Data of alkanols of medium-chain
lengths and with cis- and trans-double bonds were from Chantasart et al. and He et al.18, 19 Data of
amides, diols, dioxolanes, glucosides, monoglycerides, and piperidinones were obtained from Warner
et al.14, 20 and data of azones were from He et al.19, 21 Data of branched chain alkanols were from Kim et al.
and Chantasart et al.13, 18 Data of alkanols, octyl-pyrrolidone, and terpenes from studies using human
epidermal membrane (HEM) were obtained from Chantasart et al.22, 23 Enhancement factor data of
lipophilic enhancers and fatty acids were from previous studies with direct equilibration of skin and
enhancers to saturate the skin with the enhancers. These single-point concentration data at saturation in
HEM were obtained from Ibrahim and Li.8, 24
The data were analyzed for the relationship between enhancement factor and enhancer concentration.
For each enhancer, the logarithms of the enhancement factors (for the lipoidal transport pathway after
corrections for the activity coefficients) were plotted against the aqueous enhancer concentrations. Linear
regression analyses and statistics were performed using Microsoft Excel (Redmond, WA) on the
enhancement factor versus concentration relationships (Eq. 1) by setting y-intercept = 0. The linear least
squares slopes (the enhancer potency parameter α) and R2 of the regression analyses are presented. All
α values were used in the analyses of the present study regardless of the R2 values. To compare the
data, plots of the logarithms of the enhancement factors versus concentrations of the enhancers with and
without adjustment using Koct are presented.
Jump to Section
Results and Discussion Jump to Section
Correlations Between Enhancement Factor and Enhancer Concentration
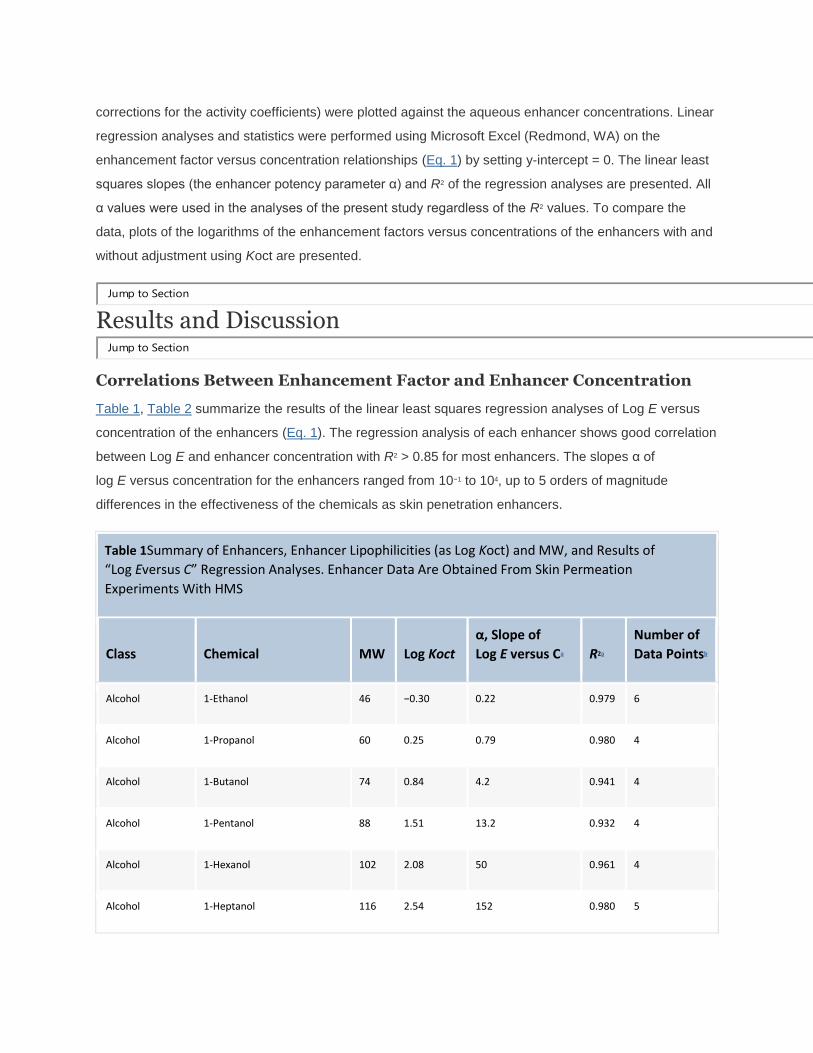
Table 1, Table 2 summarize the results of the linear least squares regression analyses of Log E versus
concentration of the enhancers (Eq. 1). The regression analysis of each enhancer shows good correlation
between Log E and enhancer concentration with R2 > 0.85 for most enhancers. The slopes α of
log E versus concentration for the enhancers ranged from 10−1 to 104, up to 5 orders of magnitude
differences in the effectiveness of the chemicals as skin penetration enhancers.
Table 1Summary of Enhancers, Enhancer Lipophilicities (as Log Koct) and MW, and Results of
“Log Eversus C” Regression Analyses. Enhancer Data Are Obtained From Skin Permeation
Experiments With HMS
Class Chemical MW Log Koct
α, Slope of
Log E versus Ca R2a
Number of
Data Pointsb
Alcohol 1-Ethanol 46 −0.30 0.22 0.979 6
Alcohol 1-Propanol 60 0.25 0.79 0.980 4
Alcohol 1-Butanol 74 0.84 4.2 0.941 4
Alcohol 1-Pentanol 88 1.51 13.2 0.932 4
Alcohol 1-Hexanol 102 2.08 50 0.961 4
Alcohol 1-Heptanol 116 2.54 152 0.980 5

Alcohol 1-Octanol 130 3.13 612 0.974 4
Alcohol 1-Nonanol 144 3.52 1935 0.968 4
Alcohol Isopropanol 60 0.05 0.51 0.990 5
Alcohol 2-Hexanol 102 1.83 22.3 0.945 5
Alcohol 2-Heptanol 116 2.43 69 0.959 5
Alcohol 2-Octanol 130 3.03 259 0.735 4
Alcohol 2-Nonanol 144 3.48 1102 0.250 4
Alcohol 3-Hexanol 102 1.81 18.2 0.980 4
Alcohol 3-Heptanol 116 2.42 58 0.921 4
Alcohol 3-Octanol 130 2.94 200 0.950 3
Alcohol 3-Nonanol 144 3.47 711 0.862 4
Alcohol 4-Heptanol 116 2.32 55 0.942 4
Alcohol 4-Octanol 130 2.88 188 0.985 4
Alcohol 4-Nonanol 144 3.46 585 0.939 4
Alcohol 5-Nonanol 144 3.42 524 0.964 5
Aromatic ring:
alcohol
2-Phenylethanol 122 1.57 16.4 0.989 4
Alcohol cis-3-Penten-1-ol 86 1.08 4.6 0.892 3
Alcohol cis-3-Hexen-1-ol 100 1.63 17.6 0.965 4
Alcohol cis-3-Octen-1-ol 128 2.71 193 0.994 3
Alcohol cis-3-Nonen-1-ol 142 3.25 555 0.999 3

Alcohol trans-3-Hexen-1-ol 100 1.76 19.0 0.847 4
Amide/Alcohol trans-Hydroxyproline-N-
decanamide-C-ethylamide
131 2.86 222 0.894 3
Amide N,N-Dimethylhexanamide 143 1.36 11.9 0.944 5
Amide N,N-Dimethylheptanamide 157 1.89 36 0.902 5
Amide N,N-Dimethyloctanamide 171 2.59 144 0.991 5
Amide N,N-Dimethylnonanamide 185 3.00 596 0.978 5
Azone 1-Butyl-2-azacycloheptanone 169 1.80 35 0.912 3
Azone 1-Hexyl-2-azacycloheptanone 197 2.91 230 0.853 4
Azone 1-Octyl-2-azacycloheptanone 225 4.04 2315 0.998 4
Diol 1,2-Hexanediol 118 0.78 5.0 0.978 4
Diol 1,2-Octanediol 146 2.08 54 0.954 5
Diol 1-2-Decanediol 174 3.23 770 0.970 5
Dioxolane 2-(1-Butyl)-2-methyl-1,3
dioxolane
144 2.07 78 0.756 3
Dioxolane 2-(1-Hexyl)-2-methyl-1,3
dioxolane
172 3.51 794 0.118 3
Glucoside 1-Octyl-β-D-glucopyranoside 292 1.94 61 0.622 3
Glucoside 1-Decyl-β-D-glucopyranoside 320 3.14 655 0.953 5
Monoglyceride 1,2-Dihydroxypropyl
octanoate
218 2.6 165 0.958 4
Monoglyceride 1,2-Dihydroxypropyl
decanoate
246 3.4 1482 0.709 4

Piperidinone 1-Butyl-2-piperidinone 155 1.39 11.7 0.761 4
Piperidinone 1-Hexyl-2-piperidinone 183 2.3 135 0.910 4
Piperidinone 1-Octyl-2-piperidinone 211 3.41 929 0.918 5
Pyrrolidone 1-Ethyl-2-pyrrolidone 113 −0.04 0.38 0.956 4
Pyrrolidone 1-Butyl-2-pyrrolidone 141 1.02 2.7 0.993 4
Pyrrolidone 1-Hexyl-2-pyrrolidinone 169 2.1 37 0.981 4
Pyrrolidone 1-Octyl-2-pyrrolidinone 197 3.05 517 0.989 5
View Table in HTML
aLinear regression slopes and R2 (forcing y-intercept = 0).
bNumber of concentration data points in the linear regression analysis.
Table 2Summary of Enhancers, Enhancer Lipophilicities (as Log Koct) and MW, and Results of
“Log Eversus C” Regression Analyses. Enhancer Data Are Obtained From Skin Permeation
Experiments With HEM
Class Chemical MW Log Koct
α, Slope of
Log Eversus Ca R2a
Number of
Data Pointsb
Alcohol 1-Hexanol 102 2.08 42 0.753 4
Alcohol 1-Heptanol 116 2.54 152 0.265 4
Alcohol 1-Octanol 130 3.13 512 0.966 3
Alcohol 4-Octanol 130 2.88 145 0.821 4
Aromatic ring: alcohol 2-Phenylethanol 122 1.57 17.4 0.916 4
Terpene Thymol 150 2.52 338 0.829 4
Terpene Menthol 156 3.38 372 0.696 3
Terpene Menthone 154 2.87 262 0.766 3

Terpene Carvacrol 150 2.52 355 0.591 4
Terpene Cineole 154 3.13 148 0.878 3
Pyrrolidone 1-Octyl-2-
pyrrolidinone
197 3.05 404 0.931 4
Aromatic ring: alcohol Benzyl alcohol 108 1.06 –c –c –c
Aromatic ring: alcohol 2-Phenoxyethanol 138 1.16 –c –c –c
Aromatic ring:
aminobenzoate
Padimate O 277 5.76 –c –c –c
Aromatic ring:
hydroxyanisole
Butylated
hydroxyanisole
180 3.14 –c –c –c
Aromatic ring:
salicylate
2-Ethylhexyl
salicylate
250 5.97 –c –c –c
Aromatic ring:
salicylate
Salicylaldehyde 122 2.0 –c –c –c
Ester Isopropyl myristate 270 7.3 –c –c –c
Fatty acid Decanoic acid 172 4.02 –c –c –c
Fatty acid Undecanoic acid 186 4.51 –c –c –c
Fatty acid Lauric acid 200 5.0 –c –c –c
Fatty acid Tridecanoic acid 214 5.49 –c –c –c
Fatty acid Myristic acid 228 5.98 –c –c –c
Fatty acid Pentadecanoic acid 242 6.47 –c –c –c
Fatty acid Palmitic acid 256 6.96 –c –c –c
Fatty acid Stearic acid 284 7.94 –c –c –c

Fatty acid Linoleic acid 280 7.51 –c –c –c
Fatty acid Oleic acid 282 7.64 –c –c –c
Fatty acid Ricinoleic acid 298 6.19 –c –c –c
Alcohol 1-Undecanol 172 4.2 –c –c –c
Alcohol Oleyl alcohol 268 7.0 –c –c –c
Azone Laurocapram 281 6.28 –c –c –c
View Table in HTML
aLinear regression slopes and R2 (forcing y-intercept = 0).
bNumber of concentration data points in the linear regression analysis.
cNot available. Only single-point concentration data at saturation in HEM are available.
Figure 1 shows the correlation between the potency parameters α and Log Koct values of the enhancers
(Eq. 3). The data suggest a strong correlation between the effectiveness of the enhancers (based on
potency parameter α) and the lipophilicities of the enhancers (indicated by their Log Koct), supporting the
relationship described in Equation 2. The regression of e2.15 is equivalent to 100.933 in the logarithmic scale.
The 100.933 value suggests that the n value in Equations 2 and 3 is close to unity. Despite that the HEM
data (triangle symbols in the plot) show larger variability compared to the HMS data, both sets of data
demonstrate similar trends and the significant impact of the lipophilicities of the enhancers on their
effectiveness to enhance skin permeation.
Figure 1
Correlation between the enhancer potency (slope α of Log E vs. C) and Log Koct. Each data point
represents an individual penetration enhancer. Note that e2.15 = 100.933 in the logarithmic scale.
View Large Image | View Hi-Res Image | Download PowerPoint Slide

The ability of a penetration enhancer partitioning and diffusing into the SC could affect the effectiveness
of the enhancer. In addition to enhancer lipophilicity, molecular charge and MW, which govern enhancer
partition and diffusion behaviors in lipids, could affect enhancer potency. The molecular shape and size of
an enhancer also affect its intercalation in the SC intercellular lipids and enhancer-induced lipid
fluidization. The majority of the penetration enhancers in Table 1, Table 2 are uncharged, so possible
effects of molecular charges on enhancer potency could not be systematically investigated in the present
study. For enhancer molecular size, the influence of MW on enhancer potency was examined using
regression analyses of Equation 4. No significant effect of MW on enhancer potency in addition to that of
Log Koct was found: n and R2 obtained using Equation 4 (n = 0.91, R2 = 0.970) are essentially the same
as those of Equation 3 (Fig. 1).
Jump to Section
Correlations Between Enhancement Factor and Enhancer Concentration With Koct
With the correlation between α and Log Koct for the enhancers in Figure 1, the concentrations of the
enhancers were multiplied by their respective Koct values to determine their equilibrium concentrations in
the lipid phase at the aqueous enhancer concentration conditions. Figure 2 illustrates the effect of
enhancer lipophilicity (based on their Koct) on skin permeation enhancement by comparing the
relationships of “Log E versus C” and “Log E versus C ∙ Koct.” The figure shows the large data scattering
of “Log E versus C” over the enhancer concentration range between 0.0002 and 5 M “collapses” to the
narrower range between 0.3 and 6 M when C ∙ Koct was used as the x-axis in the analysis. The data
suggest that the general condition of C ∙ Koct = 0.3 to 6 M is required to induce significant permeation
enhancement under the conditions of the enhancers studied. There is no significant difference between
the HEM and HMS data. The variability in the “Log E versus C ∙ Koct” relationships for the enhancers
could be attributed to the different intrinsic potencies of the enhancers.
Figure 2
Correlation between Log E and enhancer concentration C ∙ Koct (i.e., x-axis concentration = C ∙ Koct)
compared to the results without Koct (i.e., x-axis concentration = C). Each data point represents a
concentration condition of an enhancer.

View Large Image | View Hi-Res Image | Download PowerPoint Slide
Jump to Section
Enhancement Factor, Enhancer Concentration, and Koct for Each Enhancer Class
The “Log E versus C ∙ Koct” relationships were further examined based on their chemical classes and
structures. Figure 3 examines the relationships between Log E and C ∙ Koct of alkanols with short- to
medium-chain lengths. The 1-alkanol data show good predictivity of C ∙ Koct on permeation enhancement
with essentially the same intrinsic potencies (α′) for the alkanol homologous series. The data also suggest
an effect of alkyl chain branching (2-, 3-, and 4-alkanols) on permeation enhancement. Branching of the
alkyl chain leads to less effective enhancers compared to 1-alkanols. This observation is consistent with a
previous study using the E = 10 approach.18 Although 2-alkanols show a trend of lower Log E values
compared to 1-alkanols, most 2-alkanol data points still overlap with those of 1-alkanols. The data of 3-
alkanols, 4-alkanols, and 5-alkanols show a clear deviation from those of 1-alkanols, but there is no
noticeable difference between 3-alkanols, 4-alkanols, and 5-alkanols in the figure. The Log E values
of cis- and trans-alken-1-ols are not significantly different from those of 1-alkanols, which is consistent
with the results in a previous study using the E = 10 approach.19 The lack of the C=C double bond effect
of the enhancers on skin permeation enhancement could be due to the alkyl chain lengths (C5-C9)
examined and the C ∙ Koct strategy used in the present study.
Figure 3
Relationship between permeation enhancement and C ∙ Koct for alkanols and the effect of alkyl chain
branching (branched alkanols: 2-, 3-, 4-, and 5-alkanols) and C=C double bonds (cis- and trans-alken-1-
ols). Each data point represents a “C ∙ Koct” condition of an enhancer.
View Large Image | View Hi-Res Image | Download PowerPoint Slide
Figure 4 compares the relationships between permeation enhancement factor and enhancer
concentration (C ∙ Koct) for homologous series of enhancers of different polar head groups. The data
show larger uncertainties of using C ∙ Koct to predict the permeation enhancement effect for the
enhancers. The majority of the data points overlap with those of 1-alkanols. The diols show some data

scattering to the higher Log E values, and the pyrrolidones and azacycloheptanones show data scattering
to the lower Log E values relative to 1-alkanols. Most enhancers follow the permeation enhancement
relationship: Log E = 0.32 ∙ C ∙ Koct, that the condition of C ∙ Koct > 0.5 M is required for effective
permeation enhancement (e.g., E > 2).
Figure 4
Relationships between enhancement factor and C ∙ Koct for the studied penetration enhancers compared
with alkanol data. Each data point represents a “C ∙ Koct” condition of an enhancer.
View Large Image | View Hi-Res Image | Download PowerPoint Slide
Jump to Section
Comparison Between HMS and HEM Enhancement Factors and Data Regression Analyses
Figure 5 presents the relationships between enhancement factor and concentration (C ∙ Koct) for HEM
and HMS and all the enhancers studied. The results of previous skin permeation studies using the direct
equilibration method (liquid enhancers or enhancers in an organic solvent saturating the HEM SC for the
permeation experiments)8, 24 are also presented in the figure for comparison. The HEM data of alkyl chain
enhancers that have similar chemical structures to those in the HMS studies are consistent with those of
HMS. Larger deviations and variability were observed with the HEM data of ring-structure enhancers
(e.g., the terpenes and 2-phenylethanol) compared to the enhancers in the HMS studies. The data of
highly lipophilic enhancers from the direct equilibration studies with HEM (data of enhancers saturated in
HEM) are not substantially different from those of the less lipophilic enhancers in the HMS studies.
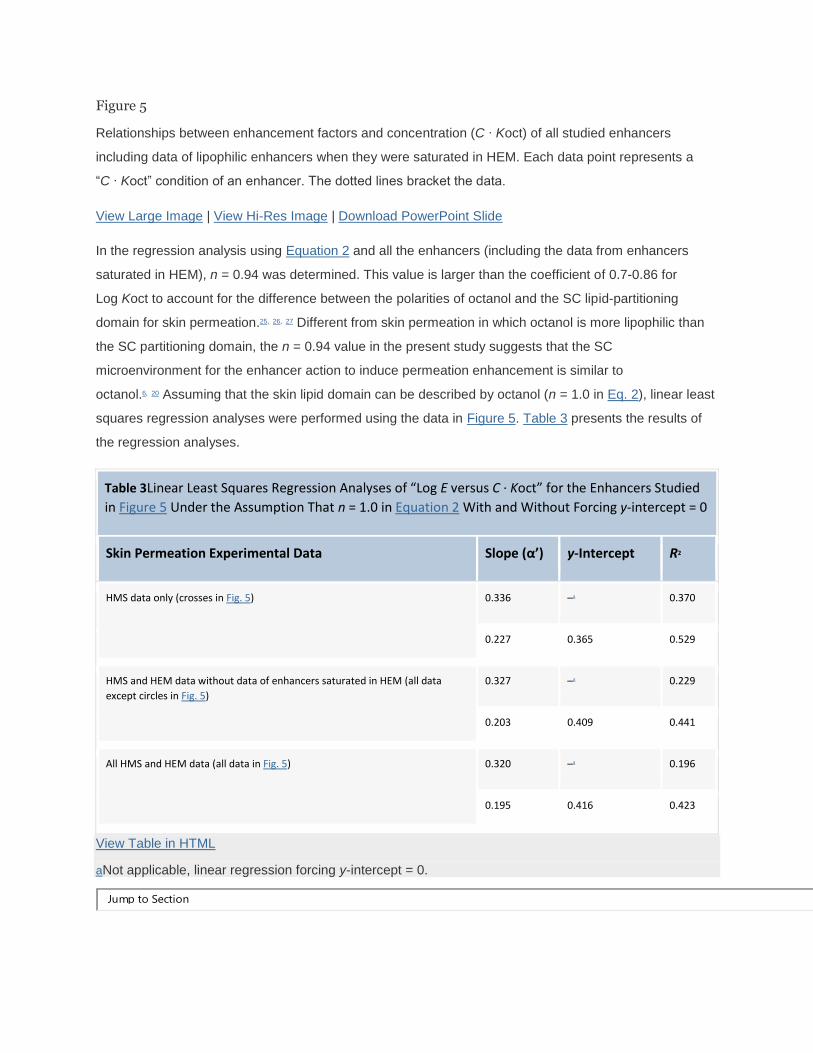
Figure 5
Relationships between enhancement factors and concentration (C ∙ Koct) of all studied enhancers
including data of lipophilic enhancers when they were saturated in HEM. Each data point represents a
“C ∙ Koct” condition of an enhancer. The dotted lines bracket the data.
View Large Image | View Hi-Res Image | Download PowerPoint Slide
In the regression analysis using Equation 2 and all the enhancers (including the data from enhancers
saturated in HEM), n = 0.94 was determined. This value is larger than the coefficient of 0.7-0.86 for
Log Koct to account for the difference between the polarities of octanol and the SC lipid-partitioning
domain for skin permeation.25, 26, 27 Different from skin permeation in which octanol is more lipophilic than
the SC partitioning domain, the n = 0.94 value in the present study suggests that the SC
microenvironment for the enhancer action to induce permeation enhancement is similar to
octanol.6, 20 Assuming that the skin lipid domain can be described by octanol (n = 1.0 in Eq. 2), linear least
squares regression analyses were performed using the data in Figure 5. Table 3 presents the results of
the regression analyses.
Table 3Linear Least Squares Regression Analyses of “Log E versus C ∙ Koct” for the Enhancers Studied
in Figure 5 Under the Assumption That n = 1.0 in Equation 2 With and Without Forcing y-intercept = 0
Skin Permeation Experimental Data Slope (α’) y-Intercept R2
HMS data only (crosses in Fig. 5) 0.336 –a 0.370
0.227 0.365 0.529
HMS and HEM data without data of enhancers saturated in HEM (all data
except circles in Fig. 5)
0.327 –a 0.229
0.203 0.409 0.441
All HMS and HEM data (all data in Fig. 5) 0.320 –a 0.196
0.195 0.416 0.423
View Table in HTML
aNot applicable, linear regression forcing y-intercept = 0.
Jump to Section
Enhancer Concentration and Koct to Predict Skin Permeation Enhancement
A main finding in the present study is the importance of Koct as a parameter to predict the effects of
penetration enhancers. Enhancer Koct (i.e., lipophilicity) can be used to assess enhancer potency. This is
consistent with the finding that enhancer effects are related to enhancer concentration in the SC
barrier,28 and hence enhancer partitioning into the SC lipids and enhancer lipophilicities. Particularly, a
correlation was found between the enhancer potency parameter α and enhancer Koct (Fig. 1). Using this
correlation, the potency of an enhancer for skin permeation enhancement under the conditions studied
can be predicted. The R2 value of the regression analysis in Figure 1 suggests satisfactory predictivity.
Under the conditions in the present study, skin permeation enhancement can also be predicted by the
thermodynamic activity of the enhancer in the formulation and its equilibrium activity in octanol
(i.e., C ∙ Koct). The values of C ∙ Koct were shown to correlate with skin permeation enhancement. The
higher the aqueous enhancer concentration in the chamber (or formulation) and the higher its lipophilicity,
the higher is the skin permeation enhancement. This correlation suggests that C ∙ Koct can be a predictor
of skin permeation enhancement. The significance of Koct suggests that octanol could mimic the
microenvironment for the enhancer action in the SC. According to Table 3, the equation derived from the
present analysis for skin permeation enhancement is Log E = 0.32 ∙ C ∙ Koct.
Specifically, the relationship of “Log E = 0.32 ∙ C ∙ Koct” suggests that the condition of C ∙ Koct > 0.5 M is
needed for an enhancer to induce adequate permeation enhancement. Although the concentration of 0.5
M in this analysis is empirical, mechanistic insights can be deduced from this value. Assuming that the
equilibrium C ∙ Koct concentration is representative of the enhancer concentration in the SC intercellular
lipids, the “threshold” value of 0.5 M (or 10% [w/w] for an enhancer with MW of 200 Da) implies that
relatively high enhancer concentration is needed in the SC to induce effective permeation enhancement
under the conditions studied. This value is not highly dependent on the chemical structures among the
enhancers examined in the present study (Fig. 5) as the data scatter of this “threshold” value (e.g., ∼0.5-3
M for E = 2) is within an order of magnitude from each other. This suggests that the differences in the
intrinsic potencies of the enhancers are generally small. There is also a general trend that the n-alkyl
chain enhancers are more effective than branched alkyl chain enhancers and some carbon ring-structure
enhancers (e.g., menthol and cineole). The disruption of SC lipid lamellar packing is a major mechanism
of skin penetration enhancers.28, 29, 30, 31 The enhancement effect is therefore related to the intercalation of
the enhancers in the SC lipid structure and the amounts of the enhancers embedded in the lipids.28 The n-
alkyl chain enhancers could be more disruptive to the structural order of the SC intercellular lipid lamella
compared to the branched alkyl and ring-structure enhancers when the enhancers partition and

intercalate in the lipids. It is also possible that the branched alkyl and ring-structure enhancers do not
partition into lipid lamella as well as the n-alkyl chain enhancers do.
Jump to Section
Considerations for Using Enhancer Concentration and Koct as Predictors of Skin Permeation Enhancement
Considerations should be given to the limitations of predicting permeation enhancement using the
“Log E versus C ∙ Koct” relationship. First, symmetric and equilibrium conditions were used in the skin
permeation experiments to determine the enhancement factors analyzed in the present study. In
transdermal delivery in practice, an asymmetric condition is normally encountered, in which the
enhancers are only applied to the skin in the donor chamber. The asymmetric condition would likely result
in a lower enhancement factor compared to that under the symmetric condition. The difference between
enhancer-induced skin permeation effects under the asymmetric and symmetric conditions was examined
previously.32 In this previous study, a correlation between the enhancement factors under the asymmetric
and symmetric conditions was observed, with ∼2-3× lower flux enhancement under the asymmetric
condition. The enhancement factor estimated using the “Log E versus C ∙ Koct” relationship in the present
study therefore could overestimate the permeation enhancement effect under the asymmetric enhancer
condition in practice.
Skin permeation after formulation application in practice is in transient state. Steady-state permeation
normally cannot be achieved due to the transport lag time, drug and enhancer depletion, and other
changing conditions in the topical and transdermal formulations. The present analysis used steady-state
permeation data. As skin permeation enhancement is related to the concentration of the enhancer in the
SC, drug permeation is affected by enhancer permeation kinetics (e.g., from the formulation to its site of
action in SC). The analysis did not take into account the diffusion of enhancers in the SC. The analysis
also did not consider the changes in enhancer concentration in the formulation due to possible enhancer
depletion when a finite dose of an enhancer is used. Enhancer depletion could be important for lipophilic
enhancers due to their high skin uptake.
The permeation enhancement factors predicted from the correlation in the present study could be limited
to permeants of certain physicochemical properties. The model permeants in the enhancer analysis were
moderately lipophilic with MW in the ∼270-360 Da range. Permeant molecular size (or MW) could affect
enhancer-induced permeation enhancement.33 For example, skin permeation enhancement was found to
be a function of permeant MW (see Supplementary Material).7 The same trend was observed in skin
permeability enhancement results from molecular dynamics simulations.28 Therefore, permeants of MW
different from the ∼270-360 Da range would likely deviate from the “Log E versus C ∙ Koct” relationship in

the present study. In addition to MW, permeant lipophilicity dictates the pathway for its skin permeation.
The SC intercellular lipids are the predominant pathway for the permeation of lipophilic permeants
whereas the pore pathway is the predominant permeation pathway for polar and ionic permeants. Skin
permeation enhancement of the pore pathway was not determined in the present analysis, and therefore,
the “Log E versus C ∙ Koct” relationship should not be applied to polar and ionic permeants.
Aqueous media were the donor and receptor solutions in the skin permeation studies in the present
analysis for the permeability-enhancing effects and baseline permeability values. The results are
therefore only appropriate for drug delivery systems that provide skin occlusion when the skin is fully
hydrated. In addition, the skin permeation studies did not include nonaqueous vehicles and cosolvents.
The “Log E versus C ∙ Koct” relationship is therefore expected to be for aqueous formulations. For skin
permeation of a nonaqueous formulation, the vehicle (or cosolvent) alters the thermodynamic activity of
the enhancer and hence affects the partitioning tendency of the enhancer from the vehicle into the SC. In
this case, the vehicle can result in lower concentration of the enhancer at its site of action in the SC.
The variability in the “Log E = 0.32 ∙ C ∙ Koct” relationship (Fig. 5 and Table 3) suggests errors up to an
order of magnitude in predicting permeation enhancement using this simple relationship. A number of
factors contribute to this variability, which could be minimized. The present analysis was based on both
experimental and calculated Koct values in the literature, so the uncertainties related to these literature
values contribute to the variability in Figure 5. For the direct equilibration experimental approach,8 both
experimental and calculated aqueous solubility values in the literature were used and the uncertainties
related to these literature values further contribute to the variability. Considering the simplicity of the
“Log E = 0.32 ∙ C ∙ Koct” relationship, which does not take into account possible differences between the
intrinsic potencies of the enhancers, the observed variability in the correlation is not surprising.
Nevertheless, this relationship provides guidance to the effects of chemical penetration enhancers in
formulation development.
Jump to Section
Conclusion
To address the question whether penetration enhancer effects can be predicted by enhancer
concentration and enhancer physicochemical properties, the present study investigated the relationships
between skin permeation enhancement and enhancer concentration for more than 40 chemical
penetration enhancers from previous skin permeation studies under symmetric/equilibrium conditions.
Good correlations were observed between the logarithms of enhancement factors and concentrations of
the enhancers studied. A correlation between the enhancer potency parameter α and enhancer Koct was
observed. This suggests that octanol represents the skin barrier microenvironment for the enhancers,

consistent with the results in previous studies. Whereas enhancer Koct was an effective predictor of
enhancer potency, no significant effect of enhancer MW on enhancer potency was observed. Data of
more than 15 penetration enhancers under the SC saturation condition were also investigated. Together
with the data obtained under the symmetric/equilibrium conditions, a simple QSER between
enhancement factor and enhancer concentration was derived: Log E = 0.32 ∙ C ∙ Koct, which could be
used to predict skin permeation enhancement. The “threshold” enhancer concentration for skin
permeation enhancement was determined: C ∙ Koct > 0.5 M. When using the “Log E versus C ∙ Koct”
relationship, consideration should be given to the effects of symmetric versus asymmetric enhancer
configurations, aqueous versus cosolvent media, steady state versus non-steady-state conditions, and
equilibrium enhancer condition versus diffusing and depleting enhancers. Limitations should also be
considered such as the uncertainties in the prediction (errors up to an order of magnitude) and that the
“Log E versus C ∙ Koct” relationship is limited to permeants using the SC lipoidal pathway for skin
permeation.
Acknowledgments
The authors thank Drs. Kevin S. Warner, Ning He, Kunio Yoneto, Abdel-Halim Ghanem, and Sarah A.
Ibrahim for their contributions to the skin penetration enhancer studies and Dr. William I. Higuchi for his
contribution and the conception of the idea in the original penetration enhancer project. The skin
penetration enhancer studies were supported in part by NIH Grants GM 043181 and GM 063559.
There is no personal, financial, or non-financial conflict of interest. The data presented in this paper can
be available upon request to the corresponding author.
Jump to Section
Supplementary Data
Supplemental Materials
Jump to Section
References 1. Asbill, C.S. and Michniak, B.B. Percutaneous penetration enhancers: local versus transdermal activity. Pharm
Sci Technolo Today. 2000; 3: 36–41
o View in Article
|
o Google Scholar
2. Williams, A.C. and Barry, B.W. Penetration enhancers. Adv Drug Deliv Rev. 2004; 56: 603–618
o View in Article

|
o Google Scholar
3. Karande, P., Jain, A., Ergun, K., Kispersky, V., and Mitragotri, S. Design principles of chemical penetration enhancers for transdermal drug delivery. Proc Natl Acad Sci U S A. 2005; 102: 4688–4693
o View in Article
|
o Google Scholar
4. Vavrova, K., Zbytovska, J., and Hrabalek, A. Amphiphilic transdermal permeation enhancers: structure-activity relationships. Curr Med Chem. 2005; 12: 2273–2291
o View in Article
|
o Google Scholar
5. Chantasart, D. and Li, S.K. Structure enhancement relationship of chemical penetration enhancers in drug transport across the stratum corneum. Pharmaceutics. 2012; 4: 71–92
o View in Article
|
o Google Scholar
6. Li, S.K. and Higuchi, W.I. Quantitative structure-enhancement relationship and the microenvironment of the enhancer site of action. in: N. Dragicevic, H.I. Maibach (Eds.) Percutaneous Penetration Enhancers Chemical Methods in Penetration Enhancement: Modification of the Stratum Corneum. Springer-Verlag, New York; 2015: 55–67
o View in Article
|
o Google Scholar
7. Li, S.K. and Higuchi, W.I. Mechanistic studies of permeation enhancers. in: N. Dragicevic, H.I. Maibach (Eds.) Percutaneous Penetration Enhancers Drug Penetration Into/Through the Skin: Methodology and General Considerations. Springer-Verlag, New York; 2017: 119–136
o View in Article
|
o Google Scholar
8. Ibrahim, S.A. and Li, S.K. Effects of chemical enhancers on human epidermal membrane: structure-enhancement relationship based on maximum enhancement (Emax). J Pharm Sci. 2009; 98: 926–944
o View in Article
|
o Google Scholar
9. Ibrahim, S.A. and Li, S.K. Effects of solvent deposited enhancers on transdermal permeation and their relationship with Emax. J Control Release. 2009; 136: 117–124
o View in Article

|
o Google Scholar
10. Shaker, D.S., Ghanem, A.H., Li, S.K., Warner, K.S., Hashem, F.M., and Higuchi, W.I. Mechanistic studies of the effect of hydroxypropyl-β-cyclodextrin on in vitro transdermal permeation of corticosterone through hairless mouse skin. Int J Pharm. 2003; 253: 1–11
o View in Article
|
o Google Scholar
11. Warner, K.S., Shaker, D.S., Molokhia, S. et al. Silicone elastomer uptake method for determination of free 1-alkyl-2-pyrrolidone concentration in micelle and hydroxypropyl-β-cyclodextrin systems used in skin transport studies. J Pharm Sci. 2008; 97: 368–380
o View in Article
|
o Google Scholar
12. Ghanem, A.H., Mahmoud, H., Higuchi, W.I., Liu, P., and Good, W.R. The effects of ethanol on the transport of lipophilic and polar permeants across hairless mouse skin: methods/validation of a novel approach. Int J Pharm. 1992; 78: 137–156
o View in Article
|
o Google Scholar
13. Kim, Y.H., Ghanem, A.H., Mahmoud, H., and Higuchi, W.I. Short chain alkanols as transport enhancers for lipophilic and polar/ionic permeants in hairless mouse skin: mechanism(s) of action.Int J Pharm. 1992; 80: 17–31
o View in Article
|
o Google Scholar
14. Warner, K.S., Li, S.K., and Higuchi, W.I. Influences of alkyl group chain length and polar head group on chemical skin permeation enhancement. J Pharm Sci. 2001; 90: 1143–1153
o View in Article
|
o Google Scholar
15. Leo, A., Hansch, C., and Elkins, D. Partition coefficients and their uses. Chem Rev. 1971; 71: 525–616
o View in Article
|
o Google Scholar
16. Xiang, T.X. and Anderson, B.D. The relationship between permeant size and permeability in lipid bilayer membranes. J Membr Biol. 1994; 140: 111–122
o View in Article

|
o Google Scholar
17. Yoneto, K., Ghanem, A.H., Higuchi, W.I., Peck, K.D., and Li, S.K. Mechanistic studies of the 1-alkyl-2-pyrrolidones as skin permeation enhancers. J Pharm Sci. 1995; 84: 312–317
o View in Article
|
o Google Scholar
18. Chantasart, D., Li, S.K., He, N., Warner, K.S., Prakongpan, S., and Higuchi, W.I. Mechanistic studies of branched-chain alkanols as skin permeation enhancers. J Pharm Sci. 2004; 93: 762–779
o View in Article
|
o Google Scholar
19. He, N., Warner, K.S., Chantasart, D., Shaker, D.S., Higuchi, W.I., and Li, S.K. Mechanistic study of chemical skin permeation enhancers with different polar and lipophilic functional groups. J Pharm Sci. 2004; 93: 1415–1430
o View in Article
|
o Google Scholar
20. Warner, K.S., Li, S.K., He, N. et al. Structure-activity relationship for chemical skin permeation enhancers: probing the chemical microenvironment of the site of action. J Pharm Sci. 2003; 92: 1305–1322
o View in Article
|
o Google Scholar
21. He, N., Li, S.K., Suhonen, T.M., Warner, K.S., and Higuchi, W.I. Mechanistic study of alkyl azacycloheptanones as skin permeation enhancers by permeation and partition experiments with hairless mouse skin. J Pharm Sci. 2003; 92: 297–310
o View in Article
|
o Google Scholar
22. Chantasart, D., Sa-Nguandeekul, P., Prakongpan, S., Li, S.K., and Higuchi, W.I. Comparison of the effects of chemical permeation enhancers on the lipoidal pathways of human epidermal membrane and hairless mouse skin and the mechanism of enhancer action. J Pharm Sci. 2007; 96: 2310–2326
o View in Article
|
o Google Scholar
23. Chantasart, D., Pongjanyakul, T., Higuchi, W.I., and Li, S.K. Effects of oxygen-containing terpenes as skin permeation enhancers on the lipoidal pathways of human epidermal membrane. J Pharm Sci. 2009; 98: 3617–3632
o View in Article
|
o Google Scholar
24. Ibrahim, S.A. and Li, S.K. Efficiency of fatty acids as chemical penetration enhancers: mechanisms and structure enhancement relationship. Pharm Res. 2010; 27: 115–125
o View in Article
|
o Google Scholar
25. Potts, R.O. and Guy, R.H. Predicting skin permeability. Pharm Res. 1992; 9: 663–669
o View in Article
|
o Google Scholar
26. Mitragotri, S. Modeling skin permeability to hydrophilic and hydrophobic solutes based on four permeation pathways. J Control Release. 2003; 86: 69–92
o View in Article
|
o Google Scholar
27. Nitsche, J.M., Wang, T.F., and Kasting, G.B. A two-phase analysis of solute partitioning into the stratum corneum. J Pharm Sci. 2006; 95: 649–666
o View in Article
|
o Google Scholar
28. Lundborg, M., Wennberg, C.L., Narangifard, A., Lindahl, E., and Norlen, L. Predicting drug permeability through skin using molecular dynamics simulation. J Control Release. 2018; 283: 269–279
o View in Article
|
o Google Scholar
29. Suhonen, M.T., Bouwstra, J.A., and Urtti, A. Chemical enhancement of percutaneous absorption in relation to stratum corneum structural alterations. J Control Release. 1999; 59: 149–161
o View in Article
|
o Google Scholar
30. Engelbrecht, T.N., Schroeter, A., Hauss, T., and Neubert, R.H. Lipophilic penetration enhancers and their impact to the bilayer structure of stratum corneum lipid model membranes: neutron diffraction studies based on the example oleic acid. Biochim Biophys Acta. 2011; 1808: 2798–2806
o View in Article
|

o Google Scholar
31. Anjos, J.L., Neto Dde, S., and Alonso, A. Effects of 1,8-cineole on the dynamics of lipids and proteins of stratum corneum. Int J Pharm. 2007; 345: 81–87
o View in Article
|
o Google Scholar
32. Chantasart, D. and Li, S.K. Relationship between the enhancement effects of chemical permeation enhancers on the lipoidal transport pathway across human skin under the symmetric and asymmetric conditions in vitro. Pharm Res. 2010; 27: 1825–1836
o View in Article
|
o Google Scholar
33. Mitragotri, S. Effect of bilayer disruption on transdermal transport of low-molecular-weight hydrophobic solutes. Pharm Res. 2001; 18: 1018–1023
o View in Article
|
o Google Scholar
Copyright © 2022 FDOKUMEN


