Effect of Esters on the Permeation of Chemicals with Different ...
EFFECT OF DIFFERENT ENHANCERS ON THE TRANSDERMALPERMEATION OF INSLUIN ANALOG
K. M. Yerramsetty, V. K. Rachakonda, B. J. Neely, S. V. Madihally, and K. A. M. Gasem*
School of Chemical Engineering, Oklahoma State University, Stillwater, OK 74078
AbstractUsing chemical penetration enhancers (CPEs), transdermal drug delivery (TDD) offers analternative route for insulin administration, wherein the CPEs reversibly reduce the barrierresistance of the skin. However, there is a lack of sufficient information concerning the effect ofCPE chemical structure on insulin permeation. To address this limitation, we examined the effectof CPE functional groups on the permeation of insulin. A virtual design algorithm thatincorporates quantitative structure-property relationship (QSPR) models for predicting the CPEproperties was used to identify 43 potential CPEs. This set of CPEs was prescreened using aresistance technique, and the 22 best CPEs were selected. Next, standard permeation experimentsin Franz cells were performed to quantify insulin permeation.
Our results indicate that specific functional groups are not directly responsible for enhancedinsulin permeation. Rather, permeation enhancement is produced by molecules that exhibitpositive log Kow values and possess at least one hydrogen donor or acceptor. Toluene was the onlyexception among the 22 potential CPEs considered. In addition, toxicity analyses of the 22 CPEswere performed. A total of eight CPEs were both highly enhancing (permeability coefficient atleast four times the control value) and non-toxic, five of which are new discoveries.
Keywordstransdermal; drug delivery; permeation enhancer; insulin
1. INTRODUCTIONNon-traditional methods for insulin delivery like insulin pumps, inhalers and pens aregaining importance due to their obvious advantages over traditional delivery methods [1].Another promising non-traditional alternative is the delivery of insulin through skin usingtransdermal patches. Transdermal drug delivery (TDD) can minimize problems commonlyassociated with traditional delivery methods such as, painful administration, patientcompliance, liver metabolism, and sustained and controlled delivery [2]. As such, TDD hasgained wide acceptance in many therapeutic applications for a wide variety of drugs likenicotine [3] and estradiol [4].
© 2010 Elsevier B.V. All rights reserved.*Author to whom all correspondence should be sent: Phone (405)744-5280, Fax: (405) 744-6338, [email protected]'s Disclaimer: This is a PDF file of an unedited manuscript that has been accepted for publication. As a service to ourcustomers we are providing this early version of the manuscript. The manuscript will undergo copyediting, typesetting, and review ofthe resulting proof before it is published in its final citable form. Please note that during the production process errors may bediscovered which could affect the content, and all legal disclaimers that apply to the journal pertain.
NIH Public AccessAuthor ManuscriptInt J Pharm. Author manuscript; available in PMC 2011 October 15.
Published in final edited form as:Int J Pharm. 2010 October 15; 398(1-2): 83–92. doi:10.1016/j.ijpharm.2010.07.029.
NIH
-PA Author Manuscript
NIH
-PA Author Manuscript
NIH
-PA Author Manuscript

However, delivery of protein molecules like insulin has proven to be difficult due to thelarge molecular size (>3000 Da.) and hydrophilic nature of these molecules to which thehuman skin provides a very efficient transport barrier [5,6]. Several physical and chemicalmethods have been developed to improve the permeation of insulin through human skin [7–10]. By far, the most efficient method in enhancing insulin permeation through skin isiontophoresis [7]; however, the economic viability and ease of applicability of chemicalapproaches, such as the use of chemical penetration enhancers (CPEs), makes them anattractive alternative.
Very few studies involving the use of CPEs for transdermal insulin delivery exist in theliterature [8,11]. Further, in these limited studies, traditional CPEs involving either fattyacids of fatty alcohols are employed in tandem with iontophoresis. As such, CPEs in theseapplications are not mixed in a solution along with insulin. Instead, the skin is pre-treatedwith the CPE solution for about two hours, and then washed off before placing the insulinsolution on the skin. This is inconvenient from the standpoint of the applicability of aninsulin patch designed for sustained TDD. More importantly, these CPEs are limited in theirability to increase the permeation of insulin through the skin significantly and/or exhibittoxic effects to the skin. To address these shortcomings, a large number of CPEs (43 CPEs)containing different functional groups were selected to examine the effect of CPE structuralvariation on insulin permeation. The CPEs were not used for pre-treating the skin; rather,they were mixed with the insulin solution and allowed to remain in contact with the skin.
The 43 CPEs were identified with our virtual design algorithm which combines geneticalgorithms (GAs) and quantitative structure-property relationship (QSPR) models forimportant CPE properties (skin permeation, octanol-water partition coefficient, meltingpoint, aqueous solubility, and skin sensitization).
Specifically, the development of the virtual design algorithm included (a) integration of non-linear, theory-based structure-property relationship (SPR) property models and geneticalgorithms (GAs) to develop a reliable virtual screening algorithm for generation ofpotential CPEs, and (b) validation of the virtual screening predictions (using melatonin as anexample drug and pig skin as the model for human skin) by performing carefully designedexperiments for CPE toxicity and drug permeation in the presence of potential CPEsidentified as non toxic.
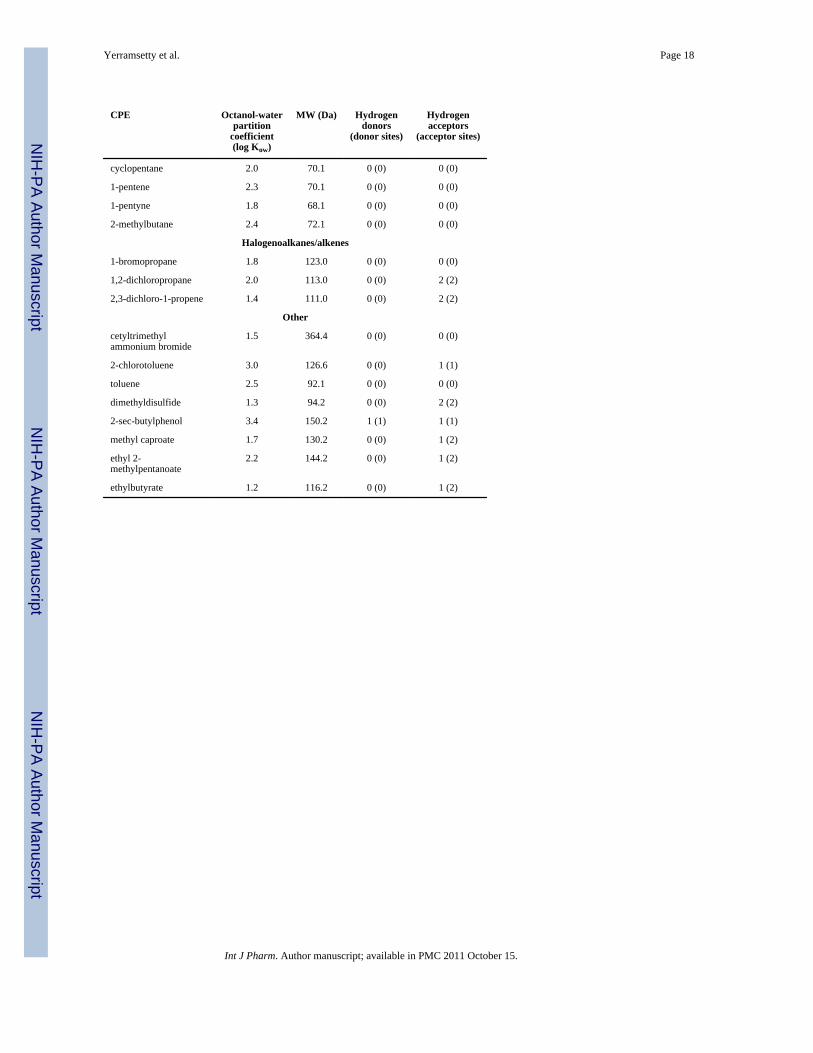
Details concerning the algorithms and models can be found elsewhere [12]. Based onfunctional group attachments, this set of CPEs was classified as: fatty acids, fatty ketones,fatty alcohols, fatty aldehydes, fatty amines, pyridines/pyrrolidones/pyrrolidinones, alkanes/alkenes/alkynes, halogenoalkanes/alkenes and other miscellaneous CPEs not belonging toany of the previous groups. Only molecules that had positive logarithmic octanol-waterpartition coefficient (log Kow) values were selected because these molecules are more likelyto exhibit desired skin transport properties. As such, only molecules that increase thepermeation of drugs through the “pull” mechanism proposed by Liron et al. [13] and Kadiret al. [14] have been investigated. The permeation effect of this mechanism results from theinteraction of a suitable CPE with skin which alters the dermal properties allowing increasedpermeation of a drug of interest. Significant properties of the CPEs calculated usingChemAxon software [15] are tabulated in Table 1.
The traditional permeation experimental apparatus using Franz diffusion cells provides areliable in vitro technique for estimating the permeation of insulin through the skin;however, it is time and labor intensive. Therefore, a two-step approach for identifyingpotential CPEs is employed. First, only those CPEs that decrease the skin resistance beyonda threshold value were selected using a resistance technique, which is justified based on our
Yerramsetty et al. Page 2
Int J Pharm. Author manuscript; available in PMC 2011 October 15.
NIH
-PA Author Manuscript
NIH
-PA Author Manuscript
NIH
-PA Author Manuscript

previous experience and similar studies reported in literature [16–18]. Second, traditionalpermeation experiments were performed to calculate accurately the permeability of insulin.
Another important issue associated with the use of CPEs is their toxicity. In fact, toxicity isoften the major limiting factor in identifying potential CPEs [16]. To assess the suitability ofthe CPEs investigated in the present study, 3-(4,5-dimethylthiazol-2-yl)-2,5-diphenyltetrazolium bromide (MTT)-formazan assay was employed to evaluate cell viabilityin the presence of a CPE of interest, and this constituted a preliminary screening mechanismto eliminate CPEs that were toxic at the cellular level. Additionally, histology studies on theintact porcine skin were performed to examine the effects of CPEs on skin.
2. MATERIALS AND METHODS2.1. Materials
All of the enhancers studied were obtained from Sigma Aldrich Chemical Company (StLouise, MO, USA), except for 1-methyl-2-pyrrolidone, which was obtained fromConocoPhillips (Bartlesville, OK, USA). Lispro, a short acting analog of human insulin, waspurchased from Eli Lilly Company (Indianapolis, IN, USA). Lispro was selected because ofits higher dermal absorption rate than normal insulin, which makes it more suitable fortransdermal delivery. Henceforth, in the present work, insulin refers to the Lispro analog.Ethanol USP was obtained from Aaper Alcohol and Chemical Co. (Shelbyville, KY, USA).High performance liquid chromatography (HPLC) grade acetonitrile was purchased fromFischer Scientific (Atlanta, GA, USA).
2.2. Skin PreparationFresh porcine abdominal skin was obtained from Ralphs Packing Co. (Perkins, OK, USA)and Bob McKinney & Sons (Cushing, OK, USA). The skin was cleaned with cold runningwater to remove dried blood and dirt, and hair was clipped using an electric clipper. Theadipose tissue and subcutaneous muscle layers were surgically excised. The skin was thenwrapped in aluminum foil and stored at −20°C until needed. The skin was stored for amaximum of 4 weeks before being used for experimentation. Representative samples wereassessed histologically to assess the quality of the skin preparation, as described in Section2.6.
2.3. Prescreening of Enhancers Based on Changes in Skin ResistancePreparation of Solution—Phosphate buffered saline (PBS, pH – 7.4, phosphate andsodium chloride concentrations of 0.001M and 0.137M, respectively) was used to prepareCPE solutions on the day of the experiment. First, 0.5 mL of ethanol was mixed with 0.5 mLof PBS and the test CPEs were added to each of these solutions to give a final CPEconcentration of 5% w/v.
Experimentation—The enhancers were prescreened based on their skin resistancereduction, which was measured using a resistance chamber that was built in-house. Aschematic of the chamber and specific details of this technique, including the current type,the current intensity and the instrumentation are described elsewhere [18]. Briefly, theresistance chamber consists of two half-inch thick Teflon plates fixed to a Teflon Petri dish.Five holes with a diameter of 0.79 cm were drilled into each Teflon plate. The holes in thetop plate serve as donor chambers, and the holes in the bottom plate serve as receiverchambers, as in Franz diffusion cells. Porcine skin was placed between the receiver anddonor plates with the stratum corneum facing the donor wells, and the two plates wereclamped together tightly. The Petri dish was filled with PBS such that the receiver chamberswere completely filled with PBS, which was assured by checking the skin resistance;
Yerramsetty et al. Page 3
Int J Pharm. Author manuscript; available in PMC 2011 October 15.
NIH
-PA Author Manuscript
NIH
-PA Author Manuscript
NIH
-PA Author Manuscript

presence of air pockets between the skin and the receiver chambers showed very highresistance values since air has low conductivity. Resistance readings were taken using acommon electrode placed beneath the receiver plate and the other placed sequentially intoeach donor well, which were filled with just the CPE and no insulin.
All potential enhancers were tested at a concentration of 5% (wt/v) in 1:1 PBS and ethanolsolution with the receiver chambers maintained at 37 ± 1°C. Resistance measurements weretaken every hour for up to 6 hours and the CPE solution was in contact with the skin for thisentire period. Rachakonda et al. [18] have shown that the efficacy of a CPE can beestablished by measuring the drop in the skin resistance during a 6 hour contact periodbetween the CPE and the skin. Measurements beyond this time period contribute noadditional information regarding CPE efficacy. The resistance reduction factor (RF), whichis defined as the ratio of the initial resistance value (R) at time 0 to the resistance value ofthe sample obtained at time t (6 hrs), was calculated as given by:
(1)
2.4. Permeation Experiments on the Prescreened EnhancersPreparation of Solution—Phosphate buffer (PB, pH – 7.4, monosodium phosphatemonohydrate and disodium phosphate heptahydrate concentrations of 13.55 mM and 46.41mM, respectively) was used as the receiver solution in the Franz permeation cells. Solutionsof CPEs were prepared on the day of the experiment by dissolving 0.6 mL volume ofethanol with 0.4 mL of insulin solution. The final concentration of insulin wasapproximately 40 IU/mL or 1.8 mg/mL. The test CPEs were added to each of these solutionsto give a final concentration of 5% w/v. In general, the enhancement effect is dependent onthe concentration of the CPE in the donor solution, and if a CPE was to be developedcommercially, a range of concentration for each CPE would require investigation. However,due to the number of CPEs involved in this work, we have limited testing to CPEs only at a5% w/v concentration. The enhancement at this concentration has been used widely in skinpermeation literature as a reasonable indicator of the CPE’s efficacy [19–21].
Experimentation—All the permeation experiments were conducted using Franz diffusioncells (Permegear Inc., Riegelsville, PA, USA). The capacities of the donor and the receiverchambers were 1 mL and 5 mL, respectively. The surface area available for diffusion was0.64 cm2. The receiver chamber temperature was maintained at 37 ± 1°C using a flow loopconsisting of a water bath reservoir (Isotemp 105, Fischer, Atlanta, GA, USA) and aMasterflex L/S peristaltic pump (Fischer, Atlanta, GA, USA).
The receiver chambers of the Franz diffusion cells were filled with PB and stirredcontinuously using a magnetic stir bar. Abdominal skin was thawed at room temperature fora minimum of two hours and was placed between the donor and receiver chambers with thestratum corneum facing the donor chamber. Then, 1.0 mL solutions containing insulin andCPE were placed inside the donor chambers of Franz diffusion cells. The control samplescontained 0.4 mL insulin and 0.6 mL ethanol solution. At different time intervals (3, 9, 12,18, 24, 36 & 48 h), 0.1 mL samples were withdrawn from the receiver chamber using asyringe. Fresh PB in 0.1 mL amounts was replaced in the receiver chambers. The collectedsamples were stored at 4°C until further analysis.
HPLC Analysis—The concentrations of insulin in the receiver chambers at different timeintervals were measured using a HPLC system (Dionex Co., Sunnyvale, CA, USA)containing a Waters Symmetry 300 column (4.6 *150 mm dimensions, 5 µm and 90 Å
Yerramsetty et al. Page 4
Int J Pharm. Author manuscript; available in PMC 2011 October 15.
NIH
-PA Author Manuscript
NIH
-PA Author Manuscript
NIH
-PA Author Manuscript

packing). A 40:60 (v/v) mixture of acetonitrile and water was the mobile phase. Flow ratewas 1.0 mL/min and the eluent was monitored at 276 nm. Linearity for HPLC analysis wasobserved in the concentration range of 0.01–12.5 IU/mL (R2 > 0.99).
Permeability Coefficient (Kp) and Enhancement Factor (EF) Calculations—Thefollowing steady-state equation was used to calculate permeability of the skin:
(2)
where, Am is the exposure area of the skin sample (0.64 cm2), C0 is the initial concentrationin the donor chamber in mM, Kp is the permeability of the membrane and t is time in hrs.The permeability is given in terms of the diffusion coefficient (Dm), the partition coefficient(Km), and the thickness of the skin sample (L):
(3)
In this study, the amount of drug permeated was calculated as the total amount of drugpermeated through skin during a time period of 48 hr. The lag times (Lt) were calculated asthe x-intercept of the steady-state portion of the permeation profiles (cumulative insulinpermeated, IU/cm2) plotted against the time (hr) profiles, as shown in Figure 1.
2.5. In Vitro Cytotoxicity AnalysisHuman foreskin fibroblasts (HFF-1, cell line) were purchased from American Type CultureCollection (Walkersville, MD, USA) and maintained in Dulbecco’s Modified Eagle Mediumsupplemented with 4 mM L-glutamine, 4.5 g/L sodium bicarbonate, 0.1 mM β-mercaptoethanol, 100 U/mL penicillin-streptomycin, 2.5 g/mL amphotericin, and 10% Fetalbovine serum (Invitrogen Corp., Carlsbad, CA, USA). The cell cultures were maintained in5% CO2 at 37°C with medium changes every 48 h.
Cells in the exponential growth phase were detached using 0.05% trypsin - 10 µMethylenediaminetetraacetic acid (EDTA) (Invitrogen Corp., Carlsbad, CA, USA),centrifuged, and re-suspended in fresh growth medium. Viable cells were counted in aheamocytometer using trypan blue dye exclusion principle, and approximately 25,000 viablecells were seeded into each well of a 24-well plate in 0.5 mL growth medium and incubatedfor 24 h. CPEs were dissolved in PBS with 1% dimethyl sulfoxide (DMSO). The CPEs weretested at three different concentrations of 10 mg/mL, 1 mg/mL and 0.1 mg/mL.
After 24 h of exposure to the CPEs, morphological changes were monitored using aninverted microscope (Nikon, TE2000U, Melville, NY), and digital micrographs werecaptured from different locations on the well plate. Additionally, MTT assays wereperformed for viability testing using a previously reported procedure [22]. In brief, growthmedium was replaced with 0.5 mL of 2 mg/mL MTT (Sigma-Aldrich Chemical Company,St. Louis, MO, USA) solution in PBS and incubated for four to five hours at 37°C. TheMTT solution was discarded, the cells were washed with PBS solution, and 0.2 mL DMSOwas added to dissolve the formazan salt crystals. The absorbance of the solution containingthe solubilized formazan was measured at 540 nm with readings at 620 nm serving asreferences. Fraction viabilities for each well were calculated with respect to the control wellsusing the following equation.
Yerramsetty et al. Page 5
Int J Pharm. Author manuscript; available in PMC 2011 October 15.
NIH
-PA Author Manuscript
NIH
-PA Author Manuscript
NIH
-PA Author Manuscript
(4)
where, Abs(540) and Abs(620) indicate the absorbance values for the well at 540 nm and620 nm, respectively, n indicates the number of wells used as controls (replicates) and thesubscript control indicates the readings of the control wells.
2.6. HistologySkin samples that were used for the permeation studies were immediately removed from theFranz cells and fixed in 1.5% buffered formalin. The samples were embedded in paraffinand 6-µm sections were cut using a microtome. Hemotoxylin and eosin staining wasperformed and digital photomicrographs were taken at representative regions using aninverted microscope (Nikon, TE2000U, Melville, NY, USA).
Morphological changes in the skin (especially in epidermal layers) after the permeationexperiments were observed visually and classified on a scale of A–D; Class A – non toxic(morphology of the sample looks exactly similar to the control sample); Class B – slightlytoxic (morphology looks almost similar to the control sample); Class C – toxic (morphologyincludes partial epidermal degradation with nuclei bleeding into the dermal layers); Class D– severely toxic (morphology includes severe epidermal degradation with cell death).
2.7. Statistical AnalysisAll experiments were performed at least three times, and single factor one-way analysis ofthe variance (ANOVA) was performed with a 95% confidence interval on the cell fractionviability and drug permeability data. This was done to determine if the differences amongthese data at different experimental conditions are greater than the errors due to randomeffects. A p-value less than 0.05 indicates a significant difference exists between the twogroups of data.
3. RESULTS3.1. Prescreening of the Enhancers
A total of 43 enhancers were tested for reduction in porcine skin resistance using theresistance technique. The calculated reduction factors of the candidate CPEs are tabulated inTable 2. Only those enhancers that caused a reduction factor of 10 or greater were marked aseffective and selected for further analysis. These CPEs (a total of 22) are marked with anasterisk, as shown in Table 2. Different CPEs belonging to all the functional group classesexcept for the “alkanes/alkenes/alkynes” group were represented in these 22 prescreenedenhancers. No particular functional group contributed dominantly to this list of pre-screenedenhancers, and molecular structures not satisfying the pre-screening criterion wererepresented by all group classes.
3.2. Permeability of Insulin in the Presence of the Prescreened EnhancersTo evaluate the permeation of insulin in the presence of the prescreened enhancers,permeation experiments were performed using the standard Franz diffusion cells. Thecumulative amounts of insulin permeated per cm2 and the permeability values (Kp) aretabulated in Table 3. From the table, it is evident that all the enhancers with a RF of at least10 also increased cumulative amount of insulin permeated by at least two times (EF >2).
Yerramsetty et al. Page 6
Int J Pharm. Author manuscript; available in PMC 2011 October 15.
NIH
-PA Author Manuscript
NIH
-PA Author Manuscript
NIH
-PA Author Manuscript

This provides validation of our prescreening procedure using the resistance technique. Nofunctional group exhibited significantly high permeabilities when compared to other groups.Table 3 also lists the lag times, L,t for permeation in the presence of CPEs. All CPEs exceptfor lauric cid and toluene increased the lag time when compared to the lag times obtainedusing the control (ethanol + insulin) solution. The lag times in the presence of lauric acid arecomparable to the control value, while the lag times in the presence of toluene weresignificantly lower than the control value.
The relationship between Kp and RF values was explored; however, initial results showedlarge deviations for two CPEs, 2,3-dichloro-1-propene and toluene, which were excludedfrom further analysis. Subsequently, a correlation plot of averaged log Kp and log RF values,where values were averaged at approximately 0.1 log RF intervals, was plotted (Figure 2)and the resulting R2 was found to be 0.79. A horizontal line in the figure indicates the Kpvalue for the control. As shown in the figure and Table 3, all the prescreened enhancers hadKp values greater than that of control, indicating that the prescreening resistance technique isable to predict successfully the CPEs that might enhance permeation of insulin.
3.3. Cytotoxicity of Predicted CPEsAt the highest concentration of 10 mg/mL all the CPEs exhibited toxicity (fractionalviability less than 0.3; data not shown); even though in the cases of 4-octanone andoctaldehyde, the morphology and the density of the cells was similar to that of control. Atthe lowest concentration of 0.1 mg/mL all the enhancers except for pulegone (fractionalviability < 0.3) were found to be non-toxic (fractional viability was statistically similar tocontrol, p > 0.05; data not shown). At the moderate concentration of 1 mg/mL, eightenhancers were found to be non-toxic as shown in Figure 3. The figure presents toxicity interms of fractional viability with respect to control after 24 h of cell exposure to CPEs, asassessed using the MTT assay. Of the 22 CPEs examined, satisfactory viability (fractionalviability was statistically similar to control, p > 0.05) was indicated for eight CPEs:menthone, decanol, oleic acid, cis-4-hexen-1-ol, 2,4,6-collidine, cycloundecanone, 4-octanone, and octaldehyde. All other CPEs showed significant reduction in the viability ofcells (p < 0.05). To understand the influence of CPEs on cellular activity, morphology offibroblasts was assessed after 24 h of exposure to CPEs found to be non-toxic after MTTassays. The micrographs of the cells (upper panels) are provided in Figure 4 along with themicrographs of the skin (lower panels) after exposure to each CPE. These results show thatthe addition of these CPEs did not alter cell morphology, indicating that the CPE had notoxic effects.
3.4. Histology of Skin Exposed to CPEsMicrographs of the porcine skin after exposure to CPEs are given in the lower panels ofFigure 4. Table 4 shows the CPEs graded according to their effect on the morphology of theskin, as mentioned in Section 2.6. There was severe epidermal degradation with completecell death for skin exposed to menthone, indicating a high level of toxicity (classified as D).Decanol was slightly toxic (classified as B) to the skin cells as shrunken nuclei in theepidermal layers were observed. Cycloundecanone was moderately toxic (classified as B)with nuclei from the epidermis bleeding slightly into the dermis. In contrast, oleic acid, 4-octanone, octanal, cis-4-hexen-1-ol and 2,4,6-collidine were nontoxic (classified as A) as nosignificant change in the morphology of the skin samples exposed to the respectivechemicals was observed.
Yerramsetty et al. Page 7
Int J Pharm. Author manuscript; available in PMC 2011 October 15.
NIH
-PA Author Manuscript
NIH
-PA Author Manuscript
NIH
-PA Author Manuscript

4. DISCUSSIONTraditional methods of identifying CPEs usually involve laborious and time-intensivepermeation measurements that reduce significantly the experimental throughput. Analternative has been proposed in the literature [16,17] that uses the changes in electricalresistance to estimate the enhancement effect of the CPEs. This method is more efficient interms of cost and time when compared to permeation experiments. Therefore the resistancetechnique was employed in the present work to prescreen the initial list of 43 molecules. Atotal of these 22 enhancers were examined further using the traditional permeationexperiments involving Franz diffusion cells and HPLC. The lag times in the presence ofmost CPEs were found to be greater than the lag time in the presence of control (ethanol +insulin) solution. This could be due to the length of time involved in the stratum corneumpermeation by higher molecular weight CPEs when compared to the lower molecular weightethanol. Also, no relationship was found between the resistance reduction profiles (notshown) and the calculated lag times.
The resistance reduction factor and enhancement factor were calculated for these 22 pre-screened enhancers, and the observed correlation (R2 = 0.79) between the enhancer RF andKp values is shown in Figure 2. Variation in the correlation can be attributed to the limitednumber of data, the variable initial resistances of different skin samples, hair density on thatparticular skin sample and other factors that lead to large uncertainties in the reduction ofresistances [23–25]. Although, great care has been taken to limit these uncertainties(including the use of select abdominal skin samples that have a narrow range of initialresistance values), variations due to other factors such as age, weight and previous history ofthe animal usually associated with biological samples could not be avoided. In addition,limiting the resistance experiments to 6 h to enhance the experimental throughput magnifiesthese uncertainties. Therefore, the resistance technique should be used as a “coarse” rapidmethod for identifying CPEs that alter significantly the barrier properties of the skin. Theexact level of enhancement should be estimated from the traditional permeationexperiments.
The log Kow values, molecular weights, number of hydrogen donors and acceptors for all ofthe enhancers are tabulated in Table 1. Of the 43 enhancers tested using resistancetechnique, all except two enhancers had positive log Kow values. However, this alone is nota sufficient condition for a chemical to be an enhancer, as is evident from the RF values forthe chemicals in the alkanes/alkenes/alkynes group, where a wide range of positive log Kowvalues does not translate to significant reduction in skin resistance. Also, these CPEs havenot shown any increase in insulin permeation (data not shown). An important aspect of thisgroup of chemicals is their lack of hydrogen acceptors or donors (Table 1), which indicatesthat these two properties are significant attributes of an effective insulin enhancer.Narishetty and Panchagnula [26,27] have reported that oxygen atoms in the terpenes formhydrogen bonds with skin lipid bi-layers and lead to stratum corneum structure modification.Therefore, it is reasonable to expect that any CPE with hydrogen bonding capability willhave the ability to modify the stratum corneum structure. Further studies need to beconducted to investigate the number of hydrogen bonding groups that would result inoptimum enhancement. However, we found two exceptions to this hydrogen bonding rule;cetyltrimethyl ammoniumbromide and toluene, both of which enhance the permeation ofinsulin significantly, but have no hydrogen donors or acceptors. The anomaly exhibited bycetyltrimethyl ammonium bromide can be explained by the fact that it dissociates into anionic form in aqueous solutions and therefore has some electronegative effects, even thoughthe structure lacks any hydrogen donors or acceptors. This still leaves the behavior oftoluene unexplained since electronegative regions in the structure are absent.
Yerramsetty et al. Page 8
Int J Pharm. Author manuscript; available in PMC 2011 October 15.
NIH
-PA Author Manuscript
NIH
-PA Author Manuscript
NIH
-PA Author Manuscript

Since toxicity is the major limitation of the applicability of the CPEs, all 22 prescreenedenhancers were tested for their effects on human fibroblasts at three concentrations ofdifferent orders of magnitude (10 mg/mL, 1 mg/mL and 0.1 mg/mL). At the moderateconcentration of 1 mg/mL, eight enhancers were found to be non-toxic. In the presence ofthese non-toxic enhancers, the Kp value for insulin permeation was at least 4 times that ofcontrol. Therefore, our search has resulted in eight CPEs (a) that were non-toxic from thepreliminary cytotoxicity studies, and (b) that enhance insulin permeation, as deduced fromthe in vitro permeation studies.
The cellular toxicity (in vitro) studies were conducted at 1% w/v whereas the permeationstudies and the histology studies were performed at 5% w/v. Using 1 mg/mL (or 1%w/v)CPE for each well of a 24 well plate, the average concentration of the CPE per cell isapproximately 4*10−5 mg/mL. In the permeation experiments, the average concentration ofthe CPE per skin cell is approximately 1.5*10−5 mg/mL, assuming porcine skin cell densityto be equal to that of human skin, which is approximately 6 million cells per squarecentimeter, and that all of the CPE in the donor solution transports into the viable epidermis.Since the amount of CPE transported into the viable layers of the skin is less than theconcentration of CPE in the donor chamber due to the transport barrier presented by thestratum corneum, the value presented above is a conservative estimate for the actual CPEconcentration in the epidermis. Therefore, if the CPE was non-toxic at the concentration of4*10−5 mg/mL per cell, then the CPE must be non-toxic in the permeation experimentswhere the concentration is less than 1.5*10−5 mg/mL per cell. The in vitro toxicity resultspresented in the current work can be safely extrapolated to assess the toxicity of the CPE tothe skin cells in the permeation experiments.
As discussed previously, the in vitro cellular level toxicity data usually overestimates theeffect of the CPE on the skin, due to the lack of a proper stratum corneum that acts as theinitial barrier to the transport of molecules into the skin [28]. Therefore, the cellular leveldata provides an approximation of the toxicity of the CPE. While histological analysis is amore reliable toxicity model, this technique is time and labor-intensive and therefore wasused only to confirm the cytotoxicity results for the eight non-toxic CPEs. The grading ofthe CPEs based on their effect on porcine skin is tabulated in Table 4, from which it isevident that seven of the eight potential CPEs are non-toxic to the intact skin; menthone wasthe exception that shows severe toxicity; nevertheless, when menthone was tested on porcineskin at 1% w/v, it was non-toxic, indicating a concentration-dependent toxicity effect for thisCPE in the concentration ranges that we tested for.
Of the eight CPEs discovered in this study, menthone, decanol and oleic acid have alreadybeen thoroughly investigated in the literature for their effects on the enhancement ofdifferent drugs. Specifically, pre-treatment of the porcine skin with menthone and otherterpenes has been used to enhance permeation of insulin in conjunction with iontophoresis[29]. Also, menthone has been used to enhance the permeation of weakly hydrophobic drugslike melatonin [18] and some strongly hydrophobic drugs like tamoxifen [30]. Similarly,decanol and oleic acid have been used as permeation enhancers for a large variety of drugslike melatonin [19,20] and ketotifen [31]. However, to our knowledge, they have not beenused to enhance insulin permeation through skin. The remaining five CPEs discovered inthis study have not been investigated for their enhancement effects with any drug in theliterature previously.
One final note on the validity of the results of this work is in order. In the current work, alldata has been generated using in vitro methods. However, in vitro results are not a trueindication of the bioavailability of the drug and the toxicity effects of the CPE. Therefore, invivo studies are required to confirm the safety and applicability of the CPEs identified in this
Yerramsetty et al. Page 9
Int J Pharm. Author manuscript; available in PMC 2011 October 15.
NIH
-PA Author Manuscript
NIH
-PA Author Manuscript
NIH
-PA Author Manuscript
work. Further, no interactions were assumed between the CPE and insulin in the donorsolution, based on the nearly constant elution time observed for insulin during HPLCanalysis; however, additional studies need to be performed on potential CPEs to confirm thisassumption.
5. CONCLUSIONSThe current results lead to the conclusion that no specific CPE functional groups are directlyresponsible for enhanced insulin permeation. Rather, CPE permeation enhancement isproduced by molecules that exhibit positive log Kow values and possess at least onehydrogen donor or acceptor, with the exception of toluene among the 22 CPEs considered.As such, future CPE screening could be narrowed down to include only molecules that meetthese criteria, thus reducing the computational and experimental burdens involved inidentifying new CPEs.
The current work also demonstrates the usefulness of an efficient two-step approach foridentifying CPEs, namely, the use of the resistance technique as a rapid method to pre-screen the potential CPEs followed by the traditional permeation measurements to quantifyaccurately the permeabilities. This approach was used to screen an initial set of 43 potentialCPEs to identify 22 likely CPEs, which were then tested for their effect on insulinpermeability. Despite its high-throughput, the resistance technique remains a coarse methodfor identifying potential CPEs and should not be the primary determinant for estimating theincrease in drug permeability.
As also shown in the literature, toxicity of discovered CPEs was the major limiting factor inapplicability in the current work. Only eight of the 22 potential CPEs that enhanced insulinpermeability were found to be non-toxic. Of these eight, three CPEs were investigatedpreviously in the literature, and five CPEs have never been investigated as enhancers.
AcknowledgmentsFinancial support for this research was provided by the National Institute of Biomedical Imaging andBioengineering (1R21EB005749).
REFERENCES1. Patni P, Varghese D, Balekar N, Jain DK. Needle-free insulin drug delivery. Indian Journal of
Pharmaceutical Sciences. 2006; vol. 68:7–12.2. Chong, S.; Fung, HL. Transdermal drug delivery systems: Pharmacokinetics, clinical efficacy, and
tolerance development. In: Hadgraft, J.; Guy, RH., editors. Transdermal Drug Delivery:Developmental Issues and Research Initiatives. 1st ed. New York: Marcel Dekker; 1989. p.135-154.
3. Nair MK, Chetty DJ, Ho H, Chien YW. Biomembrane permeation of nicotine: Mechanistic studieswith porcine mucosae and skin. Journal of Pharamaceutical Sciences. 1997; vol. 86:257–262.
4. Goodman M, Barry BW. Action of penetration enhancers on human skin as assessed by thepermeation of model drugs 5-fluorouracil and estradiol. I. Infinite dose technique. Journal ofInvestigative Dermatology. 1988; vol. 91:323–327. [PubMed: 3171212]
5. Monteiro-Riviere, NA. Comparative anatomy, physiology, and biochemistry of mammalian skin. In:Hobson, DW., editor. Dermal and Ocular Toxicology: Fundamentals and Methods. 1st ed. BocaRaton, FL: CRC Press; 1991. p. 3-73.
6. Monteiro-Riviere, NA. Anatomical factors affecting barrier function. In: Marzulli, FN.; Maibach,HI., editors. Dermatotoxicology. 1st ed. Washington, D.C.: Taylor & Francis; 1996. p. 43-70.
Yerramsetty et al. Page 10
Int J Pharm. Author manuscript; available in PMC 2011 October 15.
NIH
-PA Author Manuscript
NIH
-PA Author Manuscript
NIH
-PA Author Manuscript

7. Pillai O, Panchagnula R. Transdermal delivery of insulin from poloxamer gel: Ex vivo and in vivoskin permeation studies in rat using iontophoresis and chemical enhancers. Journal of ControlledRelease. 2003; vol. 89:127–140. [PubMed: 12695068]
8. Rastogi SK, Singh J. Passive and iontophoretic transport enhancement of insulin through porcineepidermis by depilatories: Permeability and fourier transform infrared spectroscopy studies. AAPSPharmSciTech. 2003; vol. 4:E29. [PubMed: 14621961]
9. Pan Y, Zhao HY, Zheng JM. The enhancing effect of electroporation and iontophoresis on thepermeation of insulin through human skin. Yao Xue Xue Bao. 2002; vol. 37:649–652. [PubMed:12567783]
10. Smith NB, Lee S, Shung KK. Ultrasound-mediated transdermal in vivo transport of insulin withlow-profile cymbal arrays. Ultrasound in Medicine & Biology. 2003; vol. 29:1205–1210.[PubMed: 12946523]
11. Pillai O, Nair V, Panchagnula R. Transdermal iontophoresis of insulin: Iv. Influence of chemicalenhancers. International Journal of Pharmaceutics. 2004; vol. 269:109–120. [PubMed: 14698582]
12. Godavarthy SS, Yerramsetty M, Rachakonda VK, Neely BJ, Madihally SV, Robinson RL Jr,Gasem KA. Design of improved permeation enhancers for transdermal drug delivery. J Pharm Sci.2009; vol. 98:4085–4099. [PubMed: 19697392]
13. Liron Z, Cohen S. Percutaneous absorption of alkanoic acids II: Application of regular solutiontheory. Journal of Pharmaceutical Sciences. 1984; vol. 73:538–542. [PubMed: 6726640]
14. Kadir R, Stempler D, Liron Z, Cohen S. Delivery of theophylline into excised human skin fromalkanoic acid solutions: A "Push-pull" Mechanism. Journal of Pharmaceutical Sciences. 1987; vol.76:774–779. [PubMed: 3430340]
15. ChemAxon. Marvin and calculator plugin demo. [last accessed on December, 2007].http://www.chemaxon.com/demosite/marvin/index.html
16. Karande P, Jain A, Mitragotri S. Discovery of transdermal penetration enhancers by high-throughput screening. Nature Biotechnology. 2004; vol. 22:192–197.
17. Karande P, Jain A, Mitragotri S. Relationships between skin's electrical impedance andpermeability in the presence of chemical enhancers. Journal of Controlled Release. 2006; vol.110:307–313. [PubMed: 16313994]
18. Rachakonda VK, Yerramsetty KM, Madihally SV, Robinson JRL, Gasem KAM. Screening ofchemical penetration enhancers for transdermal drug delivery using electrical resistance of skin.Pharmaceutical Research. 2008; vol. 25:2697–2074. [PubMed: 18683029]
19. Kandimalla K, Kanikkannan N, Andega S, Singh M. Effect of fatty acids on the permeation ofmelatonin across rat and pig skin in-vitro and on the transepidermal water loss in rats in-vivo.Journal of Pharmacy and Pharmacology. 1999; vol. 51:783–790. [PubMed: 10467952]
20. Andega S, Kanikkannan N, Singh M. Comparison of the effect of fatty alcohols on the permeationof melatonin between porcine and human skin. Journal of Controlled Release. 2001; vol. 77:17–25. [PubMed: 11689256]
21. Kanikkannan N, Singh M. Skin permeation enhancement effect and skin irritation of saturated fattyalcohols. Int J Pharm. 2002; vol. 248:219–228. [PubMed: 12429475]
22. Mosmann T. Rapid colorimetric assay for cellular growth and survival: Application to proliferationand cytotoxicity assays. Journal of Immunological Methods. 1983; vol. 65:55–63. [PubMed:6606682]
23. Nicander I, Ollmar S. Electrical impedance measurements at different skin sites related to seasonalvariations. Skin Research and Technology. 2000; vol. 6:81–86. [PubMed: 11428947]
24. Fujita T, Fujii Y, Okada SF, Miyauchi A, Takagi Y. Fall of skin impedance and bone and jointpain. Journal of Bone and Mineral Research. 2001; vol. 19:175–179.
25. Davies DJ, Ward RJ, Heylings JR. Multi-species assessment of electrical resistance as a skinintegrity marker for in vitro percutaneous absorption studies. Toxicology In Vitro. 2004; vol.18:351–358. [PubMed: 15046783]
26. Narishetty ST, Panchagnula R. Transdermal delivery of zidovudine: Effect of terpenes and theirmechanism of action. Journal of Controlled Release. 2004; vol. 95:367–379. [PubMed: 15023449]
27. Narishetty ST, Panchagnula R. Transdermal delivery system for zidovudine: In vitro, ex vivo andin vivo evaluation. Biopharmaceutics & Drug Disposition. 2004; vol. 25:9–20.
Yerramsetty et al. Page 11
Int J Pharm. Author manuscript; available in PMC 2011 October 15.
NIH
-PA Author Manuscript
NIH
-PA Author Manuscript
NIH
-PA Author Manuscript

28. Kojima H, Sato A, Hanamura A, Katada T, Konishi H. Evaluation of skin irritation in areconstituted human dermal model (3-d model) using water insoluble fatty acids, fatty alcoholsand hydrocarbons. Alternatives to Animal Testing and Experimentation. 1998; vol. 5:201–210.
29. Pillai O, Panchagnula R. Transdermal iontophoresis of insulin. V. Effect of terpenes. Journal ofControlled Release. 2003; vol. 88:287–296. [PubMed: 12628335]
30. Zhao K, Singh S, Singh J. Effect of menthone on the in vitro percutaneous absorption of tamoxifenand skin reversibility. International Journal of Pharmaceutics. 2001; vol. 219:177–181. [PubMed:11337177]
31. Kimura C, Nakanishi T, Tojo K. Skin permeation of ketotifen applied from stick-type formulation.European Journal of Pharmaceutics and Biopharmaceutics. 2007; vol. 67:420–424. [PubMed:17433642]
Yerramsetty et al. Page 12
Int J Pharm. Author manuscript; available in PMC 2011 October 15.
NIH
-PA Author Manuscript
NIH
-PA Author Manuscript
NIH
-PA Author Manuscript
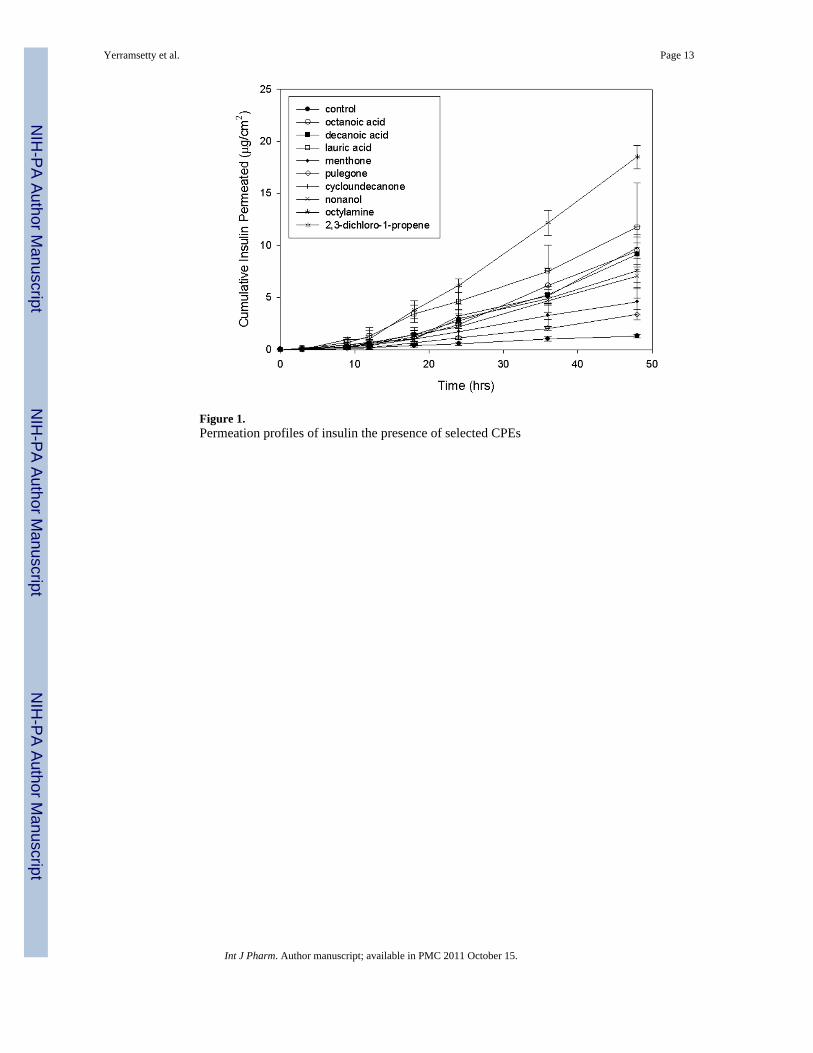
Figure 1.Permeation profiles of insulin the presence of selected CPEs
Yerramsetty et al. Page 13
Int J Pharm. Author manuscript; available in PMC 2011 October 15.
NIH
-PA Author Manuscript
NIH
-PA Author Manuscript
NIH
-PA Author Manuscript

Figure 2.Variation of permeability with reduction factor on an averaged basis. The horizontal dashedline indicates the control level. The solid line is the regression line for the correlationbetween the permeability coefficient and reduction factor.
Yerramsetty et al. Page 14
Int J Pharm. Author manuscript; available in PMC 2011 October 15.
NIH
-PA Author Manuscript
NIH
-PA Author Manuscript
NIH
-PA Author Manuscript

Figure 3.Toxicity after 24 hours of exposure to the CPEs. The non-toxic CPEs and toxic CPEs arecolored in white and grey, respectively.
Yerramsetty et al. Page 15
Int J Pharm. Author manuscript; available in PMC 2011 October 15.
NIH
-PA Author Manuscript
NIH
-PA Author Manuscript
NIH
-PA Author Manuscript

Figure 4.Micrographs of the cells (upper panels) and the pig skin samples (lower panels) afterexposure to the CPEs at a concentration of 5%w/v.
Yerramsetty et al. Page 16
Int J Pharm. Author manuscript; available in PMC 2011 October 15.
NIH
-PA Author Manuscript
NIH
-PA Author Manuscript
NIH
-PA Author Manuscript

NIH
-PA Author Manuscript
NIH
-PA Author Manuscript
NIH
-PA Author Manuscript
Yerramsetty et al. Page 17
Table 1
Properties of the CPEs tested, where the parenthetical values are indicative of either donor or acceptor sites.
CPE Octanol-waterpartition
coefficient(log Kow)
MW (Da) Hydrogendonors
(donor sites)
Hydrogenacceptors
(acceptor sites)
Acids
octanoic acid 2.4 144.2 1 (1) 2 (3)
decanoic acid 3.2 172.3 1 (1) 2 (3)
oleic acid 6.1 282.5 1 (1) 2 (3)
lauric acid 4.0 200.3 1 (1) 2 (3)
azelaic acid 1.6 188.2 2 (2) 4 (6)
salicylic acid 1.9 138.1 2 (2) 3 (4)
tert-butyl acetic acid 1.6 116.2 1 (1) 2 (3)
Ketones
menthone 3.1 154.3 0 (0) 1 (2)
acetophenone 1.4 120.2 0 (0) 1 (2)
4-octanone 2.8 128.2 0 (0) 1 (2)
pulegone 2.8 152.2 0 (0) 1 (2)
cycloundecanone 168.8
3-methyl-2-hexanone 2.4 114.2 0 (0) 1 (2)
2-methylcyclohexanone
2.1 112.2 0 (0) 1 (2)
2-heptanone 2.2 114.2 0 (0) 1 (2)
Alcohols
cis-4-hexen-1-ol 1.2 100.2 1 (1) 1 (1)
nonanol 2.6 144.3 1 (1) 1 (1)
decanol 3.0 158.3 1 (1) 1 (1)
Aldehydes
hexanal 1.2 100.2 0 (0) 1 (2)
octanal 2.0 128.2 0 (0) 1 (2)
salicaldehyde 2.1 122.1 1 (1) 2 (3)
Amines
N,N-dimethylisopropylamine
0.9 87.2 1 (1) 0 (0)
octylamine 2.2 129.2 1 (2) 1 (1)
Pyridines/ Pyrrolidones/Pyrrolidinones
2,4,6-collidine 1.5 121.2 0 (0) 1 (1)
1-dodecyl-2-pyrrolidinone
4.0 253.4 0 (0) 1 (2)
1-methyl-2-pyrrolidone −0.4 99.1 0 (0) 1 (2)
2-methyl-3-oxazolidinone
−0.1 101.1 0 (0) 2 (3)
Alkanes/Alkenes/Alkynes
nonane 5.6 128.2 0 (0) 0 (0)
Int J Pharm. Author manuscript; available in PMC 2011 October 15.
NIH
-PA Author Manuscript
NIH
-PA Author Manuscript
NIH
-PA Author Manuscript
Yerramsetty et al. Page 18
CPE Octanol-waterpartition
coefficient(log Kow)
MW (Da) Hydrogendonors
(donor sites)
Hydrogenacceptors
(acceptor sites)
cyclopentane 2.0 70.1 0 (0) 0 (0)
1-pentene 2.3 70.1 0 (0) 0 (0)
1-pentyne 1.8 68.1 0 (0) 0 (0)
2-methylbutane 2.4 72.1 0 (0) 0 (0)
Halogenoalkanes/alkenes
1-bromopropane 1.8 123.0 0 (0) 0 (0)
1,2-dichloropropane 2.0 113.0 0 (0) 2 (2)
2,3-dichloro-1-propene 1.4 111.0 0 (0) 2 (2)
Other
cetyltrimethylammonium bromide
1.5 364.4 0 (0) 0 (0)
2-chlorotoluene 3.0 126.6 0 (0) 1 (1)
toluene 2.5 92.1 0 (0) 0 (0)
dimethyldisulfide 1.3 94.2 0 (0) 2 (2)
2-sec-butylphenol 3.4 150.2 1 (1) 1 (1)
methyl caproate 1.7 130.2 0 (0) 1 (2)
ethyl 2-methylpentanoate
2.2 144.2 0 (0) 1 (2)
ethylbutyrate 1.2 116.2 0 (0) 1 (2)
Int J Pharm. Author manuscript; available in PMC 2011 October 15.

NIH
-PA Author Manuscript
NIH
-PA Author Manuscript
NIH
-PA Author Manuscript
Yerramsetty et al. Page 19
Table 2
Reduction factors (RF) calculated for the enhancers. The data are the means and standard deviations of aminimum of three repetitions. Enhancers marked with an asterisk produced RF values greater than 10
CPE RF = R0/R6
None (Control) 2.6 ± 0.8
Acids
octanoic acid* 46 ± 8.1
decanoic acid* 89 ± 11.0
oleic acid * 17 ± 2.6
lauric acid* 50 ± 7.5
azelaic acid 1.2 ± 0.1
salicylic acid 5.8 ± 0.4
tert-butyl acetic acid 5 ± 2.3
Ketones
menthone* 21 ± 2.4
acetophenone 1.4 ± 0.1
4-octanone* 17 ± 2.4
pulegone* 39 ± 7.9
cycloundecanone* 53 ± 5.7
3-methyl-2-hexanone 3.8 ± 2.0
2-methyl cyclohexanone 4.2 ± 1.4
2-heptanone 5.0 ± 0.6
Alcohols
cis-4-hexen-1-ol* 14 ± 2.3
nonanol* 41 ± 3.8
decanol* 31 ± 6.7
Aldehydes
hexanal 2.1 ± 0.4
octanal* 28 ± 7.6
salicaldehyde 4.8 ± 0.1
Amines
N,N-dimethylisopropylamine* 60 ± 8.0
octylamine* 76 ± 8.1
Pyridines/ Pyrrolidones/Pyrrolidinones
2,4,6-collidine* 10 ± 1.0
1-dodecyl-2-pyrrolidinone* 29 ± 1.5
1-methyl-2-pyrrolidone 7 ± 2.3
2-methyl-3-oxazolidinone 6 ± 1.7
Alkanes/Alkenes/Alkynes
nonane 4.2 ± 0.3
cyclopentane 3.9 ± 0.1
1-pentene 7 ± 2.6
Int J Pharm. Author manuscript; available in PMC 2011 October 15.

NIH
-PA Author Manuscript
NIH
-PA Author Manuscript
NIH
-PA Author Manuscript
Yerramsetty et al. Page 20
CPE RF = R0/R6
1-pentyne 3.5 ± 0.3
2-methylbutane 2.1 ± 0.2
Halogenoalkanes/alkenes
1-bromopropane 1.7 ± 0.4
1,2-dichloropropane 3.3 ± 0.8
2,3-dichloro-1-propene* 12 ± 2.4
Other
cetyltrimethyl ammoniumbromide*
19.4 ± 0.1
2-chlorotoluene* 53 ± 7.2
toluene* 16 ± 3.1
dimethyldisulfide* 53 ± 9.0
2-sec-butylphenol * 86 ± 21.7
methyl caproate 6.7 ± 0.7
ethyl 2-methylpentanoate 3.0 ± 0.8
ethylbutyrate 2 ± 1.0
Int J Pharm. Author manuscript; available in PMC 2011 October 15.

NIH
-PA Author Manuscript
NIH
-PA Author Manuscript
NIH
-PA Author Manuscript
Yerramsetty et al. Page 21
Table 3
Cumulative insulin permeated per cm2, permeability coefficient (Kp) values and lag times (Lt) of insulin in thepresence of the CPEs. Values are means and standard deviations of at least three repetitions.
Insulin
CPE
Cumulative insulinpermeated (IU/cm2)
Permeability Kp(10−3 cm/hr)
Lag timeLt (hr)
none (control) 1.2 ± 0.2 0.7 ± 0.1 6.3 ± 0.9
Acids
octanoic acid 9 ± 1.6 4.9 ± 0.8 12 ± 2.2
decanoic acid 9 ± 2.7 5 ± 1.4 12 ± 1.8
oleic acid 7 ± 1.3 3.8 ± 0.6 10 ± 1.3
lauric acid 12 ± 4.2 6 ± 2.2 5 ± 2.2
Ketones
menthone 5 ± 1.2 2.4 ± 0.7 9 ± 2.6
4-octanone 8 ± 1.9 4 ± 1.0 8 ± 3.0
pulegone 3.3 ± 0.5 1.7 ± 0.3 10 ± 2.1
cycloundecanone 10 ± 1.0 5.0 ± 0.4 12 ± 2.4
Alcohols
cis-4-hexen-1-ol 3.9 ± 0.6 2.4 ± 0.5 12 ± 2.1
nonanol 7 ± 1.1 3.7 ± 0.5 9 ± 1.2
decanol 8.8 ± 0.5 4.6 ± 0.3 7 ± 1.9
Aldehydes
octanal 10 ± 1.1 5.0 ± 0.6 8 ± 3.0
Amines
N,N-dimethylisopropyl
amine
5 ± 1.8 2.8 ± 0.9 10 ± 1.8
octylamine 7 ± 2.6 4 ± 1.3 10 ± 3.9
Pyridines/ Pyrrolidones/Pyrrolidinones
2,4,6-collidine 2.5 ± 0.2 1.3 ± 0.1 10 ± 1.3
1-dodecyl-2-pyrrolidinone
2.2 ± 0.2 1.1 ± 0.1 9 ± 1.2
Halogenoalkanes/alkenes
2,3-dichloro-1-propene
18 ± 1.1 10 ± 1.3 10 ± 0.5
Other
cetyltrimethylammonium
bromide
4.7 ± 0.6 2.4 ± 0.3 11 ± 3.3
2-chlorotoluene 14 ± 4.2 8 ± 2.1 9 ± 2.6
toluene 22 ± 5.3 12 ± 5.0 3 ± 1.6
dimethyldisulfide 11 ± 1.2 5.8 ± 0.6 7 ± 1.1
2-sec-butylphenol 11 ± 1.6 5.6 ± 0.8 10 ± 3.2
Int J Pharm. Author manuscript; available in PMC 2011 October 15.

NIH
-PA Author Manuscript
NIH
-PA Author Manuscript
NIH
-PA Author Manuscript
Yerramsetty et al. Page 22
Table 4
Histological evaluation of potential CPEs at 5% w/v concentration
CPE Grade CPE Grade
menthone D octanal A
decanol B cycloundecanone B
oleic acid A cis-4-hexen-1-ol A
4-octanone B 2,4,6-collidine A
Int J Pharm. Author manuscript; available in PMC 2011 October 15.
Copyright © 2022 FDOKUMEN