split spoon penetration testing in gravels - Open Collections
Upload
khangminh22Category
view
1download
0
Citation: Sarango-Granda, P.;
Espinoza, L.C.; Díaz-Garrido, N.;
Alvarado, H.; Rodríguez-Lagunas,
M.J.; Baldomá, L.; Calpena, A. Effect
of Penetration Enhancers and Safety
on the Transdermal Delivery of
Apremilast in Skin. Pharmaceutics
2022, 14, 1011. https://doi.org/
10.3390/pharmaceutics14051011
Academic Editors: Jianqing Gao and
Bozena B. Michniak-Kohn
Received: 14 March 2022
Accepted: 27 April 2022
Published: 7 May 2022
Publisher’s Note: MDPI stays neutral
with regard to jurisdictional claims in
published maps and institutional affil-
iations.
Copyright: © 2022 by the authors.
Licensee MDPI, Basel, Switzerland.
This article is an open access article
distributed under the terms and
conditions of the Creative Commons
Attribution (CC BY) license (https://
creativecommons.org/licenses/by/
4.0/).
pharmaceutics
Article
Effect of Penetration Enhancers and Safety on the TransdermalDelivery of Apremilast in SkinPaulo Sarango-Granda 1,2,3 , Lupe Carolina Espinoza 2,3,* , Natalia Díaz-Garrido 4,5 , Helen Alvarado 1,María J. Rodríguez-Lagunas 4,6 , Laura Baldomá 4 and Ana Calpena 1,2
1 Department of Pharmacy, Pharmaceutical Technology and Physical Chemistry, Faculty of Pharmacy and FoodSciences, University of Barcelona, 08028 Barcelona, Spain; [email protected] (P.S.-G.);[email protected] (H.A.); [email protected] (A.C.)
2 Institute of Nanoscience and Nanotechnology (IN2UB), University of Barcelona, 08028 Barcelona, Spain3 Departamento de Química, Universidad Técnica Particular de Loja, Loja 1101608, Ecuador4 Department of Biochemistry and Physiology, Faculty of Pharmacy and Food Sciences, University of Barcelona,
08028 Barcelona, Spain; [email protected] (N.D.-G.); [email protected] (M.J.R.-L.);[email protected] (L.B.)
5 Institute of Biomedicine of the University of Barcelona (IBUB), Sant Joan de Déu Research Institute,08028 Barcelona, Spain
6 Nutrition and Food Safety Research Institute (INSA-UB), 08921 Santa Coloma de Gramenet, Spain* Correspondence: [email protected]; Tel.: +593-7-370-1-444
Abstract: The poor water solubility of apremilast (APR) is the main impediment to the penetrationof the drug through the skin barrier. The objective of this study was to evaluate the permeability ofAPR in different solutions enriched with penetration promoters in ex vivo samples of human skin,and additionally assess its tolerance in vivo. To this end, APR solutions with 5% promoter weredeveloped, and the drug’s ability to penetrate human abdominal skin samples was evaluated; thecoefficients of permeability, cumulated amounts permeated, and flow were some of the parametersevaluated; likewise, the in vitro and in vivo tolerance of the solutions was evaluated. The resultsobtained showed that the solutions containing squalene as a promoter improved the penetrationof APR compared to the other promoters evaluated; in the same way, on an in vitro scale in HaCaTcells, the promoters were not toxic, finding a cell viability greater than 80% at the different dilutionsevaluated. In the in vivo tests carried out with the solution that presented the best results (APR-Squalene solution), it was observed that it does not cause irritation or erythema on the skin after itscolorimetric and histological evaluation of the dorsal region of rats after its application. Squalenebecomes an excellent candidate to improve the permeability of the drug in the case of the developmentof a topical formulation; in addition, it was confirmed that this penetration enhancer is neither toxicnor irritating when in contact with the skin in in vivo tests.
Keywords: apremilast; squalene; skin; promoter
1. Introduction
The transdermal drug administration consists of the application of a pharmaceuticalproduct on the skin; the drug penetrates through the epidermis and the dermis and, inmany cases, a dermal microcirculation can occur [1]. Transdermal administration providesa non-invasive alternative (unlike the parenteral route), minimizes the risk of toxic sideeffects, and avoids pre-systemic metabolism (oral route), improving bioavailability [2].Pharmaceutical products, when administered to the skin, and upon contact and penetrationthrough its layers, encounter dendritic cells (epidermis and dermis) that play a crucial rolein immune responses [3]. There are some strategies to facilitate and enhance transdermaldrug permeation including the use of penetration enhancers as well as laser and lightdevices in fractional mode [4].
Pharmaceutics 2022, 14, 1011. https://doi.org/10.3390/pharmaceutics14051011 https://www.mdpi.com/journal/pharmaceutics
Pharmaceutics 2022, 14, 1011 2 of 17
The skin represents 16% of the total body mass (in an average person) and fulfills aprotective barrier function. The skin allows the body to protect itself from the externalenvironment and water loss [5,6]. The skin is divided into three sections, the epidermis,dermis, and hypodermis [7]. The possible routes of drug penetration through these layers ofthe skin are known as transepidermal and transappendageal routes [8]. The transepidermalroute consists of the passage of the drug through the stratum corneum (a multicellular layerthat is subdivided into several layers); this type of penetration can be intracellular (throughcorneocytes, keratinocytes, the transport of hydrophilic compounds prevails) or intercel-lular (transport of lipid compounds through intercellular spaces). The transappendegeanroute, on the other hand, consists of the passage of molecules through the hair follicles andsweat glands [9,10]
Penetration enhancers are substances that facilitate the transport of the drug throughthe skin; their properties include that they are mostly colorless and odorless substances,pharmacologically inert, specific in their mode of action, physically and chemically stable,non-toxic, non-irritating, non-allergenic, and have a reversible action [11]. Penetrationenhancers act primarily on the stratum corneum and may influence drug diffusion throughit or change partitioning in the stratum corneum; the most common penetration enhancersinclude fatty acids, alkanes, esters, terpenes, cyclodextrins, surfactants, and azone, amongothers [12,13].
Apremilast (APR) is a selective inhibitor of phosphodiesterase IV. The mechanism of ac-tion of this drug consists of modulating a series of proinflammatory and anti-inflammatorymediators (for example: TNFα, IL-23, IL-10, and IL-17), this modulation is achieved byincreasing the levels of cyclic adenosine monophosphate (cAMP) intracellular [14]. APR iseffective for the treatment of psoriasis, an autoimmune and chronic disease that is charac-terized by thick patches of inflamed, scaly skin due to an excessive proliferation of skincells whose treatment is based on control of symptoms using phototherapy, and systemicand topical therapies with different drugs including corticosteroids, vitamin D3 analogues,methotrexate, acitretin, cyclosporine, and biological-targeted agents such as ustekinumab,secukinumab, and ixekizumab [15]. APR administration is currently approved, in the formof oral tablets of 10, 20, and 30 mg, manufactured and marketed by the Celgene Corporationunder the trade name of Otezla, indicated for patients with psoriatic arthritis, and mod-erate to severe psoriasis, and patients with Behcet’s syndrome [16,17]. The effectivenessof this drug is limited by its side effects such as diarrhea, nausea, depression, and weightloss [18]. For this reason, the development of alternative administration forms, such astopical formulations, are attractive for local anti-inflammatory therapy; some research hascovered this field with the development of nanocarriers incorporated into gels in somecases to improve the administration and bioavailability of APR [19–23].
The poor water solubility of APR is the main impediment to the penetration of thedrug through the skin barrier (stratum corneum). Therefore, the objective of this studyis based on evaluating the permeability of APR contained in a solution with differentpenetration promoters in ex vivo samples of human skin, and at the same time to evaluatetheir tolerance in vivo.
2. Materials and Methods2.1. Materials
APR (purity: 99.6%; MW: 460.5 g/mol) was acquired from Wuhan Senwayer CenturyChemical (Wuhan, China). Gattefossé (Barcelona, Spain) supplied Transcutol® P [Diethy-lene glycol monoethyl ether]. The permeation promoters Azone® [1-dodecylazacycloheptan-2-one] was supplied by Durham Pharmaceuticals (Durham, UK). Carene [3-Carene], De-canol [1-Decanol], Limonene [(S)-4-Isopropenyl-1-methyl cyclohexene], Menthone [(2S,5R)-2-Isopropyl-5-methyl cyclohexanone], Nonane [n-Nonane], Pinene [(+)-α-Pinene], andSqualene [2,6,10,15,19,23-Hexamethyltetracosane] were purchased from Sigma Aldrich(Madrid, Spain). Reagents for histological procedures were purchased from Sigma andThermo Fisher Scientific (Barcelona, Spain). Reagents for cellular assays, HaCaT cell lines,

Pharmaceutics 2022, 14, 1011 3 of 17
and 3-[4,5-Dimethylthiazol-2-yl]-2,5- diphenyltetrazolium bromide (MTT) cell-proliferationassay were obtained from Gibco (Cacavelos, Portugal), Cell Line Services (Eppelheim,Germany), and Sigma (Barcelona, Spain), respectively. Ultrapure water was obtained fromWater Millipore MilliQ purification system (Millipore Corporation, Burlington, VT, USA),and all the other chemical reagents used were analytical grade.
2.2. Validation of Analytical Method
An analytical method was validated by high performance liquid chromatography(HPLC) for the identification and quantification of APR. The HPLC system is detailed inprevious studies [21].
A 200 µg/mL stock solution was prepared. Different calibration curves were preparedfrom the stock solution in two ranges and five concentrations of each. The injection volumefor the low range was 50 µL and the high range was 20 µL:
Low range: 0.156, 0.313, 0.625, 1.25, 2.5 and 5 µg/mL.High range: 5, 10, 20, 50, 75, and 100 µg/mL.Data was collected and processed using Empower 3 software (Waters, Milford, CT,
USA). Method validation was carried out in accordance with the International Conferenceon Harmonization (ICH) Q2A and ICH Q2B Guidelines [24]:
LinearityThe linearity of five calibration curves at two ranges, each with six concentration
levels, was evaluated. The correlation coefficient (r2) obtained after the least squareslinear regression analysis of the calibration lines was evaluated; in addition, the linearityratios were evaluated using a one-way analysis of variance (ANOVA) test comparing theconcentration of the standards. In relation to the areas obtained from them, this statisticaltreatment was carried out using the Graph Pad Prism® 5.0 software.
Accuracy and PrecisionFive calibration curves were performed on different days at two concentration levels:
0.156–5 µg/mL and 5–100 µg/mL. Accuracy was expressed as the percentage of relativeerror (%RE) (Equation (1)). Precision was defined as the relative standard deviation (%RSD)or correlation coefficient:
%RE =C0 − Cn
Cn(1)
where, C0 is the observed concentration; Cn is the nominal concentration and %RE repre-sents the mean percentage deviation (% relative error).
SpecificityThe specificity of the method was evaluated by the absence of interference in the
retention time of the analyte. Volumes of 20–50 µL were injected and the chromatographicprofiles were analyzed at a wavelength of 230 nm. Five different samples were evaluated: (i)mobile phase blank, (ii) APR standard, (iii) skin blank as control, (iv) APR sample releasedthrough the skin, and (v) APR sample retained in skin.
SensitivitySensitivity was measured by determining the limits of detection (LOD) and quantifica-
tion (LOQ). The LOD and LOQ were measured as a function of the standard deviation ofthe response and the slope of the calibration curve. LOD and LOQ were calculated by:
LOD =
[(3.3 s)
p
](2)
LOD =
[(10 s)
p
](3)
where, s is the standard deviation of the Y-intercept, and p is the slope of the calibra-tion curve.
Pharmaceutics 2022, 14, 1011 4 of 17
2.3. Apremilast Solution Preparation
APR solution was prepared by dissolving APR in Transcutol® P: water (60:40 v/v) andthe addition of 5% v/v penetration enhancer (Table 1). A solution with a concentration of1.5 mg/mL was obtained.
Table 1. Permeation enhancer used in this study.
MolecularFormula Molecular Mass Permeation
Enhancer SubstanceCAS RegisterNumber
C18H35NO 281.5 g/mol Azone® 59227-89-3C10H16 136.2 g/mol Carene 13466-78-9C10H16 136.24 g/mol Limonene 5989-27-5C10H18O 154.25 g/mol Menthone 14073-97-3C9H20 128.25 g/mol Nonane 111-84-2C10H16 136.23 g/mol Alpha-Pinene 80-56-8C30H62 422.8 g/mol Squalene 111-01-3
2.4. Ex Vivo Skin Permeation Test
The permeation of the drug through the skin was determined using the Franz diffusiontechnique [25]. Franz diffusion cells (Hanson Research, Chatsworth, CA, USA; Crown GlassCompany, New Jersey, NJ, USA), with a diffusion area of 0.64 cm2 and receptor compart-ment of 6 mL, were used. Samples of abdominal human skin (Hospital de Barcelona, SCIAS,Barcelona, Spain) were used for this experiment in accordance with the Ethics Committeeof the Hospital de Barcelona (17 January 2020). Human skin was dermatomized to 400 µmthickness with an Aesculap GA 630 dermatome (Aesculap, Tuttligen, Germany). The skinwas equilibrated for 30 min and the integrity of the skin was evaluated based on its TEWLusing Tewameter TM 300 (Courage & Khazaka Electronics GmbH, Cologne, Germany);those that met an acceptance criterion of TEWL less than 10 g m−2 h−1 were used [26].The receptor medium consisted of Transcutol® P: Water (60:40 v/v) in order to maintainsink conditions [27]. The assay was carried out at controlled temperature of 32 ± 0.5 ◦Cand magnetic stirring of 500 r.p.m. Aliquots of 500 µL (APR-solutions 1.5 mg/mL) wereadded to the donor compartment of each cell. APR solution without promoter was used asa control (No promotor). Then, 200 µL aliquots were removed from the receptor compart-ment and replaced by the same volume of medium at different time intervals including 0(pre sample time point), 14, 17, 20, 23, and 24 h. The samples obtained were quantified byHPLC as described in Section 2.2. Table 2 details the experimental conditions of the ex vivopermeation test. All solutions were made with skin from the same donor in triplicate, inthis way an attempt is made to reduce the interindividual variability of the response due tobiological differences.
Table 2. Experimental conditions for Ex vivo skin permeation test.
Condition Description
Receptor fluid: Transcutol® P: Water (60:40 v/v)Cell volume: 6 mLDiffusion area: 0.64 cm2
Membrane: Human skinThickness: 400 µmReplicates: 3 replicatesTemperature: 32 ± 0.5 ◦CStirring: 500 r.p.m.Dose: 500 µL (1.5 mg/mL)Sample volume: 200 µLSampling times: 0 (pre-sample time point), 14, 17, 20, 23 and 24 h
Pharmaceutics 2022, 14, 1011 5 of 17
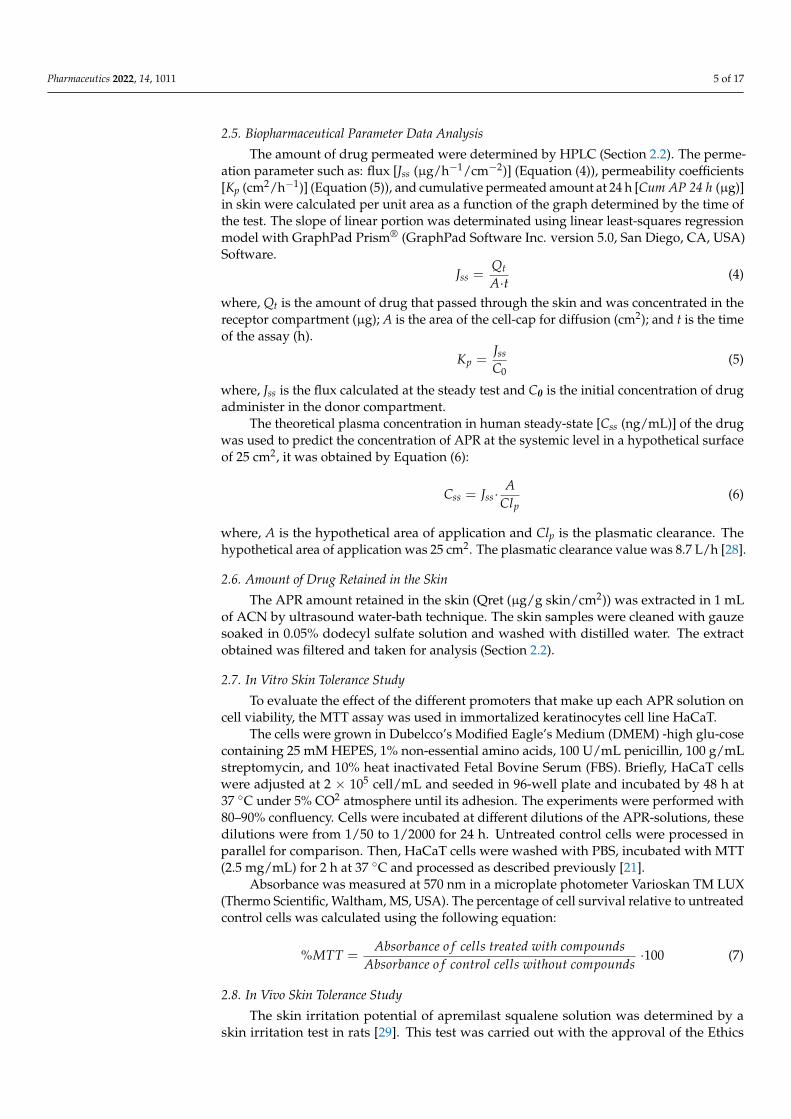
2.5. Biopharmaceutical Parameter Data Analysis
The amount of drug permeated were determined by HPLC (Section 2.2). The perme-ation parameter such as: flux [Jss (µg/h−1/cm−2)] (Equation (4)), permeability coefficients[Kp (cm2/h−1)] (Equation (5)), and cumulative permeated amount at 24 h [Cum AP 24 h (µg)]in skin were calculated per unit area as a function of the graph determined by the time ofthe test. The slope of linear portion was determinated using linear least-squares regressionmodel with GraphPad Prism® (GraphPad Software Inc. version 5.0, San Diego, CA, USA)Software.
Jss =Qt
A·t (4)
where, Qt is the amount of drug that passed through the skin and was concentrated in thereceptor compartment (µg); A is the area of the cell-cap for diffusion (cm2); and t is the timeof the assay (h).
Kp =Jss
C0(5)
where, Jss is the flux calculated at the steady test and C0 is the initial concentration of drugadminister in the donor compartment.
The theoretical plasma concentration in human steady-state [Css (ng/mL)] of the drugwas used to predict the concentration of APR at the systemic level in a hypothetical surfaceof 25 cm2, it was obtained by Equation (6):
Css = Jss·A
Clp(6)
where, A is the hypothetical area of application and Clp is the plasmatic clearance. Thehypothetical area of application was 25 cm2. The plasmatic clearance value was 8.7 L/h [28].
2.6. Amount of Drug Retained in the Skin
The APR amount retained in the skin (Qret (µg/g skin/cm2)) was extracted in 1 mLof ACN by ultrasound water-bath technique. The skin samples were cleaned with gauzesoaked in 0.05% dodecyl sulfate solution and washed with distilled water. The extractobtained was filtered and taken for analysis (Section 2.2).
2.7. In Vitro Skin Tolerance Study
To evaluate the effect of the different promoters that make up each APR solution oncell viability, the MTT assay was used in immortalized keratinocytes cell line HaCaT.
The cells were grown in Dubelcco’s Modified Eagle’s Medium (DMEM) -high glu-cosecontaining 25 mM HEPES, 1% non-essential amino acids, 100 U/mL penicillin, 100 g/mLstreptomycin, and 10% heat inactivated Fetal Bovine Serum (FBS). Briefly, HaCaT cellswere adjusted at 2 × 10⁵ cell/mL and seeded in 96-well plate and incubated by 48 h at37 ◦C under 5% CO2 atmosphere until its adhesion. The experiments were performed with80–90% confluency. Cells were incubated at different dilutions of the APR-solutions, thesedilutions were from 1/50 to 1/2000 for 24 h. Untreated control cells were processed inparallel for comparison. Then, HaCaT cells were washed with PBS, incubated with MTT(2.5 mg/mL) for 2 h at 37 ◦C and processed as described previously [21].
Absorbance was measured at 570 nm in a microplate photometer Varioskan TM LUX(Thermo Scientific, Waltham, MS, USA). The percentage of cell survival relative to untreatedcontrol cells was calculated using the following equation:
%MTT =Absorbance o f cells treated with compounds
Absorbance o f control cells without compounds·100 (7)
2.8. In Vivo Skin Tolerance Study
The skin irritation potential of apremilast squalene solution was determined by askin irritation test in rats [29]. This test was carried out with the approval of the Ethics
Pharmaceutics 2022, 14, 1011 6 of 17
Committee of the University of Barcelona and the Bellvitge Establishment, Barcelona, Spain(number 387/18, 26 November 2018).
Sprague Dawel rats (600–700 g) (n = 12) divided in three groups (n = 4) in a room withcontrolled temperature and humidity with food and water ad libitum, were used. The firstgroup was treated with APR solution enriched with squalene (APR-Squalene solution),the second group was treated only with squalene solution without drug (Blank-Squalenesolution), and the third group correspond to the positive control (Treatment with 0.8 mL ofXylol). The rats were shaved in the dorsal area 24 h before starting the test. Three areaswere drawn in the dorsal region of the animal.
2.8.1. Biomechanical Skin Properties Evaluation
Stratum corneum hydration (SCH) was measured in the basal state and ten minutesafter the application of APR-Squalene and Blank-Squalene solutions in the treated areausing a CM-825 Corneometer (Courage & Khazaka Electronics GmbH, Köln, Germany).
2.8.2. Colorimetric Parameters
The possible changes at the skin level after the application of APR-Squalene solutionand Blank-Squalene solution were evaluated through the color differences in the skin ofthe rat dorsal region with respect to the basal color, this assay was performed according toa study by Limon et al., 2017 [30] modified.
Skin color detection was performed on the dorsal area of the rats, using an MPA5Multiprobe adapter with CL400 skin colorimeter probe from Courage + Khazaka electronicGmbH, Köln, Germany. The measuring probe on contact with the skin emitted a white LEDlight that homogeneously illuminated the area where it was applied; the light scattered onthe skin is detected by the probe and expressed as light intensity: R, red; G, green; and B,white, on a numerical scale from 0 to 255 each.
A first measurement (basal value) was performed and then the addition of Xyloland APR-Squalene solution (or Blank-Squalene solution) was performed as indicated inSection 2.5.
The color determinations were performed 10 min after the application of the varioussolutions. The colors found were reproduced with the Microsoft Excel program from theRGB codes.
The treatment of the RGB color data obtained A (R1, G1, B1) and B (R2, G2, B2); thedifference was obtained by calculating the linear distance in space between the two pointsand subsequently evaluating the distance; the following geometric equation was used forthe linear distance: ∣∣∣∣ →AB
∣∣∣∣ = √(R2 − R1)2 + (G2 − G1)
2 + (B2 − B1)2 (8)
From the results of the linear distance, the direction of the distance was determinedthrough the determination of the general difference of the light intensity, using the followingequation:
∆intensity = (R2 − R1) + (G2 − G1) + (B2 − B1) (9)
A negative result corresponds to a darker coloration, which is indicative of erythemaand was assigned a value (+1), and a positive result corresponds to a lighter coloration,which indicates less erythema and was assigned a value (−1).
Finally, the difference between the two colors was obtained by multiplying the lineardistance by the direction of the distance; the mean values obtained initially (basal) andthose obtained after the induction of vasodilatation (application of xylol) were calculatedand considered as 0% and 100%, respectively.
Consequently, the values obtained from the samples were calculated with respect tothose obtained with 100% and in this way the sequence of the different stages of evolutionof the erythema was traced.

Pharmaceutics 2022, 14, 1011 7 of 17
2.8.3. Histological Analysis
Rat skin biopsies were stored in cassettes for 24 h in 4% formaldehyde, the cassetteswere washed by immersion in PBS (3 washes at 1 h intervals) and stored in 96% ethanol.
The samples were fixed in paraffin; sections of 6-µm thickness were stained withhematoxylin and eosin.
The samples were observed through a suitable Olympus BX41 microscope with anOlympus XC50 camera.
3. Results3.1. Validation of Analythical Method
The conditions such as linearity, accuracy, precision, specificity, and sensitivity showthat the method is specific for the detection and quantification of APR.
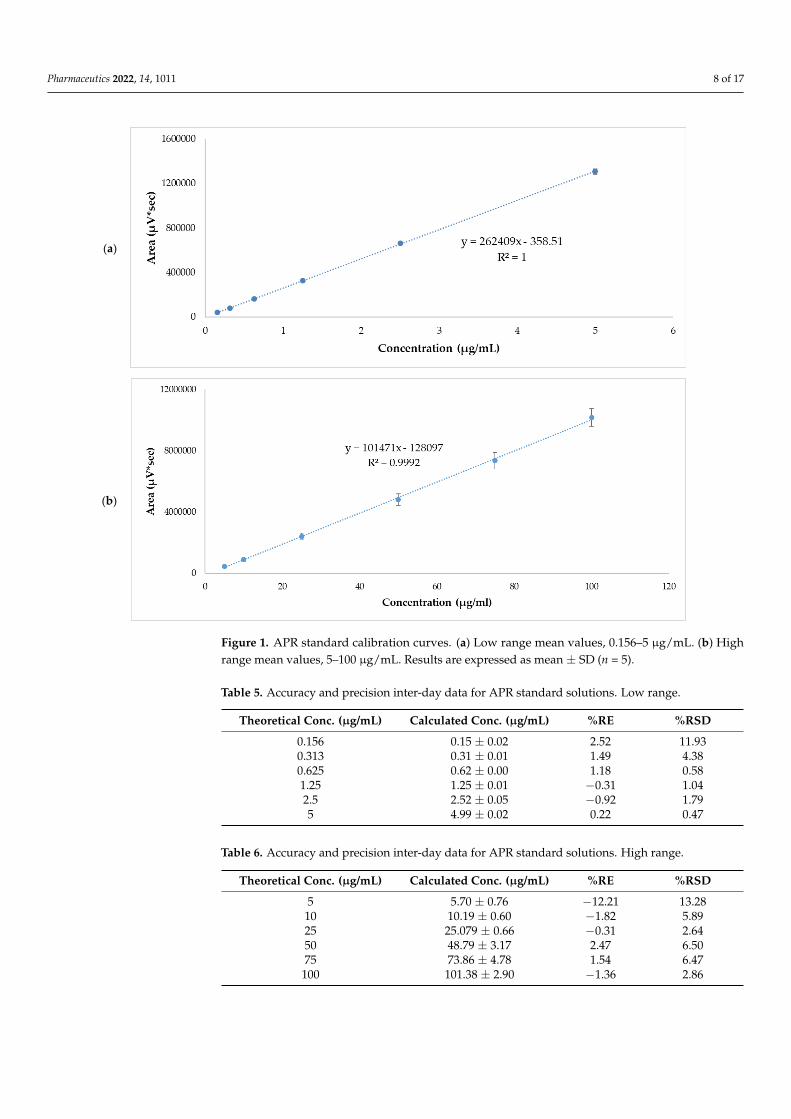
Linearity was evaluated from five calibration curves at two concentration levelsranging from 0.156–5 µg/mL and 5–100 µg/mL. Tables 3 and 4 show the areas obtainedfrom each standard concentration. The r2 values of each of the calibration lines were >0.999.The graphic representation of mean values are shown in Figure 1. The statistical analysis ofvariance (ANOVA) showed that there were no statistically significant differences betweenthe response areas obtained (p = 0.06 for low range and p = 0.39 for high range.
Table 3. Standard APR curve and respective area response factor. Low range.
Concentration (µg/mL) Ratio 1 Ratio 2 Ratio 3 Ratio 4 Ratio 5
0.156 252,307.69 269,166.67 249,397.44 256,782.05 242,217.950.313 260,434.50 262,038.34 256,102.24 249,444.09 259,776.360.625 264,326.40 258,344.00 253,980.80 256,646.40 260,494.401.25 265,984.00 263,853.60 257,673.60 260,917.60 266,177.602.5 268,948.00 266,495.20 261,592.80 261,648.80 264,435.205 254,123.20 265,660.60 263,674.80 260,534.60 264,838.60
Table 4. Standard APR curve and respective area response factor. High range.
Concentration (µg/mL) Ratio 1 Ratio 2 Ratio 3 Ratio 4 Ratio 5
5 109,557.800 74,592.400 82,219.400 99,394.400 84,412.60010 106,052.700 73,916.800 93,962.200 93,504.300 85,729.50025 107,647.960 86,377.760 91,944.640 100,525.680 97,117.12050 103,422.940 87,307.680 105,285.220 90,515.760 95,526.08075 104,525.933 95,189.893 87,206.813 100,035.547 103,939.733100 104,007.780 93,685.270 104,641.200 107,957.790 97,844.260
The accuracy and precision of the method were obtained through the analysis ofsamples with an APR standard concentration of 0.156–5 µg/mL and 5–100 µg/mL. Theresults are expressed as %RE and %RSD, for accuracy and precision, respectively. The dataare reported in Tables 5 and 6. These results show good precision with 11.93% and 13.28 forlow and high range, respectively. The accuracy of the method was 2.54% and −12.21% forlow and high range, respectively, for lowest standard concentration.
The analytical method was considered specific because it demonstrated that there isno interference in the identification and retention time of APR (Figure 2). The retentiontime of APR was 3.3 min.
Pharmaceutics 2022, 14, 1011 8 of 17
Pharmaceutics 2022, 14, x FOR PEER REVIEW 8 of 18
reported in Tables 5 and 6. These results show good precision with 11.93% and 13.28 for
low and high range, respectively. The accuracy of the method was 2.54% and −12.21% for
low and high range, respectively, for lowest standard concentration.
(a)
(b)
Figure 1. APR standard calibration curves. (a) Low range mean values, 0.156 - 5 µg/mL. (b) High
range mean values, 5 - 100 µg/mL. Results are expressed as mean ± SD (n = 5).
Table 5. Accuracy and precision inter-day data for APR standard solutions. Low range.
Theoretical Conc.
(µg/mL) Calculated Conc. (µg/mL) %RE %RSD
0.156 0.15 ± 0.02 2.52 11.93
0.313 0.31 ± 0.01 1.49 4.38
0.625 0.62 ± 0.00 1.18 0.58
1.25 1.25 ± 0.01 −0.31 1.04
2.5 2.52 ± 0.05 −0.92 1.79
5 4.99 ± 0.02 0.22 0.47
Figure 1. APR standard calibration curves. (a) Low range mean values, 0.156–5 µg/mL. (b) Highrange mean values, 5–100 µg/mL. Results are expressed as mean ± SD (n = 5).
Table 5. Accuracy and precision inter-day data for APR standard solutions. Low range.
Theoretical Conc. (µg/mL) Calculated Conc. (µg/mL) %RE %RSD
0.156 0.15 ± 0.02 2.52 11.930.313 0.31 ± 0.01 1.49 4.380.625 0.62 ± 0.00 1.18 0.581.25 1.25 ± 0.01 −0.31 1.042.5 2.52 ± 0.05 −0.92 1.795 4.99 ± 0.02 0.22 0.47
Table 6. Accuracy and precision inter-day data for APR standard solutions. High range.
Theoretical Conc. (µg/mL) Calculated Conc. (µg/mL) %RE %RSD
5 5.70 ± 0.76 −12.21 13.2810 10.19 ± 0.60 −1.82 5.8925 25.079 ± 0.66 −0.31 2.6450 48.79 ± 3.17 2.47 6.5075 73.86 ± 4.78 1.54 6.47
100 101.38 ± 2.90 −1.36 2.86

Pharmaceutics 2022, 14, 1011 9 of 17
Pharmaceutics 2022, 14, x. https://doi.org/10.3390/xxxxx www.mdpi.com/journal/pharmaceutics
(a)
(b)
Pharmaceutics 2022, 14, x FOR PEER REVIEW 2 of 2
(c)
(d)
Figure 2. Chromatograms. (a) Apremilast standard 0.156 µg/mL. (b) Apremilast standard 100 µg/mL.(c) Apremilast extracted from human skin after the permeation study. (d) Blank sample.
Pharmaceutics 2022, 14, 1011 10 of 17
The LOD and LOQ were calculated using the response standard deviation andthe slope of the calibration curve of 0.156–5 µg/mL and 5–100 µg/mL. From the flowand the Y-intersection of the five straight lines, the LOD for APR was established at0.04 ± 0.05 µg/mL for low range and 5.70 ± 4.25 µg/mL for high range; the LOQ for APRwas established at 0.11 ± 0.14 for low range and 17.28 ± 12.87 for high range. The methodis sensitive enough for the drug determination.
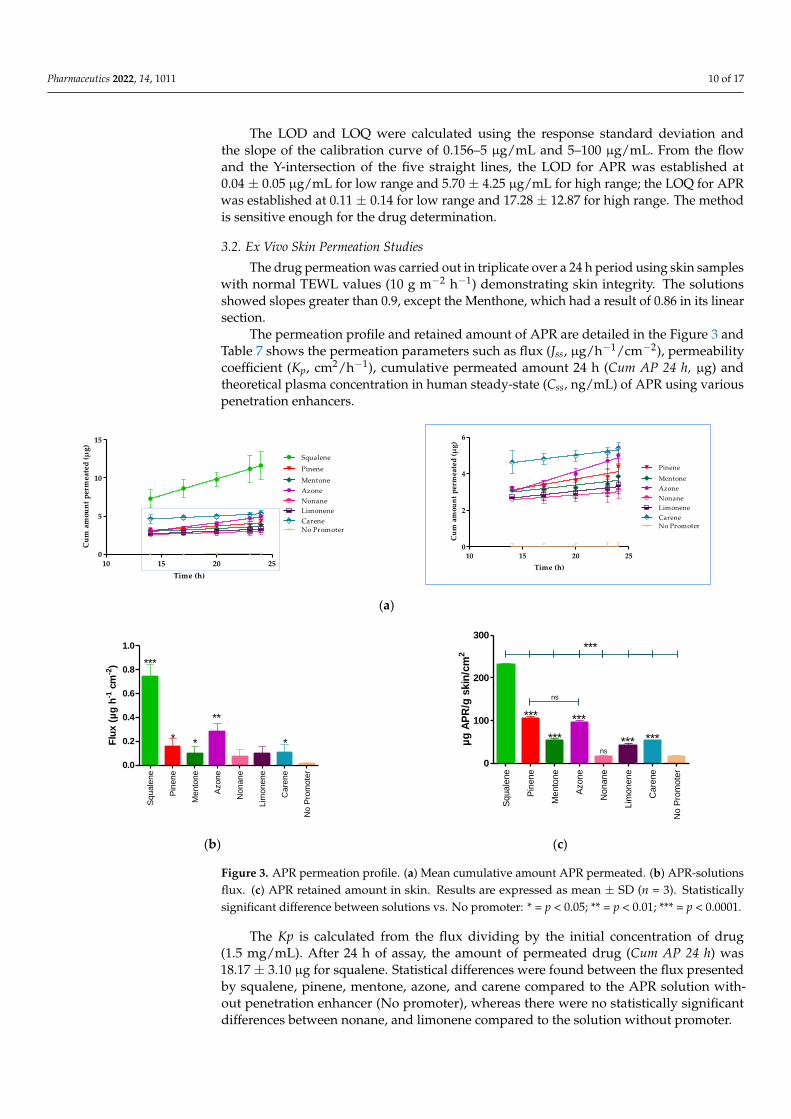
3.2. Ex Vivo Skin Permeation Studies
The drug permeation was carried out in triplicate over a 24 h period using skin sampleswith normal TEWL values (10 g m−2 h−1) demonstrating skin integrity. The solutionsshowed slopes greater than 0.9, except the Menthone, which had a result of 0.86 in its linearsection.
The permeation profile and retained amount of APR are detailed in the Figure 3 andTable 7 shows the permeation parameters such as flux (Jss, µg/h−1/cm−2), permeabilitycoefficient (Kp, cm2/h−1), cumulative permeated amount 24 h (Cum AP 24 h, µg) andtheoretical plasma concentration in human steady-state (Css, ng/mL) of APR using variouspenetration enhancers.
Pharmaceutics 2022, 14, x FOR PEER REVIEW 11 of 18
The APR retained amount was more evident in the presence of squalene, pinene, and
azone (Figure 3c) where squalene presented a greater amount retained (230.40 ± 4.50 µg/g
skin/cm2), showing statistically significant differences with pinene (104.99 ± 4.30 µg/g
skin/cm2) and azone (96.05 ± 3.10 µg/g skin/cm2).
Table 7. Biopharmaceutical parameters of Apremilast-solutions with and without penetration en-
hancer.
n = 3 Jss
(µg h−1 cm−2)
Kp
(cm2 h−1)
Cum AP 24 h
(µg)
Css
(ng/mL)
Qret
(µg/g skin/cm2)
Azone® 0.28 ± 0.07 e,g,h 1.88 × 10⁻⁴ e,g,h 8.15 ± 0.75 h 0.81 ± 0.01 a,c,e,h 96.05 ± 3.10 b,c,e,h
Carene 0.11 ± 0.06 g,h 7.21 × 10⁻⁵ g,h 8.41 ± 0.50 h 0.31 ± 0.05 h 52.27 ± 2.10 h
Limonene 0.10 ± 0.06 g 6.49 × 10⁻⁵ g 5.30 ± 0.92 h 0.28 ± 0.03 h 40.91 ± 5.50 h
Menthone 0.10 ± 0.06 g 6.67 × 10⁻⁵ g 6.01 ± 0.80 h 0.28 ± 0.05 a,e,h 52.61 ± 5.60 a,e,h
Nonane 0.07 ± 0.06 g 4.48 × 10⁻⁵ g 4.85 ± 0.90 h 0.19 ± 0.02 b,c,h 15.13 ± 4.20 b,c
Pinene 0.16 ± 0.06 g,h 1.04 × 10⁻⁴ g,h 6.84 ± 0.80 h 0.45 ± 0.02 d,a,e,c,b,h 104.99 ± 4.30 b,c,d,e,h
Squalene 0.74 ± 0.10 a,b,c,d,e,f,h 4.93 × 10⁻⁴ a,b,c,d,e,f,h 18.17 ± 3.10 a,b,c,d,e,f,h 2.13 ± 0.02 a,b,c,d,e,f,h 230.40 ± 4.50 a,b,c,d,e,f,h
No promoter 0.01 ± 0.01 3.8 × 10⁻⁶ 0.08 ± 0.30 0.02 ± 0.01 15.14 ± 2.40 a Azone; b Carene; c Limonene; d Menthone; e Nonane; f Pinene; g Squalene; h No promoter. Results
are expressed by mean ± SD (n = 3). One-way Analysis of Variance (ANOVA) with Tukey’s Multiple
Comparison Test were performed to assess the statistical significance between groups at (p < 0.05).
Underline value: Promoter enhancer that presents a greater retained amount of drug in the skin.
10 15 20 250
5
10
15
Squalene
Pinene
Mentone
Azone
Nonane
Limonene
Carene
No Promoter
Time (h)
Cu
m a
mou
nt
per
mea
ted
(µ
g)
10 15 20 250
2
4
6
Pinene
Mentone
Azone
Nonane
Limonene
Carene
No Promoter
Time (h)
Cu
m a
mou
nt
per
mea
ted
(µ
g)
(a)
Sq
ua
lene
Pin
en
e
Mento
ne
Azo
ne
No
nan
e
Lim
on
en
e
Ca
rene
No
Pro
mo
ter
0.0
0.2
0.4
0.6
0.8
1.0
***
* **
**
Flu
x (
µg
h-1
cm
-2)
Sq
ua
lene
Pin
en
e
Mento
ne
Azo
ne
No
nan
e
Lim
on
en
e
Ca
rene
No
Pro
mo
ter
0
100
200
300
***
***
***
*** ***ns
ns
***
µg
AP
R/g
skin
/cm
2
(b) (c)
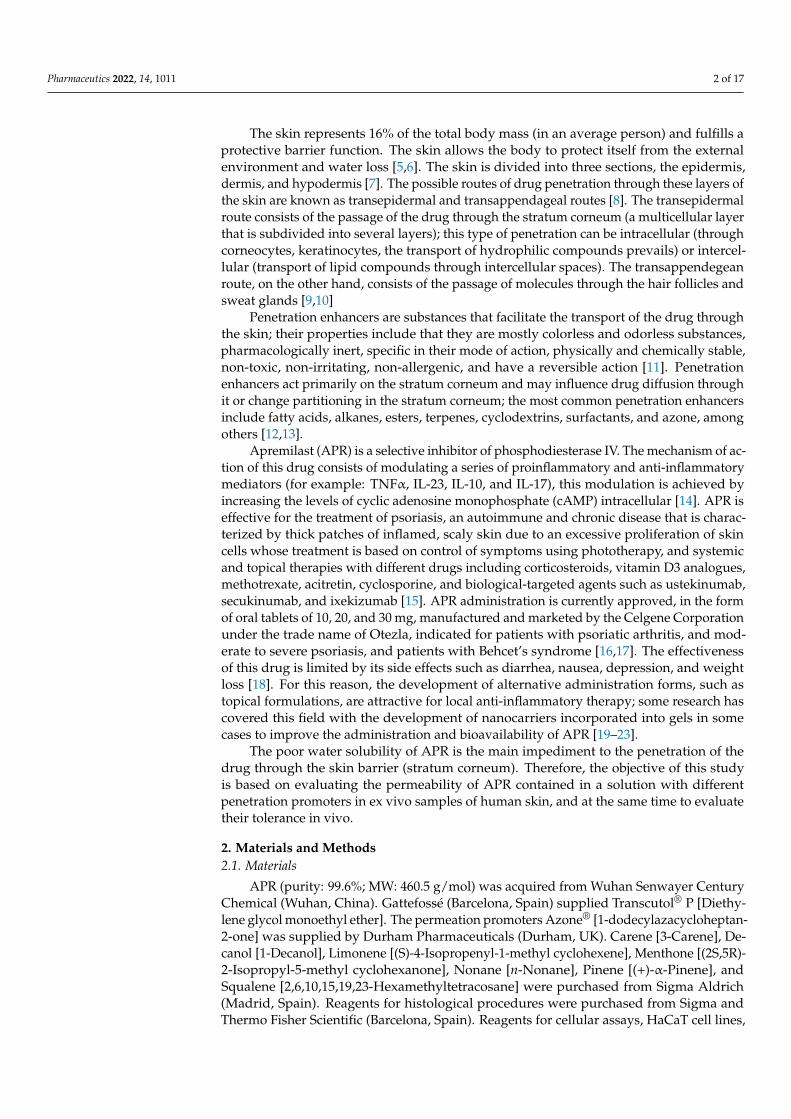
Figure 3. APR permeation profile. (a) Mean cumulative amount APR permeated. (b) APR-solutions
flux. (c) APR retained amount in skin. Results are expressed as mean ± SD (n = 3). Statistically sig-
nificant difference between solutions vs. No promoter: * = p < 0.05; ** = p < 0.01; *** = p < 0.0001.
Figure 3. APR permeation profile. (a) Mean cumulative amount APR permeated. (b) APR-solutionsflux. (c) APR retained amount in skin. Results are expressed as mean ± SD (n = 3). Statisticallysignificant difference between solutions vs. No promoter: * = p < 0.05; ** = p < 0.01; *** = p < 0.0001.
The Kp is calculated from the flux dividing by the initial concentration of drug(1.5 mg/mL). After 24 h of assay, the amount of permeated drug (Cum AP 24 h) was18.17 ± 3.10 µg for squalene. Statistical differences were found between the flux presentedby squalene, pinene, mentone, azone, and carene compared to the APR solution with-out penetration enhancer (No promoter), whereas there were no statistically significantdifferences between nonane, and limonene compared to the solution without promoter.

Pharmaceutics 2022, 14, 1011 11 of 17
Table 7. Biopharmaceutical parameters of Apremilast-solutions with and without penetration enhancer.
n = 3 Jss(µg h−1 cm−2)
Kp
(cm2 h−1)Cum AP 24 h
(µg)Css
(ng/mL)Qret
(µg/g skin/cm2)
Azone® 0.28 ± 0.07 e,g,h 1.88 × 10⁻⁴ e,g,h 8.15 ± 0.75 h 0.81 ± 0.01 a,c,e,h 96.05 ± 3.10 b,c,e,h
Carene 0.11 ± 0.06 g,h 7.21 × 10⁻⁵ g,h 8.41 ± 0.50 h 0.31 ± 0.05 h 52.27 ± 2.10 h
Limonene 0.10 ± 0.06 g 6.49 × 10⁻⁵ g 5.30 ± 0.92 h 0.28 ± 0.03 h 40.91 ± 5.50 h
Menthone 0.10 ± 0.06 g 6.67 × 10⁻⁵ g 6.01 ± 0.80 h 0.28 ± 0.05 a,e,h 52.61 ± 5.60 a,e,h
Nonane 0.07 ± 0.06 g 4.48 × 10⁻⁵ g 4.85 ± 0.90 h 0.19 ± 0.02 b,c,h 15.13 ± 4.20 b,c
Pinene 0.16 ± 0.06 g,h 1.04 × 10⁻⁴ g,h 6.84 ± 0.80 h 0.45 ± 0.02 d,a,e,c,b,h 104.99 ± 4.30 b,c,d,e,h
Squalene 0.74 ± 0.10 a,b,c,d,e,f,h 4.93 × 10⁻⁴ a,b,c,d,e,f,h 18.17 ± 3.10 a,b,c,d,e,f,h 2.13 ± 0.02 a,b,c,d,e,f,h 230.40 ± 4.50 a,b,c,d,e,f,h
Nopromoter 0.01 ± 0.01 3.8 × 10⁻⁶ 0.08 ± 0.30 0.02 ± 0.01 15.14 ± 2.40
a Azone; b Carene; c Limonene; d Menthone; e Nonane; f Pinene; g Squalene; h No promoter. Results are expressedby mean ± SD (n = 3). One-way Analysis of Variance (ANOVA) with Tukey’s Multiple Comparison Test wereperformed to assess the statistical significance between groups at (p < 0.05). Underline value: Promoter enhancerthat presents a greater retained amount of drug in the skin.
The APR retained amount was more evident in the presence of squalene, pinene, andazone (Figure 3c) where squalene presented a greater amount retained (230.40 ± 4.50 µg/gskin/cm2), showing statistically significant differences with pinene (104.99 ± 4.30 µg/gskin/cm2) and azone (96.05 ± 3.10 µg/g skin/cm2).
3.3. In Vitro Tolerance Studies or Cell Viability Studies
The toxicity of the seven permeation promoters used in this study was evaluated inskin cells (HaCaT cells) by the MTT assay. The results of treatment of HaCaT cells treatedwith different dilutions of the permeation promoters are shown in Figure 4.
Pharmaceutics 2022, 14, x FOR PEER REVIEW 12 of 18
3.3. In Vitro Tolerance Studies or Cell Viability Studies
The toxicity of the seven permeation promoters used in this study was evaluated in
skin cells (HaCaT cells) by the MTT assay. The results of treatment of HaCaT cells treated
with different dilutions of the permeation promoters are shown in Figure 4.
Most of the permeation promoters tested were found not to induce cytotoxicity in the
cells, except for azone which, at 1/100 dilution (highest concentration tested), induced cy-
totoxicity. The results suggested that the promoters evaluated do not generate skin irrita-
tion, but caution should be exercised with the use of azone; likewise, no correlation was
found between the results obtained for skin cell toxicity with reference to its effect on drug
penetration through the skin.
Figure 4. Effect of permeation promoters at different dilutions on the viability of HaCaT keratino-
cyte cells in vitro.
3.4. In Vivo Skin Tolerance Study
3.4.1. Biomechanical Skin Properties Evaluation
Hydration in the stratum corneum was evaluated after the application of the two
solutions (APR-Squalene solution and Blank-Squalene solution).
Topical application of these solutions on the skin significantly increased hydration in
stratum corneum. These results were predictable, taking into account that the solutions
are mostly made up of water and Transcutol.
These results suggest that the solutions with Squalene do not cause damage or irrita-
tion in the skin barrier (Figure 5).
Basal APR-Squalene Blank-Squalene 0
20
40
60
80
100
ns
******
SC
H (
a.u
)
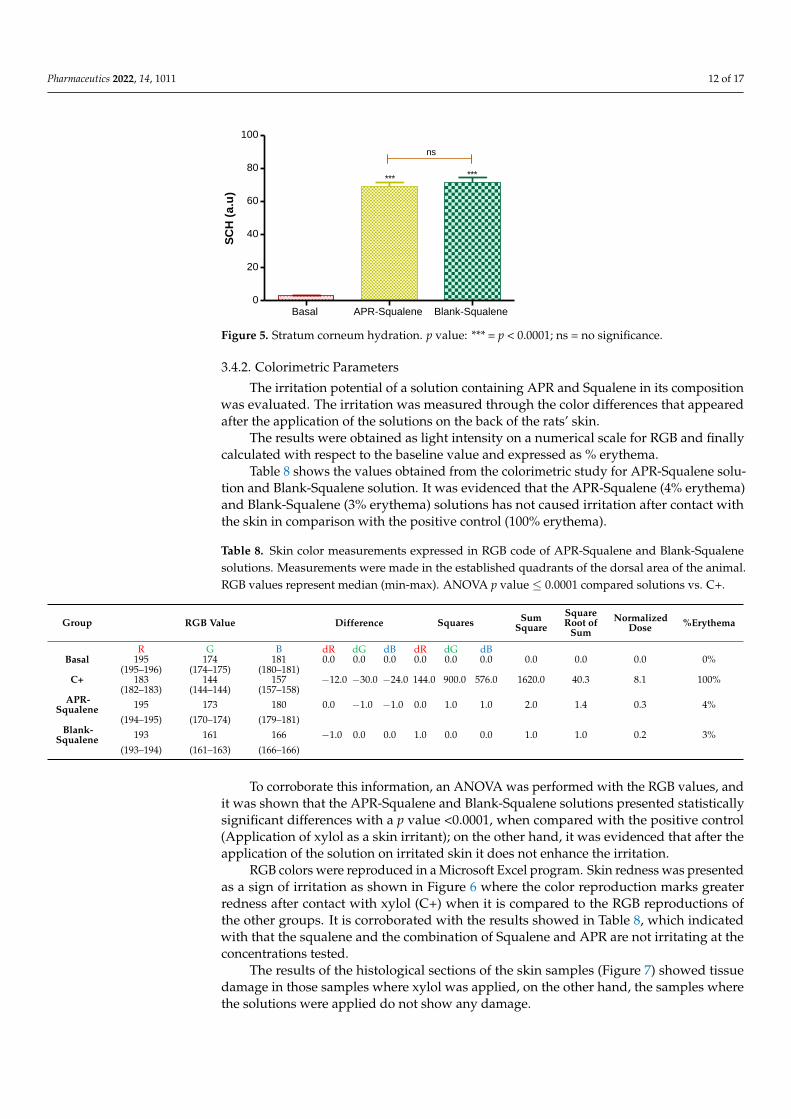
Figure 5. Stratum corneum hydration. p value: *** = p < 0.0001; ns = no significance.
3.4.2. Colorimetric Parameters
The irritation potential of a solution containing APR and Squalene in its composition
was evaluated. The irritation was measured through the color differences that appeared
after the application of the solutions on the back of the rats’ skin.
100 50010
0020
00
0
20
40
60
80
100
120
140
Azone
Carene
Limonene
Menthone
Nonane
Pinene
Squalene
Dilutions
Ce
ll v
iab
ilit
y (
%)
Figure 4. Effect of permeation promoters at different dilutions on the viability of HaCaT keratinocytecells in vitro.
Most of the permeation promoters tested were found not to induce cytotoxicity inthe cells, except for azone which, at 1/100 dilution (highest concentration tested), inducedcytotoxicity. The results suggested that the promoters evaluated do not generate skinirritation, but caution should be exercised with the use of azone; likewise, no correlationwas found between the results obtained for skin cell toxicity with reference to its effect ondrug penetration through the skin.
3.4. In Vivo Skin Tolerance Study3.4.1. Biomechanical Skin Properties Evaluation
Hydration in the stratum corneum was evaluated after the application of the twosolutions (APR-Squalene solution and Blank-Squalene solution).
Topical application of these solutions on the skin significantly increased hydration instratum corneum. These results were predictable, taking into account that the solutions aremostly made up of water and Transcutol.
These results suggest that the solutions with Squalene do not cause damage or irrita-tion in the skin barrier (Figure 5).
Pharmaceutics 2022, 14, 1011 12 of 17
Pharmaceutics 2022, 14, x FOR PEER REVIEW 12 of 18
3.3. In Vitro Tolerance Studies or Cell Viability Studies
The toxicity of the seven permeation promoters used in this study was evaluated in
skin cells (HaCaT cells) by the MTT assay. The results of treatment of HaCaT cells treated
with different dilutions of the permeation promoters are shown in Figure 4.
Most of the permeation promoters tested were found not to induce cytotoxicity in the
cells, except for azone which, at 1/100 dilution (highest concentration tested), induced cy-
totoxicity. The results suggested that the promoters evaluated do not generate skin irrita-
tion, but caution should be exercised with the use of azone; likewise, no correlation was
found between the results obtained for skin cell toxicity with reference to its effect on drug
penetration through the skin.
Figure 4. Effect of permeation promoters at different dilutions on the viability of HaCaT keratino-
cyte cells in vitro.
3.4. In Vivo Skin Tolerance Study
3.4.1. Biomechanical Skin Properties Evaluation
Hydration in the stratum corneum was evaluated after the application of the two
solutions (APR-Squalene solution and Blank-Squalene solution).
Topical application of these solutions on the skin significantly increased hydration in
stratum corneum. These results were predictable, taking into account that the solutions
are mostly made up of water and Transcutol.
These results suggest that the solutions with Squalene do not cause damage or irrita-
tion in the skin barrier (Figure 5).
Basal APR-Squalene Blank-Squalene 0
20
40
60
80
100
ns
******
SC
H (
a.u
)
Figure 5. Stratum corneum hydration. p value: *** = p < 0.0001; ns = no significance.
3.4.2. Colorimetric Parameters
The irritation potential of a solution containing APR and Squalene in its composition
was evaluated. The irritation was measured through the color differences that appeared
after the application of the solutions on the back of the rats’ skin.
100 50010
0020
00
0
20
40
60
80
100
120
140
Azone
Carene
Limonene
Menthone
Nonane
Pinene
Squalene
Dilutions
Ce
ll v
iab
ilit
y (
%)
Figure 5. Stratum corneum hydration. p value: *** = p < 0.0001; ns = no significance.
3.4.2. Colorimetric Parameters
The irritation potential of a solution containing APR and Squalene in its compositionwas evaluated. The irritation was measured through the color differences that appearedafter the application of the solutions on the back of the rats’ skin.
The results were obtained as light intensity on a numerical scale for RGB and finallycalculated with respect to the baseline value and expressed as % erythema.
Table 8 shows the values obtained from the colorimetric study for APR-Squalene solu-tion and Blank-Squalene solution. It was evidenced that the APR-Squalene (4% erythema)and Blank-Squalene (3% erythema) solutions has not caused irritation after contact withthe skin in comparison with the positive control (100% erythema).
Table 8. Skin color measurements expressed in RGB code of APR-Squalene and Blank-Squalenesolutions. Measurements were made in the established quadrants of the dorsal area of the animal.RGB values represent median (min-max). ANOVA p value ≤ 0.0001 compared solutions vs. C+.
Group RGB Value Difference Squares SumSquare
SquareRoot of
SumNormalized
Dose %Erythema
R G B dR dG dB dR dG dBBasal 195 174 181 0.0 0.0 0.0 0.0 0.0 0.0 0.0 0.0 0.0 0%
(195–196) (174–175) (180–181)C+ 183 144 157 −12.0 −30.0 −24.0 144.0 900.0 576.0 1620.0 40.3 8.1 100%
(182–183) (144–144) (157–158)APR-
Squalene 195 173 180 0.0 −1.0 −1.0 0.0 1.0 1.0 2.0 1.4 0.3 4%(194–195) (170–174) (179–181)
Blank-Squalene 193 161 166 −1.0 0.0 0.0 1.0 0.0 0.0 1.0 1.0 0.2 3%
(193–194) (161–163) (166–166)
To corroborate this information, an ANOVA was performed with the RGB values, andit was shown that the APR-Squalene and Blank-Squalene solutions presented statisticallysignificant differences with a p value <0.0001, when compared with the positive control(Application of xylol as a skin irritant); on the other hand, it was evidenced that after theapplication of the solution on irritated skin it does not enhance the irritation.
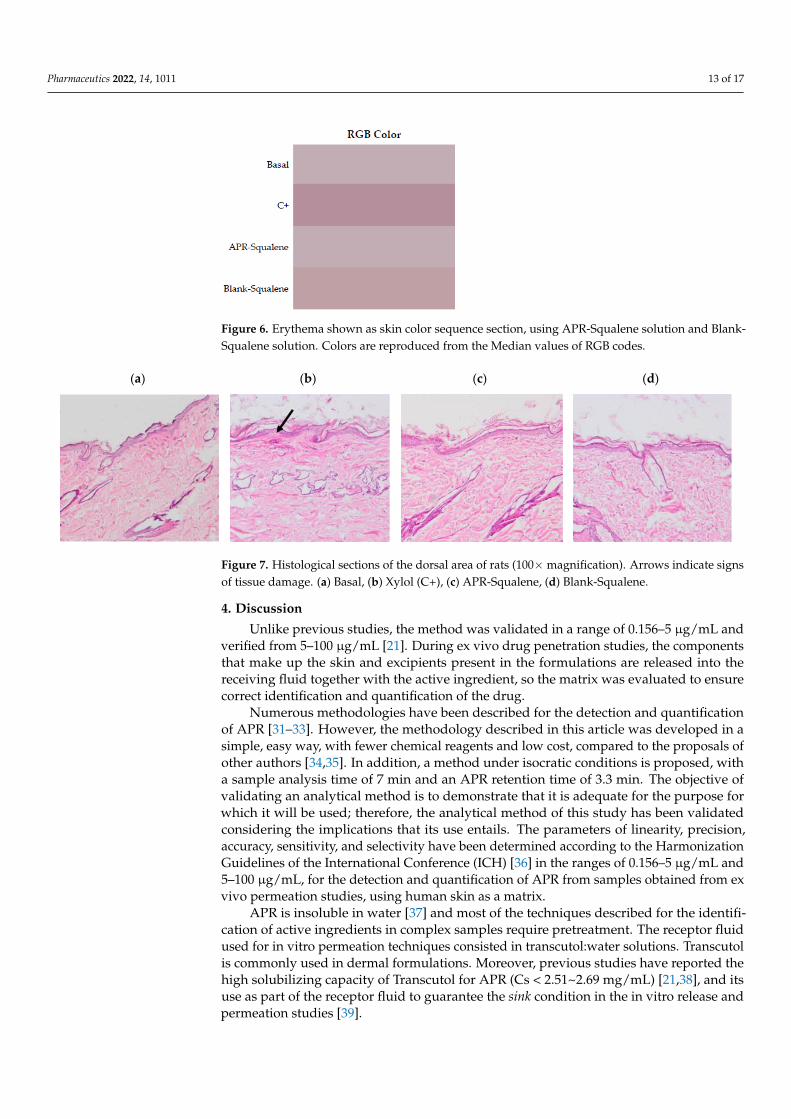
RGB colors were reproduced in a Microsoft Excel program. Skin redness was presentedas a sign of irritation as shown in Figure 6 where the color reproduction marks greaterredness after contact with xylol (C+) when it is compared to the RGB reproductions ofthe other groups. It is corroborated with the results showed in Table 8, which indicatedwith that the squalene and the combination of Squalene and APR are not irritating at theconcentrations tested.
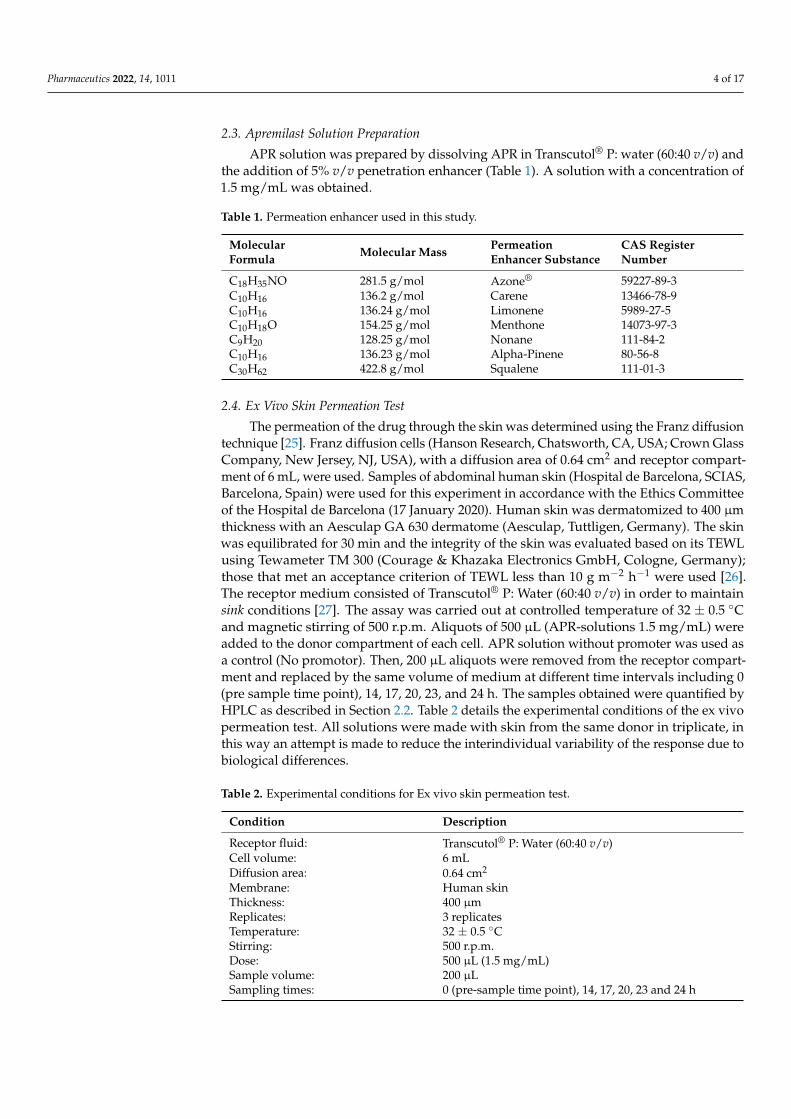
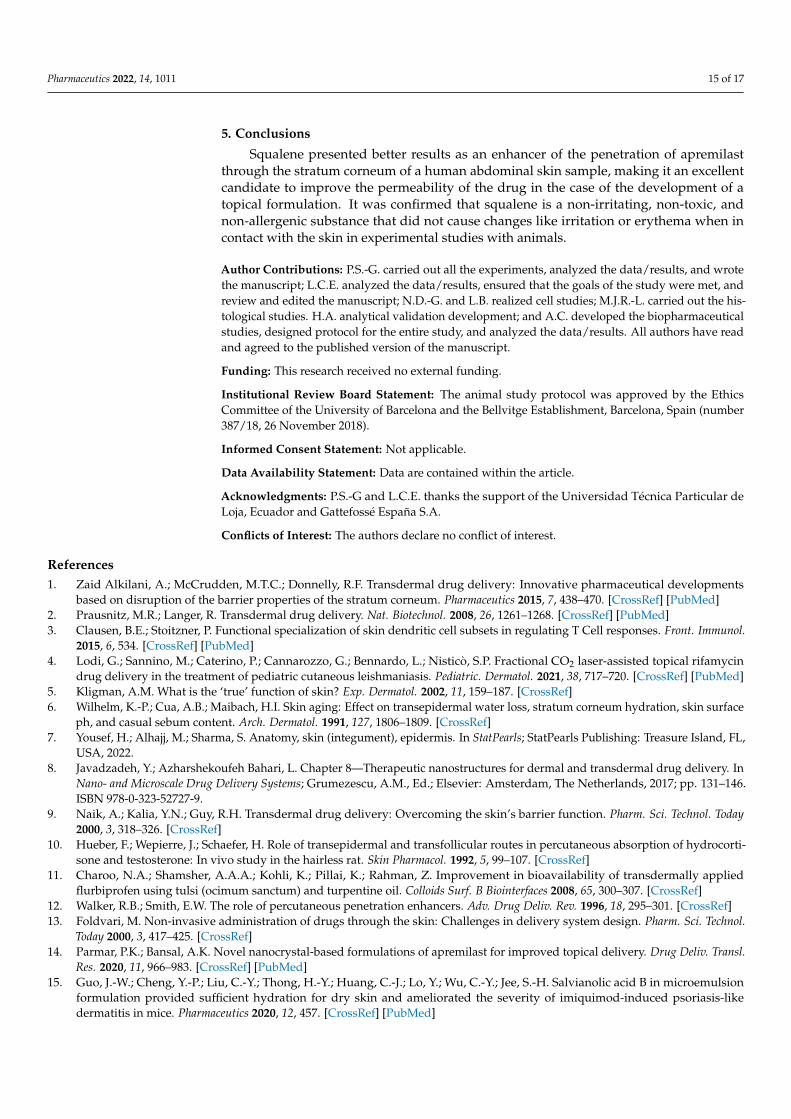
The results of the histological sections of the skin samples (Figure 7) showed tissuedamage in those samples where xylol was applied, on the other hand, the samples wherethe solutions were applied do not show any damage.
Pharmaceutics 2022, 14, 1011 13 of 17
Pharmaceutics 2022, 14, x FOR PEER REVIEW 13 of 18
The results were obtained as light intensity on a numerical scale for RGB and finally
calculated with respect to the baseline value and expressed as % erythema.
Table 8 shows the values obtained from the colorimetric study for APR-Squalene so-
lution and Blank-Squalene solution. It was evidenced that the APR-Squalene (4% ery-
thema) and Blank-Squalene (3% erythema) solutions has not caused irritation after contact
with the skin in comparison with the positive control (100% erythema).
To corroborate this information, an ANOVA was performed with the RGB values,
and it was shown that the APR-Squalene and Blank-Squalene solutions presented statis-
tically significant differences with a p value <0.0001, when compared with the positive
control (Application of xylol as a skin irritant); on the other hand, it was evidenced that
after the application of the solution on irritated skin it does not enhance the irritation.
RGB colors were reproduced in a Microsoft Excel program. Skin redness was pre-
sented as a sign of irritation as shown in Figure 6 where the color reproduction marks
greater redness after contact with xylol (C+) when it is compared to the RGB reproductions
of the other groups. It is corroborated with the results showed in Table 8, which indicated
with that the squalene and the combination of Squalene and APR are not irritating at the
concentrations tested.
The results of the histological sections of the skin samples (Figure 7) showed tissue
damage in those samples where xylol was applied, on the other hand, the samples where
the solutions were applied do not show any damage.
Table 8. Skin color measurements expressed in RGB code of APR-Squalene and Blank-Squalene
solutions. Measurements were made in the established quadrants of the dorsal area of the animal.
RGB values represent median (min-max). ANOVA p value ≤ 0.0001 compared solutions vs. C+.
Group RGB Value Difference Squares Sum
Square
Square root of
Sum
Normalized
Dose
%Ery-
thema
R G B dR dG dB dR dG dB
Basal 195 174 181 0.0 0.0 0.0 0.0 0.0 0.0 0.0 0.0 0.0 0%
(195–196) (174–175) (180–181)
C+ 183 144 157 −12.0 −30.0 −24.0 144.0 900.0 576.0 1620.0 40.3 8.1 100%
(182–183) (144–144) (157–158)
APR-
Squa-
lene
195 173 180 0.0 −1.0 −1.0 0.0 1.0 1.0 2.0 1.4 0.3 4%
(194–195) (170–174) (179–181)
Blank-
Squa-
lene
193 161 166 −1.0 0.0 0.0 1.0 0.0 0.0 1.0 1.0 0.2 3%
(193–194) (161–163) (166–166)
Figure 6. Erythema shown as skin color sequence section, using APR-Squalene solution and Blank-
Squalene solution. Colors are reproduced from the Median values of RGB codes.
Figure 6. Erythema shown as skin color sequence section, using APR-Squalene solution and Blank-Squalene solution. Colors are reproduced from the Median values of RGB codes.
Pharmaceutics 2022, 14, x FOR PEER REVIEW 14 of 18
(a) (b) (c) (d)
Figure 7. Histological sections of the dorsal area of rats (100X magnification). Arrows indicate signs
of tissue damage. (a) Basal, (b) Xylol (C+), (c) APR-Squalene, (d) Blank-Squalene.
4. Discussion
Unlike previous studies, the method was validated in a range of 0.156–5 µg/mL and
verified from 5–100 µg/mL [21]. During ex vivo drug penetration studies, the components
that make up the skin and excipients present in the formulations are released into the
receiving fluid together with the active ingredient, so the matrix was evaluated to ensure
correct identification and quantification of the drug.
Numerous methodologies have been described for the detection and quantification
of APR [31–33]. However, the methodology described in this article was developed in a
simple, easy way, with fewer chemical reagents and low cost, compared to the proposals
of other authors [34,35]. In addition, a method under isocratic conditions is proposed, with
a sample analysis time of 7 min and an APR retention time of 3.3 min. The objective of
validating an analytical method is to demonstrate that it is adequate for the purpose for
which it will be used; therefore, the analytical method of this study has been validated
considering the implications that its use entails. The parameters of linearity, precision,
accuracy, sensitivity, and selectivity have been determined according to the Harmoniza-
tion Guidelines of the International Conference (ICH) [36] in the ranges of 0.156–5 µg/mL
and 5–100 µg/mL, for the detection and quantification of APR from samples obtained from
ex vivo permeation studies, using human skin as a matrix.
APR is insoluble in water [37] and most of the techniques described for the identifi-
cation of active ingredients in complex samples require pretreatment. The receptor fluid
used for in vitro permeation techniques consisted in transcutol:water solutions. Trans-
cutol is commonly used in dermal formulations. Moreover, previous studies have re-
ported the high solubilizing capacity of Transcutol for APR (Cs < 2.51~2.69 mg/mL)
[21,38], and its use as part of the receptor fluid to guarantee the sink condition in the in
vitro release and permeation studies [39].
The permeation of the drug through the skin was determined with the Franz Cell
Diffusion technique and the membrane used was dermatomized human abdominal skin.
The promoters evaluated have been extensively studied and were selected because there
is research that has reported that these promoters increase drug penetration without hav-
ing other pharmacological activities in the body. Moreover, they are non-toxic, non-irri-
tating, non-allergenic, unidirectional, and compatible with drugs and excipients of dermal
formulations, in addition to being cosmetologically acceptable [40,41]. However, despite
its good performance in improving the skin permeability of drugs, there are still sub-
stances used as penetration enhancers that can cause skin irritation or, in some cases, skin
toxicity in vitro in HACAT cells [42]. Azone, which was patented in 1976, is the first com-
pound designed specifically as a penetration enhancer. It interacts with the structural li-
pids that make up the stratum corneum, thus allowing the passage of the drug, as well as
acting by denaturing proteins and modifying the coefficient of diffusion of the drug fa-
voring permeation through the skin [43,44]. The terpenes used in this study, such as
Figure 7. Histological sections of the dorsal area of rats (100×magnification). Arrows indicate signsof tissue damage. (a) Basal, (b) Xylol (C+), (c) APR-Squalene, (d) Blank-Squalene.
4. Discussion
Unlike previous studies, the method was validated in a range of 0.156–5 µg/mL andverified from 5–100 µg/mL [21]. During ex vivo drug penetration studies, the componentsthat make up the skin and excipients present in the formulations are released into thereceiving fluid together with the active ingredient, so the matrix was evaluated to ensurecorrect identification and quantification of the drug.
Numerous methodologies have been described for the detection and quantificationof APR [31–33]. However, the methodology described in this article was developed in asimple, easy way, with fewer chemical reagents and low cost, compared to the proposals ofother authors [34,35]. In addition, a method under isocratic conditions is proposed, witha sample analysis time of 7 min and an APR retention time of 3.3 min. The objective ofvalidating an analytical method is to demonstrate that it is adequate for the purpose forwhich it will be used; therefore, the analytical method of this study has been validatedconsidering the implications that its use entails. The parameters of linearity, precision,accuracy, sensitivity, and selectivity have been determined according to the HarmonizationGuidelines of the International Conference (ICH) [36] in the ranges of 0.156–5 µg/mL and5–100 µg/mL, for the detection and quantification of APR from samples obtained from exvivo permeation studies, using human skin as a matrix.
APR is insoluble in water [37] and most of the techniques described for the identifi-cation of active ingredients in complex samples require pretreatment. The receptor fluidused for in vitro permeation techniques consisted in transcutol:water solutions. Transcutolis commonly used in dermal formulations. Moreover, previous studies have reported thehigh solubilizing capacity of Transcutol for APR (Cs < 2.51~2.69 mg/mL) [21,38], and itsuse as part of the receptor fluid to guarantee the sink condition in the in vitro release andpermeation studies [39].

Pharmaceutics 2022, 14, 1011 14 of 17
The permeation of the drug through the skin was determined with the Franz CellDiffusion technique and the membrane used was dermatomized human abdominal skin.The promoters evaluated have been extensively studied and were selected because thereis research that has reported that these promoters increase drug penetration withouthaving other pharmacological activities in the body. Moreover, they are non-toxic, non-irritating, non-allergenic, unidirectional, and compatible with drugs and excipients ofdermal formulations, in addition to being cosmetologically acceptable [40,41]. However,despite its good performance in improving the skin permeability of drugs, there are stillsubstances used as penetration enhancers that can cause skin irritation or, in some cases,skin toxicity in vitro in HACAT cells [42]. Azone, which was patented in 1976, is thefirst compound designed specifically as a penetration enhancer. It interacts with thestructural lipids that make up the stratum corneum, thus allowing the passage of thedrug, as well as acting by denaturing proteins and modifying the coefficient of diffusionof the drug favoring permeation through the skin [43,44]. The terpenes used in thisstudy, such as Carene, Limonene, Mentona, Nonane, Alpha-pinene, and squalene, areorganic compounds and laboratory designed that attract great interest. Terpenes aregenerally considered to be less toxic and have a potential of low irritation compared to othersubstances such as surfactants and other synthetic penetration enhancers [45]. Terpenesare a class of clinically acceptable and relatively safe permeation enhancers for hydrophilicand lipophilic drugs [40]. Terpenes are of natural origin and are generally considered “safe”by the US Federal Drug Administration, which allow them to offer advantages over otherenhancers including alcohols, fatty acids, sulfoxides, and azone [46]. In this study, squalenewas the most effective promoter in improving the permeability of APR through humanabdominal skin. The squalenic acid chain confers high hydrophobicity for skin penetrationof hydrophobic drugs, such as APR [47]. Squalene reduces the oxidative damage of freeradicals in the skin; in addition, this promoter is present in a percent of around 13% insebum which is produced by the sebaceous glands that correspond to small glands presentin the skin that secrete sebum in hair follicles to lubricate skin and hair in animals [48].Squalene is considered a great emollient in nature; it is quickly and efficiently absorbedinto the skin [49]. Therefore, these results suggest that the incorporation of squalene indermal formulations could be used as a strategy to improve the permeation of APR throughthe stratum corneum and their retention within the skin providing topical therapeuticalternatives with reduced side effects for the local treatment of psoriasis.
Squalene and the other penetration promoters evaluated in this study were non-toxicsubstances according to the results obtained for cell viability in HACAT keratinocytecells. According to several studies, penetration promoters must be non-toxic or irritatingsubstances, the absorption must be immediate and unidirectional [50,51]. In addition,after removing the material from the membrane, the tissue should immediately recover itsbarrier properties and the promoter should be compatible with the drug and pharmaceuticalexcipients [52].
For the in vivo tolerance test through animal models, APR solutions were used to-gether with 5% squalene, as a penetration promoter. The evaluated colorimetric parametersshowed that the squalene solutions (with and without drug) are neither irritant nor toxicwhen in contact with the back of the animal’s skin in comparison with the positive controland that was corroborated with histological tests. The histological results showed tissuedamage after the application of xylol; however, this was not evidenced with the solutionsevaluated. Consistent and reproducible color assessment is one of the most useful tech-niques in dermatology. Devices used for this purpose can quantify color, erythema, and tanin various skin types; the devices contain a spectrophotometer that analyzes the spectralcharacteristics of a color [53]. This technique is currently used due to its non-invasive natureand allows the characterization of injured skin from non-injured skin in patients with skininvolvement; it is also used to evaluate the efficacy of drugs on skin pigmentation [54].
Pharmaceutics 2022, 14, 1011 15 of 17
5. Conclusions
Squalene presented better results as an enhancer of the penetration of apremilastthrough the stratum corneum of a human abdominal skin sample, making it an excellentcandidate to improve the permeability of the drug in the case of the development of atopical formulation. It was confirmed that squalene is a non-irritating, non-toxic, andnon-allergenic substance that did not cause changes like irritation or erythema when incontact with the skin in experimental studies with animals.
Author Contributions: P.S.-G. carried out all the experiments, analyzed the data/results, and wrotethe manuscript; L.C.E. analyzed the data/results, ensured that the goals of the study were met, andreview and edited the manuscript; N.D.-G. and L.B. realized cell studies; M.J.R.-L. carried out the his-tological studies. H.A. analytical validation development; and A.C. developed the biopharmaceuticalstudies, designed protocol for the entire study, and analyzed the data/results. All authors have readand agreed to the published version of the manuscript.
Funding: This research received no external funding.
Institutional Review Board Statement: The animal study protocol was approved by the EthicsCommittee of the University of Barcelona and the Bellvitge Establishment, Barcelona, Spain (number387/18, 26 November 2018).
Informed Consent Statement: Not applicable.
Data Availability Statement: Data are contained within the article.
Acknowledgments: P.S.-G and L.C.E. thanks the support of the Universidad Técnica Particular deLoja, Ecuador and Gattefossé España S.A.
Conflicts of Interest: The authors declare no conflict of interest.
References1. Zaid Alkilani, A.; McCrudden, M.T.C.; Donnelly, R.F. Transdermal drug delivery: Innovative pharmaceutical developments
based on disruption of the barrier properties of the stratum corneum. Pharmaceutics 2015, 7, 438–470. [CrossRef] [PubMed]2. Prausnitz, M.R.; Langer, R. Transdermal drug delivery. Nat. Biotechnol. 2008, 26, 1261–1268. [CrossRef] [PubMed]3. Clausen, B.E.; Stoitzner, P. Functional specialization of skin dendritic cell subsets in regulating T Cell responses. Front. Immunol.
2015, 6, 534. [CrossRef] [PubMed]4. Lodi, G.; Sannino, M.; Caterino, P.; Cannarozzo, G.; Bennardo, L.; Nisticò, S.P. Fractional CO2 laser-assisted topical rifamycin
drug delivery in the treatment of pediatric cutaneous leishmaniasis. Pediatric. Dermatol. 2021, 38, 717–720. [CrossRef] [PubMed]5. Kligman, A.M. What is the ‘true’ function of skin? Exp. Dermatol. 2002, 11, 159–187. [CrossRef]6. Wilhelm, K.-P.; Cua, A.B.; Maibach, H.I. Skin aging: Effect on transepidermal water loss, stratum corneum hydration, skin surface
ph, and casual sebum content. Arch. Dermatol. 1991, 127, 1806–1809. [CrossRef]7. Yousef, H.; Alhajj, M.; Sharma, S. Anatomy, skin (integument), epidermis. In StatPearls; StatPearls Publishing: Treasure Island, FL,
USA, 2022.8. Javadzadeh, Y.; Azharshekoufeh Bahari, L. Chapter 8—Therapeutic nanostructures for dermal and transdermal drug delivery. In
Nano- and Microscale Drug Delivery Systems; Grumezescu, A.M., Ed.; Elsevier: Amsterdam, The Netherlands, 2017; pp. 131–146.ISBN 978-0-323-52727-9.
9. Naik, A.; Kalia, Y.N.; Guy, R.H. Transdermal drug delivery: Overcoming the skin’s barrier function. Pharm. Sci. Technol. Today2000, 3, 318–326. [CrossRef]
10. Hueber, F.; Wepierre, J.; Schaefer, H. Role of transepidermal and transfollicular routes in percutaneous absorption of hydrocorti-sone and testosterone: In vivo study in the hairless rat. Skin Pharmacol. 1992, 5, 99–107. [CrossRef]
11. Charoo, N.A.; Shamsher, A.A.A.; Kohli, K.; Pillai, K.; Rahman, Z. Improvement in bioavailability of transdermally appliedflurbiprofen using tulsi (ocimum sanctum) and turpentine oil. Colloids Surf. B Biointerfaces 2008, 65, 300–307. [CrossRef]
12. Walker, R.B.; Smith, E.W. The role of percutaneous penetration enhancers. Adv. Drug Deliv. Rev. 1996, 18, 295–301. [CrossRef]13. Foldvari, M. Non-invasive administration of drugs through the skin: Challenges in delivery system design. Pharm. Sci. Technol.
Today 2000, 3, 417–425. [CrossRef]14. Parmar, P.K.; Bansal, A.K. Novel nanocrystal-based formulations of apremilast for improved topical delivery. Drug Deliv. Transl.
Res. 2020, 11, 966–983. [CrossRef] [PubMed]15. Guo, J.-W.; Cheng, Y.-P.; Liu, C.-Y.; Thong, H.-Y.; Huang, C.-J.; Lo, Y.; Wu, C.-Y.; Jee, S.-H. Salvianolic acid B in microemulsion
formulation provided sufficient hydration for dry skin and ameliorated the severity of imiquimod-induced psoriasis-likedermatitis in mice. Pharmaceutics 2020, 12, 457. [CrossRef] [PubMed]

Pharmaceutics 2022, 14, 1011 16 of 17
16. Fala, L. Otezla (apremilast), an oral PDE-4 inhibitor, receives FDA approval for the treatment of patients with active psoriaticarthritis and plaque psoriasis. Am. Health Drug Benefits 2015, 8, 105–110. [PubMed]
17. FDA Approves OTEZLA® (apremilast) for the Treatment of Oral Ulcers Associated with Behçet’s Disease. Available on-line: https://ir.celgene.com/press-releases-archive/press-release-details/2019/FDA-Approves-OTEZLA-apremilast-for-the-Treatment-of-Oral-Ulcers-Associated-with-Behets-Disease/default.aspx (accessed on 13 February 2022).
18. Langley, A.; Beecker, J. Management of common side effects of apremilast. J. Cutan. Med. Surg. 2018, 22, 415–421. [CrossRef][PubMed]
19. Rapalli, V.K.; Sharma, S.; Roy, A.; Singhvi, G. Design and dermatokinetic evaluation of apremilast loaded nanostructured lipidcarriers embedded gel for topical delivery: A potential approach for improved permeation and prolong skin deposition. ColloidsSurf. B Biointerfaces 2021, 206, 111945. [CrossRef] [PubMed]
20. Rapalli, V.K.; Sharma, S.; Roy, A.; Alexander, A.; Singhvi, G. Solid lipid nanocarriers embedded hydrogel for topical delivery ofapremilast: In-vitro, ex-vivo, dermatopharmacokinetic and anti-psoriatic evaluation. J. Drug Deliv. Sci. Technol. 2021, 63, 102442.[CrossRef]
21. Sarango-Granda, P.; Silva-Abreu, M.; Calpena, A.C.; Halbaut, L.; Fábrega, M.-J.; Rodríguez-Lagunas, M.J.; Díaz-Garrido, N.;Badia, J.; Espinoza, L.C. Apremilast microemulsion as topical therapy for local inflammation: Design, characterization andefficacy evaluation. Pharmaceuticals 2020, 13, 484. [CrossRef] [PubMed]
22. Mulleria, S.S.; Marina, K.; Ghetia, S.M. Formulation, optimization and in vitro evaluation of apremilast nanoemulgel for topicaldelivery. Int. J. Pharm. Investig. 2021, 11, 230–237. [CrossRef]
23. Sindhoor, S.M.; Koland, M. Topical delivery of apremilast loaded nanostructured lipid carrier based hydrogel for psoriasistherapy. J. Pharm. Res. Int. 2021, 33, 7–20. [CrossRef]
24. ICH: Quality Guidelines. Available online: https://www.ich.org/page/quality-guidelines (accessed on 14 February 2022).25. Zsikó, S.; Csányi, E.; Kovács, A.; Budai-Szucs, M.; Gácsi, A.; Berkó, S. Methods to evaluate skin penetration in vitro. Sci. Pharm.
2019, 87, 19. [CrossRef]26. Guth, K.; Schäfer-Korting, M.; Fabian, E.; Landsiedel, R.; van Ravenzwaay, B. Suitability of skin integrity tests for dermal
absorption studies in vitro. Toxicol. Vitr. 2015, 29, 113–123. [CrossRef] [PubMed]27. Espinoza, L.C.; Silva-Abreu, M.; Calpena, A.C.; Rodríguez-Lagunas, M.J.; Fábrega, M.-J.; Garduño-Ramírez, M.L.; Clares, B.
Nanoemulsion strategy of pioglitazone for the treatment of skin inflammatory diseases. Nanomed. Nanotechnol. Biol. Med. 2019,19, 115–125. [CrossRef] [PubMed]
28. Liu, Y.; Zhou, S.; Nissel, J.; Wu, A.; Lau, H.; Palmisano, M. The pharmacokinetic effect of coadministration of apremilast andmethotrexate in individuals with rheumatoid arthritis and psoriatic arthritis. Clin. Pharmacol. Drug Dev. 2014, 3, 456–465.[CrossRef]
29. Sekizawa, J.; Yasuhara, K.; Suyama, Y.; Yamanaka, S.; Tobe, M.; Nishimura, M. A simple method for screening assessment of skinand eye irritation. J. Toxicol. Sci. 1994, 19, 25–35. [CrossRef] [PubMed]
30. Limón, D.; Jiménez-Newman, C.; Rodrigues, M.; González-Campo, A.; Amabilino, D.B.; Calpena, A.C.; Pérez-García, L. Cationicsupramolecular hydrogels for overcoming the skin barrier in drug delivery. ChemistryOpen 2017, 6, 585–598. [CrossRef]
31. Xiong, K.; Ma, X.; Cao, N.; Liu, L.; Sun, L.; Zou, Q.; Wei, P. Identification, characterization and HPLC quantification of impuritiesin apremilast. Anal. Methods 2016, 8, 1889–1897. [CrossRef]
32. Landge, S.B.; Dahale, S.B.; Jadhav, S.A.; Solanki, P.V.; Bembalkar, S.R.; Mathad, V.T. Development and Validation of stability indi-cating rapid RP-LC method for determination of process and degradation related impurities of apremilast, an anti-inflammatorydrug. AJAC 2017, 08, 380–394. [CrossRef]
33. Panchumarthy, R.; Sulthana, S.; Harsha Sri, K. Development and Validation of a Stability-Indicating Reversed Phase Hplc Method forDetermination of Apremilast in Bulk and Pharmaceutical Dosage Form; Scholars Research Library: Uxbridge, UK, 2020.
34. Kulkarni, P.; Deshpande, A. Analytical methods for determination of apremilast from bulk, dosage form and biological fluids: Acritical review. Crit. Rev. Anal. Chem. 2020, 51, 258–267. [CrossRef]
35. Patel, N.; Patel, S.; Surati, J.; Akbari, A.; Shah, D. Apremilast—A review of analytical methods developed for API with itsimpurities, pharmaceutical formulations and biological matrices. Int. J. Pharm. Res. Appl. 2021, 6, 735–755.
36. European Medicines Agency ICH Q2 (R1) Validation of Analytical Procedures: Text and Methodology. Available online:https://www.ema.europa.eu/en/ich-q2-r1-validation-analytical-procedures-text-methodology (accessed on 15 July 2020).
37. Madan, J.R.; Khobaragade, S.; Dua, K.; Awasthi, R. Formulation, optimization, and in vitro evaluation of nanostructured lipidcarriers for topical delivery of apremilast. Dermatol. Ther. 2020, 33, e13370. [CrossRef] [PubMed]
38. Shakeel, F.; Haq, N.; Alanazi, F.K.; Alsarra, I.A. Solubility and thermodynamics of apremilast in different mono solvents:Determination, correlation and molecular interactions. Int. J. Pharm. 2017, 523, 410–417. [CrossRef] [PubMed]
39. Osborne, D.W.; Musakhanian, J. Skin penetration and permeation properties of transcutol®—Neat or diluted mixtures. AAPSPharmSciTech 2018, 19, 3512–3533. [CrossRef]
40. Amin, S.; Kohli, K.; Khar, R.K.; Mir, S.R.; Pillai, K.K. Mechanism of in vitro percutaneous absorption enhancement of carvedilolby penetration enhancers. Pharm. Dev. Technol. 2008, 13, 533–539. [CrossRef] [PubMed]
41. Kovácik, A.; Kopecná, M.; Vávrová, K. Permeation enhancers in transdermal drug delivery: Benefits and limitations. Expert Opin.Drug Deliv. 2020, 17, 145–155. [CrossRef] [PubMed]

Pharmaceutics 2022, 14, 1011 17 of 17
42. Chen, J.; Jiang, Q.-D.; Wu, Y.-M.; Liu, P.; Yao, J.-H.; Lu, Q.; Zhang, H.; Duan, J.-A. Potential of essential oils as penetrationenhancers for transdermal administration of ibuprofen to treat dysmenorrhoea. Molecules 2015, 20, 18219–18236. [CrossRef][PubMed]
43. Hadgraft, J.; Peck, J.; Williams, D.G.; Pugh, W.J.; Allan, G. Mechanisms of action of skin penetration enhancers/retarders: Azoneand analogues. Int. J. Pharm. 1996, 141, 17–25. [CrossRef]
44. Haq, A.; Michniak-Kohn, B. Effects of solvents and penetration enhancers on transdermal delivery of thymoquinone: Permeabilityand skin deposition study. Drug Deliv. 2018, 25, 1943–1949. [CrossRef]
45. Sapra, B.; Jain, S.; Tiwary, A.; Sapra, B.; Jain, S.; Tiwary, A.K. Percutaneous permeation enhancement by terpenes: Mechanisticview. AAPS J. 2008, 10, 120–132. [CrossRef]
46. Fox, L.T.; Gerber, M.; Plessis, J.D.; Hamman, J.H. Transdermal drug delivery enhancement by compounds of natural origin.Molecules 2011, 16, 10507–10540. [CrossRef]
47. Gref, R.; Deloménie, C.; Maksimenko, A.; Gouadon, E.; Percoco, G.; Lati, E.; Desmaële, D.; Zouhiri, F.; Couvreur, P. VitaminC–squalene bioconjugate promotes epidermal thickening and collagen production in human skin. Sci. Rep. 2020, 10, 16883.[CrossRef] [PubMed]
48. Pragst, F.; Auwärter, V.; Kießling, B.; Dyes, C. Wipe-test and patch-test for alcohol misuse based on the concentration ratio of fattyacid ethyl esters and squalene CFAEE/CSQ in skin surface lipids. Forensic Sci. Int. 2004, 143, 77–86. [CrossRef] [PubMed]
49. Huang, Z.-R.; Lin, Y.-K.; Fang, J.-Y. Biological and pharmacological activities of squalene and related compounds: Potential usesin cosmetic dermatology. Molecules 2009, 14, 540–554. [CrossRef] [PubMed]
50. Herman, A.; Herman, A.P. Essential oils and their constituents as skin penetration enhancer for transdermal drug delivery: Areview. J. Pharm. Pharmacol. 2015, 67, 473–485. [CrossRef] [PubMed]
51. Chapter 5—Chemical permeation enhancers. In Transdermal Drug Delivery; Ita, K. (Ed.) Academic Press: Cambridge, MA, USA,2020; pp. 63–96. ISBN 978-0-12-822550-9.
52. Junginger, H.E.; Verhoef, J.C. Macromolecules as safe penetration enhancers for hydrophilic drugs—A fiction? Pharm. Sci. Technol.Today 1998, 1, 370–376. [CrossRef]
53. Ly, B.C.K.; Dyer, E.B.; Feig, J.L.; Chien, A.L.; Del Bino, S. Research techniques made simple: Cutaneous colorimetry: A reliabletechnique for objective skin color measurement. J. Investig. Dermatol. 2020, 140, 3–12.e1. [CrossRef]
54. Nam, G.W.; Baek, J.H.; Koh, J.S.; Hwang, J.-K. The seasonal variation in skin hydration, sebum, scaliness, brightness and elasticityin Korean females. Skin Res. Technol. 2015, 21, 1–8. [CrossRef]
Copyright © 2022 FDOKUMEN