Transcribed enhancers lead waves of coordinated transcription in transitioning mammalian cells
Upload
independentCategory
view
1download
0
Human GLI3 Intragenic Conserved Non-CodingSequences Are Tissue-Specific EnhancersAmir Ali Abbasi1, Zissis Paparidis1, Sajid Malik1, Debbie K. Goode2, Heather Callaway2, Greg Elgar2, Karl-Heinz Grzeschik1*
1 Institute of Human Genetics, Philipps-University, Marburg, Germany, 2 School of Biological and Chemical Sciences, Queen Mary University ofLondon, London, United Kingdom
The zinc-finger transcription factor GLI3 is a key regulator of development, acting as a primary transducer of Sonic hedgehog(SHH) signaling in a combinatorial context dependent fashion controlling multiple patterning steps in different tissues/organs.A tight temporal and spatial control of gene expression is indispensable, however, cis-acting sequence elements regulatingGLI3 expression have not yet been reported. We show that 11 ancient genomic DNA signatures, conserved from the pufferfishTakifugu (Fugu) rubripes to man, are distributed throughout the introns of human GLI3. They map within larger conservednon-coding elements (CNEs) that are found in the tetrapod lineage. Full length CNEs transiently transfected into human cellcultures acted as cell type specific enhancers of gene transcription. The regulatory potential of these elements is conservedand was exploited to direct tissue specific expression of a reporter gene in zebrafish embryos. Assays of deletion constructsrevealed that the human-Fugu conserved sequences within the GLI3 intronic CNEs were essential but not sufficient for full-scale transcriptional activation. The enhancer activity of the CNEs is determined by a combinatorial effect of a core sequenceconserved between human and teleosts (Fugu) and flanking tetrapod-specific sequences, suggesting that successive clusteringof sequences with regulatory potential around an ancient, highly conserved nucleus might be a possible mechanism for theevolution of cis-acting regulatory elements.
Citation: Abbasi AA, Paparidis Z, Malik S, Goode DK, Callaway H, et al (2007) Human GLI3 Intragenic Conserved Non-Coding Sequences Are Tissue-Specific Enhancers. PLoS ONE 2(4): e366. doi:10.1371/journal.pone.0000366
INTRODUCTIONMutations in the human transcription factor GLI3 cause a variety
of dominant developmental defect syndromes, subsumed under
the term ‘‘GLI3 morphopathies’’ [1], including Greig cephalopo-
lysyndactyly syndrome (GCPS) [2–4], Pallister-Hall syndrome
(PHS) [5], postaxial polydactyly type A (PAPA) [6], and preaxial
polydactyly type IV (PPD-IV) [1]]. Mutations affecting murine
Gli3, such as extra toes (Xt), anterior digit deformity (add), and
polydactyly Nagoya (Pdn) serve as models for GLI3 morphopathies
[7–10]. All GLI3 morphopathies show malformations of the
autopod, i.e. polydactylies or syndactylies. In addition, craniofacial
abnormalities are associated with GCPS, and in the most severe
form, PHS, other developmental malformations occur, such as
hypothalamic hamartoma, visceral anomalies, anus atresy, epi-
glottis and larynx defects [11].
Genotype-phenotype correlation has been reported for Pallister-
Hall syndrome with mutations deleting the C-terminal part of
GLI3, 39of the zinc finger encoding domain, leaving the DNA-
binding domain intact [12,13]. Functional haploinsufficiency of
GLI3 appears to cause GCPS, since deletions or translocations
eliminating one allele as well as missense or nonsense mutations
distributed over the entire coding sequence are associated with this
phenotype [2,4,12].
The transcription factor GLI3, together with its paralogues
GLI1 and GLI2, acts as a primary transducer of Sonic hedgehog
(SHH) signaling in a context dependent combinatorial fashion
[14]. GLI3 and GLI2 can act both as transcriptional activators or
repressors whereas GLI1, whose expression is transcriptionally
regulated by GLI2 and GLI3, appears to play a secondary role in
potentiating the SHH response [15–18]. In murine embryos, the
locations affected in human GLI3 morphopathies, in particular the
forebrain and the autopod, show strong Gli3 expression [8]. In
humans, a lower level of GLI3 in these locations due to
haploinsufficiency is inadequate for normal development. Appar-
ently, the amount of gene product produced by one GLI3 allele is
sufficient in most other locations.
Mouse embryos with homozygous Gli3 deficiency show
pleiotropic and lethal congenital malformations with distinct
preaxial limb polydactylies [8,9]. A multitude of studies in mice
and other model organisms have proven that a GLI-code, the
interplay of GLI proteins and the temporally fine tuned expression
of the GLI genes in adjacent domains, together provide a basic tool
that is used over and over again in embryonal development. This
is applicable to patterning along the anteroposterior axis [19],
induction of sclerotome [20], morphogenesis of the neural tube
[21], [14,22], the prosencephalon [23], and cerebellum [24],
anterior-posterior limb patterning [25], chondrocyte differentia-
tion [26], skeletal muscle formation [27] and prostate gland
development [28]. These data indicate that GLI3 has essential
functions controlling multiple patterning steps in different tissues/
organs, and therefore a tight temporal and spatial control of gene
expression is indispensable.
The identification of cis-acting regulatory elements interacting
with the GLI3 promoter could facilitate the detection of factors
controlling the tissue specific availability of GLI3 in trans in
Hedgehog (HH) target cells. In turn, identification of transcription
Academic Editor: Jean-Nicolas Volff, Ecole Normale Superieure de Lyon, France
Received February 2, 2007; Accepted March 19, 2007; Published April 11, 2007
Copyright: � 2007 Abbasi et al. This is an open-access article distributed underthe terms of the Creative Commons Attribution License, which permitsunrestricted use, distribution, and reproduction in any medium, provided theoriginal author and source are credited.
Funding: This work was funded by Deutsche Forschungsgemeinschaft (Gr373-21;GRK 767) and Stiftung P.E.Kempkes, Marburg, Germany. A.A.A. holds a fellowshipof Higher Education Commission of Pakistan.
Competing Interests: The authors have declared that no competing interestsexist.
* To whom correspondence should be addressed. E-mail: [email protected]
PLoS ONE | www.plosone.org 1 April 2007 | Issue 4 | e366
factors for spatial and temporal control of GLI3 expression would
greatly enhance our understanding of the regulatory network that
coordinates the multitude of patterning events associated with the
HH signaling pathway. Mammalian enhancers can be defined by
a combinatorial code for an assembly of transcription factor
binding sites (TFBS), but in silico identification has proven difficult.
This is firstly due to the paucity of information about TF binding
specificity, confined to a set of loose consensus binding motifs.
Secondly, transcription factors generally recognize only six to eight
base-pair DNA motifs, and the distance over which they may be
located around a particular gene could be vast [29]. Enhancer
elements have been observed at a distance of more than
a megabase from their target gene [30]. To narrow the sequence
intervals to be scrutinized experimentally for cis-acting regulatory
potential, multispecies highly conserved non-coding sequences
(CNEs) have been targeted [31]. CNEs are much more conserved
than the sequences of known enhancers, but many of these
elements clearly regulate gene expression [32]. They also might
play a role in other processes, e.g. as repressors, replication origins
or modulators of chromatin structure. The reason for the strong
evolutionary constraint over extended lengths of DNA sequence is
not known. Sequence conservation of cis-regulatory elements of
transcription within CNEs might date back to the period in
evolution when the new patterns that they determine were added
to a basic body plan. Non-coding sequence elements conserved
from Fugu to man might harbour enhancers directing a basic
outline common to the two distantly related vertebrates, whereas
tetrapod specific CNEs might only contain regulatory elements for
later additions to the body plan, such as an autopod with digits.
As an initial attempt to identify and characterize the regulatory
code directing human GLI3 expression, we have applied reporter
gene assays to test the regulatory potential of 11 intronic Fugu-
human CNEs in cultured cells with or without endogenous GLI3
expression. All elements are able to regulate expression in a cell
type dependent fashion. The elements identified as potential
enhancers extend beyond the Fugu-human highly conserved core
sequences into flanking, less well conserved DNA. These core
sequences are necessary but not sufficient for full regulatory
potential. By expressing reporter genes under the control of the
human GLI3-CNEs in zebrafish embryos, we demonstrate that the
activating or repressor potential of CNEs observed in human cell
culture transient transfection assays is retained in vivo in a teleost
fish. Enhancers with activating potential differ in their tissue
specificity, however, none of them direct expression exclusively in
one tissue. Nevertheless, to a large extent reporter gene expression
patterns mimic endogenous zebrafish gli3 expression. We conclude
that human-Fugu CNEs, located in the introns of GLI3, mark
critical components of the cis-regulatory inventory for temporal
and spatial expression control of this key developmental gene.
RESULTS
GLI3 Tetrapod-Teleost Conserved Non-coding
Elements (CNEs) are located exclusively within
intronsThe pufferfish gli3 (scaffold_210; ENSEMBL genome browser) is
tightly bordered by genes that are not orthologous to the human
GLI3 flanking regions. Therefore, it is more likely that non-coding
sequences conserved between human and Fugu and which might
be potential enhancers, are restricted to GLI3 introns. GLI3 is
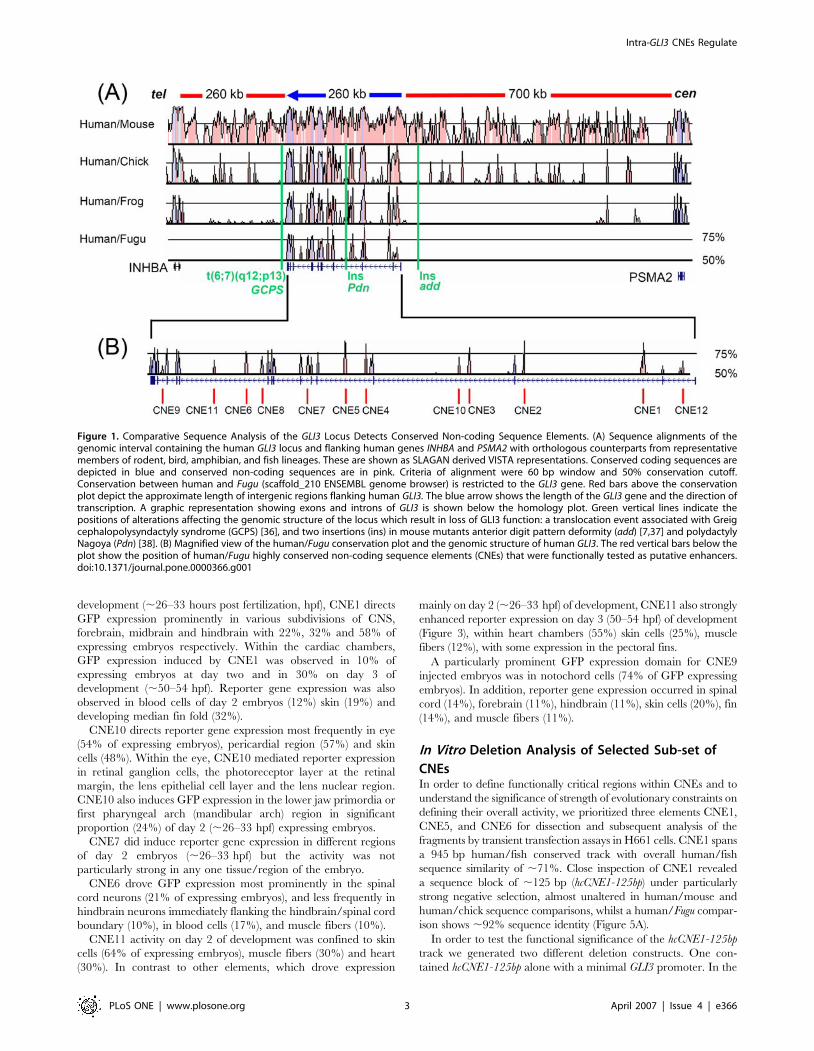
flanked by variable gene desert [33]. Comparison of approxi-
mately 1 Mb human genomic DNA sequence encompassing GLI3
and extending up to the flanking genes with the complete assembly
of the Takifugu rubripes genome sequence indicates that sequence
homology is restricted to the gene region proper (Figure 1).
Multi-species alignment of GLI3 genomic sequences from
mammals revealed extensive conservation, which obscured the
identification of potentially functional elements embedded in
intronic DNA (Figure 1A). However, in the transition from
moderate (mammalian sequence comparison) to intermediate
evolutionary distance (human vs birds/amphibia) the extent of
neutrally evolving sequences dropped sharply, whilst sequence
comparison at an extreme phylogenetic distance (human/teleost)
reduced the number of candidates further. This allowed us to
prioritize 11 CNEs for functional analysis.
These CNEs are distributed across almost the entire GLI3
interval (Figure 1B), with 2 elements in each of introns 2, 3, 4, and
10 and one in each of introns 1, 6, and 13. The amplicons
encompassing ancient signatures within flanking sequences highly
conserved only in mammals are described in Table 1. CNE2
represents an ultraconserved element [34] (.200 bp at 100%
identity in human, rat and mouse) and will be described elsewhere.
A further element, CNE8, located in intron 10 has not yet been
tested functionally. Using both extrinsic and ab initio approaches
embedded at the UCSC browser and the Ensembl gene build
system, we found no evidence for overlap with putative protein
coding regions or non-coding RNA genes. In each of the 11 CNEs
we predict transcription factor binding sites (TFBSs) for estab-
lished developmental regulators (Table 1) using the programs
Consite and rVista v 2.
Cell Based Reporter Assays Reveal a Context
Dependent Dual Nature (Activator/Repressor) of
CNEsIn order to test the selected subset of 10 sequence elements for
their potential to regulate reporter gene expression, recombinant
constructs with CNEs placed in either orientation upstream of
a luciferase gene controlled by either the heterologous SV40
promoter or the human minimal GLI3 promoter (Figure 2A), were
transiently transfected into two human kidney fibroblast lines. The
H661 cell line expresses endogenous GLI3 whereas H441 does not
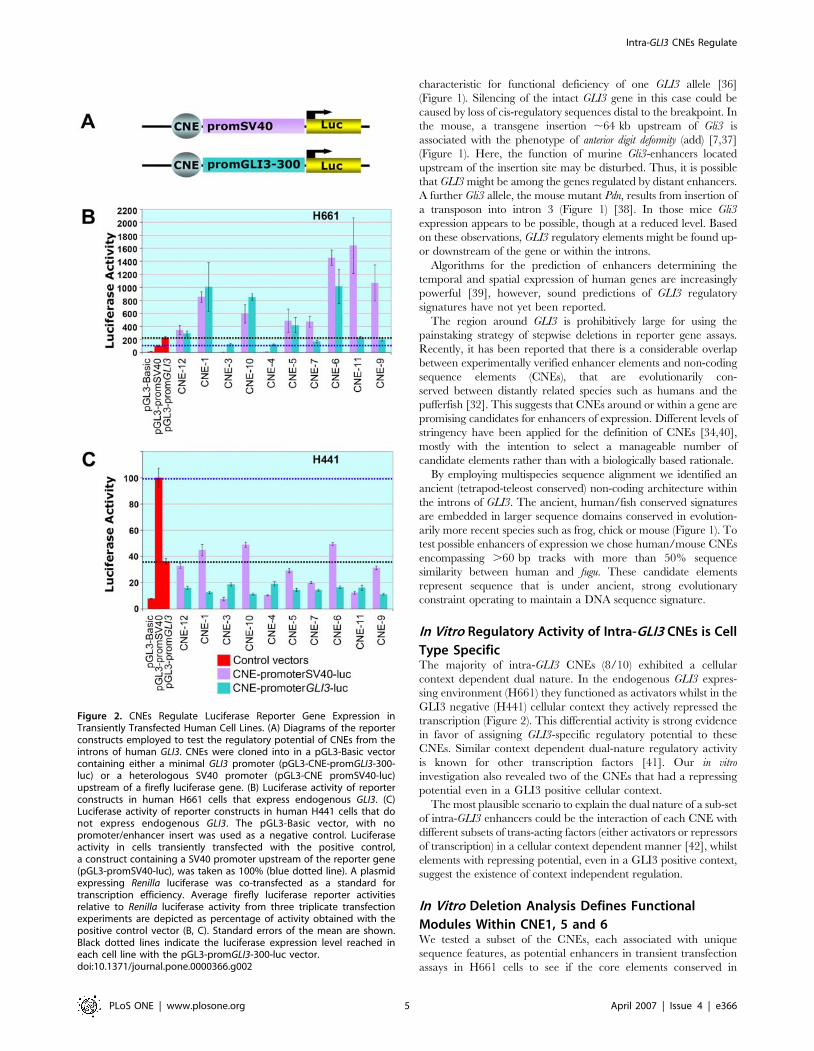
express this gene (data not shown). In dual luciferase assays eight
elements (CNE 1, 5, 6, 7, 9, 10, 11, and 12) showed activating
potential in H661 cells whereas two elements (CNE3 and CNE4)
repressed reporter gene expression below the level achieved by
either promoter alone (Figure 2B).
In contrast, when tested in the H441 cell line, all CNEs
exhibited a strong repressing activity (Figure 2C). Thus, the cell
based reporter assay identified two categories of intra-GLI3
regulatory elements: firstly context independent repressors and
secondly enhancers with a context dependent dual nature, serving
as activators in a GLI3 positive context and as repressors in cells
without endogenous GLI3 expression.
In Vivo Functional Analysis of CNEs with Transiently
Transfected Zebrafish EmbryosThe CNEs that have been tested in vitro were next tested in vivo
using zebrafish as a model organism. CNEs were co-injected with
a GFP reporter into zebrafish embryos and then monitored for
enhancer activity at set time points.
With the exception of CNE5, the in vitro identified cellular
context dependent enhancer elements drove GFP expression in
significant proportion of microinjected zebrafish embryos
(Figures 3 and 4), whereas neither CNE3 nor CNE4 could induce
reporter gene expression in fish embryos. At day two of
Intra-GLI3 CNEs Regulate
PLoS ONE | www.plosone.org 2 April 2007 | Issue 4 | e366
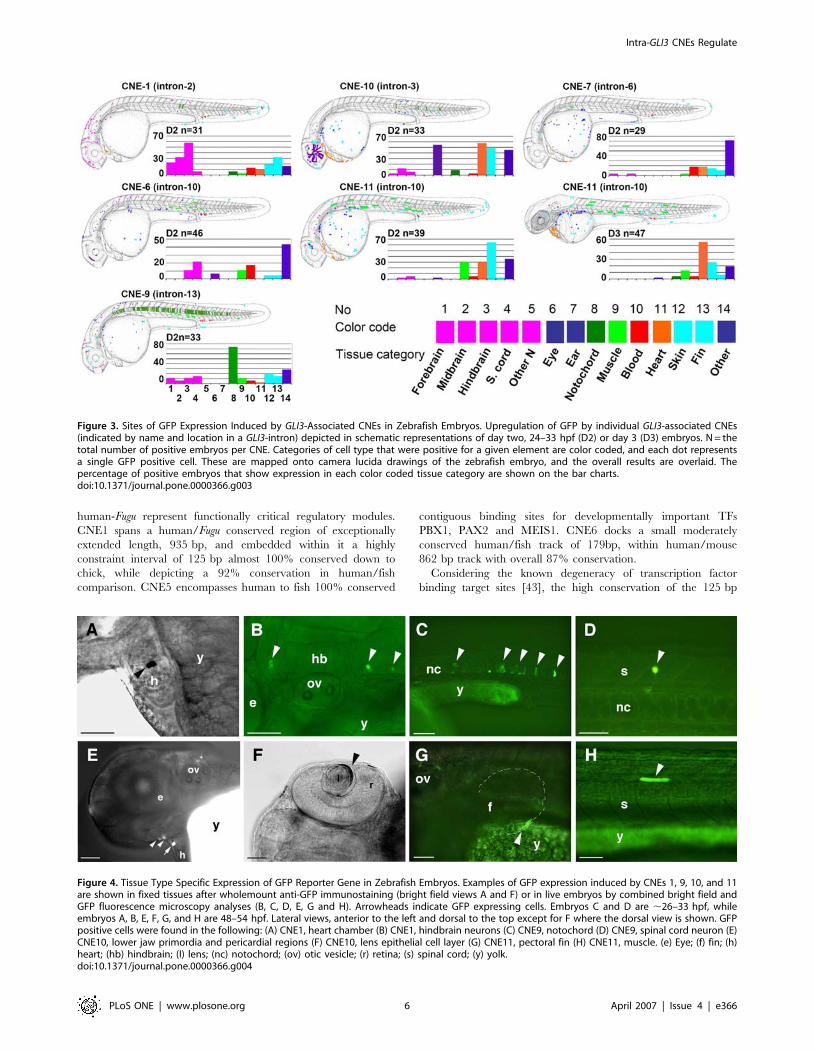
development (,26–33 hours post fertilization, hpf), CNE1 directs
GFP expression prominently in various subdivisions of CNS,
forebrain, midbrain and hindbrain with 22%, 32% and 58% of
expressing embryos respectively. Within the cardiac chambers,
GFP expression induced by CNE1 was observed in 10% of
expressing embryos at day two and in 30% on day 3 of
development (,50–54 hpf). Reporter gene expression was also
observed in blood cells of day 2 embryos (12%) skin (19%) and
developing median fin fold (32%).
CNE10 directs reporter gene expression most frequently in eye
(54% of expressing embryos), pericardial region (57%) and skin
cells (48%). Within the eye, CNE10 mediated reporter expression
in retinal ganglion cells, the photoreceptor layer at the retinal
margin, the lens epithelial cell layer and the lens nuclear region.
CNE10 also induces GFP expression in the lower jaw primordia or
first pharyngeal arch (mandibular arch) region in significant
proportion (24%) of day 2 (,26–33 hpf) expressing embryos.
CNE7 did induce reporter gene expression in different regions
of day 2 embryos (,26–33 hpf) but the activity was not
particularly strong in any one tissue/region of the embryo.
CNE6 drove GFP expression most prominently in the spinal
cord neurons (21% of expressing embryos), and less frequently in
hindbrain neurons immediately flanking the hindbrain/spinal cord
boundary (10%), in blood cells (17%), and muscle fibers (10%).
CNE11 activity on day 2 of development was confined to skin
cells (64% of expressing embryos), muscle fibers (30%) and heart
(30%). In contrast to other elements, which drove expression
mainly on day 2 (,26–33 hpf) of development, CNE11 also strongly
enhanced reporter expression on day 3 (50–54 hpf) of development
(Figure 3), within heart chambers (55%) skin cells (25%), muscle
fibers (12%), with some expression in the pectoral fins.
A particularly prominent GFP expression domain for CNE9
injected embryos was in notochord cells (74% of GFP expressing
embryos). In addition, reporter gene expression occurred in spinal
cord (14%), forebrain (11%), hindbrain (11%), skin cells (20%), fin
(14%), and muscle fibers (11%).
In Vitro Deletion Analysis of Selected Sub-set of
CNEsIn order to define functionally critical regions within CNEs and to
understand the significance of strength of evolutionary constraints on
defining their overall activity, we prioritized three elements CNE1,
CNE5, and CNE6 for dissection and subsequent analysis of the
fragments by transient transfection assays in H661 cells. CNE1 spans
a 945 bp human/fish conserved track with overall human/fish
sequence similarity of ,71%. Close inspection of CNE1 revealed
a sequence block of ,125 bp (hcCNE1-125bp) under particularly
strong negative selection, almost unaltered in human/mouse and
human/chick sequence comparisons, whilst a human/Fugu compar-
ison shows ,92% sequence identity (Figure 5A).
In order to test the functional significance of the hcCNE1-125bp
track we generated two different deletion constructs. One con-
tained hcCNE1-125bp alone with a minimal GLI3 promoter. In the
Figure 1. Comparative Sequence Analysis of the GLI3 Locus Detects Conserved Non-coding Sequence Elements. (A) Sequence alignments of thegenomic interval containing the human GLI3 locus and flanking human genes INHBA and PSMA2 with orthologous counterparts from representativemembers of rodent, bird, amphibian, and fish lineages. These are shown as SLAGAN derived VISTA representations. Conserved coding sequences aredepicted in blue and conserved non-coding sequences are in pink. Criteria of alignment were 60 bp window and 50% conservation cutoff.Conservation between human and Fugu (scaffold_210 ENSEMBL genome browser) is restricted to the GLI3 gene. Red bars above the conservationplot depict the approximate length of intergenic regions flanking human GLI3. The blue arrow shows the length of the GLI3 gene and the direction oftranscription. A graphic representation showing exons and introns of GLI3 is shown below the homology plot. Green vertical lines indicate thepositions of alterations affecting the genomic structure of the locus which result in loss of GLI3 function: a translocation event associated with Greigcephalopolysyndactyly syndrome (GCPS) [36], and two insertions (ins) in mouse mutants anterior digit pattern deformity (add) [7,37] and polydactylyNagoya (Pdn) [38]. (B) Magnified view of the human/Fugu conservation plot and the genomic structure of human GLI3. The red vertical bars below theplot show the position of human/Fugu highly conserved non-coding sequence elements (CNEs) that were functionally tested as putative enhancers.doi:10.1371/journal.pone.0000366.g001
Intra-GLI3 CNEs Regulate
PLoS ONE | www.plosone.org 3 April 2007 | Issue 4 | e366
second construct, to investigate the activity of the moderately
conserved human/Fugu flanking region, the hcCNE1-125bp frag-
ment was deleted from the wild type CNE1(Figure 5B).
Deletion of the 125 bp highly conserved region reduced the
activity by 67% compared to wild type construct, but it was still
able to induce reporter gene expression 4-fold compared to the
control vector, in which luciferase expression was driven alone by
the minimal GLI3 promoter. Tested alone, hcCNE1-125bp was
unable to show any activating potential (Figure 5C).
CNE5 harbors two highly conserved blocks interrupted by
a short less well-conserved fragment (Figure 6B). Within one of
these blocks, 100% conserved in multispecies sequence compar-
ison from human to fish, phylogenetic footprinting reveals contigu-
ous binding sites for three developmentally important homeobox
and paired box transcription factors, PBX1, PAX2 and MEIS1.
The PAX2 and MEIS1 binding sites overlap by one nucleotide.
A 50 bp module encompassing the PBX1, PAX2, and MEIS1
binding sites was excised from the wild type CNE5 fragment. Also,
a 144 bp region encompassing both highly conserved blocks was
isolated. Each of these were compared to wt CNE5 for their
potential to enhance reporter gene transcription when transiently
transfected into H661 cells. In contrast to wt CNE5, both elements
were unable to activate basic transcription (Figure 6B and 6C).
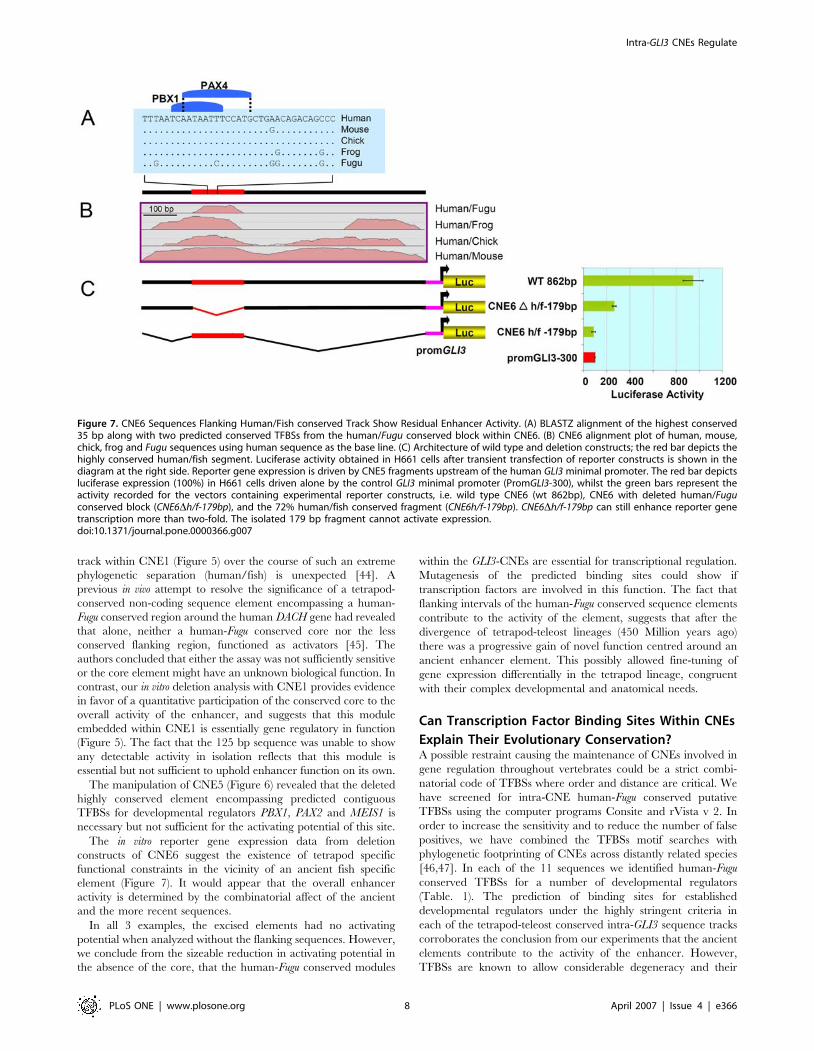
The wild type 862 bp CNE6 fragment shows 87% sequence
identity in a human/mouse comparison and contains a 179 bp
moderately conserved region between human/Fugu. This track
encompasses a 35 bp highly conserved site (Figure 7A and 7B). In
order to investigate the role of both the 179 bp human/fish region
and the flanking tetrapod conserved elements in the overall in vitro
enhancer activity of wt CNE6, each region was investigated
separately (Figure 7C).
Deletion of the 179 bp element reduced the activity of CNE6 by
,70% compared to the wild type construct. However, compared
to the control vector, this deleted CNE6 was still able to up-
regulate the reporter gene expression by more than 2-fold. The
179 bp fragment upstream of the minimal GLI3 promoter did not
result in up-regulation of reporter gene expression compared to
the control (Figure 7B and 7C).
DISCUSSION
Tetrapod-Teleost Conserved CNEs within Introns of
GLI3 Identify EnhancersHuman GLI3 extends over 260 kb on chromosome 7p14.1
(Figure 1A), a gene poor region, and is flanked by ,260 kb and
,700 kb intergenic intervals [35]. GLI3-regulatory elements,
potentially, could be located anywhere in this region. Considering
observations with other developmental genes in gene poor regions,
such as sonic hedgehog (SHH) [30], enhancers could even map
within or beyond the neighbouring genes. In humans, the occurr-
ence of distant regulatory elements can be heralded by cytogene-
tically detected translocations in patients with developmental
malformations, causing the trait via separation of enhancer ele-
ments from their respective gene. In the case of GLI3, a trans-
location t(6;7)(q27;p13) truncating chromosome 7p14 about 10 kb
downstream of the last exon results in a GCPS phenotype
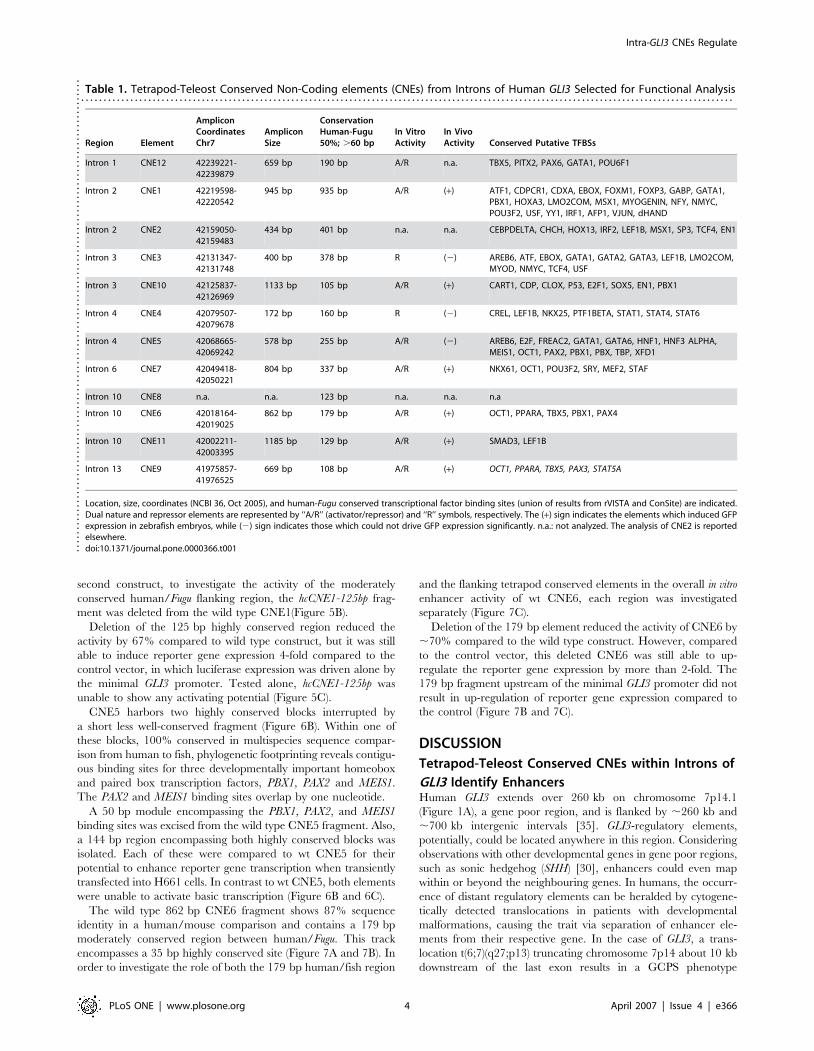
Table 1. Tetrapod-Teleost Conserved Non-Coding elements (CNEs) from Introns of Human GLI3 Selected for Functional Analysis. . . . . . . . . . . . . . . . . . . . . . . . . . . . . . . . . . . . . . . . . . . . . . . . . . . . . . . . . . . . . . . . . . . . . . . . . . . . . . . . . . . . . . . . . . . . . . . . . . . . . . . . . . . . . . . . . . . . . . . . . . . . . . . . . . . . . . . . . . . . . . . . . .
Region Element
AmpliconCoordinatesChr7
AmpliconSize
ConservationHuman-Fugu50%; .60 bp
In VitroActivity
In VivoActivity Conserved Putative TFBSs
Intron 1 CNE12 42239221-42239879
659 bp 190 bp A/R n.a. TBX5, PITX2, PAX6, GATA1, POU6F1
Intron 2 CNE1 42219598-42220542
945 bp 935 bp A/R (+) ATF1, CDPCR1, CDXA, EBOX, FOXM1, FOXP3, GABP, GATA1,PBX1, HOXA3, LMO2COM, MSX1, MYOGENIN, NFY, NMYC,POU3F2, USF, YY1, IRF1, AFP1, VJUN, dHAND
Intron 2 CNE2 42159050-42159483
434 bp 401 bp n.a. n.a. CEBPDELTA, CHCH, HOX13, IRF2, LEF1B, MSX1, SP3, TCF4, EN1
Intron 3 CNE3 42131347-42131748
400 bp 378 bp R (2) AREB6, ATF, EBOX, GATA1, GATA2, GATA3, LEF1B, LMO2COM,MYOD, NMYC, TCF4, USF
Intron 3 CNE10 42125837-42126969
1133 bp 105 bp A/R (+) CART1, CDP, CLOX, P53, E2F1, SOX5, EN1, PBX1
Intron 4 CNE4 42079507-42079678
172 bp 160 bp R (2) CREL, LEF1B, NKX25, PTF1BETA, STAT1, STAT4, STAT6
Intron 4 CNE5 42068665-42069242
578 bp 255 bp A/R (2) AREB6, E2F, FREAC2, GATA1, GATA6, HNF1, HNF3 ALPHA,MEIS1, OCT1, PAX2, PBX1, PBX, TBP, XFD1
Intron 6 CNE7 42049418-42050221
804 bp 337 bp A/R (+) NKX61, OCT1, POU3F2, SRY, MEF2, STAF
Intron 10 CNE8 n.a. n.a. 123 bp n.a. n.a. n.a
Intron 10 CNE6 42018164-42019025
862 bp 179 bp A/R (+) OCT1, PPARA, TBX5, PBX1, PAX4
Intron 10 CNE11 42002211-42003395
1185 bp 129 bp A/R (+) SMAD3, LEF1B
Intron 13 CNE9 41975857-41976525
669 bp 108 bp A/R (+) OCT1, PPARA, TBX5, PAX3, STAT5A
Location, size, coordinates (NCBI 36, Oct 2005), and human-Fugu conserved transcriptional factor binding sites (union of results from rVISTA and ConSite) are indicated.Dual nature and repressor elements are represented by ‘‘A/R’’ (activator/repressor) and ‘‘R’’ symbols, respectively. The (+) sign indicates the elements which induced GFPexpression in zebrafish embryos, while (2) sign indicates those which could not drive GFP expression significantly. n.a.: not analyzed. The analysis of CNE2 is reportedelsewhere.doi:10.1371/journal.pone.0000366.t001..
....
....
....
....
....
....
....
....
....
....
....
....
....
....
....
....
....
....
....
....
....
....
....
....
....
....
Intra-GLI3 CNEs Regulate
PLoS ONE | www.plosone.org 4 April 2007 | Issue 4 | e366
characteristic for functional deficiency of one GLI3 allele [36]
(Figure 1). Silencing of the intact GLI3 gene in this case could be
caused by loss of cis-regulatory sequences distal to the breakpoint. In
the mouse, a transgene insertion ,64 kb upstream of Gli3 is
associated with the phenotype of anterior digit deformity (add) [7,37]
(Figure 1). Here, the function of murine Gli3-enhancers located
upstream of the insertion site may be disturbed. Thus, it is possible
that GLI3 might be among the genes regulated by distant enhancers.
A further Gli3 allele, the mouse mutant Pdn, results from insertion of
a transposon into intron 3 (Figure 1) [38]. In those mice Gli3
expression appears to be possible, though at a reduced level. Based
on these observations, GLI3 regulatory elements might be found up-
or downstream of the gene or within the introns.
Algorithms for the prediction of enhancers determining the
temporal and spatial expression of human genes are increasingly
powerful [39], however, sound predictions of GLI3 regulatory
signatures have not yet been reported.
The region around GLI3 is prohibitively large for using the
painstaking strategy of stepwise deletions in reporter gene assays.
Recently, it has been reported that there is a considerable overlap
between experimentally verified enhancer elements and non-coding
sequence elements (CNEs), that are evolutionarily con-
served between distantly related species such as humans and the
pufferfish [32]. This suggests that CNEs around or within a gene are
promising candidates for enhancers of expression. Different levels of
stringency have been applied for the definition of CNEs [34,40],
mostly with the intention to select a manageable number of
candidate elements rather than with a biologically based rationale.
By employing multispecies sequence alignment we identified an
ancient (tetrapod-teleost conserved) non-coding architecture within
the introns of GLI3. The ancient, human/fish conserved signatures
are embedded in larger sequence domains conserved in evolution-
arily more recent species such as frog, chick or mouse (Figure 1). To
test possible enhancers of expression we chose human/mouse CNEs
encompassing .60 bp tracks with more than 50% sequence
similarity between human and fugu. These candidate elements
represent sequence that is under ancient, strong evolutionary
constraint operating to maintain a DNA sequence signature.
In Vitro Regulatory Activity of Intra-GLI3 CNEs is Cell
Type SpecificThe majority of intra-GLI3 CNEs (8/10) exhibited a cellular
context dependent dual nature. In the endogenous GLI3 expres-
sing environment (H661) they functioned as activators whilst in the
GLI3 negative (H441) cellular context they actively repressed the
transcription (Figure 2). This differential activity is strong evidence
in favor of assigning GLI3-specific regulatory potential to these
CNEs. Similar context dependent dual-nature regulatory activity
is known for other transcription factors [41]. Our in vitro
investigation also revealed two of the CNEs that had a repressing
potential even in a GLI3 positive cellular context.
The most plausible scenario to explain the dual nature of a sub-set
of intra-GLI3 enhancers could be the interaction of each CNE with
different subsets of trans-acting factors (either activators or repressors
of transcription) in a cellular context dependent manner [42], whilst
elements with repressing potential, even in a GLI3 positive context,
suggest the existence of context independent regulation.
In Vitro Deletion Analysis Defines Functional
Modules Within CNE1, 5 and 6We tested a subset of the CNEs, each associated with unique
sequence features, as potential enhancers in transient transfection
assays in H661 cells to see if the core elements conserved in
Figure 2. CNEs Regulate Luciferase Reporter Gene Expression inTransiently Transfected Human Cell Lines. (A) Diagrams of the reporterconstructs employed to test the regulatory potential of CNEs from theintrons of human GLI3. CNEs were cloned into in a pGL3-Basic vectorcontaining either a minimal GLI3 promoter (pGL3-CNE-promGLI3-300-luc) or a heterologous SV40 promoter (pGL3-CNE promSV40-luc)upstream of a firefly luciferase gene. (B) Luciferase activity of reporterconstructs in human H661 cells that express endogenous GLI3. (C)Luciferase activity of reporter constructs in human H441 cells that donot express endogenous GLI3. The pGL3-Basic vector, with nopromoter/enhancer insert was used as a negative control. Luciferaseactivity in cells transiently transfected with the positive control,a construct containing a SV40 promoter upstream of the reporter gene(pGL3-promSV40-luc), was taken as 100% (blue dotted line). A plasmidexpressing Renilla luciferase was co-transfected as a standard fortranscription efficiency. Average firefly luciferase reporter activitiesrelative to Renilla luciferase activity from three triplicate transfectionexperiments are depicted as percentage of activity obtained with thepositive control vector (B, C). Standard errors of the mean are shown.Black dotted lines indicate the luciferase expression level reached ineach cell line with the pGL3-promGLI3-300-luc vector.doi:10.1371/journal.pone.0000366.g002
Intra-GLI3 CNEs Regulate
PLoS ONE | www.plosone.org 5 April 2007 | Issue 4 | e366
human-Fugu represent functionally critical regulatory modules.
CNE1 spans a human/Fugu conserved region of exceptionally
extended length, 935 bp, and embedded within it a highly
constraint interval of 125 bp almost 100% conserved down to
chick, while depicting a 92% conservation in human/fish
comparison. CNE5 encompasses human to fish 100% conserved
contiguous binding sites for developmentally important TFs
PBX1, PAX2 and MEIS1. CNE6 docks a small moderately
conserved human/fish track of 179bp, within human/mouse
862 bp track with overall 87% conservation.
Considering the known degeneracy of transcription factor
binding target sites [43], the high conservation of the 125 bp
Figure 3. Sites of GFP Expression Induced by GLI3-Associated CNEs in Zebrafish Embryos. Upregulation of GFP by individual GLI3-associated CNEs(indicated by name and location in a GLI3-intron) depicted in schematic representations of day two, 24–33 hpf (D2) or day 3 (D3) embryos. N = thetotal number of positive embryos per CNE. Categories of cell type that were positive for a given element are color coded, and each dot representsa single GFP positive cell. These are mapped onto camera lucida drawings of the zebrafish embryo, and the overall results are overlaid. Thepercentage of positive embryos that show expression in each color coded tissue category are shown on the bar charts.doi:10.1371/journal.pone.0000366.g003
Figure 4. Tissue Type Specific Expression of GFP Reporter Gene in Zebrafish Embryos. Examples of GFP expression induced by CNEs 1, 9, 10, and 11are shown in fixed tissues after wholemount anti-GFP immunostaining (bright field views A and F) or in live embryos by combined bright field andGFP fluorescence microscopy analyses (B, C, D, E, G and H). Arrowheads indicate GFP expressing cells. Embryos C and D are ,26–33 hpf, whileembryos A, B, E, F, G, and H are 48–54 hpf. Lateral views, anterior to the left and dorsal to the top except for F where the dorsal view is shown. GFPpositive cells were found in the following: (A) CNE1, heart chamber (B) CNE1, hindbrain neurons (C) CNE9, notochord (D) CNE9, spinal cord neuron (E)CNE10, lower jaw primordia and pericardial regions (F) CNE10, lens epithelial cell layer (G) CNE11, pectoral fin (H) CNE11, muscle. (e) Eye; (f) fin; (h)heart; (hb) hindbrain; (I) lens; (nc) notochord; (ov) otic vesicle; (r) retina; (s) spinal cord; (y) yolk.doi:10.1371/journal.pone.0000366.g004
Intra-GLI3 CNEs Regulate
PLoS ONE | www.plosone.org 6 April 2007 | Issue 4 | e366
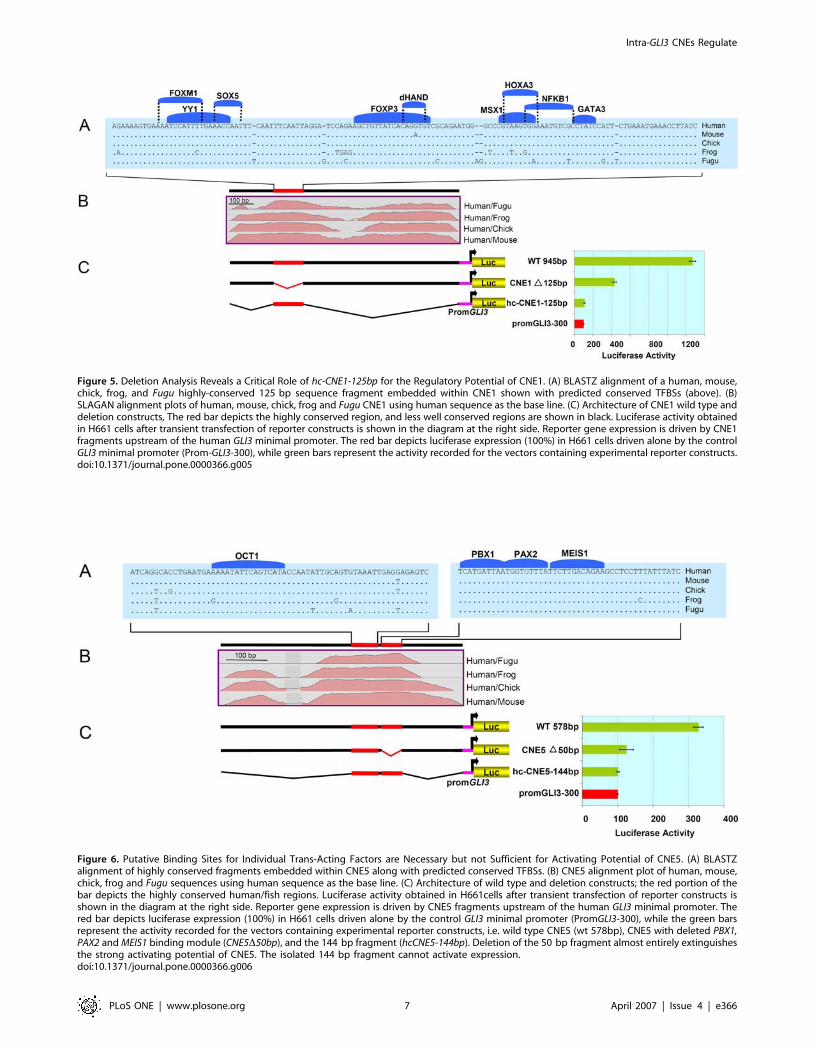
Figure 5. Deletion Analysis Reveals a Critical Role of hc-CNE1-125bp for the Regulatory Potential of CNE1. (A) BLASTZ alignment of a human, mouse,chick, frog, and Fugu highly-conserved 125 bp sequence fragment embedded within CNE1 shown with predicted conserved TFBSs (above). (B)SLAGAN alignment plots of human, mouse, chick, frog and Fugu CNE1 using human sequence as the base line. (C) Architecture of CNE1 wild type anddeletion constructs, The red bar depicts the highly conserved region, and less well conserved regions are shown in black. Luciferase activity obtainedin H661 cells after transient transfection of reporter constructs is shown in the diagram at the right side. Reporter gene expression is driven by CNE1fragments upstream of the human GLI3 minimal promoter. The red bar depicts luciferase expression (100%) in H661 cells driven alone by the controlGLI3 minimal promoter (Prom-GLI3-300), while green bars represent the activity recorded for the vectors containing experimental reporter constructs.doi:10.1371/journal.pone.0000366.g005
Figure 6. Putative Binding Sites for Individual Trans-Acting Factors are Necessary but not Sufficient for Activating Potential of CNE5. (A) BLASTZalignment of highly conserved fragments embedded within CNE5 along with predicted conserved TFBSs. (B) CNE5 alignment plot of human, mouse,chick, frog and Fugu sequences using human sequence as the base line. (C) Architecture of wild type and deletion constructs; the red portion of thebar depicts the highly conserved human/fish regions. Luciferase activity obtained in H661cells after transient transfection of reporter constructs isshown in the diagram at the right side. Reporter gene expression is driven by CNE5 fragments upstream of the human GLI3 minimal promoter. Thered bar depicts luciferase expression (100%) in H661 cells driven alone by the control GLI3 minimal promoter (PromGLI3-300), while the green barsrepresent the activity recorded for the vectors containing experimental reporter constructs, i.e. wild type CNE5 (wt 578bp), CNE5 with deleted PBX1,PAX2 and MEIS1 binding module (CNE5D50bp), and the 144 bp fragment (hcCNE5-144bp). Deletion of the 50 bp fragment almost entirely extinguishesthe strong activating potential of CNE5. The isolated 144 bp fragment cannot activate expression.doi:10.1371/journal.pone.0000366.g006
Intra-GLI3 CNEs Regulate
PLoS ONE | www.plosone.org 7 April 2007 | Issue 4 | e366
track within CNE1 (Figure 5) over the course of such an extreme
phylogenetic separation (human/fish) is unexpected [44]. A
previous in vivo attempt to resolve the significance of a tetrapod-
conserved non-coding sequence element encompassing a human-
Fugu conserved region around the human DACH gene had revealed
that alone, neither a human-Fugu conserved core nor the less
conserved flanking region, functioned as activators [45]. The
authors concluded that either the assay was not sufficiently sensitive
or the core element might have an unknown biological function. In
contrast, our in vitro deletion analysis with CNE1 provides evidence
in favor of a quantitative participation of the conserved core to the
overall activity of the enhancer, and suggests that this module
embedded within CNE1 is essentially gene regulatory in function
(Figure 5). The fact that the 125 bp sequence was unable to show
any detectable activity in isolation reflects that this module is
essential but not sufficient to uphold enhancer function on its own.
The manipulation of CNE5 (Figure 6) revealed that the deleted
highly conserved element encompassing predicted contiguous
TFBSs for developmental regulators PBX1, PAX2 and MEIS1 is
necessary but not sufficient for the activating potential of this site.
The in vitro reporter gene expression data from deletion
constructs of CNE6 suggest the existence of tetrapod specific
functional constraints in the vicinity of an ancient fish specific
element (Figure 7). It would appear that the overall enhancer
activity is determined by the combinatorial affect of the ancient
and the more recent sequences.
In all 3 examples, the excised elements had no activating
potential when analyzed without the flanking sequences. However,
we conclude from the sizeable reduction in activating potential in
the absence of the core, that the human-Fugu conserved modules
within the GLI3-CNEs are essential for transcriptional regulation.
Mutagenesis of the predicted binding sites could show if
transcription factors are involved in this function. The fact that
flanking intervals of the human-Fugu conserved sequence elements
contribute to the activity of the element, suggests that after the
divergence of tetrapod-teleost lineages (450 Million years ago)
there was a progressive gain of novel function centred around an
ancient enhancer element. This possibly allowed fine-tuning of
gene expression differentially in the tetrapod lineage, congruent
with their complex developmental and anatomical needs.
Can Transcription Factor Binding Sites Within CNEs
Explain Their Evolutionary Conservation?A possible restraint causing the maintenance of CNEs involved in
gene regulation throughout vertebrates could be a strict combi-
natorial code of TFBSs where order and distance are critical. We
have screened for intra-CNE human-Fugu conserved putative
TFBSs using the computer programs Consite and rVista v 2. In
order to increase the sensitivity and to reduce the number of false
positives, we have combined the TFBSs motif searches with
phylogenetic footprinting of CNEs across distantly related species
[46,47]. In each of the 11 sequences we identified human-Fugu
conserved TFBSs for a number of developmental regulators
(Table. 1). The prediction of binding sites for established
developmental regulators under the highly stringent criteria in
each of the tetrapod-teleost conserved intra-GLI3 sequence tracks
corroborates the conclusion from our experiments that the ancient
elements contribute to the activity of the enhancer. However,
TFBSs are known to allow considerable degeneracy and their
Figure 7. CNE6 Sequences Flanking Human/Fish conserved Track Show Residual Enhancer Activity. (A) BLASTZ alignment of the highest conserved35 bp along with two predicted conserved TFBSs from the human/Fugu conserved block within CNE6. (B) CNE6 alignment plot of human, mouse,chick, frog and Fugu sequences using human sequence as the base line. (C) Architecture of wild type and deletion constructs; the red bar depicts thehighly conserved human/fish segment. Luciferase activity obtained in H661 cells after transient transfection of reporter constructs is shown in thediagram at the right side. Reporter gene expression is driven by CNE5 fragments upstream of the human GLI3 minimal promoter. The red bar depictsluciferase expression (100%) in H661 cells driven alone by the control GLI3 minimal promoter (PromGLI3-300), whilst the green bars represent theactivity recorded for the vectors containing experimental reporter constructs, i.e. wild type CNE6 (wt 862bp), CNE6 with deleted human/Fuguconserved block (CNE6Dh/f-179bp), and the 72% human/fish conserved fragment (CNE6h/f-179bp). CNE6Dh/f-179bp can still enhance reporter genetranscription more than two-fold. The isolated 179 bp fragment cannot activate expression.doi:10.1371/journal.pone.0000366.g007
Intra-GLI3 CNEs Regulate
PLoS ONE | www.plosone.org 8 April 2007 | Issue 4 | e366
overall density across each individual CNE is low. Unless strict
maintenance of a combination of specific TFBSs and flanking
sequence is required to retain tissue specifity of enhancer action,
these sites may not contribute to the major constraint responsible
for conservation of non-coding elements throughout evolution.
Intra-GLI3 CNEs Show Tissue Specific Regulatory
Activity In VivoIn order to address the in vivo role of GLI3 associated conserved
non-coding elements we selected a medium throughput strategy
[31], employing transient reporter gene expression from the
human b-globin promoter under the influence of a putative
enhancer element in zebrafish embryos. This approach exploiting
the transparency and rapid development of zebrafish embryos has
recently shown its immense potential for functionally testing
enhancer elements among conserved non-coding regions [31,48–
50]. Our results (Figure 3) indicate that the regulatory potential of
most of the human CNEs defined in transient transfection assays
of human cell cultures is similarly present in fish embryos. There is
also a correlation between both enhancer and repressor activity in
vitro and in vivo. Thus, we present evidence that both the sequence
and the regulatory characteristics of cis-acting elements are
conserved throughout evolution, from teleosts to man.
In mouse, GLI3 plays a prominent role in development of brain,
ear, eye, craniofacial structures, limb and lung, and is also expressed
in heart, kidney, skeletal muscles, fetal blood cells, epidermal cell
layer of skin and other tissues (Mouse Genome Informatics http://
www.informatics.jax.org). Zebrafish gli3 is reported to be expressed
in brain, dorsal spinal cord neurons, eye, and pectoral fin bud
(Zebrafish Information Network; http://zfin.org) [51,52]. Howev-
er, exhaustive expression patterns throughout different stages of
development have not been published.
A number of the positions in which transgene expression is
observed coincide with known sites of GLI3 activity. For example
CNE1 drives GFP expression predominantly in various subdivi-
sions of the CNS, CNE10 activity was most frequent in the eye,
pericardial region, lower jaw primordia and skin cells, CNE6
activity was more specific to hindbrain/spinal cord boundary
neurons, muscle fibers and blood cells, and CNE11 driven
reporter expression was largely restricted to cardiac chambers,
skin cells and muscle fibers. Interestingly, CNE11 also induced
GFP expression with low frequency within pectoral fins at day 3 of
development which is consistent with the reported timing of
zebrafish gli3 expression in this tissue [51]. It can be seen that
functional redundancy with respect to the site of expression was
evident for all regulatory elements, a notion concordant with
findings in other genes [53].
Some cell populations such as heart, the pericardial region, blood
cells, muscle fibers, skin, and lower jaw primordial are domains of
Gli3 expression in mouse but not so far described in zebrafish.
However, GLI3 functions appear to be conserved in mouse and
zebrafish [51]. Therefore, the expression of gli3 in zebrafish might
be more extensive than reported so far. We observed expression in
domains of the embryo where gli3 is expressed neither in zebrafish
nor in mouse. For example, CNE9 directed expression pre-
dominantly to the notochord, which is inconsistent with the
reported endogenous GLI3 expression in either species. This could
reflect position effects upon the reporter-transgene inducing its
expression at ectopic sites. The unexpected finding of a CNE within
GLI3, which directs reporter gene expression at a site where GLI3
itself is never observed, stresses the importance of genomic context
for the function of regulatory elements, as had been concluded by
previous studies [31,53,54]. We must therefore exercise caution
when trying to draw conclusions on the normal regulatory potential
of genomic fragments based on reporter construct studies, in both
cell culture and transgenic animals.
Conserved Regulatory Elements are Uncovered by
Sequence Comparison at Extreme Phylogenetic
SeparationMost locations of reporter gene expression induced in transgenic
zebrafish embryos by the human intronic GLI3 CNEs represent
prominent sites reported for endogenous zebrafish gli3 [51].
However, zebrafish gli3 expression in the pectoral fin bud has been
reported to begin around 37 hpf, and by 44 h is expressed
uniformly throughout the fin bud [51]. At this location only CNE
11 evoked signals in the pectoral fin (Figure 3), unlike the other
enhancers, most of which ceased to act after ,28–33 hrs. It is
possible that more focused analysis may reveal additional expression
in the fin bud, but most probably the array of potential cis-acting
regulatory elements chosen in this study did not cover the complete
toolbox of elements required to orchestrate gli3 expression during
zebrafish development. We have pinpointed the regions to be
analyzed as potential enhancers by the presence of a human-Fugu
conserved sequence element, but the extent of the fragments
included as CNEs was defined from human/mouse comparison. By
this approach we addressed an ancient core as well sequences
flanking each human-Fugu-conserved element, which may have
evolved in tetrapods after its divergence from the teleost lineage. It is
of note that these flanking sequences show little identity in teleost
genomes, yet still function as enhancers in zebrafish. Homology
among non-coding intra-GLI3 sequences of tetrapods is not
restricted to areas identified through comparison with Fugu. CNEs
uncovered by sequence comparison within tetrapods could form
a rich source of further regulatory elements patterning tetrapod-
specific additions to the body plan. It will be interesting to test if and
where enhancers regulating expression of more modern structures,
such as digits, direct reporter expression in the fish.
MATERIALS AND METHODS
Reporter constructsCandidate enhancer sequences (CNEs, Table 1) were PCR
amplified using the high fidelity herculase enhanced DNA
polymerase (Stratagene, Amsterdam, The Netherlands) with
primers containing KpnI restriction site tags. Amplified DNA
was purified using the QIAquick PCR purification kit (Qiagen,
Hilden, Germany). Purified PCR products were then subjected to
restriction site digestion with KpnI (New England Bio Labs,
Ipswich, USA) and subsequently cloned in both orientations
upstream of a minimal GLI3 promoter or a heterologous SV40
promoter driving expression of the luciferase gene in the vector
pGL3 (Promega, Madison, USA). The reporter constracts were
designated pGL3-promGLI3-300-luc and pGL3-promSV40-luc,
respectively. Recombinant reporter expression constructs were
transfected into Top10 competent bacterial cells (Invitrogen,
Karlsruhe, Germany) and subsequently isolated and purified using
the Qiagen plasmid purification kit (Qiagen). To control the clones
for presence of any point mutations generated during PCR
amplification, appropriate DNA preparations were sequenced in
ABI 377 automated sequencer (Applied Biosystems, Foster City,
USA) and were analyzed with Sequencer software, Version 4.2.
Deletion MutantsThe deletion mutants of selected CNEs were made by PCR using
the recombinant reporter construct of each of the respective wild
Intra-GLI3 CNEs Regulate
PLoS ONE | www.plosone.org 9 April 2007 | Issue 4 | e366
type CNE as a template. The sequences flanking the segment to be
deleted were PCR amplified with two different sets of primers.
One member of each set was wt primer tagged with a KpnI
restriction site, while the other member was designed from the
immediate vicinity of the sequence to be deleted and tagged with
a HindIII restriction site. Amplified products flanking the region to
be deleted were purified using the QIAquick PCR purification kit
(Qiagen) and digested by HindIII then subsequently ligated to one
another. The ligated products were size fractioned on 2% agarose
gel, and the DNA fragment of expected length was gel excised,
purified by using a QIAquick gel extraction kit (Qiagen), digested
by KpnI, and inserted into the pGL3-promGLI3-300-luc reporter
plasmid. Sequence of each deleted recombinant construct was
confirmed by sequencing (ABI 377 automated sequencer; Applied
Biosystems). In order to avoid the de-novo creation of transcription
factor binding sites, compared to wild type sequence, each of the
deleted sequences were analyzed for potential TFBS with the
TESS web tool (Transcription Element Search Software on
http://www.cbil.upenn.edu/tess).
Cell CulturesThe human lung tumor cell line H661 and the human bronchiolar
epithelial cells H441 were obtained from the ATTC, USA, and
grown under standard conditions in RPM1-1640 medium (Sigma
Aldrich, Missouri, USA) containing 10% fetal calf serum, 1% non-
essential amino acids, 2% penicillin/streptomycin and 1% L-
glutamine (H661) or in modified RPMI-1640 medium (Sigma
Aldrich) with 25mM HEPES and sodium bicarbonate, containing
4% fetal calf serum, 1% non-essential amino acids, 2% penicillin/
streptomycin and 1% L-glutamine (H441), respectively.
Transient Transfection and Dual Luciferase AssayThe day before transfection, 46105 H661 or 36105 H441 cells
were seeded into each well of a 12-well plate in 2 ml of the
appropriate growth medium containing serum and antibiotics.
After 24 hours of incubation at normal growth conditions, cells
were transfected by using Effectene (Qiagen) according to the
manufacturer’s recommendations with the experimental firefly
luciferase reporter constructs at a concentration of 200 ng/well,
along with 100 ng/well of pRLSV40 (Promega) an expression
vector containing cDNA encoding Renilla luciferase as an internal
control reporter, and 200 ng/well of pGKBT7 (Clontech,
Mountain View, USA) as a stuffer/carrier DNA.
48 hours after transfection, cells were assayed for luciferase
activity with with the Dual-Luciferase Reporter Assay System
(Promega) on an AutoLumat LB 953 luminometer (Berthold,
Pforzheim, Germany). The activities of experimental reporter
(firefly luciferase) were normalized to the activities of internal
control reporter (Renilla luciferase). Triplicate assays were con-
ducted three times.
Zebrafish Enhancer/GFP Reporter AssayZebrafish were bred and raised according to standard protocols
[55]. CNEs for co-injection were either cut out from plasmids or
amplified by PCR and then purified by QIAquick PCR
purification kit (Qiagen). The reporter expression construct
consisting of cDNA encoding enhanced green fluorescent protein
(EGFP) under the control of minimal promoter from the human,
b-globin gene was also PCR amplified from plasmid construct
(Clontech). Element DNA (250–300 ng/ul) and reporter DNA
fragment (25 ng/ul) were combined with tracer, i.e. phenol red
(0.1%), and co-injected into the embryos produced from natural
mating with a femtojet pressure injection system (Eppendorf,
Hamburg, Germany) at the 1- to 8-cell stage, embryos developing
abnormally were discarded after 2 to 3 hours of injection. Normal
embryos were raised in 0.003% phenylthiocarbamide in embryo
medium from tailbud stage. On the second day of microinjection
(approximately 26–33 hpf) embryos were dechorionated using
pronase E, anaesthetized in Tricaine and analysed under UV-light
for GFP expression by using an IX81 motorised inverted
microscope (Olympus, Tokyo, Japan). Images were captured
using an FVII CCD monochrome digital camera and analySIS
image-processing software.
GFP expressing cells were classified according to the following
tissue categories: forebrain, midbrain, hindbrain, spinal cord, eye,
ear, notochord, muscle, blood (circulating)/blood islands, heart/
pericardial region, epidermis and fins. GFP expressing cells that
were not localized unequivocally were classified as others.
Location and tissue category of each GFP-expressing cell for each
embryo was recorded schematically using Adobe Photoshop
software (Adobe Systems, San Jose, USA), onto an overlay of
a camera lucida drawing of 31-hpf embryo. For each CNE, the
GFP expression data was collected from 20-50 expressing
embryos. As a control, mean of 200 embryos were injected with
conserved coding and non-conserved intronic sequences along
with the reporter system and were found unable to show any
significant GFP induction.
Combined schematised expression data for each CNE was
compressed into a JPEG file and coupled with graphical depiction
of expression domains to present an overall impression of the
spatial pattern to which the element directs expression.
Anti-GFP ImmunostainingFor immunostaining embryos were fixed in 4% paraformaldehyde
overnight at 4uC and incubated with rabbit polyclonal anti-GFP
(AMS Biotechnology, Abingdon Oxon, UK) using standard
protocols [56] and the ABC amplification system (Vectastain;
Vector laboratories, Burlingame, USA). Stained embryos were
subsequently cleared in glycerol, flatmounted, and observed under
bright field with Olympus IX81 motorised inverted microscope.
Comparative Sequence AnalysisApproximately 1 Mb of the human genome, encompassing GLI3
(ENSG00000106571) as well as GLI3 orthologous sequences of
mouse (ENSMUSG00000021318), chick (ENSGALG00000012329),
frog (ENSXETG00000001856) and Fugu (SINFRUG00000153715)
were obtained from Ensembl genome browser (http://www.ensembl.
org). Multispecies sequence comparison was performed by using the
glocal alignment program Shuffle-LAGAN [57]. Human sequence
was used as the baseline and annotated by using the exon/intron
information available at Ensembl genome browser. Shuffle-LAGAN
alignment was visualised with the VISTA visualization program [58].
The alignment was performed using 60 bp window and a cutoff score
of 50% identity.
In Silico Mapping of Conserved Transcription Factor
Binding SitesHuman-Fugu conserved transcription factor binding sites in each
CNE were detected with ConSite (http:/www.phylofoot.org/
consite) and rVISTA.2.0 (http:/rvista.decode.org/). The ConSite
screen for conserved TFBS was performed against the JASPAR
database with 50% conservation cuttoff, 60 bp window size and
75% transcription factor score threshold settings.
rVISTA 2.0 searches for conserved TFBSs were performed
against 500 vertebrate TF matrices from the TRANSFAC library,
Intra-GLI3 CNEs Regulate
PLoS ONE | www.plosone.org 10 April 2007 | Issue 4 | e366
with matrix similarity cuttoff 0.85 by submitting a BLASTZ
alignment file for each CNE to the rVISTA 2.0 site.
ACKNOWLEDGMENTSWe thank Mrs. D. Bornholdt for expert technical assistance.
Author Contributions
Conceived and designed the experiments: KG. Performed the experiments:
AA ZP DG HC. Analyzed the data: GE AA KG ZP SM DG. Wrote the
paper: GE AA KG DG.
REFERENCES1. Radhakrishna U, Bornholdt D, Scott HS, Patel UC, Rossier C, et al. (1999) The
phenotypic spectrum of GLI3 morphopathies includes autosomal dominantpreaxial polydactyly type-IV and postaxial polydactyly type-A/B; No phenotype
prediction from the position of GLI3 mutations. Am J Hum Genet 65: 645–655.
2. Vortkamp A, Gessler M, Grzeschik KH (1991) GLI3 zinc-finger gene
interrupted by translocations in Greig syndrome families. Nature 352: 539–540.
3. Wild A, Kalff-Suske M, Vortkamp A, Bornholdt D, Konig R, et al. (1997) Point
mutations in human GLI3 cause Greig syndrome. Hum Mol Genet 6:
1979–1984.
4. Kalff-Suske M, Wild A, Topp J, Wessling M, Jacobsen EM, et al. (1999) Point
mutations throughout the GLI3 gene cause Greig cephalopolysyndactylysyndrome. Hum Mol Genet 8: 1769–1777.
5. Kang S, Graham JM Jr, Olney AH, Biesecker LG (1997) GLI3 frameshiftmutations cause autosomal dominant Pallister-Hall syndrome. Nat Genet 15:
266–268.
6. Radhakrishna U, Wild A, Grzeschik KH, Antonarakis SE (1997) Mutation inGLI3 in postaxial polydactyly type A. Nat Genet 17: 269–271.
7. Pohl TM, Mattei MG, Ruther U (1990) Evidence for allelism of the recessiveinsertional mutation add and the dominant mouse mutation extra-toes (Xt).
Development 110: 1153–1157.
8. Schimmang T, Lemaistre M, Vortkamp A, Ruther U (1992) Expression of the
zinc finger gene Gli3 is affected in the morphogenetic mouse mutant extra-toes
(Xt). Development 116: 799–804.
9. Hui CC, Joyner AL (1993) A mouse model of greig cephalopolysyndactyly
syndrome: the extra-toesJ mutation contains an intragenic deletion of the Gli3gene. Nat Genet 3: 241–246.
10. Schimmang T, Oda SI, Ruther U (1994) The mouse mutant PolydactylyNagoya (Pdn) defines a novel allele of the zinc finger gene Gli3. Mamm Genome
5: 384–386.
11. Biesecker LG, Ondrey F (1998) Pallister-Hall syndrome. Otolaryngol HeadNeck Surg 119: 556.
12. Johnston JJ, Olivos-Glander I, Killoran C, Elson E, Turner JT, et al. (2005)Molecular and clinical analyses of Greig cephalopolysyndactyly and Pallister-
Hall syndromes: robust phenotype prediction from the type and position ofGLI3 mutations. Am J Hum Genet 76: 609–622.
13. Bose J, Grotewold L, Ruther U (2002) Pallister-Hall syndrome phenotype in
mice mutant for Gli3. Hum Mol Genet 11: 1129–1135.
14. Ruiz i Altaba A, Nguyen V, Palma V (2003) The emergent design of the neural
tube: prepattern, SHH morphogen and GLI code. Curr Opin Genet Dev 13:513–521.
15. Ding Q, Motoyama J, Gasca S, Mo R, Sasaki H, et al. (1998) Diminished Sonichedgehog signaling and lack of floor plate differentiation in Gli2 mutant mice.
Development 125: 2533–2543.
16. Motoyama J, Liu J, Mo R, Ding Q, Post M, et al. (1998) Essential function of
Gli2 and Gli3 in the formation of lung, trachea and oesophagus. Nat Genet 20:
54–57.
17. Bai CB, Joyner AL (2001) Gli1 can rescue the in vivo function of Gli2.
Development 128: 5161–5172.
18. Bai CB, Auerbach W, Lee JS, Stephen D, Joyner AL (2002) Gli2, but not Gli1, is
required for initial Shh signaling and ectopic activation of the Shh pathway.Development 129: 4753–4761.
19. Brewster R, Mullor JL, Ruiz i Altaba A (2000) Gli2 functions in FGF signaling
during antero-posterior patterning. Development 127: 4395–4405.
20. Buttitta L, Mo R, Hui CC, Fan CM (2003) Interplays of Gli2 and Gli3 and their
requirement in mediating Shh-dependent sclerotome induction. Development130: 6233–6243.
21. Persson M, Stamataki D, te Welscher P, Andersson E, Bose J, et al. (2002)Dorsal-ventral patterning of the spinal cord requires Gli3 transcriptional
repressor activity. Genes Dev 16: 2865–2878.
22. Wijgerde M, McMahon JA, Rule M, McMahon AP (2002) A direct requirementfor Hedgehog signaling for normal specification of all ventral progenitor
domains in the presumptive mammalian spinal cord. Genes Dev 16: 2849–2864.
23. Rallu M, Corbin JG, Fishell G (2002) Parsing the prosencephalon. Nat Rev
Neurosci 3: 943–951.
24. Corrales JD, Rocco GL, Blaess S, Guo Q, Joyner AL (2004) Spatial pattern of
sonic hedgehog signaling through Gli genes during cerebellum development.
Development 131: 5581–5590.
25. Robert B, Lallemand Y (2006) Anteroposterior patterning in the limb and digit
specification: Contribution of mouse genetics. Dev Dyn 235: 2337–2352.
26. Koziel L, Wuelling M, Schneider S, Vortkamp A (2005) Gli3 acts as a repressor
downstream of Ihh in regulating two distinct steps of chondrocyte differentiation.Development 132: 5249–5260.
27. McDermott A, Gustafsson M, Elsam T, Hui CC, Emerson CP Jr, et al. (2005)
Gli2 and Gli3 have redundant and context-dependent function in skeletal muscleformation. Development 132: 345–357.
28. Pu Y, Huang L, Prins GS (2004) Sonic hedgehog-patched Gli signaling in thedeveloping rat prostate gland: lobe-specific suppression by neonatal estrogens
reduces ductal growth and branching. Dev Biol 273: 257–275.
29. Holstege FC, Clevers H (2006) Transcription factor target practice. Cell 124:21–23.
30. Lettice LA, Heaney SJ, Purdie LA, Li L, de Beer P, et al. (2003) A long-range
Shh enhancer regulates expression in the developing limb and fin and isassociated with preaxial polydactyly. Hum Mol Genet 12: 1725–1735.
31. Woolfe A, Goodson M, Goode DK, Snell P, McEwen GK, et al. (2005) Highlyconserved non-coding sequences are associated with vertebrate development.
PLoS Biol 3: e7.
32. Pennacchio LA, Ahituv N, Moses AM, Prabhakar S, Nobrega MA, et al. (2006)In vivo enhancer analysis of human conserved non-coding sequences. Nature
444: 499–502.
33. Ovcharenko I, Loots GG, Nobrega MA, Hardison RC, Miller W, et al. (2005)Evolution and functional classification of vertebrate gene deserts. Genome Res
15: 137–145.
34. Bejerano G, Pheasant M, Makunin I, Stephen S, Kent WJ, et al. (2004)
Ultraconserved elements in the human genome. Science 304: 1321–1325.
35. Scherer SW, Cheung J, MacDonald JR, Osborne LR, Nakabayashi K, et al.(2003) Human chromosome 7: DNA sequence and biology. Science 300:
767–772.
36. Kruger G, Gotz J, Kvist U, Dunker H, Erfurth F, et al. (1989) Greig syndrome ina large kindred due to reciprocal chromosome translocation t(6;7)(q27;p13).
Am J Med Genet 32: 411–416.
37. van der Hoeven F, Schimmang T, Vortkamp A, Ruther U (1993) Molecular
linkage of the morphogenetic mutation add and the zinc finger gene Gli3.Mamm Genome 4: 276–277.
38. Ueta E, Maekawa M, Morimoto I, Nanba E, Naruse I (2004) Sonic hedgehog
expression in Gli3 depressed mouse embryo, Pdn/Pdn. Congenit Anom (Kyoto)44: 27–32.
39. Bejerano G, Siepel AC, Kent WJ, Haussler D (2005) Computational screening of
conserved genomic DNA in search of functional noncoding elements. Nat
Methods 2: 535–545.
40. Sanges R, Kalmar E, Claudiani P, D’Amato M, Muller F, et al. (2006) Shufflingof cis-regulatory elements is a pervasive feature of the vertebrate lineage.
Genome Biol 7: R56.
41. Grice EA, Rochelle ES, Green ED, Chakravarti A, McCallion AS (2005)Evaluation of the RET regulatory landscape reveals the biological relevance of
a HSCR-implicated enhancer. Hum Mol Genet 14: 3837–3845.
42. Hersh BM, Carroll SB (2005) Direct regulation of knot gene expression by
Ultrabithorax and the evolution of cis-regulatory elements in Drosophila.Development 132: 1567–1577.
43. Stormo GD (2000) DNA binding sites: representation and discovery. Bioinfor-
matics 16: 16–23.
44. Boffelli D, Nobrega MA, Rubin EM (2004) Comparative genomics at thevertebrate extremes. Nat Rev Genet 5: 456–465.
45. Poulin F, Nobrega MA, Plajzer-Frick I, Holt A, Afzal V, et al. (2005) In vivo
characterization of a vertebrate ultraconserved enhancer. Genomics 85:
774–781.
46. Loots GG, Ovcharenko I (2004) rVISTA 2.0: evolutionary analysis oftranscription factor binding sites. Nucleic Acids Res 32: W217–221.
47. Sandelin A, Wasserman WW, Lenhard B (2004) ConSite: web-based prediction
of regulatory elements using cross-species comparison. Nucleic Acids Res 32:W249–252.
48. Goode DK, Snell P, Smith SF, Cooke JE, Elgar G (2005) Highly conserved
regulatory elements around the SHH gene may contribute to the maintenance of
conserved synteny across human chromosome 7q36.3. Genomics 86: 172–181.
49. McEwen GK, Woolfe A, Goode D, Vavouri T, Callaway H, et al. (2006)Ancient duplicated conserved noncoding elements in vertebrates: a genomic and
functional analysis. Genome Res 16: 451–465.
50. Muller F, Chang B, Albert S, Fischer N, Tora L, et al. (1999) Intronic enhancerscontrol expression of zebrafish sonic hedgehog in floor plate and notochord.
Development 126: 2103–2116.
51. Tyurina OV, Guner B, Popova E, Feng J, Schier AF, et al. (2005) Zebrafish Gli3
functions as both an activator and a repressor in Hedgehog signaling. Dev Biol277: 537–556.
52. Vanderlaan G, Tyurina OV, Karlstrom RO, Chandrasekhar A (2005) Gli
function is essential for motor neuron induction in zebrafish. Dev Biol 282:550–570.
Intra-GLI3 CNEs Regulate
PLoS ONE | www.plosone.org 11 April 2007 | Issue 4 | e366
53. Fisher S, Grice EA, Vinton RM, Bessling SL, McCallion AS (2006)
Conservation of RET regulatory function from human to zebrafish withoutsequence similarity. Science 312: 276–279.
54. Gomez-Skarmeta JL, Lenhard B, Becker TS (2006) New technologies, new
findings, and new concepts in the study of vertebrate cis-regulatory sequences.Dev Dyn 235: 870–885.
55. Westerfield M (2000) The zebrafish book: A guide for the laboratory use ofzebrafish (Danio rerio) Oregon: University of Oregon Press.
56. Moens CB, Fritz A (1999) Techniques in neural development. Methods Cell Biol
59: 253–272.57. Brudno M, Malde S, Poliakov A, Do CB, Couronne O, et al. (2003) Glocal
alignment: finding rearrangements during alignment. Bioinformatics 19 Suppl 1:
i54–62.58. Mayor C, Brudno M, Schwartz JR, Poliakov A, Rubin EM, et al. (2000) VISTA
: visualizing global DNA sequence alignments of arbitrary length. Bioinformatics16: 1046–1047.
Intra-GLI3 CNEs Regulate
PLoS ONE | www.plosone.org 12 April 2007 | Issue 4 | e366
Copyright © 2022 FDOKUMEN