Whole-epigenome analysis in multiple myeloma reveals DNA hypermethylation of B cell-specific...
34
BLUEPRINT-IHEC _ Agirre et al., 2 nd revision submitted in January 2015 Whole-epigenome analysis in multiple myeloma reveals DNA hypermethylation of B cell-specific enhancers Xabier Agirre, 1 Giancarlo Castellano, 2 Marien Pascual, 1 Simon Heath 3 , Marta Kulis, 2 Victor Segura, 4 Anke Bergmann, 5 Anna Esteve, 3 Angelika Merkel, 3 Emanuele Raineri, 3 Lidia Agueda, 3 Julie Blanc, 3 David Richardson, 6 Laura Clarke, 6 Avik Datta, 6 Nuria Russiñol, 2 Ana C. Queirós, 2 Renée Beekman, 2 Juan R. Rodríguez-Madoz, 1 Edurne San José-Enériz, 1 Fang Fang, 7 Norma C. Gutiérrez, 8 José M. García-Verdugo, 9 Michael I. Robson, 10 Eric C. Schirmer, 10 Elisabeth Guruceaga, 4 Joost H.A. Martens, 11 Marta Gut, 3 Maria J. Calasanz, 12 Paul Flicek, 6 Reiner Siebert, 5 Elías Campo, 2 Jesús F. San Miguel, 13 Ari Melnick, 7 Hendrik G. Stunnenberg, 11 Ivo G. Gut, 3 Felipe Prosper, 1,13,14 and José I. Martín-Subero 2,14 1 Area de Oncología, Centro de Investigación Médica Aplicada (CIMA), Universidad de Navarra, Pamplona, Spain. 2 Unidad de Hematopatología, Servicio de Anatomía Patológica, Hospital Clínic, Universitat de Barcelona, Institut d’Investigacions Biomèdiques August Pi i Sunyer (IDIBAPS), Barcelona, Spain. 3 Centro Nacional de Análisis Genómico, Parc Científic de Barcelona, Barcelona, Spain. 4 Unidad de Bioinformática, Centro de Investigación Médica Aplicada (CIMA), Universidad de Navarra, Pamplona, Spain. 5 Institute of Human Genetics, Christian-Albrechts-University, Kiel, Germany. 6 European Bioinformatics Institute, European Molecular Biology Laboratory, , Cambridge, UK. 7 Division of Hematology/Oncology, Department of Medicine, Weill Cornell Medical College, New York, USA. 8 Hospital Universitario de Salamanca, Salamanca, Spain 9 Department of Cellular Morphology, University of Valencia, Unidad Mixta CIPF-UVEG, CIBERNED, Valencia, Spain. 10 The Wellcome Trust Centre for Cell Biology, University of Edinburgh, Edinburgh, UK. 11 Department of Molecular Biology, Faculty of Science, Nijmegen Centre for Molecular Life Sciences, Radboud University Nijmegen, Nijmegen, The Netherlands. 12 Departamento de Genética, Universidad de Navarra, Pamplona, Spain. 13 Clínica Universidad de Navarra, Universidad de Navarra, Pamplona, Spain. 14 These authors share senior authorship Corresponding authors: [email protected], [email protected], [email protected] Running Title: DNA hypermethylation of enhancers in myeloma. Keywords: DNA hypermethylation, enhancer, multiple myeloma Cold Spring Harbor Laboratory Press on February 12, 2015 - Published by genome.cshlp.org Downloaded from
-
Upload
independent -
Category
Documents
-
view
1 -
download
0
Transcript of Whole-epigenome analysis in multiple myeloma reveals DNA hypermethylation of B cell-specific...
BLUEPRINT-IHEC _ Agirre et al., 2nd revision submitted in January 2015
1
Whole-epigenome analysis in multiple myeloma reveals DNA
hypermethylation of B cell-specific enhancers
Xabier Agirre,1 Giancarlo Castellano,2 Marien Pascual,1 Simon Heath3, Marta Kulis,2 Victor Segura,4 Anke Bergmann,5 Anna Esteve,3 Angelika Merkel,3 Emanuele Raineri,3 Lidia Agueda,3 Julie Blanc,3 David Richardson,6 Laura Clarke,6 Avik Datta,6 Nuria Russiñol,2 Ana C. Queirós,2 Renée Beekman,2 Juan R. Rodríguez-Madoz,1 Edurne San José-Enériz,1 Fang Fang,7 Norma C. Gutiérrez,8 José M. García-Verdugo,9 Michael I. Robson,10 Eric C. Schirmer,10 Elisabeth Guruceaga,4 Joost H.A. Martens,11 Marta Gut,3 Maria J. Calasanz,12 Paul Flicek,6 Reiner Siebert,5 Elías Campo,2 Jesús F. San Miguel,13 Ari Melnick,7 Hendrik G. Stunnenberg,11 Ivo G. Gut,3 Felipe Prosper,1,13,14 and José I. Martín-Subero2,14 1Area de Oncología, Centro de Investigación Médica Aplicada (CIMA), Universidad de Navarra, Pamplona, Spain. 2Unidad de Hematopatología, Servicio de Anatomía Patológica, Hospital Clínic, Universitat de Barcelona, Institut d’Investigacions Biomèdiques August Pi i Sunyer (IDIBAPS), Barcelona, Spain. 3Centro Nacional de Análisis Genómico, Parc Científic de Barcelona, Barcelona, Spain. 4Unidad de Bioinformática, Centro de Investigación Médica Aplicada (CIMA), Universidad de Navarra, Pamplona, Spain. 5Institute of Human Genetics, Christian-Albrechts-University, Kiel, Germany. 6European Bioinformatics Institute, European Molecular Biology Laboratory, , Cambridge, UK. 7Division of Hematology/Oncology, Department of Medicine, Weill Cornell Medical College, New York, USA. 8Hospital Universitario de Salamanca, Salamanca, Spain 9Department of Cellular Morphology, University of Valencia, Unidad Mixta CIPF-UVEG, CIBERNED, Valencia, Spain. 10The Wellcome Trust Centre for Cell Biology, University of Edinburgh, Edinburgh, UK. 11Department of Molecular Biology, Faculty of Science, Nijmegen Centre for Molecular Life Sciences, Radboud University Nijmegen, Nijmegen, The Netherlands. 12Departamento de Genética, Universidad de Navarra, Pamplona, Spain. 13Clínica Universidad de Navarra, Universidad de Navarra, Pamplona, Spain. 14 These authors share senior authorship Corresponding authors: [email protected], [email protected], [email protected] Running Title: DNA hypermethylation of enhancers in myeloma. Keywords: DNA hypermethylation, enhancer, multiple myeloma
Cold Spring Harbor Laboratory Press on February 12, 2015 - Published by genome.cshlp.orgDownloaded from

BLUEPRINT-IHEC _ Agirre et al., 2nd revision submitted in January 2015
2
Abstract
While analyzing the DNA methylome of multiple myeloma (MM), a
plasma cell neoplasm, by whole-genome bisulfite sequencing and high-density
arrays, we observed a highly heterogeneous pattern globally characterized by
regional DNA hypermethylation embedded in extensive hypomethylation. In
contrast to the widely reported DNA hypermethylation of promoter-associated
CpG islands (CGIs) in cancer, hypermethylated sites in MM, as opposed to
normal plasma cells, were located outside CpG islands and were unexpectedly
associated with intronic enhancer regions defined in normal B cells and plasma
cells. Both RNA-seq and in vitro reporter assays indicated that enhancer
hypermethylation is globally associated with downregulation of its host genes.
ChIP-seq and DNase-seq further revealed that DNA hypermethylation in these
regions is related to enhancer decommissioning. Hypermethylated enhancer
regions overlapped with binding sites of B cell-specific transcription factors
(TFs) and the degree of enhancer methylation inversely correlated with
expression levels of these TFs in MM. Furthermore, hypermethylated regions in
MM were methylated in stem cells and gradually became demethylated during
normal B-cell differentiation, suggesting that MM cells either reacquire
epigenetic features of undifferentiated cells or maintain an epigenetic signature
of a putative myeloma stem cell progenitor. Overall, we have identified DNA
hypermethylation of developmentally-regulated enhancers as a new type of
epigenetic modification associated with the pathogenesis of MM.
Cold Spring Harbor Laboratory Press on February 12, 2015 - Published by genome.cshlp.orgDownloaded from
BLUEPRINT-IHEC _ Agirre et al., 2nd revision submitted in January 2015
3
Multiple Myeloma (MM) is an aggressive and incurable neoplasm
characterized by clonal proliferation of plasma cells in the bone marrow and a
marked clinico-biological heterogeneity (Bergsagel et al. 2013; Morgan et al.
2012). MM frequently arises from a pre-malignant state known as monoclonal
gammopathy of undetermined significance (MGUS), although the precise
molecular mechanisms involved in the progression from MGUS to MM are only
partially understood. Various distinct genetic abnormalities have been observed
in both MM and MGUS, including gene mutations, chromosomal
rearrangements or aneusomies (Bergsagel and Kuehl. 2005; Chapman et al.
2011; Chng et al. 2006).
Besides genetic abnormalities, recent studies have shown that epigenetic
changes such as DNA methylation play an important role in MM. Various
reports indicate that DNA methylation patterns are capable of distinguishing
normal plasma cells (NPCs) from MGUS and MM cells. The major differences
between these entities can be explained by the occurrence of DNA
hypomethylation in malignant plasma cells (Walker et al. 2011; Salhia et al.
2010; Heuck CJ et al. 2013). In addition to this DNA hypomethylation, some
studies have demonstrated aberrant DNA hypermethylation of promoter regions
of different tumor suppressor genes in MM, although the classical CpG island
methylator phenotype (CIMP) extensively observed in a wide variety of tumors
(Issa 2004) has been rarely reported in MM (Martin et al. 2008).
Hypermethylation of RASD1, for example, has been correlated with resistance
of MM to dexamethasone (Nojima et al. 2009). Inappropriate DNA methylation
of TNFRSF18 (also known as GITR) (Liu et al. 2013), MIR34B/C (Wong et al.
Cold Spring Harbor Laboratory Press on February 12, 2015 - Published by genome.cshlp.orgDownloaded from

BLUEPRINT-IHEC _ Agirre et al., 2nd revision submitted in January 2015
4
2011), or the combined inactivation of genes GPX3, RBP1, SPARC and TGFBI
(Kaiser et al. 2013) have been associated with poor prognosis, survival and
disease progression in patients with MM.
In spite of these significant findings, the high-throughput DNA
methylation reports published so far in MM were restricted to the study of
promoter regions (Heuck et al. 2013; Kaiser et al. 2013; Nojima et al. 2009;
Salhia et al. 2010; Walker et al. 2011). Hence, the purpose of our study was to
adopt a more extensive and unbiased analysis of the DNA methylome, including
promoters, gene bodies and intergenic regions in normal plasma cells (NPC)
and plasma cells from MGUS and MM patient samples. Using this approach, we
have identified that DNA methylation of B cell-specific enhancer regions is a
new phenomenon associated with MM pathogenesis.
Cold Spring Harbor Laboratory Press on February 12, 2015 - Published by genome.cshlp.orgDownloaded from

BLUEPRINT-IHEC _ Agirre et al., 2nd revision submitted in January 2015
5
Results
The DNA methylome of MM is globally characterized by a large degree of
heterogeneity
To analyze the DNA methylome and define general epigenetic signatures
associated with plasma cell disorders, we applied the HumanMethylation450
BeadChip (Illumina Inc.) to purified plasma cells obtained from bone marrow
samples of MM (n=104) and MGUS (n=16) patients as well as normal bone
marrows (n=3 pools from 4 donors each) and non-tumoral tonsils (n=8)
(Supplemental Table 1). Unsupervised principal component analysis of the
normalized DNA methylation data identified a clear distinction between NPC
and MM samples, with a larger degree of heterogeneity in the myeloma plasma
cells (Fig. 1A,B; Supplemental Fig. 1). Next, we further characterized this
heterogeneity of MM by comparing it with other lymphoid malignancies. We
calculated the median methylation value per case and measured the variability
per entity. The coefficient of variation (CV) was significantly higher (P<0.001) in
MM (CV=30.7) than in acute lymphoblastic leukemia (ALL, CV=7.9), chronic
lymphocytic leukemia (CLL, CV=5.3) and diffuse large B cell lymphoma
(DLBCL, CV=10.4) (Fig. 1C). This analysis shows that the extreme
heterogeneity of DNA methylation levels seems to be an epigenetic feature
which is specific for MM. To further characterize this variable pattern, we
sequenced the whole DNA methylome at a single base pair resolution (>51-fold
coverage per sample) of NPCs from bone marrow and two MM in which the
HumanMethylation450 BeadChip indicated extreme hyper- or hypomethylation
(white arrows in Fig. 1B; Supplemental Fig. 1; Supplemental Tables 1 and 2).
Indeed, these analyses validated the array data at the whole-genome level, with
Cold Spring Harbor Laboratory Press on February 12, 2015 - Published by genome.cshlp.orgDownloaded from

BLUEPRINT-IHEC _ Agirre et al., 2nd revision submitted in January 2015
6
the genome of MM1 being hypermethylated and that of MM2 being
hypomethylated as compared to NPCs (Fig. 1D-F). Hence, MM can show
different methylomes, with a wide range of methylation levels that range from
globally hypo- to hypermethylated.
Detection of aberrant DNA methylation in MM and MGUS
To obtain a reliable whole-genome measure of the magnitude of
epigenetic changes in MM, we compared the methylation levels of each MM
sample with extreme methylation patterns and NPCs. Sample MM1 showed
1,504,700 differentially methylated regions (DMRs) covering a total of 2,158,824
CpG dinucleotides whereas MM2 had 1,875,824 DMRs covering 4,308,958
CpGs. As previously suggested in Fig. 1D, the majority of DMRs identified in
MM2 were hypomethylated whereas MM1 showed less hypomethylation and
increased hypermethylation levels (Fig. 2A,B).
Next, we attempted to generate a consensus differential methylation
signature of MGUS and MM in comparison with NPCs, using microarray data of
a large series of samples (Fig. 2C-E). From 78,998 differentially methylated
CpGs identified between MM and NPC, the great majority were hypomethylated
(98.3%). In MGUS, we detected 9,388 differentially methylated CpGs, of which
6,874 (73.2%) were hypomethylated and 2,514 (26.8%) hypermethylated (Fig.
2C-E; Supplemental Fig. 2). A direct comparison between MM and MGUS
revealed that the progression from MGUS to MM seems to be associated with
increased hypomethylation in the absence of additional hypermethylation
events (Supplemental Fig. 3).
Cold Spring Harbor Laboratory Press on February 12, 2015 - Published by genome.cshlp.orgDownloaded from

BLUEPRINT-IHEC _ Agirre et al., 2nd revision submitted in January 2015
7
Applying an unsupervised analysis in order to compare the DNA
methylation profiles of clinically-relevant MM subtypes based on the presence
or absence of cytogenetic alterations, i.e. hyperdiploidy, chromosomal
translocations affecting the immunoglobulin heavy chain (IGH) locus and TP53
deletions, we did not find any apparent association (Fig. 1B; Supplemental Fig.
4). These results were confirmed using a supervised approach, in which we
observed only a few differentially methylated CpGs between cytogenetic
subgroups (Supplemental Fig. 5). However, these findings do not rule out the
possibility that other genetic aberrations, not analyzed in our study, may be
related to DNA methylation changes, as shown previously in MM as well as in
other tumors (Walker et al. 2011; Weisenberger et al. 2006).
Hypo- and hypermethylated CpGs in MM are located in specific genomic
regions and enriched in particular chromatin states
Hypomethylated sites in MM and MGUS mainly occurred in regions
lacking CpG islands (CGI) and were predominantly located in gene bodies and
intergenic regions. Although both WGBS and HumanMethylation450 BeadChip
showed this effect, the enrichment, when compared with the background
distribution, was particularly evident in the consensus signature (MM vs. NPCs)
derived from HumanMethylation450 BeadChip. Interestingly, hypermethylated
sites also occurred in regions lacking CGIs (Supplemental Fig. 6).
In order to investigate the functional significance of aberrant DNA
methylation in MM, we annotated hypo- and hypermethylated CpGs according
to functional chromatin states recently described by ChIP-seq in immortalized
mature B cells (IMBCs) (Ernst et al. 2011), which have a DNA methylation
Cold Spring Harbor Laboratory Press on February 12, 2015 - Published by genome.cshlp.orgDownloaded from

BLUEPRINT-IHEC _ Agirre et al., 2nd revision submitted in January 2015
8
profile similar to normal memory B cells and plasma cells (Supplemental Fig. 7).
As previously observed in colon cancer (Berman et al. 2011), the great majority
(75-80%) of hypomethylated CpGs in MM and MGUS, or those losing
methylation in the progression from MGUS to MM, were located in
heterochromatic and late-replicating regions such as lamina-associated
domains (LADs) (Fig. 2F; Supplemental Fig. 3 and 8). We analyzed the
potential effect of this epigenetic change and we found neither a morphological
alteration of the chromatin bound to the nuclear lamina by electron microscopy
nor a detachment of hypomethylated regions from the nuclear lamina by 3D-
FISH. We then studied the transcriptome of 11 MM cases and four NPCs by
RNA-seq, and we observed that genes located in hypomethylated
heterochromatic regions globally showed low expression levels both in NPCs
and MMs regardless of their methylation status (Supplemental Fig. 9).
Furthermore, focusing only on promoter regions undergoing demethylation, only
1.9% of the CpGs showed a significant correlation (P<0.01) with gene
expression. These data suggest that heterochromatin hypomethylation seems
to have a low impact on gene expression.
Remarkably, a large proportion of hypermethylated CpGs in MM (n=794;
59.9%; P < 1x10-12; Supplemental Table 3) and MGUS (n=1,656; 65.9%; P <
1x10-12) were located within enhancer regions (Figs. 2F; 3A; Supplemental Fig.
10), and in particular, within intronic enhancers (Supplemental Fig. 11). To
evaluate whether differential methylation of enhancers in MM may be
functionally relevant, we analyzed the expression of their associated genes by
RNA-seq. Overall, we observed a shift towards an inverse correlation between
enhancer methylation and their associated gene expression as compared to
Cold Spring Harbor Laboratory Press on February 12, 2015 - Published by genome.cshlp.orgDownloaded from

BLUEPRINT-IHEC _ Agirre et al., 2nd revision submitted in January 2015
9
non-enhancer intronic regions of the same genes (Fig. 3B-F; Supplemental
Table 4), which mostly took place in the absence of DNA methylation changes
in the corresponding promoter regions (Supplemental Fig. 12). In fact, out of the
50 genes with the strongest inverse correlation between enhancer methylation
and gene expression, only two (4%) showed concurrent promoter
hypermethylation. We further analyzed the consequences of differential DNA
methylation at enhancer regions, and observed that treating a MM cell line with
5-azacytidine led to increased expression of SLC15A4 and PVT1
(Supplemental Fig. 13). Due to the unspecificity of this pharmacological
treatment, we also performed reporter assays using a CpG-Free Luciferase
Vector (Klug and Rehli. 2006). We cloned three enhancer regions into this
vector, which showed variable levels of correlation between DNA methylation
and expression levels (Supplemental Table 5). Luciferase activity analyzed in
transient transfection assays comparing unmethylated and in vitro methylated
vectors revealed that upon enhancer methylation, the luciferase activity was
reduced, further supporting our findings in primary tumors (Fig. 3D-F).
Hypermethylation of B cell-specific enhancers in MM is associated with
enhancer decommissioning
After showing that DNA methylation is related to enhancer activity, we
attempted to analyze the biological function of the genes with hypermethylated
enhancers (631 genes associated with the 794 CpGs). A Gene Ontology
analysis pointed to significant enrichment of various terms associated with B-
cell differentiation (Supplemental Table 6). Furthermore, using transcription
factor binding sites (TFBSs) identified by ChIP-seq in the ENCODE Project
Cold Spring Harbor Laboratory Press on February 12, 2015 - Published by genome.cshlp.orgDownloaded from

BLUEPRINT-IHEC _ Agirre et al., 2nd revision submitted in January 2015
10
(Gerstein et al. 2012), we observed that hypermethylated enhancers overlapped
with binding sites of TFs associated with B-cell differentiation such as BCL11A,
BATF, EBF1 and PAX5 (Supplemental Table 7). These data led us to
investigate whether the DNA methylation levels of these enhancer regions are
modulated during normal B-cell differentiation. We analyzed the DNA
methylation profiles of seven B-cell differentiation stages, including
hematopoietic multipotent progenitors, several immature B cells, naive B cells,
germinal center B cells and plasma cells. In addition, we included embryonic
stem cells (ESCs) and IMBCs (Ernst et al. 2011) in the analysis, as well as
other B-cell neoplasms such as CLL (n=139) (Kulis et al. 2012), ALL (n=46)
(Busche et al. 2013) and DLBCL (n=40). Surprisingly, the 794 enhancer-
associated CpGs hypermethylated in MM were also methylated in ESCs and
gradually lost DNA methylation, finally becoming completely unmethylated in
germinal center B cells and terminally differentiated plasma cells (Fig. 4A). We
found that ALLs appear to maintain a methylation pattern resembling their
cellular origin (precursor B cell), while DLBCLs, similarly to MM, show
hypermethylation of B cell-specific enhancers when compared to their cell of
origin (i.e. germinal center B-cells) (Supplemental Fig. 14).
Next, we studied whether enhancer hypermethylation in MM was
accompanied by a change in the chromatin state. We performed ChIP-seq with
antibodies against monomethylated lysine 4 (H3K4me1) and acetylated lysine
27 (H3K27ac) of histone 3 in NPCs and in the MM cell line U266, and also
DNase-seq in the latter. Data were compared to ESCs (showing
hypermethylated enhancers, similar to MM) and IMBCs (with unmethylated
enhancers, similar to NPCs). As shown in Fig. 4B, the genomic areas
Cold Spring Harbor Laboratory Press on February 12, 2015 - Published by genome.cshlp.orgDownloaded from

BLUEPRINT-IHEC _ Agirre et al., 2nd revision submitted in January 2015
11
surrounding unmethylated enhancers in IMBCs show a clear enrichment of
H3K4me1 and H3K27ac as well as DNase hypersensitive sites. In NPCs, the
regions under study lost H3K27ac but H3K4me1 showed a strong signal,
indicating that they maintain their enhancer status. In contrast, methylated
enhancers in ESCs and the U266 cell line actually represent decommissioned
enhancers (Rivera and Ren. 2013; Whyte et al. 2012) lacking all the enhancer-
associated features (Fig. 4B,C). Interestingly, 125 of the 794 enhancers with
significant hypermethylation in MM cases were unmethylated in the U266 MM
cell line. Similarly to IMBCs, these unmethylated B-cell enhancers were
accompanied by a chromatin structure linked to active enhancers in the MM cell
line (Fig. 4C). This finding is further supported by the fact that enhancers
(defined as such in IMBCs) hypomethylated in IMBCs, NPCs and the MM cell
line, but hypermethylated in ESCs, only showed active enhancer-related
chromatin marks in the first three (Supplemental Fig. 15).
Downregulation of B cell-specific transcription factors in MM is
associated with enhancer hypermethylation
All the above results suggest that MMs acquire hypermethylation in
enhancer regions that paradoxically undergo demethylation during normal B-cell
differentiation (Fig. 4A). Since the process of B-cell differentiation is guided by
expression of stage-specific TFs (Kurosaki et al. 2010; Matthias and Rolink.
2005), the binding of TFs to their target enhancers may result in demethylation.
Several lines of evidence support this model in which DNA demethylation during
cell development is mediated by the presence of TFs, whose binding may block
DNA methylation maintenance after cell division (Hon et al. 2013; Kulis et al.
Cold Spring Harbor Laboratory Press on February 12, 2015 - Published by genome.cshlp.orgDownloaded from
BLUEPRINT-IHEC _ Agirre et al., 2nd revision submitted in January 2015
12
2013; Lee et al. 2012; Stadler et al. 2011; Feldmann et al. 2013). Interestingly,
here we have observed the reverse process in plasma cell disorders in which B
cell-specific TF binding sites seem to reacquire a chromatin state which is
typical of undifferentiated cells. Therefore, we postulate that downregulation of
B cell-specific TFs in MM cells could result in enhancer methylation and
decommissioning. To test this hypothesis, we analyzed the expression levels of
B cell-specific TFs in MMs and NPCs by RNA-seq, and correlated them with the
mean DNA methylation level of the enhancers with altered methylation in MM.
Interestingly, for most of the B cell-specific TFs, we observed an inverse
correlation between their expression and methylation levels of their target
enhancers (Fig. 5A). Among these, the expression of STAT5, PAX5, NFATC1
and BATF, showed a significant negative correlation with DNA methylation
levels of enhancers in normal and neoplastic plasma cells (Pearson coefficient
ranging from -0.79 to -0.62, P<0.05) (Fig. 5A-D; Supplemental Table 8).
Furthermore, variable expression of several of these TFs was coordinated in
MM patients (Fig. 5E), suggesting that the expression level of a TF network,
and not that of individual TFs, was associated with the methylation levels of
enhancers. In line with this finding, the expression levels of genes regulated by
enhancer methylation also showed a correlated expression among MM patients
(Supplemental Fig. 16).
Cold Spring Harbor Laboratory Press on February 12, 2015 - Published by genome.cshlp.orgDownloaded from
BLUEPRINT-IHEC _ Agirre et al., 2nd revision submitted in January 2015
13
Discussion
In this study, we have characterized the DNA methylome of normal and
neoplastic plasma cells using a double approach. On the one hand, we
generated an epigenetic signature of common DNA methylation changes in
MGUS and MM by comparing them to NPCs, using the HumanMethylation450
BeadChip in a large series of patients. On the other hand, we analyzed the
whole DNA methylome at single base-pair resolution of two samples from the
extremes of the DNA methylation spectrum of MM. This second approach
allowed us to characterize the epigenetic heterogeneity in MM, to define the
boundaries of DMRs and to measure the magnitude of DNA methylation
changes in MM at the whole-genome level.
As shown in other studies (Salhia et al. 2010; Walker et al. 2011; Heuck
et al. 2013), we describe a clear distinction in DNA methylation patterns
between malignant and normal plasma cells, mostly in the form of
hypomethylation in the former. Interestingly, one of the major features of MM is
the extreme heterogeneity of median DNA methylation levels, which ranges
from globally hypo- to globally hypermethylated as compared to NPCs. This
heterogeneity in MM is remarkably higher than in other malignancies of the B-
cell lineage (Fig. 1C). Premalignant MGUS samples were less heterogeneous
than MM but shared a similar hypermethylation signature. In contrast,
hypomethylation in MM was much more extensive and heterogeneous than in
MGUS, suggesting that it may be related to progression from MGUS to MM, as
previously reported (Salhia et al. 2010; Walker et al. 2011; Heuck et al. 2013).
In contrast to other studies (Walker et al. 2011), we did not observe the
epigenetic variability in MM to be associated with particular genetic changes.
Cold Spring Harbor Laboratory Press on February 12, 2015 - Published by genome.cshlp.orgDownloaded from

BLUEPRINT-IHEC _ Agirre et al., 2nd revision submitted in January 2015
14
However, we cannot rule out the possibility that some genetic features, not
analyzed in our study, could be correlated with the heterogeneous DNA
methylome. Although the causes of epigenetic heterogeneity in MM require
further investigation, we postulate that this phenomenon could be the
consequence of both the DNA methylation pattern of the founder plasma cell
clone within the heterogeneous plasma cell pool and the proliferative history of
the neoplastic cells in a particular case.
One of the most unexpected findings of our study is that DNA
hypermethylation in MGUS and MM occurred in regions outside CGIs. This
finding contrasts with the classical cancer-associated CIMP (Issa 2004; Fang et
al. 2014) and recent whole-methylome reports, in which hypermethylation is
invariably associated with CGIs and CGI shores close to promoter regions
(Berman et al. 2011; Hansen et al. 2011; Kulis et al. 2012). Remarkably, a large
proportion of hypermethylated CpGs in MM and MGUS were located within
intronic regions with enhancer-related chromatin marks in non-malignant mature
B cells and plasma cells. Analyzing the methylation of these regions in the
context of B-cell differentiation, we observed a gradual demethylation from stem
cells to plasma cells. Hence, the observed methylation pattern of these regions
in MM is similar to undifferentiated precursor and stem cells. This finding may
reveal new potential insights in the biology of the disease. On the one hand, it
may represent a de novo epigenetic reprogramming in MM, leading to the
acquisition of a methylation pattern related to stemness. On the other hand, we
cannot rule out that the observed pattern could reflect an epigenetic imprint of
initial premalignant phases of the disease in progenitor cells.
Cold Spring Harbor Laboratory Press on February 12, 2015 - Published by genome.cshlp.orgDownloaded from

BLUEPRINT-IHEC _ Agirre et al., 2nd revision submitted in January 2015
15
Our analysis of the chromatin in B cells, plasma cells and MM revealed
that enhancer hypermethylation in MM was associated with enhancer
decommissioning, as recently shown in prostate and breast cancer (Taberlay et
al. 2014). Several studies have provided evidence indicating that the binding of
specific TFs mediates the loss of DNA methylation at regulatory elements
during the cell differentiation (Hon et al. 2013; Kulis et al. 2013; Lee et al. 2012;
Stadler et al. 2011; Feldmann et al. 2013). Here, we have observed that the
hypermethylation and decommissioning of specific B-cell enhancers in MM
appear to be related to downregulation of a network of B-cell TFs. Similarly to
the globally heterogeneous methylation pattern, this hypermethylation of B-cell
enhancers also varied among different cases, and may be useful to detect
disease subtypes. Interestingly, about 20% of the MM patients express the B-
cell marker CD20 (San Miguel et al. 1991). We speculate that this MM subtype
may lack hypermethylation and decommissioning of B-cell enhancers, allowing
part of the B-cell signature to be maintained. In conclusion, our results suggest
that MMs show a widely heterogeneous DNA methylation pattern. Embedded
into an extensive hypomethylated genome, we identified DNA hypermethylation
of developmentally regulated enhancers as a new epigenetic feature of MM.
The delineation of the precise role of enhancer hypermethylation in MM
pathogenesis and its potential usefulness in the clinical setting as a new source
of epigenetic biomarkers shall be further investigated.
Cold Spring Harbor Laboratory Press on February 12, 2015 - Published by genome.cshlp.orgDownloaded from

BLUEPRINT-IHEC _ Agirre et al., 2nd revision submitted in January 2015
16
Methods
Patient samples and cell line
Purified plasma cells from bone marrow aspirations were obtained from newly
diagnosed patients of MM (n=104) and MGUS (n=16). As negative controls, we
purified plasma cells from healthy donors (8 tonsils and 12 bone marrows, the
latter pooled into 3 samples of 4 donors each). The MM cell line U266 was
kindly provided by Dr. Cigudosa (Spanish National Cancer Centre-CNIO,
Madrid, Spain). Further details on the biological materials used in our study are
described in the Supplemental Methods section.
DNA methylation analysis
Whole-genome bisulfite sequencing and HumanMethylation450 BeadChip
(Illumina) were carried out in order to analyze the DNA methylation profile of
MM, MGUS, normal plasma cells and the U266 MM cell line. Details on the
experimental procedures, annotation of CpG sites, detection of differentially
methylated regions and Gene Ontology analysis are described in the
Supplemental Methods section.
Analysis of RNA-seq data
RNA samples from 11 MMs (also analyzed by HumanMethylation450
BeadChip) and 4 NPCs from tonsils were sequenced using the standard
Illumina protocol. Technical details are described in the Supplemental Methods
section.
Cold Spring Harbor Laboratory Press on February 12, 2015 - Published by genome.cshlp.orgDownloaded from
BLUEPRINT-IHEC _ Agirre et al., 2nd revision submitted in January 2015
17
Luciferase Reporter Assay
pCpGL empty vector and pCpGL-CMV/EF1 were kindly provided by Dr. Rehli,
(University Hospital, Regensburg, Germany). To properly initiate the
transcription, a CpG free minimal promoter (5´-
AGAGGGTATATAATGGAAGCTTAACTTCCAG-3´) was also cloned in the
pCpGL empty vector (see details in the Supplemental Methods section).
ChIP-seq and DNase-seq
ChIP-seq was performed in NPCs and in the U266 cell line, and DNase-seq
was carried out only on the latter. Standard protocols generated within the
Blueprint Consortium were followed. Protocol details can be found at:
http://www.blueprint-epigenome.eu/index.cfm?p=7BF8A4B6-F4FE-861A-
2AD57A08D63D0B58.
Mapped reads of the ChIP-seq data for H3K4me1 and H3K27ac as well as
DNase-seq data from the cell lines GM12878 and H1 were downloaded from
the UCSC Genome Browser (GRCh37/hg19 Assembly – http://genome-
euro.ucsc.edu).
Read density around the 794 CpGs hypermethylated in MM was calculated by
seqMINER tool using 5Kb window upstream and downstream the CpGs of
interest (Ye et al. 2011).
Analysis of transcription factor binding sites
We used ChIP-seq data from the ENCODE Project available at the UCSC
Genome Browser (http://genome.ucsc.edu/cgi-
bin/hgTrackUi?db=hg19&g=wgEncodeHaibTfbs) to obtain information on
Cold Spring Harbor Laboratory Press on February 12, 2015 - Published by genome.cshlp.orgDownloaded from

BLUEPRINT-IHEC _ Agirre et al., 2nd revision submitted in January 2015
18
transcription factor binding site (TFBS) of a total of 163 TFs. The relative
enrichment of each TFBS was calculated for the 794 hypermethylated CpGs
located in enhancer elements in comparison with the background. A Fisher's
exact test was used, and both an Odds Ratio and a P value were assigned to
each comparison.
Cold Spring Harbor Laboratory Press on February 12, 2015 - Published by genome.cshlp.orgDownloaded from

BLUEPRINT-IHEC _ Agirre et al., 2nd revision submitted in January 2015
19
Data access
WGBS, HumanMethylation450 BeadChip and RNA-seq data have been
deposited in the European Genome-phenome Archive
(https://www.ebi.ac.uk/ega/) under accession numbers EGAD00001000672,
EGAS00001000841 and EGAS00001001110, respectively. ChIP-seq and
DNase-seq data from the U266 cell line have been deposited in the European
Nucleotide Archive (https://www.ebi.ac.uk/ena/) under sample accession
numbers SAMEA2165292 and SAMEA2165299, respectively.
Acknowledgments
We thank C. López-Otín for the critical reading of this manuscript, J.C.
Cigudosa for kindly providing the U266 MM cell line; M. Ardanaz, M.P. Rabasa,
M. Xirvent, A. Pereda, G. Azaceta, A. Urquia, V. Carrasco, E. Amutio, S. Varea,
A. Alfonso and M.J. Larrayoz for providing the patients's data; and Amaia Vilas
for her excellent technical assistance. This work was funded by the European
Union's Seventh Framework Programme through the Blueprint Consortium
(grant agreement 282510), the Spanish Ministry of Economy and Competitivity
(MINECO) (project SAF2009-08663), grants from Instituto de Salud Carlos III
(ISCIII) PI10/01691, PI13/01469, RTICC RD12/0036/0068, and the Fundació La
Marató de TV3 (20132130-31-32). X.A is a Marie Curie researcher under
contract “LincMHeM-330598”, and J.I.M.-S. is a Ramon y Cajal researcher of
the MINECO. M.K. is supported by the AGAUR (Generalitat de Catalunya) and
M.P. is supported by a Sara Borrell fellowship CD12/00540.
Cold Spring Harbor Laboratory Press on February 12, 2015 - Published by genome.cshlp.orgDownloaded from

BLUEPRINT-IHEC _ Agirre et al., 2nd revision submitted in January 2015
20
Disclosure declaration
The authors declare no competing interest
Author contributions
X.A., G.C, MK, and J.I.M.-S. analyzed the DNA methylation microarrays. S.H.,
A.E., A.Me. and E.R. processed and analyzed WGBS data. L.A., J.B. and M.G.
performed WGBS library preparation and sequencing. G.C. A.B., N.R., J.H.A.M,
R.S. and H.G.S performed ChIP-seq or analyzed the data. G.C., V.S., F.F. E.G.
and A.Mel. performed RNA-seq experiments or analyzed the data. N.C.G.,
M.J.C., E.C., J.S.M. and F.P. reviewed the pathologic and clinical data and
confirmed diagnosis. M.P. and M.J.C. coordinated or performed sample
preparation and quality control. M.J.C. performed FISH analyses. J.M.G.-V.,
M.I.R. and E.C.S. performed analysis for studying the nuclear lamina. M.P,
J.R.R.-M. and E.S.J.-E. performed functional in vitro experiments. G.C., M.K.,
A.C.Q. and R.B. functionally characterized differentially methylated regions.
D.R., L.C., A.D., P.F. were in charge of data management. R.S., E.C., A.Mel.,
H.G.S. and I.G.G. coordinated next-generation sequencing efforts and
performed primary data analysis. F.P. and J.I.M.-S. conceived the study, X.A.,
F.P. and J.I.M.-S. led the experiments and wrote the paper.
Cold Spring Harbor Laboratory Press on February 12, 2015 - Published by genome.cshlp.orgDownloaded from
BLUEPRINT-IHEC _ Agirre et al., 2nd revision submitted in January 2015
21
Figure legends
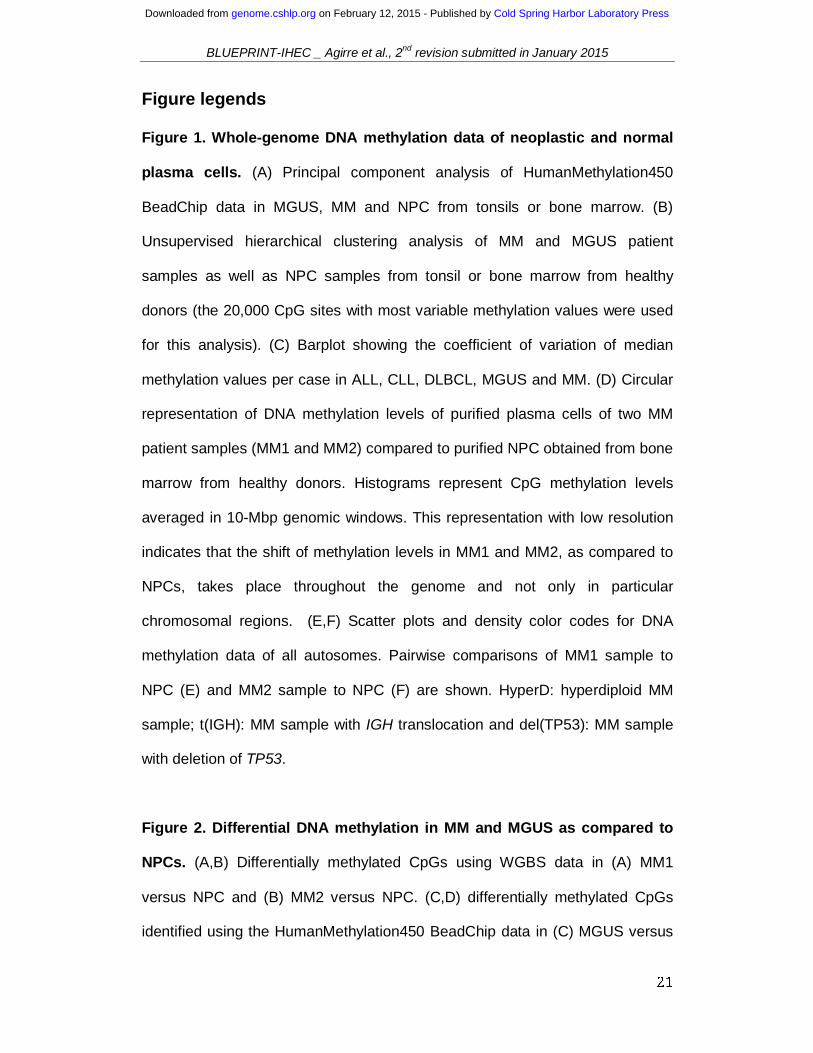
Figure 1. Whole-genome DNA methylation data of neoplastic and normal
plasma cells. (A) Principal component analysis of HumanMethylation450
BeadChip data in MGUS, MM and NPC from tonsils or bone marrow. (B)
Unsupervised hierarchical clustering analysis of MM and MGUS patient
samples as well as NPC samples from tonsil or bone marrow from healthy
donors (the 20,000 CpG sites with most variable methylation values were used
for this analysis). (C) Barplot showing the coefficient of variation of median
methylation values per case in ALL, CLL, DLBCL, MGUS and MM. (D) Circular
representation of DNA methylation levels of purified plasma cells of two MM
patient samples (MM1 and MM2) compared to purified NPC obtained from bone
marrow from healthy donors. Histograms represent CpG methylation levels
averaged in 10-Mbp genomic windows. This representation with low resolution
indicates that the shift of methylation levels in MM1 and MM2, as compared to
NPCs, takes place throughout the genome and not only in particular
chromosomal regions. (E,F) Scatter plots and density color codes for DNA
methylation data of all autosomes. Pairwise comparisons of MM1 sample to
NPC (E) and MM2 sample to NPC (F) are shown. HyperD: hyperdiploid MM
sample; t(IGH): MM sample with IGH translocation and del(TP53): MM sample
with deletion of TP53.
Figure 2. Differential DNA methylation in MM and MGUS as compared to
NPCs. (A,B) Differentially methylated CpGs using WGBS data in (A) MM1
versus NPC and (B) MM2 versus NPC. (C,D) differentially methylated CpGs
identified using the HumanMethylation450 BeadChip data in (C) MGUS versus
Cold Spring Harbor Laboratory Press on February 12, 2015 - Published by genome.cshlp.orgDownloaded from

BLUEPRINT-IHEC _ Agirre et al., 2nd revision submitted in January 2015
22
NPC samples and (D) MM versus NPC samples. (E) Heatmap of significantly
hypomethylated (left panel) or hypermethylated CpGs (right panel) in MM
samples versus NPC samples. (F) Relative distribution of differentially hypo- or
hypermethylated CpGs across different functional chromatin states of the
genome using WGBS data (left panel) or HumanMethylation450 BeadChip data
(right panel) as compared to their respective backgrounds (first column). The
numbers inside each cell point to the percentage of CpGs belonging to a
particular chromatin state. WG: whole-genome, HyperM: hypermethylated
CpGs, HypoM: hypomethylated CpGs.
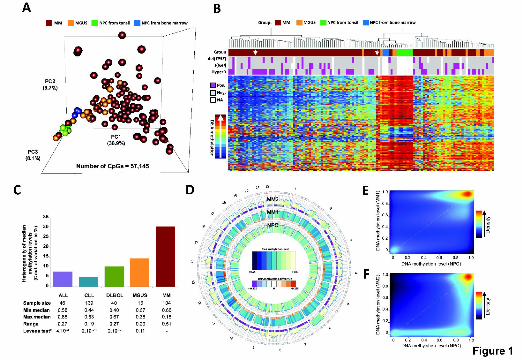
Figure 3. Functional and transcriptional analysis of hypermethylated
enhancer regions in MM. (A) Percentage of hypermethylated CpGs associated
with enhancer regions in MGUS and MM patient samples using
HumanMethylation450 BeadChip data. (B) Density plot of correlation
coefficients between methylation levels of hypermethylated enhancers and the
expression of their associated genes (cyan) using RNA-seq data. As control,
intronic CpGs of the same genes were studied excluding the enhancer
associated ones (black dotted line). For this analysis, we used 663 CpGs (out of
794) annotated to 574 genes with available gene expression, and 8,956 CpGs
in non-enhancer intronic regions of the same genes. (C) A snapshot of the
UCSC Genome Browser showing the promoter (on the left) and the 3' intronic
enhancer region (on the right) of the SLC15A4 gene. Displayed tracks include
the chromatin states characterization in IMBCs and ChIP-seq data for H3K27ac,
H3K4me1 and H3K4me3. DNA methylation levels of NPCs and MM patient
samples measured by WGBS and HumanMethylation450 BeadChip are also
Cold Spring Harbor Laboratory Press on February 12, 2015 - Published by genome.cshlp.orgDownloaded from
BLUEPRINT-IHEC _ Agirre et al., 2nd revision submitted in January 2015
23
shown. (D-F) Correlation analysis between DNA methylation levels of the
hypermethylated enhancers and expression of the associated gene (left panel).
In addition, we display the luciferase reporter activity data of the analyzed
enhancer region (right panel) located in the intron of (D) SLC15A4, (E) PVT1
and (F) NCOR2. MP: minimal promoter; MET: methylated and UNMET:
unmethylated.
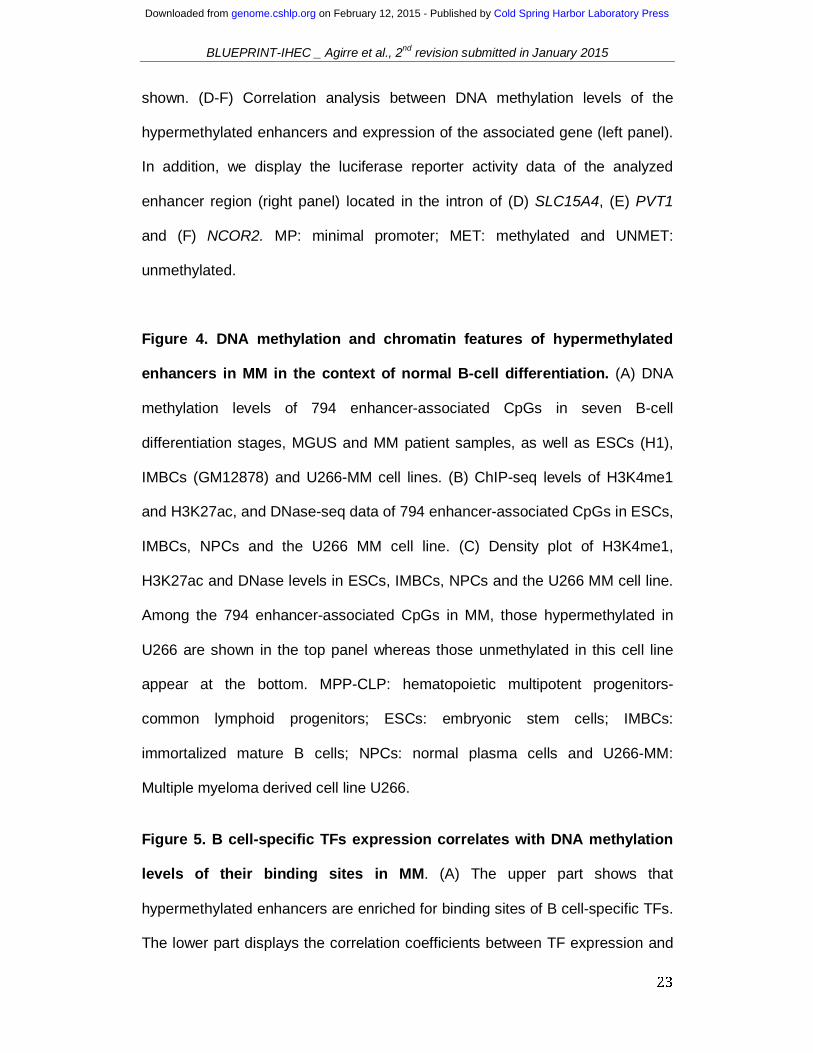
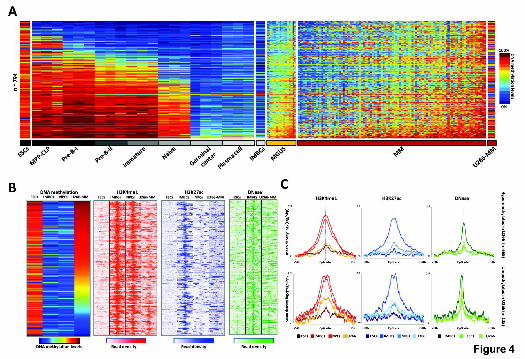
Figure 4. DNA methylation and chromatin features of hypermethylated
enhancers in MM in the context of normal B-cell differentiation. (A) DNA
methylation levels of 794 enhancer-associated CpGs in seven B-cell
differentiation stages, MGUS and MM patient samples, as well as ESCs (H1),
IMBCs (GM12878) and U266-MM cell lines. (B) ChIP-seq levels of H3K4me1
and H3K27ac, and DNase-seq data of 794 enhancer-associated CpGs in ESCs,
IMBCs, NPCs and the U266 MM cell line. (C) Density plot of H3K4me1,
H3K27ac and DNase levels in ESCs, IMBCs, NPCs and the U266 MM cell line.
Among the 794 enhancer-associated CpGs in MM, those hypermethylated in
U266 are shown in the top panel whereas those unmethylated in this cell line
appear at the bottom. MPP-CLP: hematopoietic multipotent progenitors-
common lymphoid progenitors; ESCs: embryonic stem cells; IMBCs:
immortalized mature B cells; NPCs: normal plasma cells and U266-MM:
Multiple myeloma derived cell line U266.
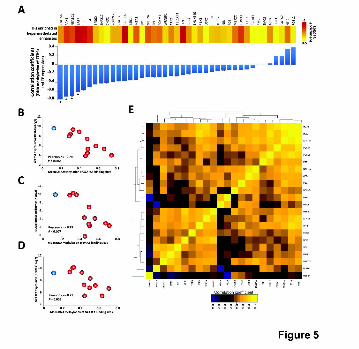
Figure 5. B cell-specific TFs expression correlates with DNA methylation
levels of their binding sites in MM. (A) The upper part shows that
hypermethylated enhancers are enriched for binding sites of B cell-specific TFs.
The lower part displays the correlation coefficients between TF expression and
Cold Spring Harbor Laboratory Press on February 12, 2015 - Published by genome.cshlp.orgDownloaded from

BLUEPRINT-IHEC _ Agirre et al., 2nd revision submitted in January 2015
24
mean DNA methylation level of their respective binding sites that suffer
hypermethylation in MM. (B-D) Scatter plots showing the association between
TF expression and mean methylation level of their respective binding sites.
Normal plasma cells are shown in blue and multiple myeloma samples are
depicted in red. *: P < 0.05. (C) Correlation matrix of expression levels of TFs
among the 11 MM cases with available RNA-seq data. Only those TFs from
panel 5A with at least 1.5 fold enrichment (in log2) were used for this analysis.
Cold Spring Harbor Laboratory Press on February 12, 2015 - Published by genome.cshlp.orgDownloaded from

BLUEPRINT-IHEC _ Agirre et al., 2nd revision submitted in January 2015
25
References
Bergsagel PL, Kuehl WM. 2005. Molecular pathogenesis and a consequent
classification of multiple myeloma. J Clin Oncol 23: 6333-6338.
Bergsagel PL, Mateos MV, Gutierrez NC, Rajkumar SV, San Miguel JF. 2013.
Improving overall survival and overcoming adverse prognosis in the treatment of
cytogenetically high-risk multiple myeloma. Blood 121: 884-892.
Berman BP, Weisenberger DJ, Aman JF, Hinoue T, Ramjan Z, Liu Y, Noushmehr H,
Lange CP, van Dijk CM, Tollenaar RA, et al. 2011. Regions of focal DNA
hypermethylation and long-range hypomethylation in colorectal cancer coincide
with nuclear lamina-associated domains. Nat Genet 44: 40-46.
Busche S, Ge B, Vidal R, Spinella JF, Saillour V, Richer C, Healy J, Chen SH, Droit A,
Sinnett D, et al. 2013. Integration of high-resolution methylome and transcriptome
analyses to dissect epigenomic changes in childhood acute lymphoblastic
leukemia. Cancer Res 73: 4323-4336.
Chapman MA, Lawrence MS, Keats JJ, Cibulskis K, Sougnez C, Schinzel AC, Harview
CL, Brunet JP, Ahmann GJ, Adli M, et al. 2011. Initial genome sequencing and
analysis of multiple myeloma. Nature 471: 467-472.
Chng WJ, Santana-Dávila R, Van Wier SA, Ahmann GJ, Jalal SM, Bergsagel PL,
Chesi M, Trendle MC, Jacobus S, Blood E, et al. 2006. Prognostic factors for
hyperdiploid-myeloma: effects of chromosome 13 deletions and IgH
translocations. Leukemia 20: 807-813.
Ernst J, Kheradpour P, Mikkelsen TS, Shoresh N, Ward LD, Epstein CB, Zhang X,
Wang L, Issner R, Coyne M, et al. 2011. Mapping and analysis of chromatin state
dynamics in nine human cell types. Nature 473: 43-49.
Fang M, Ou J, Hutchinson L, Green MR. 2014. The BRAF oncoprotein functions
through the transcriptional repressor MAFG to mediate the CpG Island Methylator
phenotype. Mol Cell 55:904-915.
Cold Spring Harbor Laboratory Press on February 12, 2015 - Published by genome.cshlp.orgDownloaded from

BLUEPRINT-IHEC _ Agirre et al., 2nd revision submitted in January 2015
26
Feldmann A, Ivanek R, Murr R, Gaidatzis D, Burger L, Schübeler D. 2013.
Transcription factor occupancy can mediate active turnover of DNA methylation at
regulatory regions. PLoS Genet 9: e1003994.
Gerstein MB, Kundaje A, Hariharan M, Landt SG, Yan KK, Cheng C, Mu XJ, Khurana
E, Rozowsky J, Alexander R, et al. 2012. Architecture of the human regulatory
network derived from ENCODE data. Nature 489: 91-100.
Hansen KD, Timp W, Bravo HC, Sabunciyan S, Langmead B, McDonald OG, Wen B,
Wu H, Liu Y, Diep D, et al. 2011. Increased methylation variation in epigenetic
domains across cancer types. Nat Genet 43: 768-775.
Heuck CJ, Mehta J, Bhagat T, Gundabolu K, Yu Y, Khan S, Chrysofakis G, Schinke C,
Tariman J, Vickrey E, et al. 2013. Myeloma is characterized by stage-specific
alterations in DNA methylation that occur early during myelomagenesis. J
Immunol 190: 2966-2975.
Hon GC, Rajagopal N, Shen Y, McCleary DF, Yue F, Dang MD, Ren B. 2013.
Epigenetic memory at embryonic enhancers identified in DNA methylation maps
from adult mouse tissues. Nat Genet 45: 1198-1206.
Issa JP. 2004. CpG island methylator phenotype in cancer. Nat Rev Cancer 4: 988-
993.
Kaiser MF, Johnson DC, Wu P, Walker BA, Brioli A, Mirabella F, Wardell CP, Melchor
L, Davies FE, Morgan GJ. 2013. Global methylation analysis identifies
prognostically important epigenetically inactivated tumor suppressor genes in
multiple myeloma. Blood 122: 219-226.
Klug M, Rehli M. 2006. Functional analysis of promoter CpG methylation using a CpG-
free luciferase reporter vector. Epigenetics 1: 127-130.
Kulis M, Heath S, Bibikova M, Queirós AC, Navarro A, Clot G, Martínez-Trillos A,
Castellano G, Brun-Heath I, Pinyol M, et al. 2012. Epigenomic analysis detects
widespread gene-body DNA hypomethylation in chronic lymphocytic leukemia.
Nat Genet 44: 1236-1242.
Cold Spring Harbor Laboratory Press on February 12, 2015 - Published by genome.cshlp.orgDownloaded from

BLUEPRINT-IHEC _ Agirre et al., 2nd revision submitted in January 2015
27
Kulis M, Queiros AC, Beekman R, Martin-Subero JI. 2013. Intragenic DNA methylation
in transcriptional regulation, normal differentiation and cancer. Biochim Biophys
Acta 1829: 1161-1174.
Kurosaki T, Shinohara H, Baba Y. 2010. B cell signaling and fate decision. Annu Rev
Immunol 28: 21-55.
Lee ST, Xiao Y, Muench MO, Xiao J, Fomin ME, Wiencke JK, Zheng S, Dou X, de
Smith A, Chokkalingam A, et al. 2012. A global DNA methylation and gene
expression analysis of early human B-cell development reveals a demethylation
signature and transcription factor network. Nucleic Acids Res 40: 11339-11351.
Liu Y, Quang P, Braggio E, Ngo H, Badalian-Very G, Flores L, Zhang Y, Sacco A,
Maiso P, Azab AK, et al. 2013. Novel tumor suppressor function of glucocorticoid-
induced TNF receptor GITR in multiple myeloma. PLoS One 8:e66982.
Martin P, Garcia-Cosio M, Santon A, Bellas C. 2008. Aberrant gene promoter
methylation in plasma cell dyscrasias. Exp Mol Pathol 84: 256-261.
Matthias P, Rolink AG. 2005. Transcriptional networks in developing and mature B
cells. Nat Rev Immunol 5: 497-508.
Morgan GJ, Walker BA, Davies FE. 2012. The genetic architecture of multiple
myeloma. Nat Rev Cancer 12: 335-348.
Nojima M, Maruyama R, Yasui H, Suzuki H, Maruyama Y, Tarasawa I, Sasaki Y,
Asaoku H, Sakai H, Hayashi T, et al. 2009. Genomic screening for genes
silenced by DNA methylation revealed an association between RASD1
inactivation and dexamethasone resistance in multiple myeloma. Clin Cancer Res
15: 4356-4364.
Rivera CM, Ren B. 2013. Mapping human epigenomes. Cell 155: 39-55.
Salhia B, Baker A, Ahmann G, Auclair D, Fonseca R, Carpten J. 2010. DNA
methylation analysis determines the high frequency of genic hypomethylation and
low frequency of hypermethylation events in plasma cell tumors. Cancer Res 70:
6934-6944.
Cold Spring Harbor Laboratory Press on February 12, 2015 - Published by genome.cshlp.orgDownloaded from

BLUEPRINT-IHEC _ Agirre et al., 2nd revision submitted in January 2015
28
San Miguel JF, Gonzalez M, Gascon A, Moro MJ, Hernandez JM, Ortega F, Jimenez
R, Guerras L, Romero M, Casanova F, et al. 1991. Immunophenotypic
heterogeneity of multiple myeloma: influence on the biology and clinical course of
the disease. Castellano-Leones (Spain) Cooperative Group for the Study of
Monoclonal Gammopathies. Br J Haematol 77: 185–190.
Stadler MB, Murr R, Burger L, Ivanek R, Lienert F, Schöler A, van Nimwegen E,
Wirbelauer C, Oakeley EJ, Gaidatzis D, et al. 2011. DNA-binding factors shape
the mouse methylome at distal regulatory regions. Nature 480: 490-495.
Taberlay PC, Statham AL, Kelly TK, Clark SJ, Jones PA. 2014. Reconfiguration of
nucleosome-depleted regions at distal regulatory elements accompanies DNA
methylation of enhancers and insulators in cancer. Genome Res 24: 1421-1432.
Walker BA, Wardell CP, Chiecchio L, Smith EM, Boyd KD, Neri A, Davies FE, Ross
FM, Morgan GJ. 2011. Aberrant global methylation patterns affect the molecular
pathogenesis and prognosis of multiple myeloma. Blood 117: 553-562.
Whyte WA, Bilodeau S, Orlando DA, Hoke HA, Frampton GM, Foster CT, Cowley SM,
Young RA. 2012. Enhancer decommissioning by LSD1 during embryonic stem
cell differentiation. Nature 482: 221-225.
Weisenberger DJ, Siegmund KD, Campan M, Young J, Long TI, Faasse MA, Kang GH,
Widschwendter M, Weener D, Buchanan D, et al. 2006. CpG island methylator
phenotype underlies sporadic microsatellite instability and is tightly associated
with BRAF mutation in colorectal cancer. Nat Genet 38:787-93.
Wong KY, Yim RL, So CC, Jin DY, Liang R, Chim CS. 2011. Epigenetic inactivation of
the MIR34B/C in multiple myeloma. Blood 118: 5901-5904.
Ye T, Krebs AR, Choukrallah MA, Keime C, Plewniak F, Davidson I, Tora L. 2011.
seqMINER: an integrated ChIP-seq data interpretation platform. Nucleic Acids
Res 39: e35.
Cold Spring Harbor Laboratory Press on February 12, 2015 - Published by genome.cshlp.orgDownloaded from
Cold Spring Harbor Laboratory Press on February 12, 2015 - Published by genome.cshlp.orgDownloaded from

Cold Spring Harbor Laboratory Press on February 12, 2015 - Published by genome.cshlp.orgDownloaded from
Cold Spring Harbor Laboratory Press on February 12, 2015 - Published by genome.cshlp.orgDownloaded from
Cold Spring Harbor Laboratory Press on February 12, 2015 - Published by genome.cshlp.orgDownloaded from
Cold Spring Harbor Laboratory Press on February 12, 2015 - Published by genome.cshlp.orgDownloaded from
10.1101/gr.180240.114Access the most recent version at doi: published online February 2, 2015Genome Res.
Xabier Agirre, Giancarlo Castellano, Marien Pascual, et al. hypermethylation of B cell-specific enhancersWhole-epigenome analysis in multiple myeloma reveals DNA
Material
Supplemental
http://genome.cshlp.org/content/suppl/2015/02/06/gr.180240.114.DC1.html
P<P
Published online February 2, 2015 in advance of the print journal.
Manuscript
Accepted
manuscript is likely to differ from the final, published version. Peer-reviewed and accepted for publication but not copyedited or typeset; accepted
License
Commons Creative
.http://creativecommons.org/licenses/by-nc/4.0/described at
a Creative Commons License (Attribution-NonCommercial 4.0 International), as ). After six months, it is available underhttp://genome.cshlp.org/site/misc/terms.xhtml
first six months after the full-issue publication date (see This article is distributed exclusively by Cold Spring Harbor Laboratory Press for the
ServiceEmail Alerting
click here.top right corner of the article or
Receive free email alerts when new articles cite this article - sign up in the box at the
http://genome.cshlp.org/subscriptionsgo to: Genome Research To subscribe to
Published by Cold Spring Harbor Laboratory Press
Cold Spring Harbor Laboratory Press on February 12, 2015 - Published by genome.cshlp.orgDownloaded from