Human Gene-Centered Transcription Factor Networks for Enhancers and Disease Variants
Upload
universityCategory
view
1download
0
Functional Enhancers at the Gene-Poor 8q24 Cancer-Linked LocusLi Jia1,2., Gilad Landan3., Mark Pomerantz4, Rami Jaschek3, Paula Herman4, David Reich5, Chunli Yan1,
Omar Khalid1,2, Phil Kantoff4, William Oh4, J. Robert Manak6, Benjamin P. Berman7, Brian E. Henderson1,
Baruch Frenkel8, Christopher A. Haiman1, Matthew Freedman4,9, Amos Tanay3*, Gerhard A. Coetzee1,2*
1 USC/Norris Cancer Center, Department of Preventive Medicine, University of Southern California, Los Angeles, California, United States of America, 2 Department of
Urology, University of Southern California, Los Angeles, California, United States of America, 3 Department of Computer Science and Applied Mathematics, Weizmann
Institute of Science, Rehovot, Israel, 4 Dana-Farber Cancer Institute, Department of Medical Oncology, Harvard Medical School, Boston, Massachusetts, United States of
America, 5 Department of Genetics, Harvard Medical School, Boston, Massachusetts, United States of America, 6 Department of Biology, University of Iowa, Iowa City,
Iowa, United States of America, 7 USC/Epigenome Center, Keck School of Medicine, University of Southern California, Los Angeles, California, United States of America,
8 Department of Orthopedic Surgery and Department of Biochemistry and Molecular Biology, Institute of Genetic Medicine, University of Southern California, Los Angeles,
California, United States of America, 9 Broad Institute of Harvard and MIT, Cambridge, Massachusetts, United States of America
Abstract
Multiple discrete regions at 8q24 were recently shown to contain alleles that predispose to many cancers including prostate,breast, and colon. These regions are far from any annotated gene and their biological activities have been unknown. Herewe profiled a 5-megabase chromatin segment encompassing all the risk regions for RNA expression, histone modifications,and locations occupied by RNA polymerase II and androgen receptor (AR). This led to the identification of severaltranscriptional enhancers, which were verified using reporter assays. Two enhancers in one risk region were occupied by ARand responded to androgen treatment; one contained a single nucleotide polymorphism (rs11986220) that resides within aFoxA1 binding site, with the prostate cancer risk allele facilitating both stronger FoxA1 binding and stronger androgenresponsiveness. The study reported here exemplifies an approach that may be applied to any risk-associated allele in non-protein coding regions as it emerges from genome-wide association studies to better understand the geneticpredisposition of complex diseases.
Citation: Jia L, Landan G, Pomerantz M, Jaschek R, Herman P, et al. (2009) Functional Enhancers at the Gene-Poor 8q24 Cancer-Linked Locus. PLoS Genet 5(8):e1000597. doi:10.1371/journal.pgen.1000597
Editor: Jason D. Lieb, The University of North Carolina at Chapel Hill, United States of America
Received April 16, 2009; Accepted July 13, 2009; Published August 14, 2009
Copyright: � 2009 Jia et al. This is an open-access article distributed under the terms of the Creative Commons Attribution License, which permits unrestricteduse, distribution, and reproduction in any medium, provided the original author and source are credited.
Funding: Grant support from the NIH (R01 CA109147 to GAC and R01 CA129435 to MLF), the Prostate Cancer Foundation (to GAC), the Whittier Foundation (toGAC), the American Cancer Society Institutional Research Grant (IRG - 58-007-48 to LJ), the Mayer Foundation (to MLF), the H. L. Snyder Medical Foundation (toMLF), the Dana-Farber/Harvard Cancer Center Prostate Cancer SPORE (National Cancer Institute Grant No. 5P50CA90381), the Israeli Science Foundation (to AT),an Alon Fellowship (to AT), and the J. Harold and Edna L. LaBriola Chair in Genetic Orthopaedic Research (held by BF). The funders had no role in the study design,data collection and analysis, decision to publish, or preparation of the manuscript.
Competing Interests: The authors have declared that no competing interests exist.
* E-mail: [email protected] (AT); [email protected] (GAC)
. These authors contributed equally to this study.
Introduction
Chromosome 8q24 is an established risk locus for many
common epithelial cancers. The region was originally discovered
by fine-mapping of a prostate cancer linkage peak from a family-
based study by deCODE genetics [1] and common alleles in the
region have subsequently been found in genome-wide scans of
prostate, colon and breast cancer [2–4]. More recently, several
other cancer types were associated with different discrete regions
of 8q24, with the exception of rs6983267, which is a susceptibility
marker for prostate and colon cancers, and perhaps also ovarian
and other cancers [5,6]. The alleles reside in distinct linkage
disequilibrium blocks including three independent regions for
prostate cancer risk (regions 1–3), one for breast cancer risk and
one for bladder cancer risk [2,4]. These findings suggest that a
common biological mechanism underlies the association of cancer
with 8q24 polymorphisms, and also argue for organ- and site-
specific functions of elements in this region. Most of the cancer risk
variants at 8q24 are encompassed in an approximately 500-kb
long stretch of sequence that is devoid of well-characterized genes -
the closest annotated gene locus in this area is the oncogene MYC
that resides approximately 200-kb telomeric from the nearest
linkage disequilibrium block region containing a risk variant.
Since the consequences of sequence changes in non protein-
coding regions of the genome are more difficult to predict than
changes in coding regions, defining the mechanisms by which the
8q24 alleles confer risk has so far been challenging. Another
complication is that genetic variants discovered through association
studies are rarely the actual causal variant, since they may be
associated with disease risk simply due to linkage disequilibrium,
which sometimes extends over relatively large distances in the
human genome. Because of these factors, understanding the
mechanisms that increase cancer risk requires an integrated and
systematic approach. One hypothesis is that the 8q24 alleles affect
the sequence of unannotated transcripts (e.g. noncoding RNAs or
unknown protein-coding genes) or change the regulation of such
transcripts in cis. The ENCODE project and the recent reports on
long noncoding RNAs [7] clearly demonstrated that a large number
PLoS Genetics | www.plosgenetics.org 1 August 2009 | Volume 5 | Issue 8 | e1000597
of unannotated transcripts are expressed in the human genome [8].
Another hypothesis is that the 8q24 risk regions contain specialized
and perhaps tissue-specific regulatory elements (enhancers) that can
influence the behavior of other loci (i.e. their target genes).
Post-translational modifications of histones (e.g. methylation,
acetylation, etc.) have proven useful in annotating sites of regulatory
activity in the human genome. Histone 3 acetylation (AcH3) is
typically associated with chromatin accessibility and transcriptional
activity, and widely used for the prediction of functional elements
such as promoters and enhancers [9]. Studies further demonstrate
that other histone modifications [e.g., mono- and tri-methylation at
histone 3 lysine 4 (H3K4me1 & 3, respectively) and trimethylation
at histone 3 lysines 27 and 36 (H3K27me3 & H3K36me3,
respectively)] are strongly correlated with different modes of
genomic activity. Specifically, H3K4me3 is often associated with
active transcription start sites (TSSs), H3K4me1 with enhancers and
regions flanking TSSs, H3K27me3 with transcriptional silencing
and H3K36me3 with transcriptional elongation through genes
[10,11]. Loci that are mapped as putatively active based on
epigenomic profiling can then be independently evaluated through
functional analyses, such as reporter assays [10,12].
The overall objective of this study was to systematically evaluate
the possible role(s) of regions within the 8q24 genomic risk interval,
overcoming the aforementioned difficulties using a combination of
epigenetic, bioinformatic, and molecular biological analyses on
multiple cell lines and tissue samples. We report here two main
findings: (i) evidence is presented that certain 8q24 risk regions
exhibit minimal RNA transcriptional output but bear the markers
of regulatory elements that are functionally active as enhancers. (ii)
More specifically, we demonstrate that a new androgen-dependent
enhancer in one of the prostate cancer risk regions is functionally
influenced by a risk-associated single nucleotide polymorphism
(SNP) via differential FoxA1 binding.
Results/Discussion
A high resolution tiling array comprising 5-megabases (Mb) of
8q24 was designed and probed with cDNA from cancer cell lines
and normal tissue, as well as with DNA obtained by chromatin
immunoprecipitation (ChIP) using antibodies for histone modifi-
cations and transcription factors. We reasoned that the combina-
tion of a focused transcriptional map and a high-resolution
epigenomic profile [13] would provide key information on the
possible functions encoded within the large 500-kb 8q24 region.
Transcripts across 8q24To study the transcriptional landscape at the 8q24 region, we
generated double-stranded cDNA from 20 normal prostate tissue
samples, the prostate cancer cell lines LNCaP and PC3, the colon
cancer line HCT116 and the breast cancer line MCF7. We
hybridized each of these cDNA samples to our custom tiling array
and normalized the probe intensity values against their genomic
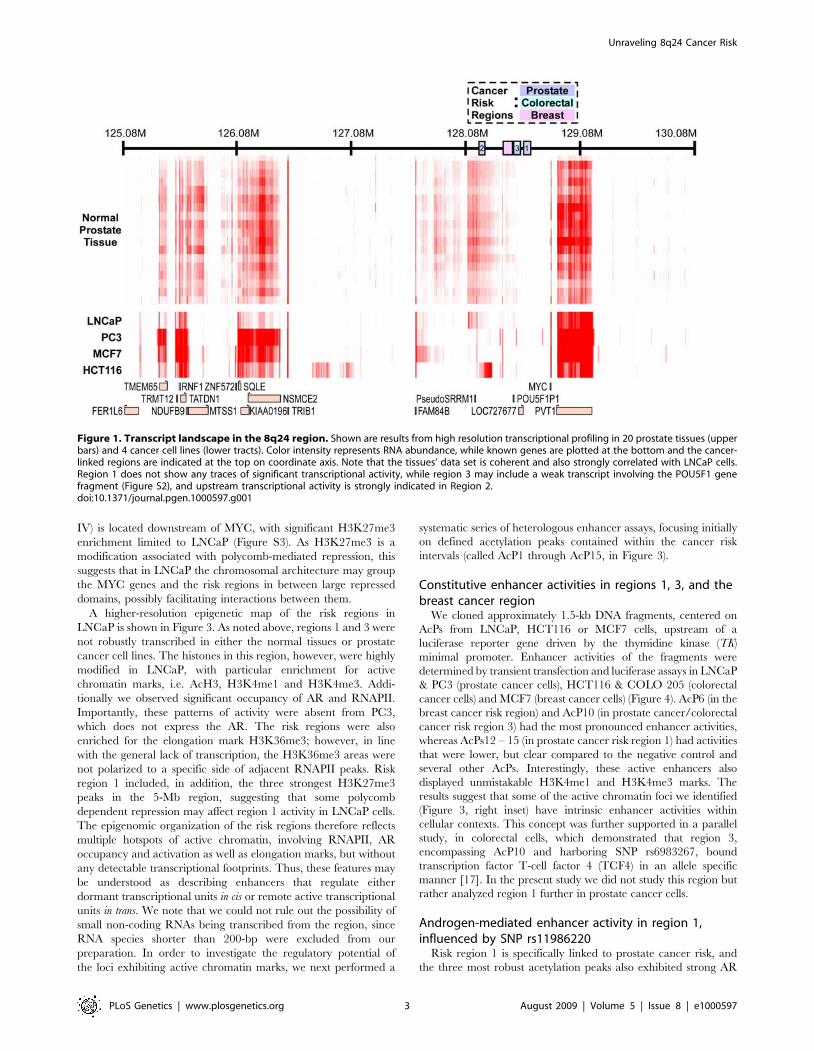
DNA background. As shown in Figure 1, the overall expression
data display a very robust expression pattern from known genes,
including MYC, PVT1, FAM84 and TRIB1, with exon probes
showing higher intensity levels than introns, and intron probes
showing higher intensity levels than intergenic sequences (Figure
S1). The tissue expression data clearly reflect the organization of
the genomic interval surrounding MYC, including a 400-kb region
spanning risk region 1 where no significant RNA could be
detected. Interestingly, the transcription signature in LNCaP
follows reasonably closely that of the prostate tissues, but the other
three cell lines (including the PC3 prostate cancer line) behave
differently. In region 2, we observed a highly reproducible
transcriptional signature in tissues and LNCaP cells, but not in
the other cell lines. We detected a strong putative transcript
downstream of region 2 in the colon cancer line HCT116, and
other cell type-specific signatures outside of the risk regions. We
also observed weak evidence of transcripts in the breast cancer
region and in region 3, including a possible transcript from the
POU5F1 pseudogene in all cell lines (Figure S2). In contrast,
region 1 was totally devoid of transcripts in all tissues and cell lines.
We did not investigate the transcripts originating in region 2 and 3
further, since their abundance in prostate tissue was not affected
by risk haplotypes in the region [14].
Epigenetic annotation of 8q24In parallel, we generated high-resolution epigenomic profiles for
the entire 5-Mb interval using ChIP-chip. For this purpose we
hybridized ChIP material to the same tiling array used earlier for
transcriptional profiling. Initially, we analyzed AcH3 in three cell
lines representing prostate (LNCaP), breast (MCF7) and colorectal
(HCT116) cancer. Because three regions independently impose
prostate cancer risk, we also interrogated two prostate cancer cell
lines (PC3 & LNCaP) more extensively for other key epigenetic
marks at high resolution. Additional histone modifications chosen
were the activation marks H3K4me1 & H3K4me3 [10], the
transcription elongation mark H3K36me3 and the polycomb
repressive mark H3K27me3. We also profiled RNA polymerase II
(RNAPII) and patterns of androgen receptor (AR) occupied
regions (ARORs). This entire multi-dimensional dataset (including
cDNA profiles) was then subjected to extensive statistical analysis
using spatial clustering, a new method that allows the dissection of
large genomic regions into distinct clusters, each reflecting a
specific combinatorial pattern of epigenetic marks in an unbiased
manner [15,16].
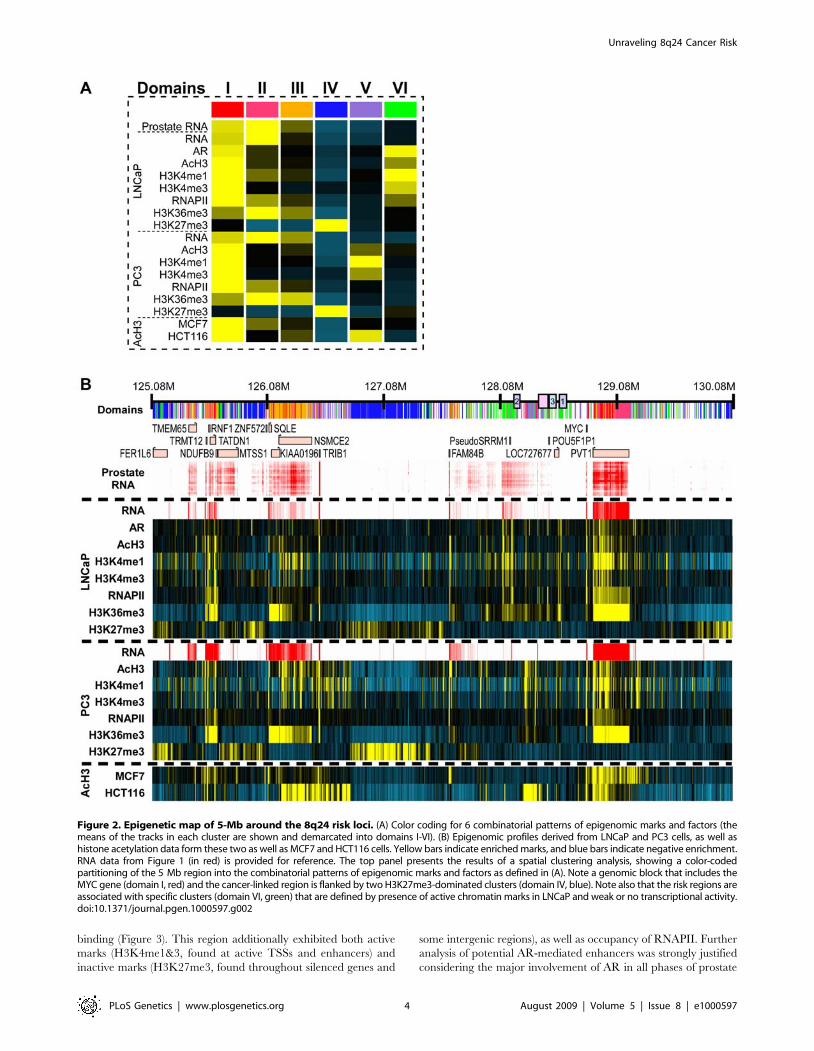
Spatial clustering of the 5-Mb region surrounding and including
the 8q24 risk loci is shown in Figure 2A and 2B. This unsupervised
cluster analysis revealed domains of combinatorial histone
modification and cDNA patterns, and determined the most likely
type of behavior at each genomic locus. Six domain types were
evident, color-coded and numbered I–VI (Figure 2A). The cancer
risk regions are bordered by two distinct domains located 2-Mb
apart: a 1-Mb type IV domain (located ,127 Mb), which is
weakly enriched with H3K27me3 marks, and a type I domain-
encompassing MYC (located ,129 Mb), which is strongly
enriched with activation-associated marks and transcription
(Figure 2B). The prostate cancer risk regions 1–3 were assigned
to a type VI domain, indicating that the chromatin of the risk-
linked domain is uniquely structured, and includes features that
are distinctly different from the aforementioned flanking regions.
Importantly, an additional LNCaP H3K27me3 domain (domain
Author Summary
Genome-wide scans of inherited genetic variation in thenormal population have recently identified many sites(loci) associated with the predisposition to complexdiseases such as cancer. Some of these cancer-associatedloci, however, are devoid of genes (situated in so-called‘‘gene deserts’’) and the mechanism(s) of the associationare not readily apparent. In the work reported here, weshow that loci associated with several cancers in a genedesert found at chromosomal area 8q24 have embeddedregulatory sequences affecting gene expression as en-hancers, and in one case this activity is modulated bygenetic variation. The results provide insight into themechanism(s) governing genetic cancer risk.
Unraveling 8q24 Cancer Risk
PLoS Genetics | www.plosgenetics.org 2 August 2009 | Volume 5 | Issue 8 | e1000597
IV) is located downstream of MYC, with significant H3K27me3
enrichment limited to LNCaP (Figure S3). As H3K27me3 is a
modification associated with polycomb-mediated repression, this
suggests that in LNCaP the chromosomal architecture may group
the MYC genes and the risk regions in between large repressed
domains, possibly facilitating interactions between them.
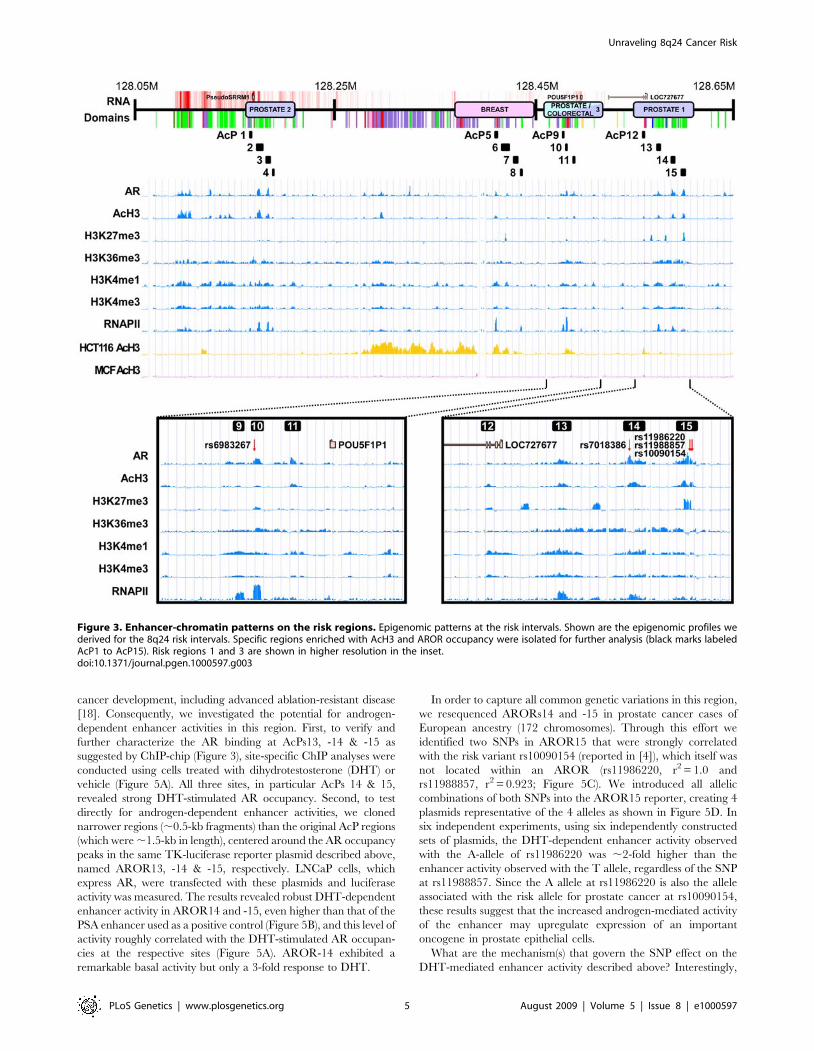
A higher-resolution epigenetic map of the risk regions in
LNCaP is shown in Figure 3. As noted above, regions 1 and 3 were
not robustly transcribed in either the normal tissues or prostate
cancer cell lines. The histones in this region, however, were highly
modified in LNCaP, with particular enrichment for active
chromatin marks, i.e. AcH3, H3K4me1 and H3K4me3. Addi-
tionally we observed significant occupancy of AR and RNAPII.
Importantly, these patterns of activity were absent from PC3,
which does not express the AR. The risk regions were also
enriched for the elongation mark H3K36me3; however, in line
with the general lack of transcription, the H3K36me3 areas were
not polarized to a specific side of adjacent RNAPII peaks. Risk
region 1 included, in addition, the three strongest H3K27me3
peaks in the 5-Mb region, suggesting that some polycomb
dependent repression may affect region 1 activity in LNCaP cells.
The epigenomic organization of the risk regions therefore reflects
multiple hotspots of active chromatin, involving RNAPII, AR
occupancy and activation as well as elongation marks, but without
any detectable transcriptional footprints. Thus, these features may
be understood as describing enhancers that regulate either
dormant transcriptional units in cis or remote active transcriptional
units in trans. We note that we could not rule out the possibility of
small non-coding RNAs being transcribed from the region, since
RNA species shorter than 200-bp were excluded from our
preparation. In order to investigate the regulatory potential of
the loci exhibiting active chromatin marks, we next performed a
systematic series of heterologous enhancer assays, focusing initially
on defined acetylation peaks contained within the cancer risk
intervals (called AcP1 through AcP15, in Figure 3).
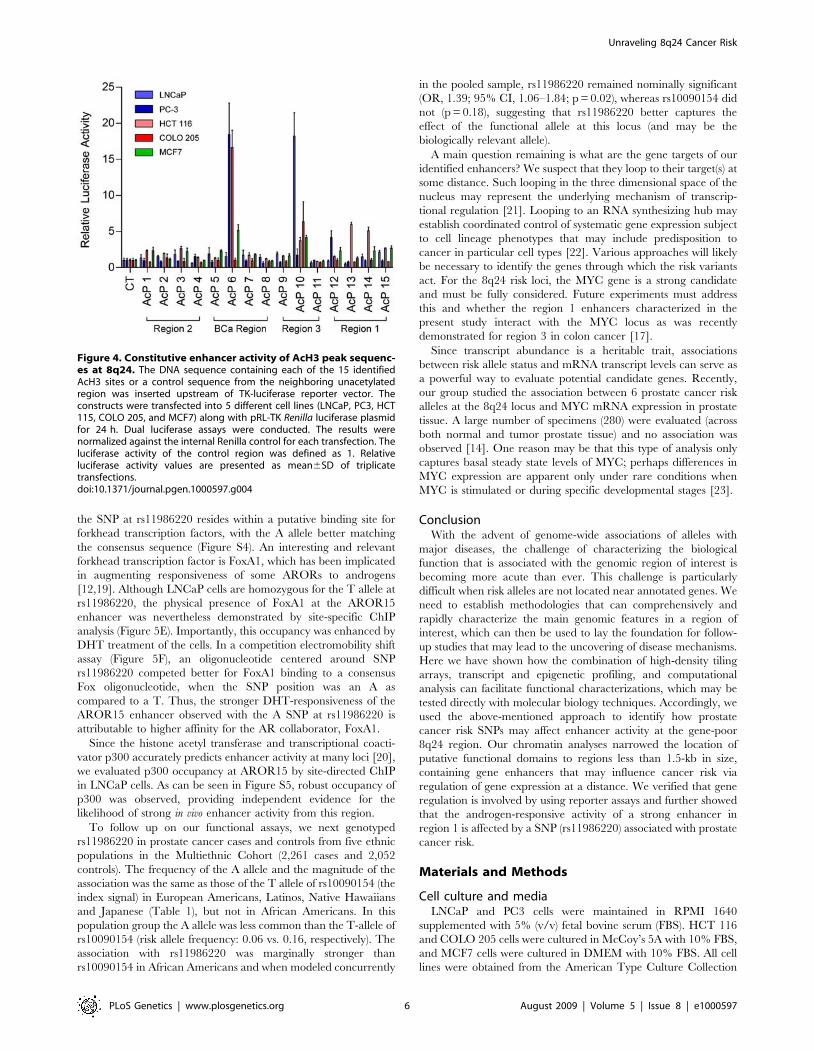
Constitutive enhancer activities in regions 1, 3, and thebreast cancer region
We cloned approximately 1.5-kb DNA fragments, centered on
AcPs from LNCaP, HCT116 or MCF7 cells, upstream of a
luciferase reporter gene driven by the thymidine kinase (TK)
minimal promoter. Enhancer activities of the fragments were
determined by transient transfection and luciferase assays in LNCaP
& PC3 (prostate cancer cells), HCT116 & COLO 205 (colorectal
cancer cells) and MCF7 (breast cancer cells) (Figure 4). AcP6 (in the
breast cancer risk region) and AcP10 (in prostate cancer/colorectal
cancer risk region 3) had the most pronounced enhancer activities,
whereas AcPs12 – 15 (in prostate cancer risk region 1) had activities
that were lower, but clear compared to the negative control and
several other AcPs. Interestingly, these active enhancers also
displayed unmistakable H3K4me1 and H3K4me3 marks. The
results suggest that some of the active chromatin foci we identified
(Figure 3, right inset) have intrinsic enhancer activities within
cellular contexts. This concept was further supported in a parallel
study, in colorectal cells, which demonstrated that region 3,
encompassing AcP10 and harboring SNP rs6983267, bound
transcription factor T-cell factor 4 (TCF4) in an allele specific
manner [17]. In the present study we did not study this region but
rather analyzed region 1 further in prostate cancer cells.
Androgen-mediated enhancer activity in region 1,influenced by SNP rs11986220
Risk region 1 is specifically linked to prostate cancer risk, and
the three most robust acetylation peaks also exhibited strong AR
Figure 1. Transcript landscape in the 8q24 region. Shown are results from high resolution transcriptional profiling in 20 prostate tissues (upperbars) and 4 cancer cell lines (lower tracts). Color intensity represents RNA abundance, while known genes are plotted at the bottom and the cancer-linked regions are indicated at the top on coordinate axis. Note that the tissues’ data set is coherent and also strongly correlated with LNCaP cells.Region 1 does not show any traces of significant transcriptional activity, while region 3 may include a weak transcript involving the POU5F1 genefragment (Figure S2), and upstream transcriptional activity is strongly indicated in Region 2.doi:10.1371/journal.pgen.1000597.g001
Unraveling 8q24 Cancer Risk
PLoS Genetics | www.plosgenetics.org 3 August 2009 | Volume 5 | Issue 8 | e1000597
binding (Figure 3). This region additionally exhibited both active
marks (H3K4me1&3, found at active TSSs and enhancers) and
inactive marks (H3K27me3, found throughout silenced genes and
some intergenic regions), as well as occupancy of RNAPII. Further
analysis of potential AR-mediated enhancers was strongly justified
considering the major involvement of AR in all phases of prostate
Figure 2. Epigenetic map of 5-Mb around the 8q24 risk loci. (A) Color coding for 6 combinatorial patterns of epigenomic marks and factors (themeans of the tracks in each cluster are shown and demarcated into domains I-VI). (B) Epigenomic profiles derived from LNCaP and PC3 cells, as well ashistone acetylation data form these two as well as MCF7 and HCT116 cells. Yellow bars indicate enriched marks, and blue bars indicate negative enrichment.RNA data from Figure 1 (in red) is provided for reference. The top panel presents the results of a spatial clustering analysis, showing a color-codedpartitioning of the 5 Mb region into the combinatorial patterns of epigenomic marks and factors as defined in (A). Note a genomic block that includes theMYC gene (domain I, red) and the cancer-linked region is flanked by two H3K27me3-dominated clusters (domain IV, blue). Note also that the risk regions areassociated with specific clusters (domain VI, green) that are defined by presence of active chromatin marks in LNCaP and weak or no transcriptional activity.doi:10.1371/journal.pgen.1000597.g002
Unraveling 8q24 Cancer Risk
PLoS Genetics | www.plosgenetics.org 4 August 2009 | Volume 5 | Issue 8 | e1000597
cancer development, including advanced ablation-resistant disease
[18]. Consequently, we investigated the potential for androgen-
dependent enhancer activities in this region. First, to verify and
further characterize the AR binding at AcPs13, -14 & -15 as
suggested by ChIP-chip (Figure 3), site-specific ChIP analyses were
conducted using cells treated with dihydrotestosterone (DHT) or
vehicle (Figure 5A). All three sites, in particular AcPs 14 & 15,
revealed strong DHT-stimulated AR occupancy. Second, to test
directly for androgen-dependent enhancer activities, we cloned
narrower regions (,0.5-kb fragments) than the original AcP regions
(which were ,1.5-kb in length), centered around the AR occupancy
peaks in the same TK-luciferase reporter plasmid described above,
named AROR13, -14 & -15, respectively. LNCaP cells, which
express AR, were transfected with these plasmids and luciferase
activity was measured. The results revealed robust DHT-dependent
enhancer activity in AROR14 and -15, even higher than that of the
PSA enhancer used as a positive control (Figure 5B), and this level of
activity roughly correlated with the DHT-stimulated AR occupan-
cies at the respective sites (Figure 5A). AROR-14 exhibited a
remarkable basal activity but only a 3-fold response to DHT.
In order to capture all common genetic variations in this region,
we resequenced ARORs14 and -15 in prostate cancer cases of
European ancestry (172 chromosomes). Through this effort we
identified two SNPs in AROR15 that were strongly correlated
with the risk variant rs10090154 (reported in [4]), which itself was
not located within an AROR (rs11986220, r2 = 1.0 and
rs11988857, r2 = 0.923; Figure 5C). We introduced all allelic
combinations of both SNPs into the AROR15 reporter, creating 4
plasmids representative of the 4 alleles as shown in Figure 5D. In
six independent experiments, using six independently constructed
sets of plasmids, the DHT-dependent enhancer activity observed
with the A-allele of rs11986220 was ,2-fold higher than the
enhancer activity observed with the T allele, regardless of the SNP
at rs11988857. Since the A allele at rs11986220 is also the allele
associated with the risk allele for prostate cancer at rs10090154,
these results suggest that the increased androgen-mediated activity
of the enhancer may upregulate expression of an important
oncogene in prostate epithelial cells.
What are the mechanism(s) that govern the SNP effect on the
DHT-mediated enhancer activity described above? Interestingly,
Figure 3. Enhancer-chromatin patterns on the risk regions. Epigenomic patterns at the risk intervals. Shown are the epigenomic profiles wederived for the 8q24 risk intervals. Specific regions enriched with AcH3 and AROR occupancy were isolated for further analysis (black marks labeledAcP1 to AcP15). Risk regions 1 and 3 are shown in higher resolution in the inset.doi:10.1371/journal.pgen.1000597.g003
Unraveling 8q24 Cancer Risk
PLoS Genetics | www.plosgenetics.org 5 August 2009 | Volume 5 | Issue 8 | e1000597
the SNP at rs11986220 resides within a putative binding site for
forkhead transcription factors, with the A allele better matching
the consensus sequence (Figure S4). An interesting and relevant
forkhead transcription factor is FoxA1, which has been implicated
in augmenting responsiveness of some ARORs to androgens
[12,19]. Although LNCaP cells are homozygous for the T allele at
rs11986220, the physical presence of FoxA1 at the AROR15
enhancer was nevertheless demonstrated by site-specific ChIP
analysis (Figure 5E). Importantly, this occupancy was enhanced by
DHT treatment of the cells. In a competition electromobility shift
assay (Figure 5F), an oligonucleotide centered around SNP
rs11986220 competed better for FoxA1 binding to a consensus
Fox oligonucleotide, when the SNP position was an A as
compared to a T. Thus, the stronger DHT-responsiveness of the
AROR15 enhancer observed with the A SNP at rs11986220 is
attributable to higher affinity for the AR collaborator, FoxA1.
Since the histone acetyl transferase and transcriptional coacti-
vator p300 accurately predicts enhancer activity at many loci [20],
we evaluated p300 occupancy at AROR15 by site-directed ChIP
in LNCaP cells. As can be seen in Figure S5, robust occupancy of
p300 was observed, providing independent evidence for the
likelihood of strong in vivo enhancer activity from this region.
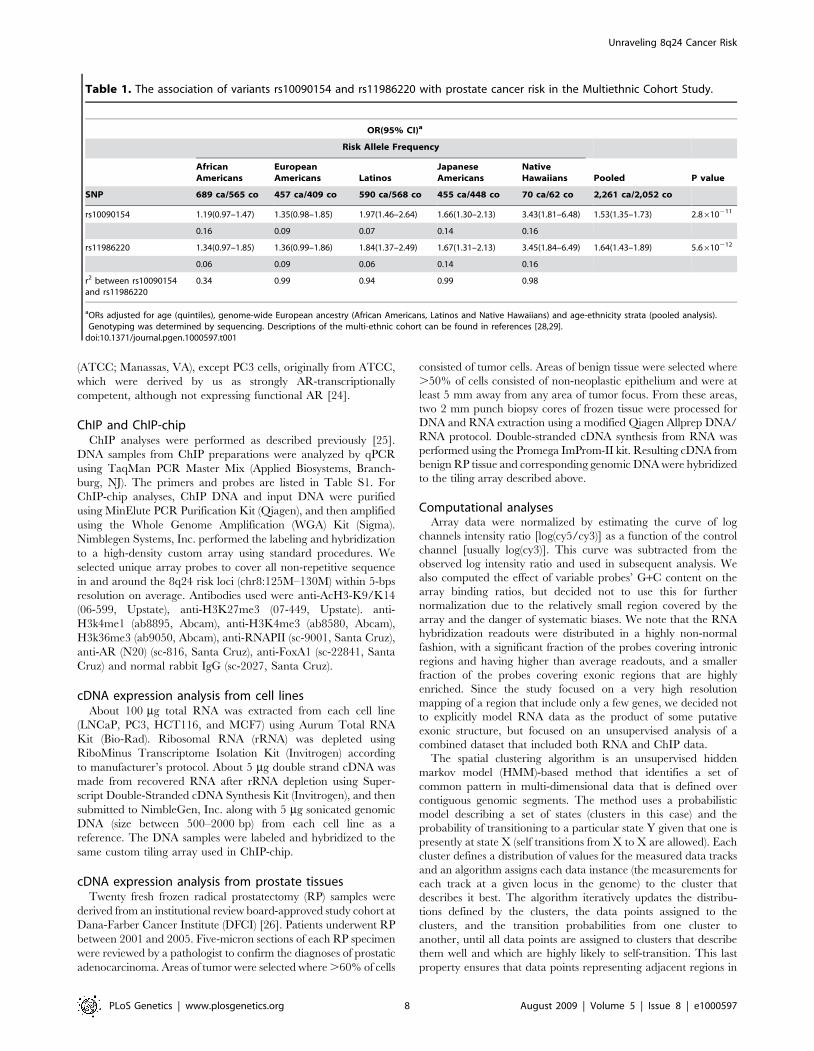
To follow up on our functional assays, we next genotyped
rs11986220 in prostate cancer cases and controls from five ethnic
populations in the Multiethnic Cohort (2,261 cases and 2,052
controls). The frequency of the A allele and the magnitude of the
association was the same as those of the T allele of rs10090154 (the
index signal) in European Americans, Latinos, Native Hawaiians
and Japanese (Table 1), but not in African Americans. In this
population group the A allele was less common than the T-allele of
rs10090154 (risk allele frequency: 0.06 vs. 0.16, respectively). The
association with rs11986220 was marginally stronger than
rs10090154 in African Americans and when modeled concurrently
in the pooled sample, rs11986220 remained nominally significant
(OR, 1.39; 95% CI, 1.06–1.84; p = 0.02), whereas rs10090154 did
not (p = 0.18), suggesting that rs11986220 better captures the
effect of the functional allele at this locus (and may be the
biologically relevant allele).
A main question remaining is what are the gene targets of our
identified enhancers? We suspect that they loop to their target(s) at
some distance. Such looping in the three dimensional space of the
nucleus may represent the underlying mechanism of transcrip-
tional regulation [21]. Looping to an RNA synthesizing hub may
establish coordinated control of systematic gene expression subject
to cell lineage phenotypes that may include predisposition to
cancer in particular cell types [22]. Various approaches will likely
be necessary to identify the genes through which the risk variants
act. For the 8q24 risk loci, the MYC gene is a strong candidate
and must be fully considered. Future experiments must address
this and whether the region 1 enhancers characterized in the
present study interact with the MYC locus as was recently
demonstrated for region 3 in colon cancer [17].
Since transcript abundance is a heritable trait, associations
between risk allele status and mRNA transcript levels can serve as
a powerful way to evaluate potential candidate genes. Recently,
our group studied the association between 6 prostate cancer risk
alleles at the 8q24 locus and MYC mRNA expression in prostate
tissue. A large number of specimens (280) were evaluated (across
both normal and tumor prostate tissue) and no association was
observed [14]. One reason may be that this type of analysis only
captures basal steady state levels of MYC; perhaps differences in
MYC expression are apparent only under rare conditions when
MYC is stimulated or during specific developmental stages [23].
ConclusionWith the advent of genome-wide associations of alleles with
major diseases, the challenge of characterizing the biological
function that is associated with the genomic region of interest is
becoming more acute than ever. This challenge is particularly
difficult when risk alleles are not located near annotated genes. We
need to establish methodologies that can comprehensively and
rapidly characterize the main genomic features in a region of
interest, which can then be used to lay the foundation for follow-
up studies that may lead to the uncovering of disease mechanisms.
Here we have shown how the combination of high-density tiling
arrays, transcript and epigenetic profiling, and computational
analysis can facilitate functional characterizations, which may be
tested directly with molecular biology techniques. Accordingly, we
used the above-mentioned approach to identify how prostate
cancer risk SNPs may affect enhancer activity at the gene-poor
8q24 region. Our chromatin analyses narrowed the location of
putative functional domains to regions less than 1.5-kb in size,
containing gene enhancers that may influence cancer risk via
regulation of gene expression at a distance. We verified that gene
regulation is involved by using reporter assays and further showed
that the androgen-responsive activity of a strong enhancer in
region 1 is affected by a SNP (rs11986220) associated with prostate
cancer risk.
Materials and Methods
Cell culture and mediaLNCaP and PC3 cells were maintained in RPMI 1640
supplemented with 5% (v/v) fetal bovine serum (FBS). HCT 116
and COLO 205 cells were cultured in McCoy’s 5A with 10% FBS,
and MCF7 cells were cultured in DMEM with 10% FBS. All cell
lines were obtained from the American Type Culture Collection
Figure 4. Constitutive enhancer activity of AcH3 peak sequenc-es at 8q24. The DNA sequence containing each of the 15 identifiedAcH3 sites or a control sequence from the neighboring unacetylatedregion was inserted upstream of TK-luciferase reporter vector. Theconstructs were transfected into 5 different cell lines (LNCaP, PC3, HCT115, COLO 205, and MCF7) along with pRL-TK Renilla luciferase plasmidfor 24 h. Dual luciferase assays were conducted. The results werenormalized against the internal Renilla control for each transfection. Theluciferase activity of the control region was defined as 1. Relativeluciferase activity values are presented as mean6SD of triplicatetransfections.doi:10.1371/journal.pgen.1000597.g004
Unraveling 8q24 Cancer Risk
PLoS Genetics | www.plosgenetics.org 6 August 2009 | Volume 5 | Issue 8 | e1000597
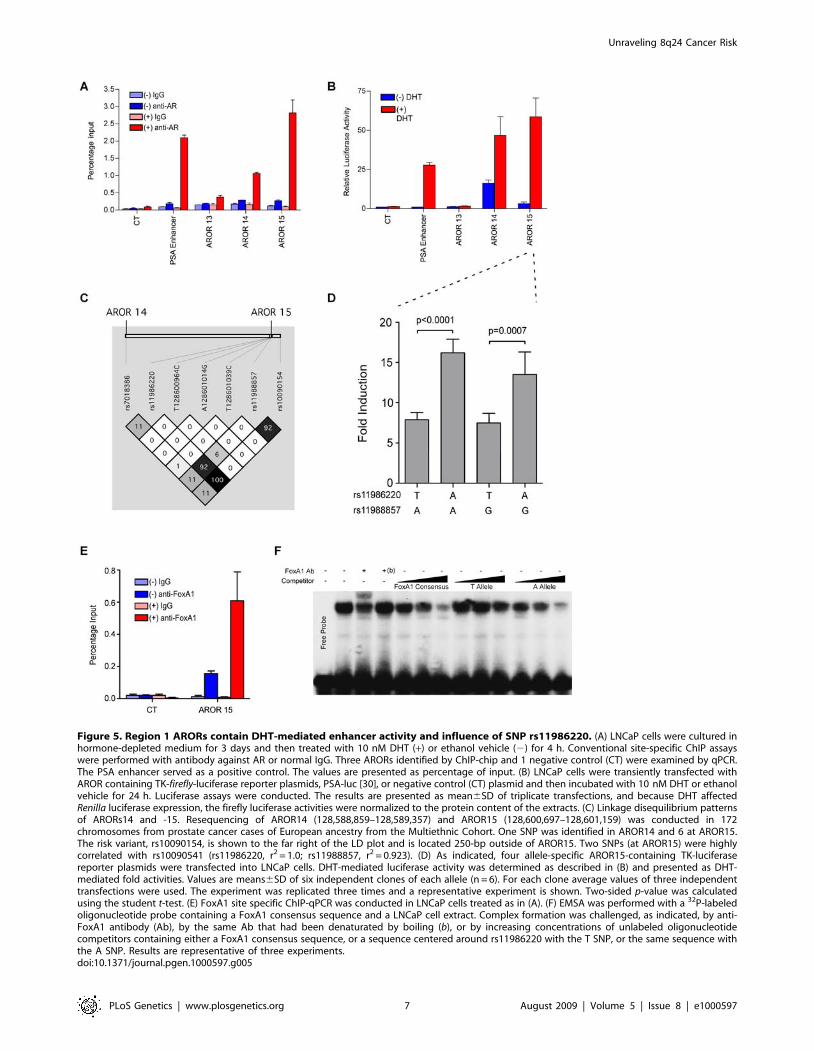
Figure 5. Region 1 ARORs contain DHT-mediated enhancer activity and influence of SNP rs11986220. (A) LNCaP cells were cultured inhormone-depleted medium for 3 days and then treated with 10 nM DHT (+) or ethanol vehicle (2) for 4 h. Conventional site-specific ChIP assayswere performed with antibody against AR or normal IgG. Three ARORs identified by ChIP-chip and 1 negative control (CT) were examined by qPCR.The PSA enhancer served as a positive control. The values are presented as percentage of input. (B) LNCaP cells were transiently transfected withAROR containing TK-firefly-luciferase reporter plasmids, PSA-luc [30], or negative control (CT) plasmid and then incubated with 10 nM DHT or ethanolvehicle for 24 h. Luciferase assays were conducted. The results are presented as mean6SD of triplicate transfections, and because DHT affectedRenilla luciferase expression, the firefly luciferase activities were normalized to the protein content of the extracts. (C) Linkage disequilibrium patternsof ARORs14 and -15. Resequencing of AROR14 (128,588,859–128,589,357) and AROR15 (128,600,697–128,601,159) was conducted in 172chromosomes from prostate cancer cases of European ancestry from the Multiethnic Cohort. One SNP was identified in AROR14 and 6 at AROR15.The risk variant, rs10090154, is shown to the far right of the LD plot and is located 250-bp outside of AROR15. Two SNPs (at AROR15) were highlycorrelated with rs10090541 (rs11986220, r2 = 1.0; rs11988857, r2 = 0.923). (D) As indicated, four allele-specific AROR15-containing TK-luciferasereporter plasmids were transfected into LNCaP cells. DHT-mediated luciferase activity was determined as described in (B) and presented as DHT-mediated fold activities. Values are means6SD of six independent clones of each allele (n = 6). For each clone average values of three independenttransfections were used. The experiment was replicated three times and a representative experiment is shown. Two-sided p-value was calculatedusing the student t-test. (E) FoxA1 site specific ChIP-qPCR was conducted in LNCaP cells treated as in (A). (F) EMSA was performed with a 32P-labeledoligonucleotide probe containing a FoxA1 consensus sequence and a LNCaP cell extract. Complex formation was challenged, as indicated, by anti-FoxA1 antibody (Ab), by the same Ab that had been denaturated by boiling (b), or by increasing concentrations of unlabeled oligonucleotidecompetitors containing either a FoxA1 consensus sequence, or a sequence centered around rs11986220 with the T SNP, or the same sequence withthe A SNP. Results are representative of three experiments.doi:10.1371/journal.pgen.1000597.g005
Unraveling 8q24 Cancer Risk
PLoS Genetics | www.plosgenetics.org 7 August 2009 | Volume 5 | Issue 8 | e1000597
(ATCC; Manassas, VA), except PC3 cells, originally from ATCC,
which were derived by us as strongly AR-transcriptionally
competent, although not expressing functional AR [24].
ChIP and ChIP-chipChIP analyses were performed as described previously [25].
DNA samples from ChIP preparations were analyzed by qPCR
using TaqMan PCR Master Mix (Applied Biosystems, Branch-
burg, NJ). The primers and probes are listed in Table S1. For
ChIP-chip analyses, ChIP DNA and input DNA were purified
using MinElute PCR Purification Kit (Qiagen), and then amplified
using the Whole Genome Amplification (WGA) Kit (Sigma).
Nimblegen Systems, Inc. performed the labeling and hybridization
to a high-density custom array using standard procedures. We
selected unique array probes to cover all non-repetitive sequence
in and around the 8q24 risk loci (chr8:125M–130M) within 5-bps
resolution on average. Antibodies used were anti-AcH3-K9/K14
(06-599, Upstate), anti-H3K27me3 (07-449, Upstate). anti-
H3k4me1 (ab8895, Abcam), anti-H3K4me3 (ab8580, Abcam),
H3k36me3 (ab9050, Abcam), anti-RNAPII (sc-9001, Santa Cruz),
anti-AR (N20) (sc-816, Santa Cruz), anti-FoxA1 (sc-22841, Santa
Cruz) and normal rabbit IgG (sc-2027, Santa Cruz).
cDNA expression analysis from cell linesAbout 100 mg total RNA was extracted from each cell line
(LNCaP, PC3, HCT116, and MCF7) using Aurum Total RNA
Kit (Bio-Rad). Ribosomal RNA (rRNA) was depleted using
RiboMinus Transcriptome Isolation Kit (Invitrogen) according
to manufacturer’s protocol. About 5 mg double strand cDNA was
made from recovered RNA after rRNA depletion using Super-
script Double-Stranded cDNA Synthesis Kit (Invitrogen), and then
submitted to NimbleGen, Inc. along with 5 mg sonicated genomic
DNA (size between 500–2000 bp) from each cell line as a
reference. The DNA samples were labeled and hybridized to the
same custom tiling array used in ChIP-chip.
cDNA expression analysis from prostate tissuesTwenty fresh frozen radical prostatectomy (RP) samples were
derived from an institutional review board-approved study cohort at
Dana-Farber Cancer Institute (DFCI) [26]. Patients underwent RP
between 2001 and 2005. Five-micron sections of each RP specimen
were reviewed by a pathologist to confirm the diagnoses of prostatic
adenocarcinoma. Areas of tumor were selected where .60% of cells
consisted of tumor cells. Areas of benign tissue were selected where
.50% of cells consisted of non-neoplastic epithelium and were at
least 5 mm away from any area of tumor focus. From these areas,
two 2 mm punch biopsy cores of frozen tissue were processed for
DNA and RNA extraction using a modified Qiagen Allprep DNA/
RNA protocol. Double-stranded cDNA synthesis from RNA was
performed using the Promega ImProm-II kit. Resulting cDNA from
benign RP tissue and corresponding genomic DNA were hybridized
to the tiling array described above.
Computational analysesArray data were normalized by estimating the curve of log
channels intensity ratio [log(cy5/cy3)] as a function of the control
channel [usually log(cy3)]. This curve was subtracted from the
observed log intensity ratio and used in subsequent analysis. We
also computed the effect of variable probes’ G+C content on the
array binding ratios, but decided not to use this for further
normalization due to the relatively small region covered by the
array and the danger of systematic biases. We note that the RNA
hybridization readouts were distributed in a highly non-normal
fashion, with a significant fraction of the probes covering intronic
regions and having higher than average readouts, and a smaller
fraction of the probes covering exonic regions that are highly
enriched. Since the study focused on a very high resolution
mapping of a region that include only a few genes, we decided not
to explicitly model RNA data as the product of some putative
exonic structure, but focused on an unsupervised analysis of a
combined dataset that included both RNA and ChIP data.
The spatial clustering algorithm is an unsupervised hidden
markov model (HMM)-based method that identifies a set of
common pattern in multi-dimensional data that is defined over
contiguous genomic segments. The method uses a probabilistic
model describing a set of states (clusters in this case) and the
probability of transitioning to a particular state Y given that one is
presently at state X (self transitions from X to X are allowed). Each
cluster defines a distribution of values for the measured data tracks
and an algorithm assigns each data instance (the measurements for
each track at a given locus in the genome) to the cluster that
describes it best. The algorithm iteratively updates the distribu-
tions defined by the clusters, the data points assigned to the
clusters, and the transition probabilities from one cluster to
another, until all data points are assigned to clusters that describe
them well and which are highly likely to self-transition. This last
property ensures that data points representing adjacent regions in
Table 1. The association of variants rs10090154 and rs11986220 with prostate cancer risk in the Multiethnic Cohort Study.
OR(95% CI)a
Risk Allele Frequency
AfricanAmericans
EuropeanAmericans Latinos
JapaneseAmericans
NativeHawaiians Pooled P value
SNP 689 ca/565 co 457 ca/409 co 590 ca/568 co 455 ca/448 co 70 ca/62 co 2,261 ca/2,052 co
rs10090154 1.19(0.97–1.47) 1.35(0.98–1.85) 1.97(1.46–2.64) 1.66(1.30–2.13) 3.43(1.81–6.48) 1.53(1.35–1.73) 2.8610211
0.16 0.09 0.07 0.14 0.16
rs11986220 1.34(0.97–1.85) 1.36(0.99–1.86) 1.84(1.37–2.49) 1.67(1.31–2.13) 3.45(1.84–6.49) 1.64(1.43–1.89) 5.6610212
0.06 0.09 0.06 0.14 0.16
r2 between rs10090154and rs11986220
0.34 0.99 0.94 0.99 0.98
aORs adjusted for age (quintiles), genome-wide European ancestry (African Americans, Latinos and Native Hawaiians) and age-ethnicity strata (pooled analysis).Genotyping was determined by sequencing. Descriptions of the multi-ethnic cohort can be found in references [28,29].
doi:10.1371/journal.pgen.1000597.t001
Unraveling 8q24 Cancer Risk
PLoS Genetics | www.plosgenetics.org 8 August 2009 | Volume 5 | Issue 8 | e1000597
the genome are likely to belong to the same cluster, maintaining
the biological tendency of contiguous genomic regions to behave
similarly. To dissect the 8q24 into regions with distinct epigenomic
behaviors we used our recently described implementation of the
algorithm [15,16] in a non-hierarchical mode, with a 12-cluster
model and assuming data is distributed normally once the cluster is
known. Other selections of model structure generated similar
results. Due to the limited size of the analyzed region we did not
try to use the model to define coupling between clusters or higher-
level organizational behaviors. In Figure 2, we report only on
clusters that were defined as informative, containing at least one
genomic track with significantly high or low mean, as other
clusters represent statistical variants of background signals and are
routinely ignored.
Plasmid construction and Luciferase reporter assaysFifteen enhancer candidates (,1500-bp sequence surrounding
the AcH3 peak center) and three ARORs (,500 bp sequence
surrounding the AROR peak center) were amplified from LNCaP
genomic DNA using High Fidelity Platinum Tag DNA polymer-
ase (Invitrogen). The amplified sequences were then subcloned in
either the KpnI or Sac II restriction sites upstream of a thymidine
kinase (TK) minimal promoter-firefly-luciferase vector in both
directions. All clones were confirmed by sequencing. The primers
for subcloning are listed in Table S1. LNCaP, PC3, HCT116,
COLO 205, and MCF7 cells were transfected with reporter
plasmids along with constitutively active pRL-TK Renilla luciferase
plasmid (Promega) using Lipofectamine LTX Reagent (Invitrogen)
according to the manufacturer’s protocol. Dual luciferase activities
were measured as previously described [25]. For DHT-mediated
enhancer activities of ARORs, LNCaP cells were transfected with
AROR containing TK-luciferase reporter plasmids. After trans-
fection, cells were treated with DHT (10 nM) or ethanol vehicle
for 24 h. Where indicated, point mutations were introduced to
create enhancer-reporter constructs with specific SNP alleles using
QuikChange site-directed mutagenesis kit (Stratagene). In these
cases, six independent clones of each construct were made, and
confirmed by sequencing. DHT-mediated fold activities are
presented and values are means6SD of the six independent
clones of each allele. For each clone average values of three
independent transfections were used. Two-side p-values between
alleles were calculated using the student t-test.
Electromobility shift assaysWhole cell extracts were prepared from LNCaP cells, cultured
in 5% FBS RPMI 1640, and EMSA was performed all as
previously described [27]. Oligonucleotides (Table S1) and anti-
FoxA1 antibody (ab 23738, Abcam) were used as indicated.
Supporting Information
Figure S1 Shown are the cumulative distributions of RNA array
signal (LNCaP data) for intergenic, intronic and exonic probes.
The data show that our data is sensitive to the difference between
strongly expressed spliced RNAs, pre-spliced unprocessed tran-
scripts and untranscribed, intergenic sequence.
Found at: doi:10.1371/journal.pgen.1000597.s001 (0.04 MB PDF)
Figure S2 Possible transcription around the POU5F1 gene
fragment. Shown are RNA array readouts in region 3 and the
Breast cancer associated locus. Probes at the POU5F1 are
enriched in all cell types and in normal prostate tissue, possibly
reflecting cross hybridization from the original POU5F1 gene. In
LNCaP and in the prostate tissues we also observe RNA signal
from strictly unique probes (see the self-chain track in the lower
part of the figure) around the POU5F1 fragment and in other
proximal probes that were also associated before with spliced
ESTs. This suggests that some transcription may be originating
from a long region involving risk region 3 and the breast cancer
linked region.
Found at: doi:10.1371/journal.pgen.1000597.s002 (0.17 MB PDF)
Figure S3 Significance of H3K27me3 domains. Shown are
aggregate statistics from Kolmogorov-Smirnov tests performed on
the H3K27me3 distributions in LNCaP and PC3. For each probe,
the distribution of log(IP/input) values centered on that probe and
within a window of given size was compared to the distribution of
all the values outside the window. The color-coded p-values
indicate the significance of the dissimilarity between that window
and the rest of the 5 Mb region. Each row within a cell-line
corresponds to a different window size (top: 512 kbp, bottom:
500 bp). High p-values indicate the presence of significant
H3K27me3 domains, with the right-most domain appearing only
in LNCaP.
Found at: doi:10.1371/journal.pgen.1000597.s003 (0.13 MB PDF)
Figure S4 Fifty-bp DNA sequences centered on rs11986220
were scanned for transcription factor binding motifs using
Transcription Element Search System (TESS) website (http://
www.cbil.upenn.edu/cgi-bin/tess/tess). A potential FoxA1/
HNF3a binding site coincided with rs11986220, with the A allele
forming a more perfect FoxA1/HNF3a binding site than the T
allele.
Found at: doi:10.1371/journal.pgen.1000597.s004 (0.06 MB PDF)
Figure S5 P300 occupancies AROR15. LNCaP cells were
cultured in 5% FBS RPMI 1640 media for 3 days. ChIP analyses
were performed using antibody against p300 (sc-585, Santa Cruz).
DNA samples from ChIP preparation were quantified by qPCR
using TaqMan PCR Master Mix (Applied Biosystems). Data were
average of triplicate qPCR determinations. The relative enrich-
ment of p300 at PSA enhancer (positive control) and AROR 15
was normalized against neighboring 8q24 control region (negative
control defined as 1).
Found at: doi:10.1371/journal.pgen.1000597.s005 (0.03 MB PDF)
Table S1 Oligonucleotide sequences.
Found at: doi:10.1371/journal.pgen.1000597.s006 (0.02 MB
XLS)
Acknowledgments
We thank Unnati Jariwala for the RNA and cDNA preparations from the
cultured cell lines used in Figure 1.
Author Contributions
Conceived and designed the experiments: LJ DR JRM BPB BEH BF CAH
MF AT GAC. Performed the experiments: LJ MP PH CY OK. Analyzed
the data: LJ GL MP RJ BPB CAH MF AT GAC. Contributed reagents/
materials/analysis tools: DR PK WO. Wrote the paper: LJ GL BF CAH
MF AT GAC.
References
1. Amundadottir LT, Sulem P, Gudmundsson J, Helgason A, Baker A, et al. (2006)
A common variant associated with prostate cancer in European and African
populations. Nat Genet 38: 652–658.
2. Easton DF, Pooley KA, Dunning AM, Pharoah PD, Thompson D, et al. (2007)
Genome-wide association study identifies novel breast cancer susceptibility loci.
Nature 447: 1087–1093.
Unraveling 8q24 Cancer Risk
PLoS Genetics | www.plosgenetics.org 9 August 2009 | Volume 5 | Issue 8 | e1000597
3. Haiman CA, Le Marchand L, Yamamato J, Stram DO, Sheng X, et al. (2007) A
common genetic risk factor for colorectal and prostate cancer. Nat Genet 39:954–956.
4. Haiman CA, Patterson N, Freedman ML, Myers SR, Pike MC, et al. (2007)
Multiple regions within 8q24 independently affect risk for prostate cancer. NatGenet 39: 638–644.
5. Ghoussaini M, Song H, Koessler T, Al Olama AA, Kote-Jarai Z, et al. (2008)Multiple loci with different cancer specificities within the 8q24 gene desert. J Natl
Cancer Inst 100: 962–966.
6. Wokolorczyk D, Gliniewicz B, Sikorski A, Zlowocka E, Masojc B, et al. (2008) ARange of Cancers Is Associated with the rs6983267 Marker on Chromosome 8.
Cancer Res 68: 9982–9986.7. Guttman M, Amit I, Garber M, French C, Lin MF, et al. (2009) Chromatin
signature reveals over a thousand highly conserved large non-coding RNAs inmammals. Nature 458: 223–227.
8. Birney E, Stamatoyannopoulos JA, Dutta A, Guigo R, Gingeras TR, et al.
(2007) Identification and analysis of functional elements in 1% of the humangenome by the ENCODE pilot project. Nature 447: 799–816.
9. Bernstein BE, Meissner A, Lander ES (2007) The mammalian epigenome. Cell128: 669–681.
10. Heintzman ND, Stuart RK, Hon G, Fu Y, Ching CW, et al. (2007) Distinct and
predictive chromatin signatures of transcriptional promoters and enhancers inthe human genome. Nat Genet 39: 311–318.
11. Wang Z, Zang C, Rosenfeld JA, Schones DE, Barski A, et al. (2008)Combinatorial patterns of histone acetylations and methylations in the human
genome. Nat Genet 40: 897–903.12. Jia L, Berman BP, Jariwala U, Yan X, Cogan JP, et al. (2008) Genomic
androgen receptor-occupied regions with different functions, defined by histone
acetylation, coregulators and transcriptional capacity. PLoS ONE 3: e3645.doi:10.1371/journal.pone.0003645.
13. Mendenhall EM, Bernstein BE (2008) Chromatin state maps: new technologies,new insights. Curr Opin Genet Dev 18: 109–115.
14. Pomerantz MM, Beckwith CA, Regan MM, Wyman SK, Petrovics G, et al.
(2009) Evaluation of the 8q24 Prostate Cancer Risk Locus and MYCExpression. Cancer Res;In press.
15. Gal-Yam EN, Egger G, Iniguez L, Holster H, Einarsson S, et al. (2008) Frequentswitching of Polycomb repressive marks and DNA hypermethylation in the PC3
prostate cancer cell line. Proc Natl Acad Sci U S A 105: 12979–12984.16. Jaschek R, Tanay A (2009) Spatial Clustering of Multivariate Genomic and
Epigenomic Information. RECOMB. pp 170–183.
17. Pomerantz MM, N. A, Jia L, Herman P, Verzi1 MP, et al. (2009) The 8q24
cancer risk variant rs6983267 demonstrates longrange interaction with MYC incolorectal cancer. Nat Genet;In press.
18. Buchanan G, Irvine RA, Coetzee GA, Tilley WD (2001) Contribution of the
androgen receptor to prostate cancer predisposition and progression. CancerMetastasis Rev 20: 207–223.
19. Lupien M, Eeckhoute J, Meyer CA, Wang Q, Zhang Y, et al. (2008) FoxA1translates epigenetic signatures into enhancer-driven lineage-specific transcrip-
tion. Cell 132: 958–970.
20. Visel A, Blow MJ, Li Z, Zhang T, Akiyama JA, et al. (2009) ChIP-seq accuratelypredicts tissue-specific activity of enhancers. Nature 457: 854–858.
21. Kininis M, Kraus WL (2008) A global view of transcriptional regulation bynuclear receptors: gene expression, factor localization, and DNA sequence
analysis. Nucl Recept Signal 6: e005.22. Ooi L, Wood IC (2007) Chromatin crosstalk in development and disease: lessons
from REST. Nat Rev Genet 8: 544–554.
23. Murphy DJ, Junttila MR, Pouyet L, Karnezis A, Shchors K, et al. (2008)Distinct thresholds govern Myc’s biological output in vivo. Cancer Cell 14:
447–457.24. Buchanan G, Craft PS, Yang M, Cheong A, Prescott J, et al. (2004) PC-3 cells
with enhanced androgen receptor signaling: A model for clonal selection in
prostate cancer. Prostate 60: 352–366.25. Jia L, Kim J, Shen H, Clark PE, Tilley WD, et al. (2003) Androgen receptor
activity at the prostate specific antigen locus: steroidal and non-steroidalmechanisms. Mol Cancer Res 1: 385–392.
26. Oh WK, Hayes J, Evan C, Manola J, George DJ, et al. (2006) Development ofan integrated prostate cancer research information system. Clin Genitourin
Cancer 5: 61–66.
27. Luppen CA, Leclerc N, Noh T, Barski A, Khokhar A, et al. (2003) Brief bonemorphogenetic protein 2 treatment of glucocorticoid-inhibited MC3T3-E1
osteoblasts rescues commitment-associated cell cycle and mineralization withoutalteration of Runx2. J Biol Chem 278: 44995–45003.
28. Kolonel LN, Altshuler D, Henderson BE (2004) The multiethnic cohort study:
exploring genes, lifestyle and cancer risk. Nat Rev Cancer 4: 519–527.29. Kolonel LN, Henderson BE, Hankin JH, Nomura AM, Wilkens LR, et al. (2000)
A multiethnic cohort in Hawaii and Los Angeles: baseline characteristics.Am J Epidemiol 151: 346–357.
30. Jia L, Shen HC, Wantroba M, Khalid O, Liang G, et al. (2006) Locus-widechromatin remodeling and enhanced androgen receptor-mediated transcription
in recurrent prostate tumor cells. Mol Cell Biol 26: 7331–7341.
Unraveling 8q24 Cancer Risk
PLoS Genetics | www.plosgenetics.org 10 August 2009 | Volume 5 | Issue 8 | e1000597
Copyright © 2022 FDOKUMEN