Pneumococcal capsule synthesis locus cps as evolutionary ...
37
1 Pneumococcal capsule synthesis locus cps as evolutionary hotspot with potential to generate novel serotypes by recombination. 2 Rafa l J. Mostowy 1,† , Nicholas J. Croucher 1 , Nicola De Maio 2,3 , Claire Chewapreecha 4,5 , Susannah J. Salter 6 , Paul Turner 7,8 , David M. Aanensen 1,9 , Stephen D. Bentley 5 , Xavier Didelot 1 , Christophe 4 Fraser 1,10 1) Department of Infectious Disease Epidemiology, School of Public Health, Imperial College London, W2 1PG 6 London, UK 2) Nuffield Department of Medicine, University of Oxford, Oxford, UK 8 3) Institute for Emerging Infections, Oxford Martin School, Oxford, UK 4) Department of Medicine, University of Cambridge, Cambridge, UK 10 5) Bioinformatics and Systems Biology Program, School of Bioresources and Technology, King Mongkut’s University of Technology Thonburi, 10140, Bangkok Thailand. 12 6) The Wellcome Trust Sanger Institute, Wellcome Trust Genome Campus, Hinxton, Cambridge CB10 1SA, UK 7) Centre for Tropical Medicine and Global Health, Nuffield Department of Medicine, University of Oxford, Oxford 14 OX3 7FZ United Kingdom 8) Cambodia-Oxford Medical Research Unit, Angkor Hospital for Children, Siem Reap, Cambodia 16 9) Centre for Genomic Pathogen Surveillance, Wellcome Genome Campus, Hinxton, Cambridge CB10 1SA, UK 10) Oxford Big Data Institute, Li Ka Shing Centre for Health Information and Discovery, Nuffield Department of 18 Medicine, University of Oxford, Oxford, UK † Corresponding author: [email protected] 20
-
Upload
khangminh22 -
Category
Documents
-
view
0 -
download
0
Transcript of Pneumococcal capsule synthesis locus cps as evolutionary ...
1
Pneumococcal capsule synthesis locus cps as evolutionary hotspot
with potential to generate novel serotypes by recombination.2
Rafa l J. Mostowy1,†, Nicholas J. Croucher1, Nicola De Maio2,3, Claire Chewapreecha4,5, Susannah J.
Salter6, Paul Turner7,8, David M. Aanensen1,9, Stephen D. Bentley5, Xavier Didelot1, Christophe4
Fraser1,10
1) Department of Infectious Disease Epidemiology, School of Public Health, Imperial College London, W2 1PG6
London, UK
2) Nuffield Department of Medicine, University of Oxford, Oxford, UK8
3) Institute for Emerging Infections, Oxford Martin School, Oxford, UK
4) Department of Medicine, University of Cambridge, Cambridge, UK10
5) Bioinformatics and Systems Biology Program, School of Bioresources and Technology, King Mongkut’s University of
Technology Thonburi, 10140, Bangkok Thailand.12
6) The Wellcome Trust Sanger Institute, Wellcome Trust Genome Campus, Hinxton, Cambridge CB10 1SA, UK
7) Centre for Tropical Medicine and Global Health, Nuffield Department of Medicine, University of Oxford, Oxford14
OX3 7FZ United Kingdom
8) Cambodia-Oxford Medical Research Unit, Angkor Hospital for Children, Siem Reap, Cambodia16
9) Centre for Genomic Pathogen Surveillance, Wellcome Genome Campus, Hinxton, Cambridge CB10 1SA, UK
10) Oxford Big Data Institute, Li Ka Shing Centre for Health Information and Discovery, Nuffield Department of18
Medicine, University of Oxford, Oxford, UK
† Corresponding author: [email protected]

2
Abstract
Diversity of the polysaccharide capsule in Streptococcus pneumoniae – main surface antigen and the2
target of the currently used pneumococcal vaccines – constitutes a major obstacle in eliminating pneumo-
coccal disease. Such diversity is genetically encoded by almost 100 variants of the capsule biosynthesis4
locus, cps. However, the evolutionary dynamics of the capsule remains not fully understood. Here, us-
ing genetic data from 4,469 bacterial isolates, we found cps to be an evolutionary hotspot with elevated6
substitution and recombination rates. These rates were a consequence of relaxed purifying selection and
positive, diversifying selection acting at this locus, supporting the hypothesis that the capsule has an in-8
creased potential to generate novel diversity compared to the rest of the genome. Diversifying selection
was particularly evident in two regulatory genes wzd/wze, which are known to affect capsule expression and10
thus the bacterium’s ability to cause invasive disease. Using a novel, capsule-centred approach, we analysed
the evolutionary history of twelve major serogroups. Such analysis revealed their complex diversification12
scenarios, which were principally driven by recombination with other serogroups and other streptococci.
Patterns of recombinational exchanges between serogroups could not be explained by serotype frequency14
alone, thus pointing to non-random associations between co-colonising serotypes. Finally, we discovered a
previously unobserved mosaic serotype 39X, which was confirmed to carry a viable and structurally novel16
capsule. Adding to previous discoveries of other mosaic capsules in densely sampled collections, these re-
sults emphasise the strong adaptive potential of the bacterium by its ability to generate novel antigenic18
diversity by recombination.
Introduction20
Streptococcus pneumoniae is a human bacterial commensal and pathogen, estimated to be the
cause of death in over 500,000 children under 5 years of age each year worldwide (WHO, 2012). The22
bacterium’s capacity to cause disease is associated with its possession of several virulence factors, of
which the most important is the surface polysaccharide capsule (Briles et al., 1992; Morona et al.,24
2004; Kadioglu et al., 2008; Hyams et al., 2010). As the outermost layer of the bacterium, the
capsule is the target of all licensed pneumococcal vaccines. However, the large diversity of capsular26
polysaccharides constitutes a major challenge for eliminating pneumococcal disease. The most
commonly used conjugate vaccines currently target ten or thirteen of the most common capsular28
types (serotypes), but today almost 100 distinct serotypes have been described and recognised.
Each serotype has a unique, experimentally confirmed serological profile (Henrichsen, 1995), and30
for many of them the biochemical structure is known (Geno et al., 2015).
3
The polysaccharide capsule in the pneumococcus is synthesised by genes located in the cps locus
(Munoz et al., 1997). Systematic genetic sequencing revealed that the diversity of cps alone forms2
a repertoire of almost 2,000 coding sequences (Bentley et al., 2006). These genes are divided based
on their functions and form three major groups (Yother, 2011; Geno et al., 2015). The first group4
is located upstream of the locus and consists of modulatory wzg, wzh, wzd and wze genes (aka.
cpsABCD), which are common to almost all serotypes. The second group are serotype-specific6
genes (i.e., glycosyltrasferases and acetyltrasferases) with polymer-specific functions, and these de-
fine a serotype. Finally, many serotypes carry sugar-synthesis genes needed for capsule production8
(e.g., rhamnose genes). Comparison of the genetic content of different serotypes demonstrated that
capsular gene acquisition and loss had been the underlying cause of emergence of many serotypes10
(Aanensen et al., 2007; Mavroidi et al., 2007). This is not surprising as the pneumococcus is known
to undergo frequent recombination (Feil et al., 2000; Henriques-Normark et al., 2008; Vos and Dide-12
lot, 2009), and the cps locus was shown to have elevated recombination rates in several lineages
(Croucher et al., 2011; Chewapreecha et al., 2014). Furthermore, we know from previous studies14
that the extent of within-serotype diversity is under-appreciated, with many hybrid serotypes cir-
culating in the population (Salter et al., 2012; van Tonder et al., 2016). However, the evolutionary16
dynamics, and hence the full adaptive potential of pneumococcal capsular polysaccharides, are not
well understood.18
The aim of this study was to gain a high-resolution view of the evolution of capsular polysaccha-
rides in S. pneumoniae. In particular, we wanted to infer the rates of evolution and recombination20
within the cps locus, compare these parameters between different serogroups, and compare the
relationship between evolution affecting capsular genes and that affecting the remainder of the22
genome. To this end, we analysed capsular diversity in a collection of 4,469 bacterial isolates from
several different studies, together with 50 non-pneumococcal streptococcal isolates (see supplemen-24
tary tables S1 and S2). Our approach allowed us to observe the evolution of the pneumococcus
from the point of view of the capsule itself, subdivided in major serotypes and serogroups, with26
the tree showing the evolution of the cps locus and the tips of the tree containing the information
about changes between different genomic backgrounds. By disentangling horizontal from vertical28
genetic changes, we gained insight into the timescales of diversification and recombination in cap-
sular genes. This approach brings novel qualitative and quantitative insight into the evolution of30
serotypes, the principal target of current vaccines.
4
Results
Species-wide serotype diversity2
To study the evolution of the cps locus, we analysed several collections of pneumococcal isolates
including two large carriage cohorts from MaeLa, Thailand (Chewapreecha et al., 2014) and Mas-4
sachusetts (Croucher et al., 2013); three widespread lineages, PMEN1 (CC81), PMEN2 (CC90)
and PMEN14 (CC236) (Croucher et al., 2011, 2014b,a); cps reference collection (Bentley et al.,6
2006); Dutch isolates from invasive disease (Elberse et al., 2011); and publically available reference
genomes from the European Nucleotide Archive (ENA). This gave a total number of 4,469 isolates8
from 29 countries and 5 continents, as shown in fig. 1A. To extract the cps locus in Illumina-
sequenced isolates (96%), these isolates were reassembled using a novel pipeline (see Materials and10
Methods). In total, we obtained 3,813 full cps sequences, which were serotyped in silico (see sup-
plementary table S3). Fig. 1B shows the observed serotype distribution, with 47% of the identified12
cps sequences being serotypes targeted by the seven-valent pneumoccal conjugate vaccine (PCV7)
and 59% being serotypes targeted by the more recent thirteen-valent vaccine (PCV13). Altogether14
we identified 96 reference serotypes consisting of 254 homology groups (henceforth referred to as
capsule-specific genes).16
Amongst the 96 references, there were two cps variants which have not been previously confirmed
as new serotypes. Putative serotype 10X was found in five isolates from MaeLa and originally18
classified as 10B, 10F or 33B. Its genetic structure suggests that it is a mosaic of 10C or 10F
with another serotype, possibly 35B (supplementary fig. S1). The same variant was termed 33X20
in a recent report by van Tonder et al. (2016), however genetic analysis shows that it shares more
capsule-specific genes with serogroup 10 than 33, and in this study we analysed it together with the22
remaining members of serogroup 10. Putative serotype 39X was found in three isolates from MaeLa
(see Supplementary Material online), and to our knowledge has not been previously described. Its24
genetic structure suggests that it could have arisen as a recombination between 6C/6D and 39
(supplementary fig. S2). Indeed, in a serotyping experiment 39X reacted to antiserum which covers26
serotypes 33 and 39. From this we can conclude that pneumococci with the 39X cps locus are
capable of producing a novel capsular polysaccharide, and that it may have some cross-reactivity28
to existing pneumococcal sera (see Supplementary Material online).
To visualise cps diversity within the pneumococcus, we generated a network with nodes repre-30
sented by cps reference sequences and edges linking serotypes of minimum similarity s, defined as
a maximum of the two proportions of shared capsule-specific homology groups between each pair32
5
(see Materials and Methods). Fig. 1C shows this similarity network for two different thresholds,
conservative (s = 58%) and liberal (s = 36%), with two corresponding edge types depicted in the2
figure. We see that serotype clusters in the conservative network (henceforth referred to as genetic
serogroups) are often congruent with phenotypic serogroups. Nevertheless, there are exceptions: for4
example serotype 16F clusters with serogroup 28 with conservative threshold, but does not cluster
with 16A even with liberal threshold. These observations are consistent with earlier findings and6
highlight the complexity of the polysaccharide genotype-phenotype map (Aanensen et al., 2007;
Mavroidi et al., 2007). This approach also allows identification of mosaic triplets (nodes connecting8
other groups), which denote potential introgressive descents (Bapteste et al., 2012). In this way
one can quickly identify some of the mosaic cps variants, for example 18F (shares wcxM gene with10
18A/18B/18C and 28A/28F/16F) or 22A (shares wcwC gene with 22F and 7A/7F). The largest
connected component, which includes serogroups 10, 33, 34, 35 and others, is the one with the12
largest number of mosaic triplets. Indeed, a gene-sharing network analysis suggested that its mem-
bers consist of the most interconnected serotypes (see supplementary fig. S3). Therefore, we can14
conclude that many serotypes are highly mosaic in nature and their evolution was likely driven by
horizontal transfer of DNA.16
Recombination drives emergence of serotypes
We next investigated the diversification of different serogroups into serotypes. Gaining such insight18
from whole-genomes in S. pneumoniae is problematic. Due to frequent serotype switching, whole-
genome based phylogenies for a serogroup in question would need to be constructed based on20
distant bacterial lineages. However, previous studies have shown that high recombination rates
in the pneumococcus can obliterate the phylogenetic signal at deeper branches (Feil et al., 2001;22
Mostowy et al., 2017). This suggests that whole-genome trees based on distant pneumococcal
lineages could not be used to reliably infer the underlying evolutionary processes leading to the24
diversification of serogroups. To circumvent this problem, here we obtained clonal trees based on
cps sequences of genetic serogroups defined by red edges in fig. 1C (nodes marked with red labels).26
This approach has two main advantages. First, by focusing on closely related serotypes which
share a large majority of their tightly linked genetic content, we can more reliably apply standard28
population-genetic tools and infer the underlying clonal phylogeny. Second, this approach allows
to view the evolution of the pneumococcus from the perspective of the capsule itself, with the tree30
showing the evolution of the cps locus and the tips of the tree containing the information about
how the capsule changes between different genomic backgrounds.32
6
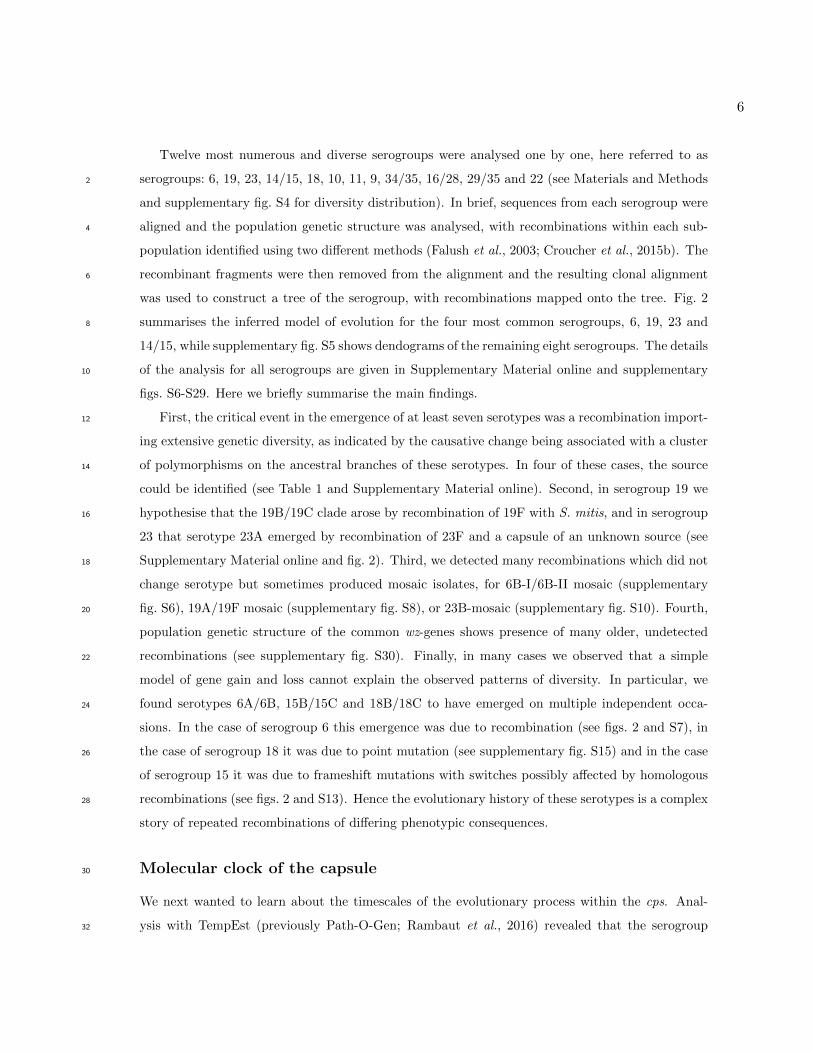
Twelve most numerous and diverse serogroups were analysed one by one, here referred to as
serogroups: 6, 19, 23, 14/15, 18, 10, 11, 9, 34/35, 16/28, 29/35 and 22 (see Materials and Methods2
and supplementary fig. S4 for diversity distribution). In brief, sequences from each serogroup were
aligned and the population genetic structure was analysed, with recombinations within each sub-4
population identified using two different methods (Falush et al., 2003; Croucher et al., 2015b). The
recombinant fragments were then removed from the alignment and the resulting clonal alignment6
was used to construct a tree of the serogroup, with recombinations mapped onto the tree. Fig. 2
summarises the inferred model of evolution for the four most common serogroups, 6, 19, 23 and8
14/15, while supplementary fig. S5 shows dendograms of the remaining eight serogroups. The details
of the analysis for all serogroups are given in Supplementary Material online and supplementary10
figs. S6-S29. Here we briefly summarise the main findings.
First, the critical event in the emergence of at least seven serotypes was a recombination import-12
ing extensive genetic diversity, as indicated by the causative change being associated with a cluster
of polymorphisms on the ancestral branches of these serotypes. In four of these cases, the source14
could be identified (see Table 1 and Supplementary Material online). Second, in serogroup 19 we
hypothesise that the 19B/19C clade arose by recombination of 19F with S. mitis, and in serogroup16
23 that serotype 23A emerged by recombination of 23F and a capsule of an unknown source (see
Supplementary Material online and fig. 2). Third, we detected many recombinations which did not18
change serotype but sometimes produced mosaic isolates, for 6B-I/6B-II mosaic (supplementary
fig. S6), 19A/19F mosaic (supplementary fig. S8), or 23B-mosaic (supplementary fig. S10). Fourth,20
population genetic structure of the common wz-genes shows presence of many older, undetected
recombinations (see supplementary fig. S30). Finally, in many cases we observed that a simple22
model of gene gain and loss cannot explain the observed patterns of diversity. In particular, we
found serotypes 6A/6B, 15B/15C and 18B/18C to have emerged on multiple independent occa-24
sions. In the case of serogroup 6 this emergence was due to recombination (see figs. 2 and S7), in
the case of serogroup 18 it was due to point mutation (see supplementary fig. S15) and in the case26
of serogroup 15 it was due to frameshift mutations with switches possibly affected by homologous
recombinations (see figs. 2 and S13). Hence the evolutionary history of these serotypes is a complex28
story of repeated recombinations of differing phenotypic consequences.
Molecular clock of the capsule30
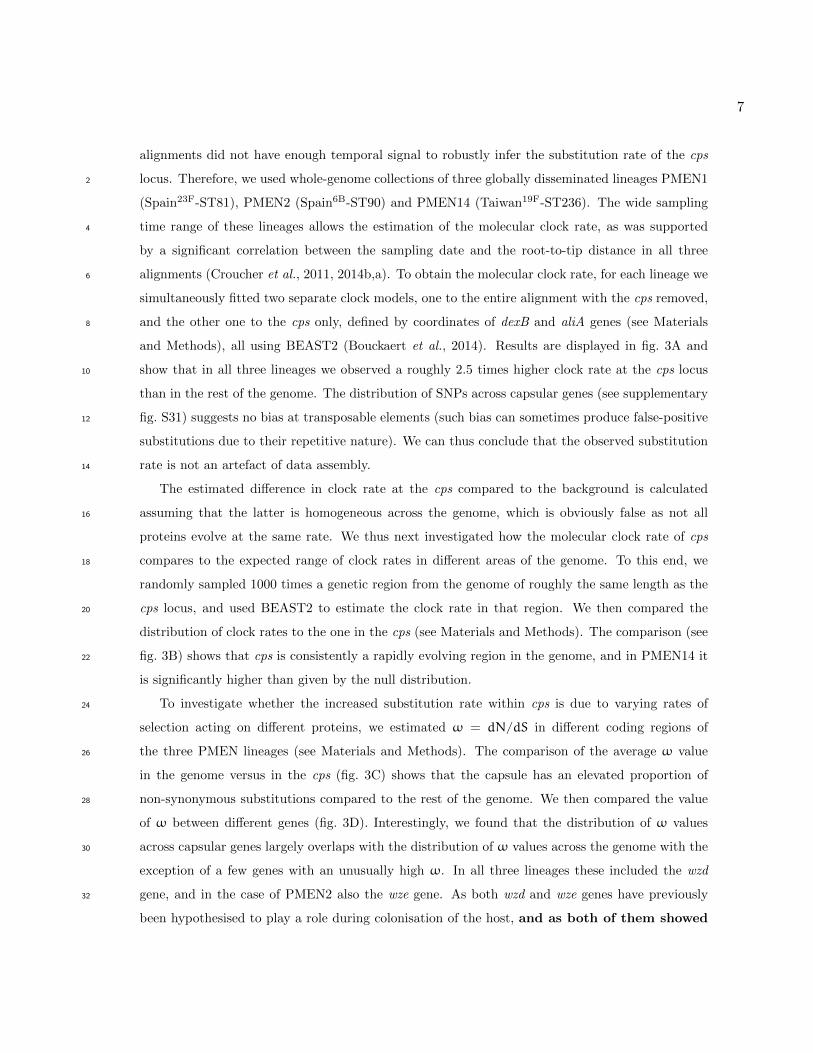
We next wanted to learn about the timescales of the evolutionary process within the cps. Anal-
ysis with TempEst (previously Path-O-Gen; Rambaut et al., 2016) revealed that the serogroup32
7
alignments did not have enough temporal signal to robustly infer the substitution rate of the cps
locus. Therefore, we used whole-genome collections of three globally disseminated lineages PMEN12
(Spain23F-ST81), PMEN2 (Spain6B-ST90) and PMEN14 (Taiwan19F-ST236). The wide sampling
time range of these lineages allows the estimation of the molecular clock rate, as was supported4
by a significant correlation between the sampling date and the root-to-tip distance in all three
alignments (Croucher et al., 2011, 2014b,a). To obtain the molecular clock rate, for each lineage we6
simultaneously fitted two separate clock models, one to the entire alignment with the cps removed,
and the other one to the cps only, defined by coordinates of dexB and aliA genes (see Materials8
and Methods), all using BEAST2 (Bouckaert et al., 2014). Results are displayed in fig. 3A and
show that in all three lineages we observed a roughly 2.5 times higher clock rate at the cps locus10
than in the rest of the genome. The distribution of SNPs across capsular genes (see supplementary
fig. S31) suggests no bias at transposable elements (such bias can sometimes produce false-positive12
substitutions due to their repetitive nature). We can thus conclude that the observed substitution
rate is not an artefact of data assembly.14
The estimated difference in clock rate at the cps compared to the background is calculated
assuming that the latter is homogeneous across the genome, which is obviously false as not all16
proteins evolve at the same rate. We thus next investigated how the molecular clock rate of cps
compares to the expected range of clock rates in different areas of the genome. To this end, we18
randomly sampled 1000 times a genetic region from the genome of roughly the same length as the
cps locus, and used BEAST2 to estimate the clock rate in that region. We then compared the20
distribution of clock rates to the one in the cps (see Materials and Methods). The comparison (see
fig. 3B) shows that cps is consistently a rapidly evolving region in the genome, and in PMEN14 it22
is significantly higher than given by the null distribution.
To investigate whether the increased substitution rate within cps is due to varying rates of24
selection acting on different proteins, we estimated ω = dN/dS in different coding regions of
the three PMEN lineages (see Materials and Methods). The comparison of the average ω value26
in the genome versus in the cps (fig. 3C) shows that the capsule has an elevated proportion of
non-synonymous substitutions compared to the rest of the genome. We then compared the value28
of ω between different genes (fig. 3D). Interestingly, we found that the distribution of ω values
across capsular genes largely overlaps with the distribution of ω values across the genome with the30
exception of a few genes with an unusually high ω. In all three lineages these included the wzd
gene, and in the case of PMEN2 also the wze gene. As both wzd and wze genes have previously32
been hypothesised to play a role during colonisation of the host, and as both of them showed
8
a trend of elevated diversity compared to other cps genes, we next tested the hypothesis
that these genes have been under diversifying selection. To this end, we estimated ω as well as2
the number of synonymous and non-synonymous substitutions for the wzd/wze region (see table
2). In both PMEN1 and PMEN14 we found the wzd/wze region to contain a significantly greater4
proportion of non-synonymous to synonymous substitutions compared to other genes in the cps
locus. Comparison of ω in the wzd/wze region with the one estimated for the entire cps locus and a6
background-derived null distribution is presented in fig. 3E. It shows that the slightly higher value
of ω in the cps is likely driven by the high value of ω in the wzd/wze region. Thus, we conclude8
that the higher level of selection in the cps locus is likely driven by strong, positive, diversifying
selection acting on the upstream wzd/wze genes.10
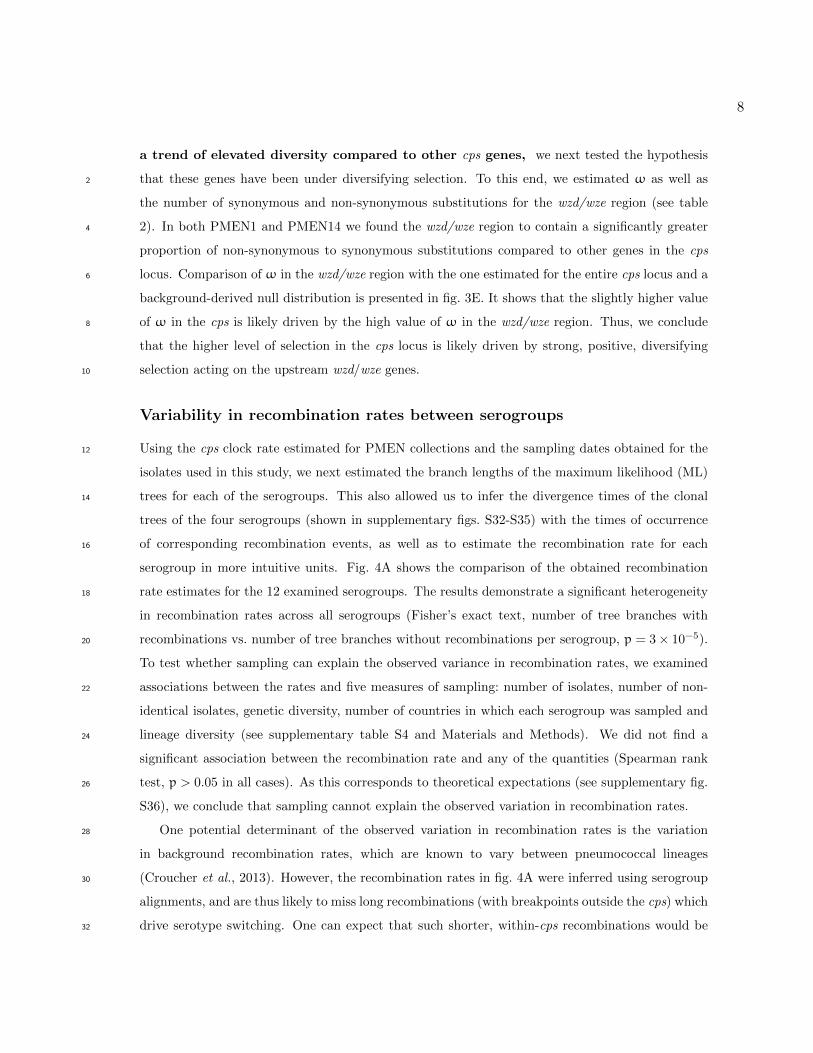
Variability in recombination rates between serogroups
Using the cps clock rate estimated for PMEN collections and the sampling dates obtained for the12
isolates used in this study, we next estimated the branch lengths of the maximum likelihood (ML)
trees for each of the serogroups. This also allowed us to infer the divergence times of the clonal14
trees of the four serogroups (shown in supplementary figs. S32-S35) with the times of occurrence
of corresponding recombination events, as well as to estimate the recombination rate for each16
serogroup in more intuitive units. Fig. 4A shows the comparison of the obtained recombination
rate estimates for the 12 examined serogroups. The results demonstrate a significant heterogeneity18
in recombination rates across all serogroups (Fisher’s exact text, number of tree branches with
recombinations vs. number of tree branches without recombinations per serogroup, p = 3× 10⁻⁵).20
To test whether sampling can explain the observed variance in recombination rates, we examined
associations between the rates and five measures of sampling: number of isolates, number of non-22
identical isolates, genetic diversity, number of countries in which each serogroup was sampled and
lineage diversity (see supplementary table S4 and Materials and Methods). We did not find a24
significant association between the recombination rate and any of the quantities (Spearman rank
test, p > 0.05 in all cases). As this corresponds to theoretical expectations (see supplementary fig.26
S36), we conclude that sampling cannot explain the observed variation in recombination rates.
One potential determinant of the observed variation in recombination rates is the variation28
in background recombination rates, which are known to vary between pneumococcal lineages
(Croucher et al., 2013). However, the recombination rates in fig. 4A were inferred using serogroup30
alignments, and are thus likely to miss long recombinations (with breakpoints outside the cps) which
drive serotype switching. One can expect that such shorter, within-cps recombinations would be32
9
be observed less frequently for two reasons. First, the recombination rate at capsule-specific genes
may be lower when recombination occurs between different serotypes or serogroups due to the lack2
of sequence similarity at the flanks of the transformed segment. Second, recombinations which are
mechanistically possible could be under natural, negative selection as they are more likely to dis-4
rupt the polysaccharide structure, thus affecting the viability of the capsule. These two hypotheses
are consistent with the recombination frequency pattern observed at cps (see fig. 4B). However,6
the absolute and relative impact of the two processes could vary between different serogroups, for
example due to varying epistatic interactions of capsular genes or co-colonisation rates of different8
serogroups. In such case, the ratio of within-cps recombination rate to full-cps recombination rate
could vary between serogroups, thereby affecting the variation observed in figure 4A.10
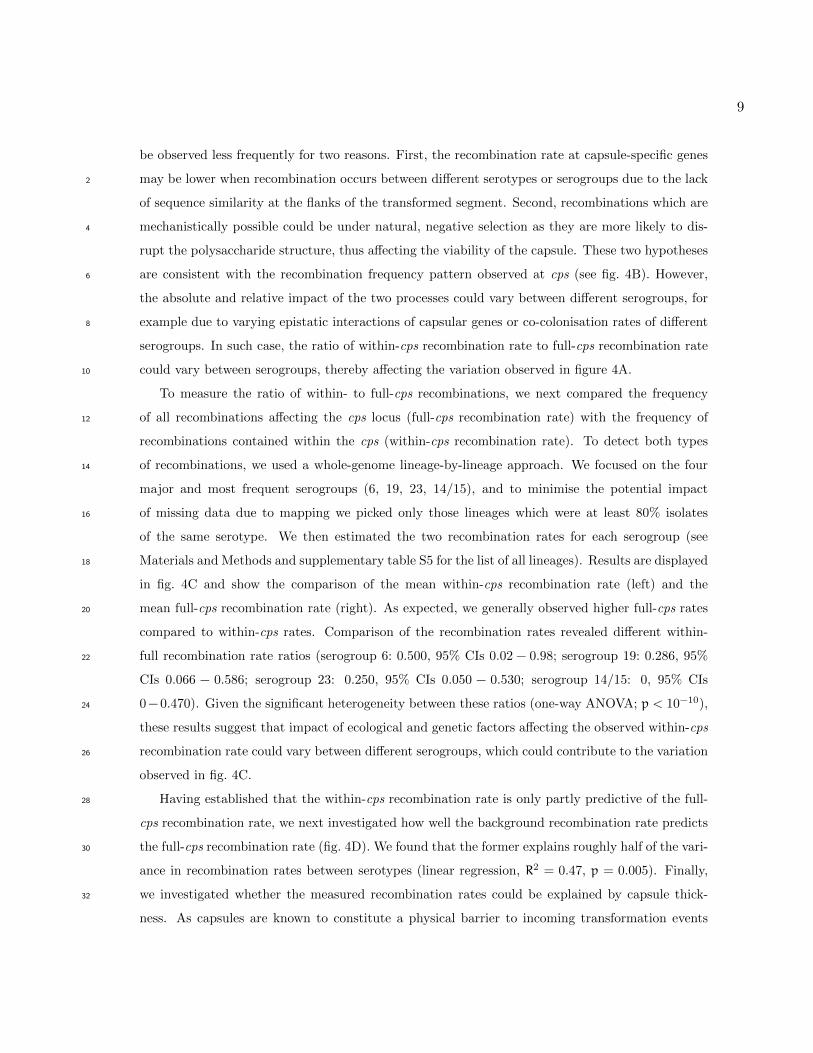
To measure the ratio of within- to full-cps recombinations, we next compared the frequency
of all recombinations affecting the cps locus (full-cps recombination rate) with the frequency of12
recombinations contained within the cps (within-cps recombination rate). To detect both types
of recombinations, we used a whole-genome lineage-by-lineage approach. We focused on the four14
major and most frequent serogroups (6, 19, 23, 14/15), and to minimise the potential impact
of missing data due to mapping we picked only those lineages which were at least 80% isolates16
of the same serotype. We then estimated the two recombination rates for each serogroup (see
Materials and Methods and supplementary table S5 for the list of all lineages). Results are displayed18
in fig. 4C and show the comparison of the mean within-cps recombination rate (left) and the
mean full-cps recombination rate (right). As expected, we generally observed higher full-cps rates20
compared to within-cps rates. Comparison of the recombination rates revealed different within-
full recombination rate ratios (serogroup 6: 0.500, 95% CIs 0.02 − 0.98; serogroup 19: 0.286, 95%22
CIs 0.066 − 0.586; serogroup 23: 0.250, 95% CIs 0.050 − 0.530; serogroup 14/15: 0, 95% CIs
0− 0.470). Given the significant heterogeneity between these ratios (one-way ANOVA; p < 10−10),24
these results suggest that impact of ecological and genetic factors affecting the observed within-cps
recombination rate could vary between different serogroups, which could contribute to the variation26
observed in fig. 4C.
Having established that the within-cps recombination rate is only partly predictive of the full-28
cps recombination rate, we next investigated how well the background recombination rate predicts
the full-cps recombination rate (fig. 4D). We found that the former explains roughly half of the vari-30
ance in recombination rates between serotypes (linear regression, R2 = 0.47, p = 0.005). Finally,
we investigated whether the measured recombination rates could be explained by capsule thick-32
ness. As capsules are known to constitute a physical barrier to incoming transformation events
10
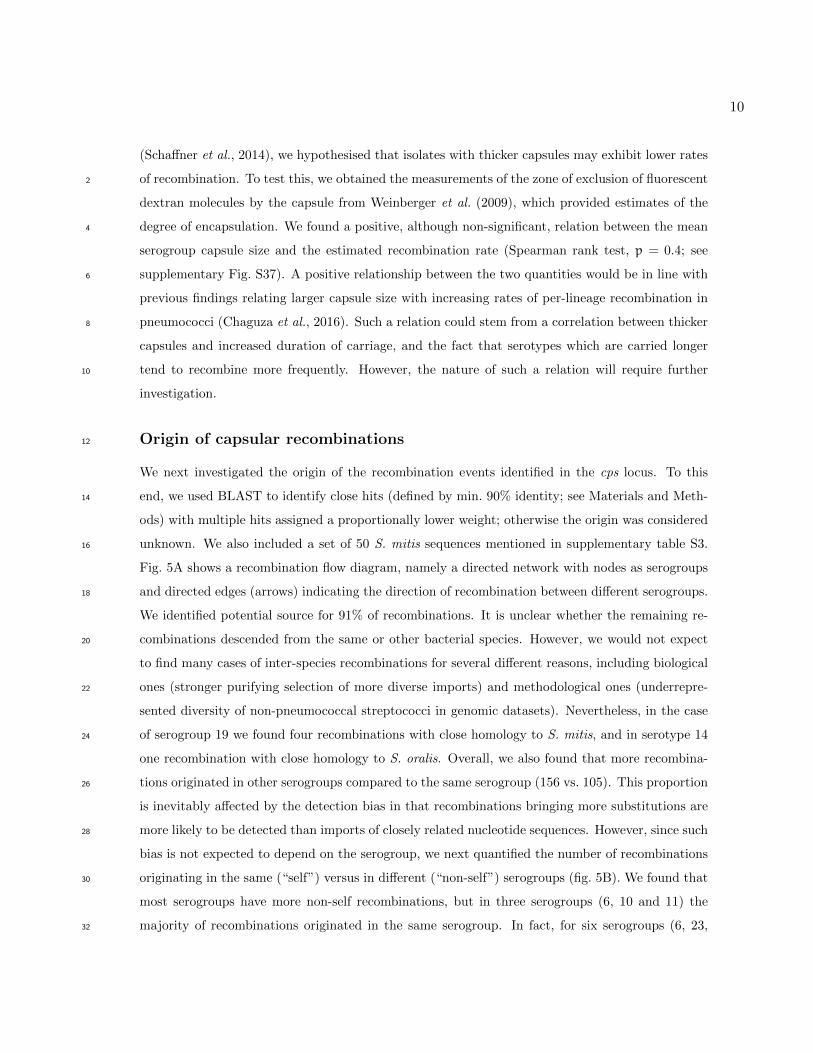
(Schaffner et al., 2014), we hypothesised that isolates with thicker capsules may exhibit lower rates
of recombination. To test this, we obtained the measurements of the zone of exclusion of fluorescent2
dextran molecules by the capsule from Weinberger et al. (2009), which provided estimates of the
degree of encapsulation. We found a positive, although non-significant, relation between the mean4
serogroup capsule size and the estimated recombination rate (Spearman rank test, p = 0.4; see
supplementary Fig. S37). A positive relationship between the two quantities would be in line with6
previous findings relating larger capsule size with increasing rates of per-lineage recombination in
pneumococci (Chaguza et al., 2016). Such a relation could stem from a correlation between thicker8
capsules and increased duration of carriage, and the fact that serotypes which are carried longer
tend to recombine more frequently. However, the nature of such a relation will require further10
investigation.
Origin of capsular recombinations12
We next investigated the origin of the recombination events identified in the cps locus. To this
end, we used BLAST to identify close hits (defined by min. 90% identity; see Materials and Meth-14
ods) with multiple hits assigned a proportionally lower weight; otherwise the origin was considered
unknown. We also included a set of 50 S. mitis sequences mentioned in supplementary table S3.16
Fig. 5A shows a recombination flow diagram, namely a directed network with nodes as serogroups
and directed edges (arrows) indicating the direction of recombination between different serogroups.18
We identified potential source for 91% of recombinations. It is unclear whether the remaining re-
combinations descended from the same or other bacterial species. However, we would not expect20
to find many cases of inter-species recombinations for several different reasons, including biological
ones (stronger purifying selection of more diverse imports) and methodological ones (underrepre-22
sented diversity of non-pneumococcal streptococci in genomic datasets). Nevertheless, in the case
of serogroup 19 we found four recombinations with close homology to S. mitis, and in serotype 1424
one recombination with close homology to S. oralis. Overall, we also found that more recombina-
tions originated in other serogroups compared to the same serogroup (156 vs. 105). This proportion26
is inevitably affected by the detection bias in that recombinations bringing more substitutions are
more likely to be detected than imports of closely related nucleotide sequences. However, since such28
bias is not expected to depend on the serogroup, we next quantified the number of recombinations
originating in the same (“self”) versus in different (“non-self”) serogroups (fig. 5B). We found that30
most serogroups have more non-self recombinations, but in three serogroups (6, 10 and 11) the
majority of recombinations originated in the same serogroup. In fact, for six serogroups (6, 23,32

11
18, 10, 11, 9) we found a significant departure from randomness in the distribution of recombi-
nations (with distributions modelled as binomial with probabilities conditional on the2
observed serogroup frequencies; see Materials and Methods), suggesting that at least
for some serogroups basic frequency distribution cannot explain the observed self/non-self recom-4
bination ratios. This points to unexpected patterns of co-occurrence of different serogroups, which
could be driven by competition during host colonisation (see Discussion). Finally, the analysis of6
excess of self-recombinations over non-self-recombinations in different regions of the cps (fig. 5C)
shows that in some serogroups the pattern of self/non-self proportion holds for both capsule-specific8
genes (which are rare in other serogroups) and in capsule-nonspecific genes (which are common in
other serogroups).10
Capsule lineage jumping
Analysis of cps sequences allows the evolution of the species to be observed from the point of12
view of the antigen which occasionally alters its genetic background via ‘lineage jumping’. Such
jumps should be observed as alterations of clonal complexes (lineages) within individual clades of14
serotype trees. The example of serogroup 6 (fig. 6A) demonstrates a large within-clade variation
of clonal complexes. To estimate the rates of lineage-jumping for four major serogroups (6, 19, 2316
and 14/15), we defined a clonal complex (CC) using eBurst (Feil et al., 2004) by linking isolates
with 6/7 MLST-locus identity, and a clonal complex group (CCG) by linking isolates with 5/718
MLST-locus identity. We next used BEAST2 to predict the rate with which an isolate in each
serogroup is expected to jump lineage (see Materials and Methods). The results are shown in fig.20
6B. We found the mean jumping-rate between CCs to be 4.7 × 10⁻³ jumps per isolate per year,
and between CCGs to be 5.0×10⁻⁴ jumps per isolate per year. If changes between all pairs of CCs22
were equally likely, we would expect that 57% of them would alter the CCG. Thus, under a random
CC-jump model we would expect the CCG jumping rate to be roughly 0.57 times the CC jumping24
rate. Instead, we found the CCG jumping rate to be lower than expected. These results suggest
that pneumococcal serotypes are less likely to jump lineages if those lineages are very distant. This26
is consistent with the observation that most pneumococcal serotype switches were previously found
to occur within a serogroup (Croucher et al., 2015c).28
12
Discussion
The pneumococcal capsule biosynthesis locus, cps, is an evolutionary hotspot, presumably underly-2
ing immune selective pressures acting on this major antigen. In the cps, we found elevated molecular
clock rate and elevated recombination rate compared to the rest of the genome. The elevated clock4
rate can be explained by two selective forces acting on the capsule: relaxed purifying selection and
diversifying selection. The former is consistent with previous observations that non-essential bac-6
terial proteins are expected to evolve faster than essential proteins (Jordan et al., 2002), and that
a viable capsule is not essential for evolutionary success as non-encapsulated pneumococci have8
been found both in carriage and disease (Chewapreecha et al., 2014; Dixit et al., 2016). Using
three, globally disseminated lineages we also found evidence for diversifying selection10
acting on the region of wzd/wze genes, which are located within the cps locus upstream
of the capsule-specific genes. These two genes have been previously demonstrated to play a12
role in the interaction with the host; previous studies found mutations in wzd to affect attachment
to the cell wall (Morona et al., 2006), and mutations in wze to affect capsule biosynthesis (Morona14
et al., 2004), both essential for the bacterium’s ability to penetrate into blood and cause invasive
disease. As different alleles of the two genes have been associated with serotype’s invasiveness16
(Varvio et al., 2009), it is thus conceivable that isolates are under constant selective pressure to
alter capsule expression due to varying epidemiological forces or within-host factors.18
We also found recombination rate at the cps locus to vary substantially between lineages (see fig.
4D and supplementary fig. S38). The average rate of recombinations affecting the cps was around20
2.5 times higher than the genome-wide recombination rate (see supplementary fig. S39), and the
latter was generally a good predictor of the former. Why does capsule recombine so frequently?22
One explanation could be that this is a consequence of increased recombination-detection power due
to increased diversity. However, homologous recombination preferentially occurs between closely24
related isolates (Majewski et al., 2000; Majewski, 2001; Ansari and Didelot, 2014), and most recom-
binations between two random isolates at cps are not going to be possible due the lack of homology26
between most capsular genes. Furthermore, computer simulations have shown that most recombi-
nations occurring on such evolutionary timescales are detectable (Mostowy et al., 2014; Croucher28
et al., 2015b). Thus, the recombination rate is more likely elevated for the same reasons as the
molecular clock, namely that most of the observed recombinations are either those which selection30
has not yet had time to eliminate, or those promoted by diversifying selection. This hypothesis is
in line with the observation that in densely sampled areas there is a higher chance of finding a rare32
recombination which has not yet been purged: the densely sampled Thai collection featured two mo-

13
saic cps sequences which have not been observed outside Mae La, while the average recombination
rate in the Thai collection was found to be higher compared to the Massachusetts collection (see2
supplementary fig. S39). Furthermore, the two genes in which evidence for diversifying selection
was found here often serve as recombination breakpoints during serotype switching (Croucher et al.,4
2015c). Given that these genes also harbour older recombinations which are difficult to detect by
other methods (see supplementary fig. S30), it is conceivable that the selective pressure driving the6
diversification of wzd/wze could also promote recombination events in the cps locus, thus driving
the observed recombination rate. Conversely, it could be selection for diversity acting on8
the neighbouring capsule-specific genes driving the elevated recombination rate, which
in turn inflates the diversity observed in the regulatory wzd/wze genes. Either way, it10
seems that selection produces recombination hotspots in the capsule, and this translates into an
increased capsular diversity over time.12
Interestingly, variation in serogroup-specific recombination rates cannot be fully explained by
the differences in the background recombination rate. Our results point to an absolute as well as14
relative impact of two additional processes: (i) decreased frequency of homologous recombinations
at the cps locus between distant serotypes due to selection for sequence similarity and the flanks,16
and (ii) negative selection against recombinations which disrupt the polysaccharide structure. In
addition, we found unexpected patterns of recombinational exchanges at cps: in several serogroups18
we found many more recombinations originating in the same serogroup than expected from the
frequency pattern alone. Even expecting some donor-detection bias in favour of more common20
serogroups, we found significant departure from randomness in both frequent and rare serogroups
as well as no departure from randomness in both frequent and rare serogroups. Thus the observed22
patterns of exchanges likely reflect variation in co-occurrence rates between different serotypes and
serogroups. Competitive interactions between serotypes have been shown to exist in mice in vivo24
(Trzcinski et al., 2015), and this indeed suggests that such co-occurrence rates may not linearly
depend on the serotype frequency distribution. In summary, the observed recombination rates26
in different serogroups are a result of the genetic, microbiological, ecological, epidemiological and
evolutionary processes acting on the pneumococcal capsule.28
Our results suggest that inter-species recombination plays an important role in the evolution of
the cps locus. One prominent example is the emergence of the 19B/19C clade by recombination30
of 19F with Streptococcus mitis. Furthermore, five detected recombinations bore close resemblance
to S. mitis and S. oralis isolates. In addition, many capsule-specific genes are shared between32
different streptococci (Kilian et al., 2014; Sørensen et al., 2016). Given the scale of genetic di-

14
versity across the mitis group streptococci (Kilian et al., 2008), this suggests that many older,
hypothesized recombinations within the cps (for example the emergence of 23A by acquiring wzy2
gene) were probably acquired from other closely related bacteria. However, the timescales of such
processes remain unclear and require a better characterisation of the polysaccharide diversity in all4
nasopharyngeal bacteria.
The novel, capsule-centred approach devised here allows to perceive the evolution6
of the bacterium from the point of view of its major antigen. This has two main
advantages. First, it permits reconstruction of the evolutionary history of different8
serogroups by combining genetic data from distant lineages. Second, changes in the
genomic background on the serogroup-based tree can inform us about the evolutionary10
dynamics of the serotype switching process. Nevertheless, the main limitation of this
approach was the difficulty to detect long recombinations with breakpoints outside12
the cps locus. This was enhanced by the fact that we excluded external IS elements
and dexB/aliA/aliB genes, both of which flank the serotype-specific gene cluster. How-14
ever, the fact that we find comparable recombination rates for the four major genetic
serogroups in both cps-based approach and the lineage-by-lineage approach suggests16
that these limitations are unlikely to affect the key findings of this study.
All evidence thus points at the cps locus being a genetically plastic and dynamic locus under18
diversifying selection, with recombination being its main evolutionary driver. While most recom-
binations are expected to either be under weak negative selection or produce non-viable capsules20
(Park et al., 2014), occasionally mosaic, previously unseen capsules can emerge. Indeed, the densely
sampled Thai collection contained two mosaic serotypes, here termed 10X and 39X (the latter was22
confirmed to carry a viable and structurally novel capsule), while a 33B/33C hybrid was previously
identified in an isolate from Denmark (Salter et al., 2012). Given (i) that dense sampling leads24
to the discovery of more recombinations, (ii) that identifying a novel, mosaic capsule requires a
detailed, comparative approach, and (iii) the enormous diversity of glycosyltransferases and acetyl-26
transferases in the microbial world, we can expect that many more such hybrids are circulating
around the world. Why are these hybrids not spreading in the population? This could be due to28
several different factors, including cross-immunity (Lipsitch, 1997), competitive exclusion (Trzcin-
ski et al., 2015) or fitness differences (Cobey and Lipsitch, 2012). However, introduction of broader,30
conjugate vaccines in the future may empty ecological niches occupied by the common serotypes,
and provide a selective advantage for some of the rare, mosaic serotypes, which could increase in32
frequency over time. Therefore, a systematic characterisation of cps diversity across different na-
15
sopharyngeal species is important for a better characterisation of the true pneumococcal adaptive
potential.2
Materials and Methods
Isolates4
In this study we combined several, previously published genetic and genomic data collections of S.
pneumoniae. These include 3,085 isolates from a continuous mother-infant carriage study in the6
Mae La refugee camp, Thailand (Turner et al., 2012; Chewapreecha et al., 2014), 616 isolates from
children carriage in Massachusetts (Croucher et al., 2013), and 605 globally disseminated isolates8
from three lineages defined by the Pneumococcal Molecular Epidemiology Network: PMEN1 or
CC81 (Croucher et al., 2011), PMEN2 or CC90 (Croucher et al., 2014b), and PMEN14 or CC23610
(Croucher et al., 2014a). We also included 45 sequences of serogroup 6 and 19 isolates from invasive
disease from the Netherlands (Elberse et al., 2011), 92 reference sequences (Bentley et al., 2006; Park12
et al., 2007; Bratcher et al., 2011; Oliver et al., 2013), and a set of 25 reference genomes of S. pneu-
moniae as found in the European Nucleotide Archive www.ebi.ac.uk/genomes/bacteria.html.14
Assembly of whole-genome lineages
Two largest collections used in this study (Massachusetts and Thailand) were analysed as described16
in the original publications, with assemblies and the corresponding assembly statistics publicly
available (Croucher et al., 2015a; Chewapreecha et al., 2014). Briefly, core-genome alignments18
were constructed and their population structure was analysed by BAPS (Corander and Marttinen,
2006). The resulting fifteen largest monophyletic clusters in the Massachusetts collection and seven20
largest monophyletic clusters in the Thai collection were chosen for the lineage-by-lineage analysis.
The corresponding isolates were mapped to closely related references to produce whole-genome22
alignments. In addition, whole-genome alignments of the three PMEN lineages were obtained
by mapping to the closest reference as described in the original publications (Croucher et al.,24
2011, 2014b,a). We inferred the maximum likelihood (ML) clonal frame of these 25 alignments
using Gubbins (Croucher et al., 2015b), with recombinations mapped to nodes of the clonal tree.26
Imports occurring in regions annotated as mobile genetic elements were excluded. The list of all
lineages with basic summary statistics, including serotypes and predominant sequence types for28
each lineage, is given in supplementary table S5.

16
Assembly of cps variants
As default assemblies were optimised for the construction of the whole-genome alignments, not all2
isolates had the cps locus contained in a single contig. To maximise the number of isolates for which
full-length cps sequences were available, the assembly pipeline was reoptimised in the following way.4
All Illumina-sequenced isolates were reassembled using velvet (Zerbino and Birney, 2008) with
varied k-mer length (between 50% and 90% of the short-read) and the expected coverage (between6
5 and 140). The aim was to find an assembly which spanned as much of the entire cps locus as
possible (defined by aligning the assembled and reference sequences using BLASTN with e-value8
< 10−50) in as few contigs as possible; if multiple such assemblies were produced, the one with the
least number of N’s and the highest n50 value was chosen. Due to the repetitive nature of10
insertion-sequence elements, sequences were assembled excluding dexB/aliA/aliB genes
and transposable elements flanking the serotype-specific region. The list of all genes used12
as markers for the start and end of the serotype sequence in question is given in supplementary table
S6. The resulting set of contigs was then analysed for potential misasseblies using reapr (Hunt14
et al., 2013) and had gaps filled using GapFiller (Nadalin et al., 2012). Finally, isolates with
the full cps locus were scaffolded against the corresponding reference sequence using ABACASS16
(Assefa et al., 2009) and GapFiller. Finally, the quality of each cps sequence was assessed visually
by comparing to the reference, in search of false-positive polymorphisms associated with N’s in the18
assembly. All poor quality assemblies were removed from the analysis, leaving 3651 cps sequences
as well as 162 previously PCR-sequenced isolates. The list of all isolates used in the study is given20
in supplementary tables S1 and S2.
Diversity of cps variants22
To compare the genetic similarity of different reference serotypes, we first collected a list of all pro-
teins located within the cps locus of all 96 references. Of those, 92 were annotated in the original24
publications (Bentley et al., 2006; Park et al., 2007; Nahm et al., 2011; Oliver et al., 2013). The
four remaining isolates (10X, 11E, 22F, 39X) were annotated by running blastn with ‘megablast’26
option against cps gene sequences from other 92 reference sequences and identifying closely related
alleles of cps genes. Families of genes with no close resemblance were searched using UniProt (Bate-28
man et al., 2015), otherwise considered as ‘unknown’. The only exception was the seemingly
unknown transferase in 22F; as shown by Salter et al. (2012) this gene is actually30
wcwC described in Bentley et al. (2006) but with no corresponding sequence due to
17
mistaken submission. Of 1590 genes, we focused on capsule-specific genes, namely those in-
volved in the synthesis of the repeat-unit (i.e., acetyltransferases, glycosyltransferases, flippases2
and polymerases) and excluded overrepresented genes wzg, wzh, wzd, wze, dexB, aliA, aliB, sugar
synthesis genes and transposable elements, giving altogether 742 proteins. All protein sequences4
were then classified into homology groups with a similar approach to Mavroidi et al. (2007). Specif-
ically, all-versus-all blastp was run with e-value threshold of 10−50 with hits with less than 60%6
query coverage ignored. The resulting undirected network was analysed with MCL (Enright et al.,
2002) with inflation value of 2, resulting in 254 homology groups. A sequence similarity network8
was constructed using 96 reference serotypes with nodes representing reference isolates and edges
representing similar sequences. Similarity between two isolates was defined as s = max(sA, sB),10
where si is the proportion of homology groups shared by both isolates to the number of homology
groups in isolate i. A network was built for a given similarity threshold meaning that all pairs12
above a chosen similarity threshold were connected with an edge. A conservative similarity index
of 0.58 was chosen to maximise the number of serogroups which are internally connected and to14
minimise the number of serogroups which are externally connected (see supplementary fig. S40).
This approach produced 40 clusters which were used as a basis for defining a genetic similarity16
group. Using such clustering, we identified 12 groups which had at least 40 isolates and 500 sin-
gle nucleotide polymorphisms in the alignment (as given in main text). With the exception of18
serogroup 19, these genetic similarity groups were identical when defined on the basis of significant
shared similarity with threshold of e = 0.01 based on the approach used by Lima-Mendez et al.20
(2008).
Evolution of serogroups22
Genetic serogroups were initially aligned using progressiveMauve (Darling et al., 2010). Visual
inspection of these alignments, together with the detailed analysis of the genetic content of serotypes24
in question and the identification of homologous and non-homologous regions for each pair of
reference strains by the command blastn -task megablast, led to determination of sequence26
blocks in the alignment. Each block corresponded either to a homologous gene or group of genes in
the reference, or to insertions or duplications. These blocks were aligned using mafft with -ginsi28
option (Katoh et al., 2002) and concatenated to produce the full alignment, such that the full cps
genetic diversity was used in further analyses.30
We next inferred the population genetic structure of serogroups, the Structure software with
linkage model was used (Falush et al., 2003). The runs were based on at least 600,000 iterations32
18
plus 200,000 burn-in and with multiple chains to insure convergence. The number of popula-
tions K was found as the smallest value of K which explained the observed population structure,2
and was supported by all independent runs, and by BAPS (Corander and Marttinen, 2006). In
all examined cases, the identified populations corresponded well to major serotypes or serotype4
groups (see Supplementary Material online for the results of the population structure analyses).
Between-population recombinations, defined by Structure with the minimum posterior probability6
for originating in a different population as 0.75 and reaching at least 0.95 at one site, were re-
moved. The initial phylogeny was generated using PhyML (Guindon et al., 2010) with the GTR8
model of nucleotide substitution with four substitution rate categories. Next, each population was
analysed by Gubbins (Croucher et al., 2015b) with the initial phylogeny used as a starting tree.10
Recombinations identified by Gubbins or Structure were removed. The resulting clonal alignments
were then analysed again by Structure to identify potential hierarchical population structure and12
within-population recombinations which Gubbins could not detect. In the final alignment, all re-
gions identified by Structure or Gubbins were removed from the alignment to generate the final14
phylogeny. The pattern of recombinations on this tree was predicted by both Gubbins (running
a single iteration conditional on the final phylogeny with two window sizes: 1kb and 10kb) and16
Structure (using the ace function in ape package in R to predict the most likely ancestral pattern
(Paradis et al., 2004)). The two types of recombinations were then merged into the final list of18
recombinations with overlapping blocks merged, however because Gubbins has a more elaborate
algorithm of predicting ancestral recombinations based on ancestral SNP reconstruction, Structure-20
recombinations at internal nodes which did not overlap with Gubbins-recombinations were ignored.
All recombinations ancestral to each of the K populations found were ignored due to low detection22
power of events on long tree branches.
Molecular clock24
To estimate the molecular clock of the cps locus, we focused on the three globally disseminated
PMEN lineages with recombinations removed as described above (Croucher et al., 2011, 2014b,a).26
Alignment was divided into the cps locus (defined by the starting position of the dexB and the
ending position of the aliA gene) and background (the clonal alignment with cps removed). The28
two alignments were then analysed using BEAST2 (Bouckaert et al., 2014) in a single analysis with
parameters shared between alignments. In particular, we assumed that the two alignments had30
the same substitution model (GTR with four gamma categories), the same tree prior (Coalescent
Bayesian Skyline), but different parameters of the clock model (Relaxed Clock Log Normal). We32
19
ensured that all parameters were estimated with effective sample size (ESS) above 200. The results
of the ucldMean parameter for the cps from three different lineages were then pooled together to2
which a log normal distribution was fit, yielding best fit parameter of µ = −12.98, which was used
as the underlying molecular clock rate of the cps (see below).4
To estimate the null distribution of the molecular clock rate in the background (i.e., without
cps) in each of the three lineages, we did the following. First, we randomly sampled twenty regions6
from the clonal alignment (excluding cps). Each region contained a coding sequence as predicted
by the Prodigal software (Hyatt et al., 2010) plus the intergenic region between the next coding8
sequence. (This way the overall length of the sampled regions was approximately the same length
as the cps, and the total length of all regions was equal to the length of the whole-genome alignment10
without the cps.) Second, the twenty sampled regions were concatenated, to which a strict clock
model was fitted using BEAST2 with the same substitution model as above but conditional on the12
clonal frame, and ran for 20M iterations. Third, we repeated this procedure for 1000 times, for all
three lineages, and saved the mean value of the clock rate for each lineage. Finally, the molecular14
clock of the cps was obtained in the same way but using only the cps, as defined above, instead of
the twenty concatenated regions.16
To date the clonal trees for the twelve serogroups, we analysed their clonal alignments using
BEAST2. Specifically, the same set of models was fitted as in the case of whole genomes with18
three exceptions. First, we assumed a coalescent constant population tree prior. Second, an
informative prior for the molecular (strict) clock was used with the value of µ estimated using20
whole-genomes and the standard deviation of 0.04. Third, the phylogeny was fixed as the final
clonal phylogeny obtained in the previous section, thereby estimating divergence times and the22
dates for the recombination events assigned to each node of the tree.
Selection24
Estimation ofω = dN/dS for three PMEN lineages was performed using CODEML from the PAML
4.9 package (Yang, 2007). First, we compared ω of the cps to the average omega in the genome. To26
this end, we concatenated genes as predicted by Prodigal in the cps versus everywhere else. Two
sets of genes were removed: (a) loci with alleles containing stop codons, and (b) loci with more28
than 20% of uninformative sites, where an ‘uninformative site’ was defined as the one where 80% or
more of isolates had missing data. CODEML was fit conditional on the whole-genome tree and with30
κ = 2 and α = 0. Confidence intervals were estimated using the log-likelihood ratio test. Second,
we estimated ω value for each gene, which was done by running CODEML individually on each32
20
gene, excluding those genes which were removed in the first approach. Calculation of the number of
synonymous and non-synonymous substitutions was performed by inferring the pattern of ancestral2
polymorphisms on the clonal frame using ClonalFrameML (Didelot and Wilson, 2015). To obtain
the null distribution of the ω values, we performed an analogous calculation as in the case of the4
molecular clock. Specifically, we randomly selected twenty coding regions from the background
excluding the cps locus, and estimated ω by concatenating these sequences. The procedure was6
repeated 1000 times.
Origins of recombinations8
To identify the sources of recombinations, we only focused on the more recent recombinations, i.e.
those occurring within each of the sub-populations identified for each serogroup alignment. The re-10
combination sequences were exported using the SNP ancestral pattern predicted along the branches
of the maximum likelihood phylogeny with Gubbins. Similarity between two recombinations was12
defined by the blast search with minimum e-value of 10−20 and percentage-identity of 90%. The
resulting recombinations were then blasted against the entire database of S. pneumoniae and S.14
mitis isolates listed in supplementary table S3. All taxa found downstream of the node where the
recombination was found were excluded from the hit list. As a null hypothesis we assumed that the16
source of recombination is unknown unless a hit was found. If a single serotype was identified as
the origin it was assigned a weight of one; if multiple serogroups were recorded as hits, the weight18
was one divided by the number of serogroups.
Lineage-jumping dynamics20
To estimate a lineage-jumping rate for the four major serogroups (6, 19, 23 and 14/15) we first
defined clonal complexes (CCs) and clonal complex groups (CCGs) using eBurst (Feil et al., 2004).22
To this end, we downloaded all available sequence types from pubmlst.org/spneumoniae (in July
2016) and identified a CC with 6/7 MLST-locus identity, and a CCG with 5/7 MLST-locus identity.24
Having identified a CC for each isolate, CCs were treated as discrete traits to perform a discrete trait
phylogenetic analysis (Lemey et al., 2009) by modelling switches of the genomic lineage background26
(CC or CCG) as discrete trait substitutions. As sampling of isolates was blind to the genomic
background (with the exception of PMEN isolates which were removed from this analysis), and28
as our discrete traits represent genetic, not geographic traits, no sampling bias for the discrete
trait analysis was expected (De Maio et al., 2015). We also did not expect any bias due to the30
distribution of lineages in different countries as such bias would only be expected in the most
21
extreme case of a single genomic background present in each geographic location but different
backgrounds in different locations (this was not the case due to the nature of data collections2
analysed here). Each sub-population in a given serogroup (determined by Structure/BAPS) was
considered as a separate phylogeny with shared molecular clock and the shared jump-rate between4
phylogenies within the same serogroup. For simplicity a homogeneous jumping-rate was assumed.
Estimation of recombination rates6
In order to estimate the recombination rate for each serogroup, we fitted a basic model describing
the distribution of recombination events on a tree using a Poisson process; see also Mostowy et al.8
(2014). The number of recombinations at each branch of the tree was modelled as a Poisson-
distributed random variable mi with mean λLi, where λ is the inferred recombination rate and Li10
is the branch length in years. The estimated recombination rate λ was the value which maximised
the likelihood ln∏B
i=1 Pois(mi; λLi), where B is the number of tree branches. To avoid estimate12
bias we excluded all long branches of the tree, namely branches leading to the most recent common
ancestors for each subpopulation (of the K populations estimated by Structure) together with all14
their ancestor branches. The same procedure was applied to both serogroup trees and lineage trees.
To compare recombination rate at the cps with whole-genome recombination rate, we anal-16
ysed the distribution of recombinations on lineage-derived trees, as described above. To control
for capsular switches, we excluded lineages which were not predominantly of the same serotype or18
serogroup, depending on the analysis. Genes dexB and aliA were used to identify the cps coor-
dinates and distinguish background- from cps-recombinations. The list of all lineages is given in20
supplementary table S5. The lineages used to estimate the recombination rates in the four anal-
ysed serogroups were chosen as predominantly of the same serotype (minumum 80%). Serogroup 6:22
MA-10, MA-13, MA-14 and PMEN2; serogroup 19: MaeLa-1 and PMEN14; serogroup 23: PMEN1;
serogroup 14/15: MA-3 and MaeLa-7. (The remaining MaeLa lineages were ignored due to the ab-24
sence of the full resolution cps locus in the original alignment.) For each serogroup, lineages were
used collectively to estimate the mean recombination rate by combining the information about the26
number of recombination events on each branch and the corresponding branch length in units of
years, and fitting the Poisson model described above.28
22
Acknowledgements
This work was supported by the EU Marie Sk lodowska-Curie Intra-European fellowship (project no.2
329515, R-EVOLUTION PNEUMO to R.J.M.), Junior Research Fellowship from Imperial College
London (to R.J.M.), Sir Henry Dale Fellowship (Grant Number 104169/Z/14/Z to N.J.C), Sir4
Henry Wellcome Fellowship (107376/Z/15/Z to C.C.), NIH MIDAS program (grant U01GM110721
to C.F.) and The Wellcome Trust (grant no. 09805). The authors thank Marc Lipsitch and Bill6
Hanage for interesting comments and discussions, James McInerney for help with network analyses,
Remco Bouckaert and Denise Kuhnert for help with BEAST analyses, Karin Bosch-Elberse and8
Hester Bootsma for kindly providing sampling dates for Dutch isolates, Aleksandra Krolik for help
with artwork and Statens Serum Institut for the serotyping work on three 39X isolates.10
Data Availability
All cps sequences generated and used in this study, including reference sequences, have been made12
publicly available online, and are available via the following Figshare DOIs:
https://doi.org/10.6084/m9.figshare.4681207.v1,14
https://doi.org/10.6084/m9.figshare.4681213.v1
https://doi.org/10.6084/m9.figshare.4681225.v1,16
Supplementary figures S7, S9, S11 and S13 are available in high-resolution via:
https://doi.org/10.6084/m9.figshare.4680913.v1,18
https://doi.org/10.6084/m9.figshare.4681180.v1
https://doi.org/10.6084/m9.figshare.4681198.v1,20
https://doi.org/10.6084/m9.figshare.4681201.v1
22
References
Aanensen, D. M., Mavroidi, A., Bentley, S. D., Reeves, P. R., and Spratt, B. G. 2007. Predicted24
functions and linkage specificities of the products of the Streptococcus pneumoniae capsular
biosynthetic loci. J. Bacteriol., 189(21): 7856–7876.26
Ansari, M. A. and Didelot, X. 2014. Inference of the properties of the recombination process from
whole bacterial genomes. Genetics, 196(1): 253–265.28
23
Assefa, S., Keane, T. M., Otto, T. D., Newbold, C., and Berriman, M. 2009. ABACAS: algorithm-
based automatic contiguation of assembled sequences. Bioinformatics, 25(15): 1968–1969.2
Bapteste, E., Lopez, P., Bouchard, F., Baquero, F., McInerney, J. O., and Burian, R. M. 2012.
Evolutionary analyses of non-genealogical bonds produced by introgressive descent. Proc. Natl.4
Acad. Sci. U.S.A., 109(45): 18266–18272.
Bateman, A., Martin, M. J., O’Donovan, C., Magrane, M., Apweiler, R., Alpi, E., Antunes, R.,6
Arganiska, J., Bely, B., Bingley, M., Bonilla, C., Britto, R., Bursteinas, B., Chavali, G., Cibrian-
Uhalte, E., Silva, A. D., De Giorgi, M., Dogan, T., Fazzini, F., Gane, P., Castro, L. G., Garmiri,8
P., Hatton-Ellis, E., Hieta, R., Huntley, R., Legge, D., Liu, W., Luo, J., MacDougall, A., Mutowo,
P., Nightingale, A., Orchard, S., Pichler, K., Poggioli, D., Pundir, S., Pureza, L., Qi, G., Rosanoff,10
S., Saidi, R., Sawford, T., Shypitsyna, A., Turner, E., Volynkin, V., Wardell, T., Watkins, X.,
Zellner, H., Cowley, A., Figueira, L., Li, W., McWilliam, H., Lopez, R., Xenarios, I., Bougueleret,12
L., Bridge, A., Poux, S., Redaschi, N., Aimo, L., Argoud-Puy, G., Auchincloss, A., Axelsen, K.,
Bansal, P., Baratin, D., Blatter, M. C., Boeckmann, B., Bolleman, J., Boutet, E., Breuza,14
L., Casal-Casas, C., de Castro, E., Coudert, E., Cuche, B., Doche, M., Dornevil, D., Duvaud,
S., Estreicher, A., Famiglietti, L., Feuermann, M., Gasteiger, E., Gehant, S., Gerritsen, V.,16
Gos, A., Gruaz-Gumowski, N., Hinz, U., Hulo, C., Jungo, F., Keller, G., Lara, V., Lemercier,
P., Lieberherr, D., Lombardot, T., Martin, X., Masson, P., Morgat, A., Neto, T., Nouspikel,18
N., Paesano, S., Pedruzzi, I., Pilbout, S., Pozzato, M., Pruess, M., Rivoire, C., Roechert, B.,
Schneider, M., Sigrist, C., Sonesson, K., Staehli, S., Stutz, A., Sundaram, S., Tognolli, M.,20
Verbregue, L., Veuthey, A. L., Wu, C. H., Arighi, C. N., Arminski, L., Chen, C., Chen, Y.,
Garavelli, J. S., Huang, H., Laiho, K., McGarvey, P., Natale, D. A., Suzek, B. E., Vinayaka, C.,22
Wang, Q., Wang, Y., Yeh, L. S., Yerramalla, M. S., and Zhang, J. 2015. UniProt: a hub for
protein information. Nucleic Acids Res., 43(Database issue): D204–212.24
Bentley, S. D., Aanensen, D. M., Mavroidi, A., Saunders, D., Rabbinowitsch, E., Collins, M.,
Donohoe, K., Harris, D., Murphy, L., Quail, M. A., Samuel, G., Skovsted, I. C., Kaltoft, M. S.,26
Barrell, B., Reeves, P. R., Parkhill, J., and Spratt, B. G. 2006. Genetic analysis of the capsular
biosynthetic locus from all 90 pneumococcal serotypes. PLoS Genet., 2(3): e31.28
Bouckaert, R., Heled, J., Kuhnert, D., Vaughan, T., Wu, C. H., Xie, D., Suchard, M. A., Rambaut,
A., and Drummond, A. J. 2014. BEAST 2: a software platform for Bayesian evolutionary30
analysis. PLoS Comput. Biol., 10(4): e1003537.
24
Bratcher, P. E., Park, I. H., Oliver, M. B., Hortal, M., Camilli, R., Hollingshead, S. K., Camou,
T., and Nahm, M. H. 2011. Evolution of the capsular gene locus of Streptococcus pneumoniae2
serogroup 6. Microbiology (Reading, Engl.), 157(Pt 1): 189–198.
Briles, D. E., Crain, M. J., Gray, B. M., Forman, C., and Yother, J. 1992. Strong association between4
capsular type and virulence for mice among human isolates of Streptococcus pneumoniae. Infect.
Immun., 60(1): 111–116.6
Chaguza, C., Andam, C. P., Harris, S. R., Cornick, J. E., Yang, M., Bricio-Moreno, L., Kamng’ona,
A. W., Parkhill, J., French, N., Heyderman, R. S., Kadioglu, A., Everett, D. B., Bentley, S. D.,8
and Hanage, W. P. 2016. Recombination in Streptococcus pneumoniae Lineages Increase with
Carriage Duration and Size of the Polysaccharide Capsule. MBio, 7(5).10
Chewapreecha, C., Harris, S. R., Croucher, N. J., Turner, C., Marttinen, P., Cheng, L., Pessia, A.,
Aanensen, D. M., Mather, A. E., Page, A. J., Salter, S. J., Harris, D., Nosten, F., Goldblatt, D.,12
Corander, J., Parkhill, J., Turner, P., and Bentley, S. D. 2014. Dense genomic sampling identifies
highways of pneumococcal recombination. Nat. Genet., 46(3): 305–309.14
Cobey, S. and Lipsitch, M. 2012. Niche and neutral effects of acquired immunity permit coexistence
of pneumococcal serotypes. Science, 335(6074): 1376–1380.16
Corander, J. and Marttinen, P. 2006. Bayesian identification of admixture events using multilocus
molecular markers. Mol. Ecol., 15(10): 2833–2843.18
Croucher, N. J., Harris, S. R., Fraser, C., Quail, M. A., Burton, J., van der Linden, M., McGee,
L., von Gottberg, A., Song, J. H., Ko, K. S., Pichon, B., Baker, S., Parry, C. M., Lambertsen,20
L. M., Shahinas, D., Pillai, D. R., Mitchell, T. J., Dougan, G., Tomasz, A., Klugman, K. P.,
Parkhill, J., Hanage, W. P., and Bentley, S. D. 2011. Rapid pneumococcal evolution in response22
to clinical interventions. Science, 331(6016): 430–434.
Croucher, N. J., Finkelstein, J. A., Pelton, S. I., Mitchell, P. K., Lee, G. M., Parkhill, J., Bentley,24
S. D., Hanage, W. P., and Lipsitch, M. 2013. Population genomics of post-vaccine changes in
pneumococcal epidemiology. Nat. Genet., 45(6): 656–663.26
Croucher, N. J., Chewapreecha, C., Hanage, W. P., Harris, S. R., McGee, L., van der Linden, M.,
Song, J. H., Ko, K. S., de Lencastre, H., Turner, C., Yang, F., Sa-Leao, R., Beall, B., Klugman,28
K. P., Parkhill, J., Turner, P., and Bentley, S. D. 2014a. Evidence for soft selective sweeps in the

25
evolution of pneumococcal multidrug resistance and vaccine escape. Genome Biol Evol , 6(7):
1589–1602.2
Croucher, N. J., Hanage, W. P., Harris, S. R., McGee, L., van der Linden, M., de Lencastre,
H., Sa-Leao, R., Song, J. H., Ko, K. S., Beall, B., Klugman, K. P., Parkhill, J., Tomasz, A.,4
Kristinsson, K. G., and Bentley, S. D. 2014b. Variable recombination dynamics during the
emergence, transmission and ’disarming’ of a multidrug-resistant pneumococcal clone. BMC6
Biol., 12: 49.
Croucher, N. J., Finkelstein, J. A., Pelton, S. I., Parkhill, J., Bentley, S. D., Lipsitch, M., and8
Hanage, W. P. 2015a. Population genomic datasets describing the post-vaccine evolutionary
epidemiology of Streptococcus pneumoniae. Sci Data, 2: 150058.10
Croucher, N. J., Page, A. J., Connor, T. R., Delaney, A. J., Keane, J. A., Bentley, S. D., Parkhill,
J., and Harris, S. R. 2015b. Rapid phylogenetic analysis of large samples of recombinant bacterial12
whole genome sequences using Gubbins. Nucleic Acids Res., 43(3): e15.
Croucher, N. J., Kagedan, L., Thompson, C. M., Parkhill, J., Bentley, S. D., Finkelstein, J. A.,14
Lipsitch, M., and Hanage, W. P. 2015c. Selective and genetic constraints on pneumococcal
serotype switching. PLoS Genet., 11(3): e1005095.16
Darling, A. E., Mau, B., and Perna, N. T. 2010. progressiveMauve: multiple genome alignment
with gene gain, loss and rearrangement. PLoS ONE , 5(6): e11147.18
De Maio, N., Wu, C. H., O’Reilly, K. M., and Wilson, D. 2015. New Routes to Phylogeography:
A Bayesian Structured Coalescent Approximation. PLoS Genet., 11(8): e1005421.20
Didelot, X. and Wilson, D. J. 2015. ClonalFrameML: efficient inference of recombination in whole
bacterial genomes. PLoS Comput. Biol., 11(2): e1004041.22
Dixit, C., Keller, L. E., Bradshaw, J. L., Robinson, D. A., Swiatlo, E., and McDaniel, L. S. 2016.
Nonencapsulated Streptococcus pneumoniae as a cause of chronic adenoiditis. IDCases, 4: 56–58.24
Elberse, K., Witteveen, S., van der Heide, H., van de Pol, I., Schot, C., van der Ende, A., Berbers,
G., and Schouls, L. 2011. Sequence diversity within the capsular genes of Streptococcus pneu-26
moniae serogroup 6 and 19. PLoS ONE , 6(9): e25018.
Enright, A. J., Van Dongen, S., and Ouzounis, C. A. 2002. An efficient algorithm for large-scale28
detection of protein families. Nucleic Acids Res., 30(7): 1575–1584.
26
Falush, D., Stephens, M., and Pritchard, J. K. 2003. Inference of population structure using
multilocus genotype data: linked loci and correlated allele frequencies. Genetics, 164(4): 1567–2
1587.
Feil, E. J., Smith, J. M., Enright, M. C., and Spratt, B. G. 2000. Estimating recombinational4
parameters in Streptococcus pneumoniae from multilocus sequence typing data. Genetics, 154(4):
1439–1450.6
Feil, E. J., Holmes, E. C., Bessen, D. E., Chan, M. S., Day, N. P., Enright, M. C., Goldstein,
R., Hood, D. W., Kalia, A., Moore, C. E., Zhou, J., and Spratt, B. G. 2001. Recombination8
within natural populations of pathogenic bacteria: short-term empirical estimates and long-term
phylogenetic consequences. Proc. Natl. Acad. Sci. U.S.A., 98(1): 182–187.10
Feil, E. J., Li, B. C., Aanensen, D. M., Hanage, W. P., and Spratt, B. G. 2004. eBURST: inferring
patterns of evolutionary descent among clusters of related bacterial genotypes from multilocus12
sequence typing data. J. Bacteriol., 186(5): 1518–1530.
Geno, K. A., Gilbert, G. L., Song, J. Y., Skovsted, I. C., Klugman, K. P., Jones, C., Konradsen,14
H. B., and Nahm, M. H. 2015. Pneumococcal Capsules and Their Types: Past, Present, and
Future. Clin. Microbiol. Rev., 28(3): 871–899.16
Guindon, S., Dufayard, J. F., Lefort, V., Anisimova, M., Hordijk, W., and Gascuel, O. 2010. New
algorithms and methods to estimate maximum-likelihood phylogenies: assessing the performance18
of PhyML 3.0. Syst. Biol., 59(3): 307–321.
Henrichsen, J. 1995. Six newly recognized types of Streptococcus pneumoniae. J. Clin. Microbiol.,20
33(10): 2759–2762.
Henriques-Normark, B., Blomberg, C., Dagerhamn, J., Battig, P., and Normark, S. 2008. The rise22
and fall of bacterial clones: Streptococcus pneumoniae. Nat. Rev. Microbiol., 6(11): 827–837.
Hunt, M., Kikuchi, T., Sanders, M., Newbold, C., Berriman, M., and Otto, T. D. 2013. REAPR:24
a universal tool for genome assembly evaluation. Genome Biol., 14(5): R47.
Hyams, C., Camberlein, E., Cohen, J. M., Bax, K., and Brown, J. S. 2010. The Streptococ-26
cus pneumoniae capsule inhibits complement activity and neutrophil phagocytosis by multiple
mechanisms. Infect. Immun., 78(2): 704–715.28

27
Hyatt, D., Chen, G. L., Locascio, P. F., Land, M. L., Larimer, F. W., and Hauser, L. J. 2010.
Prodigal: prokaryotic gene recognition and translation initiation site identification. BMC Bioin-2
formatics, 11: 119.
Jordan, I. K., Rogozin, I. B., Wolf, Y. I., and Koonin, E. V. 2002. Essential genes are more4
evolutionarily conserved than are nonessential genes in bacteria. Genome Res., 12(6): 962–968.
Kadioglu, A., Weiser, J. N., Paton, J. C., and Andrew, P. W. 2008. The role of Streptococcus6
pneumoniae virulence factors in host respiratory colonization and disease. Nat. Rev. Microbiol.,
6(4): 288–301.8
Katoh, K., Misawa, K., Kuma, K., and Miyata, T. 2002. MAFFT: a novel method for rapid multiple
sequence alignment based on fast Fourier transform. Nucleic Acids Res., 30(14): 3059–3066.10
Kilian, M., Poulsen, K., Blomqvist, T., Havarstein, L. S., Bek-Thomsen, M., Tettelin, H., and
Sørensen, U. B. 2008. Evolution of Streptococcus pneumoniae and its close commensal relatives.12
PLoS ONE , 3(7): e2683.
Kilian, M., Riley, D. R., Jensen, A., Bruggemann, H., and Tettelin, H. 2014. Parallel evolution14
of Streptococcus pneumoniae and Streptococcus mitis to pathogenic and mutualistic lifestyles.
MBio, 5(4): e01490–01414.16
Lemey, P., Rambaut, A., Drummond, A. J., and Suchard, M. A. 2009. Bayesian phylogeography
finds its roots. PLoS Comput. Biol., 5(9): e1000520.18
Lima-Mendez, G., Van Helden, J., Toussaint, A., and Leplae, R. 2008. Reticulate representation
of evolutionary and functional relationships between phage genomes. Mol. Biol. Evol., 25(4):20
762–777.
Lipsitch, M. 1997. Vaccination against colonizing bacteria with multiple serotypes. Proc. Natl.22
Acad. Sci. U.S.A., 94(12): 6571–6576.
Majewski, J. 2001. Sexual isolation in bacteria. FEMS Microbiol. Lett., 199(2): 161–169.24
Majewski, J., Zawadzki, P., Pickerill, P., Cohan, F. M., and Dowson, C. G. 2000. Barriers to genetic
exchange between bacterial species: Streptococcus pneumoniae transformation. J. Bacteriol.,26
182(4): 1016–1023.
28
Mavroidi, A., Aanensen, D. M., Godoy, D., Skovsted, I. C., Kaltoft, M. S., Reeves, P. R., Bentley,
S. D., and Spratt, B. G. 2007. Genetic relatedness of the Streptococcus pneumoniae capsular2
biosynthetic loci. J. Bacteriol., 189(21): 7841–7855.
Morona, J. K., Miller, D. C., Morona, R., and Paton, J. C. 2004. The effect that mutations in the4
conserved capsular polysaccharide biosynthesis genes cpsA, cpsB, and cpsD have on virulence of
Streptococcus pneumoniae. J. Infect. Dis., 189(10): 1905–1913.6
Morona, J. K., Morona, R., and Paton, J. C. 2006. Attachment of capsular polysaccharide to the
cell wall of Streptococcus pneumoniae type 2 is required for invasive disease. Proc. Natl. Acad.8
Sci. U.S.A., 103(22): 8505–8510.
Mostowy, R., Croucher, N. J., Hanage, W. P., Harris, S. R., Bentley, S., and Fraser, C. 2014.10
Heterogeneity in the frequency and characteristics of homologous recombination in pneumococcal
evolution. PLoS Genet., 10(5): e1004300.12
Mostowy, R., Croucher, N. J., Andam, C. P., Corander, J., Hanage, W. P., and Marttinen, P. 2017.
Efficient inference of recent and ancestral recombination within bacterial populations. Mol. Biol.14
Evol., in press.
Munoz, R., Mollerach, M., Lopez, R., and Garcia, E. 1997. Molecular organization of the genes16
required for the synthesis of type 1 capsular polysaccharide of Streptococcus pneumoniae: forma-
tion of binary encapsulated pneumococci and identification of cryptic dTDP-rhamnose biosyn-18
thesis genes. Mol. Microbiol., 25(1): 79–92.
Nadalin, F., Vezzi, F., and Policriti, A. 2012. GapFiller: a de novo assembly approach to fill the20
gap within paired reads. BMC Bioinformatics, 13 Suppl 14: S8.
Nahm, M. H., Oliver, M. B., Siira, L., Kaijalainen, T., Lambertsen, L. M., and Virolainen, A. 2011.22
A report of Streptococcus pneumoniae serotype 6D in Europe. J. Med. Microbiol., 60(Pt 1):
46–48.24
Oliver, M. B., van der Linden, M. P., Kuntzel, S. A., Saad, J. S., and Nahm, M. H. 2013. Discov-
ery of Streptococcus pneumoniae serotype 6 variants with glycosyltransferases synthesizing two26
differing repeating units. J. Biol. Chem., 288(36): 25976–25985.
Paradis, E., Claude, J., and Strimmer, K. 2004. APE: analyses of phylogenetics and evolution in28
R language. Bioinformatics, 20: 289–290.
29
Park, I. H., Park, S., Hollingshead, S. K., and Nahm, M. H. 2007. Genetic basis for the new
pneumococcal serotype, 6C. Infect. Immun., 75(9): 4482–4489.2
Park, I. H., Geno, K. A., Sherwood, L. K., Nahm, M. H., and Beall, B. 2014. Population-based
analysis of invasive nontypeable pneumococci reveals that most have defective capsule synthesis4
genes. PLoS ONE , 9(5): e97825.
Rambaut, A., Lam, T. T., Max Carvalho, L., and Pybus, O. G. 2016. Exploring the temporal6
structure of heterochronous sequences using TempEst (formerly Path-O-Gen). Virus Evol , 2(1):
vew007.8
Salter, S. J., Hinds, J., Gould, K. A., Lambertsen, L., Hanage, W. P., Antonio, M., Turner,
P., Hermans, P. W., Bootsma, H. J., O’Brien, K. L., and Bentley, S. D. 2012. Variation at the10
capsule locus, cps, of mistyped and non-typable Streptococcus pneumoniae isolates. Microbiology
(Reading, Engl.), 158(Pt 6): 1560–1569.12
Schaffner, T. O., Hinds, J., Gould, K. A., Wuthrich, D., Bruggmann, R., Kuffer, M., Muhlemann,
K., Hilty, M., and Hathaway, L. J. 2014. A point mutation in cpsE renders Streptococcus pneu-14
moniae nonencapsulated and enhances its growth, adherence and competence. BMC Microbiol.,
14: 210.16
Sørensen, U. B., Yao, K., Yang, Y., Tettelin, H., and Kilian, M. 2016. Capsular Polysaccharide
Expression in Commensal Streptococcus Species: Genetic and Antigenic Similarities to Strepto-18
coccus pneumoniae. MBio, 7(6).
Trzcinski, K., Li, Y., Weinberger, D. M., Thompson, C. M., Cordy, D., Bessolo, A., Malley, R., and20
Lipsitch, M. 2015. Effect of Serotype on Pneumococcal Competition in a Mouse Colonization
Model. MBio, 6(5): e00902–00915.22
Turner, P., Turner, C., Jankhot, A., Helen, N., Lee, S. J., Day, N. P., White, N. J., Nosten, F.,
and Goldblatt, D. 2012. A longitudinal study of Streptococcus pneumoniae carriage in a cohort24
of infants and their mothers on the Thailand-Myanmar border. PLoS ONE , 7(5): e38271.
van Tonder, A. L., Bray, J. E., Quirk, S. J., Haraldsson, G., Jolley, K. A., Maiden, M. C., Hoffmann,26
S., Bentley, S. D., Haraldsson, A., Erlendsdottir, H., Kristinsson, K. G., and Brueggemann, A. B.
2016. Putatively novel serotypes and the potential for reduced vaccine effectiveness: capsular28
locus diversity revealed among 5,405 pneumococcal genomes. Microbial Genomics. Accepted for
publication.30
30
Varvio, S. L., Auranen, K., Arjas, E., and Makela, P. H. 2009. Evolution of the capsular regulatory
genes in Streptococcus pneumoniae. J. Infect. Dis., 200(7): 1144–1151.2
Vos, M. and Didelot, X. 2009. A comparison of homologous recombination rates in bacteria and
archaea. ISME J , 3(2): 199–208.4
Weinberger, D. M., Trzcinski, K., Lu, Y. J., Bogaert, D., Brandes, A., Galagan, J., Anderson,
P. W., Malley, R., and Lipsitch, M. 2009. Pneumococcal capsular polysaccharide structure6
predicts serotype prevalence. PLoS Pathog., 5(6): e1000476.
WHO 2012. Estimated Hib and Pneumococcal Deaths for Children Under 5 Years of Age, 2008.8
Technical report, World Health Organization, Immunization, Vaccines and Biologicals.
Yang, Z. 2007. PAML 4: phylogenetic analysis by maximum likelihood. Mol. Biol. Evol., 24(8):10
1586–1591.
Yother, J. 2011. Capsules of Streptococcus pneumoniae and other bacteria: paradigms for polysac-12
charide biosynthesis and regulation. Annu. Rev. Microbiol., 65: 563–581.
Zerbino, D. R. and Birney, E. 2008. Velvet: algorithms for de novo short read assembly using de14
Bruijn graphs. Genome Res., 18(5): 821–829.
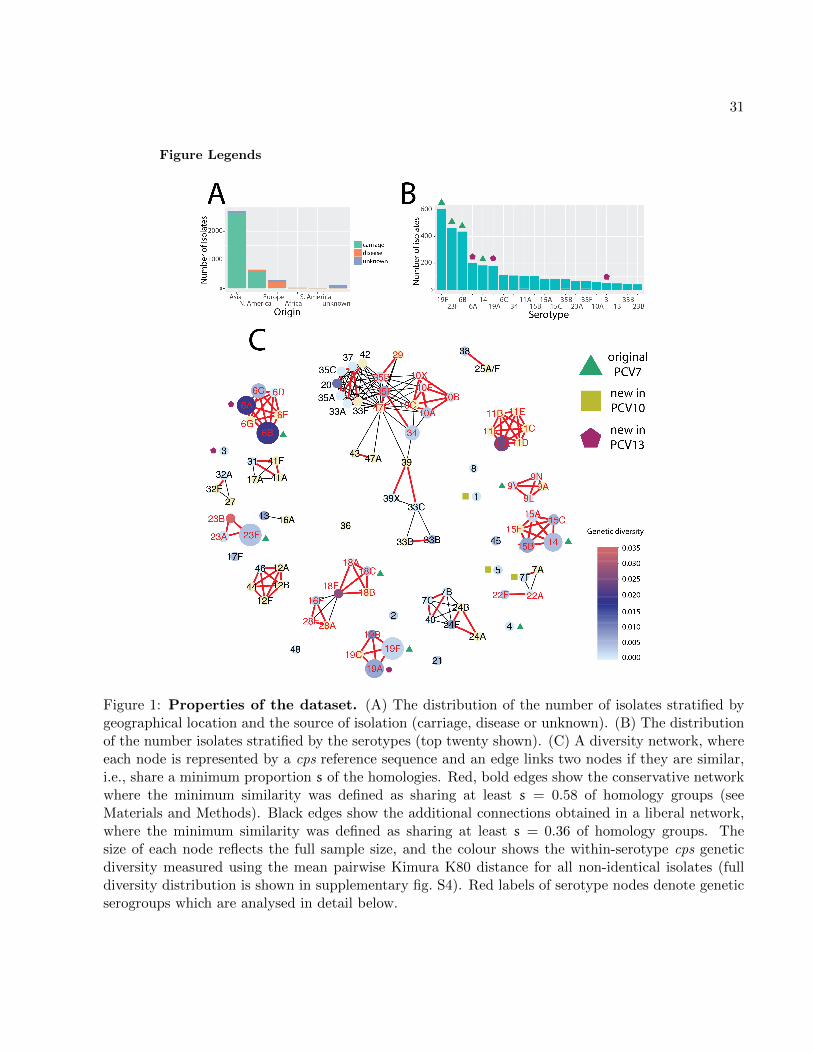
31
Figure Legends
Figure 1: Properties of the dataset. (A) The distribution of the number of isolates stratified bygeographical location and the source of isolation (carriage, disease or unknown). (B) The distributionof the number isolates stratified by the serotypes (top twenty shown). (C) A diversity network, whereeach node is represented by a cps reference sequence and an edge links two nodes if they are similar,i.e., share a minimum proportion s of the homologies. Red, bold edges show the conservative networkwhere the minimum similarity was defined as sharing at least s = 0.58 of homology groups (seeMaterials and Methods). Black edges show the additional connections obtained in a liberal network,where the minimum similarity was defined as sharing at least s = 0.36 of homology groups. Thesize of each node reflects the full sample size, and the colour shows the within-serotype cps geneticdiversity measured using the mean pairwise Kimura K80 distance for all non-identical isolates (fulldiversity distribution is shown in supplementary fig. S4). Red labels of serotype nodes denote geneticserogroups which are analysed in detail below.
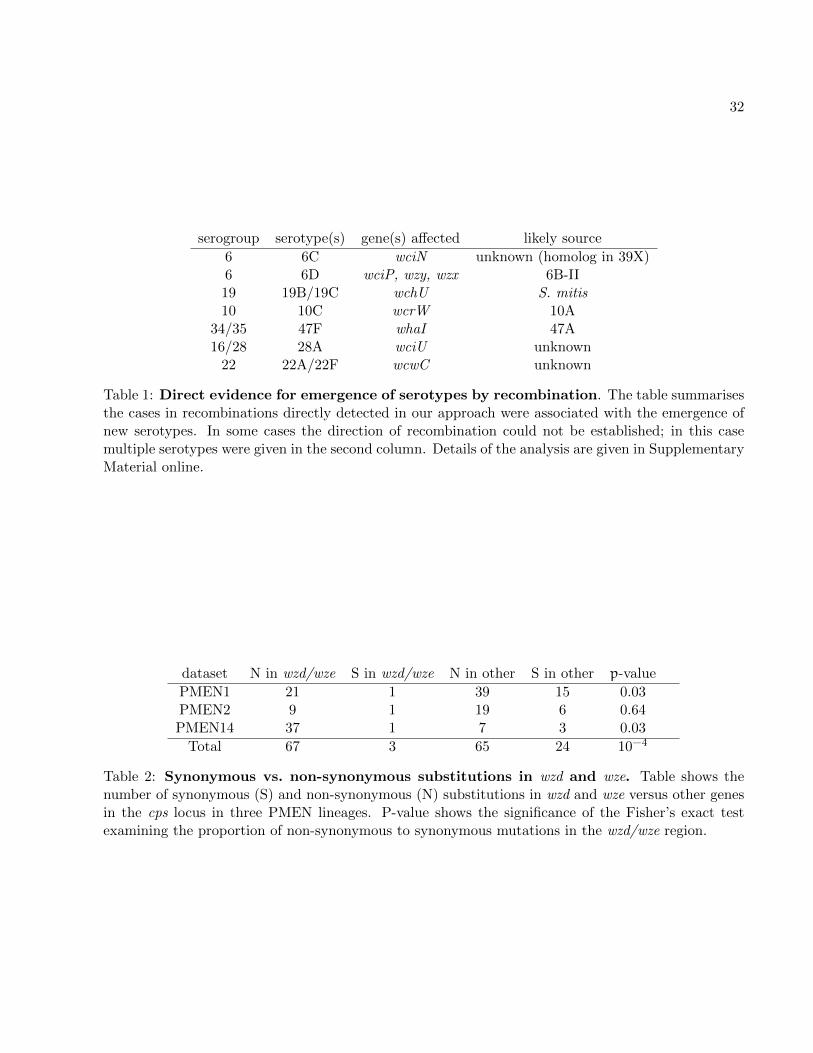
32
serogroup serotype(s) gene(s) affected likely source
6 6C wciN unknown (homolog in 39X)6 6D wciP, wzy, wzx 6B-II19 19B/19C wchU S. mitis10 10C wcrW 10A
34/35 47F whaI 47A16/28 28A wciU unknown
22 22A/22F wcwC unknown
Table 1: Direct evidence for emergence of serotypes by recombination. The table summarisesthe cases in recombinations directly detected in our approach were associated with the emergence ofnew serotypes. In some cases the direction of recombination could not be established; in this casemultiple serotypes were given in the second column. Details of the analysis are given in SupplementaryMaterial online.
dataset N in wzd/wze S in wzd/wze N in other S in other p-value
PMEN1 21 1 39 15 0.03PMEN2 9 1 19 6 0.64PMEN14 37 1 7 3 0.03
Total 67 3 65 24 10−4
Table 2: Synonymous vs. non-synonymous substitutions in wzd and wze. Table shows thenumber of synonymous (S) and non-synonymous (N) substitutions in wzd and wze versus other genesin the cps locus in three PMEN lineages. P-value shows the significance of the Fisher’s exact testexamining the proportion of non-synonymous to synonymous mutations in the wzd/wze region.
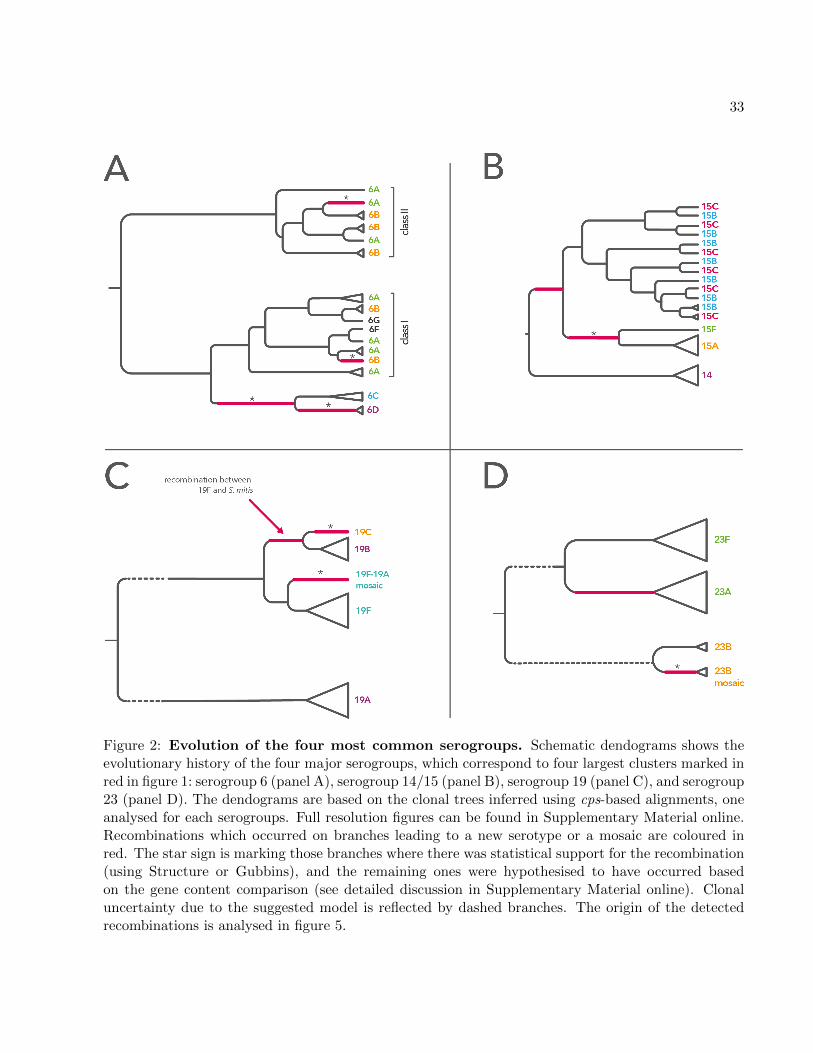
33
Figure 2: Evolution of the four most common serogroups. Schematic dendograms shows theevolutionary history of the four major serogroups, which correspond to four largest clusters marked inred in figure 1: serogroup 6 (panel A), serogroup 14/15 (panel B), serogroup 19 (panel C), and serogroup23 (panel D). The dendograms are based on the clonal trees inferred using cps-based alignments, oneanalysed for each serogroups. Full resolution figures can be found in Supplementary Material online.Recombinations which occurred on branches leading to a new serotype or a mosaic are coloured inred. The star sign is marking those branches where there was statistical support for the recombination(using Structure or Gubbins), and the remaining ones were hypothesised to have occurred basedon the gene content comparison (see detailed discussion in Supplementary Material online). Clonaluncertainty due to the suggested model is reflected by dashed branches. The origin of the detectedrecombinations is analysed in figure 5.
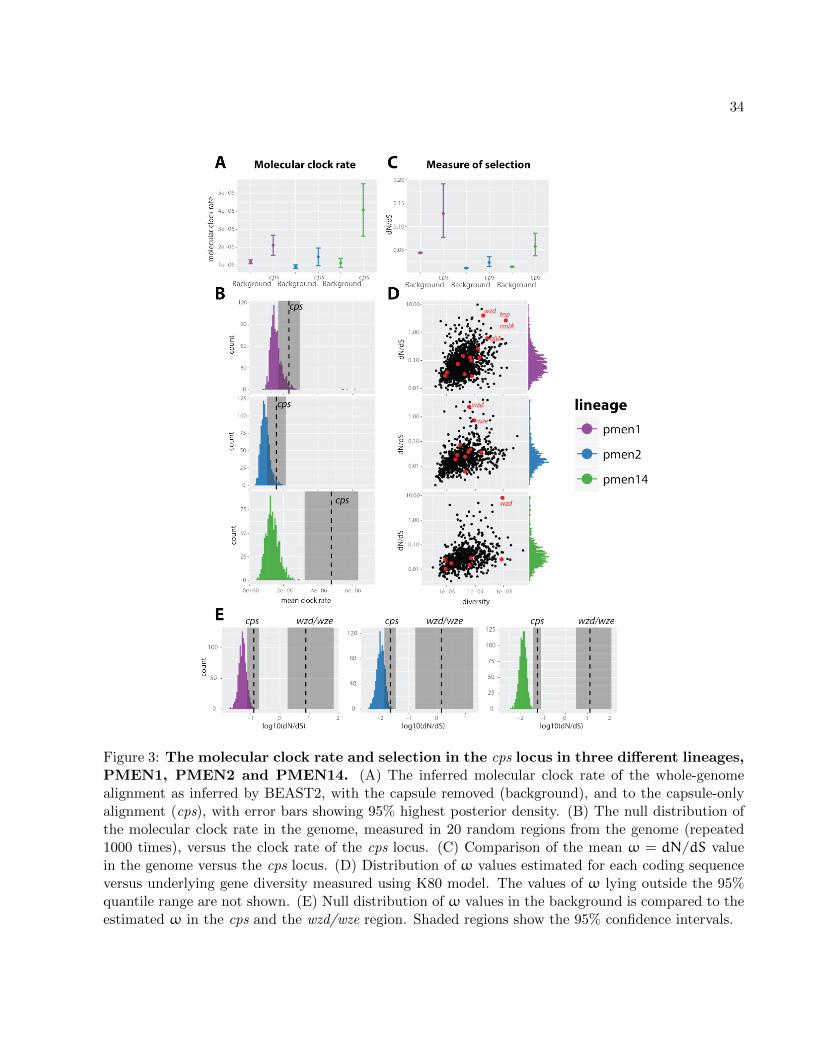
34
Figure 3: The molecular clock rate and selection in the cps locus in three different lineages,PMEN1, PMEN2 and PMEN14. (A) The inferred molecular clock rate of the whole-genomealignment as inferred by BEAST2, with the capsule removed (background), and to the capsule-onlyalignment (cps), with error bars showing 95% highest posterior density. (B) The null distribution ofthe molecular clock rate in the genome, measured in 20 random regions from the genome (repeated1000 times), versus the clock rate of the cps locus. (C) Comparison of the mean ω = dN/dS valuein the genome versus the cps locus. (D) Distribution of ω values estimated for each coding sequenceversus underlying gene diversity measured using K80 model. The values of ω lying outside the 95%quantile range are not shown. (E) Null distribution of ω values in the background is compared to theestimated ω in the cps and the wzd/wze region. Shaded regions show the 95% confidence intervals.
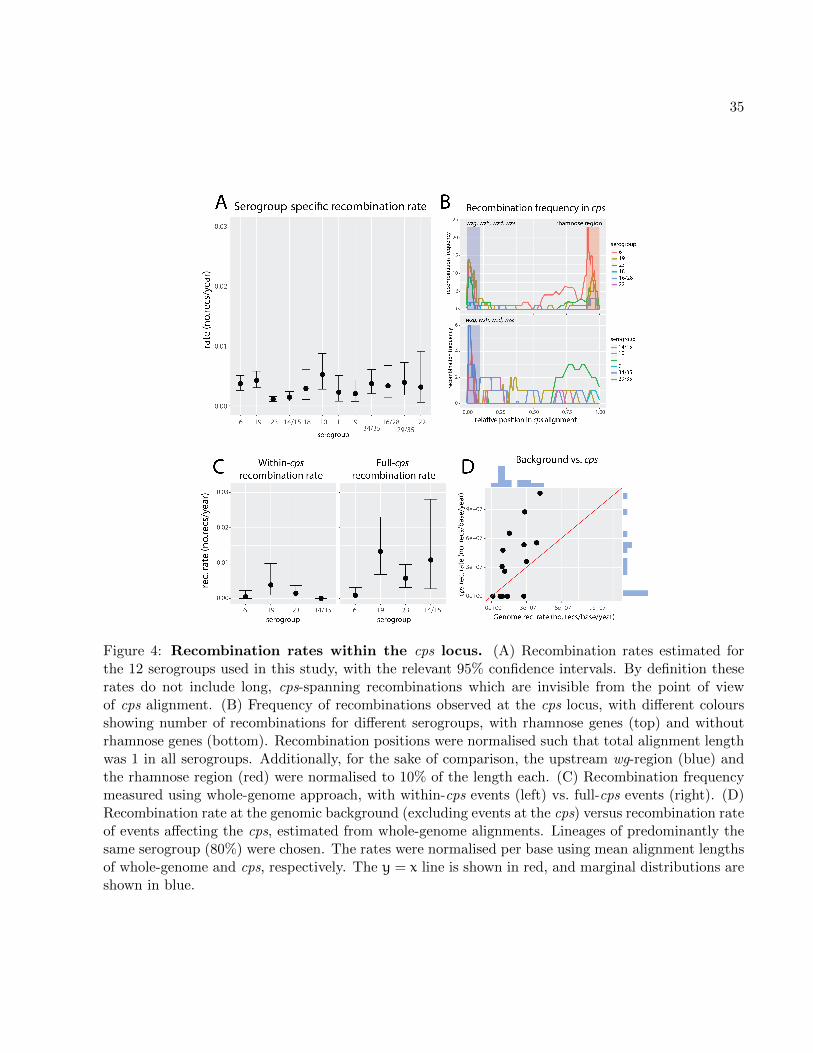
35
Figure 4: Recombination rates within the cps locus. (A) Recombination rates estimated forthe 12 serogroups used in this study, with the relevant 95% confidence intervals. By definition theserates do not include long, cps-spanning recombinations which are invisible from the point of viewof cps alignment. (B) Frequency of recombinations observed at the cps locus, with different coloursshowing number of recombinations for different serogroups, with rhamnose genes (top) and withoutrhamnose genes (bottom). Recombination positions were normalised such that total alignment lengthwas 1 in all serogroups. Additionally, for the sake of comparison, the upstream wg-region (blue) andthe rhamnose region (red) were normalised to 10% of the length each. (C) Recombination frequencymeasured using whole-genome approach, with within-cps events (left) vs. full-cps events (right). (D)Recombination rate at the genomic background (excluding events at the cps) versus recombination rateof events affecting the cps, estimated from whole-genome alignments. Lineages of predominantly thesame serogroup (80%) were chosen. The rates were normalised per base using mean alignment lengthsof whole-genome and cps, respectively. The y = x line is shown in red, and marginal distributions areshown in blue.
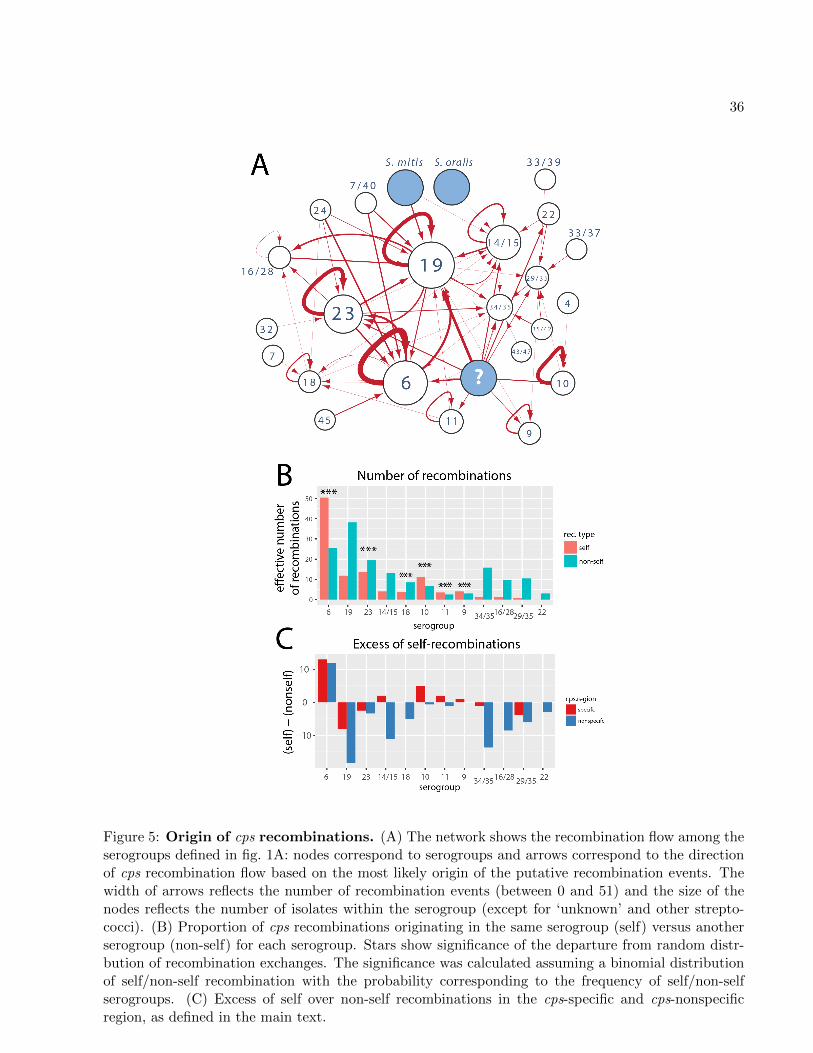
36
Figure 5: Origin of cps recombinations. (A) The network shows the recombination flow among theserogroups defined in fig. 1A: nodes correspond to serogroups and arrows correspond to the directionof cps recombination flow based on the most likely origin of the putative recombination events. Thewidth of arrows reflects the number of recombination events (between 0 and 51) and the size of thenodes reflects the number of isolates within the serogroup (except for ‘unknown’ and other strepto-cocci). (B) Proportion of cps recombinations originating in the same serogroup (self) versus anotherserogroup (non-self) for each serogroup. Stars show significance of the departure from random distr-bution of recombination exchanges. The significance was calculated assuming a binomial distributionof self/non-self recombination with the probability corresponding to the frequency of self/non-selfserogroups. (C) Excess of self over non-self recombinations in the cps-specific and cps-nonspecificregion, as defined in the main text.
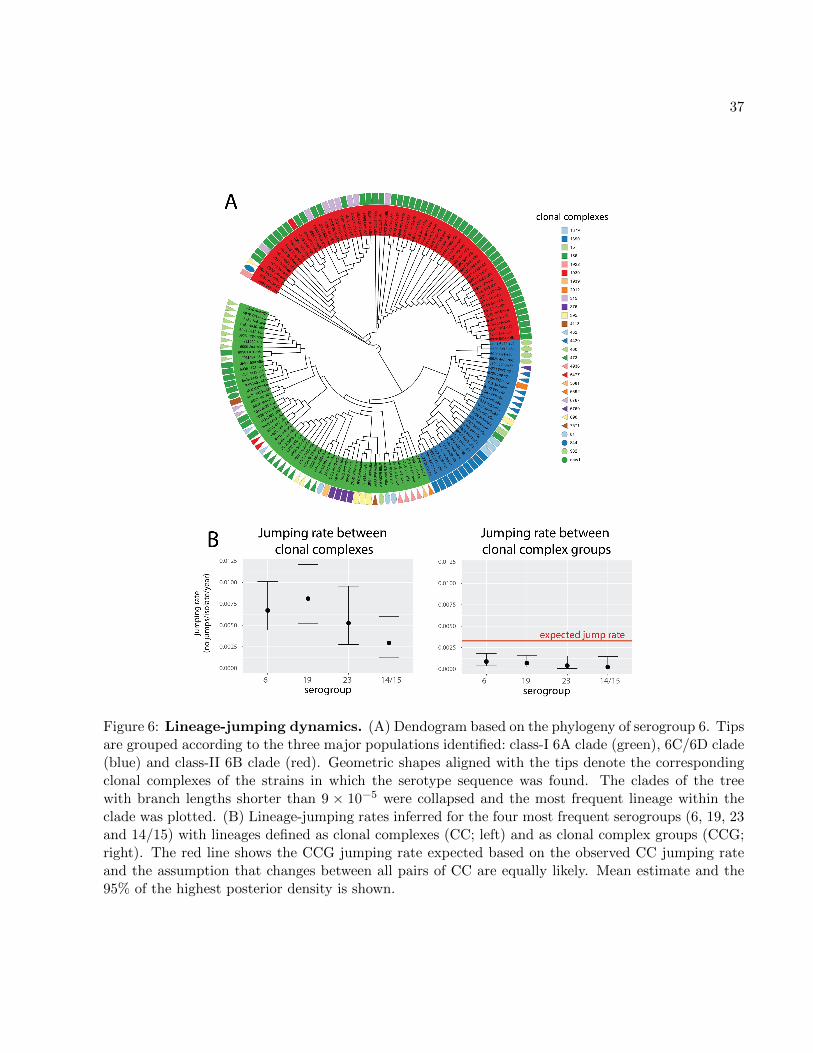
37
Figure 6: Lineage-jumping dynamics. (A) Dendogram based on the phylogeny of serogroup 6. Tipsare grouped according to the three major populations identified: class-I 6A clade (green), 6C/6D clade(blue) and class-II 6B clade (red). Geometric shapes aligned with the tips denote the correspondingclonal complexes of the strains in which the serotype sequence was found. The clades of the treewith branch lengths shorter than 9 × 10⁻⁵ were collapsed and the most frequent lineage within theclade was plotted. (B) Lineage-jumping rates inferred for the four most frequent serogroups (6, 19, 23and 14/15) with lineages defined as clonal complexes (CC; left) and as clonal complex groups (CCG;right). The red line shows the CCG jumping rate expected based on the observed CC jumping rateand the assumption that changes between all pairs of CC are equally likely. Mean estimate and the95% of the highest posterior density is shown.