Clinical and biologic implications of recurrent genomic aberrations in myeloma
38
doi:10.1182/blood-2002-10-3017 Prepublished online February 6, 2003; Greipp W Dewald, Brian Van Ness, Scott A Van Wier, Kimberly J Henderson, Richard J Bailey and Philip R Rafael Fonseca, Emily Blood, Montserrat Rue, David Harrington, Martin M Oken, Robert A Kyle, Gordon ABERRATIONS IN MYELOMA CLINICAL AND BIOLOGIC IMPLICATIONS OF RECURRENT GENOMIC (795 articles) Oncogenes and Tumor Suppressors (4217 articles) Neoplasia Articles on similar topics can be found in the following Blood collections http://bloodjournal.hematologylibrary.org/site/misc/rights.xhtml#repub_requests Information about reproducing this article in parts or in its entirety may be found online at: http://bloodjournal.hematologylibrary.org/site/misc/rights.xhtml#reprints Information about ordering reprints may be found online at: http://bloodjournal.hematologylibrary.org/site/subscriptions/index.xhtml Information about subscriptions and ASH membership may be found online at: digital object identifier (DOIs) and date of initial publication. the indexed by PubMed from initial publication. Citations to Advance online articles must include final publication). Advance online articles are citable and establish publication priority; they are appeared in the paper journal (edited, typeset versions may be posted when available prior to Advance online articles have been peer reviewed and accepted for publication but have not yet Copyright 2011 by The American Society of Hematology; all rights reserved. 20036. the American Society of Hematology, 2021 L St, NW, Suite 900, Washington DC Blood (print ISSN 0006-4971, online ISSN 1528-0020), is published weekly by For personal use only. by guest on June 7, 2013. bloodjournal.hematologylibrary.org From
-
Upload
independent -
Category
Documents
-
view
6 -
download
0
Transcript of Clinical and biologic implications of recurrent genomic aberrations in myeloma

doi:10.1182/blood-2002-10-3017Prepublished online February 6, 2003;
GreippW Dewald, Brian Van Ness, Scott A Van Wier, Kimberly J Henderson, Richard J Bailey and Philip R Rafael Fonseca, Emily Blood, Montserrat Rue, David Harrington, Martin M Oken, Robert A Kyle, Gordon ABERRATIONS IN MYELOMACLINICAL AND BIOLOGIC IMPLICATIONS OF RECURRENT GENOMIC
(795 articles)Oncogenes and Tumor Suppressors � (4217 articles)Neoplasia �
Articles on similar topics can be found in the following Blood collections
http://bloodjournal.hematologylibrary.org/site/misc/rights.xhtml#repub_requestsInformation about reproducing this article in parts or in its entirety may be found online at:
http://bloodjournal.hematologylibrary.org/site/misc/rights.xhtml#reprintsInformation about ordering reprints may be found online at:
http://bloodjournal.hematologylibrary.org/site/subscriptions/index.xhtmlInformation about subscriptions and ASH membership may be found online at:
digital object identifier (DOIs) and date of initial publication. theindexed by PubMed from initial publication. Citations to Advance online articles must include
final publication). Advance online articles are citable and establish publication priority; they areappeared in the paper journal (edited, typeset versions may be posted when available prior to Advance online articles have been peer reviewed and accepted for publication but have not yet
Copyright 2011 by The American Society of Hematology; all rights reserved.20036.the American Society of Hematology, 2021 L St, NW, Suite 900, Washington DC Blood (print ISSN 0006-4971, online ISSN 1528-0020), is published weekly by
For personal use only. by guest on June 7, 2013. bloodjournal.hematologylibrary.orgFrom

CLINICAL AND BIOLOGIC IMPLICATIONS OF RECURRENT GENOMIC ABERRATIONS IN MYELOMA
Rafael Fonseca MD 1
Emily Blood MS 2
Montserrat Rue PhD 2
David Harrington PhD 2
Martin M Oken MD 3
Robert A Kyle MD 1
Gordon W. Dewald PhD 1
Brian Van Ness Ph.D. 4
Scott A Van Wier 1
Kimberly J Henderson 1
Richard J. Bailey 1
Philip R. Greipp MD 1
on behalf of the Eastern Cooperative Oncology Group
Mayo Clinic Division of Hematology, Department of Laboratory Medicine and Pathology 1; Eastern Cooperative Oncology Group Statistical Center, Dana Farber Cancer Institute, Boston MA 2; Virginia Piper Cancer Institute, Minneapolis MN 3; University of Minnesota, Minneapolis MN 4
Address reprint requests to Rafael Fonseca MDDivision of Hematology and Internal MedicineStabile 6-22, Rochester, Minnesota 55905Phone (507)-266-0523, Fax (507)[email protected]
Running tittle (35 characters) Molecular classification of myeloma
RF is a Lilly Clinical Investigator of the Damon Runyon - Cancer Research Fund, and a Leukemia and Lymphoma Society Translational Research Awardee. This work was supported in part by Public Health Service grant R01 CA83724-01 (RF) and P01 CA62242 (RAK, PRG) from the National Cancer Institute. PRG is supported by the ECOG grant CA21115-25C from the National Cancer Institute.
Keywords: multiple myeloma; prognosis; translocations (genetics); chromosome deletion; paraproteinemias; in situhybridization.
Manuscript words count 3540 Abstract words count 244
Copyright (c) 2003 American Society of Hematology
Blood First Edition Paper, prepublished online February 6, 2003; DOI 10.1182/blood-2002-10-3017 For personal use only. by guest on June 7, 2013. bloodjournal.hematologylibrary.orgFrom

Genomic aberrations in myeloma Fonseca et al.
Versions 02/04/03; 3:44 PM Page # 2
Abstract (Word count 227)
Non-random recurrent chromosomal abnormalities are ubiquitous in
multiple myeloma (MM) and include among others translocations of the
immunoglobulin (Ig) heavy chain locus (IgH). IgH translocations in MM result
in the upregulation of oncogenes, and include more commonly
t(11;14)(q13;q32), t(4;14)(p16;q32), and t(14;16)(q32;q23). Based on the
recurrent nature of these translocations and their finding since the early stages of
the plasma cell (PC) disorders we hypothesized that they would confer biologic
and clinical variability. In addition, deletions of 13q14 and 17p13 have also been
associated with a shortened survival. We used cytoplasmic-Ig enhanced
interphase fluorescent in-situ hybridization to detect deletions (13q14 and
17p13.1), and translocations involving IgH in 351 patients treated with
conventional chemotherapy entered into the Eastern Cooperative Oncology
Group clinical trial E9486/9487. Translocations were frequently unbalanced
with loss of one of the derivative chromosomes. The presence of
t(4;14)(p16;q32) (n=42; 26 versus 45 months, P<0.001), t(14;16)(q32;q23)
(n=15; 16 versus 41 months, P=0.003), -17p13 (n=37; 23 versus 44 months,
P=0.005), and -13q14 (n=176; 35 versus 51 months, P=0.028) were associated
with shorter survival. A stratification of patients into three distinct categories
allowed for prognostication; poor prognosis group (t(4;14)(p16;q32),
t(14;16)(q32;q23), and -17p13), intermediate prognosis (−13q14), and good
prognosis group (all others), with median survivals of 24.7, 42.3, and 50.5
months respectively (P<0.001). This molecular cytogenetic classification
identifies patients into poor, intermediate and good risk categories. More
importantly it provides further compelling evidence that MM is composed of
For personal use only. by guest on June 7, 2013. bloodjournal.hematologylibrary.orgFrom

Genomic aberrations in myeloma Fonseca et al.
Versions 02/04/03; 3:44 PM Page # 3
subgroups of patients categorized according to their underlying genomic
aberrations.
Corresponding author: [email protected]
For personal use only. by guest on June 7, 2013. bloodjournal.hematologylibrary.orgFrom

Genomic aberrations in myeloma Fonseca et al.
Versions 02/04/03; 3:44 PM Page # 4
Introduction
Genetic and cytogenetic abnormalities define subgroups of
hematologic neoplasms, and accordingly have been associated with unique
biologic, clinical and prognostic features1. Recent studies with interphase
fluorescent in-situ hybridization (FISH) indicate that all MM cells harbor
chromosome abnormalities2,3. Interphase FISH detected chromosomal
abnormalities studies have also been associated with dissimilar outcomes in
some reports4-9.
We and others have proposed that specific cytogenetic abnormalities can
identify groups of MM patients with unique clinical and biologic features9-12.
Abnormalities of chromosome 13 (∆13), monosomy representing 85% of
them, have an adverse prognosis in MM, when detected by metaphase analysis
and interphase FISH4-6,8,13,14. Likewise deletions of 17p13.1, the genomic locus
of the p53 tumor suppressor gene, have been associated with an adverse patient
outcome15. Translocations involving IgH (14q32) are seen in 50-60% of MM
patients, and involve an array of non-random recurrent chromosomal partners,
but their prognostic significance has not been tested 16,17. The three most
common IgH translocations in MM are t(4;14)(p16.3;q32); t(11;14)(q13;q32),
and t(14;16)(q32;q23)10,11. In this paper we evaluate and integrate the clinical
and biologic relevance of the most common cytogenetic abnormalities. To do
For personal use only. by guest on June 7, 2013. bloodjournal.hematologylibrary.orgFrom

Genomic aberrations in myeloma Fonseca et al.
Versions 02/04/03; 3:44 PM Page # 5
so we used interphase FISH in a large cohort of MM patients who have had
long duration of follow-up.
Patients and Methods
Patients characteristics
Patients enrolled in the Eastern Cooperative Oncology Group
(ECOG) E9486 and its associated correlative laboratory clinical trial E9487 (n
= 561) had newly diagnosed MM and have been described in detail
elsewhere18. They were randomized to receive treatment with conventional
chemotherapy variations18. The median overall survival for the whole group
was 40.5 months. Patients have extensive follow-up information with the
minimum follow-up of survivors being 96 months (range 96-138 months),
resulting in negligible censoring. A total of 351 patients were included in this
study for our analysis (Table 1) as previously described by us19, and appeared
to be no different from the larger cohort of patients when all relevant biologic
and prognostic factors are considered (data not shown). Pertinent clinical and
prognostic features are available for the majority of the patients including
among others the PC labeling index (PCLI), β2-microglobulin, C-reactive
protein, and serum level of soluble IL-6 receptor (sIL-6R). These patients did
For personal use only. by guest on June 7, 2013. bloodjournal.hematologylibrary.orgFrom
Genomic aberrations in myeloma Fonseca et al.
Versions 02/04/03; 3:44 PM Page # 6
not have conventional karyotype analysis requested at the time of study entry
and it is thus not available for comparison.
Bone marrow samples
IRB approval was obtained and bone marrow research samples were
obtained after obtaining informed consent, and cytospin slides were stored for
future use (at -70°C). Aspirate samples were enriched for mononuclear cells
using the Ficol method. To improve on the specificity of the scoring process
we combined interphase FISH with immune-fluorescent detection of the
cytoplasmic-immunoglobulin light-chain20 (Fig. 1).
Probes
We used previously reported sets of probes to detect ∆13,
t(11;14)(q31;q32), and t(4;14)(p16.3;q32)19,21,22. These same cohort of patients
have been separately reported regarding the t(11;14)(q13;q32) and ∆137,8. To
detect t(14;16)(q32;q23) we used the same 14q32 chromosome probes
previously described by us21, in combination with two BAC clones (356D21
and 484H2, Research Genetics Huntsville, AL) that localize to 16q23, and
BAC clones 10205 and 10206 described by Chesi et al23. To test for 17p13.1,
we used an LSI p53 probe from Vysis, Inc. We used standard hybridization,
validation and scoring procedures as described previously by us19,21. We
For personal use only. by guest on June 7, 2013. bloodjournal.hematologylibrary.orgFrom

Genomic aberrations in myeloma Fonseca et al.
Versions 02/04/03; 3:44 PM Page # 7
scored 100 cells for each one of all abnormalities and recorded the percentage
of cells with abnormal patterns (with special attention to the number of fusions
detected for the translocations).
Statistical analysis
Descriptive and Survival Analysis
To test for association between abnormalities, or between abnormalities
and other patient categorical treatment characteristics or response to treatment,
Fisher’s exact test was used 24. To test for difference in PCLI and β2-
microglobulin between patients with and without an abnormality, a Wilcoxon
rank sum test was used25. The distribution for overall and progression-free
survival were estimated using the method of Kaplan and Meier26. The log-rank
test was used to test for differences in survival between groups27. We decided
to score 100 cells per patient to evaluate positivity end evidence of clonal
heterogeneity.
Multiple Regression Model
A Bayesian analysis was used to evaluate the contribution of genetic
abnormalities to survival28. This analysis allowed us to include all the studied
patients in the model, even the patients with missing data. The following
clinical prognostic factors (cut-off points), dichotomized according to
previously reported studies were included in the model: PCLI (<1% versus
For personal use only. by guest on June 7, 2013. bloodjournal.hematologylibrary.orgFrom
Genomic aberrations in myeloma Fonseca et al.
Versions 02/04/03; 3:44 PM Page # 8
>1%), bone marrow PC percentage (<30% versus >30%), serum creatinine (<2
versus >2mg/dL), albumin (< 3 versus >3g/dL), hemoglobin (< 10 versus
>10g/dL), β2-microglobulin (<2.7 versus >2.7mg/dL), soluble IL-6 receptor
(<270 versus >270ng/mL), C-reactive protein (<2 versus >2mg/dL), serum
monoclonal protein (<1 versus >1g/dL), and stage (I-II versus III).
A Weibull distribution was used to model time to death29. The regression
coefficients and the shape parameter, r , were given ‘non-informative’ Normal
and Gamma priors, respectively. Prior distributions for the covariates were
assumed to be Binomial (p, 1) with p distributed as Uniform (0,1). The BUGS
program (Bayesian inference using the Gibbs sampling algorithm)28 was used
to estimate the coefficients and obtain 95% credible confidence intervals. We
performed an initial 500 burn-in of iterations followed by an additional 10,000
iterations. Parameter estimates are the mean and standard deviation based on
the Gibbs samples; credible intervals are computed as the lower and upper
2/α percentiles from the last 10,000 iterations. The five genetic
abnormalities, as well as, the clinical prognostic factors that appeared to be
statistically significant (the 95% credible interval did not contain the null
value) were included in the final model.
The appropriateness of the Weibull distribution, the adequacy of the
fitted multivariate model time and the validity of the Bayesian model
For personal use only. by guest on June 7, 2013. bloodjournal.hematologylibrary.orgFrom

Genomic aberrations in myeloma Fonseca et al.
Versions 02/04/03; 3:44 PM Page # 9
(“missing at random” assumption) were checked. The results obtained using
the Bayesian approach were compared with the results obtained using the Cox
regression model in the subset of 275 patients that had complete data.
Hierarchical Groups
Three hierarchical groups, in which one patient was allocated to one
group only, were created based on hazard ratios from the results of univariate
and multivariate analyses. These groups were based on whether or not patients
had genetic abnormalities associated with poor, intermediate, or good
prognosis.
Results
Prevalence of the abnormalities
The prevalence of chromosomal abnormalities among the 351 patients
tested are as follows; t(4;14)(p16;q32) (42/332, 12.7%), t(14;16)(q32;q23)
(15/323, 4.6%), t(11;14)(q13;q32) (53/336, 15.8%), deletions 17p13.1 (37/345,
10.7%), ∆13 (176/325, 54.2%). The prevalence of the abnormalities was not
significantly different according to the stage of the disease or age, except for
∆13 which appeared to be more common among stage III patients (P =0.014).
A strong association was noted between ∆13 and the t(4;14)(p16.3;q32) as we
have previously reported (38/42 patients)(P < 0.001)22 , but this association
For personal use only. by guest on June 7, 2013. bloodjournal.hematologylibrary.orgFrom
Genomic aberrations in myeloma Fonseca et al.
Versions 02/04/03; 3:44 PM Page # 10
was not present in patients with t(14;16)(q32;q23) (8/13 patients) or
t(11;14)(q13;q32) (24/51 patients). A significant positive correlation between
deletion 17p13.1 and t(14;16)(q32;q23) was observed (5/10 patients 33%) (P =
0.018), and was suggested for t(4;14)(p16;q32) (8/42, 20%). In contrast
17p13.1 deletions had a lower incidence in patients with t(11;14)(q13;q32)(P =
0.027).
Translocation patterns and relations
In this cohort of patients all translocations were mutually exclusive; that
is there were no patient with two coexistent translocations. However, many
patients had combinations of a translocation and deletion(s) of 17p13.1 and/or
∆13. The median percent of cells with an abnormality was greater than 80%
for all abnormalities. IgH translocations were usually seen in greater than 95%
of cells. Deletions 17p13.1 were seen in less than 50% of cells in 11 of 37
cases (30%). Using the specific sets of probes we found that of 348 evaluable
patients, 139 (40%) had one chromosomal abnormalities detected, 77 (22%)
had two, and 10 (3%) had three abnormalities. Using these probes a total of
122 patients had no abnormalities detected.
For personal use only. by guest on June 7, 2013. bloodjournal.hematologylibrary.orgFrom
Genomic aberrations in myeloma Fonseca et al.
Versions 02/04/03; 3:44 PM Page # 11
Prognostic features including the PCLI and ββββ2-microglobulin
Patients had unique biologic and prognostic features according to their
baseline prognostic features (Table 1). The PCLI was significantly higher
among patients with ∆13 (P = 0.03), t(14;16)(q32;q23) (P = 0.02), or deletion
17p13.1 (P = 0.01). Serum levels of β2-microglobulin appeared to be
significantly higher in patients with deletion 17p13.1 (P = 0.03). Deletions of
17p13.1 were significantly associated with hypercalcemia (P = 0.009) and soft
tissue plasmacytomas (P = 0.0053). The use of lambda light chain was
favored in patients with t(14;16)(q23;q32) (P = 0.05). Serum levels of sIL6-R
were higher in patients with ∆13 (P = 0.003), t(4;14)(p16.3;q32) (p=0.025),
t(14;16)(q32;q23) (P = 0.009), and deletions of 17p13.1 (P = 0.006). Patients
with t(4;14)(p16.3;q32) were significantly more likely to have a serum
monoclonal protein greater than 3g/dL (P = 0.019). Light-chain only disease
was slightly more common among those patients with t(11;14)(q13;q32) (28%
among patients with t(11;14)(q13;q32) and 16% in those without
t(11;14)(q13;q32), Fisher’s exact P value=0.04). The IgA isotype was slightly
more common among patients with the t(4;14)(p16.3;q32) but was not
significant (P >0.2). No trend was observed among patients with
t(14;16)(q32;q23).
For personal use only. by guest on June 7, 2013. bloodjournal.hematologylibrary.orgFrom
Genomic aberrations in myeloma Fonseca et al.
Versions 02/04/03; 3:44 PM Page # 12
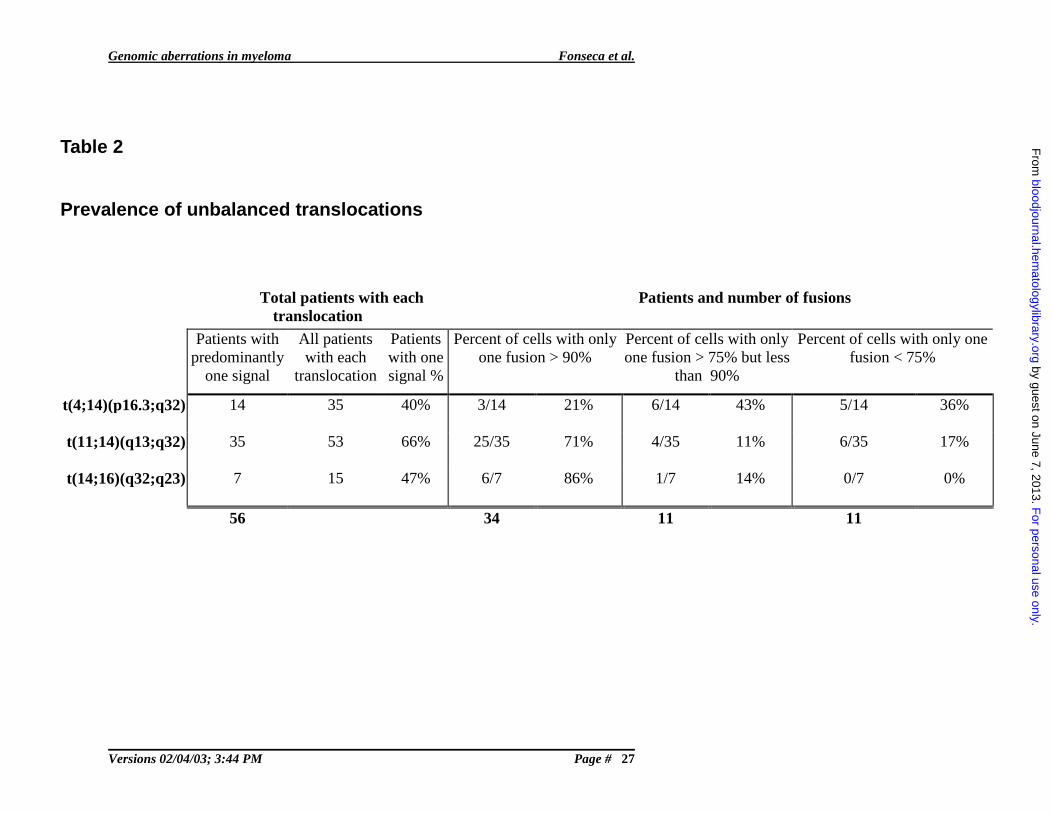
Balanced versus unbalanced translocations
A predominant patter of one fusion signal only was seen in 56 of 103
(51%) patients with evidence of a translocation by the fusion strategy. When
one only considers cases where the predominant pattern was seen in greater
than 90% of the clonal cells the total was 34 patients (33% of all IgH
translocations). This is remarkably different to what has been previously
believed in MM as balanced translocations have been assumed. (Table 2) A
recent publication by Keats and colleagues demonstrates that using RT-PCR
based strategies they find that up to one third of patients with the
t(4;14)(p16.3;q32) have unbalanced IgH translocations30.
Response to treatment
Among patients evaluable for response, those with ∆13 had a lower
likelihood of an objective response than those without the abnormality (Table
3). Otherwise there were no major differences noted.
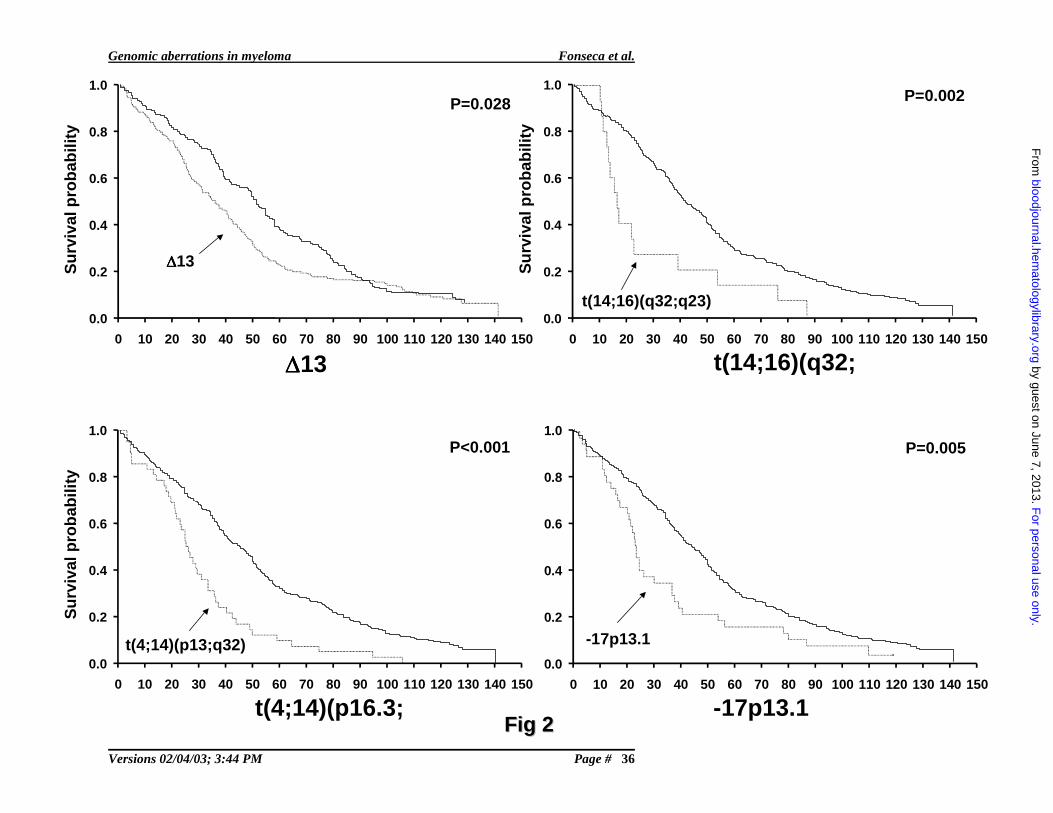
Survival analysis
On the univariate analysis, patients with t(4;14)(p16.3;q32),
t(14;16)(q32;q32), deletions of 17p13.1 and ∆13 had a significantly worse
overall survival (Fig. 2 and Table 3). Progression free survival was
significantly worse in patients with t(4;14)(p16.3;q32), t(14;16)(q32;q32), and
For personal use only. by guest on June 7, 2013. bloodjournal.hematologylibrary.orgFrom
Genomic aberrations in myeloma Fonseca et al.
Versions 02/04/03; 3:44 PM Page # 13
∆13, and was of marginal significance in patients with deletions of 17p13.1
(Table 3).
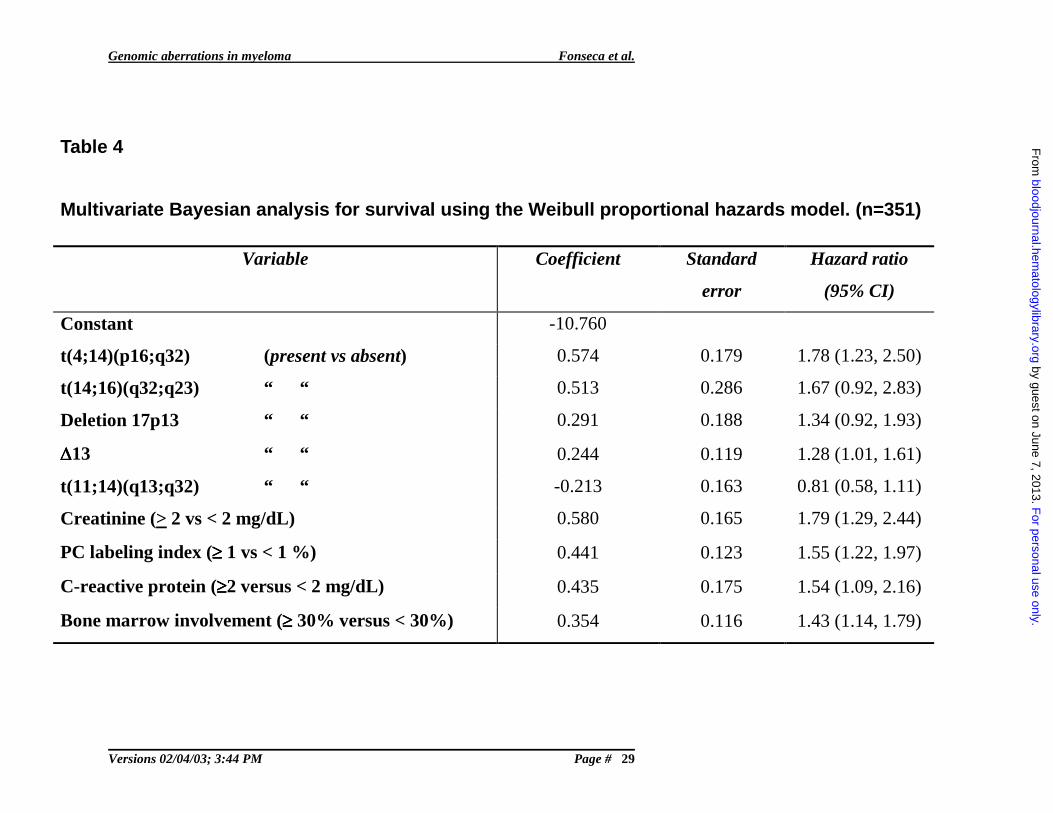
Multiple Regression Model
When adjusting for the clinical factors that were statistically
significant, as well as for other genetic abnormalities, t(4;14)(p16.3;q32) and
t(14;16)(q32;q23) had the highest hazard ratios (1.78 and 1.67, respectively),
t(4;14)(p16.3;q32) being statistically significant and t(14;16)(q32;q23)
marginally significant. Deletion of 17p13.1 was marginally significant with an
intermediate hazard ratio (1.34) with respect to the other four genetic
abnormalities (Table 4). ∆13 were also statistically significant, with a hazard
ratio equal to 1.28. These results were similar to those obtained using the Cox
regression model for only the 275 cases with complete data. The hazard ratios
(95% CI) of the genetic abnormalities in the Cox regression model, which also
included creatinine, PCLI and bone marrow PC percentage as covariates, were
1.69 (1.15, 2.49) for t(4;14)(p16.3;q32), 1.42 (0.75, 2.66) for
t(14;16)(q32;q23), 1.47 (0.97, 2.20) for -17p13.1, 1.35 (1.04, 1.74) for ∆13,
and 0.94 (0.66, 1.34) for t(11;14)(q13;q32).
For personal use only. by guest on June 7, 2013. bloodjournal.hematologylibrary.orgFrom
Genomic aberrations in myeloma Fonseca et al.
Versions 02/04/03; 3:44 PM Page # 14
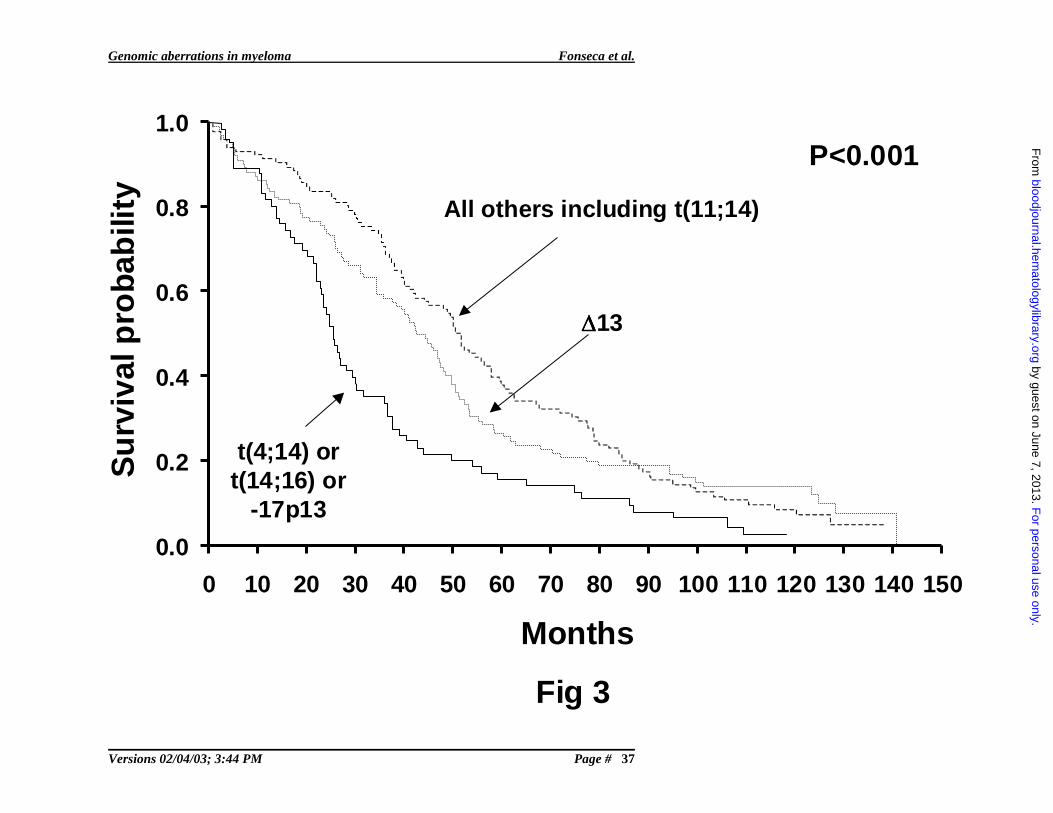
Prognostic Groups
Three hierarchical groups identified three distinct prognostic groups
(log-rank P value<0.001). The groups are as follows: Poor prognosis group-
patients with t(4;14)(p16.3;q32) and/or t(14;16)(q32;q23) and/or deletion
17p13.1 (n = 66); intermediate prognosis- patients with ∆13, but none of
t(4;14)(p16.3;q32), t(14;16)(q32;q23), or deletion 17p13.1 (n = 103); and good
prognosis- patients with t(11;14)(q13;q32) only or none of the abnormalities
tested (n = 106). Their median survival times were 24.7 months, 42.3 months
and 50.5 months respectively (Fig. 3).
Discussion
Summary
In this study we find subgroups of MM patients classified according to
their underlying cytogenetic abnormalities, and show that these abnormalities
alone can establish prognostic categories. Our study provides conclusive
clinical evidence that MM is not a single uniform disorder, but rather a group
of them that can be defined by their underlying cytogenetic anomalies
supported by this biologic variability11. Patients with the t(4;14)(p16.3;q32),
t(14;16)(q32;q23), and deletion of 17p13.1 have a significantly worse
prognosis that others. We suspect this observation is likely due to the
For personal use only. by guest on June 7, 2013. bloodjournal.hematologylibrary.orgFrom
Genomic aberrations in myeloma Fonseca et al.
Versions 02/04/03; 3:44 PM Page # 15
upregulation of specific oncogenes involved in these translocations and to loss
of the tumor suppressor gene p53 respectively. We previously demonstrated
that chromosomal abnormalities define unique presenting factors for MM and
may be associated with specific features such as the oligosecretory variant, λ-
light chain usage or ploidy status 7,8.
Biology of IgH translocations in general
Between 50% to 60% of MM patients harbor IgH translocations31-33, and
these translocations have been detected since the very early stages of the PC
neoplasms (i.e. MGUS) 34,35. This is consistent with IgH translocations being
primary events, as is seen in the mouse plasmacytoma model where they result
in c-myc upregulation 36. Of interest, all IgH translocations in MM appear to
be upregulating proliferation genes12. We conclude that while translocations
may be an early and important step 34,35, they are not sufficient in humans for
malignant transformation and more likely result in the initial clone-
immortalizing event. It is important to note that the translocations that impart a
poor prognosis in the active MM stage have no known effect on prognosis
when they are detected in MGUS. In fact we have found that patients with
MGUS and the t(4;14)(p16.3;q32) or t(14;16)(q32;q23) may remain without
progression to MM for prolonged periods of time35.
For personal use only. by guest on June 7, 2013. bloodjournal.hematologylibrary.orgFrom

Genomic aberrations in myeloma Fonseca et al.
Versions 02/04/03; 3:44 PM Page # 16
Genomic convergence and translocations
Despite ongoing genomic instability, IgH translocations are highly
conserved, as they are not lost with advancement through the different stages
of the PC neoplasms, and in fact are clonally selected as they are seen in the
majority of the clonal cells10,37. Roschke and colleagues, exploring genomic
instability in human colorectal and ovarian cancer cell lines, have previously
explored the model of “signature karyotypes”, and our working hypothesis is
consistent with it38. Here we show that in virtually all abnormal MM cases
IgH translocations involve a large percentage of the PCs. We observe similar
patterns with ∆13 but not with –17p13. This finding is in great contrast with
aneuploid clones that more commonly only affect a fraction of cells39,40. While
the situation is less clear in MGUS, it is also suggested that in many cases
translocations will involve the majority of the clonal cells34,35.
t(4;14)(p16.3;q32)
We have first reported the negative prognostic implications of both the
t(4;14)(p16.3;q32) and the t(14;16)(q32;q23) in MM patients treated with
chemotherapy41. Similar prognostic effects have been shown by Moreau and
colleagues for patients with t(4;14)(p16.3;q32) treated with high dose
chemotherapy9. The mechanisms resulting in the negative prognostic
associations with the t(4;14)(p16.3;q32) are not known.
For personal use only. by guest on June 7, 2013. bloodjournal.hematologylibrary.orgFrom
Genomic aberrations in myeloma Fonseca et al.
Versions 02/04/03; 3:44 PM Page # 17
In contrast to other B-cell malignancies IgH translocations in MM can
deregulate two or more oncogenes12. This is because in MM IgH
translocations occur into switch regions causing segregation of the Eµ and 3’α
enhancers. An example of this is the t(4;14)(p16.3;q32). While other genes
may be upregulated by the t(4;14)(p16.3;q32)42, FRGR3 and MMSET are best
characterized. However, not in all cases of a t(4;14)(p16.3;q32) is FGFR3
upregulated, and it has been found that der14 chromosome can be lost in
primary samples or cell lines (Michael Kuehl, personal communication)30.
This implies that MMSET deregulation is needed for clone survival. The
probes used in this study bracket all reported human MM breakpoints (for all
translocations) and should in theory always result in two detectable fusion
signals. However, in this study we have found that IgH translocations in MM
will frequently be unbalanced (Table 2).
t(14;16)(q32;q23)
Unlike the study by Avet-Loiseau, we have found the t(14;16)(q23;q32)
as recurrent in MM10. We observed the t(14;16)(q32;q23) in 5% of patients,
and had a clear association with an adverse outcome, with a shorter survival
and features of aggressiveness. We have also detected the t(14;16)(q32;q23)
in MGUS without transformation to MM35, but nevertheless when the
abnormality is seen in the active stages of the disease still confers an
For personal use only. by guest on June 7, 2013. bloodjournal.hematologylibrary.orgFrom
Genomic aberrations in myeloma Fonseca et al.
Versions 02/04/03; 3:44 PM Page # 18
aggressive phenotype. While c-maf upregulation is believed to be culprit, a
recently described gene, WWOX, is also disrupted by breakpoints at 16q2343.
A possible tumor suppressor role is being sought for this gene, that spans
several hundred kilobases at 16q32, and is located at the fragile site Fra16D43.
C-maf, has been shown to have transforming activity in chicken fibroblasts 44.
The t(14;16)(q32;q23) is observed in 25% of human MM cell lines but is only
seen in 5% of primary MM samples. In one of these human MM cell lines,
KMS-11, the 16q23 breakpoint places c-maf at greater than 700 kb of the IgH
enhancer in the translocated allele, without evidence of intervening deletion or
inversion (R Fonseca, unpublished observations). This highlights the
possibility that other oncogenes than those described to date may be
upregulated by any IgH translocation, other than those current believed
important for pathogenesis.
Chromosome 13 abnormalities
Our study confirms that ∆13 have a negative impact on prognosis.
Others and we have found that ∆13detected by FISH is an independent
prognostic variable on a multivariate analysis4,6. The genes associated with the
negative prognostic implications of ∆13 have yet to be defined. Detailed
molecular analysis has revealed that in the majority of cases ∆13 are indicative
of monosomy19,45. While a minimally deleted region has been postulated as
For personal use only. by guest on June 7, 2013. bloodjournal.hematologylibrary.orgFrom
Genomic aberrations in myeloma Fonseca et al.
Versions 02/04/03; 3:44 PM Page # 19
being in 13q14 other sites may be involved as well19,45. The role of ∆13 in the
pathogenesis of MM is still being elucidated. In the setting of widespread
genomic instability, chromosome 13 is almost never seen as trisomic
suggesting clonal intolerance to the gain46.
Deletion of 17p13.1 (p53)
Deletions at the p53 locus also confer an adverse prognosis, even when
they are only observed in a small proportion of patients15. While most other
abnormalities (i.e. IgH translocations and ∆13) showed little heterogeneity,
p53 deletions could be seen in smaller percents of cells and suggest early
clonal evolution. Furthermore, patients with this specific abnormality were
more likely to have other features of aggressiveness such as plasmacytomas
and hypercalcemia. All this information suggest that even when p53 deletions
may be detected at the time of diagnosis, it is likely a marker of an advanced
clone.
Therapeutic implications
As targeted therapy evolves, different treatment interventions will have
variable success, depending on the underlying genetic nature of the clone47.
For instance, the development of effective MMSET or FGFR3 small molecule
inhibitors may allow for patients with t(4;14)(p16.3;q32) to become a better
For personal use only. by guest on June 7, 2013. bloodjournal.hematologylibrary.orgFrom
Genomic aberrations in myeloma Fonseca et al.
Versions 02/04/03; 3:44 PM Page # 20
prognostic category. The use of inhibitors of the cyclin D1/CDK pathways,
such as flavopiridol, seems especially suited for patients with
t(11;14)(q13;q32). It is also worth noting that it appears that specific
treatments may be better tailored for patients with specific chromosomal
abnormalities. A comparison of our results (in patients treated with
conventional chemotherapy) to those of Moreau (in patients treated with high
dose therapy) suggests that high-dose chemotherapy provides little, or no,
survival advantage for patients with ∆13 or t(4;14)(p16.3;q32)8,9. In contrast it
appears that high-dose chemotherapy provides a significant survival increment
for patients with t(11;14)(q13;q32)7,9. While these observations are
speculative for now as they are based on a retrospective comparison, they are
highly provocative and in need of confirmation in prospective clinical trials.
Statistical aspects
A Bayesian approach was used in this study to assess the impact of
genetic abnormalities on survival adjusting for known clinical prognostic
factors. The advantage of the Bayesian analysis is that it allows including all
the subjects in the model, even those that have missing data in their covariates.
In our study sample 22% of subjects had missing data, either in the genetic
abnormalities or in the clinical variables. Imputation of missing data is done in
the Gibbs sampling framework by treating missing values as additional
For personal use only. by guest on June 7, 2013. bloodjournal.hematologylibrary.orgFrom
Genomic aberrations in myeloma Fonseca et al.
Versions 02/04/03; 3:44 PM Page # 21
unknown quantities and randomly selecting values from their conditional
distributions. Conditional distributions are a function of the observed
individual data and the current sampled values of the other missing data for a
particular individual. There was no indication of non-random “missingness” in
our data, one of the assumptions of the Bayesian analysis. Also, the
assumptions of Weibull distribution, proportional hazards and adequacy of the
multivariate model were assessed with satisfactory results. When the results of
the Bayesian approach (which included all the studied 351 patients) were
compared with those of the Cox proportional hazards regression (which
included only the 275 patients with complete data), the hazard ratios were
similar. Differences were observed mostly for the genetic abnormalities with
the smallest prevalence: (t(14;16)(q32;q23) and -17p13).
It is important to cautiously interpret the hierarchical group survival
analysis, being that patients in the poor prognosis group could have more
abnormalities than patients in the intermediate or good prognosis groups. For
instance, patients in the poor prognosis group could possibly have ∆13 deletion
in addition to one or more of the poor prognosis abnormalities. To make sure
this was not the only reason that patients in the poor prognosis group did
poorly, we switched the order of the hierarchical grouping. In the new
grouping patients with ∆13 were in one group, patients with any of the three
For personal use only. by guest on June 7, 2013. bloodjournal.hematologylibrary.orgFrom
Genomic aberrations in myeloma Fonseca et al.
Versions 02/04/03; 3:44 PM Page # 22
(t(4;14)(p16.3;q32), t(14;16)(q32;q23), deletion 17p13.1) poor prognosis
abnormalities, but not ∆13 were in another group, and patients with only
t(11;14)(q13;q32) or none of the five tested abnormalities were in the third
group. While the median survival times differed slightly from the originally
hierarchical grouping, the trend in median survival times was the same.
Patients with the poor prognosis abnormalities (t(4;14)(p16.3;q32),
t(14;16)(q32;q23), deletion 17p13.1) did worse than patients with ∆13, and
those patients both did worse than patients with only t(11;14)(q13;q32) or none
of the five tested abnormalities. We thus conclude that patients with
t(4;14)(p16.3;q32), t(14;16)(q32;q23), or deletion 17p13.1 seem to make up a
poor prognosis group.
For personal use only. by guest on June 7, 2013. bloodjournal.hematologylibrary.orgFrom
Genomic aberrations in myeloma Fonseca et al.
Versions 02/04/03; 3:44 PM Page # 23
Figure Legends
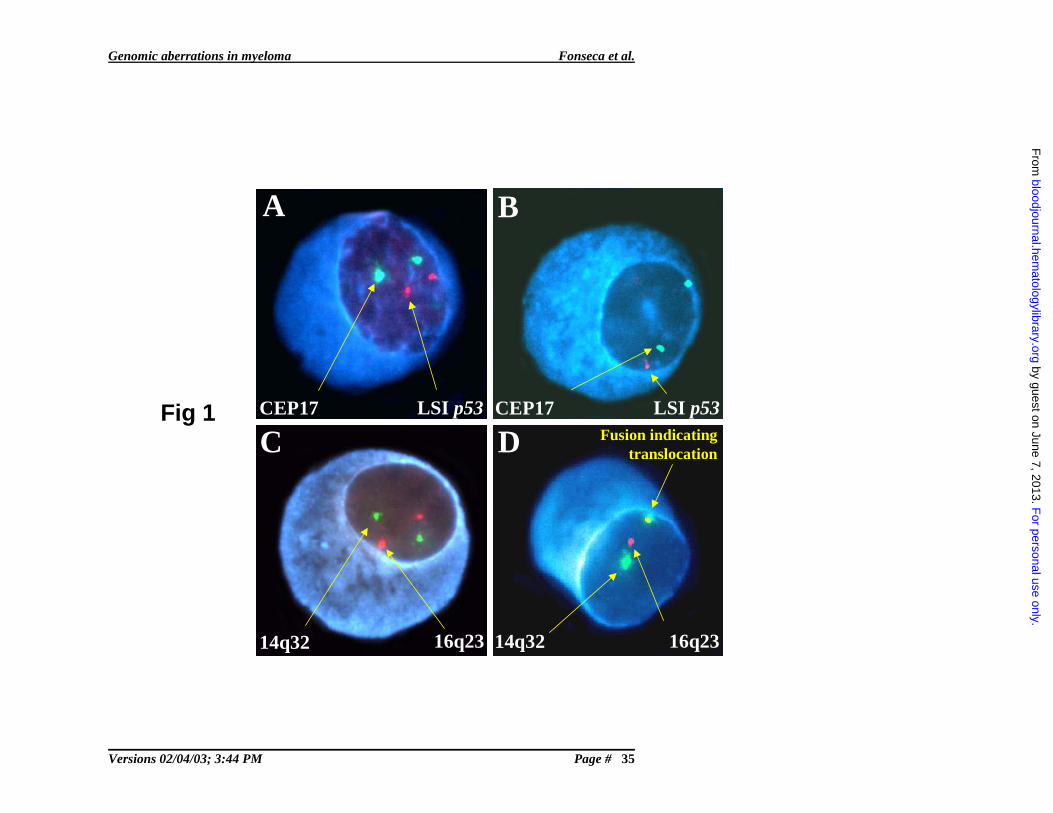
Figure 1: PCs with both the normal (A) and abnormal pattern of
hybridization (B) to test for ∆13∆13∆13∆13.
The depicted PCs show a normal and abnormal pattern of hybridization. In all
panels we show the blue fluorescence of the cytoplasm allowing the clone
specific interphase FISH scoring. Panel A shows a cell with the normal
configuration of two pairs of signals for the probes localizing to the
centromere 17 (green) and the 17p13.1 (LSI p53) probe (red). The cell in
panel B shows a cell with deletion of 17p13.1. There are two green signals
arising form the centromeric probe but only one red signal from the p53 locus
probe. Panel C shows a normal configuration of probes used to detect the
t(14;16)(q32;q23). The locus specific 14q32 probes are labeled in green and
the 16q23 probes are labeled in red. In panel D we show a cell with fusion of
probes for 14q32 (green) and 16q23 (red). The two signals in proximity
generate a fusion. If a significant number of cells scored showed this pattern a
patients is said to have a translocation.
Figure 2: Overall survival of patients stratified by the presence or absence
of each one of the specific cytogenetic abnormalities showing statistical
significance.
For personal use only. by guest on June 7, 2013. bloodjournal.hematologylibrary.orgFrom
Genomic aberrations in myeloma Fonseca et al.
Versions 02/04/03; 3:44 PM Page # 24
1The significance values are expressed next to each curve and correspond to
the log-rank test. The x-axis values represent time since diagnosis and is
expressed in months. The results for the t(11;14)(q13;q32) are not shown as it
was not statistically significant.
Figure 3: Overall survival of patients stratified by the hierarchical
classification model proposed by our study.
The survival curves show clear separation of patients into the good,
intermediate and poor prognosis category, a difference that was statistically
significant. Groups were formed by the stratification according to the presence
or absence of specific genetic abnormalities. The poor prognosis group
includes patients with –17p13.1, t(4;14)(p13;q32), and/or t(14;16)(q32;q23);
the intermediate prognosis group includes those patients with ∆13 that did not
have the aforementioned abnormalities; and the better prognosis group
includes those remaining patients including those with the t(11;14)(q13;q32)
and none of the aforementioned abnormalities.
For personal use only. by guest on June 7, 2013. bloodjournal.hematologylibrary.orgFrom

Genomic aberrations in myeloma Fonseca et al.
Versions 02/04/03; 3:44 PM Page # 25
Table 1
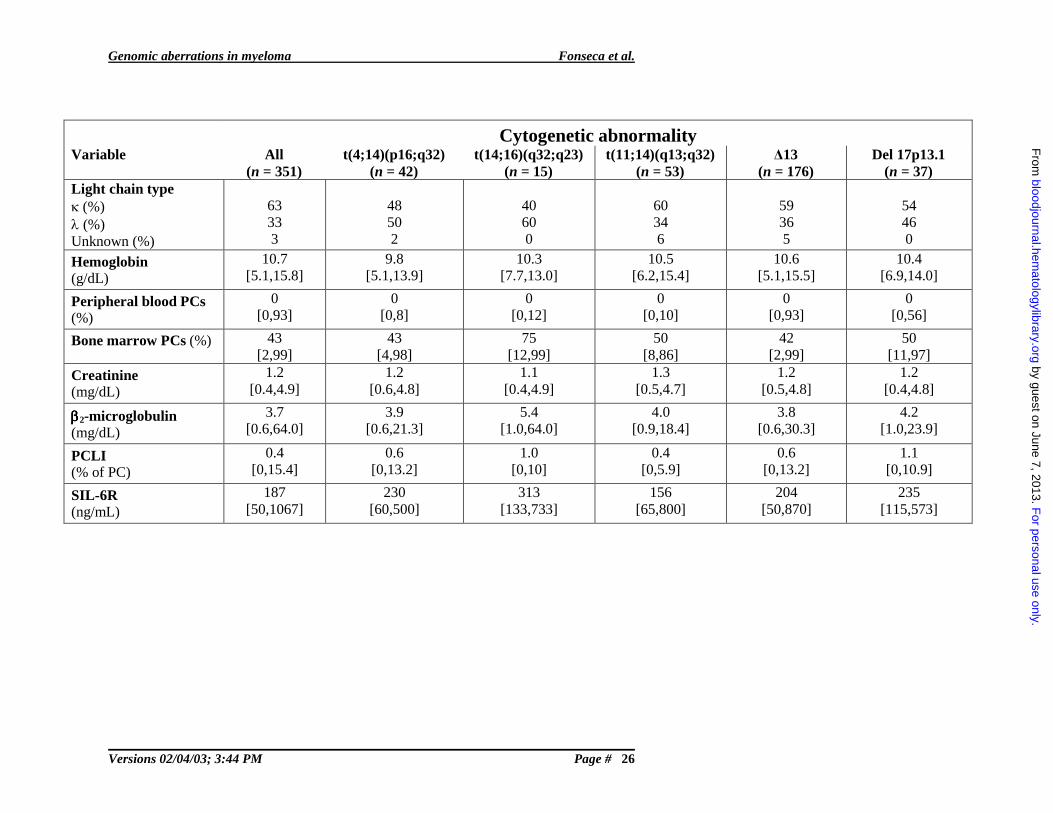
Baseline clinical and laboratory descriptive features of patients by abnormality. Numbers in brackets
denote range.
Cytogenetic abnormalityVariable All
(n = 351)t(4;14)(p16;q32)
(n = 42)t(14;16)(q32;q23)
(n = 15)t(11;14)(q13;q32)
(n = 53)∆13
(n = 176)Del 17p13.1
(n = 37)Median age [range] 63 [35,84] 59 [35,74] 58 [41,75] 62 [35,80] 62 [35,82] 64 [40,78]
Gendermale/female %
62/38 55/45 47/53 68/32 57/43 54/46
ECOG PS0-1 (%)2-4 (%)
8614
9010
1000
919
8812
8416
PlasmacytomaYes (%) 10 12 13 6 11 24Lytic bone lesionsYes (%) 61 62 54 62 60 70Hypercalcemia(Ca2+ >12mg/dL) (%) 24 21 27 23 26 43Serum M componentPresent (≥1g/dL) (%)Absent (%)
8317
9010
7327
7228
7822
7822
Urine M componentPresent (detectable) (%)Absent (%)Unknown (%)
72253
69247
67330
68302
76205
84143
F
or personal use only. by guest on June 7, 2013.
bloodjournal.hematologylibrary.org
From
Genomic aberrations in myeloma Fonseca et al.
Versions 02/04/03; 3:44 PM Page # 26
Cytogenetic abnormalityVariable All
(n = 351)t(4;14)(p16;q32)
(n = 42)t(14;16)(q32;q23)
(n = 15)t(11;14)(q13;q32)
(n = 53)∆13
(n = 176)Del 17p13.1
(n = 37)Light chain typeκ (%)λ (%)Unknown (%)
63333
48502
40600
60346
59365
54460
Hemoglobin(g/dL)
10.7[5.1,15.8]
9.8[5.1,13.9]
10.3[7.7,13.0]
10.5[6.2,15.4]
10.6[5.1,15.5]
10.4[6.9,14.0]
Peripheral blood PCs (%)
0[0,93]
0[0,8]
0[0,12]
0[0,10]
0[0,93]
0[0,56]
Bone marrow PCs (%) 43[2,99]
43[4,98]
75[12,99]
50[8,86]
42[2,99]
50[11,97]
Creatinine(mg/dL)
1.2[0.4,4.9]
1.2[0.6,4.8]
1.1[0.4,4.9]
1.3[0.5,4.7]
1.2[0.5,4.8]
1.2[0.4,4.8]
ββββ2-microglobulin(mg/dL)
3.7[0.6,64.0]
3.9[0.6,21.3]
5.4[1.0,64.0]
4.0[0.9,18.4]
3.8[0.6,30.3]
4.2[1.0,23.9]
PCLI(% of PC)
0.4[0,15.4]
0.6[0,13.2]
1.0[0,10]
0.4[0,5.9]
0.6[0,13.2]
1.1[0,10.9]
SIL-6R(ng/mL)
187[50,1067]
230[60,500]
313[133,733]
156[65,800]
204[50,870]
235[115,573]
F
or personal use only. by guest on June 7, 2013.
bloodjournal.hematologylibrary.org
From
Genomic aberrations in myeloma Fonseca et al.
Versions 02/04/03; 3:44 PM Page # 27
Table 2
Prevalence of unbalanced translocations
Total patients with each translocation
Patients and number of fusions
Patients with predominantly
one signal
All patients with each
translocation
Patients with one signal %
Percent of cells with only one fusion > 90%
Percent of cells with only one fusion > 75% but less
than 90%
Percent of cells with only one fusion < 75%
t(4;14)(p16.3;q32) 14 35 40% 3/14 21% 6/14 43% 5/14 36%
t(11;14)(q13;q32) 35 53 66% 25/35 71% 4/35 11% 6/35 17%
t(14;16)(q32;q23) 7 15 47% 6/7 86% 1/7 14% 0/7 0%
56 34 11 11
F
or personal use only. by guest on June 7, 2013.
bloodjournal.hematologylibrary.org
From

Genomic aberrations in myeloma Fonseca et al.
Versions 02/04/03; 3:44 PM Page # 28
Table 3
Overall Survival (OS), progression-free survival (PFS) and objective response (OR) to treatment by
abnormality
Abnormality N Median OS
with
abnormality
in months
(95% CI)
Median OS
without
abnormality
in months
(95% CI)
P
value
Median PFS
with
abnormality
in months
(95% CI)
Median PFS
without
abnormality
in months
(95% CI)
p
value
OR* with
abnormality
n (%)
OR*
without
abnormality
n (%)
p
value
5 yr. OS rate
with
abnormality
(%)
5 yr. OS rate
without
abnormality
(%)
t(4;14)(p16;q32) 332 26 (21,33) 45 (39,50) <.001 17 (13,21) 31 (28,34) <.001 26 (62) 197 (69) .38 10 32
t(14;16)(q32;q23) 323 16 (13,22) 41 (37,48) .003 9 (6,13) 30 (27,32) .003 8 (53) 204 (68) .27 13 29
t(11;14)(q13;q32) 336 50 (37,60) 39 (36,44) .332 33 (28,45) 27 (25,31) .590 39 (78) 187 (67) .14 38 28
Deletion 17p13 345 23 (20,36) 44 (39,49) .005 17 (11,24) 30 (27,33) .051 25 (68) 208 (69) .85 16 31
∆∆∆∆13 325 35 (29,41) 51 (41,57) .028 25 (21,29) 33 (30,37) .030 109 (63) 108 (74) .04 22 38
*: The number of patients evaluable for response may be slightly smaller than N given above.
F
or personal use only. by guest on June 7, 2013.
bloodjournal.hematologylibrary.org
From
Genomic aberrations in myeloma Fonseca et al.
Versions 02/04/03; 3:44 PM Page # 29
Table 4
Multivariate Bayesian analysis for survival using the Weibull proportional hazards model. (n=351)
Variable Coefficient Standard
error
Hazard ratio
(95% CI)
Constant -10.760
t(4;14)(p16;q32) (present vs absent) 0.574 0.179 1.78 (1.23, 2.50)
t(14;16)(q32;q23) “ “ 0.513 0.286 1.67 (0.92, 2.83)
Deletion 17p13 “ “ 0.291 0.188 1.34 (0.92, 1.93)
∆∆∆∆13 “ “ 0.244 0.119 1.28 (1.01, 1.61)
t(11;14)(q13;q32) “ “ -0.213 0.163 0.81 (0.58, 1.11)
Creatinine (> 2 vs < 2 mg/dL) 0.580 0.165 1.79 (1.29, 2.44)
PC labeling index (≥≥≥≥ 1 vs < 1 %) 0.441 0.123 1.55 (1.22, 1.97)
C-reactive protein (≥≥≥≥2 versus < 2 mg/dL) 0.435 0.175 1.54 (1.09, 2.16)
Bone marrow involvement (≥≥≥≥ 30% versus < 30%) 0.354 0.116 1.43 (1.14, 1.79) F
or personal use only. by guest on June 7, 2013.
bloodjournal.hematologylibrary.org
From

Genomic aberrations in myeloma Fonseca et al.
Versions 02/04/03; 3:44 PM Page # 30
References
1. Willis TG, Dyer MJ. The role of immunoglobulin translocations in the pathogenesis of B-cell malignancies. Blood. 2000;96:808-822
2. Zandecki M, Lai JL, Facon T. Multiple myeloma: almost all patients are cytogenetically abnormal. Br J Haematol. 1996;94:217-227
3. Drach J, Schuster J, Nowotny H, Angerler J, Rosenthal F, Fiegl M, Rothermundt C, Gsur A, Jager U, Heinz R. Multiple myeloma: high incidence of chromosomal aneuploidy as detected by interphase fluorescence in situ hybridization. Cancer Res. 1995;55:3854-3859
4. Zojer N, Konigsberg R, Ackermann J, Fritz E, Dallinger S, Kromer E, Kaufmann H, Riedl L, Gisslinger H, Schreiber S, Heinz R, Ludwig H, Huber H, Drach J. Deletion of 13q14 remains an independent adverse prognostic variable in multiple myeloma despite its frequent detection by interphase fluorescence in situ hybridization. Blood. 2000;95:1925-1930
5. Konigsberg R, Zojer N, Ackermann J, Kromer E, Kittler H, Fritz E, Kaufmann H, Nosslinger T, Riedl L, Gisslinger H, Jager U, Simonitsch I, Heinz R, Ludwig H, Huber H, Drach J. Predictive role of interphase cytogenetics for survival of patients with multiple myeloma. J Clin Oncol. 2000;18:804-812
6. Facon T, Avet-Loiseau H, Guillerm G, Moreau P, Geneviève F, Zandecki M, Laï J, Leleu X, Jouet J, Bauters F, Harousseau J, Bataille R, Mary J, (IFM) obotIFdM. Chromosome 13 abnormalities identified by FISH analysis and serum beta-2-microglobulin produce a powerful myeloma staging system for patients receiving high-dose therapy. Blood. 2001;97:1566-1571
7. Fonseca R, Harrington D, Oken M, Kyle R, Dewald G, Bailey R, Van Wier S, Henderson K, Hoyer J, Blood E, Kay N, Van Ness B, Greipp P. Myeloma and the t(11;14)(q13;q32) represents a uniquely defined biological subset of patients. Blood. 2002;99:3735-3741
8. Fonseca R, Harrington D, Oken M, Dewald G, Bailey R, Van Wier S, Henderson K, Blood E, Rajkumar S, Kay N, Van Ness B, Greipp P. Biologic and prognostic significance of interphase FISH detection of chromosome 13 abnormalities (∆13) in multiple myeloma: An Eastern Cooperative Oncology Group (ECOG) Study. Cancer Res. 2002;62:715-720
9. Moreau P, Facon T, Leleu X, Morineau N, Huyghe P, Harousseau JL, Bataille R, Avet-Loiseau H, Intergroupe Francophone du M. Recurrent 14q32 translocations determine the prognosis of multiple myeloma,
For personal use only. by guest on June 7, 2013. bloodjournal.hematologylibrary.orgFrom
Genomic aberrations in myeloma Fonseca et al.
Versions 02/04/03; 3:44 PM Page # 31
especially in patients receiving intensive chemotherapy. Blood. 2002;100:1579-1583
10. Avet-Loiseau H, Facon T, Grosbois B, Magrangeas F, Rapp MJ, Harousseau JL, Minvielle S, Bataille R, Intergroupe Francophone du M. Oncogenesis of multiple myeloma: 14q32 and 13q chromosomal abnormalities are not randomly distributed, but correlate with natural history, immunological features, and clinical presentation. Blood. 2002;99:2185-2191
11. Fonseca R, Dewald G, Coignet L. Cytogenetic abnormalities in multiple myeloma. Hematol Oncol Clin North Am. 1999;13:1169-1180
12. Kuehl WM, Bergsagel PL. Multiple myeloma: evolving genetic events and host interactions. Nature Rev Cancer. 2002;2:175-187.
13. Tricot G, Barlogie B, Jagannath S, Bracy D, Mattox S, Vesole DH, Naucke S, Sawyer JR. Poor prognosis in multiple myeloma is associated only with partial or complete deletions of chromosome 13 or abnormalities involving 11q and not with other karyotype abnormalities. Blood. 1995;86:4250-4256
14. Tricot G, Sawyer JR, Jagannath S, Desikan KR, Siegel D, Naucke S, Mattox S, Bracy D, Munshi N, Barlogie B. Unique role of cytogenetics in the prognosis of patients with myeloma receiving high-dose therapy and autotransplants. J Clin Oncol. 1997;15:2659-2666
15. Drach J, Ackermann J, Fritz E, Kromer E, Schuster R, Gisslinger H, DeSantis M, Zojer N, Fiegl M, Roka S, Schuster J, Heinz R, Ludwig H, Huber H. Presence of a p53 gene deletion in patients with multiple myeloma predicts for short survival after conventional-dose chemotherapy. Blood. 1998;92:802-809
16. Bergsagel PL, Chesi M, Nardini E, Brents LA, Kirby SL, Kuehl WM. Promiscuous translocations into immunoglobulin heavy chain switch regions in multiple myeloma. Proc Natl Acad Sci USA. 1996;93:13931-13936
17. Hallek M, Leif Bergsagel P, Anderson KC. Multiple myeloma: increasing evidence for a multistep transformation process. Blood. 1998;91:3-21
18. Oken MM, Leong T, Lenhard RE, Jr., Greipp PR, Kay NE, Van Ness B, Keimowitz RM, Kyle RA. The addition of interferon or high dose cyclophosphamide to standard chemotherapy in the treatment of patients with multiple myeloma: phase III Eastern Cooperative Oncology Group Clinical Trial EST 9486. Cancer. 1999;86:957-968
19. Fonseca R, Oken M, Harrington D, Bailey R, Van Wier S, Henderson K, Kay N, Van Ness B, Greipp P, Dewald G. Deletions of chromosome 13
For personal use only. by guest on June 7, 2013. bloodjournal.hematologylibrary.orgFrom
Genomic aberrations in myeloma Fonseca et al.
Versions 02/04/03; 3:44 PM Page # 32
in multiple myeloma identified by interphase FISH usually denote large deletions of the q-arm or monosomy. Leukemia. 2001;15:981-986
20. Ahmann GJ, Jalal SM, Juneau AL, Christensen ER, Hanson CA, Dewald GW, Greipp PR. A novel three-color, clone-specific fluorescence in situ hybridization procedure for monoclonal gammopathies. Cancer Genet Cytogenet. 1998;101:7-11
21. Hayman SR, Bailey RJ, Jalal SM, Ahmann GJ, Dispenzieri A, Gertz MA, Greipp PR, Kyle RA, Lacy MQ, Rajkumar V, Witzig TE, Lust JA, Fonseca R. Translocations involving heavy-chain locus are possible early genetic events in patients with primary systemic amyloidosis. Blood. 2001;98:2266-2268
22. Fonseca R, Oken M, Greipp P. The t(4;14)(p16.3;q32) is Strongly Associated with Chromosome 13 Abnormalities (∆13) in Both Multiple Myeloma (MM) and MGUS. Blood. 2001;98:1271-1272
23. Chesi M, Bergsagel PL, Shonukan OO, Martelli ML, Brents LA, Chen T, Schrock E, Ried T, Kuehl WM. Frequent dysregulation of the c-maf proto-oncogene at 16q23 by translocation to an Ig locus in multiple myeloma. Blood. 1998;91:4457-4463
24. Cox D. Analysis of Binary Data. London: Methuen and Co.; 197025. Wilcoxon F. Individual comparisons by ranking methods. Biometrics.
1945;1:80-8326. Kaplan EL, Meier P. Nonparametric estimation from incomplete
observations. J Am Stat Assoc. 1958;53:457-48127. Peto R, Peto J. Asymptotically efficient rank invariant test
procedures. Journal of the Royal Statistical Society, Series A. 1972;135:185-206
28. Spiegelhalter D, Thomas A, Best N, Gilks W. Bayesian inference using Gibbs sampling manual: MRC Biostatistics Unit, Institute of Public Health, Cambridge, UK.
29. Collett D. Modelling Survival Data in Medical Research. New York: Chapman and Hall; 1994.
30. Keats JJ, Reiman T, Maxwell CA, Taylor BJ, Mant MJ, Belch AR, Pilarski LM. In multiple myeloma t(4;14)(p16;q32) is an adverse prognostic factor irrespective of FGFR3 expression. Blood. 2002:2002-2006- 1675
31. Nishida K, Tamura A, Nakazawa N, Ueda Y, Abe T, Matsuda F, Kashima K, Taniwaki M. The Ig heavy chain gene is frequently involved in chromosomal translocations in multiple myeloma and plasma cell leukemia as detected by in situ hybridization. Blood. 1997;90:526-534
32. Avet-Loiseau H, Li JY, Facon T, Brigaudeau C, Morineau N, Maloisel F, Rapp MJ, Talmant P, Trimoreau F, Jaccard A, Harousseau JL,
For personal use only. by guest on June 7, 2013. bloodjournal.hematologylibrary.orgFrom

Genomic aberrations in myeloma Fonseca et al.
Versions 02/04/03; 3:44 PM Page # 33
Bataille R. High incidence of translocations t(11;14)(q13;q32) and t(4;14)(p16;q32). Cancer Res. 1998;58:5640-5645
33. Avet-Loiseau H, Brigaudeau C, Morineau N, Talmant P, Lai JL, Daviet A, Li JY, Praloran V, Rapp MJ, Harousseau JL, Facon T, Bataille R. High incidence of cryptic translocations involving the Ig heavy chain gene in multiple myeloma, as shown by fluorescence in situ hybridization. Genes Chromosomes Cancer. 1999;24:9-15
34. Avet-Loiseau H, Facon T, Daviet A, Godon C, Rapp MJ, Harousseau JL, Grosbois B, Bataille R. 14q32 translocations and monosomy 13 observed in monoclonal gammopathy of undetermined significance delineate a multistep process for the oncogenesis of multiple myeloma. Intergroupe Francophone du Myelome. Cancer Res. 1999;59:4546-4550
35. Fonseca R, Bailey RJ, Ahmann GJ, Rajkumar SV, Hoyer JD, Lust JA, Kyle RA, Gertz MA, Greipp PR, Dewald GW. Genomic abnormalities in monoclonal gammopathy of undetermined significance. Blood. 2002;100:1417-1424
36. Potter M. Perspectives on the origins of multiple myeloma and plasmacytomas in mice. Hematol-Oncol-Clin-North-Am . 1992;6:211-223
37. Avet-Loiseau H. Nonrandom Distribution of Chromosomal Abnormalities and Correlation with Clinical Stage and Prognostic Presentation: A Novel Model for Oncogenesis in Multiple Myeloma. Proceedings of the VIII International Myeloma Workshop. Banff, Alberta, Canada; 2001
38. Roschke AV, Stover K, Tonon G, Schaffer AA, Kirsch IR. Stable karyotypes in epithelial cancer cell lines despite high rates of ongoing structural and numerical chromosomal instability. Neoplasia. 2002;4:19-31.
39. Fonseca R, Ahmann GJ, Jalal SM, Dewald GW, Larson DR, Therneau TM, Gertz MA, Kyle RA, Greipp PR. Chromosomal abnormalities in systemic amyloidosis. Br J Haematol. 1998;103:704-710
40. Zandecki M, Lai JL, Genevieve F, Bernardi F, Volle-Remy H, Blanchet O, Francois M, Cosson A, Bauters F, Facon T. Several cytogenetic subclones may be identified within plasma cells from patients with monoclonal gammopathy of undetermined significance, both at diagnosis and during the indolent course of this condition. Blood. 1997;90:3682-3690
41. Fonseca R, Harrington D, Blood E, Rue M, Oken M, Dewald G, Kyle R, Van Wier S, Henderson K, Bailey R, Greipp P. A molecular classification of multiple myeloma (MM) based on cytogenetic abnormalities detected by interphase FISH, is powerful in identifying discrete groups of patients with dissimilar prognosis. Blood. 2001;98:733a
For personal use only. by guest on June 7, 2013. bloodjournal.hematologylibrary.orgFrom
Genomic aberrations in myeloma Fonseca et al.
Versions 02/04/03; 3:44 PM Page # 34
42. Still IH, Vince P, Cowell JK. The third member of the transforming acidic coiled coil-containing gene family, TACC3, maps in 4p16, close to translocation breakpoints in multiple myeloma, and is upregulated in various cancer cell lines. Genomics. 1999;58:165-170.
43. Krummel KA, Roberts LR, Kawakami M, Glover TW, Smith DI. The characterization of the common fragile site FRA16D and its involvement in multiple myeloma translocations. Genomics. 2000;69:37-46.
44. Kataoka K, Nishizawa M, Kawai S. Structure-function analysis of the maf oncogene product, a member of the b-Zip protein family. J Virol. 1993;67:2133-2141
45. Avet-Loiseau H, Daviet A, Saunier S, Bataille R. Chromosome 13 abnormalities in multiple myeloma are mostly monosomy 13. Br J Haematol. 2000;111:1116-1117
46. Debes-Marun C, Dewald G, Bryant S, Picken E, Santana-Dávila S, González-Paz N, Kyle R, Gertz M, Witzig T, Dispenzieri A, Lacy M, Rajkumar S, Lust J, Greipp P, Fonseca R. Chromosome abnormalities clustering and its implications for pathogenesis and prognosis in myeloma. Leukemia. 2002;In press
47. Anderson KC. Multiple Myeloma. Advances in disease biology: therapeutic implications. Semin Hematol. 2001;38:6-10
For personal use only. by guest on June 7, 2013. bloodjournal.hematologylibrary.orgFrom
Genomic aberrations in myeloma Fonseca et al.
Versions 02/04/03; 3:44 PM Page # 35
B
C
A
DCEP17 LSI p53 CEP17 LSI p53
14q32 16q23 14q32 16q23
Fusion indicatingtranslocation
Fig 1Fig 1
F
or personal use only. by guest on June 7, 2013.
bloodjournal.hematologylibrary.org
From
Genomic aberrations in myeloma Fonseca et al.
Versions 02/04/03; 3:44 PM Page # 36
t(4;14)(p16.3; -17p13.1
t(14;16)(q32;∆∆∆∆13
0.0
0.2
0.4
0.6
0.8
1.0
0 10 20 30 40 50 60 70 80 90 100 110 120 130 140 150
P=0.005
-17p13.1
0.0
0.2
0.4
0.6
0.8
1.0
0 10 20 30 40 50 60 70 80 90 100 110 120 130 140 150
Su
rviv
al p
rob
abili
ty
P<0.001
t(4;14)(p13;q32)
0.0
0.2
0.4
0.6
0.8
1.0
0 10 20 30 40 50 60 70 80 90 100 110 120 130 140 150
Su
rviv
al p
rob
abili
ty
P=0.028
∆∆∆∆13
0.0
0.2
0.4
0.6
0.8
1.0
0 10 20 30 40 50 60 70 80 90 100 110 120 130 140 150
Su
rviv
al p
rob
abili
ty
P=0.002
t(14;16)(q32;q23)
FFiigg 22
F
or personal use only. by guest on June 7, 2013.
bloodjournal.hematologylibrary.org
From
Genomic aberrations in myeloma Fonseca et al.
Versions 02/04/03; 3:44 PM Page # 37
0.0
0.2
0.4
0.6
0.8
1.0
0 10 20 30 40 50 60 70 80 90 100 110 120 130 140 150
Su
rviv
al p
roba
bili
ty
Months
P<0.001
t(4;14) ort(14;16) or
-17p13
∆∆∆∆13
All others including t(11;14)
Fig 3Fig 3
F
or personal use only. by guest on June 7, 2013.
bloodjournal.hematologylibrary.org
From