Ray aberrations analysis for phase plates illuminated by off-axis collimated beams
16
Ray aberrations analysis for phase plates illuminated by off-axis collimated beams Wenzi Zhang, Zi Ye, Yanping Chen, Tingyu Zhao, and Feihong Yu State Key Laboratory of Modern Optical Instrumentation, Optical Engineering Department, Zhejiang University, Hangzhou, 310027, China [email protected] Abstract: Approximate expressions of the ray aberrations for off-axis collimated beams and free form phase plates with a small derivative magnitude are derived with the defocus aberration taken into account. The cubic phase plate, which is one of the most commonly used phase plates in wavefront coding imaging systems, is illustrated as an example. The approximate expressions for the upper and lower boundaries of ray map, and the spot size in the vicinity of the focal plane are derived. The sensitivity to the defocus aberration and the variation of the induced aberrations with respect to the field positions are analyzed with derived approximate expressions as well. Some characteristics unmentioned before are derived, showing a good agreement with the exact aberrations. Finally some useful guidelines are given for the design of imaging systems with phase plates. ©2007 Optical Society of America OCIS codes: (220.1250) Aspherics; (220.1010) Aberration theory; (080.1510) Caustics; (220.1000) Aberration compensation. References and links 1. E. R. Dowski and W. T. Cathey, “Extended depth of field through wavefront coding,” Appl. Opt. 34, 1859- 1866(1995). 2. G. Muyo, A. Singh, M. Andersson, D. Huckridge, and A.R. Harvey, “Optimized thermal imaging with a singlet and pupil plane encoding: experimental realization,” in Electro-Optical and Infrared Systems: Technology and Applications III, R.G. Driggers, D.A. Huckridge, eds., Proc. SPIE 6395, 63950M (2006). 3. S. Mezouari and A. R. Harvey, “Primary aberrations alleviated with phase pupil filters,” in Novel Optical Systems Design and Optimization V, J. M. Sasian, R. J. Koshel, eds., Proc. SPIE 4768:21-31 (2002). 4. S. Mezouari, G. Muyo, and A. R. Harvey, “Amplitude and phase filters for mitigation of defocus and third- order aberrations,” in Optical Design and Engineering, L. Mazuray, P. J. Rogers, R. Warthmann, eds., Proc. SPIE 5249:238-248 (2004). 5. F. Gómez-Morales, R. Tudela, J. Ferré-Borrull, S. Bosch, and M. de la Fuente, “Pupil filters for wavefront coding: off axis performances,” in Optical Design and Engineering II, L. Mazuray, R. Wartmann, eds., Proc. SPIE 5962, 596237 (2005). 6. W.T. Cathey and E.R. Dowski, “New paradigm for imaging systems,” Appl. Opt. 41:6080-6092 (2002). 7. T. A. Mitchell and J. M. Sasian, “Variable aberration correction using axially translating phase plates,” in Window and Dome Technologies and Materials VI, R. W. Tustison, eds., Proc. SPIE 3705:209-220 (1999). 8. S. S. Sherif, E. R. Dowski, and W. T. Cathey, “A logarithmic phase filter to extend the depth of field of incoherent hybrid imaging systems,” in Algorithms and Systems for Optical Information Processing V, B. Javidi, D. Psaltis, eds., Proc. SPIE 4471:272-280 (2001). 9. S. Mezouari and A. R. Harvey, “Combined amplitude and phase filters for increased tolerance to spherical aberration,” Journal of Modern Optics 50, 2213-2220 (2003). 10. S. Mezouari and A. R. Harvey, “Phase pupil functions for control defocus and spherical aberrations,” Opt. Lett. 28, 771-773 (2003). 11. N. George and W. Chi, “Extended depth of field using a logarithmic asphere,” J. Opt. Apure Appl. Opt. 5, S157-S163 (2003). 12. S. Mezouari, G. Muyo, and A. R. Harvey, “Circularly symmetric phase filters for control of primary third- order aberrations: coma and astigmatism,” J. Opt. Soc. Am. A 23:1058-1062 (2006). 13. G. E. Johnson, P. E. X. Silveira, and E. R. Dowski, “Analysis tools for computational imaging systems,” in Visual Information Processing XIV, Z. Rahman, R. A. Schowengerdt, S. E. Reichenbach, eds., Proc. SPIE 5817, 34-44 (2005). #77352 - $15.00 USD Received 22 November 2006; revised 17 January 2007; accepted 20 February 2007 (C) 2007 OSA 19 March 2007 / Vol. 15, No. 6 / OPTICS EXPRESS 3031
-
Upload
independent -
Category
Documents
-
view
2 -
download
0
Transcript of Ray aberrations analysis for phase plates illuminated by off-axis collimated beams
Ray aberrations analysis for phase plates illuminated by off-axis collimated beams
Wenzi Zhang, Zi Ye, Yanping Chen, Tingyu Zhao, and Feihong Yu State Key Laboratory of Modern Optical Instrumentation, Optical Engineering Department, Zhejiang University,
Hangzhou, 310027, China [email protected]
Abstract: Approximate expressions of the ray aberrations for off-axis collimated beams and free form phase plates with a small derivative magnitude are derived with the defocus aberration taken into account. The cubic phase plate, which is one of the most commonly used phase plates in wavefront coding imaging systems, is illustrated as an example. The approximate expressions for the upper and lower boundaries of ray map, and the spot size in the vicinity of the focal plane are derived. The sensitivity to the defocus aberration and the variation of the induced aberrations with respect to the field positions are analyzed with derived approximate expressions as well. Some characteristics unmentioned before are derived, showing a good agreement with the exact aberrations. Finally some useful guidelines are given for the design of imaging systems with phase plates.
©2007 Optical Society of America
OCIS codes: (220.1250) Aspherics; (220.1010) Aberration theory; (080.1510) Caustics; (220.1000) Aberration compensation.
References and links
1. E. R. Dowski and W. T. Cathey, “Extended depth of field through wavefront coding,” Appl. Opt. 34, 1859-1866(1995).
2. G. Muyo, A. Singh, M. Andersson, D. Huckridge, and A.R. Harvey, “Optimized thermal imaging with a singlet and pupil plane encoding: experimental realization,” in Electro-Optical and Infrared Systems: Technology and Applications III, R.G. Driggers, D.A. Huckridge, eds., Proc. SPIE 6395, 63950M (2006).
3. S. Mezouari and A. R. Harvey, “Primary aberrations alleviated with phase pupil filters,” in Novel Optical Systems Design and Optimization V, J. M. Sasian, R. J. Koshel, eds., Proc. SPIE 4768:21-31 (2002).
4. S. Mezouari, G. Muyo, and A. R. Harvey, “Amplitude and phase filters for mitigation of defocus and third-order aberrations,” in Optical Design and Engineering, L. Mazuray, P. J. Rogers, R. Warthmann, eds., Proc. SPIE 5249:238-248 (2004).
5. F. Gómez-Morales, R. Tudela, J. Ferré-Borrull, S. Bosch, and M. de la Fuente, “Pupil filters for wavefront coding: off axis performances,” in Optical Design and Engineering II, L. Mazuray, R. Wartmann, eds., Proc. SPIE 5962, 596237 (2005).
6. W.T. Cathey and E.R. Dowski, “New paradigm for imaging systems,” Appl. Opt. 41:6080-6092 (2002). 7. T. A. Mitchell and J. M. Sasian, “Variable aberration correction using axially translating phase plates,” in
Window and Dome Technologies and Materials VI, R. W. Tustison, eds., Proc. SPIE 3705:209-220 (1999). 8. S. S. Sherif, E. R. Dowski, and W. T. Cathey, “A logarithmic phase filter to extend the depth of field of
incoherent hybrid imaging systems,” in Algorithms and Systems for Optical Information Processing V, B. Javidi, D. Psaltis, eds., Proc. SPIE 4471:272-280 (2001).
9. S. Mezouari and A. R. Harvey, “Combined amplitude and phase filters for increased tolerance to spherical aberration,” Journal of Modern Optics 50, 2213-2220 (2003).
10. S. Mezouari and A. R. Harvey, “Phase pupil functions for control defocus and spherical aberrations,” Opt. Lett. 28, 771-773 (2003).
11. N. George and W. Chi, “Extended depth of field using a logarithmic asphere,” J. Opt. Apure Appl. Opt. 5, S157-S163 (2003).
12. S. Mezouari, G. Muyo, and A. R. Harvey, “Circularly symmetric phase filters for control of primary third-order aberrations: coma and astigmatism,” J. Opt. Soc. Am. A 23:1058-1062 (2006).
13. G. E. Johnson, P. E. X. Silveira, and E. R. Dowski, “Analysis tools for computational imaging systems,” in Visual Information Processing XIV, Z. Rahman, R. A. Schowengerdt, S. E. Reichenbach, eds., Proc. SPIE 5817, 34-44 (2005).
#77352 - $15.00 USD Received 22 November 2006; revised 17 January 2007; accepted 20 February 2007
(C) 2007 OSA 19 March 2007 / Vol. 15, No. 6 / OPTICS EXPRESS 3031
14. M. Born and E. Wolf, “Principles of Optics,” 2nd ed. (Pergamon, Oxford, 1985). 15. W.Z. Zhang, Z. Ye, T.Y. Zhao, Y.P. Chen, and F.H. Yu, “Point spread function characteristics analysis of
the wavefront coding system,” Opt. Express 15, 1543-1552 (2007),
1. Introductin
Phase plates have been found to be more and more useful for imaging systems in the recent years. They have been utilized to extend the depth of field with the aberrations corrected and optical power enhanced, especially in wavefront coding imaging systems [1-6]. Moreover they also provide the variable aberration corrections for imaging systems [7]. Different types of phase plate [8-12] have been proposed and many analysis tools have been developed for characterizing their imaging properties [13]. So far most of the previous analysis of the imaging characteristics for phase plates has been carried out using Fourier optics, where the wavefront created by the phase plate is utilized to calculate the OTF (optical transfer function) and PSF (point spread function). The wavefront used in the previous mathematic calculations are only determined by the surface sag expressions of phase plates and the on-axis aberrations, such as the defocus and spherical aberration, for designing imaging systems with a large depth of field. The off-axis performance checks for phase plates have also been focused on the aberrations introduced by the system but not by phase plates. The up to date research shows a good performance on the defocus aberration at different field positions, however the exact wavefronts, i.e., the exact aberrations, introduced by phase plates with respect to the variation of the field and object positions have not been mentioned and carefully considered yet. In order to understand the exact imaging characteristics of phase plates with a wide field angle, the relationship between the exact wavefront, field parameters and object positions (defocus aberration) needs to be analyzed. Ray aberrations analysis, which can be related to the wavefronts [14], is a good candidate for analyzing these imaging characteristics, because it is more convenient to calculate the ray aberrations than the wavefront during the ray tracing procedure. In this paper, our attention is focused on the ray aberrations introduced by phase plates under the illuminations of off-axis collimated beams at different field positions. The approximate expressions of ray aberrations are derived for free form phase plates with a small derivative magnitude. Here the cubic phase plate is illustrated as an example. The sensitivity to defocus is analyzed and spot size is calculated. The induced aberrations with respect to the variation of field positions is analyzed in detail and some useful guidelines are given, which can be helpful for designing the large depth of field imaging systems with phase plates, especially the wide field angle wavefront coding systems. The rest of paper is organized as follows. In section 2 the approximate expressions of ray aberrations introduced by the phase plate under the off-axis collimated beam illumination are derived. Based on these expressions, discussions are given in section 3, where the cubic phase plate is illustrated as an example. The conclusions are drawn in section 4.
2. Derivation of the expressions for ray aberrations
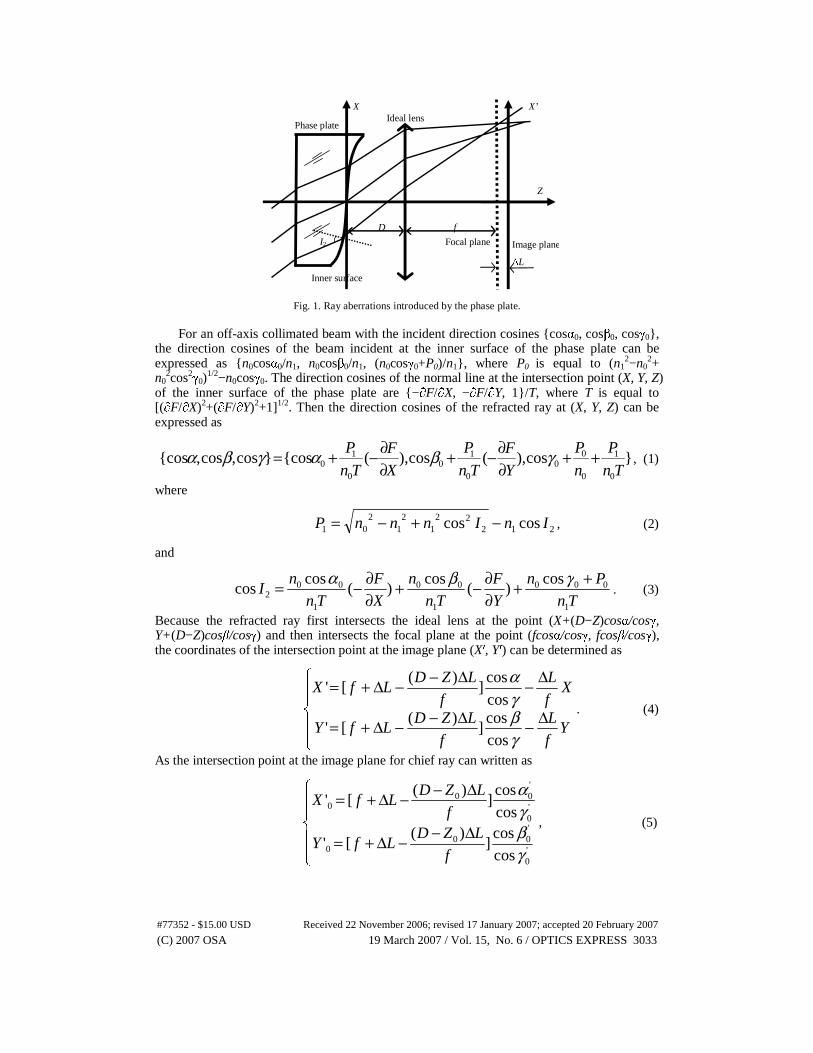
The optical system is constructed as in Fig. 1, where a phase plate with a refraction index of n1 is put in front of an ideal lens with a distance of D. The ideal lens converges the collimated rays to the Gaussian image point at the focal plane while aberrations are not brought in. The inner surface of the plate, which has the sag expression Z=F(X,Y) with a small derivative magnitude, is set to be the aperture stop with a semi-diameter of r. The ideal lens has an effective focal length of f and the image plane is at a distance ΔL away from the focal plane. The working wavelength is λ, and the refraction index is n0 in both the front and rear spaces of the phase plate. Two sets of Cartesian coordinates are introduced, including the pupil coordinates XY and the image plane coordinates X’Y’.
#77352 - $15.00 USD Received 22 November 2006; revised 17 January 2007; accepted 20 February 2007
(C) 2007 OSA 19 March 2007 / Vol. 15, No. 6 / OPTICS EXPRESS 3032
Ideal lens
I2 Focal plane
Phase plate
ΔL
D
Inner surface
f
Image plane
X
X’
Z
Fig. 1. Ray aberrations introduced by the phase plate. For an off-axis collimated beam with the incident direction cosines {cosα0, cosβ0, cosγ0}, the direction cosines of the beam incident at the inner surface of the phase plate can be expressed as {n0cosα0/n1, n0cosβ0/n1, (n0cosγ0+P0)/n1}, where P0 is equal to (n1
2−n02+
n02cos2γ0)
1/2−n0cosγ0. The direction cosines of the normal line at the intersection point (X, Y, Z) of the inner surface of the phase plate are {−∂F/∂X, −∂F/∂Y, 1}/T, where T is equal to [(∂F/∂X)2+(∂F/∂Y)2+1]1/2. Then the direction cosines of the refracted ray at (X, Y, Z) can be expressed as
}cos),(cos),({cos}cos,cos,{cos0
1
0
00
0
10
0
10 Tn
P
n
P
Y
F
Tn
P
X
F
Tn
P ++∂∂−+
∂∂−+= γβαγβα , (1)
where
21222
12
12
01 coscos InInnnP −+−= , (2)
and
Tn
Pn
Y
F
Tn
n
X
F
Tn
nI
1
000
1
00
1
002
cos)(
cos)(
coscos
++∂∂−+
∂∂−= γβα
. (3)
Because the refracted ray first intersects the ideal lens at the point (X+(D−Z)cosα/cosγ, Y+(D−Z)cosβ/cosγ) and then intersects the focal plane at the point (fcosα/cosγ, fcosβ/cosγ), the coordinates of the intersection point at the image plane (X′, Y′) can be determined as
⎪⎪⎩
⎪⎪⎨
⎧
Δ−Δ−−Δ+=
Δ−Δ−−Δ+=
Yf
L
f
LZDLfY
Xf
L
f
LZDLfX
γβγα
coscos
])(
['
cos
cos]
)(['
. (4)
As the intersection point at the image plane for chief ray can written as
⎪⎪⎩
⎪⎪⎨
⎧
Δ−−Δ+=
Δ−−Δ+=
'0
'00
0
'0
'00
0
coscos
])(
['
coscos
])(
['
γβγα
f
LZDLfY
f
LZDLfX
, (5)
#77352 - $15.00 USD Received 22 November 2006; revised 17 January 2007; accepted 20 February 2007
(C) 2007 OSA 19 March 2007 / Vol. 15, No. 6 / OPTICS EXPRESS 3033

where {cosα′0, cosβ′0, cosγ′0} and Z0 stand for the direction cosines of the refracted chief ray and sag of the inner surface at (0,0) respectively, the ray aberration introduced by the phase plate can be calculated according to Eq. (6):
⎪⎪
⎩
⎪⎪⎨
⎧
Δ−−Δ+−Δ−Δ+=−=Δ
Δ−−Δ+−Δ−Δ+=−=Δ
Yf
LZZ
f
L
f
LDLfYYY
Xf
LZZ
f
L
f
LDLfXXX
)cos
cos
cos
cos()
cos
cos
cos
cos)((''
)cos
cos
coscos
()cos
cos
coscos
)((''
'0
'0
0'0
'0
0
'0
'0
0'0
'0
0
γβ
γβ
γβ
γβ
γα
γα
γα
γα
. (6)
In the specail case where Z0, −∂F/∂X and −∂F/∂Y are all equal to zero at (0, 0), Eq. (6) can be rewritten as follows:
⎪⎪⎩
⎪⎪⎨
⎧
Δ−Δ+−Δ−Δ+=−=Δ
Δ−Δ+−Δ−Δ+=−=Δ
Yf
L
f
LZ
f
LDLfYYY
Xf
L
f
LZ
f
LDLfXXX
γβ
γβ
γβ
γα
γα
γα
coscos
)cos
cos
coscos
)((''
cos
cos)
cos
cos
cos
cos)((''
0
00
0
00
. (7)
The direction cosines {cosα, cosβ, cosγ} are equal to {cosα0+Δα, cosβ0+Δβ, cosγ0+Δγ}, where
⎪⎪⎪
⎩
⎪⎪⎪
⎨
⎧
+=Δ
∂∂−=Δ
∂∂−=Δ
)(
)(
0
1
0
0
0
1
0
1
Tn
P
n
PY
F
Tn
PX
F
Tn
P
γ
β
α
. (8)
Assuming that the sag expression Z=F(X,Y) has a small derivative magnitude, it can be concluded that there are only tiny variations in the direction cosines caused by the phase plate. Since the modulus of the direction cosines is equal to unity, Eq. (8) can be approximated as Eq. (9) if the higher order tiny variations can be neglected,
⎪⎪⎪⎪
⎩
⎪⎪⎪⎪
⎨
⎧
+−−=
Δ+Δ−≈Δ
∂∂−≈Δ
∂∂−≈Δ
022
02
02
10010
0
00
0
10
0
10
coscos
cos
coscos
)(
)(
γγγ
ββααγ
β
α
nnnnP
Y
F
n
PX
F
n
P
. (9)
Hence Eq. (7) can be approximated as Eq. (10),
#77352 - $15.00 USD Received 22 November 2006; revised 17 January 2007; accepted 20 February 2007
(C) 2007 OSA 19 March 2007 / Vol. 15, No. 6 / OPTICS EXPRESS 3034
⎪⎪⎪
⎩
⎪⎪⎪
⎨
⎧
Δ−Δ+−Δ
Δ−Δ+≈Δ
Δ−Δ+−Δ
Δ−Δ+≈Δ
Yf
Lf
LDLf
Y
Xf
Lf
LDLf
X
]coscos)cos1([cos
)(
]coscos)cos1([cos
)(
0002
03
0002
03
βαααβγ
βαββαγ
. (10)
For a small defocus aberration ΔL and a small space D, the higher order tiny variation (ΔL−DΔL/f)Δα and (ΔL−DΔL/f)Δβ can also be neglected, so Eq. (10) can be approximated as Eq. (11),
⎪⎪⎩
⎪⎪⎨
⎧
Δ−Δ+−Δ≈Δ
Δ−Δ+−Δ≈Δ
Yf
LfY
Xf
LfX
]coscos)cos1([cos
]coscos)cos1([cos
0002
03
0002
03
βαααβγ
βαββαγ
. (11)
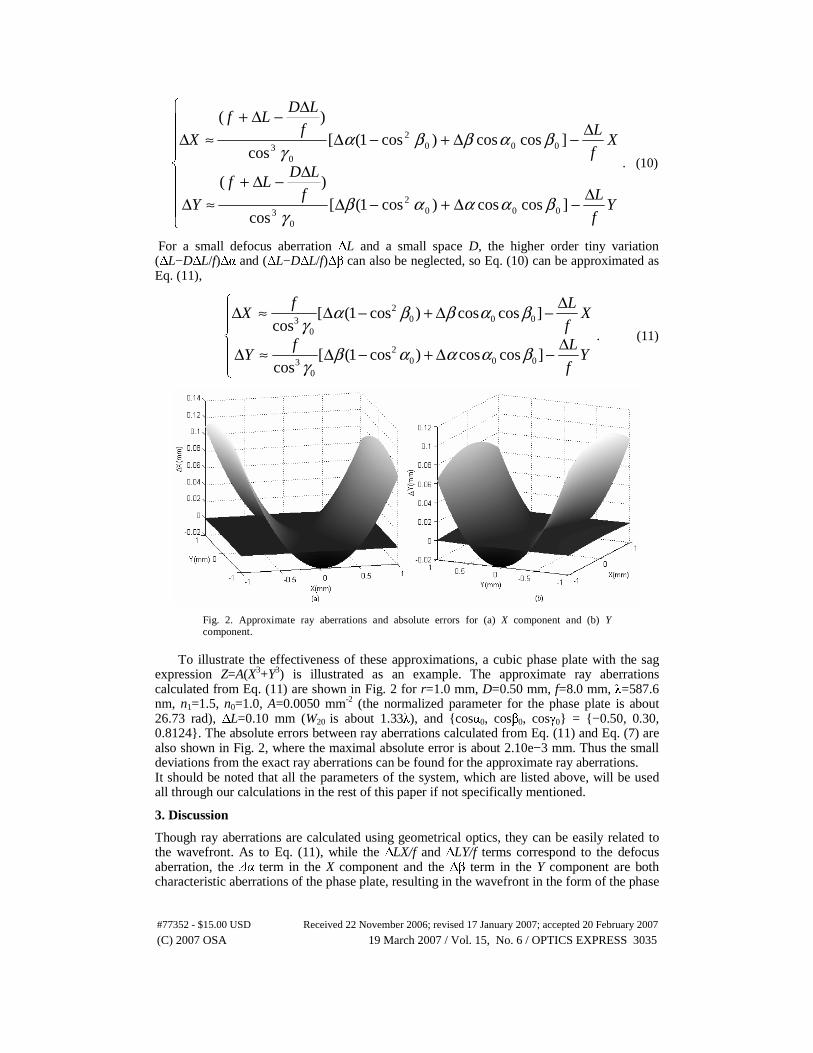
Fig. 2. Approximate ray aberrations and absolute errors for (a) X component and (b) Y component.
To illustrate the effectiveness of these approximations, a cubic phase plate with the sag expression Z=A(X3+Y3) is illustrated as an example. The approximate ray aberrations calculated from Eq. (11) are shown in Fig. 2 for r=1.0 mm, D=0.50 mm, f=8.0 mm, λ=587.6 nm, n1=1.5, n0=1.0, A=0.0050 mm-2 (the normalized parameter for the phase plate is about 26.73 rad), ΔL=0.10 mm (W20 is about 1.33λ), and {cosα0, cosβ0, cosγ0} = {−0.50, 0.30, 0.8124}. The absolute errors between ray aberrations calculated from Eq. (11) and Eq. (7) are also shown in Fig. 2, where the maximal absolute error is about 2.10e−3 mm. Thus the small deviations from the exact ray aberrations can be found for the approximate ray aberrations. It should be noted that all the parameters of the system, which are listed above, will be used all through our calculations in the rest of this paper if not specifically mentioned.
3. Discussion
Though ray aberrations are calculated using geometrical optics, they can be easily related to the wavefront. As to Eq. (11), while the ΔLX/f and ΔLY/f terms correspond to the defocus aberration, the Δα term in the X component and the Δβ term in the Y component are both characteristic aberrations of the phase plate, resulting in the wavefront in the form of the phase
#77352 - $15.00 USD Received 22 November 2006; revised 17 January 2007; accepted 20 February 2007
(C) 2007 OSA 19 March 2007 / Vol. 15, No. 6 / OPTICS EXPRESS 3035
plate’s sag expression. There are also additional aberrations brought in due to the off-axis collimated beam and the phase plate, including the Δβ term in the X component and the Δα term in the Y component. Besides, with Eq. (10) the defocus aberration constant ΔL is also found to have impacts on all these aberrations. In the rest of this section, Eq. (11) will be utilized to analyze the imaging characteristics for the cubic phase plate the in the presence of only a small defocus aberration. The cubic phase plate has a sag expression of Z=A(X3+Y3), where A is a constant, so the derivatives ∂F/∂X and ∂F/∂Y are equal to 3AX2 and 3AY2, respectively.
3.1 Spot size
In our previous work, the PSF size with a cubic phase plate present is calculated using Fourier optics [15]. Here the spot size can be calculated using geometrical optics from Eq. (11). For the general case that the phase plate is illuminated by an on-axis collimated beam, only 1D (one-dimensional) spot size needs to be calculated. Then the ray aberration in Eq. (11) can be simplified as Eq. (12),
rXrXf
LX
n
nAfX ≤≤−Δ−−≈Δ ,)1(3 2
0
1 , (12)
Eq. (12) shows that ΔX is a parabolic function of the aperture coordinates X. For 3Af(n1/n0-1)>0, the lower boundary is determined when X is equal to ΔL/[6Af2(n1/n0−1)] while the upper boundary is determined when X is equal to −r for ΔL>0, and r for ΔL<0. As 2π(n1/n0−1)Ar3/λ is equal to the normalized parameter a for the phase plate, πr2ΔL/(λf2) is equal to defocus constant kW20, where k is the wavenumber 2π/λ, and 2r/λf is equal to the diffraction-limited cutoff frequency f0 for incoherent imaging system, the lower and upper boundaries of the spot can be expressed as
⎪⎪
⎩
⎪⎪
⎨
⎧
+=Δ+−≈Δ
−=−
Δ−≈Δ
0
202
0
1
0
220
0
13
2
||23||)1(3
3
)(
)1(12
f
kWar
f
Lr
n
nAfX
fa
kW
n
nAf
LX
upper
lower
π
π. (13)
So the spot size d can be written as Eq. (14), which is in accordance with the one that we derived using Fourier optics.
0
220
0
13
22
0
1
3
|)|3(
)1(12
||)1(3
fa
kWa
n
nAf
Lr
f
Lr
n
nAfd
π+
=−
Δ+Δ+−≈ . (14)
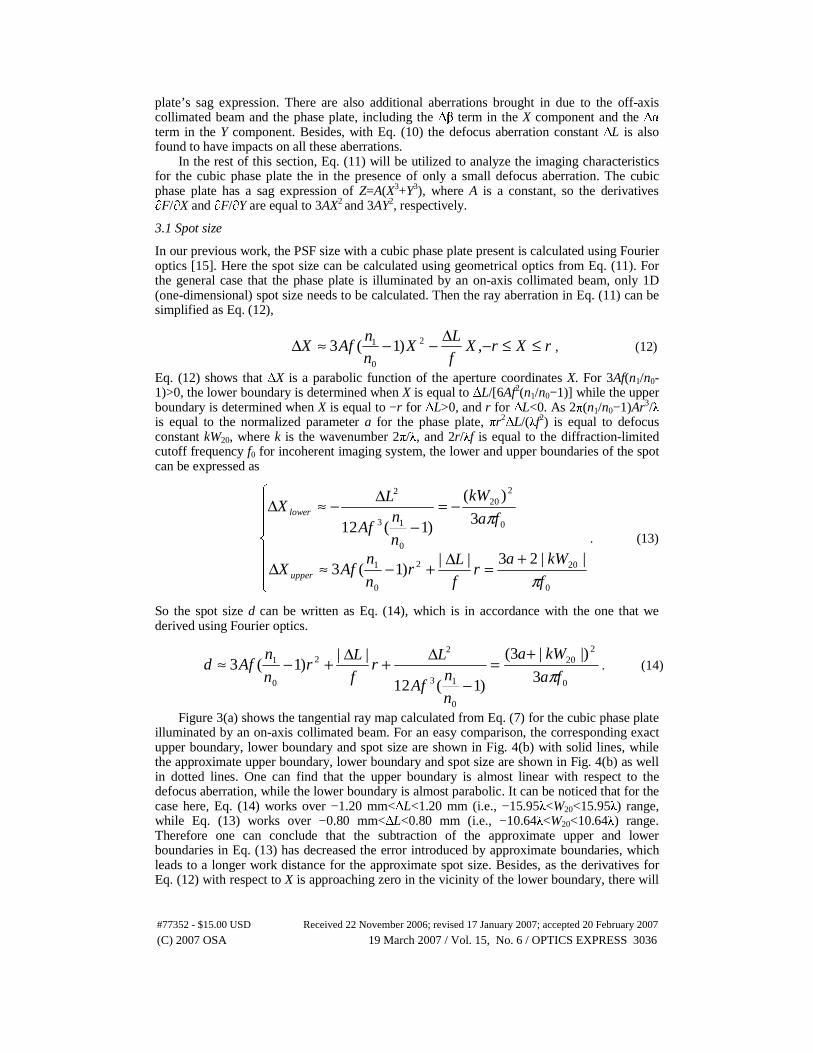
Figure 3(a) shows the tangential ray map calculated from Eq. (7) for the cubic phase plate illuminated by an on-axis collimated beam. For an easy comparison, the corresponding exact upper boundary, lower boundary and spot size are shown in Fig. 4(b) with solid lines, while the approximate upper boundary, lower boundary and spot size are shown in Fig. 4(b) as well in dotted lines. One can find that the upper boundary is almost linear with respect to the defocus aberration, while the lower boundary is almost parabolic. It can be noticed that for the case here, Eq. (14) works over −1.20 mm<ΔL<1.20 mm (i.e., −15.95λ<W20<15.95λ) range, while Eq. (13) works over −0.80 mm<ΔL<0.80 mm (i.e., −10.64λ<W20<10.64λ) range. Therefore one can conclude that the subtraction of the approximate upper and lower boundaries in Eq. (13) has decreased the error introduced by approximate boundaries, which leads to a longer work distance for the approximate spot size. Besides, as the derivatives for Eq. (12) with respect to X is approaching zero in the vicinity of the lower boundary, there will
#77352 - $15.00 USD Received 22 November 2006; revised 17 January 2007; accepted 20 February 2007
(C) 2007 OSA 19 March 2007 / Vol. 15, No. 6 / OPTICS EXPRESS 3036
be more rays that intersect the vicinity of the lower boundary, which is also exhibited in Fig. 3(a).
Fig. 3. (a) Tangential rays map. (b) Comparisons between the exact and approximate boundaries and spot size.
For the other type of phase plate, if PSF size can be approximated by the spot size, the defocused PSF size can be determined by solving the upper and lower boundaries of the ray aberrations introduced by the phase plate, which can be also acquired from the derivatives of the phase plate induced wavefront.
3.2 Sensitivity to defocus
For the cubic phase plate, inserting Eq. (9) into Eq. (11) enables us to rewrite Eq. (11) in the form as shown in Eq. (15.a), which can be rearranged as Eq. (15.b).
⎪⎪⎩
⎪⎪⎨
⎧
Δ−−+−−≈Δ
Δ−−+−−≈Δ
Yf
LAXAY
n
fPY
Xf
LAYAX
n
fPX
)]3(coscos)3)(cos1[(cos
)]3(coscos)3)(cos1[(cos
20
20
2
03
0
10
20
20
2
03
0
10
βααγ
βαβγ
,
(15.a)
⎪⎪⎪⎪⎪
⎩
⎪⎪⎪⎪⎪
⎨
⎧
−−
Δ
+−
Δ+
−−≈Δ
−−
Δ
+−
Δ+
−−≈Δ
2
03
0
0010
023
10
20
30
2
022
10
03
0
03
0
02
10
2
03
0
0010
023
10
20
30
2
022
10
03
0
03
0
02
10
cos
coscos3
)cos1(12
cos
])cos1(6
cosn[
cos
)cos1(3cos
coscos3
)cos1(12
cos
])cos1(6
cosn[
cos
)cos1(3
Xn
fAP
fAP
Ln
fAP
LY
n
fAPY
Yn
fAP
fAP
Ln
fAP
LX
n
fAPX
γβα
αγ
αγ
γα
γβα
βγ
βγ
γβ
. (15.b)
#77352 - $15.00 USD Received 22 November 2006; revised 17 January 2007; accepted 20 February 2007
(C) 2007 OSA 19 March 2007 / Vol. 15, No. 6 / OPTICS EXPRESS 3037
When cosα0cosβ0 is approaching zero, the two terms in Eq. (15.b), which are 3AP10f cosα0cosβ0Y
2/(n0cos3γ0) and 3AP10f cosα0cosβ0X2/(n0cos3γ0), can be assumed to zero. Then one
can find that the defocus aberrations in Eq. (15.b) can be treated as just tilts (i.e., the two terms n0cos3γ0ΔL2/[12AP10f
3(1−cos2β0)] and n0cos3γ0ΔL2/[12AP10f3(1−cos2α0)] in Eq. (15.b)) and
aperture shifts (the shift distances of coordinate in X and Y dimensions are n0cos3γ0ΔL/[6AP10f
2(1−cos2β0)] and n0cos3γ0ΔL/[6AP10f2(1−cos2α0)], respectively) effectively.
Thus by comparing the spot diagrams at different image plane positions, one can find that only coordinate shifts happen while the spot diagrams are maintained. As the PSF can be approximated by the spot diagram, we can also expect that the PSFs in the presence of different amount of defocus aberrations are also the same expect for the coordinates are shifted [15]. That is the reason in the view of geometric optics why the wavefront coding systems with a cubic phase mask is insensitive to defocus.
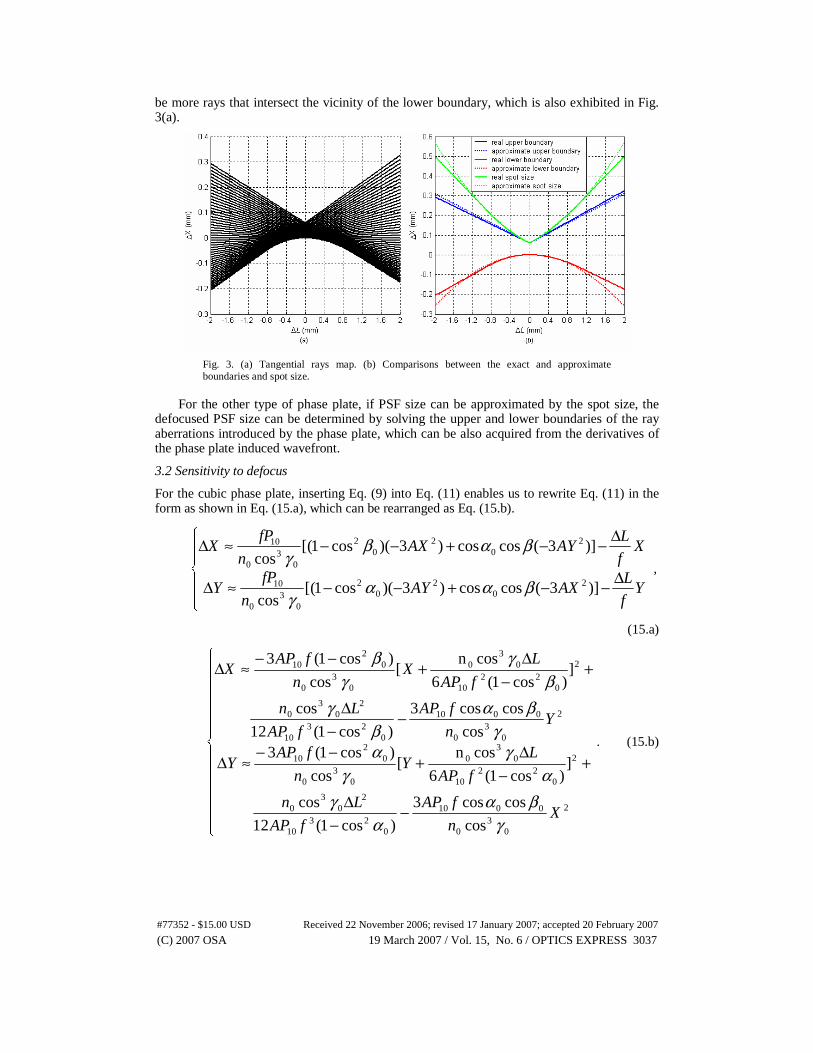
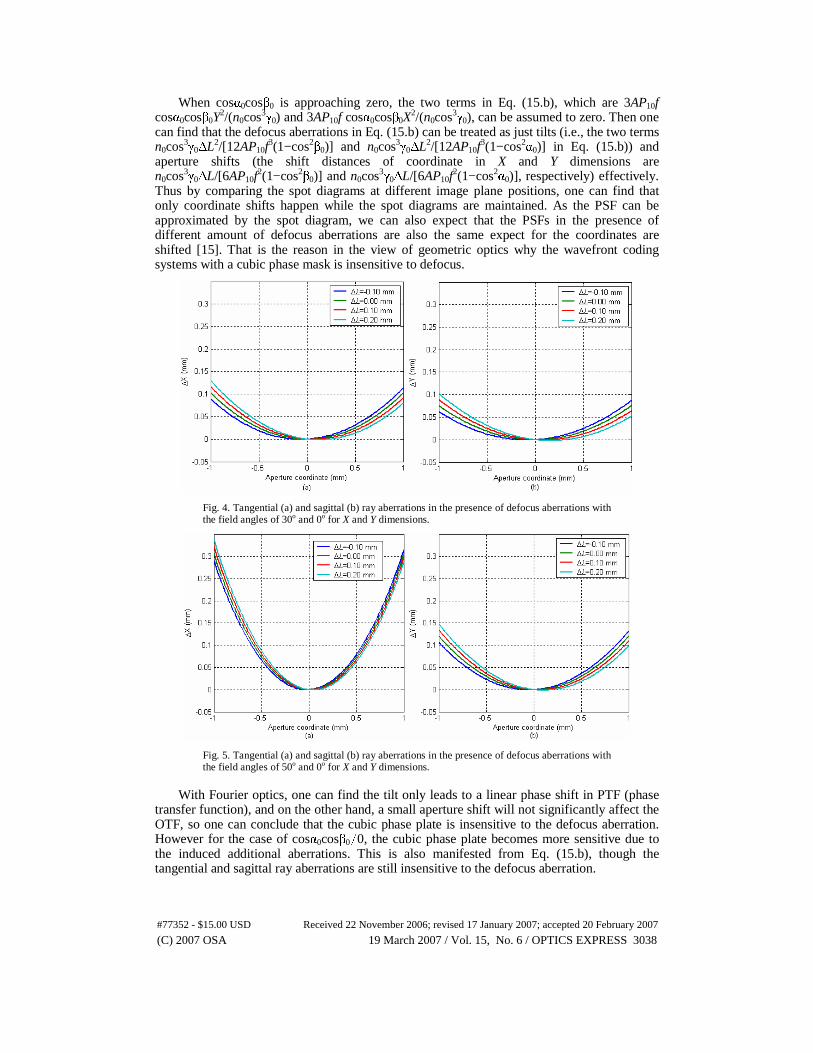
Fig. 4. Tangential (a) and sagittal (b) ray aberrations in the presence of defocus aberrations with the field angles of 30o and 0o for X and Y dimensions.
Fig. 5. Tangential (a) and sagittal (b) ray aberrations in the presence of defocus aberrations with the field angles of 50o and 0o for X and Y dimensions.
With Fourier optics, one can find the tilt only leads to a linear phase shift in PTF (phase transfer function), and on the other hand, a small aperture shift will not significantly affect the OTF, so one can conclude that the cubic phase plate is insensitive to the defocus aberration. However for the case of cosα0cosβ0≠0, the cubic phase plate becomes more sensitive due to the induced additional aberrations. This is also manifested from Eq. (15.b), though the tangential and sagittal ray aberrations are still insensitive to the defocus aberration.
#77352 - $15.00 USD Received 22 November 2006; revised 17 January 2007; accepted 20 February 2007
(C) 2007 OSA 19 March 2007 / Vol. 15, No. 6 / OPTICS EXPRESS 3038
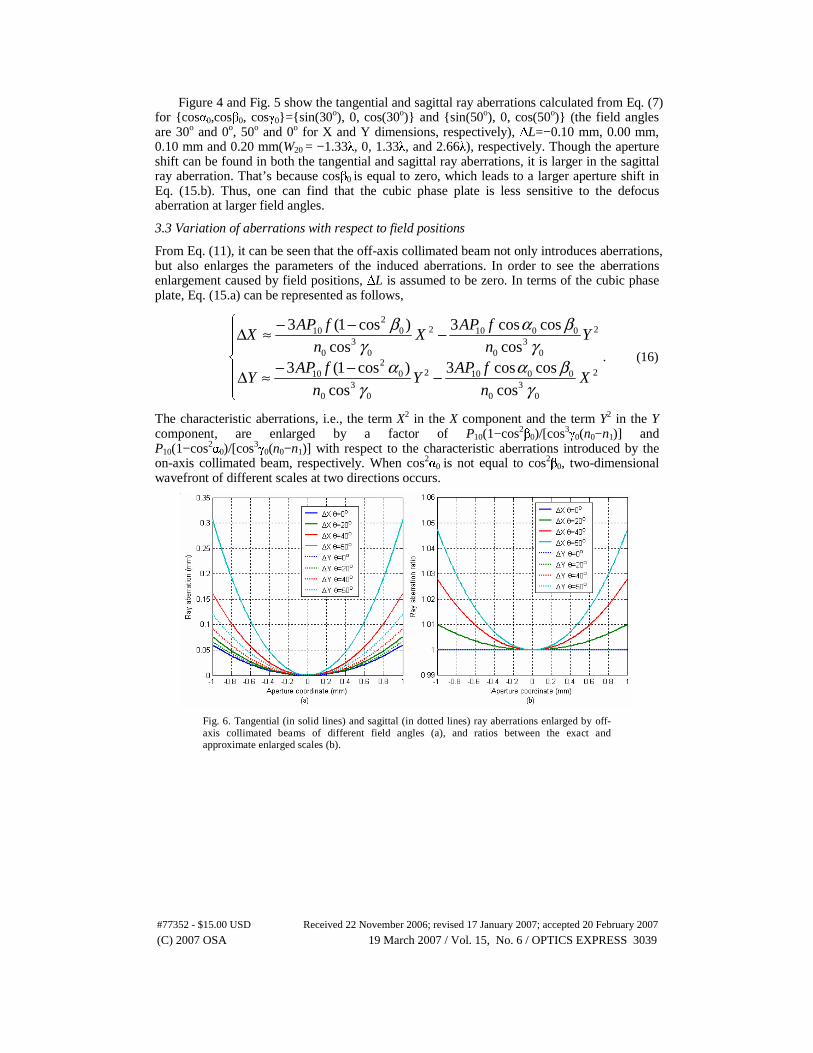
Figure 4 and Fig. 5 show the tangential and sagittal ray aberrations calculated from Eq. (7) for {cosα0,cosβ0, cosγ0}={sin(30o), 0, cos(30o)} and {sin(50o), 0, cos(50o)} (the field angles are 30o and 0o, 50o and 0o for X and Y dimensions, respectively), ΔL=−0.10 mm, 0.00 mm, 0.10 mm and 0.20 mm(W20 = −1.33λ, 0, 1.33λ, and 2.66λ), respectively. Though the aperture shift can be found in both the tangential and sagittal ray aberrations, it is larger in the sagittal ray aberration. That’s because cosβ0 is equal to zero, which leads to a larger aperture shift in Eq. (15.b). Thus, one can find that the cubic phase plate is less sensitive to the defocus aberration at larger field angles.
3.3 Variation of aberrations with respect to field positions
From Eq. (11), it can be seen that the off-axis collimated beam not only introduces aberrations, but also enlarges the parameters of the induced aberrations. In order to see the aberrations enlargement caused by field positions, ΔL is assumed to be zero. In terms of the cubic phase plate, Eq. (15.a) can be represented as follows,
⎪⎪⎩
⎪⎪⎨
⎧
−−−≈Δ
−−−≈Δ
2
03
0
00102
03
0
02
10
2
03
0
00102
03
0
02
10
cos
coscos3
cos
)cos1(3cos
coscos3
cos
)cos1(3
Xn
fAPY
n
fAPY
Yn
fAPX
n
fAPX
γβα
γα
γβα
γβ
. (16)
The characteristic aberrations, i.e., the term X2 in the X component and the term Y2 in the Y component, are enlarged by a factor of P10(1−cos2β0)/[cos3γ0(n0−n1)] and P10(1−cos2α0)/[cos3γ0(n0−n1)] with respect to the characteristic aberrations introduced by the on-axis collimated beam, respectively. When cos2α0 is not equal to cos2β0, two-dimensional wavefront of different scales at two directions occurs.
Fig. 6. Tangential (in solid lines) and sagittal (in dotted lines) ray aberrations enlarged by off-axis collimated beams of different field angles (a), and ratios between the exact and approximate enlarged scales (b).
#77352 - $15.00 USD Received 22 November 2006; revised 17 January 2007; accepted 20 February 2007
(C) 2007 OSA 19 March 2007 / Vol. 15, No. 6 / OPTICS EXPRESS 3039
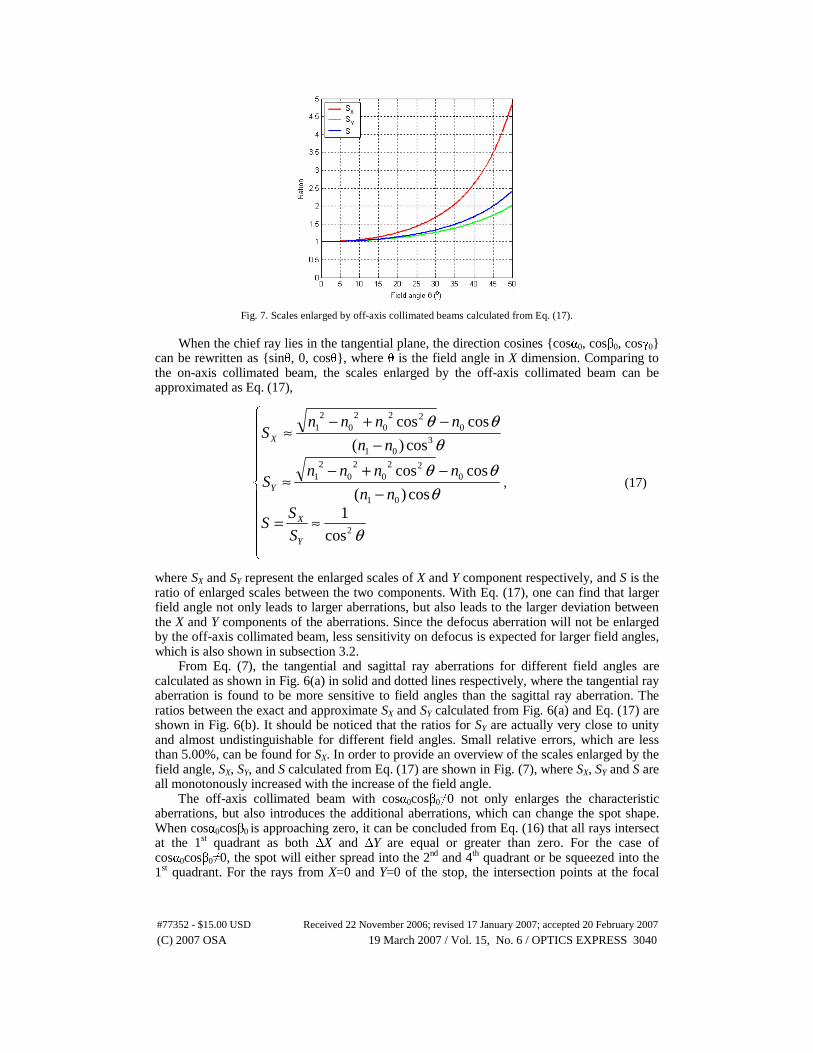
Fig. 7. Scales enlarged by off-axis collimated beams calculated from Eq. (17). When the chief ray lies in the tangential plane, the direction cosines {cosα0, cosβ0, cosγ0} can be rewritten as {sinθ, 0, cosθ}, where θ is the field angle in X dimension. Comparing to the on-axis collimated beam, the scales enlarged by the off-axis collimated beam can be approximated as Eq. (17),
⎪⎪⎪⎪
⎩
⎪⎪⎪⎪
⎨
⎧
≈=
−−+−
≈
−−+−
≈
cos
1cos)(
coscos
cos)(
coscos
2
01
022
02
02
1
301
022
02
02
1
θ
θθθ
θθθ
Y
X
Y
X
S
SS
nn
nnnnS
nn
nnnnS
, (17)
where SX and SY represent the enlarged scales of X and Y component respectively, and S is the ratio of enlarged scales between the two components. With Eq. (17), one can find that larger field angle not only leads to larger aberrations, but also leads to the larger deviation between the X and Y components of the aberrations. Since the defocus aberration will not be enlarged by the off-axis collimated beam, less sensitivity on defocus is expected for larger field angles, which is also shown in subsection 3.2. From Eq. (7), the tangential and sagittal ray aberrations for different field angles are calculated as shown in Fig. 6(a) in solid and dotted lines respectively, where the tangential ray aberration is found to be more sensitive to field angles than the sagittal ray aberration. The ratios between the exact and approximate SX and SY calculated from Fig. 6(a) and Eq. (17) are shown in Fig. 6(b). It should be noticed that the ratios for SY are actually very close to unity and almost undistinguishable for different field angles. Small relative errors, which are less than 5.00%, can be found for SX. In order to provide an overview of the scales enlarged by the field angle, SX, SY, and S calculated from Eq. (17) are shown in Fig. (7), where SX, SY and S are all monotonously increased with the increase of the field angle. The off-axis collimated beam with cosα0cosβ0≠0 not only enlarges the characteristic aberrations, but also introduces the additional aberrations, which can change the spot shape. When cosα0cosβ0 is approaching zero, it can be concluded from Eq. (16) that all rays intersect at the 1st quadrant as both ΔX and ΔY are equal or greater than zero. For the case of cosα0cosβ0≠0, the spot will either spread into the 2nd and 4th quadrant or be squeezed into the 1st quadrant. For the rays from X=0 and Y=0 of the stop, the intersection points at the focal
#77352 - $15.00 USD Received 22 November 2006; revised 17 January 2007; accepted 20 February 2007
(C) 2007 OSA 19 March 2007 / Vol. 15, No. 6 / OPTICS EXPRESS 3040
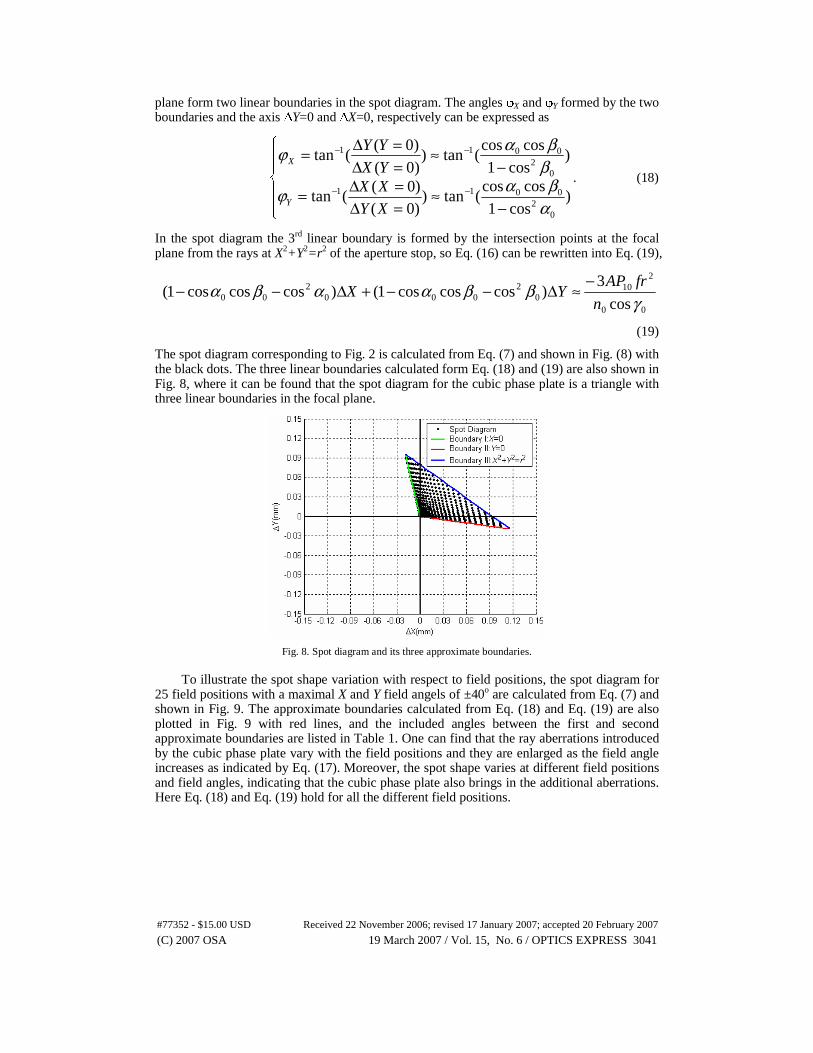
plane form two linear boundaries in the spot diagram. The angles φX and φY formed by the two boundaries and the axis ΔY=0 and ΔX=0, respectively can be expressed as
⎪⎪⎩
⎪⎪⎨
⎧
−≈
=Δ=Δ=
−≈
=Δ=Δ=
−−
−−
)cos1
coscos(tan)
)0(
)0((tan
)cos1
coscos(tan)
)0(
)0((tan
02
0011
02
0011
αβαϕ
ββαϕ
XY
XXYX
YY
Y
X
. (18)
In the spot diagram the 3rd linear boundary is formed by the intersection points at the focal plane from the rays at X2+Y2=r2 of the aperture stop, so Eq. (16) can be rewritten into Eq. (19),
00
210
02
0002
00 cos
3)coscoscos1()coscoscos1(
γββααβα
n
frAPYX
−≈Δ−−+Δ−−
(19)
The spot diagram corresponding to Fig. 2 is calculated from Eq. (7) and shown in Fig. (8) with the black dots. The three linear boundaries calculated form Eq. (18) and (19) are also shown in Fig. 8, where it can be found that the spot diagram for the cubic phase plate is a triangle with three linear boundaries in the focal plane.
Fig. 8. Spot diagram and its three approximate boundaries. To illustrate the spot shape variation with respect to field positions, the spot diagram for 25 field positions with a maximal X and Y field angels of ±40o are calculated from Eq. (7) and shown in Fig. 9. The approximate boundaries calculated from Eq. (18) and Eq. (19) are also plotted in Fig. 9 with red lines, and the included angles between the first and second approximate boundaries are listed in Table 1. One can find that the ray aberrations introduced by the cubic phase plate vary with the field positions and they are enlarged as the field angle increases as indicated by Eq. (17). Moreover, the spot shape varies at different field positions and field angles, indicating that the cubic phase plate also brings in the additional aberrations. Here Eq. (18) and Eq. (19) hold for all the different field positions.
#77352 - $15.00 USD Received 22 November 2006; revised 17 January 2007; accepted 20 February 2007
(C) 2007 OSA 19 March 2007 / Vol. 15, No. 6 / OPTICS EXPRESS 3041
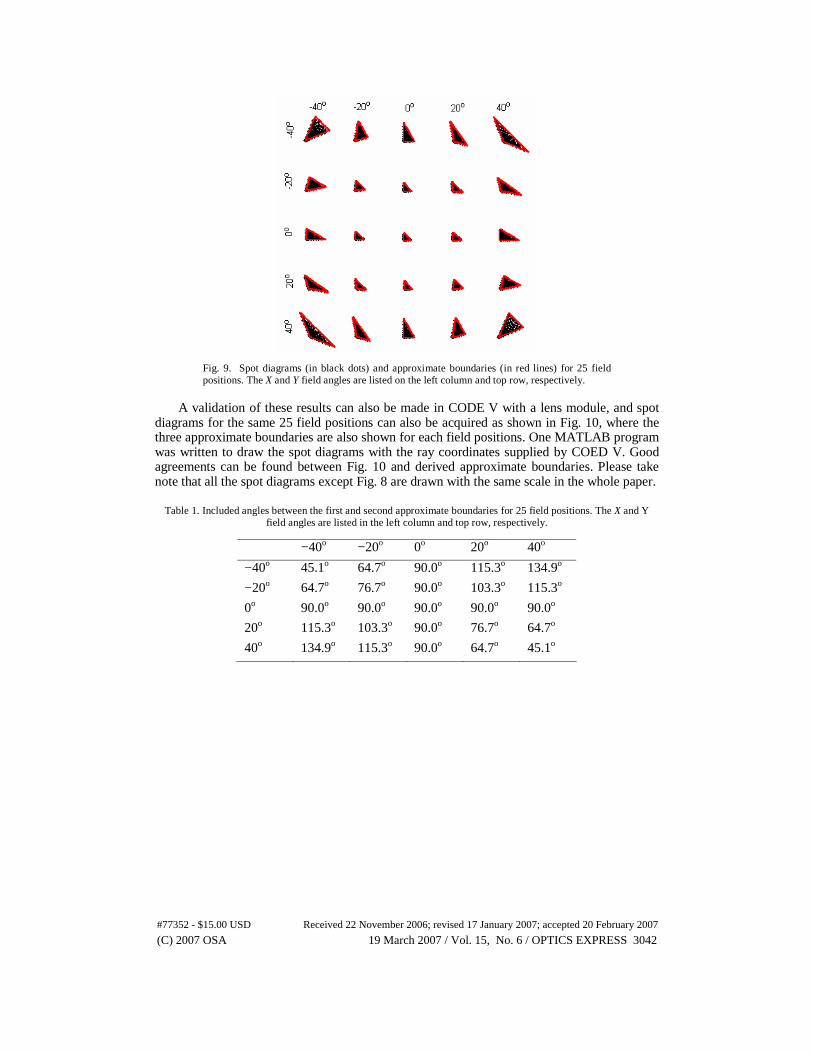
Fig. 9. Spot diagrams (in black dots) and approximate boundaries (in red lines) for 25 field positions. The X and Y field angles are listed on the left column and top row, respectively.
A validation of these results can also be made in CODE V with a lens module, and spot diagrams for the same 25 field positions can also be acquired as shown in Fig. 10, where the three approximate boundaries are also shown for each field positions. One MATLAB program was written to draw the spot diagrams with the ray coordinates supplied by COED V. Good agreements can be found between Fig. 10 and derived approximate boundaries. Please take note that all the spot diagrams except Fig. 8 are drawn with the same scale in the whole paper.
Table 1. Included angles between the first and second approximate boundaries for 25 field positions. The X and Y field angles are listed in the left column and top row, respectively.
−40o −20o 0o 20o 40o
−40o 45.1o 64.7o 90.0o 115.3o 134.9o
−20o 64.7o 76.7o 90.0o 103.3o 115.3o
0o 90.0o 90.0o 90.0o 90.0o 90.0o
20o 115.3o 103.3o 90.0o 76.7o 64.7o
40o 134.9o 115.3o 90.0o 64.7o 45.1o
#77352 - $15.00 USD Received 22 November 2006; revised 17 January 2007; accepted 20 February 2007
(C) 2007 OSA 19 March 2007 / Vol. 15, No. 6 / OPTICS EXPRESS 3042
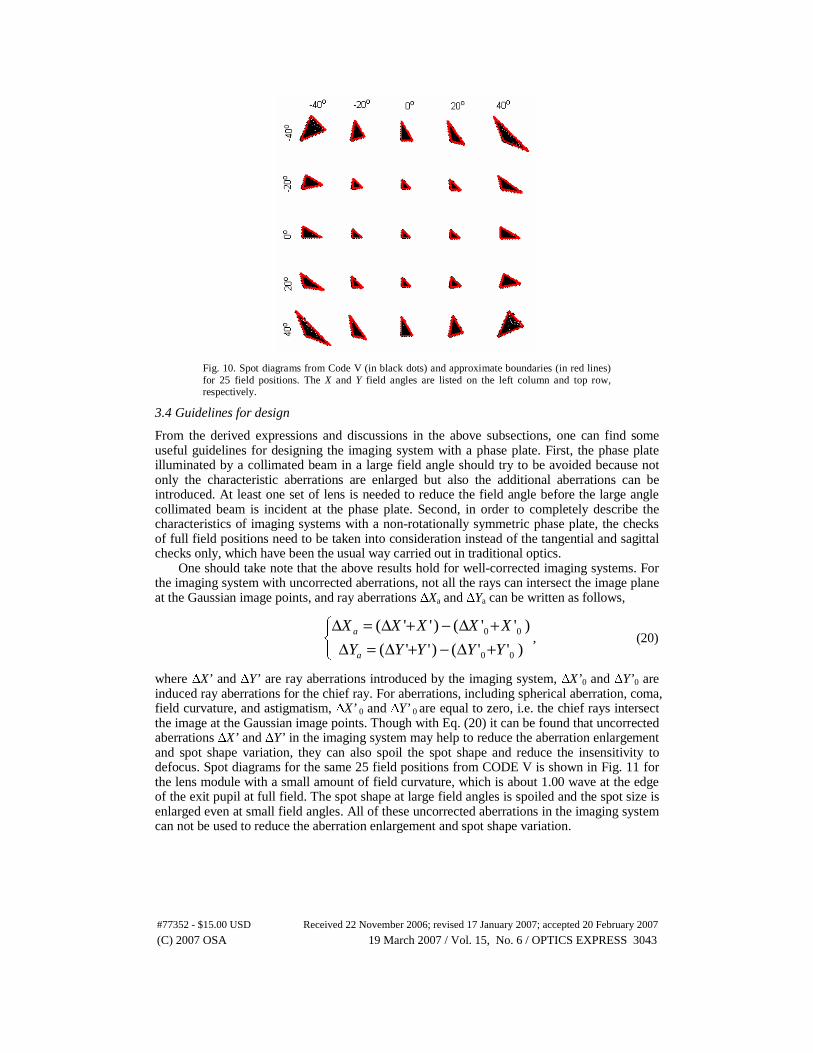
Fig. 10. Spot diagrams from Code V (in black dots) and approximate boundaries (in red lines) for 25 field positions. The X and Y field angles are listed on the left column and top row, respectively.
3.4 Guidelines for design
From the derived expressions and discussions in the above subsections, one can find some useful guidelines for designing the imaging system with a phase plate. First, the phase plate illuminated by a collimated beam in a large field angle should try to be avoided because not only the characteristic aberrations are enlarged but also the additional aberrations can be introduced. At least one set of lens is needed to reduce the field angle before the large angle collimated beam is incident at the phase plate. Second, in order to completely describe the characteristics of imaging systems with a non-rotationally symmetric phase plate, the checks of full field positions need to be taken into consideration instead of the tangential and sagittal checks only, which have been the usual way carried out in traditional optics. One should take note that the above results hold for well-corrected imaging systems. For the imaging system with uncorrected aberrations, not all the rays can intersect the image plane at the Gaussian image points, and ray aberrations ΔXa and ΔYa can be written as follows,
⎩⎨⎧
+Δ−+Δ=Δ+Δ−+Δ=Δ
)''()''(
)''()''(
00
00
YYYYY
XXXXX
a
a, (20)
where ΔX’ and ΔY’ are ray aberrations introduced by the imaging system, ΔX’0 and ΔY’0 are induced ray aberrations for the chief ray. For aberrations, including spherical aberration, coma, field curvature, and astigmatism, ΔX’ 0 and ΔY’ 0 are equal to zero, i.e. the chief rays intersect the image at the Gaussian image points. Though with Eq. (20) it can be found that uncorrected aberrations ΔX’ and ΔY’ in the imaging system may help to reduce the aberration enlargement and spot shape variation, they can also spoil the spot shape and reduce the insensitivity to defocus. Spot diagrams for the same 25 field positions from CODE V is shown in Fig. 11 for the lens module with a small amount of field curvature, which is about 1.00 wave at the edge of the exit pupil at full field. The spot shape at large field angles is spoiled and the spot size is enlarged even at small field angles. All of these uncorrected aberrations in the imaging system can not be used to reduce the aberration enlargement and spot shape variation.
#77352 - $15.00 USD Received 22 November 2006; revised 17 January 2007; accepted 20 February 2007
(C) 2007 OSA 19 March 2007 / Vol. 15, No. 6 / OPTICS EXPRESS 3043
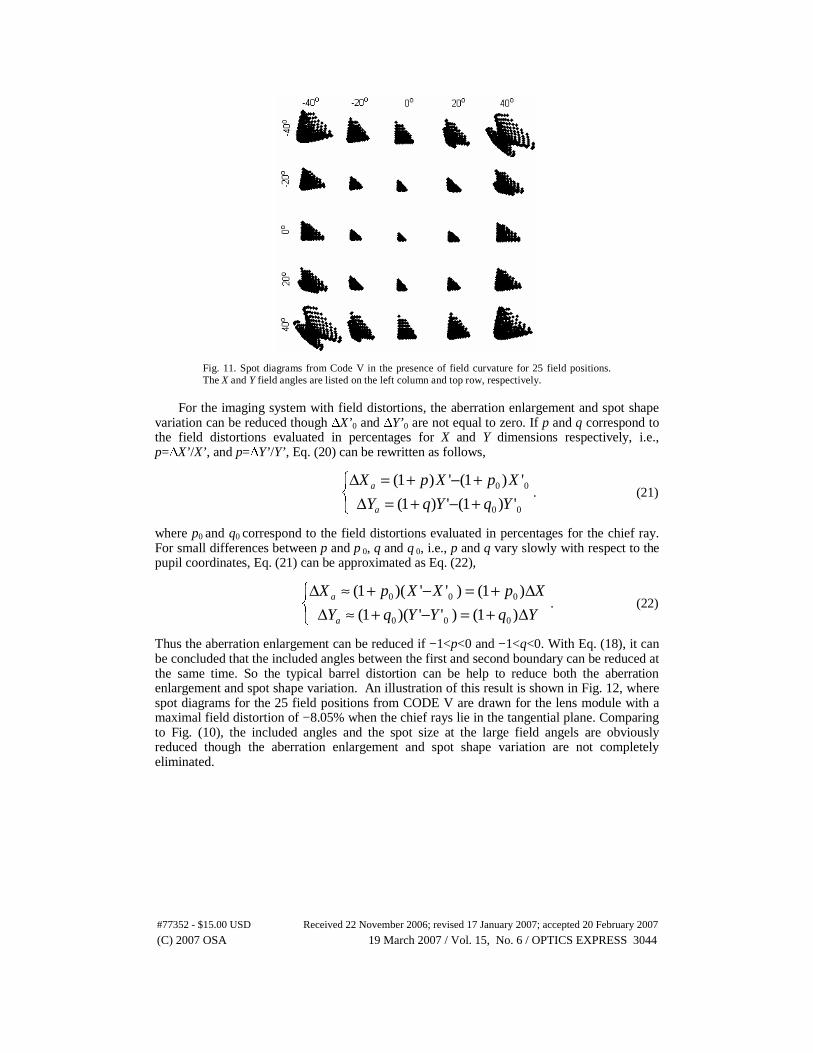
Fig. 11. Spot diagrams from Code V in the presence of field curvature for 25 field positions. The X and Y field angles are listed on the left column and top row, respectively.
For the imaging system with field distortions, the aberration enlargement and spot shape variation can be reduced though ΔX’0 and ΔY’0 are not equal to zero. If p and q correspond to the field distortions evaluated in percentages for X and Y dimensions respectively, i.e., p=ΔX’/X’, and p=ΔY’/Y’, Eq. (20) can be rewritten as follows,
⎩⎨⎧
+−+=Δ+−+=Δ
00
00
')1(')1(
')1(')1(
YqYqY
XpXpX
a
a. (21)
where p0 and q0 correspond to the field distortions evaluated in percentages for the chief ray. For small differences between p and p 0, q and q 0, i.e., p and q vary slowly with respect to the pupil coordinates, Eq. (21) can be approximated as Eq. (22),
⎩⎨⎧
Δ+=−+≈ΔΔ+=−+≈ΔYqYYqY
XpXXpX
a
a
)1()'')(1(
)1()'')(1(
000
000. (22)
Thus the aberration enlargement can be reduced if −1<p<0 and −1<q<0. With Eq. (18), it can be concluded that the included angles between the first and second boundary can be reduced at the same time. So the typical barrel distortion can be help to reduce both the aberration enlargement and spot shape variation. An illustration of this result is shown in Fig. 12, where spot diagrams for the 25 field positions from CODE V are drawn for the lens module with a maximal field distortion of −8.05% when the chief rays lie in the tangential plane. Comparing to Fig. (10), the included angles and the spot size at the large field angels are obviously reduced though the aberration enlargement and spot shape variation are not completely eliminated.
#77352 - $15.00 USD Received 22 November 2006; revised 17 January 2007; accepted 20 February 2007
(C) 2007 OSA 19 March 2007 / Vol. 15, No. 6 / OPTICS EXPRESS 3044
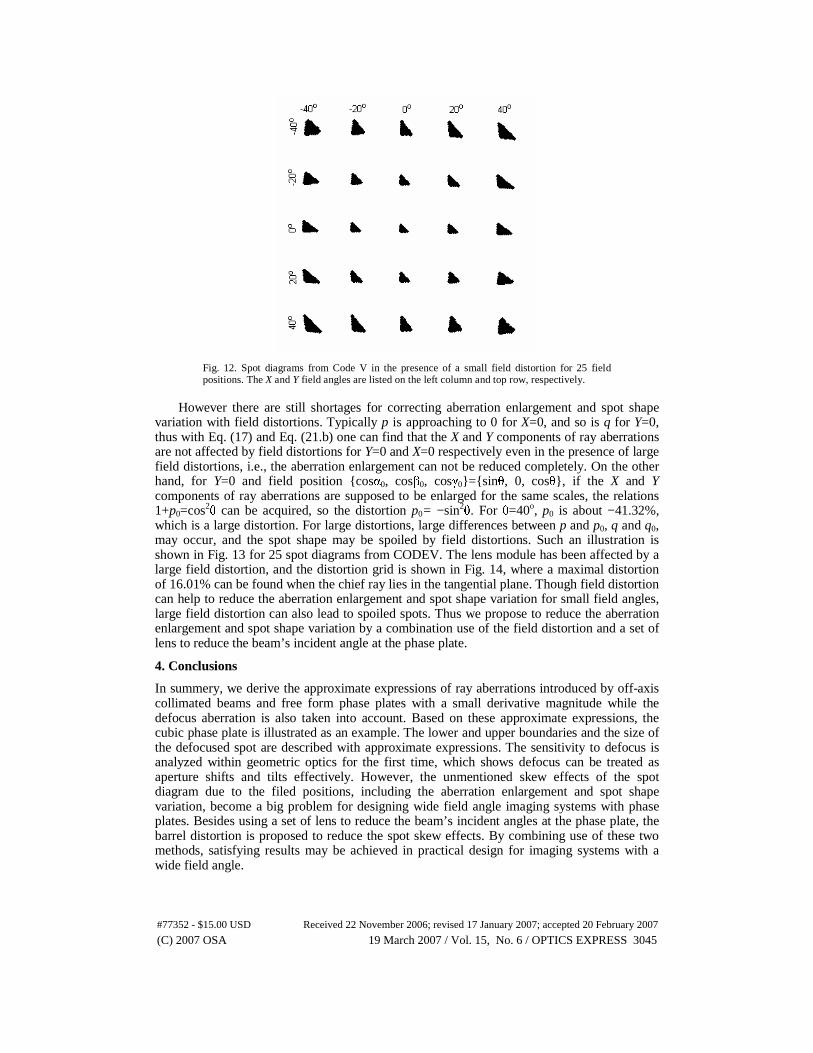
Fig. 12. Spot diagrams from Code V in the presence of a small field distortion for 25 field positions. The X and Y field angles are listed on the left column and top row, respectively.
However there are still shortages for correcting aberration enlargement and spot shape variation with field distortions. Typically p is approaching to 0 for X=0, and so is q for Y=0, thus with Eq. (17) and Eq. (21.b) one can find that the X and Y components of ray aberrations are not affected by field distortions for Y=0 and X=0 respectively even in the presence of large field distortions, i.e., the aberration enlargement can not be reduced completely. On the other hand, for Y=0 and field position {cosα0, cosβ0, cosγ0}={sinθ, 0, cosθ}, if the X and Y components of ray aberrations are supposed to be enlarged for the same scales, the relations 1+p0=cos2θ can be acquired, so the distortion p0= −sin2θ. For θ=40o, p0 is about −41.32%, which is a large distortion. For large distortions, large differences between p and p0, q and q0, may occur, and the spot shape may be spoiled by field distortions. Such an illustration is shown in Fig. 13 for 25 spot diagrams from CODEV. The lens module has been affected by a large field distortion, and the distortion grid is shown in Fig. 14, where a maximal distortion of 16.01% can be found when the chief ray lies in the tangential plane. Though field distortion can help to reduce the aberration enlargement and spot shape variation for small field angles, large field distortion can also lead to spoiled spots. Thus we propose to reduce the aberration enlargement and spot shape variation by a combination use of the field distortion and a set of lens to reduce the beam’s incident angle at the phase plate.
4. Conclusions
In summery, we derive the approximate expressions of ray aberrations introduced by off-axis collimated beams and free form phase plates with a small derivative magnitude while the defocus aberration is also taken into account. Based on these approximate expressions, the cubic phase plate is illustrated as an example. The lower and upper boundaries and the size of the defocused spot are described with approximate expressions. The sensitivity to defocus is analyzed within geometric optics for the first time, which shows defocus can be treated as aperture shifts and tilts effectively. However, the unmentioned skew effects of the spot diagram due to the filed positions, including the aberration enlargement and spot shape variation, become a big problem for designing wide field angle imaging systems with phase plates. Besides using a set of lens to reduce the beam’s incident angles at the phase plate, the barrel distortion is proposed to reduce the spot skew effects. By combining use of these two methods, satisfying results may be achieved in practical design for imaging systems with a wide field angle.
#77352 - $15.00 USD Received 22 November 2006; revised 17 January 2007; accepted 20 February 2007
(C) 2007 OSA 19 March 2007 / Vol. 15, No. 6 / OPTICS EXPRESS 3045
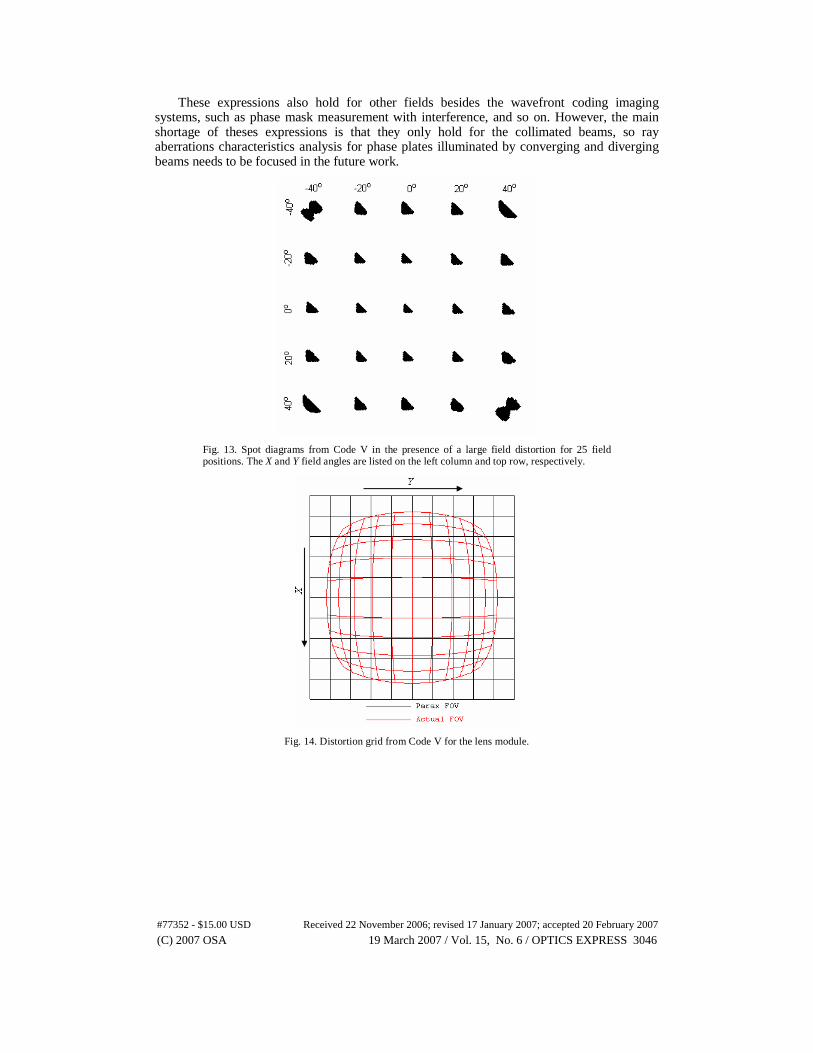
These expressions also hold for other fields besides the wavefront coding imaging systems, such as phase mask measurement with interference, and so on. However, the main shortage of theses expressions is that they only hold for the collimated beams, so ray aberrations characteristics analysis for phase plates illuminated by converging and diverging beams needs to be focused in the future work.
Fig. 13. Spot diagrams from Code V in the presence of a large field distortion for 25 field positions. The X and Y field angles are listed on the left column and top row, respectively.
Fig. 14. Distortion grid from Code V for the lens module.
#77352 - $15.00 USD Received 22 November 2006; revised 17 January 2007; accepted 20 February 2007
(C) 2007 OSA 19 March 2007 / Vol. 15, No. 6 / OPTICS EXPRESS 3046