Perforated cover plates for steel columns
22
u. S. DEPARTMENT OF COMMERCE NATIONAL BUREAU OF STANDARDS RESEARCH PAPER RP1473 Part of Journal of Research of the National Bureau of Standards, Volume 28, June 1942 PERFORATED COVER PLATES FOR STEEL COLUMNS: PROGRAM AND TEST METHODS By Ambrose H. Stang and Martin Greenspan ABSTRACT Tests were made to determine the mechanical properties of perforated cover plates intended to be used as a substitute for lattice bars or batten plates in built-up box-type columns. Each test column was built up from one perforated plate and either two or four angles. Columns with unperforated plates were used as controls. In this paper the program is outlined and the methods of test are described. The results of the tests and the conclusions will be presented in subsequent papers. CONTENTS Page I. Introduction_ ______________ _____________________________ _______ 670 II. Cover-plate columns _____ ____ ___ __ ________ ______________________ 671 1. MateriaL ______ _______________________ _____________ _____ 671 2. Cover plates and angles ________________ ___________________ 671 3. Preparation of the plates and angles __________ ______ ________ 675 4. Dimensions _ _ _ ______ ___________________________ _________ 676 5. Areas ___ ___________________________ ___ _____________ __ ___ 676 6. Column-testing program _____ __________ _______________ ____ 676 (a) Columns loaded in the elastic range _________________ 676 (b) Columns for maximum loads _____ ___ ___ ____ __ ______ 677 III. Coupons and method of test- ___________ _________________ _____ ___ 677 IV. Procedure for columns loaded in the elastic range ___ __________ ____ __ 678 1. Bolting the plates and angles __ _______ __ _____ __ ______ __ ____ 678 2. Testing procedure ___________ _________________________ ____ 678 (a) Compressometers ___________________ __ ___ __ _______ 678 (b) Correction of shortening for changes in temperature ___ 679 (c) Loading __________________ __ __ ___ __ ______ _____ ___ 679 3. Modulus of the columns __ ___________ _____________________ 679 4. Effective area of the perforated plate _______________________ 680 5. Strains ______________________________ ___ ___ ______ _______ 680 (a) GeneraL ___ _____________________ ________________ 680 (b) On the edge of the perforation _____________________ 680 (c) On the surfaces of the perforated plate ______________ 681 (d) On the angles _________ ___________________________ 682 (e) Strain for unit load __________ __ ______ ____ ___ ______ 682 6. Strains at a point ______________ __________________________ 682 7. Principal stresses ___________ ______ ________________________ 683 (a) General _________________ ___ ________________ _____ 683 (b) On the edge of the perforation __ _____ _____ _________ 683 (c) On the surfaces of the perforated plate ______________ 684 (d) On the angles ________ _____ ___ __ ___ ___ ____ ________ 684 V. Procedure for maximum-load tests of columns _____ ________ _________ 685 1. Testing procedure __ ___________________________________ ___ 685 (a) Centering the column ___ __________________________ 685 (b) Axial shortenings _________________________________ 685 (c) Defiections ______________________________________ 685 (d) Maximum load _______________________ ____________ 685 2. Effective area of plate ____________________________________ 685 VI. References _______________________________ ______________________ 686 669
-
Upload
khangminh22 -
Category
Documents
-
view
1 -
download
0
Transcript of Perforated cover plates for steel columns

u. S. DEPARTMENT OF COMMERCE NATIONAL BUREAU OF STANDARDS
RESEARCH PAPER RP1473
Part of Journal of Research of the National Bureau of Standards, Volume 28, June 1942
PERFORATED COVER PLATES FOR STEEL COLUMNS: PROGRAM AND TEST METHODS
By Ambrose H. Stang and Martin Greenspan
ABSTRACT
Tests were made to determine the mechanical properties of perforated cover plates intended to be used as a substitute for lattice bars or batten plates in built-up box-type columns. Each test column was built up from one perforated plate and either two or four angles. Columns with unperforated plates were used as controls.
In this paper the program is outlined and the methods of t est are described. The results of the tests and the conclusions will be presented in subsequent papers.
CONTENTS Page
I. Introduction_ _ _ _ _ _ _ _ _ _ _ _ _ _ _ _ _ _ _ _ _ _ _ _ _ _ _ _ _ _ _ _ _ _ _ _ _ _ _ _ _ _ _ _ _ _ _ _ _ _ _ 670 II. Cover-plate columns _____ ____ ___ __ ________ ______________________ 671
1. MateriaL ______ _______________________ _____________ _____ 671 2. Cover plates and angles ________________ ___________________ 671 3. Preparation of the plates and angles __________ ______ ________ 675 4. Dimensions _ _ _ _ _ _ _ _ _ _ _ _ _ _ _ _ _ _ _ _ _ _ _ _ _ _ _ _ _ _ _ _ _ _ _ _ _ _ _ _ _ _ _ _ _ 676 5. Areas ___ ___________________________ ___ _____________ __ ___ 676 6. Column-testing program _____ __________ _______________ ____ 676
(a) Columns loaded in the elastic range _________________ 676 (b) Columns for maximum loads _____ ___ ___ ____ __ ______ 677
III. Coupons and method of test- _ _ _ _ _ _ _ _ _ _ _ _ _ _ _ _ _ _ _ _ _ _ _ _ _ _ _ _ _ _ _ _ _ _ _ _ 677 IV. Procedure for columns loaded in the elastic range ___ __________ ____ __ 678
1. Bolting the plates and angles __ _______ __ _____ __ ______ __ ____ 678 2. Testing procedure ___________ _________________________ ____ 678
(a) Compressometers ___________________ __ ___ __ _______ 678 (b) Correction of shortening for changes in temperature ___ 679 (c) Loading __________________ __ __ ___ __ ______ _____ ___ 679
3. Modulus of the columns __ ___________ _____________________ 679 4. Effective area of the perforated plate _______________________ 680 5. Strains ______________________________ ___ ___ ______ _______ 680
(a) GeneraL ___ _____________________ ________________ 680 (b) On the edge of the perforation _____________________ 680 (c) On the surfaces of the perforated plate ______________ 681 (d) On the angles _________ ___________________________ 682 (e) Strain for unit load __________ __ ______ ____ ___ ______ 682
6. Strains at a point ______________ __________________________ 682 7. Principal stresses ___________ ______ ________________________ 683
(a) General _________________ ___ ________________ _____ 683 (b) On the edge of the perforation _ _ _ _ _ _ _ _ _ _ _ _ _ _ _ _ _ _ _ _ _ 683 (c) On the surfaces of the perforated plate ______________ 684 (d) On the angles ________ _____ ___ __ ___ ___ ____ ________ 684
V. Procedure for maximum-load tests of columns _____ ________ _________ 685 1. Testing procedure __ ___________________________________ ___ 685
(a) Centering the column ___ __________________________ 685 (b) Axial shortenings _________________________________ 685 (c) Defiections ______________________________________ 685 (d) Maximum load _______________________ ____________ 685
2. Effective area of plate ____________________________________ 685 VI. References _______________________________ ______________________ 686
669
670 Journal of Research of the National Bureau of Standards
I. INTRODUCTION
The established practice in the design of compression members of bridge trusses has been to construct such members of a box-type cross section; and the custom of designers, until recently, has been to use two channels with a cover plate on one side and lattice bracing or battens on the other, or a similar construction with four angles and two web plates in place of tho channel sections. Latticing and battening for such members have been used merely to brace the flanges of the channels or angles and to resist longitudinal shear along the axis of the member, and not as being effective in resisting either moment or thrust.
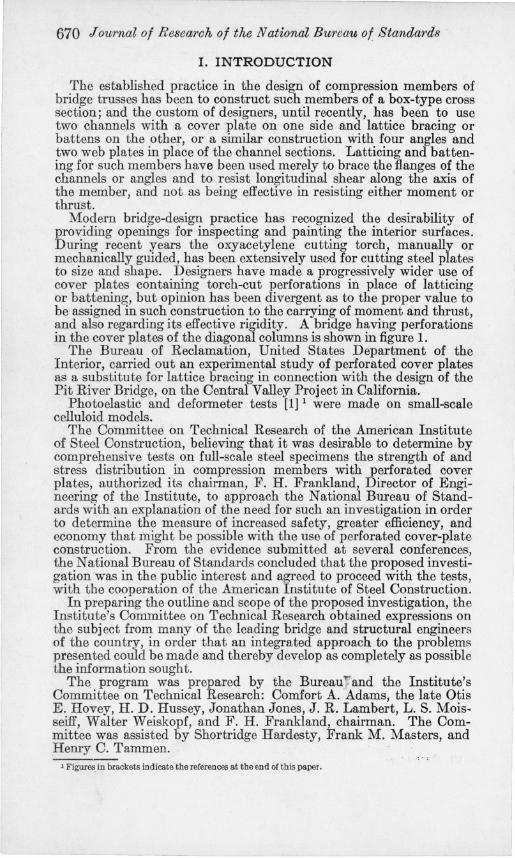
Modern bridge-design practice has recognized the desirability of providing openings for inspecting and painting the interior surfaces. During recent years the oxyacetylene cutting torch, manually or mechanically guided, has been extensively used for cutting steel plates to size and shape. Designers have made a progressively wider use of cover plates containing torch-cut perforations in place of latticing or battening, but opinion has been divergent as to the proper value to be assigned in such construction to the carrying of moment and thrust, and also regarding its effective rigidity. A bridge having perforations in the cover plates of the diagonal columns is shown in figure 1.
The Bureau of Reclamation, United States Department of the Interior, carried out an experimental s,tudy of perforated cover plates as a substitute for lattice bracing in connection with the design of the Pit River Bridge, on the Central Valley Project in California.
Photo elastic and deformeter tests [1] 1 were made on small-scale celluloid models.
The Committee on Technical Research of the American Institute of Steel Construction, believing that it was desirable to determine by comprehensive tests on full-scale steel specimens the strength of and stress distribution in compression members with perforated cover plates, authorized its chairman, F. H. Frankland, Director of Engineering of the Institute, to approach the National Bureau of Standards with an explanation of the need for such an investigation in order to determine the measure of increased safety, greater efficiency, and economy that might be possible with the use of perforated cover-plate construction. From the evidence submitted at several conferences, the National Bureau of Standards concluded that the proposed investigation was in the public interest and agreed to proceed with the tests, with the cooperation of the American Institute of Steel Construction.
In preparing the outline and scope of the proposed investigation, the Institute's Committee on Technical Research obtained expressions on the subject from many of the leading bridge and structural engineers of the country, in order that an integrated approach to the problems presented could be made and thereby develop as completely as possible the information sought.
The program was prepared by the Bureau r and the Institute's Committee on Technical Research: Comfort A.Adams, the late Otis E. Hovey, H. D. Hussey, Jonathan Jones, J. R. Lambert, L. S. Moisseiff, Walter Weiskopf, and F. H. Frankland, chairman. The Committee was assisted by Shortridge Hardesty, Frank M. Masters, and Henry C. Tammen.
J Figures in brackets indicate the references at the end of this paper.

r-~--- --- ,,,-- - - - -v--- _ . - ~ -- -
Journal of Research of the National Bureau of Standards
,
I
r
l_~~ FIGURE l.- Bl'idge over the Delawal'e RiveT from Easton, Pa. to Phillipsburg, N. J.
Note perforated cover plates.
~5
Res~arch Paper 1473
Perforated Cover Plates 671
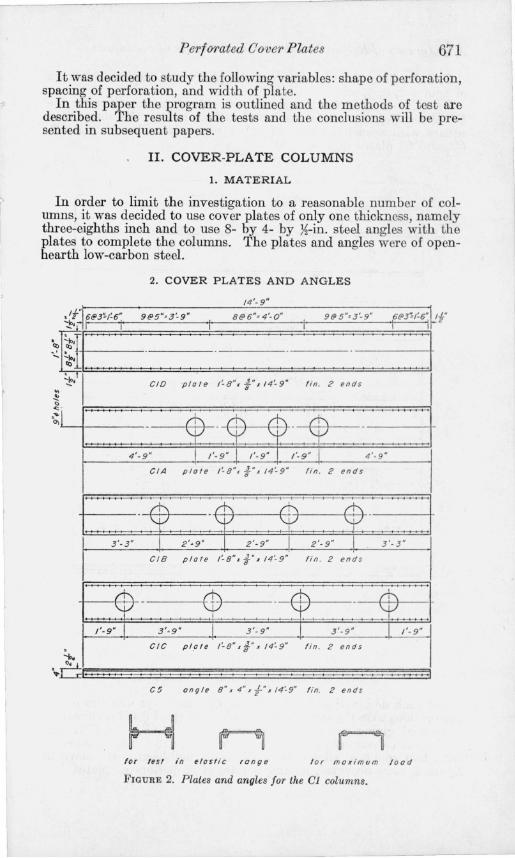
It was decided to study the following variables: shape of perforation, spacing of perforation, and width of plate.
'" In this paper the program is outlined and the methods of test are described. The results of the tests and the conclusions will be presented in subsequent papers.
II. COVER,PLATE COLUMNS
1. MATERIAL
In order to limit the investigation to a reasonable number of columns, it was decided to use cover plates of only one thickness, namely three-eighths inch and to use 8- by 4- by X-in. steel angles with the plates to complete the columns. The plates and angles were of openhearth low-carbon steel.
2. COVER PLATES AND ANGLES
14'· g"
8@6"z4'·O" I
9@S"'3',9"
::'.: ::.-:: fin . 2 ends
i th .-$ th .~ ,
"t' '-V 'Y 4',9" I 1', g" I 1', 9" I 1'·9" I 4',9"
CIA plale 1 ~8"x /"x 14 ~9" fin. 2 ends
, , , , , .~
I' ~ I' t'\ \. V \. V .~ .'V
3'·3" 2"9" 2',9" 1 2'·9" I 3',3"
CIS plale 1~8"x /" x 14~9" lin. 2 ends
tf\ ~ ,
r+; ,
(' !\ 'V \.. V '-P
1"9" I 3"9" I 3"9" ,3',g" I 1', g"
. CIC plale 1~8" x j" x 14~9" fin. 2 ends
--J..
Gil I , I CS angle 8"x 4"xf"xI4~9" f in. 2 ends
H , tor .test in elastic range f or maximum l o a d
FIGURE 2. Plates and angles for the Cl columns.

672 Journal of R e8earch of the National Bureau of Sta1Ulard8
The details and designations of the plates: and anglesFare shown in figures 2, 3, 4, and 5.
Two shapes of perforation were used; circular perforations for the ':( 01 plates (fig. 2), and ovaloid perforations having the shape of a square with semicircles erected on two opposite sides for the 02, 03, and 04 plates (figs. 3, 4, 5).
C2A plole /'-3", f " 114'-9" fin. 2 ends
C28 plote /'-3", j", 14'-9" fin. 2 ends
C2C plate /-3" 1/" I 14'-9" fin . 2 ends
H n n lor lest ill elas.tic range' lor max/mum lood
FIGURE 3. Plates and angles for the C2 columns.
For each designation 01, 02, 03, or 04, the shape and size of the perforations were the same, but three different spacings of perforations were used, giving rise to the designations OIA, OIB, 010, 02A, etc.
For each designation OIA, OIB, etc., three like plates, together with two coupons, all cut from the same mill-length, as shown in figure 6, were provided, making a total of 36 perforated plates.

l
Perforated Cover Plates 673
There were three different widths of plates, namely 15,20, and 25~ in. , the 01 plates (fig. 2) and the 03 plates (fig. 4) being both 20 in. wide. The ratio of the net to the gross cross-sectional area was 55 percent for all the perforated plates. A suggestion that the program
C3A plate I'- e" x iN x 14'-9" fin . 2 e nds
I'"'' "'4f"~~4:f:·R::±"£: : : :' B: : : :'.':::1 .: " " '" : ,6. , =i81, , "GEfj" ",=:I" 3 ' -11" 1 ~ 2'-0" ~ I· 2'-0" ~ J 3'-1f'
C3B plate I'-e" xi"x 14'- 9" fin . 2 ends
E~f~i§k~<': :~:::: ih@:::::::1 ~ l:J ~
2 '-If" I'_fi" 3'-0" /-6" 3'-0" /-6' 2'-1/'
C3C plate 1'-8"x-j" xI4'-9" · fin . 2 ends
H ; r for test in elasti c range lor maNimlJm lood
FIGURE 4. Plates and angles for th( C3 columns.
be extended to include plates of various net to gross area ratios is being considered.
Three unperforated plates of each of; these three widths were also provided, or nine lmperforated plates in all. The OlD plates shown in figure 2 are the same plates as the 03D plates shown in figure 4.

674 Journal of Researoh of the National Bureau of Standards
The nomenclature for the various plates and angles is shown in figures 2 to 6, Thus the plate having round holes, with a perforation spacing of 2 ft 9 in, and taken from the middle of the mill-length
14' -9"
1..(."' " , " "I I' " ~-i6"'3 "~1~6' 9@5"~3'-9" 8@6"~ 4'-0" . 9@5 '3-9 6@3./-6"f-lz
! it • ' • I .-.- , • ~ • ' I • ' • • • • • I , : :" ,. I , : , J :t"', C40 plOle 2'-/f, i "' 14'-9" f i n . 2 ends ,
I. '. '. '.' ,. ' .• '5~,"R,~5;.R.nl • r •••• ~ ••• ' •• ' '. :1 , , , , , ,rtd1 : fEB . S;jj, . , , "" " IWJ Jl1:JJ JWI 3'-6" I'-~/" 1'-0" 1'-:/" 1'-0" 1'-11" 3'-6"
C4A pl.ole 2'-1';",//,14'-9" fin . 2 ends
E~ft~: @©B • ~ft·3 I"FI I"FI I//FI
2 '- 6 " 1'- // " 2'-0' 1'-//' 2 '-0" 1'-//" 2'-6"
C48 plole 2',1';' ,-1",14'-9' f i n . 2 ends
1"1'1 I I w I 1//1"1 2"
/'-6" 1'-,," 3'-0' 1'-,,' 3'- 0" 1'-11" 1'-6"
C4C plole 2'.1/" Ai" .114 '· 9- · fin . 2 ends
Itl I I I I I I I t I I I I I I I J I I Ij
C5 onllle S",4",f ' ,14'-9" f i n. 2 ends
r , for /esl in elgs/it: "anile for maximum load
FIGURE 5, Plates~and angles for the C4 columns,
is designated as plate 01B(2-3), Coupons from portions of the plate adjacent to plate 01B(2-3) are designated as coupons 01B(1-2) and 01 B (3-4) ,

I
l
Perforated Gover Plates 675
The columns will be identified by the designation of the plate, followed by the item (two angles) or (four angles).
3. PREPARATION OF THE PLATES AND ANGLES
The Bethlehem Steel Company furnished the material for the specimens. The shop operations in preparing the material were carried out under the supervision of M. S. Bachman, Field Representative of that company.
The plates and angles were individually cut to length and drilled for bolts so that each angle could be used in conjunction with any plate. The number of angles required was thus greatly reduced.
The usual procedure in preparing test columns is to'l'mill the ends of the columns after assembly. A secondary object of this investigation was to determine under what conditions columns assembled
I:
r piaU}
angle
14~9'
CIA 10-IJ
14~9"
C5A IO-IJ
2'0' I I' rr CIA (1- 2)
2:0'
CSA f/-2J
48'-3"
14~9"
CIA 12-3J
48'-3"
14~9"
C5A {2-3J
2'0' I I
TT CIA
13-4)
2'0'
C5A 13-4J
CIA 14-S)
14'-9"
C5A {4-5J
FIGURE 6. Typical cutting diagrams for the plate and angle material.
from individually machined components are suitable for test purposes. The material for the plates and angles, each 14 ft 9 in. finished
length, was in multiples of three main sections, with sufficient added length for two pieces each 2 ft long for coupons. Thus from each mill-length, five pieces properly identified by marking and stenciling were cut, as shown in figure 6.
The sheared lengths to which this material was cut allowed threeeighths inch at each end for finish. The perforations, where required, were burned out and finished to Hhe dimensions shown in figures 2,3,4, and 5. The burning of these holes was performed with an oxyacetylene torch, the torch being controlled mechanically by a Radiograph. The holes were then smoothed up with a portable power grinder.
The plates were roll-straightened and all the material was checked for good alinement. All the plates and angles were then premilled, allowing one-sixteenth inch at each end for a subsequent finish cut. Bolt holes in the 14-ft 9-in. pieces were drilled from the solid, using a master drilling templet for the purpose. The material was again checked for accuracy of spacing.
676 Journal of R esearch of the National Bureau of Standards
The finishing cuts were made on a milling machine, and the members were doweled to a jig fastened on the table of the milling machine to produce an accurate end gage of holes on all the pieces alike. As a further precaution, the ends from which all the pieces were initially set for milling were identified by marking for assembly purposes.
4. DIMENSIONS
The thickness of each plate was measured at 5 points along each end, and the 10 r eadings were averaged. The readings were taken with a micrometer caliper, being estimated to 0.0001 in.
The width of each plate was measured at five locations along the length, using a special outside caliper provided with two micrometer dial gages. The contact points of the gages were in contact, one with each edge of the plate at midthickness. The width of the plate was determined from the micrometer dial gage readings when in contact with the plate edges as compared with the readings when in contact with the ends of an inside micrometer caliper having a known length. The five plate-width readings, taken to 0.001 in., were averaged.
The lengths of the plates were measured with a steel tape. The dimensions of the perforations were measured with inside
micrometer calipers. The diameters of 16 of the bolt holes in each plate were measured
with a telescoping gage and micrometer caliper. The plates were weighed. Similar measurements were made on the angles.
S. AREAS
Factors of stress concentration, column efficiencies, and other properties of perforated columns may be based on either the gross cross-sectional area or the net cross-sectional area. Elasticians commonly use the gross area, whereas many engineers prefer to use the net area. In these reports the results will be given both ways.
The gross area of the plate was taken as the product of the average thickness by the average gross width, no deduction being made for bolt holes or perforations.
The net width of the plate was taken as the gross width minus the average of the widths of all the perforations, no deduction being made for bolt holes. The net area of the plate was taken as the product of the average thickness by the average net width.
The cross-sectional area of the angles was obtained by multiplying the average thickness by the factor (the sum of the average widths of the two legs minus the average thickness), no deduction being made for bolt holes.
The gross area, A, of a column was then the sum of the gross area of the plate and the areas of the component angles.
The net area, An, of a column was the sum of the net area of the plate and the areas of the component angles.
6. COLUMN-TESTING PROGRAM
(a) COLUMNS LOADED IN THE ELASTIC RANGE
Each of the 36 perforated and 9 unperforated plates, with 2 angles and with 4 angles bolted to the plate, as shown at the bottom of figures 2, 3, 4, and 5, was subjected to compressive tests in the elastic

Perforated Cover Plate8 677
range. The angles used with the various plates were taken at random from those furnished. No difficulty in bolting the plates and the angles together was experienced.
The bolts were 1 in. in diameter, 3 in. long, and threaded 2 in. with %-in. National Coarse threads. The bodies were turned to a diameter of 0.917 in. Steel washers three-eighths inch thick were used under the nuts. The bolt holes were about 0.94 in. in diameter, so that they were not completely filled by the bolts even when the columns were under load.
(b) COLUMNS FOR MAXIMUM LOADS
After the tests in the elastic range had been completed, specimens consisting of a plate and the two angles which had been bolted to it were riveted at the plant of the Barber & Ross Co. and subjected to maximum compressive-load tests. Some of the rivets were driven before all of the bolts were removed, so that the alinement of the plate and angles was not disturbed. Maximum load tests were performed on one two-angle column of each group of three like twoangle columns. Twelve columns contained perforated plates and three columns unperforated plates.
III. COUPONS AND METHOD OF TEST
A coupon was cut in the direction of rolling from each 2-foot piece of material (fig. 6). The coupons were 16 in. long, 2.5 in. wide, and of the thickness of the material as rolled. They had parallel edges throughout their length.
The coupons were tested in the elastic range in tension in a horizontal hydraulic testing machine. The axial strains were measured on four gage lines, two on each side of the coupon, and each located halfway between an edge and the midwidth of the coupon. The strains were measured by means of Tuckerman optical strain gages [2], 2-in. gage length. Readings were estimated to 2X 10⁻⁶ in.
Strain-gage readings were taken at an initial stress (Tb and at integral multiples of (TI, (T, (i= l, 2, 3, ... , n). Young's modulus of elasticity, E, for the coupons was calculated from the stress and axialstrain data by the method of least squares, using the formula 2
(T n3-n E=..2 , 6 n n 2L:iEj-(n+1)L:Ej
(1)
;=1 ;=1
where each Ej is the average axial strain corresponding to the stress (Tj.
Transverse strains at midlength of the coupons were also measured by means of Tuckerman optical strain gages, 2-in. gage length, one on each side of the specimen. Poisson's ratio, P, for the coupons was calculated from the Young's modulus of elasticity, and the stress and the transverse-strain data by the method of least squares, using the formula
n n
6E 2t;tiE/ - (n+1)t;tE/ p=-- ,
(Tl n3-n (2)
• Equation 1 was derived on the assumption that the stress values were not subject to error Bnd was thus not strictly applicable to these data. However, the departure of the data from a straight line was so small a8 to cause the moduli computed from eq 1 to be not significantly different from those computed from the more cumbersome formula derived on the assumption that both the load and strain data were subject to error.

678 JO'lJ'lf'nal of Resem"ch of the National Bureau of Standards
where each E'i was the average transverse strain corresponding to the stress IT i.
The yield point, tensile strength, and elongation in 8 in. were determined in a vertical hydraulic testing machine.
The yield point was determined by the drop-of-beam method. The rate of strain was approximately 0.0005/min. until the yield point was reached, then 0.0015/min. until fracture.
Chemical analyses for carbon, manganese, phosphorus, and sulfur were made on composite samples of the steel for each of 01, 02, 03, 04, and 05.
IV. PROCEDURE FOR COLUMNS LOADED IN THE ELASTIC RANGE
1. BOLTING THE PLATES AND ANGLES
The plates and angles for the columns were bolted together before the column was placed in the testing machine. The nuts were tightened with a torque wrench so that the tensile stress in the bolts did not exceed 4,500 Ib/in.2 on the root area.3 The column was then placed in a vertical screw-power, beam-and-poise type of testing machine, 600,000-lb capacity, on a hardened steel plate. The centroid of the cross section of the column was made to coincide with the load line of the testing machine. A load of 20,000 lb was then applied to the column throug·h a spherical bearing suspended from the movable platen of the testing machine, and reduced to 4,000 lb. This load was applied for the purpose of bringing the ends of the plates and angles as nearly as possible into the same planes. The nuts were then tightened still more, until the tensile stress in the body of the bolts was about 15,000 Ib/in.2 on the root area.
2. TESTING PROCEDURE
(a) COMPRESSOMETERS
Compressometers having a gage length equal to an integral number of bay lengths 4 for the perforated-plate columns, and not less than one-third of the length of the column for the unperforated-plate columns, were used to measure the shortening of the columns under load. These gage lengths for the perforated-plate columns were chosen so that the solid end-portions of the perforated plates were not included in the gage length. The gage-length shortenings represent the shortening in the uniformly perforated portion of the plate. The middle of the gage length was at midheight of the column. The lower ends of the rods actuated dial micrometers attached to the column at the lower gage mark. One division on the dials was 0.0001 in., and readings were estimated to 0.1 division. Calibration of the dial micrometers showed that the error did not exceed 0.0002 in.
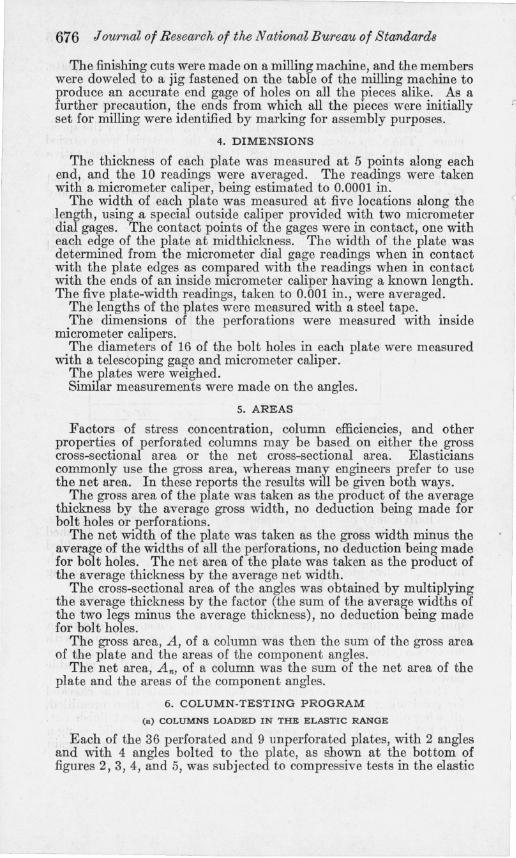
Eight compressometers, arranged as shown in figure 7, were used on the columns, except that for the tests in the elastic range of the 02 columns, and of the 04A and 04B columns, the compressometers indicated by the dashed-line circles in figure 7 were omitted .
• The relation between tension in the body of the bolt and torque on the nut was determined by measure· ments in a testing machine .
• A bay leugth is taken in this report as the length of the perforated plate between the center of two adjacent perforations.
" I
Perforated ()over Plates 679 (b) CORRECTION OF SHORTENINGIFOR CHANGES IN TEMPERATURE
Unavoidable changes of temperature during the tests were sometimes large enough to affect the shortening data. Two unstressed angles, located as shown at T, figure 7, and provided with compressometers of nearly the same gage length as the column, were used to determine the strain due to temperature changes. Tests indicated that the temperature strains in the unstressed angles and in the test column were practically equal if the temperature variations were not Loo rapid and the shortening data for the test column were accordingly corrected.
Column C2B (0-1) (four angles) in the testing machine is shown in figure 8. One of the unstressed angles used for temperature correction is shown at the right.
FIGURE 7.-Location of the compressomete1"S (indicated by circles) on the columns.
The angles (1') were used for temperature correction. 'rho dashed-line circles indicate compressometers that were not used during the elastic'range tests on the CI!, and on the C4A and C4B columns.
(c) LOADING
A compressive load equal to 20 kipsjin.2 was applied to the unperforated-plate columns and released five times. Compressometer readings were then taken at stress increments of 2 kipsjin.2 from 2 to 20 kipsjin.2 6 For the perforated-plate columns, the largest loads used were those which produced a strain in the gage length approximately equal to the strain produced in the unperforated-plate columns by a stress of 20 kips/in.2
The repeated loadings resulted in a linear relationship between load and shortening for this load range.
3. MODULUS OF THE COLUMNS
The term "modulus," E', of a column will be used to denote the ratio of the average stress to the average strain in the compressometer gage length. The average stress was obtained by dividing the total compressive load on the column by the cross-sectional area (gross or net), determined as described in section II-5.
The modulus was calculated from the average-stress, averagcstrain data by means of eq 1 .
• The largest load for the Cl-, CS·, and C4D (4 angles) columns was 18 kips/in .' On these columns 20 kips/In.' would exceed the capacity of the testing machine.
680 Journal of Re8earch of the National Bureau of Standard8
4. EFFECTIVE AREA OF~THEIPERFORATED~PLATE
The effective cross-sectional area with respect to shortening under compressive load of the uniformly perforated portion of a perforated plate is the cross-sectional area of an (hypothetical) unperforated plate of the same material in which, for the same total load, the strain would be the same as the average strain in the perforated plate. This effective area is denoted by KAp, where Ap is the cross-sectional area (gross or net) of the perforated plate; K is thus a measure of the effectiveness of the perforated plate in r esisting shortening under compressive load. It may be computed on either a gross- or a net-area basis.
For a given perforated plate, K is computed by comparison of the modulus, EP' (based on gross or on net area), for a column eonsisting of the plate and two (or four) angles, with the modulus E.', for a column consisting of an unperforated plate of the same gross width as the perforated plate and two (or four) angles. It is sufficient to take the gross cross-sectional area of the unperforated plate to be the same as the gross cross-sectional area of the perforated plate, and similarly for the angles, of which the total cross-sectional area is denoted by Aa. Then assuming that Young's modulus of elasticity for all the material in both columns is the same,
from which
EP' KAp+Aa E.' Ap+Aa'
E' K - p - Es'
(3)
The effective area of the perforated plate was KAp, where K and Ap were both based on gross area or both on net area.
5. STRAINS
(a) GENERAL
Studies were made of the strain distribution in the middle bays of the perforated plate columns.
Strain readings were taken at two loads-at a small initial load and at the largest load used for the determination of the modulus. These readings were taken during subsequent loadings after the modulus had been determined and the compressometers removed.
(b) ON THE EDGE OF THE PERFORATION
Strain-gage holes for 2-in. gage lengths were drilled on the edge of the middle perforation at midthickness of the plate. The gage lengths were spaced continuously, beginning at midwidth of the plate and extending in each quadrant of the perforation to or past the midlen~th point at the side of the perforation. Other gage lengths overlappmg these were located so as to give more values in the regions of rapidly changing strain.
The strains were determined by means of a Berry strain gage operated by hand. One division on the dial micrometer of this instrument is 0.001 in., which, for the gage holes used, amounted to a strain of 0.000095. Readings were estimated to 0.1 division.

--.-~---.~----.--- -.-,~--~-.. <------- - ~----- ---.-...---------------~--. ---------~----.----.---- _.
I J
Research Paper 1473
Journal of Research of the National Bureau of Standards
FIG U lm S.- Column C2 B (0- 1) (Jour angles) in the testi ng l1I achine dw·ing the test in the elastic range.
Tole the compressomelers on tho column and on the unstressed angle at the right whicb was used for temperature correction.
, ------

Journal of Research of the National Bureau of Standards Research Paper 1473
FIG URE)O.- H u ggenbpTlleT len som eleTs on column C2B (2- 3) (fOt' T angles) .
Perforated Oover Plates 681
These data were taken for each column. The strains for gage lines similarly located were averaged for the four quadrants of the perforation and for the three like columns.
(c) ON THE SURFACES OF THE PERFORATED PLATE
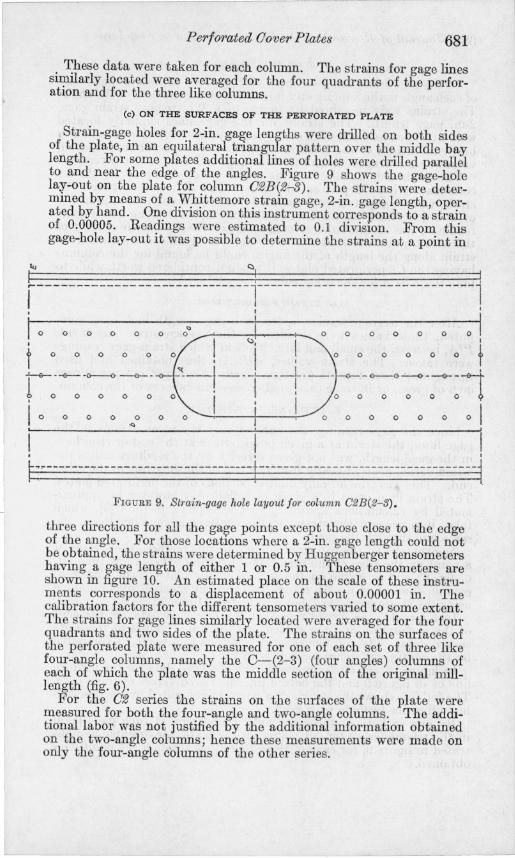
Strain-gage holes for 2-in. gage len~ths were drilled on both sides of the plate, in an equilateral triangUlar pattern over the middle bay length. For some plates additional lines of holes were drilled parallel to and near the edge of the angles. Figure 9 shows the gage-hole lay-out on the plate for column 02B(2-3) . The strains were determined by means of a Whittemore strain gage, 2-in. gage length, operated by hand. One division on this instrument corresponds to a strain of 0.00005. Readings were estimated to 0.1 division. From this gage-hole lay-out it was possible to determine the strains at a point in
L-"------------ -- --------------1--! I
- - --- -- 1
o o o o o o o o o o o o o I
too 0 0 0 o o o o o
r~~-~~~ 0-~e~-:_:1 I 0 0 0 0 ..,0 0 0 0 0 0 0 0 0 I i j I ~----------------------------------t--------- ---- ----------- -----------{
FIGURE 9. Strain-gage hole layout for column C2B(2-3).
three directions for all the gage points except those close to the edge of the angle. For those locations where a 2-in. gage length could not be obtained, the strains were determined by Huggenberger tensometers having a gage length of either 1 or 0.5 in. These tensometers are shown in figure 10. An estimated place on the scale of these instruments corresponds to a displacement of about 0.00001 in. The calibration factors for the different tensometers varied to some extent. The strains for gage lines similarly located were averaged for the four quadrants and two sides of the plate. The strains on the surfaces of the perforated plate were measured for one of each set of three like four-angle columns, namely the C-(2-3) (four angles) columns of each of which the plate was the middle section of the original milllength (fig. 6).
For the 02 series the strains on the surfaces of the plate were measured for both the four-angle and two-angle columns. The additionallabor was not justified by the additional information obtained on the two-angle columns; hence these measurements were made on only the four-angle columns of the other series.

682 Journal of Research of the National BUTeau of Standards
(d) ON THE ANGLES
Strain-gage holes for 2-in. gal;Se lengths were drilled on each side of each angle in the 8-in. leg on a hne 2.86 in. from the back of the angle. The strains were measured by means of a Whittemore strain gage, 2-in. gage length. The strains for the gage lines similarly located were averaged for both sides of the angles and for locations above and below midheight of the column. For the two-angle columns 8 strain values were averaged, and for the four-angle columns 16 were averaged.
The strain-gage readings on the angles were taken only for the six columns having 02 perforated plates. The difference between the strain value computed from the modulus for the column and for any of the gage lines on the angles, as determined by the strain-gage readings, was of the order of magnitude of the experimental error of the strain-gage determinations. Since no significant variation in strain along the length of the angles could be found for the columns having the 02 perforated plates, it was not considered worth while to take these data for the other columns tested later.
(e) STRAIN FOR UNIT LOAD
After the average strains, E, for each gage length had been computed, these values were divided by the average-stress increment, PIA, between the small and large loads at which strain-gage readings were taken. The strain values, f/(P/A), thus obtained and used throughout these reports are then strain values per kip per square inch of gross, or in some cases, net cross-sectional area of the column.
6. STRAINS AT A POINT
Since the gage readings determined only the mean strains in the gage lines, the strain at a given point, either at the end or elsewhere in the gage length, was not given directly by the readings unless the strain varied nearly linearly from one end of the gage line to the other end. This was true for only limited portions of the perforated plates. The strain at a point in a given direction may however be approximated by calculations according to Greenspan's method [3], which takes into account the strains in the contiguous gage lengths of the same line through the point.
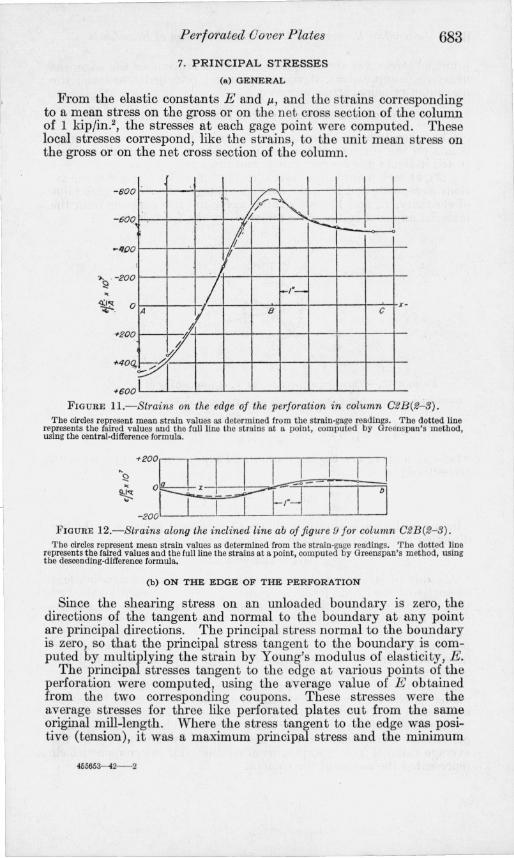
As examples of the results of the use of this method, the strains at a point on the edge of the perforation for the 02B columns (line AO of fig. 9) and in a line on the surface of the plate of the 02B(2-3) column (line ab of fig. 9), computed from the mean strains obtained using the strain gages, are shown in figures 11 and 12.
In figure 11, the circles represent the observed data for the edge of the perforation and the dotted line the faired values of these observed data. The full line shows the strains at a point, as computed by the central-difference formula with k=4.
In figure 12, the circles represent the observed data for the inclined line ab of figure 9 and the dotted line the faired values of these data. The full line shows the strains at a point, as computed by the descending-difference formula with k=2.
By one or both of these methods, the strains at each gage point in the triangular system of points on the plate, for example as illustrated in figure 9, for each of three directions through the point were obtained.
l
Perforated Oover Plates
7. PRINCIPAL STRESSES
(a) GENERAL
683
From the elastic constants E and J.I" and the strains corresponding to a mean stress on the gross or on the net cross section of the column of 1 kip/in.2, the stresses at each gage point were computed. These local stresses correspond, like the strains, to the unit mean stress on the gross or on the net cross section of the column.
-800 I I I I I I
" ~-~. : ,'- i"-I/
-50Q
fI I
/ -,'-r-
A / B C
'>-9 , -200
~, 0
/J '+200 ~
fi " )7 , ~,
0-
J +600
FIGURE H.-Strains on the edge of the perforation in column C2B(2-3). The circles represent mean strain val ues as determined from the strain-gage readings. The dotted line
represents the faired values and the full line the straios at a point, computed by Greenspan's method, using the central-difference formula .
~ .ro:Ft+fH t H - 20 0 '
FIGURE 12.-Strains along the inclined line ab of figure 9 for column C2B(2- 3)_ The circles represent mean strain values as determined from the strain-gage readings. The dotted line
represents the faired values and the fuJI line the strains at a point, computed by Greenspan's method, using the deseending-<ilfferenee formula.
(b) ON THE EDGE OF THE PERFORATION
Since the shearing stress on an unloaded boundary is zero, the directions of the tangent and normal to the boundary at any point are principal directions. The principal stress normal to the boundary is zero, so that the principal stress tangent to the boundary is computed by multirlying the strain by Young's modulus of elasticity, E.
The principa stresses tangent to the edge at various points of the perforation were computed, using the average value of E obtained from the two corresponding coupons. These stresses were the average stresses for three like perforated plates cut from the same original mill-length. Where the stress tangent to the edge was positive (tension), it was a maximum principal stress and the minimum
455653--42- 2
684 Journal of R esearoh of the National Bureau of Standards
principal stress was zero. Where the stress tangent to the edge was negative (compression), it was a minimum principal stress and the maximum principal stress was zero.
(c) ON THE SURFACES OF THE PERFORATED PLATE
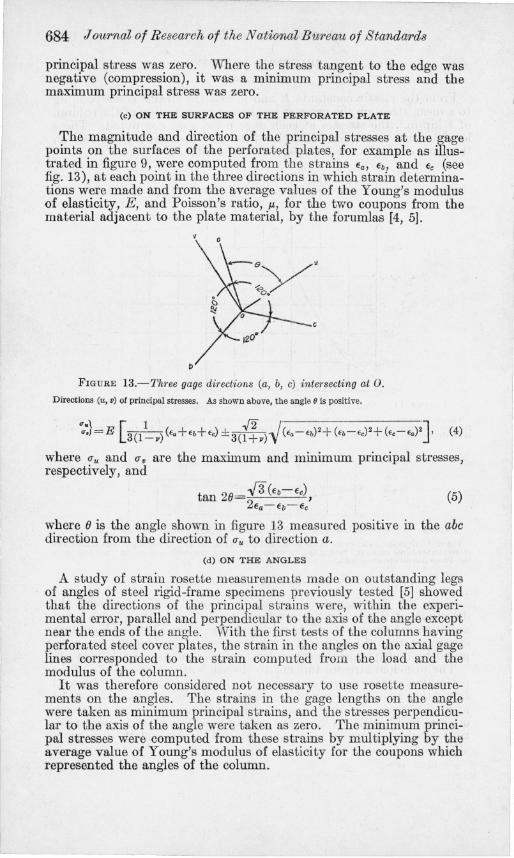
The magnitude and direction of the principal stresses at the gage points on the surfaces of the perforated plates, for example as illustrated in figure 9, were computed from the strains Ea , Eb, and Eo (see fig. 13), at each point in the three directions in which strain determinations were made and from the average values of the Young's modulus of elasticity, E, and Poisson's ratio, p" for the two coupons from the material adjacent to the plate material, by the forumlas [4, 5].
b
FIGURE I3.-Three gage directions (a, b, c) intersecting at O.
Directions (u, 0) of principal stresses. As shown above, the angle 8 is positive.
(4)
where CTu and CT. are the maximum and minimum principal stresses, respectively, and
t 2(J ../3 (Eb-EC) an . , 2Ea - Eb- Ec
(5)
where (J is the angle shown in figure 13 measured positive in the abc direction from the direction of CTu to diI'ection a.
(d) ON THE ANGLES
A study of strain rosette measurements made on outstanding legs of angles of steel rigid-frame specimens previously tested [5] showed that the directions of the principal strains were, within the experimental error, parallel and perpendicular to the axis of the angle except near the ends of the angle. With the first tests of the columns having perforated steel cover plates, the strain in the angles on the axial gage lines corresponded to the strain computed from the load and the modulus of the column.
It was therefore considered not necessary to use rosette measurements on the angles. The strains in the gage lengths on the angle were taken as minimum principal strains, and the stresses perpendicular to the axis of the angle were taken as zero. The minimum principal stresses were computed from these strains by multiplying by the average value of Young's modulus of elasticity for the coupons which represented the angles of the column.
L~
Journal of Research of the National Bureau of Star.d:uos Resea rch Paper 1473
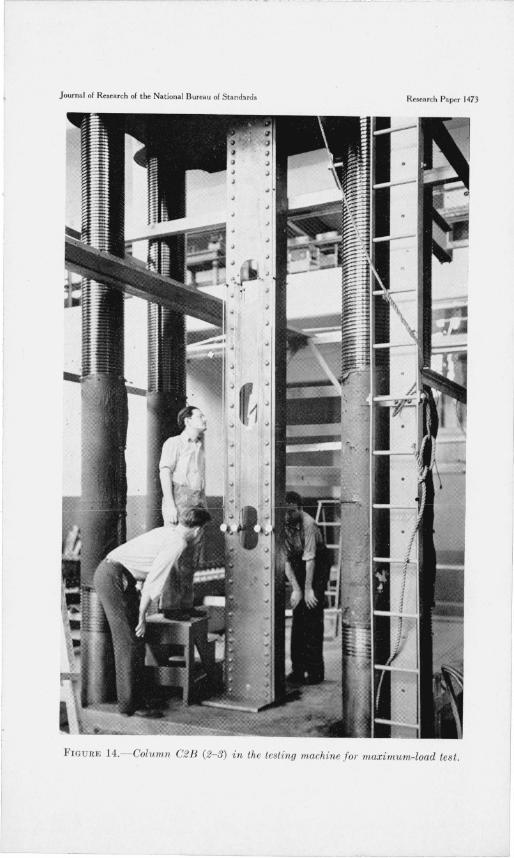
FIGURE 14.- Colwnn C2B (2- 3) in the testing machine j or maximum-load tes t.
~--.----
I
~

Perforated Oover Plates 685
V. PROCEDURE FOR MAXIMUM-LOAD TESTS OF COLUMNS
1. TESTING PROCEDURE
(a) CENTERING THE COLUMN
The columns were tested in a vertical hydraulic compression-testing machine of 10,000-kip capacity. The lower (moving) platen of this machine is mounted on a spherical bearing, so that the platcn can be tilted. The column was placed in the testing machine so that its centroidal axis, whose position was computed from the cross-sectional area of the angles and the effective cross-sectional area of the plate, coincided with the geometric axis of the testing machine.
Eight compressometers, located as shown in figure 7, were attached to the column. The gage length of the compressometers was the same as that used in the elastic-range tests. The lower platen of the testing machine was tilted so that the deformations, observed on the four compressometers on the angles, between zero load and a load approximately equal to the largest load used in the elastic-range test were as nearly as possible the same. Column 02B(2-3) is shown ready for test in figure 14.
(b) AXIAL SHORTENINGS
Data were taken to complete the stress-strain curve for stresses greater than those used in the elastic-range test. The strains were computed from the deformations observed on all eight compressometers. The compressometer dials were graduated to 0.001 in. R eadings were estimated to 0.1 division.
(c) DEFLECTIONS
The deflections at midheight of the column, in planes at rightangles to the principal axes of inertia of the cross sections, were measured at various loads. The deflections were determined to 0.01 in. by the taut-wire mirror-scale method. The distance between the supports for the wires was 14 ft 3 in.
(d) MAXIMUM LOAD
The column was compressed until the maximum load was reached, and straining was further continued until the mode of failure was visually obvious.
2. EFFECTIVE AREA OF PLATE
Let, O"max be the average stress obtained by dividing the maximum load on an unperforated-plate column by the gross cross-sectional area. The effectiveness with respect to compressive strength of a perforated plate of the same width may then be evaluated on the a,ssumption that the average compressive stress at failure on th e effective area of the perforated-plate column is the same as O"max .
Then Aa 0" max is the lC?ad carr~ed at failure by the an~le~ of the perfora te~plate column, and If P max IS the total load at failUIe, Pmax-AaO"max IS the load carried by the perforated plate at failure. The effective area
686 Journal of Resea1'cl~ of tlw National Bureaw of Standards
of the plate is (Pmax-AaUm8x)/Umax, and 0,8 measure of the effectiveness of the plate with respect to compressive strength, is
o P mo.x - A aum8x
ApO"max (6)
o may be taken on a gross- or on a net-area basis, depending on which value of Ap is used.
VI. REFERENCES
[1] J. E. Soehrens, Experimental Study of Perforated Cover Plates as a Substitute for Lattice Bracing and Batten Plates in BUilt-up Bridge Compressive Members, U. S. Dept. Interior, Bur. Reclamation, Tech. Memo. No. 579 (July 25, 1938).
[2] L. B. Tuckerman, Optical strain gages and extensometers, Proc. Am. Soc. Testing Materials 23, pt. 2, 602 (1923).
[3] Martin Greenspan, Approximation to a function of one variable from a set of its mean values, J. Research NBS 23, 309 (1939) RP1235.
[4] Ambrose H. Stang, Martin Greenspan, and William R. Osgood, Strength of a riveted steel rigid frame having straight flanges, J. Research NBS 21, 312 (1938) RP1130.
[5] O. S. Heck, Untersuchung ebener SpannungszusUinde mit Hilfe von DehnungsmeS8ern, lng-Arch. 8, 30 (1937).
WASHINGTON, February 28, 1942.