The Evolution of Bony Vertebrate Enhancers at Odds with Their Coding Sequence Landscape
11
The Evolution of Bony Vertebrate Enhancers at Odds with Their Coding Sequence Landscape Aisha Yousaf, Muhammad Sohail Raza, and Amir Ali Abbasi* National Center for Bioinformatics, Program of Comparative and Evolutionary Genomics, Faculty of Biological Sciences, Quaid-i-Azam University, Islamabad, Pakistan *Corresponding author: E-mail: [email protected]. Accepted: July 28, 2015 Abstract Enhancers lie at the heart of transcriptional and developmental gene regulation. Therefore, changes in enhancer sequences usually disrupt the target gene expression and result in disease phenotypes. Despite the well-established role of enhancers in development and disease, evolutionary sequence studies are lacking. The current study attempts to unravel the puzzle of bony vertebrates’ conserved noncoding elements (CNE) enhancer evolution. Bayesian phylogenetics of enhancer sequences spotlights promising interordinal relationships among placental mammals, proposing a closer relationship between humans and laurasiatherians while placing rodents at the basal position. Clock-based estimates of enhancer evolution provided a dynamic picture of interspecific rate changes across the bony vertebrate lineage. Moreover, coelacanth in the study augmented our appreciation of the vertebrate cis- regulatory evolution during water–land transition. Intriguingly, we observed a pronounced upsurge in enhancer evolution in land- dwelling vertebrates. These novel findings triggered us to further investigate the evolutionary trend of coding as well as CNE nonenhancer repertoires, to highlight the relative evolutionary dynamics of diverse genomic landscapes. Surprisingly, the evolutionary rates of enhancer sequences were clearly at odds with those of the coding and the CNE nonenhancer sequences during vertebrate adaptation to land, with land vertebrates exhibiting significantly reduced rates of coding sequence evolution in comparison to their fast evolving regulatory landscape. The observed variation in tetrapod cis-regulatory elements caused the fine-tuning of associated gene regulatory networks. Therefore, the increased evolutionary rate of tetrapods’ enhancer sequences might be responsible for the variation in developmental regulatory circuits during the process of vertebrate adaptation to land. Key words: CNEs, enhancers, evolutionary rate, bony vertebrates, cis-regulatory evolution. Introduction Vertebrate adaptation to land is a major breakthrough in metazoan evolutionary history, marked by extensive morpho- logical diversification. Large-scale genome sequencing of metazoans greatly enhanced our understanding of their genome architecture, which in turn spearheaded efforts to unfold the potential mechanisms implicated in diversification of the animal form. Previously, gene duplication and protein evolution were envisaged as potential mechanisms underlying the morphological complexity (Ohno 1970). Earlier endeavors were largely focused on protein-coding genes, as they were easier to pinpoint, owing to their well-established genetic code and the properly annotated coding landscape. Later in- novative findings by King and Wilson (1975) articulated the revolutionary theory of morphological evolution. According to this theory, changes in regulation of gene expression are cen- tral to phenotypic evolution between and within species. Cis-regulatory elements, specifically enhancers, orchestrate gene expression in a spatiotemporal manner during early de- velopment (Maston et al. 2006). The precise control of gene expression is pivotal for key developmental processes during embryogenesis. Enhancers are central to transcriptional and developmental gene regulation, with transcriptional regula- tion accomplished through combinatorial interactions of cis- regulatory elements with specific transcription factors (Abbasi et al. 2007). Cis-regulatory elements lack a well-defined vo- cabulary and syntax, as opposed to the coding sequences, which restrains attempts to pinpoint enhancers based on their genomic sequence alone. However, several endeavors centered on the evolutionary conservation metric have proved their potential to discern putative cis-regulatory ele- ments (Abbasi et al. 2010, 2013). For instance, pan-vertebrate genome comparisons have revealed some highly constrained genomic sequences across a wide phylogenetic span GBE ß The Author(s) 2015. Published by Oxford University Press on behalf of the Society for Molecular Biology and Evolution. This is an Open Access article distributed under the terms of the Creative Commons Attribution Non-Commercial License (http://creativecommons.org/licenses/by-nc/4.0/ ), which permits non-commercial re-use, distribution, and reproduction in any medium, provided the original work is properly cited. For commercial re-use, please contact [email protected] Genome Biol. Evol. 7(8):2333–2343. doi:10.1093/gbe/evv146 Advance Access publication August 6, 2015 2333
Transcript of The Evolution of Bony Vertebrate Enhancers at Odds with Their Coding Sequence Landscape

The Evolution of Bony Vertebrate Enhancers at Odds with
Their Coding Sequence Landscape
Aisha Yousaf, Muhammad Sohail Raza, and Amir Ali Abbasi*
National Center for Bioinformatics, Program of Comparative and Evolutionary Genomics, Faculty of Biological Sciences, Quaid-i-Azam
University, Islamabad, Pakistan
*Corresponding author: E-mail: [email protected].
Accepted: July 28, 2015
Abstract
Enhancers lie at the heart of transcriptional and developmental gene regulation. Therefore, changes in enhancer sequences usually
disrupt the target gene expression and result in disease phenotypes. Despite the well-established role of enhancers in development
and disease, evolutionary sequence studies are lacking. The current study attempts to unravel the puzzle of bony vertebrates’
conserved noncoding elements (CNE) enhancer evolution. Bayesian phylogenetics of enhancer sequences spotlights promising
interordinal relationships among placental mammals, proposing a closer relationship between humans and laurasiatherians while
placing rodents at the basal position. Clock-based estimates of enhancer evolution provided a dynamic picture of interspecific rate
changes across the bony vertebrate lineage. Moreover, coelacanth in the study augmented our appreciation of the vertebrate cis-
regulatory evolution during water–land transition. Intriguingly, we observed a pronounced upsurge in enhancer evolution in land-
dwelling vertebrates. These novel findings triggered us to further investigate the evolutionary trend of coding as well as CNE
nonenhancer repertoires, tohighlight therelativeevolutionarydynamicsofdiversegenomic landscapes.Surprisingly, theevolutionary
rates of enhancer sequences were clearly at odds with those of the coding and the CNE nonenhancer sequences during vertebrate
adaptation to land, with land vertebrates exhibiting significantly reduced rates of coding sequence evolution in comparison to their
fast evolving regulatory landscape. The observed variation in tetrapod cis-regulatory elements caused the fine-tuning of associated
gene regulatory networks. Therefore, the increased evolutionary rate of tetrapods’ enhancer sequences might be responsible for the
variation in developmental regulatory circuits during the process of vertebrate adaptation to land.
Key words: CNEs, enhancers, evolutionary rate, bony vertebrates, cis-regulatory evolution.
Introduction
Vertebrate adaptation to land is a major breakthrough in
metazoan evolutionary history, marked by extensive morpho-
logical diversification. Large-scale genome sequencing of
metazoans greatly enhanced our understanding of their
genome architecture, which in turn spearheaded efforts to
unfold the potential mechanisms implicated in diversification
of the animal form. Previously, gene duplication and protein
evolution were envisaged as potential mechanisms underlying
the morphological complexity (Ohno 1970). Earlier endeavors
were largely focused on protein-coding genes, as they were
easier to pinpoint, owing to their well-established genetic
code and the properly annotated coding landscape. Later in-
novative findings by King and Wilson (1975) articulated the
revolutionary theory of morphological evolution. According to
this theory, changes in regulation of gene expression are cen-
tral to phenotypic evolution between and within species.
Cis-regulatory elements, specifically enhancers, orchestrate
gene expression in a spatiotemporal manner during early de-
velopment (Maston et al. 2006). The precise control of gene
expression is pivotal for key developmental processes during
embryogenesis. Enhancers are central to transcriptional and
developmental gene regulation, with transcriptional regula-
tion accomplished through combinatorial interactions of cis-
regulatory elements with specific transcription factors (Abbasi
et al. 2007). Cis-regulatory elements lack a well-defined vo-
cabulary and syntax, as opposed to the coding sequences,
which restrains attempts to pinpoint enhancers based on
their genomic sequence alone. However, several endeavors
centered on the evolutionary conservation metric have
proved their potential to discern putative cis-regulatory ele-
ments (Abbasi et al. 2010, 2013). For instance, pan-vertebrate
genome comparisons have revealed some highly constrained
genomic sequences across a wide phylogenetic span
GBE
The Author(s) 2015. Published by Oxford University Press on behalf of the Society for Molecular Biology and Evolution.
This is an Open Access article distributed under the terms of the Creative Commons Attribution Non-Commercial License (http://creativecommons.org/licenses/by-nc/4.0/), which permits
non-commercial re-use, distribution, and reproduction in any medium, provided the original work is properly cited. For commercial re-use, please contact [email protected]
Genome Biol. Evol. 7(8):2333–2343. doi:10.1093/gbe/evv146 Advance Access publication August 6, 2015 2333

(Bejerano et al. 2004; Sandelin et al. 2004; Dermitzakis et al.
2005; Woolfe et al. 2005). Surprisingly, these elements are
ubiquitous in the vertebrate noncoding genomic landscape,
hereafter termed as the conserved noncoding elements
(CNEs) (Dermitzakis et al. 2005). Their profound sequence
conservation across divergent vertebrates implies functional
implications and, in line with these speculations, in vivo testing
of CNEs in transgenic mice assays has confirmed an enhancer
potential for the majority of these elements (Pennacchio et al.
2006; Visel et al. 2007, 2009; Noonan and McCallion 2010).
For the purpose of clarity, we termed them CNE enhancers.
CNE enhancers are frequently found clustering around genes
implicated in transcriptional regulation and development
(Woolfe and Elgar 2008). The preponderance of enhancers
around developmentally important genes, as well as their no-
table role in gene expression regulation, highlights them as a
key component of vertebrate developmental regulatory
networks.
In light of evolutionary development claims, the evolution
of gene regulatory elements, in addition to the gene itself, is
seen as playing an important role in morphological evolution
(Carroll 2005; Wray 2007). The main reason for this supposi-
tion is related to the modular scenario of enhancers, as any
change in enhancer sequence is less pleiotropic, altering gene
regulation in a particular tissue or developmental stage (Carroll
2008). In contrast, mutations in protein-coding sequences
lead to deleterious pleiotropic effects. Therefore, this modu-
larity of enhancers and their important role in developmental
regulation underscore their candidacy for evolutionary consid-
eration. Although significant progress has previously been
made to understand enhancer evolution, this study aims to
build on this by elucidating CNE enhancer evolution across a
wide phylogenetic span. Furthermore, this study has also
incorporated the protein-coding landscape to improve our
understanding of relative evolutionary dynamics of the pro-
tein-coding and cis-regulatory landscapes (fig. 1).
The current study provides an insight into the bony verte-
brates’ cis-regulatory realm from an evolutionary perspective.
A broad spectral exploration of a putative enhancer data set,
based on experimentally verified human enhancers, provided
an outlook on regulatory evolution, whereas Bayesian phylo-
genetics of enhancer sequences resolved the historical rela-
tionships between bony vertebrates. Furthermore, the present
work serves to illustrate a paradigmatic shift in the evolution-
ary rates of protein-coding and cis-regulatory landscapes. Both
the statistical and phylogenetic tests of the clock hypothesis
unveiled a reduced rate of evolution for tetrapod coding se-
quences. These observations suggest a variety of evolutionary
constraints underlying these diverse genomic landscapes
(fig. 1). Specifically, rate changes in tetrapod enhancer se-
quences, as opposed to the coding sequences, have possible
implications for the rewiring of regulatory circuits during the
process of vertebrate adaptation to land.
Materials and Methods
Gene Ontology Analysis of the CNE Enhancer TargetGenes
Highly constrained noncoding elements in the human
genome, which are experimentally confirmed enhancers,
were retrieved from Vista Enhancer Browser (Visel et al.
2007). For the purpose of our investigation, we focused on
deeply conserved (>450 Myr) enhancer elements expressing
in different anatomical regions of the brain (supplementary
table S1, Supplementary Material online). These enhancers
had previously been associated with their probable target
genes by our group (Parveen et al. 2013). Here, we ascer-
tained the biological themes of those enhancer target genes
through the Gene Ontology (GO) analysis. To accomplish this
task, CNE enhancer target genes were subjected to the
PANTHER classification system’s binomial statistics tool (Cho
and Campbell 2000). The program compared target genes
with a reference set of all genes within the human genome
and sought to probe their over- or underrepresentation for the
PANTHER biological process and molecular function catego-
ries (Thomas et al. 2006).
Identifying the Bony Vertebrate CNE Enhancers and TheirPhylogenetic Reconstruction
Genome-wide scanning of the bony vertebrates for putative
orthologs of the human CNE enhancers was done by running
BLAT (Kent 2002) against the tetrapod, lobe-finned fish and
teleost genomes, available at the UCSC genome browser
(Fujita et al. 2011). Orthologous sequences from the cartilag-
inous fish genome were obtained by comparing human CNE
enhancers against the elephant shark genome, available at
IMCB (http://esharkgenome.imcb.a-star.edu.sg/, last accessed
2014). Only the highest scoring BLAST hits with maximum
percentage identity and longer query span were retained.
The species that were incorporated in the current analysis
comprised: Homo sapiens, Mus musculus, Rattus novergicus,
Canis familiaris, Felis catus, Bos taurus, Equus caballus,
Monodelphis domestica, Gallus gallus, Ornithorhynchus ana-
tinus, Xenopus tropicalis, Anolis carolinensis, Latimeria
chalumnae, Danio rerio, Gasterosteus aculeatus, Tetraodon
nigroviridis, Oryzias latipes, and Callorhinchus milii.
Human, and their orthologous, bony vertebrate sequences
were retrieved by similarity searches, and then concatenated
using the head-to-tail approach in their respective species. The
concatenated bony vertebrate CNE enhancer data set was
subjected to multiple sequence alignment (MSA) using
ClustalW (Thompson et al. 1994) under default parameters.
The accuracy of this alignment was enhanced by deleting any
gapped sites in the sequences. The resulting un-gapped align-
ment (available upon request) was operated upon in tree
construction and forthcoming analyses. The phylogenetic in-
ferences of the bony vertebrate CNE enhancer data set were
Yousaf et al. GBE
2334 Genome Biol. Evol. 7(8):2333–2343. doi:10.1093/gbe/evv146 Advance Access publication August 6, 2015

Phylogenec Inference
Sequence Evoluonary Analyses
Mulple Sequence Alignment
P<0.05; CP>95 %
A
B
C
Idenfy orthologous sequences in bony vertebrate genomes
Human protein coding sequences
Concatenate sequences in their respecve species
Concatenated protein-coding dataset
Mulple sequence alignment using ClustalW
Removed gapped sites
Un-gapped mulply alignedCoding sequence dataset
Idenfy orthologous sequences in bony vertebrate genomes
Human CNE non-enhancer sequences
Concatenate sequences in their respecve species
Concatenated CNE non-enhancer dataset
Mulple sequence alignment using ClustalW
Removed gapped sites
Un-gapped mulply alignedCNE non-enhancer dataset
Idenfy orthologous sequences in bony vertebrate genomes
Human CNE enhancer sequences
Concatenate sequences in their respecve species
Concatenated CNE enhancer dataset
Mulple sequence alignment using ClustalW
Removed gapped sites
Un-gapped mulply alignedCNE enhancer dataset
Molecular clock tesng
Tajima’s relave rate test
Takezaki’s two cluster test
Molecular clock tesng
Tajima’s relave rate test
Takezaki’s two cluster test
Coding sequences’ rate of evoluon:
Tetrapods < Teleosts
P<0.05; CP>95 %
CNE enhancers’ rate of evoluon:
Tetrapods > Teleosts
Dataset Preparaon
P<0.05; CP>95 %
Molecular clock tesng
Tajima’s relave rate test
Takezaki’s two cluster test
CNE non-enhancers’ rate of evoluon:
Tetrapods < Teleosts
FIG. 1.—The flowchart depicts the complete hierarchy of analyses carried out in the current study. (A) Portrays the main steps to identify the bony
vertebrate CNE enhancers and characterize the evolutionary trend of concatenated data set through phylogenetic analyses and molecular clock testing. (B) In
the case of the protein-coding landscape, the bony vertebrates’ concatenated data set was subjected to tests of rate constancy. (C) Tajima’s relative rate and
Takezaki’s two cluster tests were performed on a control data set (CNE-nonenhancer sequences) to provide unbiased estimates of the CNE enhancer
evolution. The key steps involved to carry out the analyses are shown.
Evolution of Bony Vertebrate Enhancers GBE
Genome Biol. Evol. 7(8):2333–2343. doi:10.1093/gbe/evv146 Advance Access publication August 6, 2015 2335
accomplished to gain insights into the evolutionary account of
the bony vertebrate regulatory realm. Evolutionary relation-
ships were inferred, taking key tetrapod, lobe-finned fish
and teleost lineages and by employing the neighbor-joining
(NJ) (Saitou and Nei 1987) and the Bayesian tree inferential
techniques. For the NJ phylogenetic inference, uncorrected p-
distance was exploited as a nucleotide substitution model and
tree construction was carried out in MEGA 5.0 (Tamura et al.
2011). The resulting tree topology was tested through boot-
strapping, which provided a level of statistical confidence to
the interior branches in a tree. A total of 1,000 bootstrap
replicates were generated in the NJ tree.
Bayesian phylogenetic inference of the CNE enhancer data
set was carried out through the BEAST software package
(Drummond et al. 2012). BEAUti, a graphical user interface
to BEAST, constructed the initial BEAST XML file of input data
and enabled us to specify parameters for tree construction
and for running the Markov Chain Monte Carlo algorithm.
The best fitting nucleotide substitution model, GTR+G+I
(General Time Reversible, with g distributed rates and propor-
tion of invariable sites), was established to construct the
Bayesian phylogenetic tree. The forest of trees and log files,
generated through independent runs of BEAST, were com-
bined by LogCombiner. The resultant Bayesian tree along with
its branch support values was visualized in FigTree (http://tree.
bio.ed.ac.uk/software/figtree/).
Relative Rate Analyses of Diverse Genomic Landscapes
We carried out the rate analyses to detect significant rate
changes across the bony vertebrate lineages by employing
Tajima’s relative rate test (Tajima 1993) and Takezaki’s two-
cluster test (Takezaki et al. 1995). These tests are fully
equipped to decipher interspecific rate changes using the mo-
lecular clock as a null hypothesis. In both cases, the ungapped
MSA of the CNE enhancer data set was utilized for this pro-
cess, with C. milii being used as an outgroup. Tajima’s relative
rate test compared molecular evolutionary rates among each
pair of the bony vertebrate lineages. The resultant P values
from rate analysis were corrected for multiple testing using the
Benjamini and Yekutieli correction (Benjamini and Yekutieli
2001). Likewise, Takezaki’s two cluster test was employed
by utilizing the LINTREE (Takezaki et al. 1995), which estab-
lished a significant rate of heterogeneity between the two
major clusters in our data set, that is, tetrapods and teleosts.
The test results were presented in the tabular form (supple-
mentary table S3, Supplementary Material online). To further
understand the cis-regulatory evolution, we explored the se-
quence evolutionary trend of 10-mer DNA motifs, discovered
in a subset of the CNE enhancer data set using the MEME
motif discovery algorithm (Bailey and Elkan 1994). The result-
ing motif sequences were concatenated in their respective
species and subjected to MSA using the ClustalW algorithm.
The ungapped concatenated motif data set was analyzed by
Tajima’s relative rate test to compute the interspecific rate
differences among bony vertebrate lineages by utilizing the
elephant shark as an outgroup.
Our aim to model unbiased enhancer evolution prompted
us to investigate the evolutionary inclination of the coding
landscape as well. Therefore, a data set of 50 human pro-
tein-coding genes was randomly selected (supplementary
table S5, Supplementary Material online). The coding se-
quences belonging to these protein-coding genes were ac-
quired from the Ensembl genome browser (Hubbard et al.
2009). These sequences were BLASTed against genomes of
similar sets of species in the CNE enhancer data set. The re-
sulting sequences were concatenated by species and sub-
jected to MSA. The ungapped multiple alignment of the
bony vertebrate coding sequence data set was further ana-
lyzed by Tajima’s relative rate test and Takezaki’s two cluster
test. Both tests were employed to compare the evolutionary
rates of each pair of the tetrapod and lobe-finned fish lineages
as well as the tetrapod and teleost lineages, taking cartilagi-
nous fish as an outgroup.
In addition, to uncover the dynamic evolution of diverse
genomic landscapes, we performed the rate analysis on a
control data set, comprising conserved noncoding nonen-
hancer sequences. To accomplish this task, we carefully se-
lected a subset of UCEs and CNEs from the UCNEbase
(Dimitrieva and Bucher 2013) and the CONDOR database
(Woolfe et al. 2007), respectively. In addition, 22 CNEs (one
element from each chromosome) were collected from previ-
ously published work (Lee et al. 2011; supplementary table S8,
Supplementary Material online). None of the selected ele-
ments had shown any enhancer potential. Therefore, we
have termed them as CNE nonenhancers. The selected CNE
nonenhancers and their bony vertebrate orthologous se-
quences were concatenated by species and subjected to
MSA. After this, Tajima’s relative rate and Takezaki’s two clus-
ter tests were applied on the ungapped concatenated CNE
nonenhancer data set. Evolutionary rate comparisons, by pair,
of the tetrapod and teleost lineages were presented in sup-
plementary tables S9 and S10, Supplementary Material online.
The evolutionary rate inferences drawn from the coding se-
quence evolution as well as those from the CNE nonenhancer
sequences were compared with those of the CNE enhancers
to explore their relative evolutionary dynamics. The complete
schematic result of analyses carried out on these diverse ge-
nomic landscapes is presented as a flowchart (fig. 1).
Results
CNE Enhancers Are Associated with Development-Related Genes
The primacy of enhancers in the human gene regulatory land-
scape makes them a promising target for evolutionary consid-
eration. In this study we have presented a large-scale
Yousaf et al. GBE
2336 Genome Biol. Evol. 7(8):2333–2343. doi:10.1093/gbe/evv146 Advance Access publication August 6, 2015

exploration of experimentally validated enhancers, ap-
proached from an evolutionary sequence perspective.
Moreover, we have provided profound insights about biolog-
ical themes that are most pertinent to CNE enhancer target
genes. These target genes were previously pinpointed by our
group based on their conserved syntenic association to en-
hancers over a longer evolutionary distance (>450 Myr) and
their endogenous expression pattern in sync with the en-
hancer expression pattern (Parveen et al. 2013). Here, we
conducted GO analyses on CNE enhancer target genes
through the PANTHER classification system’s binomial statis-
tics tool (Cho and Campbell 2000). Statistical analyses for
PANTHER GO categories delineated significant (P<0.01)
functional enrichment of target gene bodies for transcriptional
regulation, DNA binding, nucleic acid binding, and transcrip-
tion factor activity (fig. 2A). Furthermore, in the biological
process category, embryonic development, nervous system
development, nucleic acid metabolism, and transcriptional
processes were also significantly overrepresented (P<0.01)
along with other developmental processes (fig. 2B).
Centered on these observations, we suggest that CNE en-
hancers are associated with an important group of genes
which are involved in transcriptional regulation and are there-
fore master regulators of development, termed as the trans-
dev genes (Woolfe et al. 2005).
Bony Vertebrate CNE Enhancer Data Set
We used an experimentally verified catalog of human CNE
enhancers (supplementary table S1, Supplementary Material
online) as a baseline to detect evolutionarily conserved puta-
tive cis-regulatory elements in other bony vertebrate lineages
(Parveen et al. 2013). The resulting human and orthologous
sequences, obtained through BLAST (Basic Local Alignment
Search Tool) searches, were concatenated in their respective
lineages. The final data set consisted of human orthologous
sequences in lobe-finned fishes (coelacanth plus tetrapods)
and ray-finned fishes (teleosts), spanning 1,315,184 and
135,698 bp, respectively. The clade-wise length distribution
of putative cis-regulatory sequences in tetrapods and teleosts
highlighted overall that tetrapod CNE enhancers have a longer
length distribution than those of teleosts. The average size of
the CNE enhancers in tetrapods and teleosts is 1,042 (270)
and 339 (28) bp, respectively (table 1). This marked differ-
ence in length distribution raises the question as to how the
CNE enhancers might have evolved during the water to land
transition of vertebrates. To provide a comprehensive answer
to this question, we carried out an examination of the molec-
ular phylogenetics of CNE enhancers along with the long-
range evolutionary rate comparisons.
The Evolution of Bony Vertebrate CNE Enhancers
The evolution of the bony vertebrates’ CNE enhancer data set
has never been modelled from a molecular phylogenetic
standpoint. The current study addressed this by providing a
thorough depiction of the CNE enhancer phylogeny across a
wide phylogenetic span. A concatenated CNE enhancer data
set from representative members of tetrapod and teleost lin-
eages was subjected to NJ and Bayesian tree construction
approaches by taking a model cartilaginous fish, the elephant
shark, as an outgroup. Moreover, a recently sequenced lobe-
finned fish, the African coelacanth, was also incorporated into
the phylogenetic analysis, due to its genealogical placement
between ray-finned fishes and tetrapods. The evolutionary
branching which stemmed from NJ and Bayesian approaches
for the CNE enhancer data set was highly congruent, so we
chose the Bayesian tree for further examination (supplemen-
tary fig. S1, Supplementary Material online, and fig. 3).
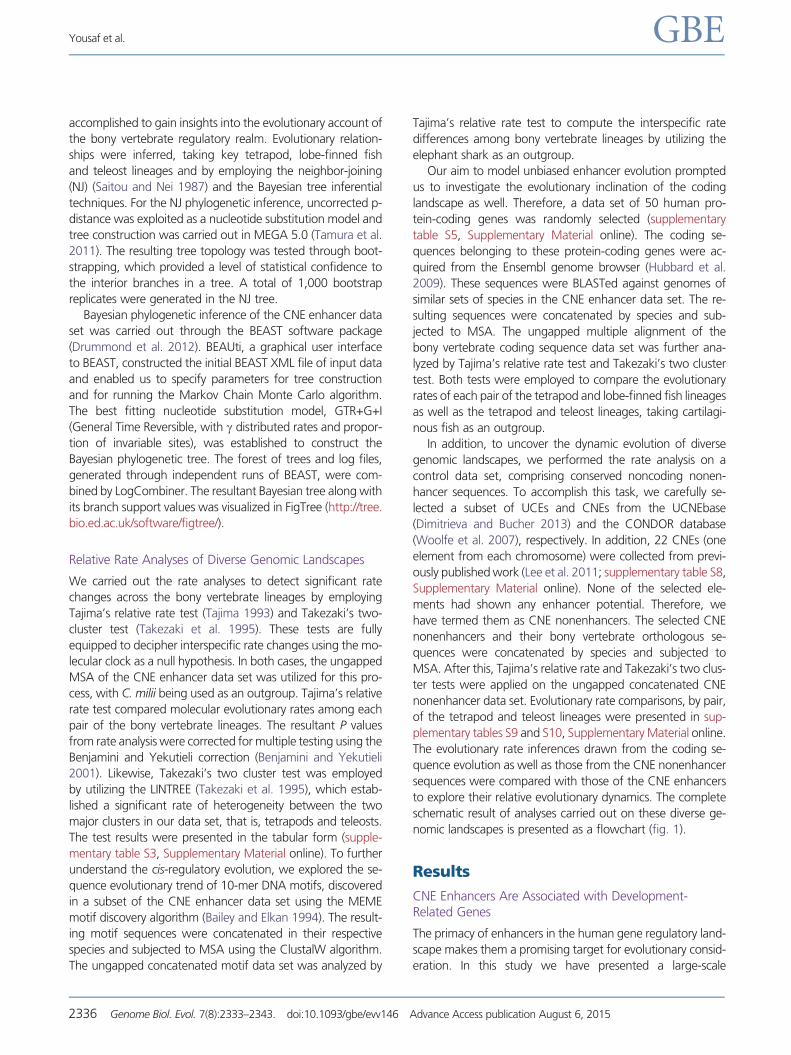
The CNE enhancer phylogeny delineated a placental
mammal branching pattern (type: Rodents (Laurasiatherians,
Primates)), which has placed rodents as basal to placental
mammals. These findings suggest a resolution to the contro-
versial trichotomy between placental mammals, by supporting
Laurasiatherians and Primates as a monophyletic group and
Rodents as the sister class to this group with significant pos-
terior probability (100%). Moreover, Bayesian phylogenetics
retrieved marsupials as the outgroup taxon to placental mam-
mals with strong branch support value (100%). The platypus,
which is a monotreme displaying a blend of mammalian, rep-
tilian and avian features, clustered with birds and reptiles.
Hence, monotremes, birds, and reptiles collectively made a
perfect outgroup to therians. Furthermore, the coelacanth ex-
hibited a basal relationship to amniotes and clustered more
closely with tetrapods than its fish relatives (100% posterior
probability). Based on these findings, it emerges that coela-
canths are closer in an evolutionary sense to tetrapods than to
ray-finned fishes. In the case of teleosts, the CNE enhancer
phylogeny maintained a robust sister group relationship be-
tween G. aculeatus and T. nigroviridis with significant poste-
rior probability support (99%). Danio rerio CNE enhancers
appeared to be highly divergent and thus demonstrated a
basal relationship to their teleost relatives. The tree branch
which led to tetrapods was relatively long when compared
with teleosts, highlighting a greater level of evolutionary
changes in the tetrapod CNE enhancers during the process
of bony vertebrate evolution.
Molecular Clock Testing and Long-Range EvolutionaryRate Comparisons
Since the inception of the molecular clock hypothesis, the rate
of clock movement during the course of evolution has been
discussed at length (Kumar and Hedges 1998; Peterson et al.
2004). Molecular clock hypothesis has played a pivotal role as
a null model in the testing of rates of molecular evolution
across different lineages. Here, we compared the molecular
evolutionary rates of the concatenated CNE enhancer data set
across the bony vertebrate lineages by clock testing. Variations
Evolution of Bony Vertebrate Enhancers GBE
Genome Biol. Evol. 7(8):2333–2343. doi:10.1093/gbe/evv146 Advance Access publication August 6, 2015 2337

in the rate of molecular evolution were modelled by employ-
ing a nonparametric relative rate approach, that is, Tajima’s
relative rate test (Tajima 1993), and a phylogenetic test of the
molecular clock, that is, two-cluster test (Takezaki et al. 1995),
on a carefully curated CNE enhancers data set. Tajima’s rela-
tive rate test provided disparate substitution rates between
ingroup species (osteichthyes) and reference outgroup species
(chondrichthyes), thereby significantly (P<0.01) rejecting the
null hypothesis of the molecular clock. Evolutionary rate com-
parisons (supplementary table S2, Supplementary Material
online) demonstrated a significantly reduced substitution
rate for human lineage when compared with rodents, a pro-
cess known as “hominid slowdown” or “fast rats,” respec-
tively. Furthermore, we found that the CNE enhancers were
accumulating substitutions at elevated levels in the tetrapod
lineages. The coelacanth, proposed as a fish closer in relation
to tetrapods than to ray-finned fishes, showed a substitution
rate pattern which was parallel to its phylogenetic cousins. On
the contrary, teleosts have been evolving at a relatively low
pace, demonstrating significantly (P<0.01) fewer substitu-
tions per site than their land-dwelling relatives.
Takezaki’s two-cluster test (Takezaki et al. 1995) statistically
rejected the clock hypothesis by demonstrating a significant
rate of heterogeneity (CP> 95%) between two of the major
clusters in our data set. Rate estimates drawn from the two-
cluster test delineated that teleosts were experiencing mark-
edly fewer substitutions (0.23 substitutions per site) than the
lobe-finned fish plus tetrapods cluster (0.38 substitutions)
when compared with the outgroup species, C. milii
(supplementary table S3, Supplementary Material online).
Furthermore, test results revealed a significantly faster evolu-
tion for zebrafish CNE enhancers than their teleost relatives.
Likewise, stickleback CNE enhancers demonstrated a greater
substitution rate than tetraodon and medaka. Therefore, both
the statistical and phylogenetic measures of the evolutionary
rate for bony vertebrate CNE enhancers were in
corroboration.
To enrich our understanding of the cis-regulatory sequence
evolution, we analyzed the evolutionary rate of concatenated
DNA motifs that were specifically discovered in a subset of the
CNE enhancer data set (supplementary table S4,
Supplementary Material online). These results suggested a sig-
nificantly elevated rate of substitution for tetrapods than for
their teleost relatives (supplementary table S4, Supplementary
Material online). Likewise, the coelacanth exhibited a signifi-
cantly faster evolutionary trend than that of teleosts.
Therefore, the evolutionary trends of concatenated DNA
motifs confirm the “slowdown” of the molecular clock for
the teleost cis-regulatory landscape.
Evolutionary Dynamics of Diverse Genomic Landscapes
Interspecific rate variation of the bony vertebrates’ CNE en-
hancer data set was found to be clearly in opposition to the
previously obtained rate estimates for CNEs and ultracon-
served noncoding elements (UCEs) (Stephen et al. 2008; Lee
et al. 2011). These findings prompted us to further investigate
the evolutionary rates of coding sequences, to unveil the evo-
lutionary dynamics of coding versus regulatory landscapes,
FIG. 2.—Statistical overrepresentation of the human CNE enhancer target genes for the molecular function and biological process categories. There
were in total 109 target gene bodies for a data set of 100 human CNE enhancers analyzed in the present study. Statistical analysis of these gene bodies for
particular GO categories, by using all genes in the human genome as a reference, was performed by using a binomial statistics tool (Thomas et al. 2006). (A)
The test highlighted significant overrepresentation of enhancer target genes for transcriptional regulation, DNA binding, nucleic acid binding, and tran-
scription factor activity. (B) In the biological process category, embryonic development, nervous system development, nucleic acid metabolism, and tran-
scriptional processes were significantly overrepresented (P< 0.01) along with other developmental processes.
Yousaf et al. GBE
2338 Genome Biol. Evol. 7(8):2333–2343. doi:10.1093/gbe/evv146 Advance Access publication August 6, 2015

and to gauge their relative contributions in organismal evolu-
tion (supplementary table S5, Supplementary Material online).
In addition, relative rate analysis was performed on a control
data set (CNE nonenhancer elements) with the aim of provid-
ing unbiased estimates of the evolution of the CNE enhancer.
In the case of the multilocus coding sequence data set,
evolutionary rate estimates drawn from Tajima’s relative rate
test and Takezaki’s two-cluster test exhibited an entirely iden-
tical trend (supplementary tables S6 and S7, Supplementary
Material online). The two-cluster test exploited Z-statistics to
demonstrate a significant level of heterogeneity among both
species pairs and major species clusters in our data set.
However, Tajima’s relative rate test relied on chi-square statis-
tics to determine interspecific rate changes in the coding se-
quence evolution. Both tests showed a dramatic decline in the
evolutionary rates of the coding repertoire during the water to
land transition of vertebrates. Teleosts exhibited an elevated
level of coding sequence evolution (0.51 substitutions per site)
to that of the lobe-finned fish plus tetrapods cluster (0.16
substitutions per site). Moreover, from the perspective of tel-
eosts, the coelacanth, dubbed a “living fossil,” demonstrated
a reduced rate of coding sequence evolution. This significantly
faster coding sequence evolution in teleosts than in other ver-
tebrate genomes (P<0.01, CP>95%) can be best explained
by the documented “plasticity” of teleost genomes
(Venkatesh 2003).
The relative rate analyses carried out on cis-regulatory as
well as coding sequences, demonstrated strong disparities in
their rates of molecular evolution during vertebrate adaptation
to land. For instance, the land-dwelling vertebrates exhibited a
significantly faster rate of regulatory sequence evolution com-
pared with their protein-coding landscape. Furthermore, rate
analyses on a control data set (nonenhancer-UCEs/CNEs) also
revealed a significantly reduced evolutionary rate for land-
dwelling vertebrates (supplementary tables S9 and S10,
Supplementary Material online). Such discrepancies in the mo-
lecular evolutionary rate of enhancers and other genomic
landscapes (protein-coding and noncoding nonenhancer
landscapes) convincingly render fast evolution of tetrapods,
a singular characteristic of the cis-regulatory landscape.
Discussion
CNEs are a substantial characteristic of vertebrate genomes.
Their integral presence within divergent vertebrates suggests
that they have made important functional contributions across
the depth of evolutionary time. Accordingly, Pennacchio and
colleagues experimentally validated the cis-regulatory poten-
tial for 1,154 CNEs (out of 2,192 tested elements) using an in
vivo transgenic mice assay (Pennacchio et al. 2006; Visel et al.
2009). The availability of such a large-scale experimentally ver-
ified enhancer data set offers a platform to explore the signif-
icance of enhancers in disease and evolution. Enhancers are
the key players in gene expression regulation; therefore, any
change in enhancer sequences will usually result in target
gene dysregulation and can underlie disease phenotypes,
such as preaxial polydactyly, Hirschsprung’s disease, and var-
ious types of cancers (Lettice et al. 2003; Ahmadiyeh et al.
2010; Sribudiani et al. 2011). The pronounced role of en-
hancers in development and disease underscores their candi-
dacy for evolutionary consideration. Previously, attempts have
been made to characterize the evolution of CNEs and ul-
traconserved elements (Stephen et al. 2008; Wang et al.
2009; Lee et al. 2011). The major caveat to these studies
was the dearth of experimental evidence for cis-regulatory
potential of the elements under question. In this study, we
have addressed this gap by employing the experimentally ver-
ified catalog of human enhancers (predominantly expressed in
the brain) as a baseline to the current investigation. The study
provides an unprecedented insight into the evolutionary
trends of the bony vertebrates’ CNE enhancer data set in a
phylogenetic context. Specifically, our data offer a valuable
insight into the relative evolutionary dynamics of cis-regulatory
and coding sequence landscapes during vertebrate adaptation
to land.
Earlier studies have designated genes in the vicinity of en-
hancers or the genes harboring them as their probable targets
(Pennacchio et al. 2006; Visel et al. 2008). Owing to the distal
regulatory potential of enhancers, this association with nearby
genes is impractical. Therefore, a previous report from our
Table 1
Species-Wise and Clade-Wise Length Distribution of Concatenated
CNE Enhancers across the Bony Vertebrate Lineages
Species/Clades Total
Length (bp)aAverage
Length (bp)b
Homo sapiens 162,080 1,620
Mus musculus 118,419 1,184
Rattus novergicus 112,459 1,124
Canis familiaris 129,521 1,295
Felis catus 95,000 950
Bos taurus 127,777 1,277
Equus caballus 137,213 1,372
Monodelphis domestica 91,926 919
Gallus gallus 79,006 790
Ornithorhynchus anatinus 74,744 747
Xenopus tropicalis 53,449 534
Anolis carolinensis 69,580 695
Latimeria chalumnae 64,010 640
Danio rerio 37,236 372
Gasterosteus aculeatus 36,278 362
Tetraodon nigroviridis 30,722 307
Oryzias latipes 31,462 314
Tetrapods 1,251,174 1,042 (270)
Teleosts 135,698 339 (28)
aTotal length of 100 concatenated CNE enhancer data set. These concate-nated sequences were operated upon in phylogenetic inference.
bLength of a single CNE enhancer after averaging over the total number ofenhancers involved.
Evolution of Bony Vertebrate Enhancers GBE
Genome Biol. Evol. 7(8):2333–2343. doi:10.1093/gbe/evv146 Advance Access publication August 6, 2015 2339
group pinpoints target gene bodies of the functionally char-
acterized enhancer data set (Parveen et al. 2013). These en-
hancer–target gene associations were based on the syntenic
conservation of the gene regulatory blocks over a longer evo-
lutionary distance, coupled with endogenous expression anal-
ysis (Parveen et al. 2013). Here, GO analysis of enhancer target
genes for the molecular function and biological process cate-
gories established an enhancer association to trans-dev genes,
confirming earlier observations (Woolfe and Elgar 2008).
Molecular phylogenetics of the concatenated CNE en-
hancer data set successfully uncovered historical relationships
among the bony vertebrate lineages, with strong branch sup-
port values (supplementary fig. S1, Supplementary Material
online, and fig. 3). NJ and Bayesian tree topologies of the
CNE enhancer data set corroboratively established the
unique interordinal relationships for the contentious placental
mammal clade. Our findings suggest a close evolutionary re-
lationship among human and laurasiatherians while placing
rodents at a basal position, and thereby provide a resolution to
the much-hyped trichotomy between placental mammals
(Murphy et al. 2001; Misawa and Nei 2003). Based on these
findings, we can develop an assertion that the concatenation
approach can yield a better phylogenetic resolution than
single element phylogeny. Interestingly, the inferred placental
mammal branching of enhancer sequences reconciles to the
evolutionary pattern of microRNAs (Dolgin 2012). MicroRNAs,
based on their presence in bilaterians and their ability to reg-
ulate development, are considered to be accountable for mor-
phological complexity as well as being a source of
morphological innovations (Peterson et al. 2009). Harmony
among the microRNAs and the CNE enhancer evolutionary
trajectories can be interpreted as a regulatory element exclu-
sive evolutionary trend. The clustering of the platypus with
reptiles and birds is in perfect harmony with earlier studies,
which highlighted the fact that the platypus genome is a mix-
ture of avian, reptilian, and mammalian characteristics
(Warren et al. 2008). Furthermore, probing the coelacanth
genome in the current study enriched our understanding of
the vertical descent from ray-finned fish to tetrapods. The
coelacanth maintained a closer evolutionary relationship to
its land-living cousins than to its fish relatives, confirming ear-
lier observations (Amemiya et al. 2013).
FIG. 3.—Bayesian phylogenetic inference of the bony vertebrates’ concatenated CNE enhancer data set. Tree construction was carried out by employing
100 CNE enhancers, concatenated in their respective lineages (supplementary table S1, Supplementary Material online). The Bayesian maximum clade
credibility tree was inferred using the BEAST package (Drummond et al. 2012), under the “GTR+G+I” model of nucleotide substitution. The numbers on
branches represent posterior values supporting that branch. The scale bar shows the number of nucleotide substitutions per site.
Yousaf et al. GBE
2340 Genome Biol. Evol. 7(8):2333–2343. doi:10.1093/gbe/evv146 Advance Access publication August 6, 2015

The clock-based evolutionary rate estimates of the conca-
tenated CNE enhancer data set provide deep insights into the
bony vertebrates’ cis-regulatory realm. Takezaki’s two cluster
test and Tajima’s relative rate test demonstrated an analogous
rate of enhancer evolution in the bony vertebrate lineages
(supplementary tables S2 and S3, Supplementary Material
online). Moreover, the concatenated 10-mer DNA motif
data set delineated a parallel evolutionary trend as well (sup-
plementary table S4, Supplementary Material online).
Evolutionary rate comparisons demonstrated a significantly
reduced rate of substitution for the human lineage when com-
pared with rodents, thereby corroborating the phenomenon
of “hominid slowdown” or “fast rats,” respectively
(Bromham et al. 1996; Kumar 2005). Furthermore, rate anal-
yses pinpointed a significantly faster rate of evolution for tet-
rapods than that of teleosts since their divergence from their
last common ancestor (supplementary tables S2 and S3,
Supplementary Material online). These clade-specific changes
in tetrapods can be tracked down to their extensive morpho-
logical diversification in the course of vertebrate land adapta-
tion. Therefore, the observed rate pattern of cis-regulatory
evolution can be best explained by the “time scaling” phe-
nomenon (Gingerich 2001; Rabosky and Adams 2012), which
suggests slower morphological change in older lineages in
relation to younger ones. Surprisingly, the coelacanth accu-
mulated significantly (CP-value > 95%) more substitutions
than its land-living relatives and ray-finned fishes. The evolu-
tionary trend exhibited by the coelacanth cis-regulatory ele-
ments goes hand-in-hand with those of the transposable
elements (Amemiya et al. 2013). This exceptional characteris-
tic of the coelacanth putative cis-regulatory repertoire rein-
forces the theory that not all regions of the coelacanth
genome are evolving slowly. Intriguingly, harmony among
the evolutionary rates of the coelacanth transposable ele-
ments (thought to have an important role in gene regulation)
and putative cis-regulatory elements establishes quicker evo-
lution exclusive to the coelacanth regulatory landscape.
The modeling of enhancer evolution at the macroevolu-
tionary scale and their rate analyses revealed an evolutionary
inclination toward diverse genomic landscapes. Relative rate
analyses of the multilocus coding sequence data set as well as
the CNE nonenhancer data set (control data set) unveiled a
dynamic picture of bony vertebrate evolution. Confirming pre-
vious observations, protein-coding sequences and the CNE
non-enhancer sequences portrayed a significantly faster evo-
lution among teleosts than for tetrapods (supplementary
tables S6, S7, S9, and S10, Supplementary Material online)
(Jaillon et al. 2004; Brunet et al. 2006; Steinke et al. 2006;
Stephen et al. 2008; Lee et al. 2011). The pronounced up-
surge of protein evolution shown in ray-finned fishes com-
pared with the other vertebrate genomes reveals the
diversity of fish genomes, previously proposed by Venkatesh
(2003). The observed pattern of protein-coding and CNE
nonenhancer sequence evolution was clearly at odds with
the cis-regulatory landscape, specifically during vertebrate
land adaptation. Accordingly, tetrapods and the coelacanth,
which displayed a fast evolving regulatory landscape, depicted
a slower rate for coding sequence evolution. These findings
convincingly establish the quicker evolution of tetrapods and
the coelacanth, a singular characteristic of the regulatory land-
scape. Quicker evolution of the regulatory elements in land-
living vertebrates suggests that tetrapods have to endure
many more changes in their cis-regulatory landscape to
“brave land.” The variation in tetrapod cis-regulatory se-
quences might affect the expression of target genes and
thereby alter the associated gene regulatory networks.
Therefore, the elevated substitution rate in tetrapod cis-regu-
latory elements suggests the rewiring of regulatory circuits
during the process of vertebrate adaptation to land (Abbasi
2011).
This observed variation in the relative evolutionary rates of
coding and regulatory repertoires suggests that assorted evo-
lutionary constraints determine the diverse genomic land-
scapes. The quicker evolution of tetrapod CNE enhancers is
evidence of either adaptive evolution or a relaxation of con-
straints. Taking fast evolving regulatory repertoire of tetrapods
as evidence of relaxation of selective constraints is not viable,
as mutations in cis-regulatory elements have been associated
with various genetic disorders (Sagai et al. 2005; Kleinjan and
Coutinho 2009; VanderMeer and Ahituv 2011). This sugges-
tion implicates enhancers as the prospective candidate for
adaptive evolution. Therefore, cis-regulatory polymorphism
studies probing archaic hominin genomes in concert with
the contemporary human population will provide an en-
hanced dissection of the regulatory realm during the course
of human evolution. Keeping in mind the well-established role
of enhancer variation in eliciting disease phenotypes as well as
in phenotypic variation, analyzing biologically eloquent cis-
regulatory variants and pinpointing their disease association
can be an important emphasis of future studies.
Conclusion
The inferred phylogeny of the CNE enhancers across teleos-
tomi as well as the relative rate estimates of the bony verte-
brates’ regulatory repertoire overwhelmingly enhances our
understanding of vertebrate cis-regulatory evolution. The dra-
matic variation witnessed in the molecular evolutionary rates
of regulatory, versus coding and noncoding, repertoires of the
genome during vertebrate adaptation to land, suggests that a
number of disparate selection constraints act on diverse ge-
nomic landscapes. The variations within tetrapod cis-regula-
tory sequences might affect the expression of target genes
and thereby alter the associated gene regulatory networks.
It is therefore speculated here that the evolutionary exclusive-
ness of cis-regulatory sequences underlies the rewiring of the
regulatory circuit during vertebrate adaptation to land.
Evolution of Bony Vertebrate Enhancers GBE
Genome Biol. Evol. 7(8):2333–2343. doi:10.1093/gbe/evv146 Advance Access publication August 6, 2015 2341
Supplementary Material
Supplementary figure S1 and tables S1–S10 are available at
Genome Biology and Evolution online (http://www.gbe.
oxfordjournals.org/).
Acknowledgments
The authors are thankful to Muhammad Faisal for assisting
with the motif analysis and to Nazia Parveen for her critical
reading of the manuscript. This study was supported by
Higher Education Commission (HEC) of Pakistan.
Literature CitedAbbasi AA. 2011. Evolution of vertebrate appendicular structures: insight
from genetic and palaeontological data. Dev Dyn. 240:10051016.
Abbasi AA, et al. 2007. Human GLI3 intragenic conserved non-coding
sequences are tissue-specific enhancers. PLoS One 2:e366.
Abbasi AA, et al. 2010. Human intronic enhancers control distinct sub-
domains of Gli3 expression during mouse CNS and limb development.
BMC Dev Biol. 10:44.
Abbasi AA, Minhas R, Schmidt A, Koch S, Grzeschik KH. 2013. Cis-regu-
latory underpinnings of human GLI3 expression in embryonic cranio-
facial structures and internal organs. Dev Growth Differ. 55:699709.
Ahmadiyeh N, et al. 2010. 8q24 prostate, breast, and colon cancer risk loci
show tissue-specific long-range interaction with MYC. Proc Natl Acad
Sci U S A. 107:97429746.
Amemiya CT, et al. 2013. The African coelacanth genome provides in-
sights into tetrapod evolution. Nature 496:311316.
Bailey TL, Elkan C. 1994. Fitting a mixture model by expectation maximi-
zation to discover motifs in biopolymers. Proc Int Conf Intell Syst Mol
Biol. 2:2836.
Bejerano G, et al. 2004. Ultraconserved elements in the human genome.
Science 304:13211325.
Benjamini Y, Yekutieli D. 2001. The control of the false discovery rate in
multiple testing under dependency. Ann Stat. 29:11651188.
Bromham L, Rambaut A, Harvey PH. 1996. Determinants of rate variation
in mammalian DNA sequence evolution. J Mol Evol. 43:610621.
Brunet FG, et al. 2006. Gene loss and evolutionary rates following whole-
genome duplication in teleost fishes. Mol Biol Evol. 23:18081816.
Carroll SB. 2005. Evolution at two levels: on genes and form. PLoS Biol.
3:e245.
Carroll SB. 2008. Evo-devo and an expanding evolutionary synthesis: a
genetic theory of morphological evolution. Cell 134:2536.
Cho RJ, Campbell MJ. 2000. Transcription, genomes, function. Trends
Genet. 16:409415.
Dermitzakis ET, Reymond A, Antonarakis SE. 2005. Conserved non-genic
sequences—an unexpected feature of mammalian genomes. Nat Rev
Genet. 6:151157.
Dimitrieva S, Bucher P. 2013. UCNEbase—a database of ultraconserved
non-coding elements and genomic regulatory blocks. Nucleic Acids
Res. 41:D101–D109.
Dolgin E. 2012. Phylogeny: rewriting evolution. Nature 486:460462.
Drummond AJ, Suchard MA, Xie D, Rambaut A. 2012. Bayesian phyloge-
netics with BEAUti and the BEAST 1.7. Mol Biol Evol. 29:19691973.
Fujita PA, et al. 2011. The UCSC Genome Browser database: update 2011.
Nucleic Acids Res. 39:D876–D882.
Gingerich PD. 2001. Rates of evolution on the time scale of the evolution-
ary process. Genetica 112–113:127144.
Hubbard TJP, et al. 2009. Ensembl 2009. Nucleic Acids Res. 37:
D690–D697.
Jaillon O, et al. 2004. Genome duplication in the teleost fish Tetraodon
nigroviridis reveals the early vertebrate proto-karyotype. Nature
431:946957.
Kent WJ. 2002. BLAT—the BLAST-like alignment tool. Genome Res.
12:656664.
King MC, Wilson AC. 1975. Evolution at two levels in humans and chim-
panzees. Science 188:107116.
Kleinjan DJ, Coutinho P. 2009. Cis-ruption mechanisms: disruption of cis-
regulatory control as a cause of human genetic disease. Brief Funct
Genomic Proteomic. 8:317332.
Kumar S. 2005. Molecular clocks: four decades of evolution. Nat Rev
Genet. 6:654662.
Kumar S, Hedges SB. 1998. A molecular timescale for vertebrate evolution.
Nature 392:917920.
Lee AP, Kerk SY, Tan YY, Brenner S, Venkatesh B. 2011. Ancient verte-
brate conserved noncoding elements have been evolving rapidly in
teleost fishes. Mol Biol Evol. 28:12051215.
Lettice LA, et al. 2003. A long-range Shh enhancer regulates expression in
the developing limb and fin and is associated with preaxial polydactyly.
Hum Mol Genet. 12:17251735.
Maston GA, Evans SK, Green MR. 2006. Transcriptional regulatory ele-
ments in the human genome. Annu Rev Genomics Hum Genet.
7:2959.
Misawa K, Nei M. 2003. Reanalysis of Murphy et al.’s data gives various
mammalian phylogenies and suggests overcredibility of Bayesian trees.
J Mol Evol. 57(Suppl. 1):S290–S296.
Murphy WJ, et al. 2001. Resolution of the early placental mammal
radiation using Bayesian phylogenetics. Science 294:23482351.
Noonan JP, McCallion AS. 2010. Genomics of long-range regulatory ele-
ments. Annu Rev Genomics Hum Genet. 11:123.
Ohno S. 1970. Evolution by gene duplication. Berlin/New York: Springer-
Verlag.
Parveen N, et al. 2013. Comparative genomics using teleost fish helps to
systematically identify target gene bodies of functionally defined
human enhancers. BMC Genomics 14:122.
Pennacchio LA, et al. 2006. In vivo enhancer analysis of human conserved
non-coding sequences. Nature 444:499502.
Peterson KJ, Dietrich MR, McPeek MA. 2009. MicroRNAs and metazoan
macroevolution: insights into canalization, complexity, and the
Cambrian explosion. Bioessays 31:736747.
Peterson KJ, et al. 2004. Estimating metazoan divergence times with a
molecular clock. Proc Natl Acad Sci U S A. 101:65366541.
Rabosky DL, Adams DC. 2012. Rates of morphological evolution are
correlated with species richness in salamanders. Evolution
66:18071818.
Sagai T, Hosoya M, Mizushina Y, Tamura M, Shiroishi T. 2005. Elimination
of a long-range cis-regulatory module causes complete loss of limb-
specific Shh expression and truncation of the mouse limb.
Development 132:797803.
Saitou N, Nei M. 1987. The neighbor-joining method—a new method for
reconstructing phylogenetic trees. Mol Biol Evol. 4:406425.
Sandelin A, et al. 2004. Arrays of ultraconserved non-coding regions span
the loci of key developmental genes in vertebrate genomes. BMC
Genomics 5:99.
Sribudiani Y, et al. 2011. Variants in RET associated with Hirschsprung’s
disease affect binding of transcription factors and gene expression.
Gastroenterology 140:572582.
Steinke D, Salzburger W, Braasch I, Meyer A. 2006. Many genes in fish
have species-specific asymmetric rates of molecular evolution. BMC
Genomics 7:20.
Stephen S, Pheasant M, Makunin IV, Mattick JS. 2008. Large-scale
appearance of ultraconserved elements in tetrapod genomes and
slowdown of the molecular clock. Mol Biol Evol. 25:402408.
Yousaf et al. GBE
2342 Genome Biol. Evol. 7(8):2333–2343. doi:10.1093/gbe/evv146 Advance Access publication August 6, 2015

Tajima F. 1993. Simple methods for testing the molecular evolutionary
clock hypothesis. Genetics 135:599607.
Takezaki N, Rzhetsky A, Nei M. 1995. Phylogenetic test of the molecular
clock and linearized trees. Mol Biol Evol. 12:823833.
Tamura K, et al. 2011. MEGA5: molecular evolutionary genetics analysis
using maximum likelihood, evolutionary distance, and maximum par-
simony methods. Mol Biol Evol. 28:27312739.
Thomas PD, et al. 2006. Applications for protein sequence-function evo-
lution data: mRNA/protein expression analysis and coding SNP scoring
tools. Nucleic Acids Res. 34:W645–W650.
Thompson JD, Higgins DG, Gibson TJ. 1994. Clustal-W—improving the
sensitivity of progressive multiple sequence alignment through se-
quence weighting, position-specific gap penalties and weight matrix
choice. Nucleic Acids Res. 22:46734680.
VanderMeer JE, Ahituv N. 2011. cis-regulatory mutations are a genetic
cause of human limb malformations. Dev Dyn. 240:920930.
Venkatesh B. 2003. Evolution and diversity of fish genomes. Curr Opin
Genet Dev. 13:588592.
Visel A, et al. 2008. Ultraconservation identifies a small subset of
extremely constrained developmental enhancers. Nat Genet.
40:158160.
Visel A, et al. 2009. ChIP-seq accurately predicts tissue-specific activity of
enhancers. Nature 457:854858.
Visel A, Minovitsky S, Dubchak I, Pennacchio LA. 2007. VISTA Enhancer
Browser—a database of tissue-specific human enhancers. Nucleic
Acids Res. 35:D88–D92.
Wang J, Lee AP, Kodzius R, Brenner S, Venkatesh B. 2009. Large number
of ultraconserved elements were already present in the jawed verte-
brate ancestor. Mol Biol Evol. 26:487490.
Warren WC, et al. 2008. Genome analysis of the platypus reveals unique
signatures of evolution. Nature 453:175183.
Woolfe A, Elgar G. 2008. Organization of conserved elements near key
developmental regulators in vertebrate genomes. Adv Genet.
61:307-338.
Woolfe A, et al. 2005. Highly conserved non-coding sequences are asso-
ciated with vertebrate development. PLoS Biol. 3:e7.
Woolfe A, et al. 2007. CONDOR: a database resource of developmentally
associated conserved non-coding elements. BMC Dev Biol. 7:100.
Wray GA. 2007. The evolutionary significance of cis-regulatory mutations.
Nat Rev Genet. 8:206216.
Associate editor: Greg Elgar
Evolution of Bony Vertebrate Enhancers GBE
Genome Biol. Evol. 7(8):2333–2343. doi:10.1093/gbe/evv146 Advance Access publication August 6, 2015 2343