
Modeling preference of commercial toasted white corn tortilla chips using proportional odds models
12
Modeling preference of commercial toasted white corn tortilla chips using proportional odds models J-F. Meullenet*, R. Xiong, J.A. Hankins, P. Dias, S. Zivanovic, M.A. Monsoor, T. Bellman-Horner, Z. Liu, H. Fromm Department of Food Science, University of Arkansas, 2650 N Young Avenue, Fayetteville, AR 72704, USA Received 31 August 2001; received in revised form 21 July 2002; accepted 27 August 2002 Abstract Eleven commercial toasted white corn tortilla chip products from the United States were evaluated by a group of 80 consumers of age 18–35 and by a trained sensory panel. Proportional odds models in conjunction with principal components were used for internal and external preference modeling of tortilla chip consumer overall acceptance. The internal preference modeling showed that flavor was the most important attribute to consumer overall acceptance followed by the interaction of appearance by flavor and texture. The external preference modeling showed that one flavor attribute (salt aftertaste) and one texture attribute (crispness) contributed significantly to increase consumer overall acceptance, whereas one appearance attribute (instrumental color a*) sig- nificantly lowered consumer overall acceptance. The information reported in this study is important to the tortilla chip industry to produce tortilla chips with greater consumer acceptability. This study implies that proportional odds model using principal com- ponents is an alternative tool for consumer preference modeling. # 2003 Elsevier Science Ltd. All rights reserved. Keywords: Tortilla chips; Consumer testing; Descriptive analysis; Preference modeling; Proportional odds models 1. Introduction US households are very fond of salty snacks, includ- ing tortilla chips. According to Dies (2000), 76% of US households purchase tortilla chips every 32 days. In 1996, tortilla and potato chips accounted for five of the top 10 products of the salty snack category (Anon- ymous, 1998). In the USA, tortilla chips have a 20% market share of salty snack purchases, second only to potato chips (Lisser, 1993). In 1996, tortilla chips enjoyed their highest sales in 10 years, and yellow tor- tilla chips gained in popularity (Wellman, 1997). A few studies have been carried out to evaluate sen- sory properties of tortilla chips. Buttery and Ling (1995, 1998) characterized the flavor volatiles of corn tortilla chips, while Hawrysh, Erin, Kim, and Hardin (1995) examined the sensory and chemical stability of tortilla chips fried in canola oil, corn oil, and partially hydro- genated soybean oil. Stinson and Tomassetti (1995) showed that flavor and texture acceptability of low-fat tortilla chips increased when natural corn flavor was added. However, the consumer preference pattern of this product is not yet clearly defined. The knowledge of the consumer’s attitude and preference patterns of tor- tilla chip products is of importance to develop a new product or to improve existing products. Consumer preference of tortilla chips can be studied using external and internal preference modeling tech- niques that have been employed for many foods (Arditti, 1997; Meullenet et al., 2001). Internal pref- erence modeling uses only the consumer data to deter- mine consumer preference patterns, while external preference modeling relates consumer preference data to descriptive sensory information and/or instrumental data (Lawlor & Delahunty, 2000). In the preference study, consumer acceptance responses are usually ordi- nal categories. Ordinary least square (OLS) regression can be used for preference modeling when the ordinal response (Y) is treated as a continuous variable. As a result, OLS regression models the mean scores of the 0950-3293/03/$ - see front matter # 2003 Elsevier Science Ltd. All rights reserved. doi:10.1016/S0950-3293(02)00154-4 Food Quality and Preference 14 (2003) 603–614 www.elsevier.com/locate/foodqual * Corresponding author. Tel.: +1-501-575-6822; fax: +1-501-575- 6936. E-mail address: [email protected] (J.-F. Meullenet).
-
Upload
independent -
Category
Documents
-
view
4 -
download
0
Transcript of Modeling preference of commercial toasted white corn tortilla chips using proportional odds models

Modeling preference of commercial toasted white corn tortillachips using proportional odds models
J-F. Meullenet*, R. Xiong, J.A. Hankins, P. Dias, S. Zivanovic, M.A. Monsoor,T. Bellman-Horner, Z. Liu, H. Fromm
Department of Food Science, University of Arkansas, 2650 N Young Avenue, Fayetteville, AR 72704, USA
Received 31 August 2001; received in revised form 21 July 2002; accepted 27 August 2002
Abstract
Eleven commercial toasted white corn tortilla chip products from the United States were evaluated by a group of 80 consumers ofage 18–35 and by a trained sensory panel. Proportional odds models in conjunction with principal components were used forinternal and external preference modeling of tortilla chip consumer overall acceptance. The internal preference modeling showed
that flavor was the most important attribute to consumer overall acceptance followed by the interaction of appearance by flavorand texture. The external preference modeling showed that one flavor attribute (salt aftertaste) and one texture attribute (crispness)contributed significantly to increase consumer overall acceptance, whereas one appearance attribute (instrumental color a*) sig-
nificantly lowered consumer overall acceptance. The information reported in this study is important to the tortilla chip industry toproduce tortilla chips with greater consumer acceptability. This study implies that proportional odds model using principal com-ponents is an alternative tool for consumer preference modeling.
# 2003 Elsevier Science Ltd. All rights reserved.
Keywords: Tortilla chips; Consumer testing; Descriptive analysis; Preference modeling; Proportional odds models
1. Introduction
US households are very fond of salty snacks, includ-ing tortilla chips. According to Dies (2000), 76% of UShouseholds purchase tortilla chips every 32 days. In1996, tortilla and potato chips accounted for five of thetop 10 products of the salty snack category (Anon-ymous, 1998). In the USA, tortilla chips have a 20%market share of salty snack purchases, second only topotato chips (Lisser, 1993). In 1996, tortilla chipsenjoyed their highest sales in 10 years, and yellow tor-tilla chips gained in popularity (Wellman, 1997).A few studies have been carried out to evaluate sen-
sory properties of tortilla chips. Buttery and Ling (1995,1998) characterized the flavor volatiles of corn tortillachips, while Hawrysh, Erin, Kim, and Hardin (1995)examined the sensory and chemical stability of tortillachips fried in canola oil, corn oil, and partially hydro-
genated soybean oil. Stinson and Tomassetti (1995)showed that flavor and texture acceptability of low-fattortilla chips increased when natural corn flavor wasadded. However, the consumer preference pattern ofthis product is not yet clearly defined. The knowledge ofthe consumer’s attitude and preference patterns of tor-tilla chip products is of importance to develop a newproduct or to improve existing products.Consumer preference of tortilla chips can be studied
using external and internal preference modeling tech-niques that have been employed for many foods(Arditti, 1997; Meullenet et al., 2001). Internal pref-erence modeling uses only the consumer data to deter-mine consumer preference patterns, while externalpreference modeling relates consumer preference data todescriptive sensory information and/or instrumentaldata (Lawlor & Delahunty, 2000). In the preferencestudy, consumer acceptance responses are usually ordi-nal categories. Ordinary least square (OLS) regressioncan be used for preference modeling when the ordinalresponse (Y) is treated as a continuous variable. As aresult, OLS regression models the mean scores of the
0950-3293/03/$ - see front matter # 2003 Elsevier Science Ltd. All rights reserved.
doi:10.1016/S0950-3293(02)00154-4
Food Quality and Preference 14 (2003) 603–614
www.elsevier.com/locate/foodqual
* Corresponding author. Tel.: +1-501-575-6822; fax: +1-501-575-
6936.
E-mail address: [email protected] (J.-F. Meullenet).

ordinal response and the information on the structure(frequencies) of the ordinal response is lost. From themarketing point of view, the information from thestructure of the ordinal response is often more mean-ingful and useful than that from the mean scores of theresponse. OLS regression requires that the distributionof error is normal. However, for the limited number ofresponse categories used in consumer testing or if thenine or seven response categories are collapsed to five orthree categories, the normal distribution assumptionmight not be satisfied. In addition, OLS regression mayproduce extreme predictions that may be out of thecategorical range. These drawbacks have limited the useof OLS regression in preference modeling. Proportionalodds models do not have these limitations and could bean alternative for preference modeling. Proportionalodds models are widely used in categorical data analysisin health science (Agresti, 1990) and have been recentlyapplied to sensory data from study on consumer accep-tance of canola oil (Vaisey-Genser et al., 1994), qualita-tive studies of food choice (Tepper, Choi, & Nayga,1997) and consumer acceptance of oca cultivars (Sang-ketkit, Savage, Martin, Searle, & Mason, 2000). Themajor advantages of the proportional odds model ana-lysis are that it can apply to ordinal categorical respon-ses, model the structure (frequencies) of the categoricalresponses and estimate the mean scores of the respon-ses. Its invariance to choice of response categories isalso an advantage (Agresti, 1990). Since the logit trans-formation in the proportional odds model exaggeratesdifferences at the ends of the scale, compared to themiddle, it suggests that differences between categories inthe middle of the scale are quite minor, but more influ-ential at either extreme of the scale. This may be con-sidered being a merit because the two ends of the scalerepresent two different groups of consumers who eitherlike or dislike the product and the middle of the scalerepresents an ‘undecided’ group of consumers who nei-
ther like nor dislike the product. The proportional oddsassumption is crucial to a proportional odds model,which limits its use in some situations. Another limi-tation of the proportional odds model is that it requiresa large number of observations to model the structureof the response.This study was conducted to determine preferences
for tortilla chips and to quantify specific sensory char-acteristics in tortilla chips presently on the market. Thespecific objectives of this paper were to apply propor-tional odds models to internal and external preferencemodeling and to identify the key sensory characteristicsthat determine consumer acceptance of eleven tortillachip products by using descriptive analysis and propor-tional odds models.
2. Materials and methods
2.1. Samples
A broad range of commercially available tortilla chipswas purchased at local supermarkets. The originalgroup of tortilla chips, which included yellow and whitecorn chips, was evaluated for salt and fat content. Thetortilla chips were then screened based on color, salt andfat content. Eleven commercially available tortilla chipproducts were selected for this study (Table 1). Allsamples selected were toasted white corn chips. Largebags of each type of tortilla chips were purchased 1–2days before testing. The samples were randomly codedwith a three-digit number and stored to prevent frac-tioning of chips.The coded samples were presented to panelists on
white plastic plates 6-inches in diameter. Approximately5–6 large chips or 6–8 bite size chips were placed oneach plate. Each bag of chips was immediately resealedusing a bag clip to preserve freshness.
Table 1
Commercial baked pure white corn tortilla chip products
Product name
Abbreviation Shape Producer Salt content(%)a
Best Yet White Corn
BYW Triangle Fleming Companies, Inc. 4Green Mountain Gringo
GMG Strip Green Mountain Gringo 5Guy’s Restaurant Rounds
GUY Round Guy’s Snack Foods 3Medallion White Corn
MED Triangle Medallion Food Corporation 2Mission Strips
MIS Strip Mission Food Corporation 4Mission Triangle
MIT Triangle Mission Food Corporation 4Oak Creek Farms White Corn
OAK Round Oak Creek Farms 2Santita’s
SAN Triangle Frito-Lay 5Tom’s White Corn
TOM Triangle Tom’s Foods Inc. 5Tostito’s Bite Size
TOB Round Frito-Lay 5Tostito’s Restaurant Style
TOR Triangle Frito-Lay 3a Expressed as percent daily intake: percent daily value are based on a 2000 calorie diet. The size of serving is 28 g.
604 J.-F. Meullenet et al. / Food Quality and Preference 14 (2003) 603–614

2.2. Descriptive analysis
Eleven tortilla chip samples were evaluated forappearance, flavor and texture by a group of nineSpectrum1 trained panelists (Meilgaard, Civille, &Carr, 1999). Panel orientation was conducted to developa descriptive lexicon for appearance, flavor and textureattributes specific to tortilla chips, using the Spectrum1
Method (Sensory Spectrum Inc., Chatham, NJ) and anumerical scale from 0 to 15 with one significant digit(Meilgaard et al., 1999). Lexicon and references usedwere too lengthy to publish here but can be found in anarticle by Meullenet et al. (in press) or are availableupon request. The texture ballot analyzed four majorcategories of product texture characteristics: surface, firstbite, chewdown, and residual, for a total of 15 textureattributes. The flavor profile (i.e. basic tastes, aromatics,feeling factors, and aftertaste), consisted of 23 attributes.The appearance ballot consisted of five attributes.Texture, flavor and appearance evaluations were car-
ried out under controlled conditions over two 3-h ses-sions, two 2.5-h sessions and two 2-h sessions,respectively. During each session, the samples wererandomly presented to panelists assigned to an individ-ual booth and provided with a paper ballot and refer-ences. Crackers (Nabisco Premium Unsalted) and waterwere provided to each panelist as a means for cleansingand rinsing their palates between each sample. A 10-minbreak was scheduled at each session. The texture andflavor evaluations were performed in duplicate, whilethe appearance evaluation was performed by presenting10 chips. The panelists were asked to evaluate all thechips and to give an average score for each attribute.This method was used because of the large variation inappearance within each product.
2.3. Consumer testing
Based on the work of Dies (2000) who reported that76% of US households purchase tortilla chips every 32days, we assumed that 75% of the population inNorthwest Arkansas (i.e. where the test was conducted)consumes tortilla chip products on a regular basis. Theminimum sample size necessary to get a representativesample of the population was calculated to be 73 con-sumers using the formula Z�pð1� pÞ=C
2p (in this case, Z
value Za=1.96 associated with 95% confidence level,the proportion P=0.75, and the confidence intervalC2p 4 10%) (Rea & Parker, 1992). Since the consumertest was performed over a 2-day period, 80 consumerswere selected in anticipation of second day no shows.The consumer panel was recruited by posting adver-
tisements requesting participation in a salty snack con-sumer test. Consumers of these snack products betweenthe ages of 18 and 35 interested in participating wereasked to call. A phone screener was used to determine if
the caller consumed tortilla chips on a regular basis,considered to be every 2 weeks or twice a month. Thescreener was used for every caller until 80 eligible partici-pants were identified. A $20 gift card was offered as anincentive and was paid upon completion of the 2-day test.A completely randomized design was used across the
11 samples for the 80 consumers (Meilgaard et al.,1999). Each consumer was seated in an individual test-ing booth with controlled lighting and positive airflow,and was presented with five tortilla chip samples on thefirst day of the test and with six tortilla chip samples onthe second day. The consumers were provided with 5–6large chips or 6–8 bite size chips for each sample, pre-sented on coded white 6-inch diameter plastic plates.Each sample was assigned a random three-digit code tobe entered on the ballot as a means of identifying thesample. Each consumer was asked to evaluate appear-ance, overall impression, flavor, and texture of eachsample on a nine-point hedonic scale with 1=Dislikeextremely and 9=Like extremely (Table 2). Consumerswere also asked to rate the amount of salt on a five-point just-about-right scale with 1=Much too low,5=Much too high (Table 2). The purchase intent ofconsumers toward the product was rated using a five-point scale with 1=definitely would buy and 5=defi-nitely would not buy (Table 2). Demographic dataincluding consumer gender, age group (1=18–20,2=21–23, 3=24–26, 4=27–29, 5=30–32, 6=33–35years of age), consumption frequency (1=6 times ormore/week, 2=3–5 times/week, 3=1–2 times/week,4=1–3 times/month, 5=less than 1 time/month) andpreference toward brands (0=not preferred, 1=pre-ferred) and preferred shape (1=Triangle, 2=Round,3=Strip, 4=Bite sized, 5=no preference) of tortillachips, were also gathered.
2.4. Color measurements
Five whole chips were randomly selected from eachsample. The color of each whole chip was instrumen-tally evaluated using a Minolta CR-300 colorimeter(Minolta Co., Ltd., Osaka, Japan) with a 50 mm mea-suring head. The measuring head was placed into thecenter of each whole chip. Color values were measuredin triplicate and recorded as averaged L*=whiteness(0=black, 100=white), a* (�a*=greenness,+a*=redness) and b* (�b*=blueness, +b*=yellow-ness). L*, a* and b*, referred as to instrumental colorL*, a* and b*, respectively, were used as appearanceattributes for external preference modeling.
2.5. Statistical analysis
The consumer response scores (Y) (overall acceptanceand acceptance of appearance, flavor and texture, pur-chase intent, etc.) of tortilla chips were ordered values in
J.-F. Meullenet et al. / Food Quality and Preference 14 (2003) 603–614 605

Table 2
Frequency (%) of consumer overall acceptance and consumer acceptance of appearance, flavor, texture and saltiness for 11 tortilla chip productsa
Attribute
Scaleb % of the number of consumers for white corn tortilla chipscBYW
GMG GUY MED MIS MIT OAK SAN TOB TOM TOROverall acceptance
Dislike extremely (1) 0.0 5.0 1.3 3.8 1.3 0.0 6.3 0.0 0.0 5.0 0.0Dislike very much (2)
0.0 5.0 2.5 7.5 2.5 3.8 3.8 0.0 0.0 1.3 2.5Dislike moderately (3)
3.8 8.8 6.3 7.5 6.3 2.5 6.3 0.0 3.8 3.8 1.3Dislike slightly (4)
11.3 13.8 17.5 18.8 12.5 10.0 17.7 7.5 3.8 6.3 2.5Neither dislike or like (5)
13.8 10.0 7.5 8.8 3.8 5.0 7.6 6.3 3.8 12.5 5.0Like slightly (6)
13.8 23.8 21.3 20.0 18.8 8.8 16.5 7.5 12.5 12.5 15.0Like moderately (7)
30.0 16.3 22.5 25.0 26.3 36.3 27.8 33.8 18.8 30.0 26.3Like very much (8)
26.3 13.8 20.0 6.3 22.5 25.0 10.1 38.8 43.8 21.3 30.0Like extremely (9)
1.3 3.8 1.3 2.5 6.3 8.8 3.8 6.3 13.8 7.5 17.5Appearance
Dislike extremely (1) 0.0 1.0 0.0 0.0 0.0 0.0 1.0 0.0 0.0 1.0 0.0Dislike very much (2)
0.0 0.0 1.0 4.0 3.0 0.0 2.0 0.0 1.0 1.0 2.0Dislike moderately (3)
3.0 4.0 5.0 2.0 6.0 4.0 1.0 0.0 2.0 0.0 1.0Dislike slightly (4)
16.0 11.0 10.0 13.0 15.0 7.0 6.0 2.0 6.0 6.0 7.0Neither dislike or like (5)
4.0 11.0 6.0 8.0 6.0 5.0 11.0 5.0 4.0 6.0 3.0Like slightly (6)
13.0 12.0 14.0 9.0 13.0 12.0 10.0 8.0 6.0 13.0 9.0Like moderately (7)
21.0 19.0 22.0 27.0 12.0 20.0 27.0 26.0 16.0 19.0 19.0Like very much (8)
21.0 17.0 18.0 13.0 15.0 24.0 12.0 32.0 29.0 27.0 27.0Like extremely (9)
2.0 4.0 4.0 4.0 10.0 8.0 9.0 7.0 16.0 7.0 12.0Flavor
Dislike extremely (1) 0.0 5.1 1.3 7.5 2.5 0.0 8.9 0.0 0.0 1.3 0.0Dislike very much (2)
0.0 7.6 1.3 10.0 3.8 1.3 11.4 0.0 0.0 5.0 2.5Dislike moderately (3)
6.3 7.6 8.8 8.8 7.5 6.3 6.3 1.3 2.5 5.0 0.0Dislike slightly (4)
13.8 16.5 22.5 18.8 6.3 6.3 19.0 6.3 3.8 16.3 6.3Neither dislike or like (5)
10.0 12.7 8.8 6.3 6.3 8.8 10.1 7.5 3.8 15.0 3.8Like slightly (6)
13.8 17.7 21.3 22.5 23.8 15.0 13.9 8.8 17.5 12.5 18.8Like moderately (7)
22.5 16.5 17.5 15.0 21.3 25.0 17.7 27.5 21.3 16.3 20.0Like very much (8)
28.8 12.7 16.3 10.0 21.3 27.5 8.9 36.3 33.8 21.3 35.0Like extremely (9)
5.0 3.8 2.5 1.3 7.5 10.0 3.8 12.5 17.5 7.5 13.8Texture
Dislike extremely (1) 0.0 3.8 0.0 1.3 0.0 0.0 1.3 0.0 0.0 0.0 0.0Dislike very much (2)
1.3 6.3 0.0 7.5 1.3 1.3 2.6 0.0 0.0 3.8 1.3Dislike moderately (3)
2.5 6.3 8.8 1.3 3.8 5.0 5.1 0.0 0.0 2.5 1.3Dislike slightly (4)
12.5 26.6 16.3 18.8 5.0 15.0 7.7 3.8 2.5 11.4 0.0Neither dislike or like (5)
1.3 8.9 11.3 8.8 8.8 5.0 9.0 7.5 5.1 15.2 6.3Like slightly (6)
12.5 15.2 13.8 15.0 17.5 15.0 19.2 13.8 16.5 11.4 8.8Like moderately (7)
28.8 21.5 27.5 27.5 22.5 25.0 28.2 23.8 17.7 21.5 23.8Like very much (8)
31.3 10.1 20.0 17.5 31.3 25.0 21.8 35.0 38.0 27.8 38.8Like extremely (9)
10.0 1.3 2.5 2.5 10.0 8.8 5.1 16.3 20.3 6.3 20.0Amount of salt
Much too low (1) 3.8 20.0 8.8 31.3 1.3 5.0 10.1 0.0 2.5 8.8 3.8Low (2)
31.3 46.3 41.3 41.3 10.1 10.0 44.3 12.5 22.5 32.5 23.8Just right (3)
48.8 32.5 36.3 15.0 63.3 60.0 38.0 62.5 62.5 46.3 65.0High (4)
13.8 1.3 13.8 12.5 20.3 18.8 6.3 22.5 12.5 11.3 7.5Much too high (5)
2.5 0.0 0.0 0.0 5.1 6.3 1.3 2.5 0.0 1.3 0.0Purchase intent
Definitely would not buy (1) 6.3 21.3 16.3 30.0 6.3 6.3 24.1 0.0 10.0 2.5 2.5Probably would not buy (2)
22.5 35.0 23.8 22.5 18.8 19.0 27.8 13.8 21.3 12.5 13.8Maybe/maybe not buy (3)
30.0 28.8 28.8 28.8 27.5 20.3 27.8 27.5 30.0 17.5 23.8Probably would buy (4)
31.3 12.5 27.5 16.3 36.3 36.7 11.4 25.0 22.5 42.5 27.5Definitely would buy (5)
10.0 2.5 3.8 2.5 11.3 17.7 8.9 23.8 16.3 25.0 32.5a Total observations (n=80 consumers) for each tortilla chip sample. Frequency (%)=100�number of consumers rating the category/n.b A nine-point hedonic scale for consumer overall acceptance and acceptance of appearance, flavor and texture, a five-point Just About Right
scale for the amount of salt (saltiness), and a five-point scale for purchase intent.c Sample name abbreviations can be found in Table 1.
606 J.-F. Meullenet et al. / Food Quality and Preference 14 (2003) 603–614

a set of nine or five categories. Since the order of thecategories is meaningful, the responses are ordinal cate-gorical variables. Each of ordinal categorical variableshas ordered categories and a frequency associated witheach category. Both proportional odds models and OLSregression models can apply to the ordinal categoricalvariables, depending upon how the ordinal categoricalvariables are treated and what is required to be mod-eled. When the ordinal categorical responses are simplytreated as continuous variables and modeling of themean scores of the responses is of interest, OLS regres-sion can apply if its assumptions are met. It was foundin this study that the response scores (Y) for some of theproducts tested did not follow a normal distribution andtherefore were not appropriate for significance testingusing a standard analysis of variance or OLS regression(Jones & Wang, 2000). When the ordinal categoricalresponses are treated as ordinal categorical variablesand the frequencies of the categories of the responsesare of interest, proportional odds models are appro-priate. The proportional odds models can also predictthe mean scores of the response, which provides a basisfor comparison with OLS regression models. Anotheradvantage of proportional odds models is invariance tochoice of response categories (Agresti, 1990). Thismeans that when nine categories and three categorieswhich were collapsed from the nine categories are usedin parallel, similar conclusions will be reached (Agresti,1990). This feature is useful in the case where nine cate-gories need to be collapsed into three categories such as(dislike, neither dislike nor like, like) to determine theprobability of ‘like’ or ‘dislike’. The proportional oddsmodels are widely used to analyze the structure (fre-quencies) of ordered categorical data, do not require thenormality assumption and can be mathematicallyexpressed as (SAS OnlineDoc); Agresti, 1990]:
logit �ijk� �
¼ log�ijk
1� �ijk
� �¼ �k þ X
0ij�
where log�ijk
1� �ijk
� �is the log (i.e. loge) odds of
response Yij (scores) being in category k or below(k=1,2,. . .,K�1, with K=9 for a nine-point scale andK=5 for a five-point scale), also referred as to the logit.�ijk=P(Y4k|Xij) is the probability that the categoricalscore (response Yij) rated by the ith consumer(i=1,2,. . .,80) will be in category k or below for tortillachip product j (j=1,2,. . .,11), given a vector of inde-pendent variables/covariates Xij. �k is an interceptparameter representing the logits of the cumulativeresponse when the explanatory variables/covariates Xijare zero and �14�24. . .4�K�1. � is a vector ofunknown parameters representing the effect of Xij onthe response Y. The proportional odds assumption is
crucial for the proportional odds model (Jones &Wang, 2000). It is that, after fitting an intercept termfor each logit, the effect of changing a value or level ofa covariate is the same for each of the (K�1) types oflogit. Proportional odds models were fitted to the datausing PROC LOGISTIC of SAS. The highest end ofthe rating scale (Y=9, i.e. Y=‘Like extremely’ foracceptance; Y=5, i.e. ‘Would buy definitely’ for pur-chase intent, or ‘Much too high’ for saltiness) was usedto associate with the lowest level in the SAS responseprofile table, the probability of ‘Y=90 or ‘Y=50 wasmodeled in the proportional odds models. PROCLOGISTIC provides a Chi-square statistic (�2) to testproportional odds assumption. The goodness-of-fit of alogistic model is measured using either the likelihoodratio (G2) or Pearson Chi-square statistic (�2). Only G2
was used in this study. The null hypothesis for thegoodness-of-fit test of a proportional odds model isthat the expected cumulative frequencies from the pro-portional odds model agrees with the observed cumu-lative frequencies, namely that the model fits the data.The statistic G2, defined as2P
observed � log observed=expectedð Þ, is used as agoodness-of-fit test statistic to compare observed andexpected cumulative frequencies. G2 is approximately achi-square distribution with a degree of freedom (DF)(in PROC LOGISTIC of SAS, degree of freedom iscomputed as DF=mk�q, where m is the number ofsubpopulation profiles determined by the number ofdistinct observations, k+1 is the number of responselevels, q is the number of parameter estimated) (SASOnlineDoc, SAS Version 8, SAS Institute Inc., Cary,NC). The P-value for G2 with DF is usually used fortesting the null hypothesis. If the P-value for G2 from aproportional odds model is less than the pre-selectedsignificance level (usually 0.05), the null hypothesis isrejected, indicating that the model does not fit. Other-wise, the null hypothesis is accepted, that is, the modelfits. The pre-selected significance level of 0.05 was usedin this study.If the model fits the data, it can be used to calculate
the fitted/expected mean frequencies/probabilities of alllevels of a response Y. For an ordinal response (morethan two levels) such as consumer overall acceptanceand acceptance of appearance, flavor or texture, theexpected mean frequency/probability (Pk of observinglevel k) for product j (j=1,2,. . .,11) is calculated asfollows:
�j1 ¼ P Yij ¼ 1 j Xij� �
¼1
1þ e� �1þ�0Xijð Þ
�j2 ¼ P Yij ¼ 2 j Xij� �
¼1
1þ e� �2þ�0Xijð Þ�
1
1þ e� �1þ�0Xijð Þ
J.-F. Meullenet et al. / Food Quality and Preference 14 (2003) 603–614 607

�j3 ¼ P Yij ¼ 3 j Xij� �
¼1
1þ e� �3þ�0Xijð Þ�
1
1þ e� �2þ�0Xijð Þ
. . .
�jðK�1Þ ¼ P Yij ¼ ðK� 1Þ j Xij� �
¼1
1þ e� �K�1þ�0Xijð Þ�
1
1þ e� �K�2þ�0Xijð Þ
�jK ¼ P Yij ¼ K j Xij� �
¼ 1�1
1þ e� �K�1þ�0Xijð Þ
By using the expected mean frequency/probability,the fitted/expected mean scores ðY� jÞ of consumerresponse for product j (j=1,2,. . .,11) are calculated as:
Y� j ¼ �j1 1þ �j2 2þ �j3 3þ . . .þ �jðK�1Þ ðK
� 1Þ þ �jK K
¼XKk¼1
�jk k
This equation implies that although the proportionalodds model fits the cumulative probabilities of theresponse, the fitted mean scores of the response for eachproduct can be derived indirectly from the fitted model.If OLS regression applies to the same response, the fit-ted mean scores for each product can also be obtaineddirectly from the OLS regression model. R2 (coefficientof determination) and RMSE (root mean square error)are used in OLS regression to assess the goodness-of-fitof the model and can be calculated out using theobserved and fitted mean scores of the response. Sincethe fitted mean scores of the response can be obtainedfrom both OLS regression and proportional oddsmodel, their goodness-of-fit can be compared using R2
and RMSE (denoted hereafter as R2score and RMSEscore).This provides a means for comparing proportional oddsmodel with other regression models in terms of only themean scores of the response.For modeling of the consumer overall acceptance and
purchase intent, the product variable (11 tortilla chipsproducts) together with demographic variables (gender,age group, preferred brand, preferred shape and con-sumption frequency) were used as covariates (Xij) in theproportional odds models. The covariates such as pro-duct, gender, preferred brand and preferred shape werecategorical variables in the proportional odds models.Since the covariates of consumption frequency and agegroup were ordinal categorical variables, they weretreated as continuous variables in the proportional oddsmodels (i.e. assuming linear effects of the ordinal cate-gorical variables on the response). However, for internal
and external preference modeling, principal components(continuous variables), together with the categoricalvariable of product shape (round, triangle and strip),were used as covariates (Xij) in the proportional oddsmodels because the original sensory variables (that werecontinuous variables) were correlated. For internalpreference modeling, principal components wereextracted from consumer acceptance scores of appear-ance, flavor, texture and their interactions. For externalpreference modeling, principal components wereextracted from the descriptive attributes prior to per-forming preference modeling of consumer overallacceptance and acceptance of appearance, flavor andtexture. The SELECTION=BACKWARD option inPROC LOGISTIC was used to select significant cov-ariates (principal components) (P<0.05). The like-lihood ratio G2=D1�D0 (D1=deviance for the simplemodel, D0=deviance for the complex model) and back-ward elimination method were also used to select sig-nificant sensory variables (P<0.05) in the significantprincipal components. Only the ‘optimal’ proportionalodds models were reported in this paper.
3. Results and discussion
3.1. Consumer acceptance
The frequency of the consumer overall acceptanceand acceptance of appearance, flavor, texture andamount of salt is presented in Table 2. It was evidentthat TOR had the highest overall acceptance frequencyof ‘Like extremely’, followed by TOB. The consumeracceptance of appearance, flavor and texture of TOBwas rated as ‘Like extremely’ by 16.0, 17.5 and 20.3% ofthe consumers, respectively. In contrast, only 4.0, 1.4and 2.5% of the consumers rated the acceptance ofappearance, flavor and texture of MED as ‘Like extre-mely’, respectively. In terms of the amount of salt, 60 to65% of the consumers rated five products (MIT, MIS,TOB, TOR and SAN) as ‘Just about right’, whereasMED had the lowest rate (i.e. 15%). It was found thatthe ‘Just about right’ rates were associated with the saltcontent (Table 1). A salt content of 4% was found to be‘Just about right’ for saltiness acceptance. TOR had thehighest rate (i.e. 32.5%) of purchase intent as ‘Definitelywould buy’, while MED again had the lowest rate(2.5%).The Chi-square (�2) for testing the proportional odds
assumption was 84.93, which was not significant withrespect to a Chi-square distribution with 84 degrees offreedom (DF) (P=0.45). This suggests that the propor-tional odds assumption was satisfied. The likelihoodratio G2 was 2886.13 (DF=5836) with P1.0, indicat-ing that the proportional odds model adequately fittedthe data. The parameterization used in the SAS system
608 J.-F. Meullenet et al. / Food Quality and Preference 14 (2003) 603–614

is one that leaves out the parameter for the baseline(TOR in this case) with which each product is com-pared. Hence, a positive parameter estimate (�) inTable 3 means that the compared product is preferredto TOR, and a negative value means that TOR waspreferred. Based on the b estimates, SAN (0.24) was themost preferred product, while MED (�1.47) was theleast preferred one. It was evident from Table 3 that theprobabilities (P>Chi-square) for the products BYW,MIT SAN, TOB and TOM were greater than 0.05,indicating that the products were not significantly dif-ferent from TOR, while those for the remaining pro-ducts were less than 0.05, suggesting significantdifference in overall acceptance between the productsand TOR. The odds ratios in Table 3 compare eachproduct with TOR. Other odds ratios can be obtained.For example, the odds ratio between MED (least pre-ferred) and SAN (most preferred) was 0.18, indicatingthat the odds of consumers liking rate for MED was0.18 times the odds for SAN. The positive parameterestimate for age group suggested that age group waspositively associated with liking. The odds ratio for agegroup means that the odds of consumer liking ratewould increased by 8% for one unit increase in agegroup if holding other covariates constant. ‘Older’ con-sumers tended to give higher acceptance scores for tor-tilla chips than ‘younger’ ones. The odds ratios for
preferred brand showed that the odds of consumers lik-ing non-preferred brand products were 0.58 times theodds of liking preferred brands. This indicated thatalthough the chip samples were randomly presentedwithout any indication of brand names, consumerscould have recognized their preferred brand samples,maybe through shape, size, color, smell and texture ofchips, which they are familiar with. Tostita’s brand wasselected as a preferred brand by 90% of consumers.Similarly, Mission brand, Guy’s brand, Santita’s brandand the remaining brands were selected as a preferredbrand by 41.2, 15.0, 12.5 and 0 to 1.2%, respectively.The proportional odds model also adequately fitted
for purchase intent (P=0.33 for �2 of 39.15, DF=36;G2=2239.32, DF=2912, P1.0). Product, preferredbrand and gender were significant contributors to con-sumer purchase intent (Table 3). The odds that con-sumers ‘would buy’ non-preferred brand products were0.50 times the odds that consumers ‘would buy’ pre-ferred brands. The odds ratios for gender showed thatthe odds of ‘would buy’ the chips were 25.7% smallerfor females than for males. The � estimates indicatedthat consumers would buy SAN most if the effects ofgender and preferred brand were partialed out, andMED was the least likely to be purchased. In this study,it was found that the proportional odds assumption wasnot satisfied with acceptance of appearance, flavor, tex-
Table 3
Parameter estimates and statistics for proportional odds models for consumer overall acceptance and purchase intent (see Appendix)
Parametera
DF Overall acceptance Purchase intentEstimate
S.E. Chi-square P>Chi-square Oddsratio
Estimate
S.E. Chi-square P>Chi-square Oddsratio
�1
1 �2.17 0.26 67.43 <0.0001 �0.76 0.22 11.84 0.0006�2
1 �0.24 0.24 0.98 0.3226 0.87 0.22 15.44 <0.0001 �3 1 1.01 0.24 17.09 <0.0001 2.12 0.23 84.85 <0.0001�4
1 1.76 0.25 50.18 <0.0001 3.58 0.25 205.95 <0.0001�5
1 2.22 0.25 76.92 <0.0001�6
1 3.19 0.27 142.82 <0.0001 �7 1 3.94 0.29 186.35 <0.0001�8
1 4.80 0.34 201.49 <0.0001Product: BYW
1 �0.47 0.34 1.99 0.1586 0.62 �0.37 0.34 1.21 0.2708 0.69Product: GMG
1 �1.28 0.34 14.44 0.0001 0.28 �1.53 0.34 20.06 <0.0001 0.22Product: GUY
1 �1.00 0.32 9.66 0.0019 0.37 �1.01 0.33 9.54 0.002 0.37Product: MED
1 �1.47 0.34 18.95 <0.0001 0.23 �1.59 0.34 21.59 <0.0001 0.20Product: MIS
1 �0.73 0.30 5.92 0.015 0.48 �0.46 0.30 2.29 0.1299 0.63Product: MIT
1 �0.33 0.30 1.18 0.2764 0.72 �0.24 0.30 0.62 0.43 0.79Product: OAK
1 �1.21 0.34 12.84 0.0003 0.30 �1.41 0.34 16.91 <0.0001 0.24Product: SAN
1 0.24 0.33 0.56 0.4537 1.28 0.35 0.33 1.16 0.2808 1.42Product: TOB
1 0.18 0.29 0.41 0.5223 1.20 �0.01 0.29 0.00 0.9687 0.99Product: TOM
1 �0.43 0.34 1.62 0.203 0.65 �0.40 0.34 1.42 0.2339 0.67Product: TOR
0 0 – – – 1.00 0 – – – 1.00Age group
1 0.07 0.04 4.50 0.0338 1.08Preferred brand: No
1 �0.54 0.20 6.90 0.0086 0.58 �0.69 0.21 11.08 0.0009 0.50Preferred brand: Yes
0 0 – – – 1.00 0 – – – 1.00Gender: Female
1 �0.30 0.12 5.72 0.0167 0.74Gender: Male
0 0 – – – 1.00a Sample name abbreviations can be found in Table 1.
J.-F. Meullenet et al. / Food Quality and Preference 14 (2003) 603–614 609
ture and saltiness. This may be due to non-parallelismof the logits of each cumulative response among thechip products, suggesting the limitations of propor-tional odds models.
3.2. Prediction of overall acceptance from attributeacceptance: internal preference model
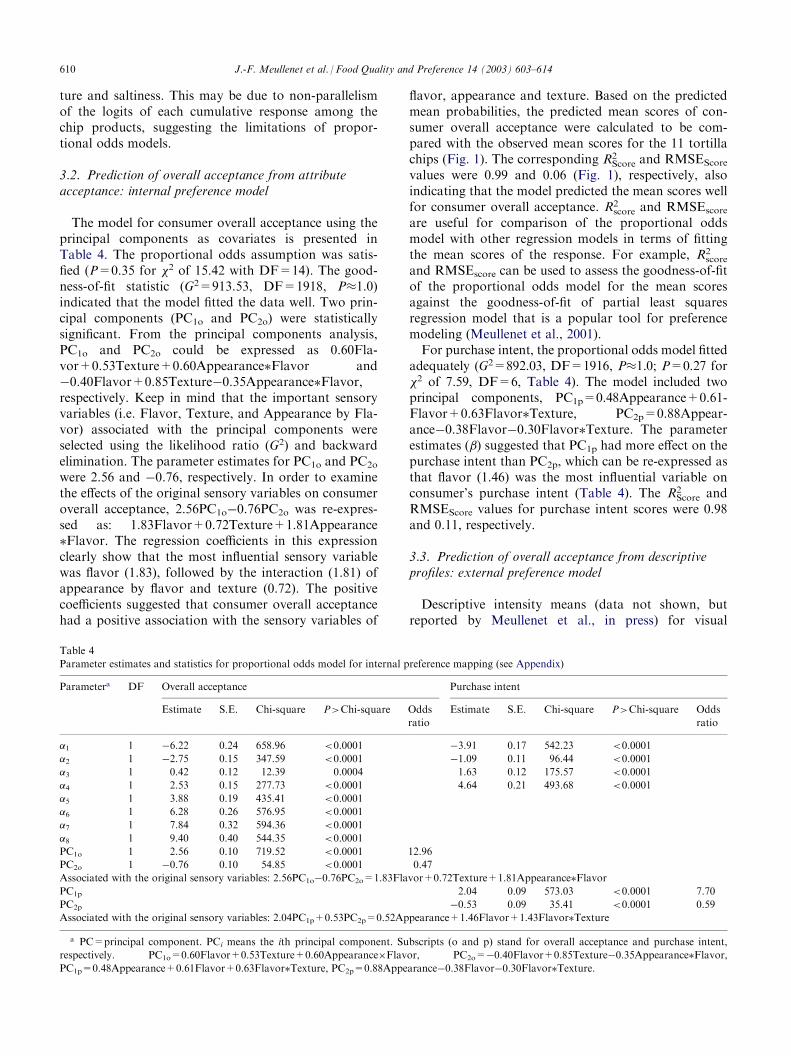
The model for consumer overall acceptance using theprincipal components as covariates is presented inTable 4. The proportional odds assumption was satis-fied (P=0.35 for �2 of 15.42 with DF=14). The good-ness-of-fit statistic (G2=913.53, DF=1918, P1.0)indicated that the model fitted the data well. Two prin-cipal components (PC1o and PC2o) were statisticallysignificant. From the principal components analysis,PC1o and PC2o could be expressed as 0.60Fla-vor+0.53Texture+0.60Appearance�Flavor and�0.40Flavor+0.85Texture�0.35Appearance�Flavor,respectively. Keep in mind that the important sensoryvariables (i.e. Flavor, Texture, and Appearance by Fla-vor) associated with the principal components wereselected using the likelihood ratio (G2) and backwardelimination. The parameter estimates for PC1o and PC2owere 2.56 and �0.76, respectively. In order to examinethe effects of the original sensory variables on consumeroverall acceptance, 2.56PC1o�0.76PC2o was re-expres-sed as: 1.83Flavor+0.72Texture+1.81Appearance�Flavor. The regression coefficients in this expressionclearly show that the most influential sensory variablewas flavor (1.83), followed by the interaction (1.81) ofappearance by flavor and texture (0.72). The positivecoefficients suggested that consumer overall acceptancehad a positive association with the sensory variables of
flavor, appearance and texture. Based on the predictedmean probabilities, the predicted mean scores of con-sumer overall acceptance were calculated to be com-pared with the observed mean scores for the 11 tortillachips (Fig. 1). The corresponding R2Score and RMSEScorevalues were 0.99 and 0.06 (Fig. 1), respectively, alsoindicating that the model predicted the mean scores wellfor consumer overall acceptance. R2score and RMSEscoreare useful for comparison of the proportional oddsmodel with other regression models in terms of fittingthe mean scores of the response. For example, R2scoreand RMSEscore can be used to assess the goodness-of-fitof the proportional odds model for the mean scoresagainst the goodness-of-fit of partial least squaresregression model that is a popular tool for preferencemodeling (Meullenet et al., 2001).For purchase intent, the proportional odds model fitted
adequately (G2=892.03, DF=1916, P1.0; P=0.27 for�2 of 7.59, DF=6, Table 4). The model included twoprincipal components, PC1p=0.48Appearance+0.61-Flavor+0.63Flavor�Texture, PC2p=0.88Appear-ance�0.38Flavor�0.30Flavor�Texture. The parameterestimates (�) suggested that PC1p had more effect on thepurchase intent than PC2p, which can be re-expressed asthat flavor (1.46) was the most influential variable onconsumer’s purchase intent (Table 4). The R2Score andRMSEScore values for purchase intent scores were 0.98and 0.11, respectively.
3.3. Prediction of overall acceptance from descriptiveprofiles: external preference model
Descriptive intensity means (data not shown, butreported by Meullenet et al., in press) for visual
Table 4
Parameter estimates and statistics for proportional odds model for internal preference mapping (see Appendix)
Parametera
DF Overall acceptance Purchase intentEstimate
S.E. Chi-square P>Chi-square Oddsratio
Estimate
S.E. Chi-square P>Chi-square Oddsratio
�1
1 �6.22 0.24 658.96 <0.0001 �3.91 0.17 542.23 <0.0001�2
1 �2.75 0.15 347.59 <0.0001 �1.09 0.11 96.44 <0.0001 �3 1 0.42 0.12 12.39 0.0004 1.63 0.12 175.57 <0.0001�4
1 2.53 0.15 277.73 <0.0001 4.64 0.21 493.68 <0.0001�5
1 3.88 0.19 435.41 <0.0001 �6 1 6.28 0.26 576.95 <0.0001�7
1 7.84 0.32 594.36 <0.0001�8
1 9.40 0.40 544.35 <0.0001PC1o
1 2.56 0.10 719.52 <0.0001 12.96PC2o
1 �0.76 0.10 54.85 <0.0001 0.47Associated with the original sensory variables: 2.56PC1o�0.76PC2o=1.83Flavor+0.72Texture+1.81Appearance�Flavor
PC1p
2.04 0.09 573.03 <0.0001 7.70PC2p
�0.53 0.09 35.41 <0.0001 0.59Associated with the original sensory variables: 2.04PC1p+0.53PC2p=0.52Appearance+1.46Flavor+1.43Flavor�Texture
a PC=principal component. PCi means the ith principal component. Subscripts (o and p) stand for overall acceptance and purchase intent,
respectively. PC1o=0.60Flavor+0.53Texture+0.60AppearanceFlavor, PC2o=�0.40Flavor+0.85Texture�0.35Appearance�Flavor,
PC1p=0.48Appearance+0.61Flavor+0.63Flavor�Texture, PC2p=0.88Appearance�0.38Flavor�0.30Flavor�Texture.
610 J.-F. Meullenet et al. / Food Quality and Preference 14 (2003) 603–614

appearance, flavor, and texture attributes were used forexternal preference modeling. The modeling resultsshowed that the proportional odds model adequatelyfitted the data for overall acceptance (�2=9.25,DF=14, P=0.81; G2=89.99, DF=94, P=0.60). Theparameter estimates are listed in Table 5. Two (PC1oand PC2o) out of three principal components wereselected as important covariates, which equivalentlysays that one flavor descriptive attribute (salt aftertaste),one appearance attribute (instrumental color a*) andone texture descriptive attribute (crispness) were statis-tically significant contributors to the consumer overallacceptance of tortilla chips (Table 5). Appearance, fla-vor and texture descriptive attributes were included inthe external preference model, confirming modelingresults from the above internal preference modeling. Itshould not be surprising that salt aftertaste was themost important flavor attribute to the acceptancebecause American consumers like salt. Crispness wasone of the most important texture attributes for chipsincluding tortilla chips. As expected, it increased con-sumer overall acceptance, but its contribution to theoverall acceptance was lower than that of salt aftertaste.Instrumental color a* negatively contributed consumeroverall acceptance. The R2Score and RMSEScore valuesfor the average scores of consumer overall acceptancewere 0.95 and 0.16 (Fig. 2), respectively, indicating thatthe model could accurately predicted the mean scores ofoverall acceptance.The proportional odds model (Table 5) including two
principal components (PC1p and PC2p) also adequatelyfitted the data for purchase intent (�2=8.49, DF=6,P=0.20; G2=45.05, DF=46, P=0.48). Since saltaftertaste, crispness and instrumental color (a*) wereassociated with the principal components, they werealso significant contributors to consumer purchaseintent. These variables played similar roles in the modelfor purchase intent as they did in the model for overall
acceptance. The R2Score and RMSEScore values for theaverage scores of consumer purchase intent were 0.97and 0.09, respectively, suggesting that the mean scoresof purchase intent could be accurately predicted by theproportional odds model using salt aftertaste, crispnessand instrumental color a*.
3.4. Prediction of tortilla chip flavor acceptance fromflavor descriptors
The proportional odds assumption was satisfied forflavor external preference modeling (�2=27.56,DF=28, P=0.49). The likelihood ratio (G2=73.66,DF=84, P=0.78) indicated that the proportional oddsmodel could adequately fit the flavor data. The first,third, fifth and sixth principal components (PC1f, PC3f,PC5f, PC6f) were selected as significant predictors in themodel (Table 5). By replacing the principal componentswith the original sensory variables, it was found thattoasted corn, salt aftertaste, toasted grain aftertaste andsweet aftertaste contributed to increased consumeracceptance of flavor while cardboard and grain complexdecreased consumer flavor acceptance (Table 5). TheR2Score and RMSEScore values for the average scores ofconsumer flavor acceptance were 0.99 and 0.09, respec-tively.
3.5. Prediction of tortilla chip texture acceptance fromtexture descriptors
The proportional odds model also adequately fittedthe texture data (�2=31.79, DF=21, P=0.06;G2=85.29, DF=77, P=0.24). The first, second andthird principal components (PC1t, PC2t, PC3t) wereselected out of seven principal components as significantpredictors in the model, indicating that the seven sen-sory texture variables were highly correlated. The tex-ture descriptive variables/attributes of hardness,toothpack, crispness, oily film, moisture absorption,persist of crisp, loose particles were significant con-tributors to the consumer acceptance of tortilla chiptexture (Table 5). The R2Score and RMSEScore values forthe average scores of consumer texture acceptance forthe tortilla chip products were 0.93 and 0.19, respec-tively.
3.6. Prediction of tortilla chip appearance acceptancefrom visual appearance descriptors
The proportional odds model adequately fitted thedata for appearance acceptance (�2=40.47, DF=35,P=0.24; G2=90.78, DF=83, P=0.26). Two principalcomponents (PC1a and PC2a) and product shape wereselected as significant predictors in the model. WhenPC1a and PC2a were expressed by the original sensoryvariables, it was found that degree of whiteness
Fig. 1. Predicted versus observed average consumer overall accep-
tance. Predicted average scores were obtained from consumer appear-
ance, flavor and texture acceptance using a proportional odds model.
Sample name abbreviations can be found in Table 1.
J.-F. Meullenet et al. / Food Quality and Preference 14 (2003) 603–614 611

612
Table 5
Parameter estimates for the proportional odds model for external preference modeling (see Appendix)
Parametera DF Overall acceptanceb Appearance acceptancec Flavor acceptanced Texture acceptancee Purchase intentf
Estimate Chi-square P>Chi- square Estimate Chi-square P>Chi- square Estimate Chi-square P>Chi- square Estimate Chi-squar hi- square Estimate Chi-square P>Chi- square
�1 1 �2.84 415.84 <0.0001 �2.12 267.33 <0.0001 �2.70 429.79 <0.0001 �2.45 415.11 001 �2.01 388.08 <0.0001
�2 1 �0.93 147.08 <0.0001 �0.38 16.02 <0.0001 �0.94 147.42 <0.0001 �0.61 69.85 001 �0.40 31.108 <0.0001
�3 1 0.30 17.84 <0.0001 0.74 58.05 <0.0001 0.01 0.01 0.9248 0.47 42.89 001 0.83 117.76 <0.0001
�4 1 1.04 176.28 <0.0001 1.40 177.84 <0.0001 0.80 110.99 <0.0001 1.19 215.12 001 2.26 413.11 <0.0001
�5 1 1.49 290.76 <0.0001 1.90 271.84 <0.0001 1.26 230.71 <0.0001 1.71 336.34 001
�6 1 2.46 419.67 <0.0001 3.21 358.93 <0.0001 2.20 407.53 <0.0001 2.90 409.47 001
�7 1 3.21 390.25 <0.0001 4.23 272.92 <0.0001 2.92 421.12 <0.0001 3.72 329.43 001
�8 1 4.07 289.04 <0.0001 5.98 105.13 <0.0001 3.96 315.98 <0.0001 5.37 142.33 001
PC1o 1 0.50 106.58 <0.0001
PC2o 1 0.20 9.42 0.0021
PC2a 1 �0.17 6.79 0.0092
PC3a 1 �0.25 11.73 0.0006
PC4a 1 �0.85 14.90 0.0001
Shape: round 1 �0.30 2.95 0.0860
Shape: strip 1 �0.73 19.52 <0.0001
Shape: triangle 0 0.00 – –
PC1f 1 0.35 95.25 <0.0001
PC3f 1 0.22 10.53 0.0012
PC5f 1 0.35 6.96 0.0083
PC6f 1 �1.68 35.44 <0.0001
PC1t 1 0.26 40.39 001
PC2t 1 �0.11 5.88 154
PC3t 1 0.47 72.71 001
PC1p 1 0.55 125.85 <0.0001
PC2p 1 0.28 17.90 <0.0001
a PC=principal component, PCi=ith principal component, Subscripts (o, a, f, t and p) stand for acceptance of overall, appearance, flavor and texture, purchase intent, vely. Information on Shape can be found in Table 1.b Overall acceptance: PC1o=0.51SaltAftertaste+0.67Crispness�0.55a*, PC2o=0.75SaltAftertaste�0.03Crispness+0.66a*, 0.5PC1o+0.2PC2o=0.41SaltAftertaste+0.32 s�0.14a*.c Appearance acceptance: PC2a=0.18DegreeOfWhiteness+0.06GrainFlecks�0.32CharMarks+0.93a*, PC3a=0.65DegreeOfWhiteness+0.08GrainFlecks+0.75CharMa 3a*, PC4a=�0.52
DegreeOfWhiteness+0.77GrainFlecks+0.34CharMarks+0.17a*, 0.85PC2a+0.78PC3a+0.43PC4a=0.24DegreeOfWhiteness�0.68GrainFlecks�0.42CharMarks�0.33a*.d Flavor acceptance: PC1f=0.46ToastedCorn+0.49SaltAftertaste�0.45ToastedGrainAftertaste�0.24SweetAftertaste�0.39Cardboard+0.36GrainComplex, PC3f=�0.1 Corn+0.44SaltAftertaste�0.40 ToastedGrain
Aftertaste+0.69SweetAftertaste+0.06Cardboard�0.37GrainComplex, PC5f=�0.30ToastedCorn+0.74SaltAftertaste�0.53ToastedGrainAftertaste�0.26SweetAftertaste rdboard�0.03 GrainComplex, PC6f=�0.48Toast-
0.48ToastedCorn+0.02SaltAftertaste�0.41ToastedGrainAftertaste�0.10SweetAftertaste+0.51Cardboard+0.57GrainComplex, 0.35PC1f+0.22PC3f+0.35PC5f�1.68PC6f oastedCorn+ 0.50SaltAftertaste+0.63
ToastedGrainAftertaste+0.14SweetAftertaste�0.95Cardboard�0.93GrainComplex.e Texture acceptance: PC1t=�0.34Hardness+0.17Toothpack+0.51Crispness+0.37OilyFilm�0.43MoistAbsorption+0.51PersistOfCrisp+0.11LooseParticles, PC2t=0 ess
+0.56Toothpack�0.32Crispness�0.08OilyFilm�0.29MoistAbsorption+0.12PersistOfCrisp+0.55LooseParticles, PC3t=�0.45Hardness
+0.33Toothpack+0.33Crispness�0.54OilyFilm+0.40MoistAbsorption�0.10PersistOfCrisp+0.35 LooseParticles, 0.26PC1t�0.11PC2t+0.47PC3t=�0.35Hardness
+0.14Toothpack+0.32Crispness�0.15OilyFilm+0.11MoistAbsorption+0.08PersistOfCrisp+0.13LooseParticles.f Purchase intent: PC1p=0.51SaltAftertaste+0.67Crispness�0.55a*, PC2p=0.75SaltAftertaste�0.03Crispness+0.66a*, 0.55PC1p+0.28PC2p=0.49SaltAftertaste+0.36C �0.12a*.
J.-F.Meullen
etetal./FoodQuality
andPreferen
ce14(2003)603–614
e P>C
<0.0
<0.0
<0.0
<0.0
<0.0
<0.0
<0.0
<0.0
<0.0
0.0
<0.0
respecti
Crispnes
rks+0.1
6Toasted
+0.09Ca
=0.84 T
.43Hardn
rispness

increased appearance acceptance, while grain flecks,char marks and instrumental color (a*) had negativeimpact on appearance acceptance. Product shape alsoplayed an important role in determining appearanceacceptance. Triangle tortilla chips were most preferredby consumers, while strip chips were least preferred(Table 5). The R2Score and RMSEScore values for themean scores of consumer appearance acceptance for thechips were 0.85 and 0.17, respectively.
4. Conclusions
The present study demonstrated that proportionalodds models offer sensory scientists an alternativechoice for internal/external preference modeling. Use ofprincipal components in proportional odds model canavoid the collinearity problem caused by correlationbetween sensory variables. Proportional odds modelscan model the structure of ordinal categorical responsesand estimate the mean scores of the responses. Com-parison of proportional odds model analysis with otherregression models need to be performed in more details.The internal preference modeling revealed that flavor
was the most important attribute to consumer overallacceptance. The external preference modeling showedpotential for predicting consumer overall acceptance oftortilla chips using three descriptive attributes of saltaftertaste, crispness and instrumental color value a* aspredictors. The research reported here provides usefulinformation for developing an understanding of thedrivers of tortilla chips consumer acceptance. Theresults must be interpreted within the limits of experi-mental conditions. In a real purchase situation, con-sumers probably pay less attention to information thanin an experimental situation, and they can choose aproduct with a lower expected quality but with anattractive price (Siret & Issanchou, 2000). In addition,
the consumer panel was drawn from the local popula-tion and may not be totally representative of thenational population.
5. Uncited reference
Shtatland et al., 2000
Acknowledgements
The authors would like to thank Dr. James Dunn,Department of Mathematics, University of Arkansasfor the assistance with the proportional odds modeling.
Appendix
*==EXAMPLES OF FITTINGPROPORTIONAL ODDS MODELS TOOVERALL ACCEPTANCE DATA USING SASPROCEDURES;*==THE RESULTS ARE PRESENTED INTABLES 3,4 AND 5, RESPECTIVELY;
*THE DATA FORMAT USED (ONLY APORTION OF THE VARIABLES IS LISTEDHERE);DATA ChipsData;INFILE ‘‘C:n>ChipsData.txt‘‘;INPUT Panlist Product$ OverallAppearance Flavor TextureGender$ AgeGroup$ConsumptionFrequency$PreferredShape$ PreferredBrand$AftertasteSalt Crispiness Color_aProductShape$;RUN;
*THE MODEL FOR OVERALL ACCEPTANCE(THE RESULTS ARE IN TABLE 3);PROC LOGISTIC DATA=ChipsDataDESCENDING;CLASS Product GenderConsumptionFrequencyPreferredShape PreferredBrand/PARAM=GLM;MODEL Overall=Product GenderPreferredShape PreferredBrandAgeGroup ConsumptionFrequency/SELECTION=Backward SLS=0.05SLE=0.10 LINK=Logit RSQUARELACKFIT SCALE=None AGGREGATE;
Fig. 2. Predicted versus observed average consumer overall accep-
tance. Predicted average scores were obtained from sensory descriptive
attributes using a proportional odds model. Sample name abbrevia-
tions can be found in Table 1.
J.-F. Meullenet et al. / Food Quality and Preference 14 (2003) 603–614 613

TITLE1 ‘POM: Overallacceptance=Product &Demographical Variables’;RUN;
*THE OPTIMAL MODEL FOR INTERNALPREFERENCE MODELING FOR OVERALLACCEPTANCE (THE RESULTS ARE INTABLE 4);*--PRIN1:THE 1ST PRINCIPALCOMPONENT, PRIN2:THE 2NDPRINCIPAL COMPONENT,. . .;PROC PRINCOMP DATA=ChipsDataOUT=PCSEx OUTSTAT=StatEx;VAR Flavor TextureAppearance*Flavor;RUN;PROC LOGISTIC DATA=PCSEx DESCENDINGOUT=ParamsEx;MODEL Overall=PRIN1-PRIN3/SELECTION=Backward SLS=0.05SLE=0.10 LINK=Logit RSQUARELACKFIT SCALE=None AGGREGATE;TITLE1 ‘Internal PreferenceModeling For Overall Acceptance’;OUTPUTOUT=PredOverallEx(KEEP=Product_LEVEL_ Pred) P=Pred;RUN;
*THE OPTIMAL MODEL FOR EXTERNALPREFERENCE MODELING FOR OVERALLACCEPTANCE (THE RESULTS ARE INTABLE 5);PROC PRINCOMP DATA=ChipsDataOUT=PCSIn OUTSTAT=StatIn;VAR AftertasteSalt CrispinessColor_a;RUN;PROC LOGISTIC DATA=PCSIn DESCENDINGOUT=ParamsEx;CLASS ProductShape/PARAM=GLM;MODEL Overall=PRIN1-PRIN3ProductShape/SELECTION=BackwardSLS=0.05 SLE=0.10 LINK=LogitRSQUARE LACKFIT SCALE=NoneAGGREGATE;TITLE1 ‘External PreferenceModeling For Overall Acceptance’;OUTPUTOUT=PredOverallIn(KEEP=Product_LEVEL_ Pred) P=Pred;RUN;
References
Agresti, A. (1990). Categorical data analysis. New York: Wiley.
Anonymous (1998). An interview with McCormick on trends in the
snack food industry. Cereal Food World, 43(2), 60–65.
Arditti, S. (1997). Preference mapping: a case study. Food Quality and
Preference, 8, 323–327.
Buttery, R. G., & Ling, L. C. (1995). Volatile flavor components of
corn tortillas and related products. Journal of Agriculture and Food
Chemistry, 43, 1878–1882.
Buttery, R. G., & Ling, L. C. (1998). Additional studies on flavor
components of corn tortilla chips. Journal of Agriculture and Food
Chemistry, 46, 2764–2769.
Dies, C. R. (2000). Food product design: applications. Available: http://
www.Fodproductdesign.com/archive/2000/0100ap/html. Accessed
on 2 December 2000.
Hawrysh, Z. J., Erin, M. K., Kim, S. S., & Hardin, R. T. (1995). Sen-
sory and chemical stability of tortilla chips fried in canola oil, corn
oil, and partially hydrogenated soybean oil. Journal of American Oil
and Chemistry Society, 72, 1123–1130.
Jones, B., & Wang, J. (2000). The analysis of repeated measurements
in sensory and consumer studies. Food Quality and Preference, 11,
35–41.
Lawlor, J. B., & Delahunty, C. M. (2000). The sensory profile and
consumer preference for ten specialty cheeses. International Journal
of Dairy Technology, 53, 28–36.
Lisser, E. de. (1993). Tortilla chips tempt snackers with changes. Wall
Street Journal, New York p. B1(May 6).
Meilgaard, M., Civille, G. V., & Carr, B. T. (1999). Sensory evaluation
techniques (3rd ed.). Boca Raton, FL: CRC Press.
Meullenet, J.-F., Griffin, V. K., Carson, K., Davis, G., Davis, S.,
Gross, J., Hankins, J. A., Sailer, E., Sitakalin, C., Suwansri, S., &
Vasquez Caicedo, A. L. (2001). Rice external preference mapping
for Asian consumers living in the United States. Journal of Sensory
Studies, 16, 73–94.
Meullenet, J -F., Xiong, R., Monsoor, M., Bellman-Horner, T., Ziva-
novic, S., Dias, P., Fromm, H., & Liu, Z.(2002). Preference mapping
of commercial toasted white corn tortilla chips. Journal of Food
Science, 67, 1950–1957.
Rea, L. M., & Parker, R. A. (1992). Designing and conducting survey
research. San-Francisco, USA: Jossey-Bass.
Sangketkit, C., Savage, G. P., Martin, R. J., Searle, B. P., & Mason,
S. L. (2000). Sensory evaluation of new lines of oca (Oxalis tuberosa)
grown in New Zealand. Food Quality and Preference, 11, 189–199.
SAS OnlineDoc (Version 8) (2001). SAS/STAT user’s guide: proc
logistic procedure. Cary, NC: SAS1 Institute.
Shtatland, E. S., Moore, S., & Barton, M.B. (2000). Why we need an
R2 measure of fit (and not only one) in PROC LOGISTIC and
PROC GENMOD. In Proceedings of the twenty-fifty annual SAS
users group international conference (pp. 1338–1343), Indianapolis,
USA, 9–12 April.
Siret, F., & Issanchou, S. (2000). Traditional process: influence on
sensory properties and on consumer’s expectation and liking. Food
Quality and Control, 11, 217–228.
Stinson, C. T., & Tomassetti, S. J. (1995). Effect of natural corn flavor
on the sensory quality of low fat tortilla chips. Food Technology,
49(5), 84 88–90.
Tepper, B. J., Young, S. C., & Nayga, R. M. (1997). Understanding
food choice in adult men: influence of nutrition knowledge, food
beliefs and dietary restraint. Food Quality and Preference, 8(4), 307–
317.
Vaisey-Genser, M., Malcolmson, L. J., Ryland, D., Przybylski, R.,
Eskin, N. A. M., & Armstrong, L. (1994). Consumer acceptance of
canola oils during temperature-accelerated storage. Food Quality
and Preference, 5(4), 237–243.
Wellman, D. (1997). Snack foods. Supermarket Business, 52(9), 64.
614 J.-F. Meullenet et al. / Food Quality and Preference 14 (2003) 603–614