
u22 - étude critique de photographies et d'autres œuvres ...
Upload
khangminh22Category
view
1download
0
TECHNOLOGIE ADVANCE POUR LA GÉNOMIQUE ET LA CLINIQUES
ÉTUDE FONCTIONNELLE DES ENHANCERS LYMPHOIDES
Soutenue le 11/12/2017 devant le jury composé de:
Par
Pr. Pascal RIHET Président
Dr. Jean-Christophe ANDRAU Rapporteur
Dr. Thomas SEXTON Rapporteur
Dr. Veronique ADOUE Examinateur Dr. Catherine NGUYEN Examinateur
Dr. Salvatore SPICUGLIA Directeur de thèse

Defended on 11/12/2017 in front of jury members:
Pr. Pascal RIHET President
Dr. Jean-Christophe ANDRAU Reporter
Dr. Thomas SEXTON Reporter
Dr. Veronique ADOUE Examiner Dr. Catherine NGUYEN Examiner
Dr. Salvatore SPICUGLIA Supervisor

Acknowledgement
First and foremost I acknowledge jury members Jean-Christophe Andrau, Thomas
SEXTON, Veronique ADOUE, Catherine NGUYEN and Pascal RIHET who dedicated
their time for critical reading, proof and assessing my dissertation. I am grateful for their
valuable input and candid advice that actually helps enlarging my vision of science.
I would like to offer my sincerest gratitude to my supervisor, Dr. Salvator SPICUGLIA,
who has supported me throughout my thesis with his patience and knowledge. I
attribute the level of my PhD degree to his encouragement and effort and without him
this thesis, too, would not have been completed or written. One simply could not wish
for a better or friendlier supervisor.
I offer my enduring gratitude to the lab mate Eve-lyne MATHIEU for his indispensable
help in conducting my experiments. My PhD is credited to hersupport and devoted
guidance, always providing coherent answers to my questions.
I owe particular thanks to Magali TORRES who always help me to do my work and her
valuable guidelines. I am honored to meet a person like her.
Also essential to my success as a graduate student I would like to mention Denis
PUTHIER whose computational expertise help me a lot.
Thanks to our collaborators Mohamed Belhocine, Ariel Galindo, Guillaume
Charbonnier, Lan T. M. Dao, Saadat Hussain, David Santiago, Wiam Saadi, Yasmina
Kermezli who have been involved in this work and provided intellectual materials and
moral support throughout.
Thanks to all members of the TGML for performing ChIP-Seq and RNA-Seq. Many thanks
to the staffs of TAGC for creating an environment where I can focus on doing great
science, working with you have been extremely fun, stimulating and educational. I am
very happy to spend the most beautiful of my life with you. Thanks so much for all.
I would like to acknowledge funding THI-QAR University and Iraqi Ministry of Higher
Education and Scientific Research. Without their support I would never had a chance
to carry out my PhD in France. For the last years I have had the privilege of being a part
of the best graduate program at Aix-Marseille University. This fundamental education
provides the solid foundation for my future careers.
Last but not least, I would like to express my special thanks to my entire dear friends
everywhere for their supports, kindness and amity. All of you have been an
indispensable part of my life. My life is happier and meaning when I meet you.

Above all, thank a lot to My Mother, who is a woman like no other. She gave me life,
nurtured me, taught me, dressed me,fought for me, held me, shouted at me, kissed me,
but most importantly she loved me unconditionally. There are not enough words to
describe just how important my mother is to me, and what a powerful influence she
continues to be. Mother, I Love You.
Thanks so much to Souls My Father's and My Brother's, hard to say how much I
missed you, and this dissertation is a gift to you. I would like to thank all my family: My
Brothers, Sisters and my nephews and nieces to supporting me spiritually and for
giving me the best reasons to finish this dissertation and my life in general.
Résumé
Près de 18 ans se sont écoulés depuis que le projet Génome humain a révolutionné le monde de la génomique et de la génétique en séquençant les 3,2 milliards de paires de bases du génome humain. Alors que la communauté scientifique s'attendait à trouver environ 100 000 gènes, l'analyse du génome humain n'a révélé que 20.500 gènes couvrant 1,50% du génome. La première constatation était donc que la complexité de l'organisme n'est pas corrélée au nombre de ses gènes; et le second, que 98,50% du génome était "inutile" (ou ADN poubelle). On sait maintenant que cet ADN non codant fait partie intégrante de la complexité des organismes vivants. De nombreux processus qui conduisent à la complexité des organismes ont été identifiés. Parmi ces processus, la régulation de l'expression des gènes semble inévitable. En effet, ce processus biologique universel est essentiel au développement et au fonctionnement de tous les organismes vivants. Chez les mammifères, organismes étudiés au cours de ma thèse, ces mécanismes reposent fortement sur l'existence de séquences non codantes dans le génome qui agiront indirectement sur la machinerie transcriptionnelle afin d'ajuster avec précision le niveau d'expression des gènes. Les régions cis-régulatrices contiennent en général plusieurs modules de régulation autonomes qui varient entre 50 et 1.500 pb. Chacun de ces modules semble être conçu pour exécuter une fonction spécifique, telle que l'activation de son gène associé dans un type cellulaire spécifique ou à un stade particulier du développement. Les amplificateurs (aussi appelés par le terme anglais enhancers) ont été initialement identifiés comme des séquences d'ADN agissant en cis qui augmentent la transcription d'une manière qui est indépendante de leur orientation et de leur distance par rapport au site d’initiation de la transcription. En outre, les gènes d'identité cellulaire sont souvent associés à des regroupements ou clusters d’enhancers, structures également appelées super-enhancers, censés assurer une régulation correcte de l'expression des gènes tout au long du développement et de la différenciation des cellules. Pour mieux comprendre la régulation des gènes à partir de ces réseaux régulateurs complexes, nous avons étudié la régulation du gène Ikzf1 qui code pour un facteur de transcription essentiel à la différenciation lymphoïde et également impliqué dans la leucémogenèse. En combinant différents types de données épigénomiques, nous avons privilégié l’étude d’un élément enhancer situé à 120 kb en amont du gène Ikzf1. Nous avons trouvé que la délétion de l'enhancer IkE120 entraine une réduction significative de l'ARNm d’Ikzf1. Cependant, nous avons observé que la transcription immature ainsi que l’usage des promoteurs et exons alternatifs d’Ikzf1 sont différemment affectée dans les cellules délitées par IKE120. Ces résultats semblent indiquer que l'élément IkE120 pourrait avoir des fonctions supplémentaires au-delà de la seule régulation de l'initiation de la transcription. Ma thèse est structurée en 7 chapitres. Dans le premier chapitre, j'ais traité de la régulation transcriptionnelle chez les mammifères et des facteurs contribuant à la régulation transcriptionnelle. Dans le chapitre deux, j'ai résumé le rôle fonctionnel des amplificateurs sur l'expression des gènes. Dans les chapitres trois et quatre, j'ai discuté des méthodes qui peuvent être utilisées pour étudier les éléments régulateurs, y compris les tests rapporteur, les manipulations génétiques par le système CRISPR/Cas9 et les stratégies pour étudier les interactions à long terme de la chromatine. Dans les cinquième et sixième chapitres, je me suis particulièrement concentré sur la différenciation des lymphocytes T et sur les facteurs de transcription impliqués. Les résultats sont présentés au chapitre sept. Enfin, au huitième chapitre, je présente une discussion générale et des perspectives à long terme.

Abstract
It has now been almost 18 years since the outcome of the Human Genome project revolutionized the world of genomics and genetics by sequencing the 3.2 billion base pairs of the human genome. While the scientific community was expecting to find around 100,000 genes, the analysis of the human genome revealed only 20,500 genes covering 1.50% of the genome. The first finding was therefore that the complexity of organism was not correlated to the number of its genes, since humans have almost half as much as rice (32000-50000 genes); and the second, that 98.50% of the genome was "unnecessary" (junk DNA). It is now known that these 98.50% non-coding DNA are an integral part of the complexity of living organisms. In more than a decade, many processes that have led to the complexity of organisms have been identified. Among these processes, the regulation of the expression of genes seems unavoidable. Indeed, this universal biological process is essential for the development and functioning of all living organisms, even if the mechanisms used differ between prokaryotes and eukaryotes. In mammals, organisms studied during my thesis, these mechanisms rely heavily on the existence of non-coding sequences within the genome that will indirectly act on transcriptional machinery in order to accurately adjust the level of gene expression.
Transcriptional control regions often contain multiple, autonomous enhancer modules that vary from about 50 bp to 1.5 kbp in size. Each of these modules appears to be designed to perform a specific function, such as the activation of its cognate gene in a specific cell type or at a particular stage in development. Enhancers were originally identified as cis-acting DNA sequences that increase transcription in a manner that is independent of their orientation and distance relative to the RNA start site. In addition, cell identity genes are often associated with cluster of enhancers, also termed super-enhancers, which are believed to ensure proper regulation of gene expression throughout cell development and differentiation. To better understand gene regulation based on these complex regulatory networks, we studied the regulation of the Ikzf1 gene which encoded for a lymphoid-specific transcription factor essential for lymphoid differentiation and also involved in leukemogenesis. By combining different epigenomics data sets we prioritize an enhancer element located 120 kb upstream the IKZF1 gene. We found that deletion of the E120 enhancer resulted in significant reduction of Ikzf1 mRNA. However, we observed that immature transcription, promoter and exon usage were differentially affected in the IKE120-deleted cells. The results indicated that E120 element might have additional functions over solely regulating transcription initiation. We suggest that expression of some tissue-specific and cell identity genes might, at least partially, be regulated at the level of mRNA maturation and that components of enhancer’s clusters are directly involved in this process.
My thesis is structured into 7 chapters. In the first chapter, I had dealt with transcriptional regulation in mammals and the important factors contributing to transcriptional regulation. In chapter two, I summarized the functional role of

enhancers on gene expression. In chapters three and four, I discussed the powerful methods that can be used to study regulatory elements including the enhancer assays, the recently developed genome editing by CRISPR/Cas9 system and the strategies to study long-range chromatin interactions. In the fifth and sixth chapters, I focused particularly on the T cell differentiation and involved transcription factors. The results are presented in chapter seven. Finally, in the eighth chapter, I give a general discussion and long-term perspectives.

Principal Abbreviations
ATP Adenosine Triphosphate
CD4/8 Cluster of Differentiation 4 or 8.
ChIP Chromatin Immunoprecipitation.
ChIP-Seq Chromatin Immunoprecipitation coupled with high throughput sequencing.
CpG CG dinucleotide.
CRE Cis regulatory element.
CRM Cis regulatory Module.
CTCF CCCTC-binding Factor.
CREB C-AMP Response Element-binding protein.
CBP CREB-Binding Protein.
CRISPR Clustered Regularly Interspaced Short Palindromic Repeats.
CTs Chromosome Territories.
DHS DNAseI Hypersensitivity Site.
DN Double Negative.
DNMT DNA MethyTransferase.
DP Double Positive.
DBD DNA-Binding Domain.
ETP Early Thymic Progenitor.
eRNA enhancer RNA.
GTF General Transcription Factor.
HATs Histone AcetylTransferases.
HDAC Histone Deactylase.
HSC Hematopoietic Progenitor Cell.
HDM Histone DeMethylation.
5hmC 5-hydroxymethyl-Cytosine.
LCR Locus Control Regions.

LncRNS Long non-coding RNAs
LincRNA intergenic lncRNAs
MLL Mixed-Linage Leukemia Proteins.
NHEJ Non Homologous End Joining.
PIC Preinitiation Complex.
RNA POlII RNA Polymerase II.
PreTCR pre-T cell receptor.
pTa pre-T a chain of preTCR.
RAG Recombination Activating Gene.
sgRNA Single guide RNA
SP Single Positive.
STARR-seq Self-Transcribing Active Regulatory Region sequencing.
TCR T cell Receptor.
TF Transcription Factor.
TFBS Transcription Factors Binding Site.
TSS Transcription Start Site.
TET Ten-eleven Translocation.
Contents
Introduction Pqge
Chapter 1. Transcriptional regulation
I .Transcriptional regulation in mammals 1
1. Regulation of gene expression in mammals 1
2. The importance of transcriptional regulation 1
II. Transcription regulatory Factors 2
1. Chromatin structure 2
2. DNA methylation 2
3. Post-translational histone modification 3
4. Transcription factors 6
5. Cis-regulatory elements 7
6. Promoter 8
7. Enhancer 9
8. Insulators 10
9. Silencer 10
10. Long non-coding RNAs 11
Chapter 2. Functional role of enhancers
I. Transcriptional regulation by enhancers 14
1. Definition of enhancers 14
2. Functional enhancer features 15
3. Enhancer States 17
4. Super-enhancers 17
5. Enhancer transcription 19
6. Regulation of gene expression by communication of enhancers and promoters 21

7. Methods of studying long-range interaction between regulatory elements 23
8. Chromatin Conformation Capture (3C) 25
Chapter 3. High-throughput reporter assays
1. Overview 27
2. Conventional enhancer reporter assays 27
3. Massively Parallel Reporter Assays (MPRAs) 28
4. Self -Transcribing Active Regulatory Region Sequencing (STARR-seq) 29
5. CapStarr-seq 30
Chapter 4. Genome editing by CRISPR/Cas9
1. Introduction 32
2. Genome editing in diverse eukaryotic cells and organisms 33
3. Induction a knockout or knockin by CRISPR/Cas9 system 34
4. CRISPR/Cas9 applications 36
Chapter 5. T cell differentiation
1. Introduction 39
2. Development and thymus selection of T lymphocytes 39
3. The α, β T cell differentiation pathway 40
3.1. Expression of the pre-TCR to the membrane of the thymocytes 41
3.2. The positive selection 42
3.3. The negative selection 43
Chapter 6. Transcription factors involved in T cell differentiation
6.1. Introduction 45
6.2. Ikaros 47
6.2.1. Ikaros structure and function 48
6.2.2. Ikaros alterations in hematologic malignancies 49
6.3. Runx1Transcription Factor 49

6.4. Ets Transcription Factors 49
6.5. HebTranscription Factor 51
6.6. Tcf1 Transcription Factor 51
Results
Chapter 7. Functional Study of Lymphoid specific enhancers
1. Objectives 53
2. Functional study of an Ikzf1 enhancer 53
3. Contributions 53
MANUSCRIPT. Multiple functions of an Ikzf1 enhancer in regulating
gene Expression 56
4. Additional results: Functional Study of Lymphoid specific enhancers 57
5. Contributions 57
Discussion
Chapter 8. 61
1. Short summary of results 62
2. Enhancers might control gene expression by different mechanisms 65
3. Off- target effect in CRISPR/Cas9 system 67
3. Long-term perspectives 68
References 69
Annexes 86
Annex 1. Article. Genome-wide characterization of mammalian
promoters with distal enhancer functions.

1
INTRODUCTION
2
Chapter 1
I. Transcriptional regulation in mammals
1. The regulation of gene expression in mammals:
All of the cells of an organism have an identical genome; the cells diversity of some
3.72 × 10¹³ cells (Bianconi et al., 2013) that make up the human body is considerable. The
number of different cell types is estimated between 210-411 according to the classification
methods used (Vickaryous and Hall, 2006). In addition, the copy of the whole genome in
every cell contains more than 20,000 genes, 3 billion letters of DNA. While each individual
is established by hundred specialized cell types and many organs with that shared genome.
The traditional opinion of the central dogma of biology is that "the genetic information
encoded by DNA is transcribed into messenger RNA (mRNA); each mRNA translated to a
specific protein (or a small number of proteins)". The gene products are produced when
and where required by the cells in an organism. Except for house-keeping genes, that is
mostly constant. The regulation of gene expression is the origin of this great cell diversity
and constitutes a major source of complexity in mammals by its involvement in cell
differentiation (Venter et al., 2001).
2. The importance of transcriptional regulation
Gene regulation consists of activating, repressing or modulating the expression of the gene
of a cell in a very specific way (Kouadjo et al., 2007).The monitoring of gene expression is a
biological process necessary to all organisms. This is achieved by the interaction of
regulatory proteins and specific DNA motifs in the control regions of the genes that they
regulate (Velculescu et al., 1999). Most genes have distinct transcription levels across the
life cycle, according to the environmental conditions, in different cell types and regions, and
among sexes. Transcriptional regulation is an exceedingly powerful process: rates of RNA
synthesis can vacillate by orders of size, change after some time scales of minutes, and vary
among nearby cells. Many genes have spatially and temporally heterogeneous expression
patterns. Genes encoding regulatory proteins have probably the most complex expression
profiles.(Gerhart and Kirschner, 1997; Davidson, 2001; Gregory, 2003). In spite of the fact
that the transcription profiles of "housekeeping" genes are for the much simpler, most are
transcribed at various levels among cell types and are closed down in response to
extraordinary environmental conditions such as heat shock (Gregory, 2003).
So, even if most of the cells of a body contain the same genome, every cell expresses only a
part of its genes grace to the genetic regulation. According to the combination of the
expressed genes, every cell possesses a unique profile of expression which is going to
confer its morphological characteristics and specific functions. Gene expression can be
regulated at many steps in the pathway from DNA to RNA to protein including the
modulation of chromatin states, transcription initiation and elongation, mRNA processing,
transport, translation, and stability. As a mandatory condition and as a fundamental step of

3
gene expression, the regulation of transcription from DNA to RNA is essential. Also within
this process, the regulation of transcription is complex and is dependent on both cis and
trans regulatory elements as shown in (Fig. 1.1).
Figure 1.1 | The structure of a eukaryotic protein-coding gene. Regulatory sequence
controls when and where expression occurs for the protein coding region (red). Promoter
and enhancer regions (yellow) regulate the transcription of the gene into a pre-mRNA
which is modified to remove introns (light grey) and add a 5' cap and poly-A tail (dark
grey). The mRNA 5' and 3' untranslated regions (blue) regulate translation into the final
protein product. (Adapted from Thomas and Rohan, 2017)
II. Transcription regulatory Factors
1. Chromatin structure
Chromatin structure is controlled by epigenetic modifications that affect the chemical
properties of histones and some DNA bases. Histone changes are made on the tails of
histone proteins to alter the formation of chromatin and to create binding regions of the
protein and enzymatic complexes. The scientists also noted that the distribution of these
changes is not random, there are changes indicating the existence of promoters and
changes indicate the presence of enhancers ... Etc.
2. DNA methylation
The methylation of DNA is an important mechanism for maintaining the stability of the
genome by silencing the effectiveness of the jumping elements and others. The process is
usually done for the 5- cytosine within the islands of CpG dinucleotides (5mC), which
extends to about 200 bases and replaces the hydrogen atom with the methyl group (CH3)
by family of methyltransferases (DNMTs) including DNMT1, DNMT3A, and DNMT3B. It is
found that the methyl group does not affect the transcription into RNA but is associated

4
with the removal of the transcription machinery and silencing the gene. This is the result of
the spatial isolation of the Hindrance Steric and preventing the arrival of the transcription
machines into DNA. There are also proteins that can bind to the methylated DNA such as
MeCP2, MBD1, MBD2, MBD3, and KAISO.
The degree of methylations within the human genome is high and intense. In human
somatic cells, m5C accounts for ∼1% of total DNA bases and therefore affects 70%–80% of
all CpG dinucleotides in the genome. This average pattern conceals intriguing temporal and
spatial variation (Bird, 2002).
On the pathway of DNA demethylation, 5mC can be converted into 5-hydroxymethyl-
cytosine (5hmC) through the enzymatic oxidation by ten-eleven translocation (TET)
enzyme family (TET1, TET2, TET3) (Tahhiliani et al.,2009), reviewed in (Dahl et al.,2011;
Kriukine et al.,2012) (Fig. 1.2). In contrast to 5mC, the demethylated nucleotides facilitate
the DNA to become transcriptionally active, allow for gene expression. For instance, the
formation of 5hmChas been detected at promoters, enhancers and gene bodies of various
cell types and positively correlated to gene expression (Stroud et al., 2011; serandour et al.,
2011; Ficz et al., 2011). The dynamic transformation of DNA through methylation is an
important epigenetic regulation. Many genome wide mapping studies of 5hmC were
performed to profiling DNA hydroxymethylcytosine by sensitive, accurate methods.
Recently, the single-base resolution for 5hmC map in both mouse and human can be
achieved by studies of (Serandour et al., 2016) and (Wen et al., 2014).
Figure 1.2| Schematic representation of DNA methylation, which converts cytosine to 5’methyl-
cytosine via the actions of DNA methyltransferase (DNMT). DNA methylation typically occurs at
cytosines that are followed by a guanine (i.e., CpG motifs).(Adapted from Jeremy et al., 2010).
3. Post-translational histone modification
Eukaryotic DNA is packaged into a macromolecular structure known as chromatin by
wrapping 147 base pairs of naked DNA around the histone octamer containing two copies
of every core histone H2A, H2B, H3 and H4(Luger et al., 1997). With the addition of linker
histone H1 that binds to the nucleosome at the DNA entry-exit purpose, protective the DNA
linking adjacent nucleosomes, more compaction, and condensation is achieved (Robinson
and Rhodes, 2006). In order to facilitate cellular functions like replication, transcription

5
and DNA repair, the compaction of DNA is applied in a specific method that provides of two
structurally and functionally distinct chromosomal domains; called euchromatin,
representing the transcriptionally active, loosely packaged, gene-rich regions and the
extremely condensed, and also gene-poor heterochromatin(Huisinga et al., 2006). The
transition among euchromatin and heterochromatin is really affected by mechanisms
including DNA methylation, non-coding RNAs and RNA interference (RNAi), DNA
replication-independent association of histone variants and histone post-translational
modifications.
Lysine acetylation associated with chromatin openness and transcriptional activation. The
acetylation of lysine 27 (H3K27ac) has shown to mark at active promoters and distal
regulatory elements (Heintzman et al., 2009; Creyghton et al., 2010). Trimethylation of
histone H3 lysine 4 (H3K4me3) and H3 lysine 36 (H3K36me3) are both correlated with
transcribed chromatin, however, H3K4me3 marks mainly promoter region and some active
enhancers (Pekowska et al., 2011), whereas H3K36me3 is located along gene body of the
transcribed gene (Barski et al., 2007; Mikkelsen et al., 2007). In opposition to these active
marks, trimethylation of H3 lysine 9 (H3K9me3), H3 lysine 27 (H3K27me3) and H4 lysine
20 (H4K20me3) are generally correlated to gene repression (Mikkelsen et al., 2007; Zhu et
al., 2012). The combination of mapping many histone modifications helps to identify the
distinguished genomic elements (Table 1.1). However, the levels of modification do not
necessarily reflect the activity of regulatory elements.
Table 1.1: Post-translational histone modification
Modification Histones Effects of transcription
K=Lysine, R= Arginine, S= Serine, T= Threonine
Modify site

6
Most epigenetics process are carried out by enzymes, protein complexes or small
sections of RNA. These enzymes are divided into: Writers are enzymes that add
molecules to modulate DNA or histone; Erasers are the enzymes that remove the
work of writers enzymes; Readers are the enzymes or proteins that perform the
necessary processes after modification (Williams, 2013), as shown in (Fig. 1.3). As a
result of these activities, there is an Epigenetic Code because the modification that
occurs to these proteins are varied, and reflects the environmental effects, the
phenotypic pattern of the cell and the life of the organism (Bierne et al., 2012).
Figure 1.3|Tools of epigenetics. Enzymes that introduce distinct post- translational
modification in histones. (Adapted fromTarakhovsky, 2010).
Histone modification represents an essential role in epigenetics; affecting transcription,
DNA replication, and DNA repair (Esteller, 2008). Histone acetylation at lysine residues is
organized principally by the opposing actions of two families of enzymes the HATs that
acetylate histones and the HDACs (Shahbazian and Grunstein, 2007). HATs, which convey
acetyl groups from acetyl-CoA to lysine residues, involve three main subfamilies that are
functionally distinct—GCN5-related N-acetyltransferase (GNAT), MYST histone
acetyltransferase, and p300/ CBP HDACs, in opposition, exclude acetyl groups from
histones; they contain four groups (classes I–IV) (Zhang and Dent 2005), some of which are
reliant on Zn2+ (Haberland et al. 2009). Class III HDACs, identified as sirtuins, despite,
require NAD+ as a cofactor. In usual, histone acetylation occurs in transcriptional
activation, whereas deacetylation is correlated with gene silencing (Lane and Chabner,
2009).
Histone methylation is performed by HMTs. They can be divided into three types: SET
domain and non-SET domain lysine methyltransferases, and arginine methyltransferases.
All of these use SAM as a coenzyme to carry methyl groups to lysine or arginine residues of
substrate proteins. There are three different levels of lysine methylation (i.e., mono-, di-,
and tri-methylated) (Varier and Timmers, 2011). Histone methylation can be associated
with transcriptional activation or repression, depending on the location of the lysine that is

7
modified (Berger, 2007). For example, methylation of H3K4, H3K36, and H3K791 is
connected with active transcription, whereas methylation of H3K9, H3K27, and H4K20
frequently shows silenced chromatin. Histone demethylation is performed by a group of
enzymes collectively known as HDMs. Histones are phosphorylated principally on serine,
threonine, tyrosine as well as much less studied sites such as arginine, histidine and lysine.
Phosphate groups are attached to and removed from the target histone residue by histone
kinases and phosphatases respectively. The transfer of a phosphate group from ATP to the
hydroxyl group of the amino acid side chain introduces a negative charge, which can induce
electrostatic interaction within chromatin (Bannistor et al., 2011).
There are two main ways of how histone modification can affect transcriptional regulation.
Firstly, histone modification may directly change the chromatin structure or its dynamics.
For example, acetylation of a lysine neutralizes its positive charge and reduces the affinity
of positive charge on histone to the negative charge on DNA; therefore loosen the
chromatin (Choi and Howe, 2009). Secondly, histone modifications can act indirectly as
signals to be recognized by "readers" who translate these modifications into
transcriptional outcome (Strahl and Allis, 2000).
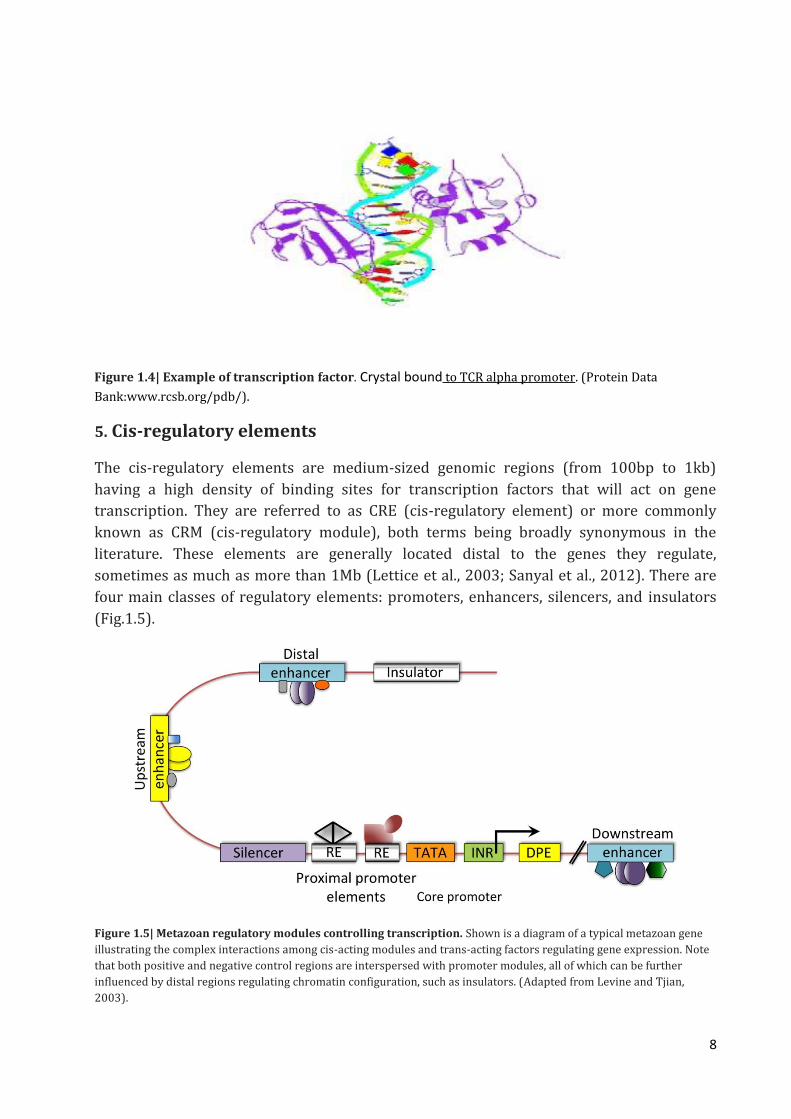
4. Transcription factors
Transcription factors are proteins that act on the regulation of the transcription of the
genes, either by activating or inhibiting transcription. These factors are fixed on specific
DNA sequences called the binding site (TFBS, Transcription Factor Binding Site) by way of
their DNA binding domain (DBD, DNA binding Domain) (Fig. 1.4). In addition to this
binding domain, transcription factors possess activation or repression domains in order
toact on gene transcription, and potentially domains of multimerization and regulation.
Many transcription factors will, in fact, form hetero or homo-dimers before binding to DNA
such as NFY (Nuclear transcription factor Y) which is composed of three subunits (NFYA,
NFYB, and NFYC) (Kim et al., 1996), or NFKB1 which is a dimer consisting of proteins
comprising a Rel-like domain(Lin et al., 2000). Moreover, some factors can be regulated by
post-translational modifications such as CREB (C-AMP Response Element-binding protein)
which must be phosphorylated before it can be read with DNA (Gonzalez et al., 1989).
There are many mechanisms by which TFs regulate gene expression. For instance, TFs can
recruit and stabilize the binding of the RNA-Polymerase II (RNAPII), or catalyze the
acetylation or deacetylation of histone proteins or recruit coactivator or corepressor
proteins during protein-protein interactions to the transcription factor DNA complex. The
TFs that bind directly to core promoters are named general transcription factors (GTFs). In
order to begin the transcription, the six GTFs (TFIID, TFIIA, TFIIB, TFIIF, TFIIE, and TFIIH)
together with RNAPII and other mediator proteins compose the basic transcriptional
apparatus and take a seat on the promoter and activate transcription.
8
Figure 1.4| Example of transcription factor. Crystal bound to TCR alpha promoter. (Protein Data
Bank:www.rcsb.org/pdb/).
5. Cis-regulatory elements
The cis-regulatory elements are medium-sized genomic regions (from 100bp to 1kb)
having a high density of binding sites for transcription factors that will act on gene
transcription. They are referred to as CRE (cis-regulatory element) or more commonly
known as CRM (cis-regulatory module), both terms being broadly synonymous in the
literature. These elements are generally located distal to the genes they regulate,
sometimes as much as more than 1Mb (Lettice et al., 2003; Sanyal et al., 2012). There are
four main classes of regulatory elements: promoters, enhancers, silencers, and insulators
(Fig.1.5).
Figure 1.5| Metazoan regulatory modules controlling transcription. Shown is a diagram of a typical metazoan gene
illustrating the complex interactions among cis-acting modules and trans-acting factors regulating gene expression. Note
that both positive and negative control regions are interspersed with promoter modules, all of which can be further
influenced by distal regions regulating chromatin configuration, such as insulators. (Adapted from Levine and Tjian,
2003).

9
6. Promoter
The main role of the promoter is to bind and rightly position the transcription initiation
complex, whose main catalytic activity consists of DNA-dependent RNA polymerase. In
mammals, RNA polymerase II (RNAPII)-transcribed genes are highly heterogeneous with
regard to expression level and specificity setting. Consequently, their transcriptional
control requires being highly specialized and dynamic; a major part of this variety is
interfered by different classes of RNAPII promoters that oppose dramatically in their
design, which in turn limits the promoter function and regulation nature (Sandelin et
al.2007; Valen and Sanddlin, 2011). In eukaryotes, the term ‘core promoter’ is usually
accustomed focus on the DNA region within the directly adjacent of the Transcription Start
Sites (TSS), which is expected to berth the pre-initiation complex (PIC).In the normal
aspect of RNAPII promoter function (Fig.1.6), the core promoter consists of many
interchangeable sequence elements around the TSS, which attach parts of the PIC (Boris
and Lenhar, 2012).
Figure 1.6| A summary of promoter elements and regulatory signals. Chromatin is
comprised of DNA wrapped around histones to form nucleosomes. The structure of chromatin can be tightly wrapped or
accessible to proteins. Boundaries between these states may be marked by insulators. The region around the
transcription start site (TSS) is often divided into a larger proximal promoter upstream of the TSS and a smaller core
promoter just around the TSS. The exact boundaries vary between studies. To recruit RNA polymerase II (RNAPII) and to
activate transcription of the gene, sequence-specific regulatory proteins (transcription factors) bind to specific sequence
patterns (namely, transcription factor binding sites (TFBSs)) that are near to the TSS (proximal elements) or that are far
away from it (enhancers). TFBSs can also occur in clusters, forming cis-regulatory modules. (Adapted from Boris, 2012).
Alternately, in some kinds of promoters, the motifs themselves may not be the main
determinants of TSS positioning. In the traditional model, the regulative input to the core
promoter contain of transcription factors binding to sites, either in the promoter region of
10
many hundred base pairs of the TSS (at proximal elements) or more away (at distal
elements). However, the difference among these two fundamental classes (the high- and
low-CpG promoters) has newly been challenged to an extent by the presentation that
dividing promoters into ‘sharp’ and ‘broad’ presents a better functional classification of
promoter types than a CpG versus none-CpG distinction(Rach et al.,2011). Some promoters
comprise both a functional TATA box and a CpG island, and there are signs that such
promoters are able of both TATA-dependent and TATA-independent transcriptional
initiation (Ponjavicet al., 2006; Boris, 2012).
7. Enhancer
Enhancers were initially defined as short DNA fragments with many prominent traits,
including the ability to positively influence target gene expression; functional
independence of genomic distance and direction proportional to the interest gene
promoter; hypersensitivity to DNase treatment, indicative of a de-compacted chromatin
case; the appearance of specific DNA sequences permitting the binding of transcription
factors (TFs); and enriched coupling of transcription co-activators and histone
acetylation(Bulger and Groudine, 2011;Levine, 2010;Blackwood and Kadonaga, 1998).
The first enhancer identified was a 72 bp long DNA fragment from the late gene region of
simian virus SV40 that enhanced the expression of a reporter gene promoter by ~ 200-fold
(Banerji, et al., 1981, Moreau et al.1981). Additional work illustrated the presence of
cellular enhancers’ in vivo (Banerji et al., 1983; Gillies, et al., 1983). Thereafter, molecular
genetic studies have uncovered several enhancers that function in different cell types and
developmental systems (Bulger and Groudine, 2011; Levine, 2010; Blackwood and
Kadonaga, 1998). Enhancer sequences comprise short DNA motifs which serve as binding
situations for sequence-specific transcription factors. These proteins induct co-activators
and co-repressors such that the combined regulatory signals of all joined factors regulate
the activity of the enhancer. Moreover, activity of enhancer has been shown to link with
specific features of chromatin. Active enhancers are usually free of nucleosomes, the
structural units of chromatin, such that the DNA is available and can be bound by
transcription factors (Fig.1.7). In addition, nucleosomes in the nearness of active enhancers
usually consist of histones with features post-translational modifications, like histone H3
lysine 4 monomethylation (H3K4me1) and H3K27 acetylation (H3K27ac), at their amino
termini. Functional status of enhancers that have been proven repeatedly is that they seem
to behave regardless of distance and orientation to their target genes, and can operate at
long distances of several hundred kilobases or even megabases via looping (Amano et
al.2009; Daria et al.,2014). Furthermore, enhancers keep their functions separately of the
sequence context (for example, if put into heterologous reporter constructs). Eventually,
enhancers are modular, and they participate additively and partly repetitively to the
general expression pattern of their target genes (Daria et al., 2014).

11
.
Fig. 1.7| Enhancers are distinct genomic region that contain binding site sequences for transcription
factors (TFs) and that can upregulate the transcription of a target gene from its transcription start site (TSS).
Along the linear genomic DNA sequence, enhancers can be located at any distance from their target genes,
which makes their identification challenging.(Adapted from Shlyueva et al., 2014).
8. Insulators
Insulators are identified as DNA element that limits the action of long-range regulatory
elements, such as enhancers, so that they act on the proper promoter target (Sanyal et al.,
2012; Bernstein et al., 2014). One step to do this is through an enhancer-blocking activity.
When placed between an enhancer and a target promoter, such an insulator can block the
activity of the enhancer and whereby defeat gene expression (Neph et al., 2012). CCCTC-
binding factor (CTCF) is the main protein responsible for the enhancer-blocking activity of
mammalian insulators (Thurman et al., 2012). Insulators that work as barriers can block
position impacts when they surround a stably integrated reporter gene (Ogbourn and
Antalis, 1998), probably by blocking the prevalence of repressive heterochromatin from
the position of incorporation into the reporter gene. This is an independent activity from
enhancer blocking, and it needs various proteins such as upstream stimulatory factor
(USF), which in turn recruits histone modifying enzymes (Ogbourn and Antalis, 1998). The
enhancer blocking and barrier activities can happen together in some insulators or
individually in others.
9. Silencers
Silencers have a negative effect on the expression of the genes that they regulate by
decreasing their transcriptional level. Like enhancers, these distal regulatory sequences
consist of several sites that will allow the fixation of transcription factors (Repressors) and
specific corepressors. The silencer activity is generally independent of their position or
orientation in the genome, although some studies have shown the existence of position-
dependent silencers (Ogbourn and Antalis, 1998). However, silencer studies have revealed

12
the atypical role of certain cofactors, for example in converting a transcription factor
(activator), usually associated with enhancers as a repressor factor (Perissi et al., 2004).
Similarly, the study of the NRSE (Neuron-Restrictive Silencer Element) element showed
that NRSE may either silence or enhance transcription depending on the cellular context
within the nervous system (Bessis et al., 1997).
10. Long non-coding RNAs
Recent genome wide studies have revealed that two-thirds of the genome is being
transcribed but a minority of transcriptional output encode for proteins (Bertone et al.,
2004; Carninci et al., 2005; Birney et al.,2007; Kapranov et al., 2007). One class of non-
coding RNAs is termed long non-coding RNAs (lncRNAs) which is classified as non-coding
RNA transcripts longer than 200 nucleotides, lncRNA are characterized by being
transcribed from RNAPII but at low level, exhibit alternative splicing, multiexonic,
polyadenylatd, and generally exhibit low coding potential (Kapranov et al.,2007; Guttman
et al., 2009). Studies of lncRNA localization have shown that lncRNAs are expressed from
different genomic regions, thus, the different type of lncRNAs can be classified according to
their relative location to the nearby coding genes. Follow that, there are intergenic
(lincRNA), antisense, intronic and divergent classes of lncRNAs. Intergenic lncRNAs are
separate transcriptional units from coding genes, generally defined with at least 5 kb away
from coding genes (Guttman et al., 2009). Antisense lncRNAs are initiated inside a coding
gene (overlap at least one coding exon) and transcribed in the opposite direction of coding
gene. Intronic lncRNAs are lncRNAs that initiate inside an intron of a coding gene,
transcribe in either direction and do not overlap with any exon. Divergent lncRNAs are
transcripts that initiate in a divergent fashion from promoter of a coding gene (Fig.1.8).
Figure 1.8| Illustration scheme for different lncRNA classes. The exons are represented by boxes. The
transcriptional orientation is illustrated by the arrows.
The question "are lncRNAs functional or they are just the transcription "noise"?" has been
in debate in many years. Many studies point to functional roles of lncRNAs with several
reasonable arguments. Firstly, lncRNA genes are expressed in a tissue-specific manner and

13
are regulated expression (Sone et al., 2007; Mercer et al., 2008; Derrien et al., 2012). For
example, investigation of the transcriptional landscape of many human cell lines found that
29% of lncRNAs were expressed specifically in a single cell type, while only 10% were
expressed in all cell types (Djebali et al., 2012). Studies of lncRNA expression showed that
they are differentially expressed during differentiation, development or in response to
stimuli (Ravasi et al., 2006; Dinger et al., 2008; Mohamed et al., 2010).Secondary, many
lncRNAs have found to be involved in wide variety of cellular processes, cell differentiation
and implicated in many diseases, reviewed in (Hu et al., 2012; Batista and change, 2013;
Fatica and Bozzoni, 2013; Mathieu et al., 2014; Lopez-Pajares, 2016). Various mechanisms
of gene expression regulation by lncRNAs have been proposed. Among these, lncRNAs
might act as RNA decoy by sequestration of TFs or signaling proteins (Kino et al., 2010).
Alternative, lncRNAs might mediate epigenetic modifications of DNA by acting as modular
scaffolds for recruiting chromatin remodeling complexes to specific loci (Wang et al.,
2011). Many lncRNAs seem to bind to specific combinations of regulatory proteins,
potentially acting as scaffold elements within ribonucleoprotein complexes (Ng et al.,
2012). In the other cases, lncRNAs could affect the post-transcriptional gene regulation
such as inhibit protein translation, modulate splicing or degrade mRNAs (Tripathi et al.,
2010; Gong and Maquat, 2011; Yoon et al., 2012). Lastly, lncRNAs can compete with miRNA
for their binding to mRNA, thus, act as miRNA sponge (Cesana et al., 2011) (Fig.1.9).

14
Figure 1.9| Regulation of gene expression by lncRNAs. Figure adapted from (Mathieu et
al., 2014).
To date, the mechanisms in which lncRNAs get involved in transcriptional activation
including a) lncRNAs recruit activating proteins and protein complexes; b) lncRNAs
mediate chromatin interactions; c) lncRNAs play a role in eviction of repressive
machineries. The first mechanism of action was found in the example of the long intergenic
non-coding ncRNA-a7 act on SNI1 promoter in human A549 cells (Qrom et al., 2010). This
study showed that ncRNA-a7 is required for the expression of SNAI1 and serve as a scaffold
for the assembly of transcription factors and other chromatin remodeling enzymes at the
promoter. The second category of activating ncRNAs is given by an example of ncRNA-a
(non-coding RNA activating) which regulates gene activation through recruiting the
mediator complex (Lai et al., 2013). Lastly, the third type of mechanisms is exemplified by
ncRNA Brave heart which interacts with SUZ12 of PRC2 complex and prevents their action
on MesP1 promoter (Klattenhoff et al., 2013). Together, these studies suggested that non
coding RNAs might involve in gene activation by affecting many of the transcription steps.
15
Chapter 2
Functional role of enhancers
I. Transcriptional regulation by enhancers
1. Definition of enhancers
Differentiation of the different cell types found in multicellular organisms requires the
creation of spatiotemporal patterns of gene expression through evolution(Levine,2010). In
eukaryotes, gene transcription is a very complex process which requires the formation of a
complex set of interactions between TFs and DNA sequences (Fig.2.1)(Maston et al., 2006).
Transcriptional regulation is achieved in large part by enhancers that are DNA sequences
comprising many binding sites for various transcription factors. The enhancers possess an
ability to activate transcription regardless of their location, distance or direction with
regard to the promoters of genes(Banerjiet al., 1981).
The important issue to the understanding the function of enhancers, is how regulatory
elements which can be located at variable distances from core promoters participate to the
accurate transcriptional regulation.
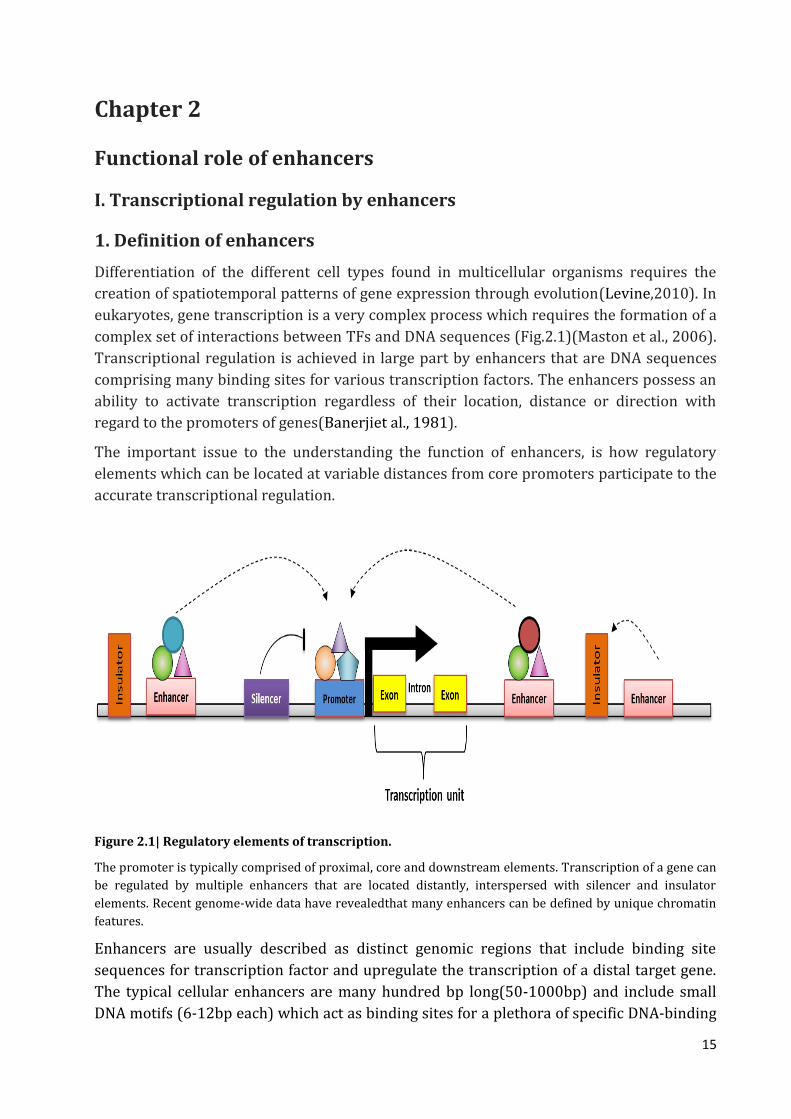
Figure 2.1| Regulatory elements of transcription.
The promoter is typically comprised of proximal, core and downstream elements. Transcription of a gene can
be regulated by multiple enhancers that are located distantly, interspersed with silencer and insulator
elements. Recent genome-wide data have revealedthat many enhancers can be defined by unique chromatin
features.
Enhancers are usually described as distinct genomic regions that include binding site
sequences for transcription factor and upregulate the transcription of a distal target gene.
The typical cellular enhancers are many hundred bp long(50-1000bp) and include small
DNA motifs (6-12bp each) which act as binding sites for a plethora of specific DNA-binding
16
transcription factors, These proteins recruit co-activators and co-repressors such that the
connected regulatory cues of all bound factors determine the activity of enhancers. The
enhancers bind specific transcriptional activators and enhance the rate of transcription.
Enhancers can be located close to the transcription start site, upstream or downstream
from the transcription start site, and even within introns. An enhancer can regulate more
than one gene in a position- and orientation-independent manner. The enhancer action
mechanism is believed to involve looping of the DNA, thereby bringing the enhancer-bound
transcriptional activators close to the promoter-bound transcription factors (Choudhuri,
2014). In this model the enhancers increase the efficiency of activators adjacent to the
promoter.The interaction between the enhancer-bound transcriptional activators and
promoter-bound transcription factors is mediated by coactivators (Morange, 2014;
Shlyueva et al., 2014). They are usually located within gene introns, they regulate (or, in
fact, in adjacent gene introns), and often at great distances from the promoter. One of the
most extreme examples known,for instance, is a limb bud enhancer for the mouse sonic
hedgehog (Shh) gene, that is found within the intron of another gene more than 1 Mb from
the Shh gene promoter (Lettice et al., 2003; Sagai et al., 2005).
Recent studies have shown broad similarities between enhancer and promoters and
suggested that some promoters might also play enhancer function, named Epromoters.
Epromoter display distinct genomic and epigenomic features and are associated with
stress response. Moreover, their intrinsic promoter and enhancer activates might be
dissociated across cell types. Epromoter are frequently involved in cis-regulation of distal
gene expression in their natural context, therefore functioning as bona fide enhancers (Dao
et al., 2017). See annex.
2. Functional enhancer features The enhancers are determined by cellular devices through a set of modifications of
chromatin and a specific binding sequence of TFs. While the DNA is compressed into
chromatin, enhancers must be localized to sites that are available for proteins, that is, in
regions of euchromatin with DNA-exposed.Nevertheless, enhancers are not constantly
available and may require suitable stimuli to become ‘open’.For instance, chromatin
including distal enhancers which becomes active has been shown to suffer vital
nucleosome repositioning after activating T-cell (Schones et al., 2008), treatment of
androgen receptor (He et al., 2011) and differentiation of erythrocyte (Hu et al., 2011).
These stimuli and other cellular processes caused a nucleosome re-expansion,that include
remodeling complexes of chromatin such as BAF(reviewed in Hargreaves and Crabtree,
2011). The specificity of these complexes to certain enhancers appears to be mediated by
‘pioneer’ factors,FOXA1 being the best characterized example (reviewed in Ruthenburg et
al., 2007). These proteins are linked to DNA nucleosome; induct the chromatin remodeler’s
whichfacilitate the opening of chromatin and the subsequent binding of TFs (Ruthenburg et
al., 2007).
Many studies have established the distinct characteristics of active enhancers compare
with the other regulatory elements. Genome wide mapping studies of nucleosome

17
occupancy indicate that enhancers are often located at open chromatin region (low
nucleosome occupancy which exhibit high sensitivity to DNA nucleases) (Barski et al.,
2007; Wang et al., 2008) and the nucleosome flanking enhancers contain unstable variants
(H3.3/H2A.Z).
Several specific epigenetic marks can be associated with the active enhancers. In particular,
the nucleosome flanking enhancers display enrichment of H3K4me1 and H3K4me2 and
depletion of H3K4me3 compare with promoters (Heintzman et al., 2007). The study of
Heintzman et al. used chromatin signatures to predict 55,000 candidate enhancers in five
human cell types. Interestingly, the chromatin patterns at enhancers were more variable
and cell type specific than chromatin patterns at promoters or insulators. Even the level of
H3K4me3 is lower at enhancer compare to promoters, the active enhancers were found to
be generally associated with the presence of both H3K4me1 and H3K4me3 and RNAPII
accumulation (Pekowska et al., 2011). In addition, the H3K27ac is found to be the
identifying chromatin signatures for active enhancers (Heintzman et al., 2009). Using the
epigenetic marks is one of the methods for identifying active enhancers; however, genomic
region exhibiting these features are not necessary to be functional enhancers. Despite the
broad utility of histone modification signatures to predict enhancers, the integrative
analysis suggest that enhancers are also sharing enrichment of H3K36me1, H3K27me1,
H3K9me1, and H3K4me2, suggesting the redundancy in the histone marks for
identification of enhancers. The signatures might indicate general genome accessibility or
chromatin dynamics at these sites.
In addition to specific histone modifications, enhancers are preferentially occupied by
coactivators such as p300 and CBP (CREB-binding protein). The two proteins with
acetyltransferase activity and involved in interactions with other transcription factors or
histone modifications. The histone acetyltransferase p300 was found to be the main
predictor for enhancer sites (Heintzman et al., 2007) (Fig. 2.2). Moreover, recently the
bidirectional transcription at enhancers generating a class of RNA named eRNAs has shown
to occur in almost functional enhancers. Thus, it is considered to be one of the key features
of active enhancers and it might relate to their functions in gene activation (Fig. 2.2).
18
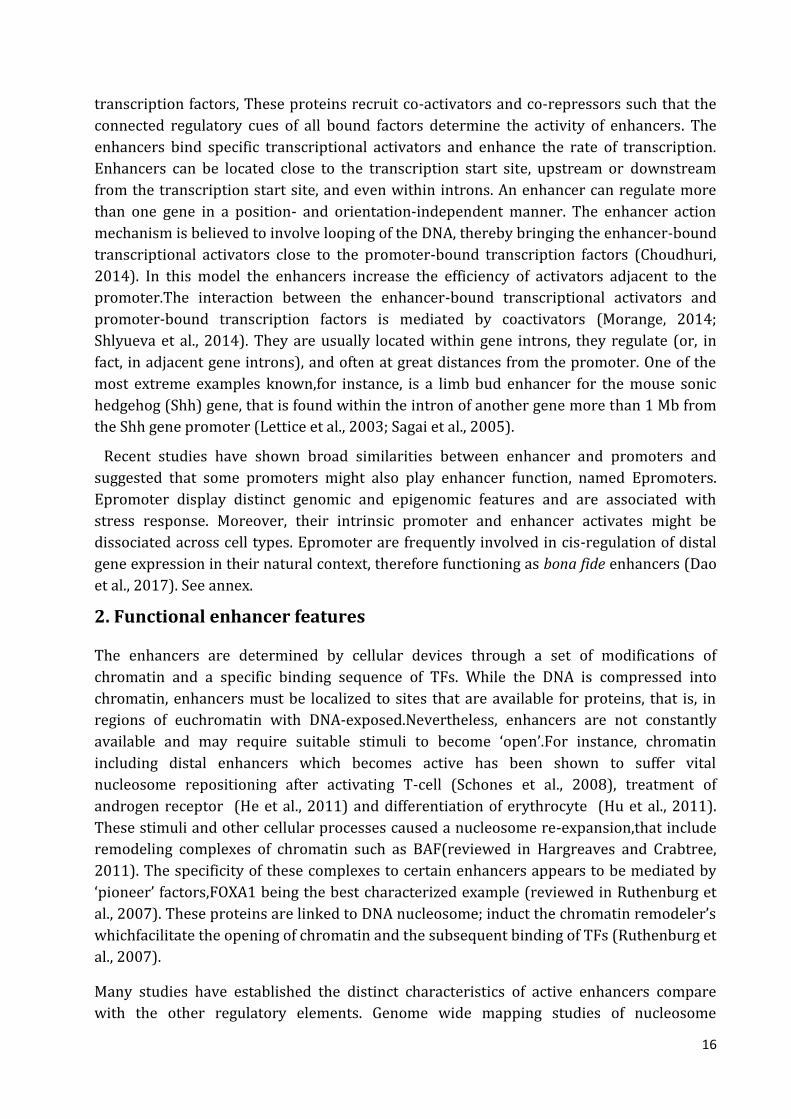
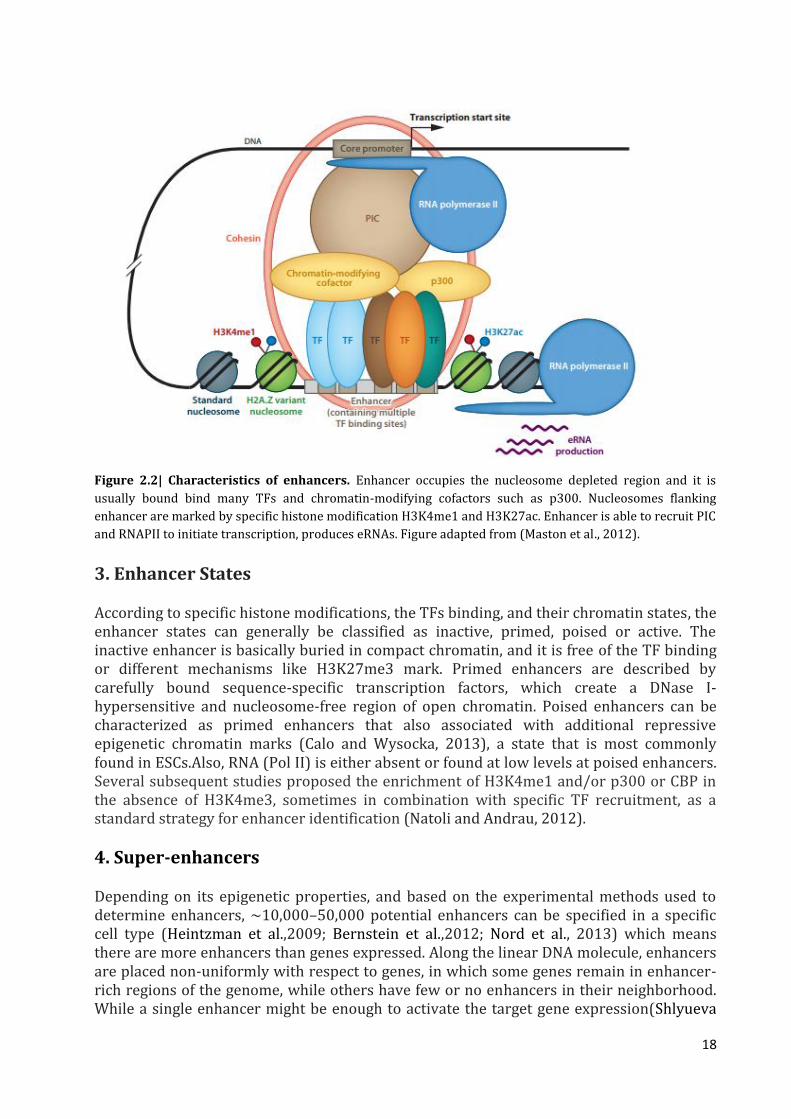
Figure 2.2| Characteristics of enhancers. Enhancer occupies the nucleosome depleted region and it is
usually bound bind many TFs and chromatin-modifying cofactors such as p300. Nucleosomes flanking
enhancer are marked by specific histone modification H3K4me1 and H3K27ac. Enhancer is able to recruit PIC
and RNAPII to initiate transcription, produces eRNAs. Figure adapted from (Maston et al., 2012).
3. Enhancer States
According to specific histone modifications, the TFs binding, and their chromatin states, the enhancer states can generally be classified as inactive, primed, poised or active. The inactive enhancer is basically buried in compact chromatin, and it is free of the TF binding or different mechanisms like H3K27me3 mark. Primed enhancers are described by carefully bound sequence-specific transcription factors, which create a DNase I-hypersensitive and nucleosome-free region of open chromatin. Poised enhancers can be characterized as primed enhancers that also associated with additional repressive epigenetic chromatin marks (Calo and Wysocka, 2013), a state that is most commonly found in ESCs.Also, RNA (Pol II) is either absent or found at low levels at poised enhancers. Several subsequent studies proposed the enrichment of H3K4me1 and/or p300 or CBP in the absence of H3K4me3, sometimes in combination with specific TF recruitment, as a standard strategy for enhancer identification (Natoli and Andrau, 2012).
4. Super-enhancers
Depending on its epigenetic properties, and based on the experimental methods used to determine enhancers, ~10,000–50,000 potential enhancers can be specified in a specific cell type (Heintzman et al.,2009; Bernstein et al.,2012; Nord et al., 2013) which means there are more enhancers than genes expressed. Along the linear DNA molecule, enhancers are placed non-uniformly with respect to genes, in which some genes remain in enhancer-rich regions of the genome, while others have few or no enhancers in their neighborhood. While a single enhancer might be enough to activate the target gene expression(Shlyueva

19
et al.,2014), high levels of gene expression which depend on signal and/or cell type-specificity are most often require genes placed in enhancer-rich regions of the genome. One clear example is represented by the relationship of enhancer-rich Locus Control Regions (LCR) and the globin genes expression in erythroid cells (Collis et al., 1990). These enhancer-dense regions have recently been called “super-enhancers” (Hnisz et al., 2013; Dowen et al., 2014). The super-enhancers were originally defined as major (tens of kilobases-long) genomic loci with an extremely high density of enhancer-associated marks, such as linking of the mediator complex, for most other genomic loci (Hnisz et al., 2013; Whyte et al., 2013). In addition, these regions can be determined by a high density (Hnisz et al., 2013) and/or prolonged (> 3 kb)(Parker et al., 2013) statements of the histone mark H3K27ac. Using differences in the intensity of mediator complex-binding sites or of H3K27ac marks to recognize super-enhancers from regular enhancers, most cell types are the presence to have among 300 and 500 super-enhancers (Hnisz et al., 2013). A fundamental portion of super-enhancers and close genes are cell type-specific, and associated gene groups with super-enhancers in a specific cell type are highly enriched of the biological processes which determine the properties of the cell types (Hnisz et al., 2013; Parker et al., 2013). For instance, multiple genes encoding the factors needed for pluripotency and self-renewal of ES cells are located near the ES cell-specific super-enhancers(Hnisz et al., 2013). In line with the specificity of their tissues, active super-enhancers in some cell types are enriched for alleles associated with the disease relevant to this type of cells (Hnisz et al., 2013; Parker et al., 2013).
Figure 2.3| Super-enhancers represent large clusters of transcriptional enhancers and associated with a higher density of TFs binding. The definition, novelty, and potential misuse of the term super-enhancers were recently discussed in a perspective essay by Pott and Lieb. They argued that super-enhancers are arbitrarily defined (i.e., there is no functional significance to the cutoff between super- and typical-enhancers) and display previously known properties of enhancers. Super-enhancers, as well as stretch enhancers, also overlap with DNA methylation valleys (large stretches of DNA with reduced methylation, often near developmentally-important genes) and locus control regions (regulatory elements controlling specific genes). This overlap between super-enhancers and other identified large-scale regulatory regions suggests they may be functionally or conceptually equivalent, with differences arising from the methods used to classify them. Together these studies propose that a relatively small set of super-enhancers act as key switches to determine cell fate. However, it is unclear whether super-
20
enhancers genuinely represent a new paradigm, describing a functional unit that is more than the sum of its parts, or whether they are simply an assembly of conventional enhancers of varying strengths (Pott and Lieb, 2014) (Fig. 2.3).
5. Enhancer transcription
The existence of transcription pre-initiation complex and elongation factors at enhancers (Koch et al., 2011; Zhang et al., 2012) according to the reality that Pol II is found at enhancers. For more than 20 years, it has been observed that Pol II generates non-coding RNAs in place control regions (Collis et al., 1990), but it has been just lately appreciated that mammalian enhancers are widely transcribed and create enhancer RNAs (eRNAs) (De Santa et al., 2010; Kim et al., 2010; Koch et al., 2011; Lam et al., 2013; Core et al., 2014). Pol II staffing to enhancers and signaling-dependent changes in eRNA expression are highly associated with alterations in the expression of close genes, proposing a functional link among eRNA and expression of the gene (Wang et al., 2011; Kaikkonen et al., 2013; Kieffer-Kwon et al., 2013; Bonn et al.,2012). The differentiating characteristics of eRNAs are that most are short (< 1 kb), are not exposed to polyadenylation or splicing (De Santa et al., 2010; Kim et al., 2010) and are decompose rapidly by the exosome (Andersson et al., 2014). In a similar manner to what have been exposed for short promoter antisense transcripts (Almada et al., 2013) these features are probably caused by the lack of a 5’ splice donor proximal to eRNA TSS (Andersson et al., 2014; Core et al., 2014), that is the main condition for splicing and transcription elongation (Fong and Zhou, 2001), packaging into messenger ribonucleoprotein particles (mRNP), polyadenylation and nuclear export (Muller and Neugebauer, 2013), all features linked to transcripts stability. Note that, the reality that enhancers like promoters in nearly every appearance, except for deficient proximal splice donors (Andersson et al., 2014) and H3K4me3 marks (Pekowska et al., 2011; Bieberstein et al., 2012), suggests that steady mRNAs or lincRNAs could be generated by inserting a splice donor downstream of an eRNA TSS (Core et al., 2014). This is similar to the ability of the intronic enhancers to act as alternative promoters (Kowalczyk et al., 2012). Current studies provide evidence that eRNAs overlap with localized enhancer activity, possibly by facilitating enhancer-promoter interactions during chromatin looping, employing of co-factors like the mediator complex (Fig. 2.2) (Dey et al., 2003)and liberate negative elongation factors (Schaukowitch et al., 2014). As of yet, there is restricted evidence for specific sequence properties of eRNAs which could be essential for their function, and not all eRNAs seems to contribute to the enhancer function. Pol II is a robust machine of nucleosome remodeling (Core et al., 2008), and transcription started from an enhancer sequence might be required to maintain the configuration of open chromatin that enables access of sequence-specific transcription factors. Furthermore, transcription of the enhancer may play a critical role in participating to the deposition of H3K4me1 and H3K4me2 marks at enhancers (Fig. 2.2). Many studies show that the D. melanogaster H3K4 methyltransferase trithorax-related (Trr) and its mammalian homologues MLL3 and MLL4 play key roles in the writing of these marks (Herz et al., 2012; Lee et al., 2013), but the mechanisms which enlist these enzymes and limit the general distribution of histone methylation still poorly understood. In addition, studies of newly selected or de novo enhancers in activated macrophages gave evidence that the methylation of H3K4, but not the acetylation of H3K27, asked transcription of enhancer and the presence of MLL3 and MLL4 (Kaikkonen et al., 2013).

21
The enhancer model activation based on time-resolved studies of binding the transcription factor, H3K4 methylation and H3K27 acetylation at de novo enhancers, eRNA transcription, and on results of gain- and loss-of-function experiments (Kaikkonen et al., 2013), is shown in (Fig. 4B) Signal-dependent activation of NF-κB (p50 and p65) appears in its cooperative binding with PU.1 and the enlisted of co-activator complexes that include histone acetyltransferases (HAT). These effects lead to remodeling of a nucleosome, acetylation of histone and the recruitment of Pol II. The transformation of Pol II from a stopped to an elongating form includes P-TEFb, which is assigned to at least some sites of transcription initiation by interactions between Brd4 and acetylated histone H4. Cyclin-dependent kinase 9 (CDK9), an element of P-TEFb, phosphorylates the C-terminal domain (CTD) of Pol II, giving anchoring sites for the complexes of histone methyltransferases myeloid/lymphoid or mixed-lineage leukemia protein 3 (MLL3) and MLL4. MLL 3 and MLL4 gradually methylate H3K4 through sequential rounds of transcription elongation. Based on this model the distribution of H3K4me1 and H3K4me2, which was found to associate with the range of enhancer transcription, and to rely on transcription elongation (Kaikkonen et al., 2013). The prevalence of this model with regard to these mechanisms by which H3K4 methylation marks are established at other classes of enhancers, like those which are selected through cellular differentiation, remains to be determined (Lee et al., 2013).
6. Regulation of gene expression by communication of enhancers and promoters
Enhancers are defined as remote regulatory elements which can be located far up to megabases from their target gene promoters. Therefore the question how do enhancers find and regulate their target gene promoters has been asked for many years. While the precise mechanisms still remain to be elucidated, several models have been proposed including a) the tracking model and b) the looping model (Fig. 2.3).
In the tracking model, RNAPII and the transcription machinery are loaded at enhancers then track through the intervening DNA between enhancers and promoters (Hatzis and Talianidis, 2002). The looping model is a more popular hypothesis in which enhancer is brought into close proximity with its target promoters through chromatin looping, facilitated by mediators and stabilized by various bridge proteins such as cohesion complex. This model is supported by several observations using recent developed 3C-related approaches which allow determining the physical interaction frequencies between specific enhancers and target gene promoters, or fluorescence insitu hybridization (FISH).

22
Figure 2.4| Models of enhancer-promoter communication.a) Tracking model. b) Looping model (E, enhancer; P, promoter). Figure adapted from (Li et al., 2016).
The next question is how do enhancers elevate transcription initiation? Activation of gene transcription is a serial process which includes chromatin remodeling. PIC recruitment, transcription initiation, release from pausing and finally productive elongation (Maston et al., 2012). During this process, it is thought that enhancers play a role as a platform for the binding of transcription factors, therefore, once reached to the target promoters, enhancers can supply (or exchange?) needed factors such as Mediators, GTFs or even RNAPII that are required for transcription initiation. The other possibility is that enhancers can affect the release rate of RNAPII (Liu et al., 2013) or recruit the elongation complex to promoters (Lin et al., 2013). Conversely, in the looping model, promoters which physically interact with enhancers also stimulate the production of eRNAs (Sanyal et al., 2012) (Fig. 2.4).
Despite the looping model is widely accepted, the underlying mechanisms of enhancer-promoter crosstalk is still elusive. The main issue is whether in the loop enhancers instruct promoters for their activation or promoters also instruct enhancers. Most studies have focused on deleting enhancers to see the impact on promoters (Ho et al., 2006; Levine, 2010), but fewer has been conducted with promoter deletion to see the impact on enhancers.

23
Figure 2.5| Mechanisms of enhancer-promoter interaction. The mediator/cohesion complex is involved in stabilize the looping. Some produced eRNAs facilitate the looping through an interaction with the subunits of mediator/cohesion complex. Figure adapted from (Kim and Shiekhattar, 2015).
7. Methods of studying long-range interaction between regulatory elements
In living cells, chromosomes are well-organized in three dimensions inside the nucleus forming separated chromosome territories (CTs) (Cremer and Cremer, 2001) (Fig. 2.5). In each territory, the interchromosomal interaction of particular chromosomes and long-range interactions between genomic regions is often occurred. The position of CTs is thought to correlate with transcriptional activity. Transcriptionally inactive regions are located at nuclear periphery (nuclear lamina) (Padeken and Heun, 2014) while regions with similar transcription activity are colocalized in nuclear space called transcription factories where they are likely sharing transcription machinery (Papantonis and Cook, 2013; Edelman and Fraser, 2012). At increasing resolution, each chromosome is comprised of many distinct chromatin domains which referred as topological associating domains (TADs) (Dixon et al., 2012; Nora et al., 2012). A TAD can expand a few hundred kilobases to several megabases region of high local contact frequency and separated from genes, transcription is regulated by cis-regulatory elements such as enhancers and promoters.

24
Figure 2.6| Different levels of genome organization. Figure adapted from (Gorkin et al., 2014).
To fully understand genome function, studying the linear genome map as well as the spatial map chromosome organization is extremely critical. There are increasing evidences that looping of chromosomes is important for transcriptional regulation and gene activation mechanisms by distant regulatory elements (Tolhuis et al., 2002; Lomvardas et al., 2006; Dekker, 2008). It has been demonstrated that transcriptionally active genes contact enhancer-like elements, whereas transcriptionally inactive genes interact with elements marked by repressive features that may act as long-range silencers (Mifsud et al., 2015).
In order to better understand the physical organization of chromosomes in the native cellular state, the chromosome conformation capture (3C) and its derivative techniques have been developed as valuable tools for uncovering functional elements in whole genome. The most advantage of 3C is converting the physical chromosomal interactions into specific DNA ligation products bearing information of interacted genomic sequences that can be detected by PCR. Only over the past decade, a series of related techniques have been developed from 3C with increase in throughput and resolution, the later the fancier name than the last. Variations of the 3C-based techniques include 4C, 5C, Hi-C, Capture-C, and ChIA-PET which are capturing the interactions in different scales and address different biological question. Each method has particular strengths and applications that will be discussed in this chapter (see Fig. 2.6 for the methodology summary of all following mentioned techniques).
25
8. Chromatin Conformation Capture (3C)
3C was first described in 2002 by Dekker et al. as a novel approach for studying 3D chromatin structures and interactions in vivo (Dekker et al., 2002). In this report, 3C was used to study the spatial organization of chromosome III in yeast, 3C has been applied to the analysis to the mammalian B-globin locus (Tolhuis et al., 2002). Then, this technique has been widely used for several studies of chromatin interaction including the T-helper type 2 cytokine locus (Spilianakis and Flavell, 2004), the immunoglobulin k locus (Liu and Garrard, 2005) and the Igf2 imprinted locus (Murrell et al., 2004). For all studies, 3C provides a reliable method for uncovering the direct long-range interaction in cis as well as in trans. The principle of 3C uses PCR to detect individual chromatin interaction, which is relative in small-scale; mostly used for targeted analysis of interactions between a set of candidate elements and is considered as “one-versus-one” scale. Also, the resolution is low within 1 kb. Long-range interactions within the same chromosome or between different chromosomes further contribute to establishing a multilayered hierarchical organization that orchestrates genome function (Sexton and Cavalli, 2015).
The next generation of 3C termed 4C was developed in parallel by separated groups with slightly difference in procedure (Simonis et al., 2006; Wurtele and Chartrand, 2006; Zhao et al., 2006). 4C protocol enables to detect unknown DNA region interacting with a locus of interest (generally named “viewpoint” or “bit”). Several studies have used 4C-seq for studying X chromosome inactivation (Splinter et al., 2011), enhancer-promoter interactions (van de Werken et al., 2012; Ghavi-Helm et al., 2014).
Also 5C, described as “many-versus-many” approach, is a further refinement of 3C allowing simultaneous study of many interactions between multiple regions (Dostie et al., 2006). This technique generates a library from 3C template by hybridize to a mix of oligonucleotides across the ligated junction of DNA fragments.
With the development of 3C-based techniques, the next question of “all-versus-all” is addressed by Hi-C method (Lieberman-Aiden et al., 2009). The procedure of Hi-C starts with the restriction enzyme digested 3C product. Studies spanning multiple organisms have observed strong correlations between histone modification patterns and long-range contact patterns in Hi-C maps (Sexton et al. 2012; Dixon et al., 2012). Another extension of 3C is Capture-C which is a combination of 3C and oligonucleotide capture technology (OCT) together with high-throughput sequencing to study hundreds of loci at once while maintaining high resolution (Hughes et al., 2014). ChIA-PET was first introduced in 2009 as a better innovative technique to capture distant DNA fragments associate through a specific protein by taking the aspects of two techniques chromatin immunoprecipitation (ChIP) and 3C (Fullwood et al., 2009).

26
Figure 2.7| Methodology summary for 3C-based technologies.
Cross-linked nuclei
3C 4C5C ChIA-PETHi-CCapture-C
PCR
qPCR
Restriction digest
Ligation
Reverse cross-links
Sonication
IP of DNA bound
specific protein
Linker ligation
Ligation
MmeI digestion
Add seq adaptors
Oligos ligation Sonication 2nd RE digestion Biotinylate ends
T7 T3
Adaptor
ligation
SureSelect
Oligo
Capture
Microarray or
sequencing
Microarray or
sequencing
Sequencing Sequencing Sequencing
Ligation
Ligation
& PCR
Ligation
& PCR
PCR wih seq
primers
PCR wih seq
primers
Shear &
pull down

27
Chapter 3
High-throughput reporter assays
1. Overview
High-throughput reporter assays are a key process used to identifying and characterizing cis-regulatory modules (CRM). In particular, the important functional roles of enhancers in the regulation of gene expression, development, and cell differentiation, as well as genetic alterations in these elements are a major cause of human disease. There is a challenging task because that an enhancer does not have situated directly vicinity to the interesting gene. Subsequently, several advanced strategies were used to identify and characterize enhancers. Usually accomplished during reporter assays which check whether a sequence able to increase expression of a transcriptional reporter by a minimal promoter. There is a great problem is that reporter assays are mainly carried out on episomes, that are thought to loss physiological chromatin. Although, the size and determinants of many of cis-regulation for regulatory sequences found in episomes versus chromosomes remain almost entirely unknown (Fumitaka Inoue et al., 2017). Enhancers are acted during the binding of transcription factors, which induct histone modifying factors, like as histone acetyltransferase (HAT) or histone methyltransferase (HMT). They are also the commitment to chromatin remodeling factors (e.g., SWI/ SNF) and the complex of cohesin that contributes in regulating chromatin structure and accessibility (Schmidt et al. 2010; Euskirchen et al. 2011; Faure et al. 2012). This feature can also be applied to identify enhancers by strategies like as DNase-seq, FAIRE-seq, and ATAC-seq (Boyle et al., 2008; Buenrostro et al., 2013). Whereas these and other genomic strategies can efficiently identify putative enhancer sequences in a genome-wide manner. In recent times, different strong strategies which mixed high-throughput sequencing into reporter assays can quantitative and accurate measure enhancer activity of thousands of regulatory elements. In the following context will summarize some of the interest powerful assays for testing the function of enhancer activity.
2. Conventional enhancer reporter assays
The most frequently used techniques to validate enhancer function, the conventional enhancer reporter assays, an experimental assay required to be implemented. Enhancers are usually described by a reporter assay which binds a candidate enhancer sequence to a minimal promoter (a promoter that is insufficient to lead reporter expression without a functional enhancer) and a reporter gene (GFP, LacZ, luciferase or others). The reporter vectors are then introduced into cell lines or organisms, and the reporter gene expression is tested. When the candidate sequence acts as an enhancer, it will be acts the minimal promoter and this lead to the expression of reporter gene in the tissue/cell type of interest. Subsequently, in the conventional method, the activity of enhancer is tested in a ‘one by one’ method and is also low-throughput and a lot of time (Fumitaka and Nadav, 2015). The product level of thereporter gene (mRNA or protein) can be revealed by LacZ dyeing, in situ hybridization or fluorescence or quantified via using bioluminescence like as in the luciferase assays.The plenty of reporter products appears to the strength of the enhancer (Fig.3.1).This classical reporter assay order act as a simple, fast and efficient manner to exam the activity of enhancer and also it remains regarded as a gold standard for
28
assessment of the enhancer. In addition, it has been considered as low throughput manner and consuming of time because every single candidate has to be cloned into reporter building and tested one- by- one.
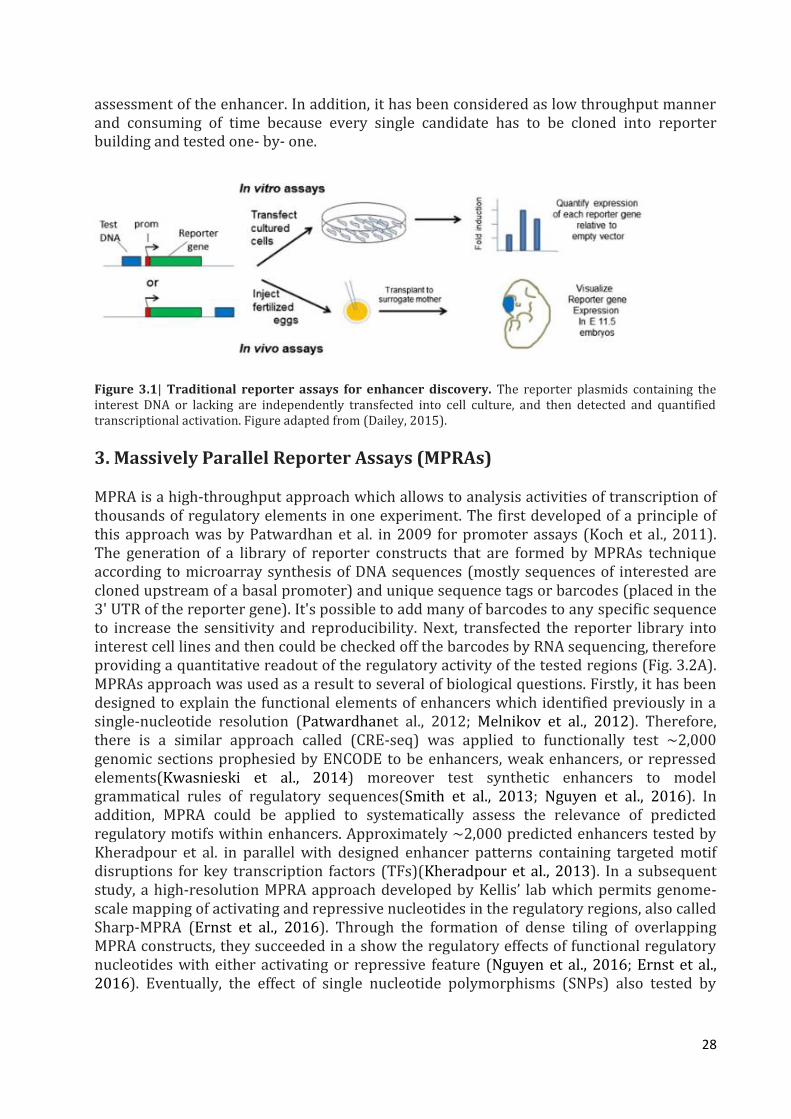
Figure 3.1| Traditional reporter assays for enhancer discovery. The reporter plasmids containing the interest DNA or lacking are independently transfected into cell culture, and then detected and quantified transcriptional activation. Figure adapted from (Dailey, 2015).
3. Massively Parallel Reporter Assays (MPRAs)
MPRA is a high-throughput approach which allows to analysis activities of transcription of thousands of regulatory elements in one experiment. The first developed of a principle of this approach was by Patwardhan et al. in 2009 for promoter assays (Koch et al., 2011). The generation of a library of reporter constructs that are formed by MPRAs technique according to microarray synthesis of DNA sequences (mostly sequences of interested are cloned upstream of a basal promoter) and unique sequence tags or barcodes (placed in the 3' UTR of the reporter gene). It's possible to add many of barcodes to any specific sequence to increase the sensitivity and reproducibility. Next, transfected the reporter library into interest cell lines and then could be checked off the barcodes by RNA sequencing, therefore providing a quantitative readout of the regulatory activity of the tested regions (Fig. 3.2A). MPRAs approach was used as a result to several of biological questions. Firstly, it has been designed to explain the functional elements of enhancers which identified previously in a single-nucleotide resolution (Patwardhanet al., 2012; Melnikov et al., 2012). Therefore, there is a similar approach called (CRE-seq) was applied to functionally test ~2,000 genomic sections prophesied by ENCODE to be enhancers, weak enhancers, or repressed elements(Kwasnieski et al., 2014) moreover test synthetic enhancers to model grammatical rules of regulatory sequences(Smith et al., 2013; Nguyen et al., 2016). In addition, MPRA could be applied to systematically assess the relevance of predicted regulatory motifs within enhancers. Approximately ~2,000 predicted enhancers tested by Kheradpour et al. in parallel with designed enhancer patterns containing targeted motif disruptions for key transcription factors (TFs)(Kheradpour et al., 2013). In a subsequent study, a high-resolution MPRA approach developed by Kellis’ lab which permits genome-scale mapping of activating and repressive nucleotides in the regulatory regions, also called Sharp-MPRA (Ernst et al., 2016). Through the formation of dense tiling of overlapping MPRA constructs, they succeeded in a show the regulatory effects of functional regulatory nucleotides with either activating or repressive feature (Nguyen et al., 2016; Ernst et al., 2016). Eventually, the effect of single nucleotide polymorphisms (SNPs) also tested by

29
MPRA in order to differentiate functional regulatory variants related to human traits or diseases(Santiago et al., 2017).
Figure 3.2|Principle of high-throughput assays for enhancer activity. (A) Overview of massively parallel reporter assay (MPRA). The test sequences (wild-type, variants, etc.) are generally synthesized in silico by
massive oligonucleotide synthesis with unique barcode tags and cloned into the plasmid backbone. Tags can be synthesized along with the test sequences or added after synthesis by polymerase chain reaction (PCR) amplification. A basal promoter and a reporter open reading frame (ORF)
are inserted between the tested element and tag sequences. The reporter library is then transfected into cultured cells. Subsequently, mRNA is
isolated and cDNA synthesized. The tags are sequenced before (plasmid library pool, for normalization) and after the transfection. The difference in the enrichment of each barcode is proportional to the enhancer activity of the test sequence. In the case of post-synthesis addition of barcodes,
an additional sequencing step is required at the first cloning step. (B) Overview of self-transcribing active regulatory region sequencing (STARR-
Seq). A genomic or bacterial artificial chromosome (BAC) library is cloned in the reporter plasmid, downstream of the ORF and upstream of the polyadenylation site (pAS). Alternatively, the regions of interest might be enriched by a capture approach. The reporter library is transfected into
cultured cells. Subsequently, mRNA is isolated and cDNA synthesized. The cloned regions are sequenced from the plasmid library pool (input)
and the cDNA. Differences in the enrichment with respect to the input are proportional to the enhancer activity. In both panels, the effect of the enhancer on the basal promoter is indicated by an arrow. Figure adapted from Santiago. et al., 2017)
4. Self -Transcribing Active Regulatory Region Sequencing (STARR-seq)
STARR-seq anew method was introduced by Alexander Stark and colleagues (Arnold et al., 2013). STARR-seq is a MPRA (Muerdter et al., 2015) used to identify and assess of transcriptional enhancers immediately depend on their activity in the whole genomes (Fig. 3.2.B). Briefly, the transcription of the bulk of the DNA fragments from arbitrary sources is downstream of a core promoter and into the 3' UTR of a GFP reporter gene. Once in the cellular context, active enhancers, it will activate the upstream promoter and transcribe themselves, lead to transcripts of reporter between cellular RNAs. Finally, detected these reporter transcripts by high-throughput sequencing, after isolated each reporter transcript, which contains the reporter gene and the “barcode” of itself, and separately by targeted PCR. Furthermore, can be measured the millions of activity putative enhancers simultaneously without affecting the location and the orientation of the candidate sequences. The distinct difference from the classical MPRA is that the tested sequence itself

30
is applied as a “barcode”, basically simplifying the complete procedure to assess the activity of enhancer. The STARR-seq approaches used by Stark’s lab to ask many basic mechanistic questions about enhancer biology in Drosophila, including (i) identification and characterization of cell-type-specific (Arnold et al., 2013; Yáñez et al., 2014) and hormone-responsive enhancers (Shlyueva et al., 2014), (ii) the effect of cis-regulatory sequence difference on activity and evolution of enhancer(Arnold et al., 2014), and (iii) dissecting the basis of enhancer core-promoter specificity(Zabidi et al., 2015; Santiago et al., 2017). The maximum of interest of STARR-seq is the ability to assess enhancer activity directly in a quantitative and genome-wide manner. The strong activity of enhancers is evaluated directly without incorporation in the context of the chromosome (ectopic assay) therefore it is considered advantage method for sources of screening arbitrary of DNA in each cell type or tissue. Furthermore, STARR-seq permits to detection of cell type specific enhancers, by transfected of the same library in different cell types. In addition, STARR-seq method can uncover the de novo of enhancer within the closed chromatin region by classical methods.
5. CapStarr-seq
STARR-seq, it was used to human cells by utilizing the specific bacterial artificial chromosomes (BACs)( Arnold et al., 2013); therefore, this technique is not easily performed, with the complexity and size of mammalian genomes, so making the formulation of representative libraries a challenge and a high sequencing depth a very necessity. To avoid this problem, our team has been developed a new capture-based approach (called CapSTARR-seq) to assess a subset of mouse DNase I hypersensitive sites (DHSs) found in developing thymocytes (Vanhille et al., 2015). Here, the regions of interest are captured by custom-designed microarrays and cloned into the STARR-seq vector, thus providing a cost-effective and quantitative assessment of enhancer activity in mammals. To overcome the problem and complexity of large genome size, the DNA library that sonicated is enriched for the selected interested enhancer candidates by Agilent Sure Select DNA capture array technology using custom-defined probes for an interest region. After the capture step, it will continue with STARR-seq procedure. CapStarr- seq offer a useful method to assess the functional enhancer in mammals as well as the similar advantages of STARR-seq procedure (Fig.3.3) (Vanhille et al., 2015).

31
Figure 3.3| Principle of CapStarr-seq. Fragmented genomic DNA is enriched for regions of interest before cloning into STARR-seq screening vector. The downstream procedure is similar to the STARR-seq. Figure adapted from (Vanhille et al., 2015).

32
Chapter 4
Genome editing by CRISPR/Cas9
1. Introduction
Clustered regularly interspaced short palindromic repeats (CRISPR) and their linked Cas
proteins function as an adaptive immune system based on RNA which protects bacteria
from infectious viruses and plasmids (Barrangou and Marraffini, 2014; Deveau et al., 2010;
Horvath and Barrangou, 2010; Terns and Terns, 2011). The CRISPR loci composed of a set
of short repetitive sequences (30–40 bp) detached by equally short spacer sequences.
Several spacer sequences of bacteria and archaea correspond the genomes of viruses and
plasmids. This notice gives rise to the assumption that CRISPR systems protect prokaryotes
from infection via these genetic elements (Bolotin et al., 2005;Mojica et al., 2005;Pourcel et
al., 2005). Immunity of CRISPR-Cas divided into three phases (Figure 4.1). First, in the
adaptation phase, Cas proteins combine short genome regions of the invader's viral or
plasmid into the CRISPR set as new spacers (Figure 4.1a) (Heler et al., 2014). Second, the
CRISPR set is cloned and treated to generate small CRISPR RNAs (crRNAs) which include a
full or partial spacer sequence (the crRNA biogenesis phase; Figure 4.1b, c, d). Through the
third phase, called as targeting, treated crRNAs will be correlated with Cas enzyme to guide
the ribonucleoprotein complex to the target sequence (Figure 4.1b, c, d). Then, cleavage of
the interest sequence also called a protospacer, this will result in both the destroy the
invader genome and immunity. Differences in this immune mechanism differentiate each of
the three main species of prokaryotic CRISPR immune systems, which were categorized
based on Cas gene preservation and operon organization (Makarova et al., 2011).
CRISPR-Cas systems type II are a simpler technique which is exclusively based on crRNA-
guided Cas9 nuclease and its cofactor, the tracrRNA (Figure 4.1c). Several major results
were created Cas9 as the perfect RNA-guided nuclease for genome editing. Early action on
type II CRISPR immunity demonstrated that the targeting of bacteriophages and plasmids
leads to the introduction of crRNA specific DSBs into the genome of these invaders
(Garneau et al., 2010), which indicates that these systems have the activity of nuclease
were necessary for genomic editing in mammalian cells. The experiments that identified
the participates of the various type II Cas genes to this nuclease activity specified cas9 as
the only type that is required to immunity in vivo and showed that there exist two nuclease
domains, RuvC and HNH, are required as well (Sapranauskas et al., 2011).
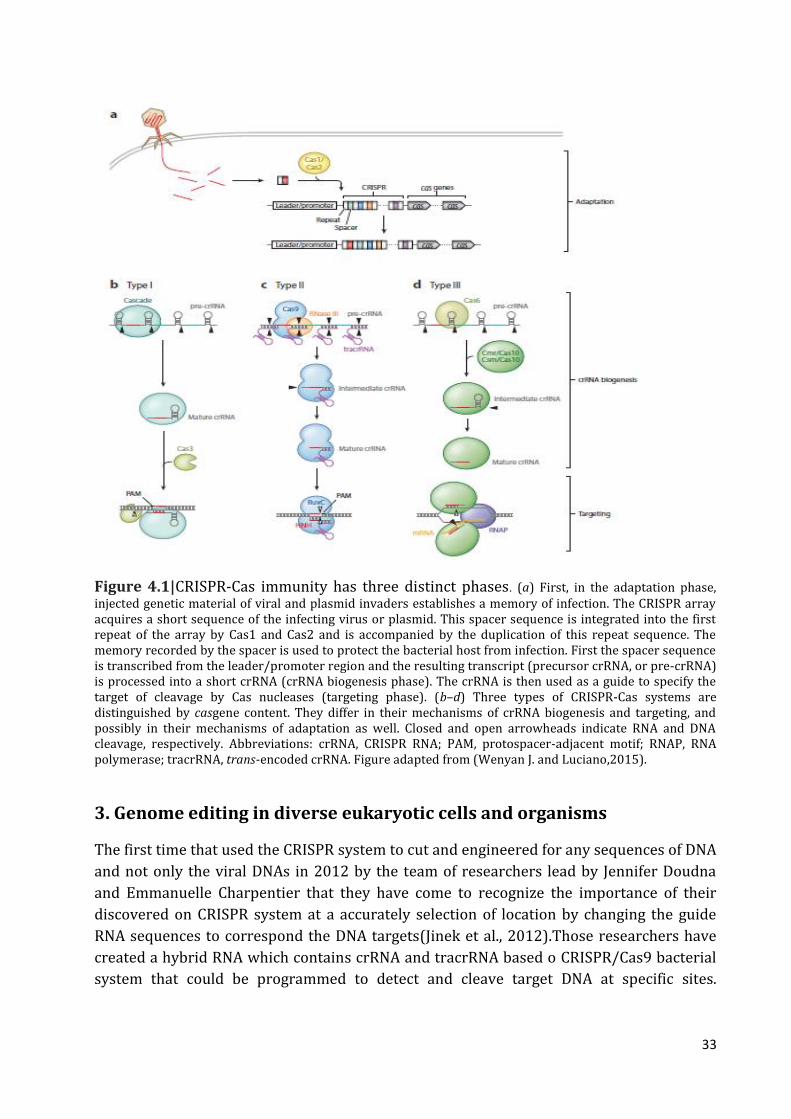
33
Figure 4.1|CRISPR-Cas immunity has three distinct phases. (a) First, in the adaptation phase, injected genetic material of viral and plasmid invaders establishes a memory of infection. The CRISPR array acquires a short sequence of the infecting virus or plasmid. This spacer sequence is integrated into the first repeat of the array by Cas1 and Cas2 and is accompanied by the duplication of this repeat sequence. The memory recorded by the spacer is used to protect the bacterial host from infection. First the spacer sequence is transcribed from the leader/promoter region and the resulting transcript (precursor crRNA, or pre-crRNA) is processed into a short crRNA (crRNA biogenesis phase). The crRNA is then used as a guide to specify the target of cleavage by Cas nucleases (targeting phase). (b–d) Three types of CRISPR-Cas systems are distinguished by casgene content. They differ in their mechanisms of crRNA biogenesis and targeting, and possibly in their mechanisms of adaptation as well. Closed and open arrowheads indicate RNA and DNA cleavage, respectively. Abbreviations: crRNA, CRISPR RNA; PAM, protospacer-adjacent motif; RNAP, RNA polymerase; tracrRNA, trans-encoded crRNA. Figure adapted from (Wenyan J. and Luciano,2015).
3. Genome editing in diverse eukaryotic cells and organisms
The first time that used the CRISPR system to cut and engineered for any sequences of DNA
and not only the viral DNAs in 2012 by the team of researchers lead by Jennifer Doudna
and Emmanuelle Charpentier that they have come to recognize the importance of their
discovered on CRISPR system at a accurately selection of location by changing the guide
RNA sequences to correspond the DNA targets(Jinek et al., 2012).Those researchers have
created a hybrid RNA which contains crRNA and tracrRNA based o CRISPR/Cas9 bacterial
system that could be programmed to detect and cleave target DNA at specific sites.

34
Generally, this tool permits for researchers to recognize the genes in living cells and
organism.
Subsequently studies demonstrated that there are two components of the CRISPR system, a
guide RNA (gRNA) and a Cas9 nuclease. The gRNA is represent a short synthetic RNA which
was made up of crRNA and a fixed tracrRNA which in turn forms scaffold to recruit the
Cas9 whereas crRNA act as guide RNA sequence to the target DNA. At the 5'end of the
crRNA found twenty nucleotides are RNA-DNA complementary base-pairing with the DNA
target. Furthermore, the CRISPR/Cas9 system requires a short conserved sequence (2-5)
nucleotides to their internal activity, called as protospacer associated motif (PAM), follows
directly 3'end of the crRNA complementary sequence on the target DNA.As previously
stated, there were three types of CRISPR/Cas systems, in type II CRISPR/Cas9 which
derived from S. pyogenes the canonical from of PAM sequence is 5'-NGG where N represent
any nucleotide. The Cas9 nuclease recognition the PAM then it is thought to destabilize the
near sequence, to facilitate the identification of the target sequence by the sgRNA and leads
to RNA-DNA pairing when the corresponding sequence is present (Anders et al.,
2014).There are two tiny molecular scissors in the Cas9 will used it, when the RNA-DNA
pairing matching is completed, to cut the DNA, the first known as HNH domain which act to
cleaves the complementary strand, whereas the second known as RuvC domain that will
cleaves the non-complementary strand, resulting to double strand break (DSB) that
identified at 3-4 nucleotides on the target DNA upstream the PAM sequence (Fig.
4.2).Importantly, in this way the activity of Cas9 nuclease will be oriented to any DNA
sequence of the ranking N20-NGG usually by changing the first 20 nucleotides of the gRNA
in or to complement to the target sequences.
Figure 4.2| The CRISPR-Cas system. The CRISPR-associated endonuclease Cas9 could target specific DNA loci and make double-strand breaks under the guidance of the tracrRNAs: crRNAs duplex. The tracrRNA: crRNA duplex directs Cas9 to use two distinct active sites, RuvC and HNH, and cleave the target DNA complementary to the crRNA, which has an adjacent protospacer-adjacent motif (PAM).
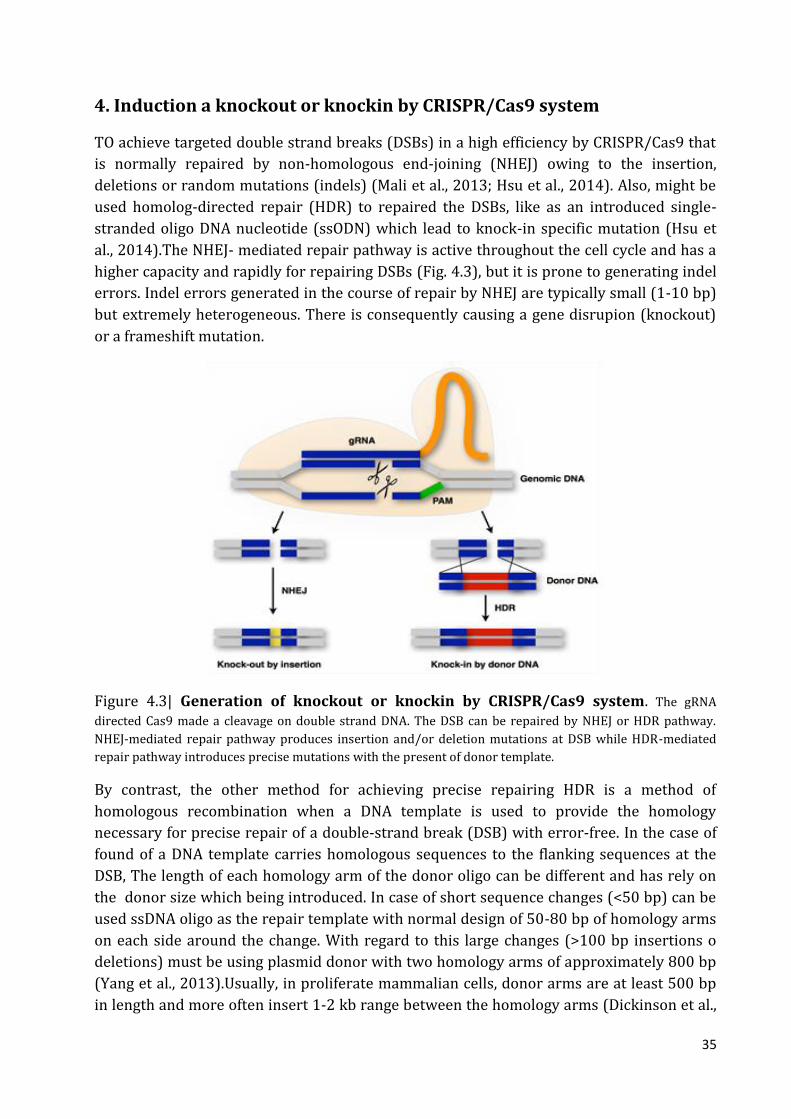
35
4. Induction a knockout or knockin by CRISPR/Cas9 system
TO achieve targeted double strand breaks (DSBs) in a high efficiency by CRISPR/Cas9 that
is normally repaired by non-homologous end-joining (NHEJ) owing to the insertion,
deletions or random mutations (indels) (Mali et al., 2013; Hsu et al., 2014). Also, might be
used homolog-directed repair (HDR) to repaired the DSBs, like as an introduced single-
stranded oligo DNA nucleotide (ssODN) which lead to knock-in specific mutation (Hsu et
al., 2014).The NHEJ- mediated repair pathway is active throughout the cell cycle and has a
higher capacity and rapidly for repairing DSBs (Fig. 4.3), but it is prone to generating indel
errors. Indel errors generated in the course of repair by NHEJ are typically small (1-10 bp)
but extremely heterogeneous. There is consequently causing a gene disrupion (knockout)
or a frameshift mutation.
Figure 4.3| Generation of knockout or knockin by CRISPR/Cas9 system. The gRNA
directed Cas9 made a cleavage on double strand DNA. The DSB can be repaired by NHEJ or HDR pathway.
NHEJ-mediated repair pathway produces insertion and/or deletion mutations at DSB while HDR-mediated
repair pathway introduces precise mutations with the present of donor template.
By contrast, the other method for achieving precise repairing HDR is a method of
homologous recombination when a DNA template is used to provide the homology
necessary for precise repair of a double-strand break (DSB) with error-free. In the case of
found of a DNA template carries homologous sequences to the flanking sequences at the
DSB, The length of each homology arm of the donor oligo can be different and has rely on
the donor size which being introduced. In case of short sequence changes (<50 bp) can be
used ssDNA oligo as the repair template with normal design of 50-80 bp of homology arms
on each side around the change. With regard to this large changes (>100 bp insertions o
deletions) must be using plasmid donor with two homology arms of approximately 800 bp
(Yang et al., 2013).Usually, in proliferate mammalian cells, donor arms are at least 500 bp
in length and more often insert 1-2 kb range between the homology arms (Dickinson et al.,

36
2013), it is possible to longer inserts but it will getting decrease the efficiency of
recombination. Also there are some condition will act on determined the efficiency of HDR
such as the concentration of donor DNA presence at the time of repair, the cell cycle and
the activity of the endogenous repair systems (Lin et al., 2014).However, the repair based
on HDR pathway could be used to insert certain point mutations or to introduce specific
sequences through recombination of the target locus with the exogenously required donor
template.
5. CRISPR/Cas9 applications
From the outset, often the CRISPR system used to knock-out target genes in different cell
types and organisms, but the Cas9 nuclease modification which believed had a significant
contribution to expand the application of CRISPR to activation and inhibition of the target
genes optionally, purify specific regions of DNA, moreover using it in the fluorescence
microscopy to image DNA in live cells. In addition, the facility of creating gRNA makes
CRISPR one of the most scalable genome editing technologies and it has been recently
employed for genome-wide screens.
The Cas9 nuclease consists of several different types that have been adopted in genome-
editing protocols (Table 4.1). The first pattern is original Cas9 (wild-type), which cleave
double stranded DNA in specific site, lead to induce of double strand break repair
mechanism by either NHEJ pathway or HDR pathway. The second pattern of Cas9 has been
sophisticated by Cong et al. called as Cas9D10A, where Cas9 modify only with activity of
nickase (Run et al., 2013; Cong et al., 2013). This modification of Cas9 cleaves only one DNA
strand, and does not activate NHEJ. Alternately, the DNA repair only by the high-fidelity
HDR pathway that conducted when is provided a homologous repair template, thus lead to
decrease of indel mutation.Cas9D10A is more attractive in terms of target specificity when
the sites are targeted by double Cas9 complexes prepared to create close DNA nicks. Then
the third pattern is nuclease-deficient Cas9 (Qi et al., 2013). In the domains of HNH and
RuvC there had been mutations H840A and D10A respectively that they act as inactivate
cleavage activity, but do not prevent binding of DNA. Consequently, this type of mutations
can be act as a sequence-specifically target any region of the genome without cleavage.
Therefore, through mergers with different effector domains, dCas9 might be done either as
a silencing of gene or activation tool. For instance incorporate dCas9 to a (VP64),
transcriptional activation domain targets the -200bp region from the transcriptional start
site (TSS) of endogenous genes to upregulate gene expression (Maeder et
al.,2013).Moreover, it has served as a visualization tool, like as dCas9 incorporate to
Enhanced Green Fluorescent protein (EGFP) to seen the repetitive DNA sequences with a
sgRNA or non-repetitive site via multiple sgRNA (Chen et al., 2013).In addition to increase
the recognition specificity of CRISPR system to the target by decreasing the off-target,
many types of Cas9 was developed either by change the PAM locus(Kleinstiver et al., 2015)
or by small molecule convert the activity of Cas9 (Davis et al., 2015). The more recently
studies has shown that they have developed a Cas9 variant with no detectable off-target
effect genome wide (Fig. 4.4).

37
Figure 4.4| Overview of various Cas9-based applications.(A) With the presence of a PAM sequence
on the opposite DNA strand, sgRNA binds to the target strand by base pairing and directs the nuclease Cas9 to generate site-
specific DSBs on the target DNA sequence. The DSB is then repaired either by NHEJ or by HDR. The former may cause frameshift
indel mutations that may abolish the target gene function whereas the latter may give rise to precise gene replacement. (B) Cas9
has two catalytic domains, the inactivation of either of which produces a nickase Cas9 (nCas9) that generates single-strand break
instead of DSBs. A pair of nCas9s can produce paired nicks which were reported to incur less off-target effects compared with
wild type Cas9 that generates DSBs (C) If the two catalytic domains of Cas9 are inactivated, wild type Cas9 is turned into
catalytically dead Cas9 (dCas9) that when fused to epigenetic modifiers can modulate target gene expression. (D) A scaffold RNA
(scRNA) capable of recruiting RNA-binding proteins (RBPs) can be incorporated into sgRNA. These RBPs are then tethered to
epigenetic modifiers and exert site-specific epigenetic regulations. (E) A protein scaffold termed SunTag that is capable of
recruiting up to 10 copies of VP64 is fused to dCas9 to increase the potency of transcriptional regulation. (F) Upon the existence
of an artificial PAM sequence, Cas9 is reprogrammed into RNA-targeting (RCas9) that can bind and cut single-stranded RNA
(ssRNA) site-specifically. Catalytically dead RCas9 (dRCas9) can serve as a site-specific ssRNA binding domain fused to various
effectors, which holds potentials to exert RNA modulations. (G) Fluorescent protein fused to dCas9 is directed by sgRNAs to
enable living cell imaging of genomic loci of interest.sgRNA: single guide RNA; PAM, protospacer-adjacent motif; DSB, double-
strand breaks; NHEJ, non-homologous end-joining; HDR, homologous directed repair; GFP: green fluorescent protein. Adapted
from (Hui-Ying Xue et al.2016).

38
Table 4.1| Cas9 variants for genome editing.Table adapted from (Ding et al., 2016).
References PAM sequence (5′>3′) Cas9 (species)
Cong et al., 2013; Hwang et al.,
2013; Ran et al., 2013b
NGG Cas9 wild type
Kleinstiver et al., 2015b NGG (reduced NAG binding) Cas9 D1135E
Davis et al., 2015 NGG (higher specificity) Cas9 37R3-2 (37R3-2
NGG (no detectable off-target effects) Cas9 (N497A-R661A-
Q695A-Q926A)
Kleinstiver et al., 2015b NGCG Cas9 VRER variant
Kleinstiver et al., 2015b NGAG Cas9 EQR variant
Kleinstiver et al., 2015b NGAN or NGNG Cas9 VQR variant
Kleinstiver et al., 2016 NGG (no detectable off-target effects) Cas9-HF1
Slaymaker et al., 2016 NGG (reduces off-target effects and maintains
robust on-target cleavage)
eSpCas9 (1.0)
Slaymaker et al., 2016 NGG (no detectable off-target effects) eSpCas9 (1.1)

39
Chapter 5
T cell differentiation
1. Introduction
T-Lymphocytes defend our body against the pathogens. Efficiency also results from their
capacity to recognize in a specific way pathogenic one was given and to activate an adapted
attack. Each T lymphocyte is provided with a receptor capable of recognizing specifically a
portion of a given pathogen. These receptors are different on the surface of each of our T
lymphocytes, so allowing our body to recognize a wide variety of pathogens. T
lymphocytes, at various receptors, are designed level of the thymus. Once produced, they
will exit of the thymus and borrow the bloodstream to join the lymph nodes. It is in the
lymph nodes that they will encounter the different pathogens that infect our body. Indeed,
the pathogens are transported by our immune system at the level of the ganglia to be
presented to the T lymphocytes.
In the case where a T lymphocyte recognizes in a specific way a pathogen, it will activate
and multiplies. The pathogen-specific T lymphocytes are then ready to commit the fight
against pathogenic recognized. There are several subtypes of T lymphocytes with different
weapons to fight against the pathogenic. CD8 T lymphocytes (also known as killer T cells)
are capable of killing the cells of our body infected by the recognized pathogen. CD4 T
lymphocytes (also called helper T lymphocytes) provide support to other cells in the
immune system by participating in their activation. In the lymph nodes, they will
participate in the activation of B lymphocytes, producing antibodies and activating CD8 T
lymphocytes. They will also help immune system cells at the site of infection, which they
will reach through the bloodstream .
In summary, to fight a pathogen efficiently, the T lymphocytes move via the blood vessels,
from their production site (the thymus) to the site of presentation of the pathogens (the
ganglia), finally to gain the site of the infection. They are so constantly moving in the body
and will interact with a wide variety of cells. Because T lymphocytes must be in the right
place at the right time and meet the right partners to defend effectively our body, their
mobility and the cellular interactions that they will establish must be well orchestrated.
2. Development and thymus selection of T lymphocytes
T cells originate from the hematopoietic stem cell, which of the bone marrow will
differentiate into a common myeloid progenitor and a common lymphoid progenitor. The
common lymphoid progenitors will enter the thymus and continue their differentiation.
Differentiated cells in the thymus, also called thymocytes, will undergo negative selection
and positive selection that will ensure that the T lymphocytes that come out of the thymus:
firstly, will be able to recognize the antigen presenting cells and secondly, will not react
against the self. At the end of the thymus, T lymphocytes that are then naive (they have

40
never encountered the antigen for which they are specific), will gain, by borrowing the
bloodstream, secondary lymphoid organs. This site promotes the encounter between the T
lymphocytes and the pathogenic antigens presented on the surface of the cells presenting
the antigen, in the condition of infection. In the absence of specific antigenic interaction,
naive T lymphocytes will circulate between the various secondary lymphoid organs. The
antigenic specificity of the interaction between a T lymphocyte and an antigen presenting
cell will result in the activation of the T lymphocyte. This will then be able to proliferate
clonally and perform its effector functions. Effector T lymphocytes are then described. They
can then reach the site of infection to perform their functions, go to the germinal centers of
secondary lymphoid organs to help activate lymphocytes or may be stored in the
secondary lymphoid organs.
Figure 5.1| Overall scheme of T-cell development in the thymus. Committed lymphoid
progenitors arise in the bone marrow and migrate to the thymus. Early committed cells lack expression of TCR, CD4 and CD8, and termed
DN (no CD4 or CD8) thymocytes which subdivided into four stages (DN1-DN4) and express the preTCR, then proliferation to DP,
(Adapted from Ronald N. Germain, 2002).
3. The α, β T cell differentiation pathway
T lymphocytes are the key cells in cell-mediated immunity or cellular immunity. In
opposite to cells of the innate immunity, they will identify the pathogens specifically by
their receptor for the antigen, the T Cell Receptor (TCR).
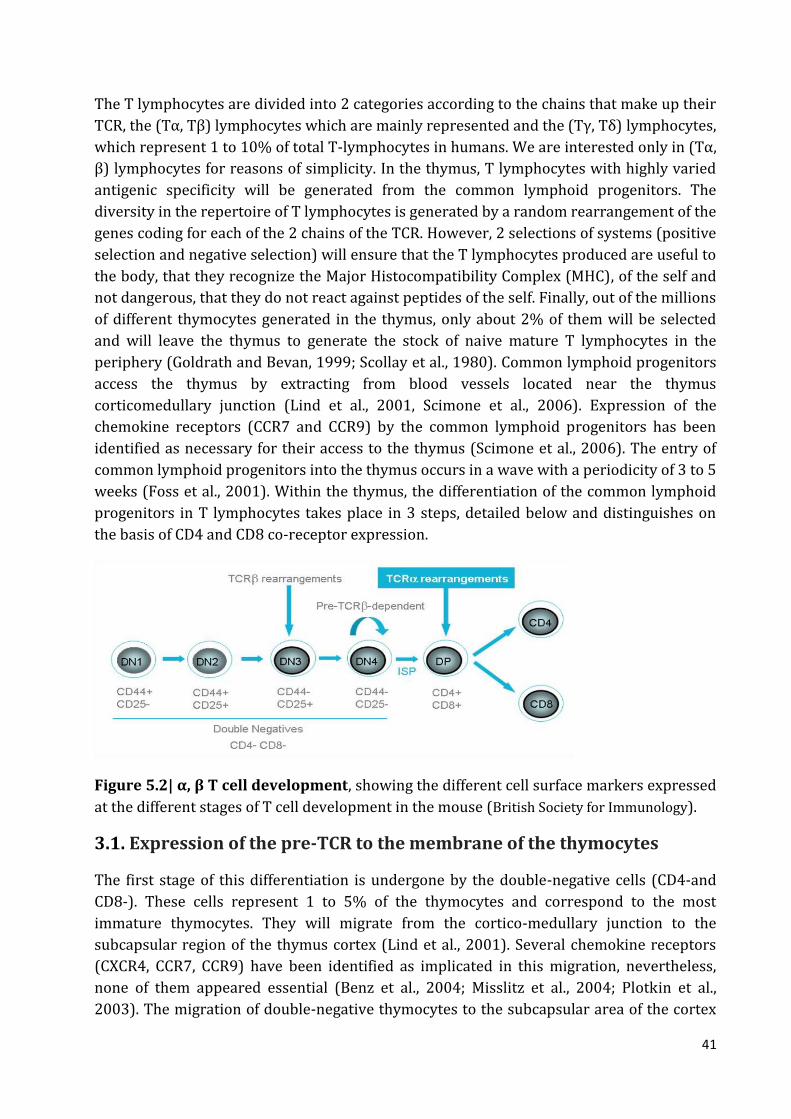
41
The T lymphocytes are divided into 2 categories according to the chains that make up their
TCR, the (Tα, Tβ) lymphocytes which are mainly represented and the (Tγ, Tδ) lymphocytes,
which represent 1 to 10% of total T-lymphocytes in humans. We are interested only in (Tα,
β) lymphocytes for reasons of simplicity. In the thymus, T lymphocytes with highly varied
antigenic specificity will be generated from the common lymphoid progenitors. The
diversity in the repertoire of T lymphocytes is generated by a random rearrangement of the
genes coding for each of the 2 chains of the TCR. However, 2 selections of systems (positive
selection and negative selection) will ensure that the T lymphocytes produced are useful to
the body, that they recognize the Major Histocompatibility Complex (MHC), of the self and
not dangerous, that they do not react against peptides of the self. Finally, out of the millions
of different thymocytes generated in the thymus, only about 2% of them will be selected
and will leave the thymus to generate the stock of naive mature T lymphocytes in the
periphery (Goldrath and Bevan, 1999; Scollay et al., 1980). Common lymphoid progenitors
access the thymus by extracting from blood vessels located near the thymus
corticomedullary junction (Lind et al., 2001, Scimone et al., 2006). Expression of the
chemokine receptors (CCR7 and CCR9) by the common lymphoid progenitors has been
identified as necessary for their access to the thymus (Scimone et al., 2006). The entry of
common lymphoid progenitors into the thymus occurs in a wave with a periodicity of 3 to 5
weeks (Foss et al., 2001). Within the thymus, the differentiation of the common lymphoid
progenitors in T lymphocytes takes place in 3 steps, detailed below and distinguishes on
the basis of CD4 and CD8 co-receptor expression.
Figure 5.2| α, β T cell development, showing the different cell surface markers expressed
at the different stages of T cell development in the mouse (British Society for Immunology).
3.1. Expression of the pre-TCR to the membrane of the thymocytes
The first stage of this differentiation is undergone by the double-negative cells (CD4-and
CD8-). These cells represent 1 to 5% of the thymocytes and correspond to the most
immature thymocytes. They will migrate from the cortico-medullary junction to the
subcapsular region of the thymus cortex (Lind et al., 2001). Several chemokine receptors
(CXCR4, CCR7, CCR9) have been identified as implicated in this migration, nevertheless,
none of them appeared essential (Benz et al., 2004; Misslitz et al., 2004; Plotkin et al.,
2003). The migration of double-negative thymocytes to the subcapsular area of the cortex

42
will last between 13 and 15 days (Porritt et al., 2003), during which they will begin to
rearrange the chain (β) of their TCR (Raulet et al., 1985). The double-negative thymocytes
express the molecular machinery necessary for the rearrangement of the genes encoding
the TCR, such as the recombinant enzymes, Recombination Activating Genes 1 and 2,
(RAG1 and RAG2) (Mombaerts et al., 1992; Shinkai et al., 1992). Based on the expression of
CD25 and CD44 markers, four distinct stages of differentiation of double-negative
thymocytes were described, double-negative 1 to 4 (DN1 to DN4) (Godfrey et al., 1993). Up
to the DN3 stage, the development of thymocytes is induced by Notch1 and supported by
IL-7 secreted by cortical stromal cells (Peschon et al., 1994; Radtke et al., 1999). Moreover,
the thymocytes themselves participate in the development of cortical stromal cells, because
in their absence the thymus cortex is histologically abnormal (Hollander et al., 1995). In the
DN2-DN3 stage, the thymocytes will begin of rearranging the genes V, D and J coding for
the chain (β) of the TCR (Saint-Ruf et al., 1994; von Boehmer, 2005). If the gene
recombination process is productive, the chain (β) will be expressed in the membrane of
the thymocyte and stabilized by the coexpression of a chain (α) substitution, the (pre-Tα)
chain. Together, the chain (β) and the (pre-Tα) chain will form the pre-TCR. Initiation of the
transduction signal by the pre-TCR allows the allelic exclusion of the locus (β) no
rearranged and transition to DN4. The latter is associated with the loss of expression of the
CD25 marker, followed by intense cell proliferation leading to the double-positive stage
(CD4 + CD8 +). The latter is represented by 80 to 90% of the present thymocytes in the
thymus (Sebzda et al., 1999). It is marked by the expression on the surface of the TCR (αβ)
after recombination functional gene V and J of the chain (α) (Alam et al., 1996).
Both Ikaros and Notch are essential for normal T cell development. The nuclear factor
Ikaros is a largely hematopoietic-specific zinc-finger regulatory protein that is essential for
normal T cell development (Chari and Winandy, 2008).Furthermore, Notch signaling is
required for cell survival and proliferation, T-cell receptor (TCR) β-chain rearrangement,
and β selection at the DN3 stage (Kleinmann et al., 2008). It has been reported by many
groups that simultaneous deregulation of Ikaros expression and the Notch pathway
cooperate in leukemogenesis, in both mice and humans. Significantly, Notch is also
essential for T cell development, suggesting that an interaction between Ikaros and the
Notch pathway could also be essential in T cell developmental processes. The mammalian
Notch family consists of four receptors: Notch1, 2, 3, and 4 (Chari and Winandy, 2008). Non
responsiveness to Notch signaling requires Ikaros, as Ikaros-deficient DN4 and CD4+ CD8+
double-positive (DP) cells remain competent to express Hes-1 after Notch activation
(Kleinmann et al., 2008).
3.2. The positive selection
The effective immunity of its host should allow removing of foreign bodies, such as
infectious agents without reacting against themselves and generate autoimmunity. This
recognizes is made potential by thymus selection during the double positive stage of
development of the T lymphocyte (reviewed in Sebzda et al., 1999). However, this selection
will allow passage from the DP stage to the SP stage only if the cell TCR recognizes the MHC

43
molecules of the host (MHC restriction) and has no specificity for a host antigen. On the
other hand, if the TCR recognizes a self-antigen with the MHC of the host the potentially
self-reactive cell will be negatively selected and eliminated (Matzinger et al., 1984;
Rammensee and Bevan, 1984). Finally, if the TCR proves unable of recognizing the MHC
the cell will be neglected and will die. The proportion of immature T cells in the thymus
that will be positively selected is only 5%, another 5% will be eliminated by negative
selection, and the remaining 90% will die negligently (van Meerwijk et al., 1997). Positive
selection allows the development of (CD4 + and CD8 +) cells forming the repertoire of
mature T cells.
T cells with a TCR recognizing MHC class I molecules will become cytotoxic T cell (CD8+
cells) (Teh et al., 1988; Sha et al., 1988), while those with TCR recognizing MHC class II
molecules will become a helper T cell (CD4 + cell) (Berg et al., 1989; Kaye et al.,
1989).Because the selection is dependent on TCR-MHC peptide interactions (the peptide
being a portion of an antigen presented by MHC), studies have helped to better define the
role of MHC peptides and molecules in the generation of the cell repertoire T mature. The
study by Nikolic-Zugic and Bevan shows that the MHC peptide complexes present during
the development of T cells directly alter the repertoire of mature T cells (Nikolic-Zugic and
Bevan, 1990).They looked at the response of T cells to albumin and used mutant MHC
molecules to demonstrate a direct correlation between the ability of MHC molecule to
present albumin and its ability to select a repertoire of T cells that can respond to the
albumin peptide. This study corroborates earlier research suggesting that the endogenous
peptide selecting the thymocyte is very close to the TCR-specific antigenic ligand of the
resulting mature T cell (Bevan and Hunig, 1981).Studies have also shown that the development
of CD8 + thymocytes was dramatically reduced in mice deficient for β2 microglobulin, a class 1
MHC component, or TAP (Zijlstra et al., 1990; vanKaer et al., 1992).The absence of β2
microglobulin prevents the expression of MHC class I while the absence of TAP results in
low expression of MHC class I molecules that are empty, that is, not associated with a
peptide. However, when β2 microglobulin is added exogenously with a mixture of peptides
to a culture of thymus lobes deficient for β2 microglobulin, positive selection resumes
(Hogquist et al., 1993).
3.3. The negative selection
Once the positive selection has been made, the thymocytes will join the medulla thymus to
continue their development and be subjected to negative selection (Campbell et al., 1999;
Kim et al., 1998; Witt et al., 2005). The negative selection makes it possible to eliminate
self-reactive thymocytes, which have a too high affinity for self-MHC-peptide complexes. In
the case where self-reactive thymocytes are found in the periphery, they would be
dangerous for the body and hence the need to eliminate them. At the level of the medulla,
thymus epithelial cells as well as dendritic cells present, on their MHC molecules, self-
antigens also expressed in peripheral organs. The ectopic expression of these antigens by
thymus epithelial cells is under the control of the protein AIRE (AutoImmuneREgulator)
(Anderson et al., 2002).AIRE has important similarities with transcription factors and

44
regulates the expression of 200 to 1200 genes in mice. In humans, AIRE deficiency causes
an autoimmune syndrome, APECED (Autoimmune PolyEndocrinopathy Candidiasis
Ectodermal Dystrophy) (Anderson et al., 2002).
The outcome of the interaction between a self-reactive thymocyte and a cell epithelial
thymus will be the functional inactivation of the thymocyte also called anergy (van
Meerwijk et al., 1997). On the other hand, the outcome of the interaction between a self-
reactive thymocyte and a dendritic cell will be the elimination of the thymocyte by
apoptosis (Page et al., 1996).

45
Chapter 6
Transcription factors involved in T cell differentiation
6.1. Introduction
Hematopoiesis indicates the process of many steps which creates each of the specific
immune and blood cell lineages, all of them are generated from pluripotent cells in the
bone marrow called hematopoietic stem cells (HSCs) (Wickramasinghe and McCullough,
2003). HSCs cells, such other stem cells, have the distinctive capacity to regenerate
themselves and produce new cells. These new cells are committed on one of two main
lineages of the HSCs, the myeloid progenitor or the lymphoid progenitor lineage. Their
offspring are subject to further series of reproduction, differentiation and lineage limitation
to form all of the ultimately differentiated cells (Shizuru et al., 2005). Lymphoid
progenitors migrate to the thymus where the different T cell lineages are produced, and
eventually lead to the mature T cell lineages, including γδ T cells and αβ T cells. The αβ T
cells are divided in several sub-lineages, like CD4+ T cells, CD8+ T cells, regulatory T cells
(Treg cells) and natural killer T cells (NKT); each of these possesses specific functions
when they migrate from the thymus to the periphery (Orkin, 2000; Shizuru et al., 2005;
Blom and Spits, 2006; McCrath et al., 2003; Hansen and Zapata, 1998). Since all T cell
subsets keep similar genome sequences, the obstetrics of cell subsets with special
functional characteristic is organized by spatiotemporal expression of a chosen set of
genes. Indeed, many studies have shed light on the key transcription factors that
participate in decision-making processes through T-cell differentiation in the thymus and
in the periphery (Taku et al., 2011) (Table 6.1).
The real development of T cells usually counts on the timing and level of transcription of
lineage-specific regulatory genes. Through hematopoiesis, transcription factors act as
coordinated of complex development events by altering a set of genes that decrease multi-
lineage prospect and drive development toward particular lineage fates (Rothenberg,
2011). The activity of the transcription factors rely on their dosage, availability of their
partners, in addition to their totally binding specificity and tendency for a consensus DNA
sequence. Transcription factors that are essential for T-cell specification and commitment
include IKAROS, RUNX1, TCF1, GATA3 and ETS and E family of proteins (Fig. 6.1).

46
Table 6.1|Essential transcription factors involved in T cell differentiation.
Figure 6.1|Role of different transcription factors during T cell differentiation.

47
6.2. Ikaros
The Ikaros transcription factor is encoded by the Ikzf1 gene. Ikaros is expressed in all
hematopoietic cells (HSC of Lin-cKit + Sca1 + phenotype, myeloid and erythroid cells, T and
B lymphocytes) (Morgan et al., 1997, Kelley et al., 1998, Klug et al., 1998, Kirstetter et al.
2002). The lymphocyte differentiation is adopted on nuclear factors that act as crucial
regulatory nodes which govern gene expression in a cell type, and stage-specific manner. A
key node in the lymphoid lineage regulatory circuit is the Ikaros family of zinc-finger DNA
binding proteins, repression that causes lymphocyte disorders and lymphoid malignancies
(Georgopoulos, 1997; Cobb, Smale, 2005). However, the regulation of Ikaros expression
varies from one cell lineage to another. In effect, the level of Ikaros expression decreases in
parallel with cell differentiation myeloid and erythroid (Klug et al., 1998, Dumortier et al.,
2003). Conversely, the level of Ikaros expression increases during T cell differentiation
(Morgan et al., 1997, Kelley et al., 1998). This probably reflects different functions of Ikaros
in these lineages. Several isoforms might be transcribed from the Ikzf1 gene (Gorzkiewicz
and Walczewska, 2014). The Ik-1 and Ik-2(H) isoforms are the most abundantly expressed
isoforms in hematopoietic cells (Morgan et al., 1997, Molnar and Georgopoulos, 1994).
Thus, most Ikaros proteins produced in normal hematopoietic cells are capable of binding
to DNA. The mechanisms of regulation of the expression of Ikaros are not very well known.
However, a previous study has demonstrated the presence of DNase I hypersensitive sites
and mapped several promoter sites in the Ikaros locus (Kaufmann et al., 2003). The
identification of these regulatory elements is of particular interest since it should allow the
detection of transcription factors involved in the regulation of the Ikaros gene.
The first key role of Ikaros transcription factor was demonstrated in the lymphoid- primed
multipotent progenitor (LMPP) (Adolfsson et al., 2005; Lai and Kondo, 2006). In addition,
the Ikaros associated with a higher order epigenetic complex which includes various
chromatin remodeling activities, on the one hand, primes an early lymphoid lineage
transcriptional signature, whereas, on the other hand, it has repressed a stem cell-specific
transcriptional signature (Ng et al., 2009). Ikaros deficient LMPPs are incapable to subject
lymphoid differentiation. Instead, they differentiate into the myeloid lineage while
retaining significant stem cell-specific gene expression (Yoshida et al., 2006; Ng et al.,
2009). Interestingly, limitation of a hematopoietic stem cell (HSC) into an LMPP is
confirmed by an increase in expression of Ikaros.
The second critical role of Ikaros is at stages of T and B cell differentiation, which express
high levels of Ikaros mRNA and protein (Georgopoulos, 1997; Kelleyet al., 1998). Thus, the
decrease in Ikaros levels in double-positive thymocytes and in pre-B cells is linked with
irregular differentiation and leukemic transformation in both mice and humans
(Georgopoulos et al., 1994; Georgopoulos, 2009).

48
6.2.1. Ikaros structure and function
The important properties of Ikaros that participated to its discovery were the C2H2 zinc
finger (ZF) motifs existing in two Krüppel-like zinc finger domains that are the feature for
both DNA and protein binding. Four ZF motifs are placed centrally on the N-terminal
domain of the Ikaros protein (ZF1–ZF4) are recognized to possess DNA-binding affinity,
while 2 additional zinc fingers (ZF5, ZF6) placed in the C-terminal domain, called the
dimerization domain, are responsible for protein interaction (Li et al., 2011; Cobb et al.,
2000; Payne, 2011) (Fig. 6.2). Supposedly, the C-terminal zinc fingers are involved in the
pericentromeric targeting of Ikaros proteins in the nucleus (Payne, 2011).
Figure 6.2| Structure of Ikaros family member proteins. Exon 1 is untranslated. Some
forms lack translation of the last 30 bases of exon 7 (the part marked with ‘‘X’’) and are designated
as ‘‘minus’’ forms. (A) Structure of Ikaros 1 protein. (B) Structures of major functional Ik-forms: Ik-
H and Ik-X. (C) Structures of major DN Ik-forms: Ik-6, Ik-9 and Ik-10. ZF: zinc finger; Nm N-terminal
end; C-: C-terminal end (Adapted from Gorzkiewicz and Walczewska, 2014).
As exon (1) is not translated and was not been identified at the begin, the first records
reported only seven exons (Francis et al., 2011; Hahm et al., 1994). However, all isoforms of
Ikaros involved the exon (8) with protein-binding ZF5 and ZF6 motifs. Furthermore,
several of the IKZF1 family member genes lost the last 30 bases of exon 7 and are named as
minus forms (Francis et al., 2011). When Ikaros interacts with DNA, it binds to the main
groove of DNA (Payne, 2011). Given the fact as transcription factor, Ikaros linked to (1 or 2
sites) include the (C/T) GGGA (A/T) sequence in promoters of regulated genes (Rebollo

49
and Schmitt, 2003; Li, 2011; Sun et al., 1999; Iacobucci et al., 2012; Yap et al., 2005). The
Ikaros protein possesses 1 domain for activation and 2 domains for repression (Sun et al.,
1996). The capacity to repress gene transcription does not count on DNA-binding affinity
or dimerization features but on the cell type and the sequence of gene promoters (Koipally
et al., 1999). The Ikaros-induced repression is mediated by chromatin modification and co-
repressor recruitment, in addition to competition for DNA sequences (Sellars et al., 2011]).
Ikaros has been suggested to be a major regulator of the transition of pre-B or pre-T cells to
mature lymphocytes (Winandy et al., 1999). Reduction of Ikaros level, in either T or B cells,
causes a fail in antigen-receptor rearrangement (Winandy, 2013). This factor also regulates
the transcription of lymphoid specific genes, such as Cd4 or Cd8 (Harker et al., 2002;
Collins et al., 2013). Loss of Ikaros activity through the progression of double negative T
cells (CD4−CD8−) to double positive (CD4+CD8+) thymocytes lead to unsuitable pre-TCR
and TCR signaling (Winandy et al., 1999; Collins et al., 2013).Moreover, the subsequent
differentiation step is strongly deviated toward CD4+ single-positive T cells. Furthermore,
the normal proliferative expansion of T cells does not happen, leading to a highly
hypocellular thymus (Winandy et al., 1999).
6.2.2. Ikaros alterations in hematologic malignancies
Several studies have documented that the deletions of IKZF1 gene (Mullighan,2012) are
considered to be the cause or the result of many human hematological diseases, like as
acute lymphoblastic leukemia (ALL) (Sun et al., 1995). Furthermore, mutations of the
Ikaros gene indirectly result in myeloproliferative neoplasms (MPNs) or its progression to
acute myeloid leukemia (AML) (Francis et al., 2011). There are diverse IKZF1 mutations
during the blastic progression of chronic myeloid leukemia (CML) (Mullighan, 2008).
Activation of the JAK-STAT pathway have been suggested to be responsible for the
leukemogenic potential of IKZF1 gene mutations (Jäger et al., 2010; Tefferi, 2010).
Homozygous IKZF1 gene deletions are embryonic lethal and are linked with the failure or
cancel development of all lymphoid cells, the early lymphoid progenitors, in addition to
overly macrophage formation and totally flawed erythrocyte and granulocyte
differentiation. Heterozygous modifications of the IKZF1 gene generally tend to fast
development of aggressive leukemias and lymphomas (Sun et al., 1996; Winandy et al.,
1995; Papathanasiou et al., 2003). The replacement of an amino acid in the DNA-binding ZF
domain resulting from a point mutation in one allele of the Ikaros gene will cause
congenital pancytopenia. This mutation leads to profound B lymphopenia and destroyed
NK cells, nonetheless, the number of T cell remains normal, which suggest that other Ikaros
family members can replace the loss of Ikaros itself (Goldman et al., 2012). Furthermore,
Ikaros-dependent alteration of lymphopoiesis can also result from its loss of expression.
Ikaros knockout mice have no fetal T-cell development but do exhibit some irregular
postnatal T-cell development (Wang et al.1996). Rag-1–/–Ikaros–/– mice have
‘breakthrough’ DP cells, indicating that Ikaros is needed for proper maintenance of the pre-
TCR checkpoint (Winandy et al., 1999). However, unlike DP cells in Rag-1–/–E2A–/– mice,

50
Rag-1–/–Ikaros–/– DP cells are inefficient at proliferation, thus indicating that the
proliferative and differentiation responses normally associated with b-selection have been
decoupled in the absence of both Ikaros and the pre-TCR signal. In addition, whereas
Ikaros–/– mice develop T-cell leukemia by 3 months, no leukemia was generated in the
absence of a pre-TCR or TCR (Winandy et al., 1999). Ikaros, therefore, acts as a tumor
suppressor gene in the context of TCR signaling, perhaps in part by maintenance of p27
expression ( Kathrein et al., 2005), in addition to its roles in regulating T-cell-specific genes.
6.3. Runx1Transcription Factor
Runx1 is expressed through thymocyte development (Satake et al., 1995; Simeone et al.,
1995). It is expressed in cortical thymocytes (Woolf et al., 2003), and shows a high level of
expression in CD4/CD8 double-negative (DN3) thymocytes (Taniuchi et al., 2002).
Overexpression of Runx1 in thymocytes by a transgenic system, resulted in stimulation of
CD8 single-positive (SP) thymocyte differentiation (Hayashi et al., 2001) and block of the
differentiation of Th2 effecter T cells (Komine et al., 2003). T cell-specific disruption of
Runx1 in mice using the Cre-loxP recombinase system lead to a deep disorder in the DN to
CD4/8 double-positive (DP) transition (Wang et al., 1993). Moreover, it was also shown
that Runx1 actively represses CD4 expression in DN thymocytes (Taniuchi et al., 2002). In
addition, together with other cofactors, Runx1 binds to the enhancers of TCRα (Giese et al.,
1995), TCRβ (Sun, W. et al., 1995), TCRγ (Hernandez and Krangel., 1995), and TCRδ
(Hernandez and Krangel., 1994) and activates transcription of these genes. Thus, Runx1
plays an important role in early thymocyte development.
Runx1 possess many specific domains of detect biochemical functions. The Runt domain
act as mediates both binding to DNA and dimerization with core-binding factor β subunit
(Wang al., 1993), while the domain of activation interacts with transcriptional coactivators
to upregulate transcription of the interest genes (Bae et al., 1994; Tanaka et al., 1995).
Across the C-terminus of the activation domain located an inhibitory domain which
opposes the impact of the activation domain (Kanno et al., 1998).
6.4. Ets Transcription Factors
The ETS proteins relate to a family of transcription factors of which several members are
expressed through T cell differentiation, including (Ets-1, Ets-2,Erg, Fli-1, Tel, Elf-1,
GABPalpha, PU.1 and Spi-B). Of these, the function of ETS1 end ETS2 factors is the best
characterized in T cell (Anderson et al., 1999). For instances, the Ets2 and Ets1 mRNAs are
expressed at consistent levels during T cell development with increased expression of both
transcripts at the pre-T DP stage (Anderson et al, 1999). Several articles in the mouse
model have addressed the role of Ets1in thymic development (Bories et al., 1995).
Overexpression of Ets2 or a dominant negative form of Ets2 (ets2) by transgenic mice
impact on the number and maturation of thymic cells in young animals (Zaldumbide et al.,
2002). In addition, it was observed that Ets2 expression permit thymocytes to proliferate
and better survival upon induction of apoptotic signals. Also, c-Myc, an Ets2 target gene, is
51
upregulated in rapidly proliferating Ets2-expressing thymocytes pretreated with
dexamethasone, which indicated that Ets2 plays a role in proliferation and survival of
thymocytes probably via a Myc-dependent pathway.
6.5. Heb Transcription Factor
The bHLH (basic helix-loop-helix) transcription factor E-box binding protein (HEB) is
highly expressed in the thymus (Hu et al., 1992; Nielsen et al., 1992). HEB is thought to
regulate E-box sites present in several T cell-specific gene enhancers, including TCR-a, TCR-
b, and CD4. Moreover, Heb and Heb (ALT) are upregulated at the DN2 and DN3 stages
(Rothenberg et al., 2008; Wang et al., 2006). The numbers of DN thymocytes and (γδ) T-cell
are influenced by the lack of HEB, consistent with a disorder that arises after the DN3 stage
(Barndt et al., 1999). Several studies have reported that HEB acts as a heterodimer with
E2A, that affect the T cell development at both the DN and DP stages (Jones and Zhuang,
2007; Barndt et al., 2000; Wojciechowski et al., 2007). However, these blocks are
incomplete and almost normal (αβ) T cell development happens in the absence of HEB,
which support the idea of compensatory roles for E2A and HEB. Indeed, conditional
deletion of both HEB and E2A in DP thymocytes resulted in a failure of the DP to SP
checkpoint for TCR expression (Jones and Zhuang, 2007; Louise et al., 2010).
6.6. Tcf1 Transcription Factor
The T cell-specific transcription factor, Tcf1, is the first factor involved in the
differentiation of T cell process. Tcf1 is a T cell-specific DNA-binding nuclear protein
(Wetering et al., 1991; Oosterwegel et al., 1991). The domain of DNA binding of Tcf1 is
named HMG box (Laudet et al., 1993). Although the Tcf1 expression is widely distributed in
the embryo (Oosterwegel et al., 1993), the expression in adult is confined to immature and
mature T cells. However, it is expressed in all thymocyte subsets, including the earliest,
DN1, and represents the first definitive T-lineage marker (Verbeek et al., 1995; Hattori et
al., 1996). Many reports have been demonstrated that essential functions for TCF1 are
linked to stages of T cell development that are regulated by the TCR or pre-TCR signaling
(Staal et al., 2008a; Staal et al., 2008b).

52
RESULTS

53
Chapter 7
Functional Study of Lymphoid specific enhancers
1. Objectives In the recent report by Vanhille et al., our laboratory performed CapStarr-seq
experiments to asses enhancer activity of putative cis-regulatory modules (CRM)
selected based on the overlap between DNase I hypersensitive sites and regions bound
by a selection of lymphoid TFs found in primary DP thymocytes (Vanhille et al., 2015).
The CapStarr-seq experiments were performed in two mouse cell lines: The P5424 T cell
line and the NIH-3T3 fibroblasts. One important observation of this study is that
enhancer strength is directly associated with the number of bound TFs. Indeed, strong
enhancers are significantly enriched for the co-binding of ETS1, RUNX1, HEB, TCF1 and
IKAROS TFs, and to less extend GATA3.
Thus, in order to identify and characterize novel enhancers regulating lymphoid genes
we combined the CapStar-seq data and ChIP-seq data for the 6 aforementioned TFs. We
selected three potential regulatory regions that harbor enhancer activity, are close to
important genes for T cell differentiation and are bound by at least 5 lymphoid
transcription factors. Based on these criteria we selected enhancers associated with the
Ikzf1, Runx1 and Ets2 loci and performed functional studies by using CRISPR/Cas9
approaches.
The P5424 cell line used in the previous CapStarr-seq experimeriments is a T cell line
derived from a RAG1 x p53 double mutant thymus (Mombaerts et al., 1995) I choose this
cell line for my functional experiments because it was previously used in the CapStarr-
seq experiments, resembles DP thymocytes at phenotypic and transcriptomic levels
(Vanhille et al., 2015), and is easily handle.
Stimulation of T cells with phorbol myristate acetate (PMA) and Ionomycin activates
TCR signaling and activate T cells via PKCi and NFAT pathways (Chatila et al., 1989; Im
et al., 2002) (Fig. 7.1). Importantly, treatment of P5424 cells by PMA/Ionomycine mimic
T cell differentiation and b-selection, as exemplified by repression of the Ptcra gene and
induction of Tcra genes (Fig. 7.2). Moreover, our lab performed RNA-seq experiments
with control and PMA/Ionomycine treated P5424 cells. Analyses of this dataset reveal
the regulation of key T cell factors, including down-regulation of Notch1/3 and induction
of Ikzf1 genes, which represent a hallmark of b-selection (Fig. 7.3). In summary, the
P5424 cell line appears as a convenient model to study gene regulation during early T
cell differentiation.

54
Figure 7.1|The combination of PMA/Ionomycine induces TCR signaling and activates
T cells via PKCi and NFAT pathways.
Figure 7.2|Assessment of gene expression of two T cell markers after PMA/Ionomycin
treatment of P5424 cells (results from Lan T.M. Dao).

55
Figure 7.3.|Effects of PMA/ Ionomycin treatment on gene expression in P5424 cell line assessed by
RNA-seq(results from Lan T.M. Dao, analyzed by Denis Puthier).
2. Functional study of an Ikzf1 enhancer Ikzf1 is associated with two clusters of enhancers or super-enhancers. We identified a
strong enhancer located 120 kb upstream Ikzf1 and lying within the upstream super-
enhancer (IkE120). By using CRISPR/Cas9 genomic deletion approach, I studied the
precise function of IkE120 enhancer in regulating Ikzf1 expression. A manuscript for
which I will be the first author has been written (see manuscript below).
3. Contributions Experimental contribution: To carry out this project, my supervisor and I routinely
discuss conceptual and experimental designs and I performed most experimental works,
which include:
- Selection of the enhancer.
- Cloning.
- Design and perform CRISPR/Cas9-mediated knock-out strategies and screening.
- ChIP-seq.
- RT-QPCR analysis, gene expression analysis.
Manuscript contribution: Contribute to write the manuscript and editing figures.

56
MANUSCRIPT
Multiple functions of an Ikzf1 enhancer in regulating gene expression

Multiple functions of an Ikzf1 enhancer in regulating gene expression
Summary:
Tissue-specific and cell identity genes are usually associated with cluster of enhancers, also called
super-enhancers, which are believed to ensure proper regulation of gene expression throughout cell
development and differentiation. However, whether individual enhancer components synergistically
contribute to induce gene transcription or play a more complex role in controlling gene expression is
not clearly understood. In this study, we combined epigenomics and transcription factor binding
along with high-throughput enhancer assay and 4C to prioritize an enhancer element located 120 kb
upstream the IKZF1 gene, encoding a key lymphoid-specific transcription factor. We found that
deletion of the E120 enhancer resulted in significant reduction of Ikzf1 mRNA. However, we observed
that immature transcription, promoter and exon usage were differentially affected in the IKE120-
deleted cells. These results indicated that E120 element might have additional functions over solely
regulating transcription initiation. We suggest that expression of some tissue-specific and cell
identity genes might, at least partially, be regulated at the level of mRNA maturation and that
components of enhancer’s clusters are directly involved in this process.
Introduction
Cell-type specific regulation of gene expression requires the activation of promoters by distalgenomic
elements defined as enhancers.The classical view of enhancer function is that they contribute to
increase the overall level of gene expression by inducing transcription from associated promoters
(Plank and Dean, 2014). Complex gene regulation is mediated by the association of cluster of
enhancers, also called super-enhancers (Pott and Lieb, 2015). Whether the individual components
(i.e. single enhancers) synergistically contribute to increase transcriptionof their target genes or have
distinct specialized functions have been a matter of debate(Pott and Lieb, 2015; Bevington et al.,
2017; Hnisz et al., 2017; Suzuki et al., 2017). Ikaros is a lymphoid specific transcription factor which
plays a major role in both T and B cell differentiation (Georgopoulos, 2017). During T cell
differentiation Ikaros have been shown to be required for proper gene regulation during the DN to
DP transition (also called b-selection) mainly by recruiting chromatin repressors (Kim et al., 1999;
Kleinmann et al., 2008) and silencing Notch1 target genes (Sridharan and Smale, 2007; Kleinmann et
al., 2008; Oravecz et al., 2015). Importantly, Ikaros deregulation or mutation play an important role
in leukemia (Winandy et al., 1995; Kastner and Chan, 2011; Zhang et al., 2012; Schjerven et al., 2013;
Olsson and Johansson, 2015). In mouse and human, Ikaros is encoded by the Ikzf1gene and is known
to harbor several transcripts isoforms playing different regulatory roles (Molnar and Georgopoulos,
1994; Molnar et al., 1996; Sun et al., 1996; Klug et al., 1998; Bellavia et al., 2007). To gain insight into
the regulation of Ikzf1 gene in T cells we identify here an enhancer located 120 upstream Ikzf1 and
studied the functional role of this regulatory element.

Results
Prioritization of an Ikzf1 enhancer
IKAROS transcription factor is encoded by the Ikzf1 gene. In mouse, Ikzf1is induced between the CD4-
CD8-(DN) and CD4+CD8+(DP) thymocytes and play an essential role in the so-called -selection
process (Georgopoulos, 2017). In DP thymocytes,Ikzf1 is associated with two clusters of enhancers or
super-enhancers (Fig. 1A). Circularized chromosome conformation capture sequencing (4C-seq)
experiments performed in DP thymocytes showed that the Ikzf1 promoter strongly interact with the
upstream super-enhancers (Fig. 1B). Thirteen DNaseI hypersensitivesites (DHS) are found within the
two super-enhancers. Regulatory elements within the Ikzf1-overlapping super-enhancer have been
previously studied (Kaufmann et al., 2003; Yoshida et al., 2013). We analyzed previously published
CapStarr-seq data obtained in the P5424 T cell line (Vanhille et al., 2015) to assess enhancer activity
from all Ikzf1-associated DHS (Fig. 1A). We found that 4 and 2 DHS displayed weak strong enhancer
activity, respectively. Of these, the DHS located at 120kb upstream Ikzf1(hereafter IkE120) displayed
strong enhancer activity, strongly interact with Ikzf1 promoter and was the only to be bound by the
combination of 5 lymphoid transcription factors, including IKAROS itself. We decided to further
explore the role of this enhancer in the P5424 cell line.
Deletion of Ikzf1 enhancer IkE120
We used CRISPR/Cas9 technology to delete the IkE120 genomic region in the P5424 cell line,
encompassing 305 bp covering the DHS site and all 5 transcription factor binding sites (IkE120 cells)
(Fig. 2A). Homozygous deletion of IkE120 was assessed by qualitative PCR and Sanger sequencing
(Fig. B-C). Ikzf1 locus harbors 6 transcript isoforms, based on RefSeq annotation (Fig. 2D, upper
panel). We first assessed the expression of the common 3' UTR (Exon E8). We observed a decrease of
4 fold in the IkE120 clone with respect to wild-type (wt) cells (Fig. 2D).Same was observed for
transcripts encompassing exons E4-E5, and decrease of 2 fold for transcripts encompassing exons E3-
E4 and E6-E7, while transcripts containing exons E2-E3 were not affected by IkE120 deletion (Fig.
2D). We also assessed promoter usages by quantifying the transcripts initiating from either E1L or
E1S. Both transcripts were significantly reduced (Fig. 2D).
Ikzf1 expression can be stimulated by treatment of P5424 cells with PMA/Ionomycine, which partially
mimic T cell differentiation and -selection (Fig. 3A and data not shown). To validation of induction
by PMA/Ionomycine we performed kinetic study of the differential expression of lncRNA (Xloc-
005923) and Ikzf1 gene by RT-qPCR (Fig. 3B). Stimulation of P5424 cells resulted in an increase of
Ikzf1 expression of both transcripts of promoter usages. In this condition only the most 3' exons were
affected by the IkE120 deletion (Fig. 3C). To gain insight into other potential structural effects on
Ikzf1 expression, we performed total RNA-seq from ribosomal depleted RNA (total-RNA-seq) of
PMA/Ionomycine stimulated cells (Fig. 4A). Splicing analyses of the Ikzf1 locus revealed a substantial
difference in the usage of a new alternative exon located between E3 and E4 (hereafter E3b). Indeed
the usage of E3b increased 2-to-3 folds in the IkE120 clone as compared to wt cells. Because no
splicing involving E3b as an acceptor was detected by total-RNA-seq (Fig. 4B). Also we assessed the
usage of a new alternative exon that revealed a substantial difference (Fig. 4C), it is likely that E3b
might represent an additional alternative promoter. We concluded that IkE120 enhancer is required
for proper expression of Ikzf1 gene. However, the effect of IkE120 does not appear to be equally
distributed along the Ikzf1locus, which might suggest that some transcripts isoforms could be
preferentially targeted.
Expression of neighbor genes and potential target genes
We next tested whether the cis-regulatory role of IkE120 was specific to the Ikzf1 gene. We first
explored the expression of neighbor genes located less than 1 Mb around Ikzf1and found that only
Fignl1, located was relatively highly expressed. Strikingly, in the IkE120 clone, the expression of the
downstream gene Fignl1, located 30 kb downstream Ikzf1, was significantly reduced (Supplementary
Fig.1). Thus, the IkE120 enhancer might play a more complex role in the epigenetic landscape of the
locus.
We also explored the expression of known Ikaros targets and found that several were down-
regulated (Supplementary Fig. 2). This might be due a consequence of the reduced level of Ikzf1
expression or to a change of the relative ratio of Ikaros isoforms.
Deletion of IkE120 affects local epigenomic and transcriptomic profiles
To assess whether IkE120 deletion affects global chromatin structure of the Ikzf1 locus we performed
ChIP-seq experiments in order to assess H3K27ac. As shown in figure 5A, deletion of IkE120 resulted
in decreasedlevels of H3K27ac around the deleted enhancer and to less extent around the Ikzf1
promoter. Thus IkE120 does not have a wide-spread effect on H3K27 acetylation of the locus, but
rather contribute to localized epigenetic marking.
IkE120 overlaps with the PMA/Ionomycine-inducible lincRNA Xloc_005922 (Fig. 5B). Based on the
analyses of splicing events (data not shown) this transcript is likely to be co-transcribed with an
upstream lincRNA (Xloc_005923) initiating 8 kb upstream IkE120. Deletion of IkE120 resulted in
reduced expression of Xloc_005923and Xloc_005922in unstimulated cells. However in
PMA/Ionomycine treated cells, deletion of IkE120 resulted in increased expression of both lincRNA
(Fig. 5C). This result was confirmed by total-RNA-seq (Supplementary Fig. 1B).Therefore, it is unlikely
that IkE120 functions a promoter of Xloc_005922. These observations also make unlikely that the
observed effects of IkE120 on Ikzf1 expression could be indirectly mediated by these lincRNAs.
Deletion of IkE120 resulted in increased immature/mature transcription ratio
We have shown that Ikzf1 is associated with a divergent non-coding transcript initiating from the
same promoter, but also with relatively high levels of intronic (i.e. immature) transcripts (Lepoivre et
al., 2013) (see also Fig. 6A).We previously suggested that both features might be functionally linked
with increased pervasive transcription at promoters of developmental transcription factors.
Therefore, we investigated whether IkE120 deletion affected the level of antisense and/or immature
transcripts at the Ikzf1 locus (Fig. 6B).Without stimulation, the RNA levels of antisense and 1st intron
transcripts were slightly reduced in IkE120 cells while the signal at the 3rd intron was dramatically
increased by 4 fold (Fig. 6B, left panel). After PMA/Ionomycine stimulation, all three amplicons
increased in IkE120 cells (Fig. 6B, right panel). Increased antisense and intronic signals in IkE120
cells were confirmed by total-RNA-seq (Fig. 6C). In addition we observed extended RNA-seq signal
after the 3’ end of Ikzf1in IkE120 cells, reminiscent of extended Pol II read-through.
To assess whether the increased intron/exon ratio observed in IkE120 cells was specific of the Ikzf1
locus, we computeda global splicing index based on total-RNA-seq (Supplementary Fig.3).

Surprisingly, we observed that the global splicing index was significantly reduced in the IkE120 cells
as compared with wt P5424 cells. Whether this global phenotype is due to an indirect effect of lower
Ikzf1 expression (or different isoform expression) or to additional unrelated mutation(s) present in
the IkE120 clone will need to be further investigated.
Discussion
The study of IKE120 deletion in the P5424 T cell line demonstrated a role of this enhancer in
controlling the expression of Ikzf1 and Fignl1 genes. Additional analyses suggested a potential
function of IKE120 in regulating alternative splicing or promoter usage of Ikzf1 gene. We also
observed decreased splicing efficiencyIkE120 cells, which might be due an indirect effect of IKE120
function or to additional unrelated mutation(s) present in this clone. We can make three different
hypotheses to explain our results:
First hypothesis: The observed phenotype is totally or partially due to an additional mutation
due to unspecific cleavage by Cas9. For instance a mutation of a splicing factor might result in
decreased splicing efficiency.
Second hypothesis: Deletion of IkE120 results in a differential expression of Ikzf1 isoforms.
This new isoform might encode for an IKAROS protein, which either play a direct role in
regulating splicing efficiency or inhibit the normal function of IKAROS. I think this hypothesis is
likely based in two evidences: On the one hand, Ikzf1 locus is known to express several isoforms,
which have been shown to display different regulatory properties (Molnar and Georgopoulos,
1994; Molnar et al., 1996; Sun et al., 1996; Klug et al., 1998; Bellavia et al., 2007). Within this
line, our results suggest that IkE120 might be involved in regulating the expression of different
isoforms. On the other hand, knock out of Ikzf1 gene results in complex phenotypes and
previous authors have suggested that IKAROS might regulate gene expression by unknown
mechanisms (Arenzana et al. 2015). More precisely a recent publication showed that IKAROS is
able to interact with PP1 enzyme, which is involved in transcription elongation and splicing
(Bottardi et al. 2014), thus the author suggest that IKAROS might be involved in splicing control
of its target genes.
Third hypothesis: The role of IkE120 is limited to control transcription initiation, and all the
other observations resulted from non-specific mutations.

Short-term perspectives
To complete the current manuscript and clarify the role ofIkE120 I propose to perform the following
experiments:
1. To analyze the expression of the different Ikaros isoforms by qualitative PCR and Sanger
sequencing.
2. To confirm the differential usage of E3b and explore whether this is associated to an alternative
promoter.
3. To reintroduce the IkE120 enhancer in the IkE120 clone by CRISPR-mediated homologous
recombination. This will allow discriminating between the role of IkE120 and any non-specific
artifact that might be present in the IkE120 clone.
4. ChIP-seq Pol II and histone modifications.
5. To perform additional 4C experiments in wt andIkE120 cells. This will shed light on the impact of
IkE120 on the genomic topology of the locus.

METHODS
Cell culture
P5424 T cell line (Mombaerts et al., 1995) was kindly provided by Dr. Eugene Oltz,
Washington, USA and was cultured as described previously (Vanhille et al., 2015). Cells
were passed every 2-3 days and routinely tested for mycoplasma contamination, and
maintained in RPMI medium (Gibco) supplemented with 10% FBS (Gold, PAA) at 37 °C,
5% CO2.
CRISPR/Cas9 genome editing
The targeted enhancer regions were defined by the peaks of CapStarr-seq and DNase-
seq which binding 6 TFs (Fig. 2A). For knockout experiments, the general strategy is
shown in (SuPP. Fig. 5). Two gRNAs were designed at each end of the targeted region by
CRISPR direct tool (Naito et al., 2015). The gRNAs were cloned into the gRNA cloning
vector (Addgene #41824) as previously described (Mali et al., 2013). Two million cells
were transfected with 3µg of each gRNA and 3µg of Cas9 (Addgene #41815) using the
Neon transfection system (Life Technologies). After 3 days of transfection, the bulk
transfected cells were plated in 96-well plates at the limiting dilution (0.5 cell per 100 µl
per well) for clonal expansion. After 10-14 days, individual cell clones were screened for
homologous allele deletion by direct PCR using Phire Tissue Direct PCR Master Mix
(Thermo Scientific) followed manufacture's protocol. Forward and reverse primers
were designed bracketing the targeted regions allowing the detection of knockout and
wild-type alleles. Clones with homologous allele deletion were considered if having at
least one expected deletion band and no wild-type band (Fig. 2C). If more than two cell
clones were obtained for a given loci, we chose the cell clones with the most precise
deletion. All the gRNAs and primers are listed in the Supplementary Table1.
PMA/Ionomycin induction
1 x 10⁶ cell/ ml of P5424 cells (WT and ∆IkE120) were stimulated for 6 hours with 20
µg/ml of PMA plus 0.5 µg/ml of ionomycin in well plate of 3 independent experiments.
Then, total RNA was prepared from resting or stimulated cells using an RNeasy kit
(Qiagen) as recommended by the manufacturer.
Gene expression
Total RNA was isolated using an RNeasy kit (Qiagen). RNA samples (1 µg) were reverse-
transcribed into cDNA using Superscript VILO Master Mix (Thermo Scientific). The
quantitative PCR was performed using power SYBR Master Mix (Thermo Scientific) on a
QuantStudio 6 Flex Real-Time PCR System. Primer sequences are listed in
Supplementary Table 2. Gene expression was normalized to that of RPL32. The
relative expression was calculated by delta Ct method and all the shown data reported
from the fold change over the control. For each cell clone, the Student's t-test was
performed (unpaired, two-tailed, 95% confidence interval) from 3 biological replicates

of independent cDNA preparations. Data are represented with standard deviation (s.d).
For RT-qPCR, 1/20 of synthesized cDNA was used as template for one reaction; PCRs
were performed with Phusion polymerase (Thermo Scientific), Tm= 60 °C, 35 cycles.
RNA-sequencing
Total RNA from P5425 cell was prepared using an RNeasy kit (Qiagen) and add β-
mercaptoethanol (β-ME) (Gibco) to buffer RLT plus as recommended by the
manufacturer. RNA quality was then checked using a Bioanalizer (Agilent technologies,
Santa Clara, USA). Only RNA with RNA Integeity Number (WT= 10, KO=9.40) then used
for RNA-seq.
Chromatin immunoprecipitation-sequencing (ChIP-seq)
Total 40 X106 P5424 cells were crosslinked in 1% formaldehyde for 10 min at 20 °C,
followed by quenching with glycine at a final concentration of 250 mM. Pelleted cells
were washed twice with ice-cold PBS, and then re-suspended in lysis buffer (20 mM
Hepes PH 7.6, 1% SDS, 1X PIC) at final cell concentration of 15 x 10 6 cells/ml. Chromatin
was sonicated with Bioruptor (Diagenode) to an average length of 200-400 bp (5 pulses
of 30 sec ON and 30 sec OFF). An aliquot of sonicated cell lysate equivalent to 0.5 x 10⁶
cells was diluted with SDS-free dilution buffer (1% Triton X-100, 1.2 mM EDTA, 16.7 mM
Tris PH 8.0, 167 mM NACL) for single immunoprecipitation. Specific antibodies (1 µg per
ChIP) and proteinase inhibitor cocktail were added to the lysate and rotated overnight
at 4 °C. The antibody used was as follow H3K27ac (C15410196, Diagenode). On the next
day, Protein A magnetic beads (Invitrogen) were washed twice with dilution buffer
(0.15% SDS, 1% Triton X-100,1.2 mM EDTA, 16.7 mM Tris pH 8.0, 167 mM NaCl and
0.1% BSA) and added to the lysate and rotated 1 hour at 4 °C. Then, beads were washed
with each of the following buffers: once with Wash Buffer 1 (2 mM EDTA, 20 mM Tris pH
8.0, 1% Triton X-100, 01% SDS, 150 mM NaCl), twice with Wash Buffer 2 (2 mM EDTA,
20 mM Tris pH 8.0, 1% Triton X-100, 0.1% SDS, 500 mM NaCl), twice with Wash Buffer 3
(1 mM EDTA, 10 mM Tris pH 8.0). Finally, beads were eluted in Elution buffer (1% SDS,
0.1 M NaHCo3) and rotated at RT for 20 min. Eluted materials were then added with 0.2
M NaCl, 0.1 mg/ml of proteinase K and incubated overnight at 65 °C reverse cross-
linking, along with the untreated input (10% of the starting material). The next day, DNA
was purified with QIAquick PCR Purification Kit (Qiagen) and eluted in 30 µl of water.At
least 1ng of ChIP was used for library preparation. Libraries for ChIPs against H3K27ac
was prepared according to Illumina ChIP-Seq protocol and sequenced on a Nextseq500
(Illumina) according to the manufacturer's instructions.
Figure 1. (A) Epigenomic profiles of the Ikzf1locus showing ChIP-Seq signals for H3K4me1,
H3K27ac and Pol II in mouse DP thymocytes. Super-enhancers, peaks of the indicated lymphoid
transcription factors and enhancer activities as defined by CapStarrseq in P5424 cells (green:
inactive; orange: weak; red: strong) are also shown. A strong enhancer associated with six
transcription factors is highlighted. (B) 4C–seq analysis of Ikzf1 promoter interactions in DP
thymocytes. The view point and the IkE120 enhancer are indicated.
Figure 2. (A) Genomic tracks showing the binding peaks of transcription factors overlapping the
IKE120 enhancer. The two sgRNAs used to delete the enhancer and primers to detect the
deletion are also shown. (B) PCR analyses of IkE120 deletion in P5424 cell line. (C) Sanger
sequencing result from deletion junctions amplified from genomic DNA of targeted ∆IkE120
clone. (D) Top: UCSC genome browser showing the transcripts isoforms of the Ikzf1 gene found
in RefSeq. Bottom: RT-qPCR analyses of Ikzf1 isoforms harboring different exons in wild-type
(WT) and ∆IkE120 P5424 cells. Values represent the mean expression normalized by RPL32
housekeeping gene of 3 independent experiments.
Figure 3. (A) Genomic tracks for RNA–seq, ChIP-seq and CapStarr-seq around the Ikzf1
locus in P5424 cells stimulated or not with PMA/ionomycin. (B) Kinetic study of the
expression of lncRNA Xloc_005923 and Ikzf1 gene by RT-qPCR in P5424 cells stimulated
with PMA/ionomycin. Values represent the mean expression normalized by RPL32
housekeeping gene of 3 independent experiments. (C) RT-qPCR analyses of Ikzf1
isoforms harboring different exons in wild-type (WT) and ∆IkE120 P5424 cells
stimulated with PMA/ionomycin. Values represent the mean expression normalized by
RPL32 housekeeping gene of 3 independent experiments.
Figure 4. (A) Sashimi and splicing (bottom) plots showing splicing alignments from
RNA-seq of WT and ∆IkE120 P5424 cells. Alignments to splice junctions are shown as an
arc connecting a pair of exons. (B) The splicing ratio (KO/WT) involving E3-E4, E3b-E4
and E3-E5 are shown. (C) RT-qPCR analyses the usage of a new alternative exon (E3b) in
wild-type (WT) and ∆IkE120 P5424 cells stimulated with PMA/ionomycin. Values
represent the mean expression normalized by RPL32 housekeeping gene of 3
independent experiments.
Figure 5. (A) Genomic tracks of H3K27ac ChIP-seq data at the Ikzf1 locus (top) and
aroundtheIkE120 enhancer (bottom, shadowed region) in WT and ∆IkE120 P5424 cells.
(B) Genomic tracks for RNA–seq, ChIP-seq and CapStarrseq around the IkE120 enhancer
in P5424 cells stimulated or not with PMA/ionomycin.The two lncRNAs close to IkE120
are shown. (C) RT-qPCR analyses of lncRNAs in WT and ∆IkE120 P5424 cells stimulated
or not with PMA/ionomycin. Values represent the mean expression normalized by
RPL32 housekeeping gene of 3 independent experiments.

Figure 6. (A) Genomic tracks for RNA–seq at the Ikzf1 locus in P5424 cells stimulated or not
with PMA/ionomycin. The signal was overcalled to visualize the expression of antisens and
intronic transcripts. (B) RT-qPCR analyses of antisens and intron amplicons indicated in 4A in
WT and ∆IkE120 P5424 cells stimulated or not with PMA/ionomycin. Values represent the mean
expression normalized by RPL32 housekeeping gene of 3 independent experiments. (C)
Genomic tracks of RNA-seq data at the Ikzf1locus from WT and ∆IkE120 P5424 cells stimulated
by PMA/Ionomycine.
Supplementary Figure 1:(A and B) Genomic tracks for RNA–seq around the Ikzf1 locus (A) and
IkE120 enahncer (B) in P5424 cells stimulated or not with PMA/ionomycin. (C) RT-qPCR
analyses of Fignl1 in WT and ∆IkE120 P5424 cells stimulated or not with PMA/ionomycin.
Values represent the mean expression normalized by RPL32 housekeeping gene of 3
independent experiments.
Supplementary Figure 2: Genomic tracks for RNA–seq showing several Ikaros target genes in
in WT and ∆IkE120 P5424 cells stimulated with PMA/ionomycin.
Supplementary Figure 3: (A and B) coverage of RNA-seq signal (FPKM= fragments per
kilobases per million of reads) in exons (A) and introns (B) of expressed genes in WT and
∆IkE120 P5424 cells stimulated with PMA/ionomycin. (C) Splicing ratio between WT and
∆IkE120 cells (Log2 scale).
Supplementary Figure 4: General strategy for generation of knockout enhancers. Two gRNAs
G1 and G2 were designed flanking the genomic target in order to delete the intervening DNA
segment. The CRISPR/Cas9 system creates two DSB at 3-4 nucleotides upstream of the PAM
sequences (red) and releases the excised DNA (purple).
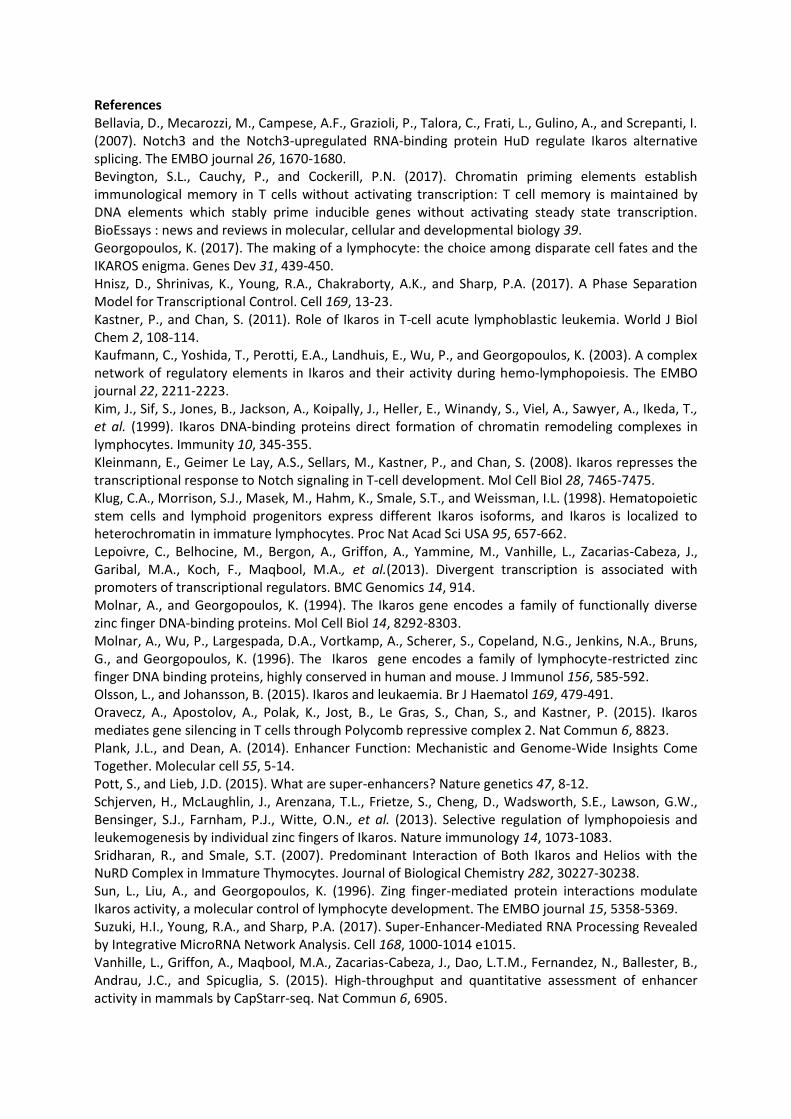
References Bellavia, D., Mecarozzi, M., Campese, A.F., Grazioli, P., Talora, C., Frati, L., Gulino, A., and Screpanti, I. (2007). Notch3 and the Notch3-upregulated RNA-binding protein HuD regulate Ikaros alternative splicing. The EMBO journal 26, 1670-1680. Bevington, S.L., Cauchy, P., and Cockerill, P.N. (2017). Chromatin priming elements establish immunological memory in T cells without activating transcription: T cell memory is maintained by DNA elements which stably prime inducible genes without activating steady state transcription. BioEssays : news and reviews in molecular, cellular and developmental biology 39. Georgopoulos, K. (2017). The making of a lymphocyte: the choice among disparate cell fates and the IKAROS enigma. Genes Dev 31, 439-450. Hnisz, D., Shrinivas, K., Young, R.A., Chakraborty, A.K., and Sharp, P.A. (2017). A Phase Separation Model for Transcriptional Control. Cell 169, 13-23. Kastner, P., and Chan, S. (2011). Role of Ikaros in T-cell acute lymphoblastic leukemia. World J Biol Chem 2, 108-114. Kaufmann, C., Yoshida, T., Perotti, E.A., Landhuis, E., Wu, P., and Georgopoulos, K. (2003). A complex network of regulatory elements in Ikaros and their activity during hemo-lymphopoiesis. The EMBO journal 22, 2211-2223. Kim, J., Sif, S., Jones, B., Jackson, A., Koipally, J., Heller, E., Winandy, S., Viel, A., Sawyer, A., Ikeda, T., et al. (1999). Ikaros DNA-binding proteins direct formation of chromatin remodeling complexes in lymphocytes. Immunity 10, 345-355. Kleinmann, E., Geimer Le Lay, A.S., Sellars, M., Kastner, P., and Chan, S. (2008). Ikaros represses the transcriptional response to Notch signaling in T-cell development. Mol Cell Biol 28, 7465-7475. Klug, C.A., Morrison, S.J., Masek, M., Hahm, K., Smale, S.T., and Weissman, I.L. (1998). Hematopoietic stem cells and lymphoid progenitors express different Ikaros isoforms, and Ikaros is localized to heterochromatin in immature lymphocytes. Proc Nat Acad Sci USA 95, 657-662. Lepoivre, C., Belhocine, M., Bergon, A., Griffon, A., Yammine, M., Vanhille, L., Zacarias-Cabeza, J., Garibal, M.A., Koch, F., Maqbool, M.A., et al.(2013). Divergent transcription is associated with promoters of transcriptional regulators. BMC Genomics 14, 914. Molnar, A., and Georgopoulos, K. (1994). The Ikaros gene encodes a family of functionally diverse zinc finger DNA-binding proteins. Mol Cell Biol 14, 8292-8303. Molnar, A., Wu, P., Largespada, D.A., Vortkamp, A., Scherer, S., Copeland, N.G., Jenkins, N.A., Bruns, G., and Georgopoulos, K. (1996). The Ikaros gene encodes a family of lymphocyte-restricted zinc finger DNA binding proteins, highly conserved in human and mouse. J Immunol 156, 585-592. Olsson, L., and Johansson, B. (2015). Ikaros and leukaemia. Br J Haematol 169, 479-491. Oravecz, A., Apostolov, A., Polak, K., Jost, B., Le Gras, S., Chan, S., and Kastner, P. (2015). Ikaros mediates gene silencing in T cells through Polycomb repressive complex 2. Nat Commun 6, 8823. Plank, J.L., and Dean, A. (2014). Enhancer Function: Mechanistic and Genome-Wide Insights Come Together. Molecular cell 55, 5-14. Pott, S., and Lieb, J.D. (2015). What are super-enhancers? Nature genetics 47, 8-12. Schjerven, H., McLaughlin, J., Arenzana, T.L., Frietze, S., Cheng, D., Wadsworth, S.E., Lawson, G.W., Bensinger, S.J., Farnham, P.J., Witte, O.N., et al. (2013). Selective regulation of lymphopoiesis and leukemogenesis by individual zinc fingers of Ikaros. Nature immunology 14, 1073-1083. Sridharan, R., and Smale, S.T. (2007). Predominant Interaction of Both Ikaros and Helios with the NuRD Complex in Immature Thymocytes. Journal of Biological Chemistry 282, 30227-30238. Sun, L., Liu, A., and Georgopoulos, K. (1996). Zing finger-mediated protein interactions modulate Ikaros activity, a molecular control of lymphocyte development. The EMBO journal 15, 5358-5369. Suzuki, H.I., Young, R.A., and Sharp, P.A. (2017). Super-Enhancer-Mediated RNA Processing Revealed by Integrative MicroRNA Network Analysis. Cell 168, 1000-1014 e1015. Vanhille, L., Griffon, A., Maqbool, M.A., Zacarias-Cabeza, J., Dao, L.T.M., Fernandez, N., Ballester, B., Andrau, J.C., and Spicuglia, S. (2015). High-throughput and quantitative assessment of enhancer activity in mammals by CapStarr-seq. Nat Commun 6, 6905.

Winandy, S., Wu, P., and Georgopoulos, K. (1995). A dominant mutation in the Ikaros gene leads to rapid development of leukemia and lymphoma. Cell 83, 289-299. Yoshida, T., Landhuis, E., Dose, M., Hazan, I., Zhang, J., Naito, T., Jackson, A.F., Wu, J., Perotti, E.A., Kaufmann, C., et al. (2013). Transcriptional regulation of the Ikzf1 locus. Blood 122, 3149-3159. Zhang, J., Jackson, A.F., Naito, T., Dose, M., Seavitt, J., Liu, F., Heller, E.J., Kashiwagi, M., Yoshida, T., Gounari, F., et al. (2012). Harnessing of the nucleosome-remodeling-deacetylase complex controls lymphocyte development and prevents leukemogenesis. Nature immunology 13, 86-94.

E-180 E-120 E-155 E-25 E5 E15
DP thymocyte
B
IkE120
View point
Zpbp Ikzf1 Fignl1 Ddc Gib10
A
Figure 1
4C
Super-enh.
IKZF1
HEB
ETS1
RUNX1
GATA3
TCF1
H3K4me1
H3K27ac
Pol II
CapStarr-Seq
(CRM activity)
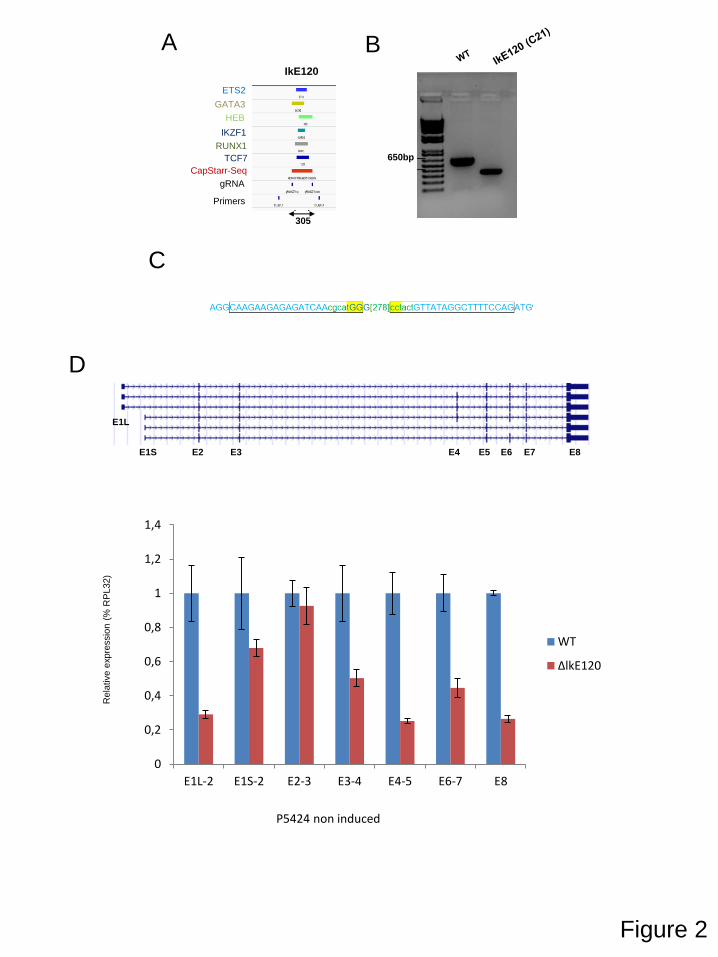
A
650bp
B
C
D
E1L
E1S E2 E3 E4 E5 E6 E7 E8
IkE120
ETS2
CapStarr-Seq
GATA3
HEB
IKZF1
RUNX1
TCF7
Primers
gRNA
305
P5424 non induced
Figure 2
Rela
tive e
xpre
ssio
n (
% R
PL32)
0
0,2
0,4
0,6
0,8
1
1,2
1,4
E1L-2 E1S-2 E2-3 E3-4 E4-5 E6-7 E8
WT
ΔlkE120

A chr11:11,091,261-11,832,386
(+)
(-)
H3K4me3
H3K4me3
H3K27Ac
H3K27Ac
DMSO
P/I
STARR-seq
RefSeq
P5424
Zpbp Ikzf1 Fignl1 Ddc 4930415F15Rik 4930512M02Rik
RN
A-s
eq
(+)
(-)
RN
A-s
eq
P5424 + PMA/Ionomycine
Rela
tive e
xpre
ssio
n (
% R
PL32)
Figure 3
0 30min 1h 2h 3h 4h
0
0,5
1
1,5
2
2,5
3
3,5
4
Ikzf1
0 30min 1h 2h 3h 4h
0
50
100
150
200
Xloc-005923
PMA/Iono
0
0,2
0,4
0,6
0,8
1
1,2
1,4
E1L-2 E1S-2 E2-3 E3-4 E4-5 E6-7 E8
WT
ΔIkE120
B
C
Rela
tive e
xpre
ssio
n (
% R
PL32)
Rela
tive e
xpre
ssio
n (
% R
PL32)

WT
DIKE120
sashimi plot
E1L E1S E2 E3
E3b
E4 E5 E6 E7 E8
Re
lative
exp
ressio
n (
% R
PL3
2)
Total RNA-seq (P5424 + P/I)
Ratio (KO//WT)
0 1 2
E3-E4
E3b-E4
E3-E5
1.1
1.1
2.2
0
1
2
3
4
5
6
7
8
E3-4 E3b-4 E6-7
WT
ΔIkE120
P5424+ PMA/I
Figure 4
A
B
C

Figure 5
A
WT
DIKE120
WT/KO
Refseq Zbpb Ikzf1 Fignl1 Ddc
P5424 (ChIP-seq H3K27ac)
WT
DIKE120
WT/KO
0
0,05
0,1
0,15
0,2
0,25
0,3
Xloc_005922 Xloc_005923
WT
delE120
0
0,5
1
1,5
2
2,5
3
Xloc_005922 Xloc_005923
WT-PMA/Iono
delE120-PMA/Iono
chr11:11,446,315-11,482,453
RNA-seq (+)
RNA-seq (-)
RNA-seq (+)
RNA-seq (-)
H3K4me3
H3K27ac
H3K4me3
H3K27ac
STARR-seq
Cufflinks
DMSO
P/I
Xloc_005923 Xloc_005922
P5424 non induced P5424 + PMA/Ionomycine
Rela
tive e
xpre
ssio
n (
% o
f R
PL32)
Rela
tive e
xpre
ssio
n (
% o
f R
PL32)
Amplicons
B
C

Figure 6
RNA seq(+)
RNA seq(-)
RNA seq(+)
RNA seq(-)
DMSO
P/I
chr11:11,528,465-11,684,168
A
B
P5424 non induced P5424 + PMA/Ionomycine
Rela
tive e
xpre
ssio
n (
% o
f R
PL32)
Rela
tive e
xpre
ssio
n (
% o
f R
PL32)
0
0,2
0,4
0,6
0,8
1
1,2
1,4
as 1st int 3rd int
WT
delE120
0
0,2
0,4
0,6
0,8
1
1,2
1,4
1,6
1,8
as 1st int 3rd int
WT-PMA/Iono
delE120-PMA/Iono
as 1st int 3rd int Amplicons
chr11:11,533,069-11,681,096
C
RNA seq(+)
RNA seq(-)
RNA seq(+)
RNA seq(-)
Wt
ΔIkE120
+PMA/Iono.
Ikzf1
chr11:11,454,117-11,484,750
0
0,1
0,2
0,3
0,4
0,5
0,6
Fignl1_E2-3
WT
delE120
WT-PMA/Iono
delE120-PMA/Iono
Supplementary Figure 1
A
B
C
RNA seq(+)
RNA seq(-)
RNA seq(+)
RNA seq(-)
Wt
RNA seq(+)
RNA seq(-)
RNA seq(+)
RNA seq(-)
Wt
Ikzf1 Fignl1
ΔIkE120
ΔIkE120

Supplementary Figure 2
RNA seq(+)
RNA seq(-)
RNA seq(+)
RNA seq(-)
RNA seq(+)
RNA seq(-)
RNA seq(+)
RNA seq(-)
RNA seq(+)
RNA seq(-)
RNA seq(+)
RNA seq(-)
Dntt Ptcra
Cd4 Cd8b1
Cd3e Dtx1 Cd3g Cd3d
Cd8a
Wt
ΔIkE120
Wt
Wt
ΔIkE120
ΔIkE120

A B
C
Sp
licin
g r
atio
(W
T/K
O)
FP
KM
FP
KM
Supplementary Figure 3
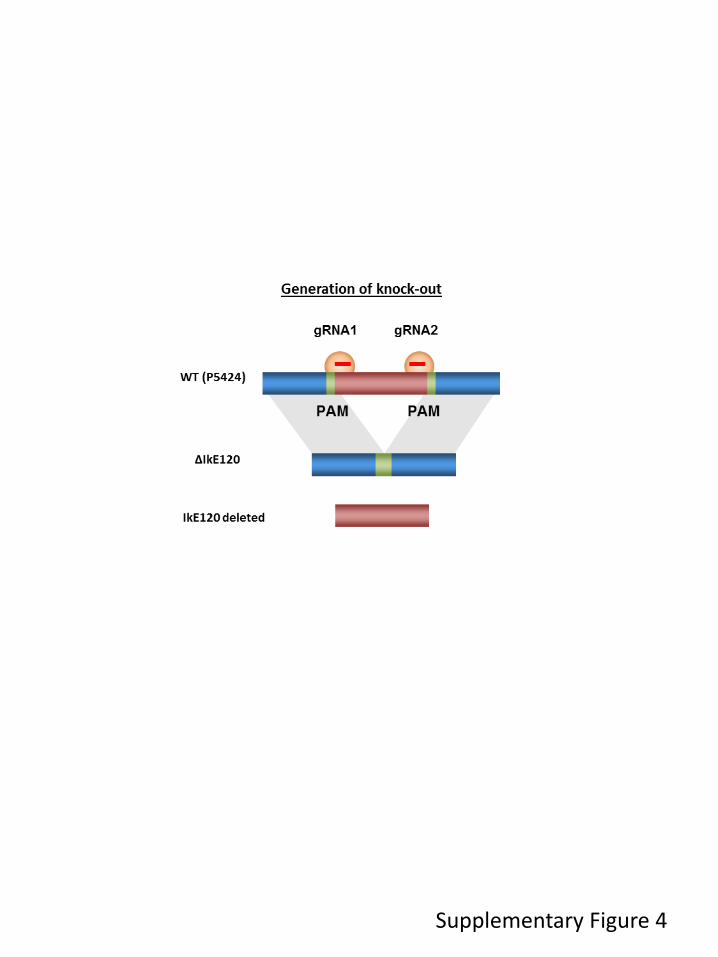
Supplementary Figure 4

Sequence(5’ – 3’) Name No
C-AAGAAGAGAGATCAACGCA gRNA_Ikzf1_Upstream 1
ACTGTTATAGGCTTTTCCA-G gRNA_Ikzf1_Downstream 2
GTTCAGGCAAATTTCAGAGG E1_Ikzf1_F 3
CTGGGAGGGTACTACTGCTC E1_Ikzf1_R 4
G-ATGCTCTCTTTCATAAGCC gRNA_Runx1_Upstream 5
CTCAGCTCTCTCCTAGGAC-A gRNA_Runx1_Downstream 6
TGGGGGGGTGGGGTGCTATT E1_Runx1_F 7
GCAGACAGGGAGGGGGAGGA E1_Runx1_R 8
G-CTGCGGACAAAGAGAGGGT gRNA_Ets2_Upstream 9
TCTTGTCTGGGGGCAAGGAG gRNA_Ets2_Downstream 10
CCACAGGGAAATCCAGATGA E1_Ets2_F 11
GCTTCACAAATGGTAGCCAC E1_Ets2_R 12
Supplementary Table 1: Primer sequences/ CRISPR

Supplementary Table 2: Primer sequences/ RT-qPCR
Sequences (5’- 3’)-R Sequences (5’- 3’)-F Name No
GGGATTGGTGACTCTGATGG GCTGCTGATGTGCAACAAA RPL32 1
TTGACCCTCATCGACATCCA CGCCCCAGGATCATTCTTG IKZF1_E1L 2
TTGACCCTCATCGACATCCA TTTGTGTGGCAGAGAGAGACA IKZF1_E1S 3
GCTCATCCCCTTCATCTGGA TGGATGTCGATGAGGGTCAA IKZF1_E2-E3 4
CACACTGGTTGCACTGGAAA ATCTGTGGGATCGTTTGCATC IKZF1_E4-E5 5
CGCGCTGCTCCTCCTTGAGA ACAGCGCAGCGGCCTTATCT IKZF1_E8 6
CTCTCTCCTCCCCCAGGTAA CCTCTCCTCAGTGGCTGTG IKZF1_1st-int 7
TCTGTGTGATGGAACTGACC GTTGCATATGGGGCTGATGG IKZF1_3rd-
int
8
TGTCCAGAGCCATCACAGAT GCTGCCTTCACCAATTGTCT IKZF1_as 9
TTCATGTCTTGCAACCCCTCA TCCATTTCCCCTGCCATAGTTT Xloc_005922 10
AGACACTGAGATGGGAAGGGA CAAAGGGAGCTGGGGATGAG Xloc_005923 11

Supplementary Table 3: Numbers of tested clones

57
4. Additional results: Functional Study of Lymphoid specific enhancers
Runx1 is associated with two clusters of enhancers or super-enhancers. We identified a
strong enhancer located 320 kb upstream Runx1 and lying within the upstream super-
enhancer (Runx1E320) (Fig 7.4.a). By using CRISPR/Cas9 genomic approach (Fig. 7.4.b). I
tested 336 clones, but only one homozygous clone (Fig. 7.4c). Unfortunately this clone was
lost during the regrowing process.
Ets2 is associated with one cluster of enhancers or super-enhancer. We identified a strong
enhancer located 160 kb upstream Ets2 (Ets2E160) (Fig. 7.5.a). By using CRISPR/Cas9
genomic approach (Fig.7.5.b) I tested 330 clones, only obtained heterozygous clones (Fig.
7.5.c).
5. Contributions
Experimental contribution: To carry out this project, my supervisor and I routinely discuss
for conceptualize and experimental designs and I performed almost all experimental works
which are including:
- Selection of the enhancer
- Cloning
- Design and perform CRISPR/Cas9-mediated knock-out strategies
- Phire direct tissue PCR

58
Figure 7. 4. | (a) Epigenomic profiles of the Runx1 locus showing ChIP-Seq signals for H3K4me1,
H3K27ac and Pol II in mouse DP thymocytes. Super-enhancers, peaks of the indicated lymphoid
transcription factors and enhancer activities as defined by CapStarr-seq in P5424 cells (green:
inactive; orange: weak; red: strong) are also shown. A strong enhancer associated with five
transcription factors is highlighted. (b) Genome browser tracks showing the 5 TFs and interested
enhancer identified by CapStarr-seq and two sgRNAs and primers to detect the deletion. (c) PCR
analyses RunxE320 homozygous deletion in P5424 cell line.
b

59
Figure 7. 5| (a) Epigenomic profiles of the Ets2 locus showing ChIP-Seq signals for H3K4me1,
H3K27ac and Pol II in mouse DP thymocytes. Super-enhancers, peaks of the indicated lymphoid
transcription factors and enhancer activities as defined by CapStarr-seq in P5424 cells (green:
inactive; orange: weak; red: strong) are also shown. A strong enhancer associated with five
transcription factors is highlighted. (b)Genome browser tracks showing the 5 TFs and interested
enhancer identified by CapStarr-seq and two sgRNAs and primers to detect the deletion. (c) PCR
analyses Ets2E160 heterozygous deletion in P5424 cell line.

60
6. Additional results: Contributionto manuscript Genome-wide characterization of
mammalian promoters with distal enhancer functions (Annex).
I contributed to the experimental part of this work by selecting and studying some of the mutant
clones described in the manuscript (Phire direct tissue PCR;RNA extraction, cDNA and QPCR)

61
DISCUSSION

62
Chapter 8
Discussion
Short summary of results
During my PhD, I worked on the functional role of an upstream enhancer of the Ikzf1 gene (IkE120).
This enhancer was identified based on the combination of epigenomics data (DNaseI, ChIP-seq for
histone marks and transcriptions factors) in primary CD4+CD8+ (DP) developing thymocytes and
high-throughput enhancer assay (CapStarr-seq) performed in the P5424 cell line. Our lab
previously showed that the number of bound lymphoid transcription factors was directly
associated with the enhancer activity (Vanhille et al., 2015). Indeed, IkE120 was bound by all the six
transcription factors analyzed in our study. I decided to delete the IkE120 enhancer in the P5424
cell line using the CRISPR/Cas9 technology. Deletion of IkE120 resulted in significant decreased of
mRNA levels of Ikzf1 and the neighbor gene Fignl1. Surprisingly, we observed immature
transcription was either not affected or increased in the knockout cells. In addition some
transcripts isoforms appears to be differentially regulated by the enhancer. However we observed
that the global level of splicing was also affected in the IkE120 knockout clone, thus cautioning the
interpretation that we can currently make about the role of IkE120 enhancer. We can make three
different hypotheses to explain our results:
First hypothesis: The observed phenotype is totally or partially due to an additional mutation due
to unspecific cleavage by Cas9. For instance a mutation of a splicing factor might result in decreased
splicing efficiency.
Second hypothesis: Deletion of IkE120 results in a differential expression of Ikzf1 isoforms. This
new isoform might encode for an IKAROS protein, which either play a direct role in regulating
splicing efficiency or inhibit the normal function of IKAROS. I think this hypothesis is likely based in
two evidences: On the one hand, Ikzf1 locus is known to express several isoforms, which have been
shown to display different regulatory properties (Molnar and Georgopoulos, 1994; Molnar et al.,
1996; Sun et al., 1996; Klug et al., 1998; Bellavia et al., 2007). Within this line, our results suggest
that IkE120 might be involved in regulating the expression of different isoforms. On the other hand,
knock out of Ikzf1 gene results in complex phenotypes and previous authors have suggested that
IKAROS might regulate gene expression by unknown mechanisms (Arenzana et al. 2015). More
precisely a recent publication showed that IKAROS is able to interact with PP1 enzyme, which is
involved in transcription elongation and splicing (Bottardi et al. 2014), thus the author suggest that
IKAROS might be involved in splicing control of its target genes (Fig. 8.1)

63
Third hypothesis: The role of IkE120 is limited to control transcription initiation, and all the other
observations resulted from non-specific mutations.
Figure 8.1.|Working Hypothesis.IkE120 might specifically control the expression of Ikzf1
transcripts containing the alternative exon E3b.
To discriminate between the different hypotheses, I propose to perform a rescue experiment in
which the wild type enhancer is reintroduced at the endogenous place in the IkE120 clone. In this
context, any remaining phenotype will be independent of IkE120 enhancer (Fig. 8.2. Proposed
Exp.).

64
Figure 8.2.|Proposed Experiments
Of course, an alternative approach will be to generate additional knockout clones. However, during
my theses I put a lot of efforts to generate additional homozygous clones without success, while
heterozygous clones were frequently obtained. Thus, for an unknown reason homozygous deletions
of IkE120 were under selected (notice that this was also the case for the enhancers of Runx1 and
ETS2, see Result chapter).
Depending on the result of the rescue experiments, we could pursuit our investigation in different
ways. In the case of the second hypothesis, it will be interesting to determine whether (i) The genes
with decreased splicing are direct target genes of Ikzf1 (using available ChIP-seq data); (ii) The
splicing deficiency is also observed in Ikzf1 knockout or mutated cells (using published RNA-seq
from Ikzf1 knockout mice (iii) Carefully study the isoforms expressed in the IkE120 clone and test
whether they are involved in splicing control. In the case of the first hypotheses, I think it will be
still interesting to try to find out the mutated gene responsible of the splicing phenotype. Indeed,
the IkE120 clone display a substantial reduction of splicing efficiency at some genes, thus the
involved protein might have a very specific and selective function in controlling splicing efficiency.
In this case, we could analyze our RNA-seq data to find mutations in the exons or deregulated
expression of known splicing factors.

65
Enhancers might control gene expression by different mechanisms
The classical view of enhancer function is that they contribute to increase transcription initiation.
Many genes, especially those involved in cell identity and tissue-specific functions are regulated by
cluster of enhancers, also called super-enhancers. Whether the individual components (i.e. single
enhancers) synergistically contribute to increase the expression levels or have more specific
functions have been a matter of debate(Pott and Lieb, 2015). Thus, it is plausible that multiple
enhancers contribute to transcriptional consistency or robustness of expression instead of
activating steady-state transcription (Hnisz et al., 2017). For instances, it is clear that not all
H3K27ac marked enhancers have enhancer functions (Santiago et al., 2017). Moreover within
super-enhancers not all individual elements display enhancer activity (Vanhille et al. 2015)(Hnisz
et al., 2015)(Hay et al., 2016). Thus, it is conceivable that inside cluster of enhancers, individual
enhancers play distinct specialized functions.
Several examples from the literature support this hypothesis:
*In a recent study, Suzuki et col. explored the role of super-enhancers in controlling the expression
of miRNA (Suzuki et al., 2017). They found that super-enhancers play a direct role in controlling
primary miRNA (pri-miRNA) maturation by recruiting recruit components of the miRNA-
processing machinery.
*It was shown that T cell memory is maintained by distal DNA elements, which stably prime
inducible genes without activating steady state transcription (Bevington et al., 2017). Chromatin
priming elements defined in this study are distinct from classical enhancers because they function
by maintaining chromatin accessibility rather than directly activating transcription.
*Expression of the hematopoietic transcription factor Mybis activated by a cluster of distal
enhancers dynamically bound by KLF1 and the GATA1/TAL1/LDB1 complex, which primarily
function as transcription elongation elements through chromatin looping (Stadhouders et al., 2012).
As a general model it have been recently proposed that (super)enhancers might work as a platform
to recruit multiple regulatory complexes, including RNA-binding molecules and splicing factors, and
therefore might function to control gene expression at different levels (Hnisz et al. 2017). A
provocative hypothesis putted forward by the authors is that enhancer clusters will create a type of
membraneless organelles, such as the nucleolus, Cajalbodies, and splicing-speckles in the nucleus,
as results of phase-separated multi-molecular assemblies (Fig. 8.3).

66
Figure 8.3.| Control of gene expression by enhancer platforms.
Based in the aforementioned arguments and our own observation at the Ikzf1 locus, I would to
suggest that some enhancers or individual components of clusters of enhancers might be involved
in transcripts maturation. This function might be mediated directly by recruiting or stabilizing
splicing factors (Figure 8.3) or indirectly by targeting transcriptional elongation or chromatin
structure (Figure 8.4). The later is consistent with the fact that splicing is generally co-
transcriptional and transcription rate and chromatin modifications can both impact on splicing
efficiency and exon usage (Braunschweig et al., 2013). This is interesting also in the line of previous
finding from our laboratory, showing that developmental transcription factors and tissue specific
genes (frequently associated with cluster of enhancers) are associated with high levels of immature
transcription(Lepoivre et al., 2013), histone marks of early transcription (i.e. H3K79me2) and RNA-
Pol II (Spicuglia et al., 2010), thus suggesting that this type of gene could be regulated at the level of
transcriptional maturation. In particular, this type of regulation will be physiological relevant in the
case of Ikzf1 gene. Indeed, Ikzf1 have been shown to encode for different IKAROS proteins playing
different functions, while expression of some isoforms have been suggested to be involved in
leukemia (Schjerven et al., 2013).
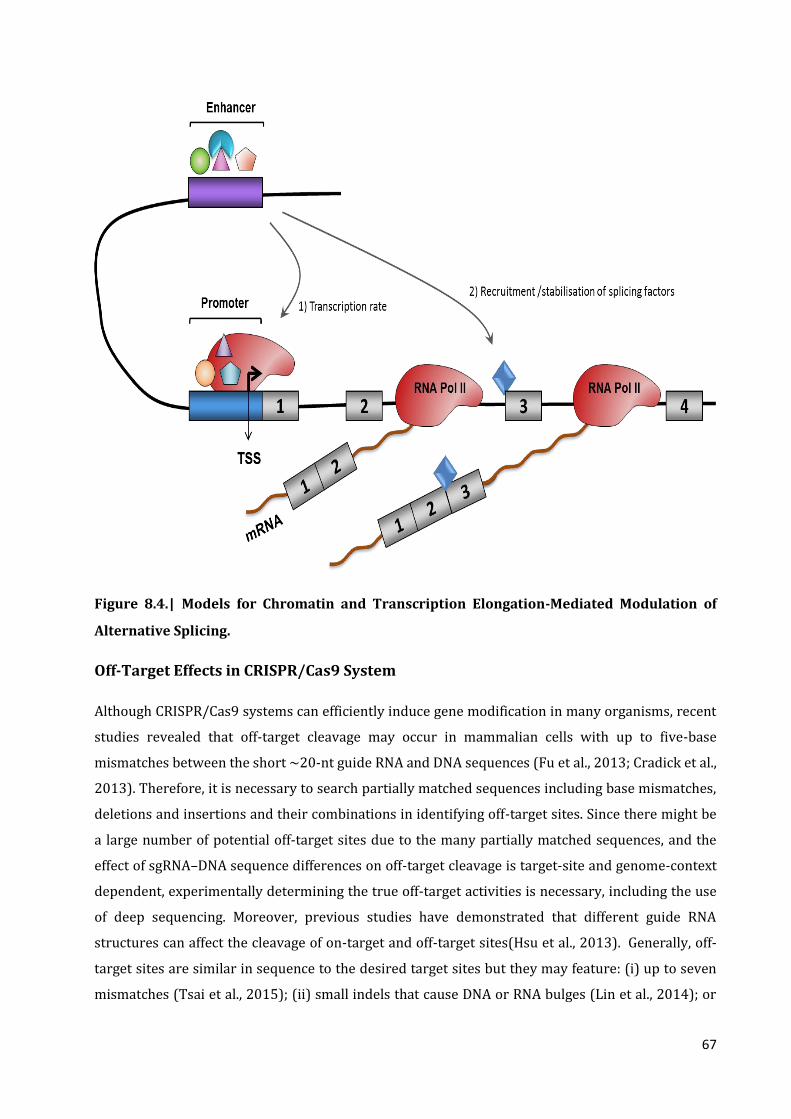
67
Figure 8.4.| Models for Chromatin and Transcription Elongation-Mediated Modulation of
Alternative Splicing.
Off-Target Effects in CRISPR/Cas9 System
Although CRISPR/Cas9 systems can efficiently induce gene modification in many organisms, recent
studies revealed that off-target cleavage may occur in mammalian cells with up to five-base
mismatches between the short ∼20-nt guide RNA and DNA sequences (Fu et al., 2013; Cradick et al.,
2013). Therefore, it is necessary to search partially matched sequences including base mismatches,
deletions and insertions and their combinations in identifying off-target sites. Since there might be
a large number of potential off-target sites due to the many partially matched sequences, and the
effect of sgRNA–DNA sequence differences on off-target cleavage is target-site and genome-context
dependent, experimentally determining the true off-target activities is necessary, including the use
of deep sequencing. Moreover, previous studies have demonstrated that different guide RNA
structures can affect the cleavage of on-target and off-target sites(Hsu et al., 2013). Generally, off-
target sites are similar in sequence to the desired target sites but they may feature: (i) up to seven
mismatches (Tsai et al., 2015); (ii) small indels that cause DNA or RNA bulges (Lin et al., 2014); or

68
(iii) a different PAM, e.g. NAG often acts as a PAM in addition to NGG, although the interaction with
Cas9 is weaker (Hsu et al., 2013). The extent of off-target activity is highly dependent on the gRNA,
and the number of off-targets varies from 0 to > 150 (Frock et al., 2015).
Long-term perspectives:
In addition to the short-term perspectives described in the Result section, I think several
experiment and analyses are worth to be done:
Study the role of the other DHS sites associated with the Ikaros locus using a similar
CRISPR/Cas9 strategy.
Many enhancers have been studied by genetic approaches. However, in these studies the
authors have generally focused on the mRNA expression. It will be worth to reanalyze these
models by comparing the level of immature (intronic) and mature (exonic) expression, as
we did in our study.
To assess whether enhancers (e.g. IkE120) contribute to transcriptional consistency or robustness
perform Single cell RNA-seq experiments with wt and knockout samples.

69
REFERENCES

70
References
Alexander Tarakhovsky, (2010). Tools and landscapes of epigenetics, Epigenetics studies the phenotypes that are born from past experiences and are kept for life. Nat. Immun.Vol.11, P: 565–568, doi: 10.1038/ni0710-565.
Almada AE, Wu X, Kriz AJ, Burge CB, Sharp PA.(2013). Promoter directionality is controlled by U1 snRNP and polyadenylation
signals. Nature. 2013; 499:360–363. Amano, T. et al. (2009).Chromosomal dynamics at the shhlocus: limb bud-specific differential regulation of competence and
active transcription. Dev. Cell 16, 47–57 (2009). Anderson, M. K., G. Hernandez-Hoyos, R. A. Diamond, and E. V. Rothenberg. (1999). Precise developmental regulation of Ets
family transcription factors during specification and commitment to the T cell lineage. Development 126:3131. Andersson R, et al. (2014). An atlas of active enhancers across human cell types and tissues. Nature. 2014; 507:455–461. Arenzana T. L., Hilde Schjerven and Stephen T. Smale(2015). Regulation of gene expression dynamics during developmental
transitions by the Ikaros transcription factor. Genes Dev. 2015 Sep 1;29(17):1801-16. doi: 10.1101/gad.266999.115. Arnold CD, Gerlach D, Spies D, et al. (2014).: Quantitative genome-wide enhancer activity maps for five Drosophila species show
functional enhancer conservation and turnover during cis-regulatory evolution. Nat Genet. 2014; 46(7): 685–92. Arnold CD, Gerlach D, Stelzer C, et al. (2013).: Genome-wide quantitative enhancer activity maps identified by STARR-seq.
Science. 2013; 339(6123): 1074–7 Avitahl N, Winandy S, Friedrich C et al., (1999). Ikaros sets thresholds for T cell activation and regulates chromosome
propagation. Immunity, 10 (3) (1999), pp. 333-343. Bae, S. C., E. Ogawa, M. Maruyama, H. Oka, M. Satake, K. Shigesada, N. A. Jenkins, D. J. Gilbert, N. G. Copeland, and Y. Ito. (1994).
PEBP2 αβ /mouse AML1 consists of multiple isoforms that possess differential transactivation po-tentials. Mol. Cell. Biol. 14:3242.
Banerji J, Rusconi S, Schaffner W(1981). Expression of a beta-globin gene is enhanced by remote SV40 DNA sequences. Cell.
1981; 27:299–308. Banerji J, Olson L, Schaffner W.(1983). A lymphocyte-specific cellular enhancer is located downstream of the joining region in
immunoglobulin heavy chain genes. Cell. 1983 Jul; 33(3):729-40. Bannister AJ, Kouzarides T. (2011). Regulation of chromatin by histone modifications. Cell Res 21(3): 381-395. Barbaric I., Gaynor Miller T. Neil Dear.(2007). Appearances can be deceiving: phenotypes of knockout mice. Briefings in
Functional Genomics, Vol. 6, Iss. 2, 1 June 2007, Pages 91–103. Barndt R, Dai MF, Zhuang Y.(1999). A novel role for HEB downstream or parallel to the pre-TCR signaling pathway during alpha
beta thymopoiesis. J Immunol. 1999; 163:3331–43. Barndt RJ, Dai M, Zhuang Y.(2000). Functions of E2A-HEB heterodimers in T-cell development revealed by a dominant negative
mutation of HEB. Mol Cell Biol. 2000; 20:6677–6685. Barrangou R, Marraffini LA. (2014). CRISPR-Cas systems: Prokaryotes upgrade to adaptive immunity. Mol. Cell 54:234–44. Basuyaux, J.P; E. Ferreira, D. Stéhelin, G. Butticè.(1997). The Ets transcription factors interact with each other and with the c-
Fos/c-Jun complex via distinct protein domains in a DNA-dependent and -independent manner. J. Biol. Chem., 272 (1997), pp. 26188–26195.
Bellavia, D., Mecarozzi, M., Campese, A.F., Grazioli, P., Talora, C., Frati, L., Gulino, A., and Screpanti, I. (2007). Notch3 and the
Notch3-upregulated RNA-binding protein HuD regulate Ikaros alternative splicing. EMBO J 26, 1670-1680. Berg, L. J., A. M. Pullen, B. Fazekas de St Groth, D. Mathis, C. Benoist, and M. M. Davis. (1989). Antigen/MHC-specific T cells are
preferentially exported from the thymus in the presence of their MHC ligand. Cell 58:1035. Berger, S.L. (2007). The complex language of chromatin regulation during transcription.Nature 447:407–412. Berghoff EG, et al. (2013). Evf2 (Dlx6as) lncRNA regulates ultraconserved enhancer methylation and the differential
transcriptional control of adjacent genes. Development. 2013; 140(21):4407–16.

71
Bernstein BE, Birney E, Dunham I, Green ED, Gunter C, Snyder M. (2014). An integrated encyclopedia of DNA elements in the human genome.Nature [Internet]. 2012 Sep 6 [cited 2014 Jan 20];489(7414):57–74.
Bessis A., Nicolas Champtiaux, Laurent Chatelin, and Jean-Pierre Changeux. (1997). The neuron-restrictive silencer element: A
dual enhancer/silencer crucial for patterned expression of a nicotinic receptor gene in the brain. Proc Natl Acad Sci U S A. 1997 May 27; 94(11): 5906–5911.Neurobiology.
Bevan, M. J., and T. Hunig. (1981). T cells respond preferentially to antigens that are similar to self H-2. Proc Natl Acad Sci U S A
78:1843. Bevington S. L., Pierre Cauchy, Jason Piper, Elisabeth Bertrand, Naveen Lalli, Rebecca C Jarvis, Liam Niall Gilding, Sascha Ott,
Constanze Bonifer, Peter N Cockerill. (2016). Inducible chromatin priming is associated with the establishment of immunological memory in T cells. The EMBO Journal (2016) e201592534, DOI 10.15252/embj.201592534.
Bhat, N. K., K. L. Komschlies, S. Fujiwara, R. J. Fisher, B. J. Mathieson,T. A. Gregorio, H. A. Young, J. W. Kasik, K. Ozato, and T. S.
Papas. (1989). Expression of ets genes in mouse thymocyte subsets and T cells.J. Immunol. 142:672. Bianconi E, Piovesan A, Facchin F, Beraudi A, Casadei R, Frabetti F, et al.(2013). An estimation of the number ofcells in the
human body.Ann Hum Biol [Internet]. 2013;40(6):463–71. Bieberstein NI, Carrillo Oesterreich F, Straube K, Neugebauer KM.(2012).First exon length controls active chromatin signatures
and transcription. Cell Rep. 2012; 2:62–68. Bierne , H. Hamon , M. and Cossart, P. (2012). Epigenetics and Bacterial Infections . Cold Spring Harb Perspective Medicine
.2:a010272 . Bierne, H. Hamon , M. and Cossart, P. (2012). Epigenetics and Bacterial Infections .Cold Spring Harb Perspective Medicine.
2:a010272. Bikard D, Hatoum-Aslan A, Mucida D, Marraffini LA. (2012). CRISPR interference can prevent natural transformation and
virulence acquisition during in vivo bacterial infection. Cell Host Microbe 12:177–86. Bird, A. (2002). DNA methylation patterns and epigenetic memory . Genes & Development, 16: 6-21 . Blackwood EM, Kadonaga JT.(1988). Going the distance: a current view of enhancer action. Science. 1998 Jul 3; 281(5373):60-3. Bock, C and Lengauer , T. (2008). Computational epigenetics. Bioinformatics, 24: 1–10.Environmental Health Perspectives.
(2006). The science of change .Environmental Health Perspectives, 114: A 160 – A167. Bolotin A, Quinquis B, Sorokin A, Ehrlich SD. (2005). Clustered regularly interspaced short palindrome repeats (CRISPRs) have
spacers of extrachromosomal origin. Microbiology 151:2551–61. Bonn S, et al. (2012). Tissue-specific analysis of chromatin state identifies temporal signatures of enhancer activity during
embryonic development. Nature Genetics. 2012; 44:148–156. Bories, J. C., D. M. Willerford, D. Grevin, L. Davidson, A. Camus, P. Martin, D. Stehelin, and F. W. Alt. (1995). Increased T-cell
apoptosis and terminal B-cell differentiation induced by inactivation of the ets-1 proto-oncogene. Nature 377: 635. Boris Lenhar, Albin Sandelin and Piero Carninci.(2012). Metazoan promoters: emerging characteristics and insights into
transcriptional regulation. Nature Rev. Genet.13, 233-245 (2012). Bottardi S., Lionel Mavoungou, Helen Pak, Salima Daou, Vincent Bourgoin, Yahia A. Lakehal, El Bachir Affar, Eric Milot (2014).
The IKAROS Interaction with a Complex Including Chromatin Remodeling and Transcription Elongation Activities Is Required for Hematopoiesis. PLOS Genetics, December 2014, Vol. 10 Issue 12.
Boyle AP, Davis S, Shulha HP, Meltzer P, Margulies EH, Weng Z, Furey TS, Crawford GE.(2008). High-resolution mapping and
characterization of open chromatin across the genome. Cell. 2008; 132:311–322. Braunschweig H, Guethlein F, Mailänder L, Marder TB.(2013). Synthesis of catechol-, pinacol-, and neopentylglycolborane
through the heterogeneous catalytic B-B hydrogenolysis of diboranes(4). Chemistry. 2013 Oct 25;19(44):14831-5. doi: 10.1002/chem.201302677. Epub 2013 Sep 20.
Braunschweig U.,Serge Gueroussov, Alex M.Plocik, Brenton R.Graveley, Benjamin J.Blencowe.(2013). Dynamic Integration of
Splicing within Gene Regulatory Pathways. Cell Vol. 152, Issue 6, Pages 1252-1269.

72
Buenrostro JD, Giresi PG, Zaba LC, Chang HY, Greenleaf WJ. (2013). Transposition of native chromatin for fast and sensitive epigenomic profiling of open chromatin, DNA-binding proteins and nucleosome position. Nature methods. 2013; 10:1213–1218.
Bulger, M. & Groudine, M. (2011).Functional and mechanistic diversity of distal transcription enhancers.Cell 144, 327–339
(2011). Bulger, M. & Groudine, M. (1981). Functional and mechanistic diversity of distal by remote SV40 DNA sequences. Cell 27, 299–
308 (1981). Cabili MN, Trapnell C, Goff L, Koziol M, Tazon-Vega B, Regev A, Rinn JL. (2011). Integrative annotation of human large intergenic
noncoding RNAs reveals global properties and specific subclasses. Genes Dev. 2011; 25:1915–1927. Calcar S, Qu C, Ching KA, Wang W, Weng Z, Green RD, Crawford GE, Ren B.,Calo, E., and Wysocka, J. (2013). Modification of
Enhancer Chromatin: What, How, and Why? Mol. Cell 49, 825-837. Cell 33, 729–740 (1983). Cesana, M. et al. (2011). A long noncoding RNA controls muscle differentiation by functioning as a competing endogenous RNA.
Cell 147, 358–369 (2011). Chambeyron S, Bickmore WA. (2004). Does looping and clustering in the nucleus regulate gene expression? Curr Opin Cell Biol.
2004; 16:256–62. Chari S. and Winandy S., (2008). Ikaros Regulates Notch Target Gene Expression in Developing Thymocytes. J Immunol. Author
manuscript; available in PMC 2009 Nov 17.Published in final edited form as:J Immunol. 2008 Nov 1; 181(9): 6265–6274. Chatilla, T., Silverman, L., Miller, R., and Geha, R. (1989). Mechanisms of T cell activation by the calcium ionophore ionomycin. J.
Immunol. 143, 1283-1289. Choudhuri Supratim.(2014).Fundamentals of Genes and Genomes. Chapter 1. Genes, Genomes, Molecular Evolution, Databases
and Analytical Tools. Chu C, et al. (2011). Genomic maps of long noncoding RNA occupancy reveal principles of RNA-chromatin interactions. Mol Cell.
2011; 44(4):667–78. Cobb, B.S., S. Morales-Alcelay, G. Kleiger, et al.(2000). Targeting of Ikaros to pericentromeric heterochromatin by direct DNA
binding. Genes Dev, 14 (17) (2000), pp. 2146-2160. Collins B, Clambey E.T., Scott-Browne J. et al. (2013). Ikaros promotes rearrangement of TCR α genes in an Ikaros null thymoma
cell line. Eur J Immunol, 43 (2) (2013), pp. 521-532. Collis P, Antoniou M, Grosveld F. (1990). Definition of the minimal requirements within the human beta-globin gene and the
dominant control region for high level expression. EMBO J. 1990; 9:233–240. Core LJ, et al. (2014). Analysis of nascent RNA identifies a unified architecture of initiation regions at mammalian promoters and
enhancers. Nat Genet. 2014; 46:1311–1320. Core LJ, Waterfall JJ, Lis JT. (2008). Nascent RNA sequencing reveals widespread pausing and divergent initiation at human
promoters. Science. 2008; 322:1845–1848. Cremer, T., and Cremer, C. (2001).Chromosome territories, nuclear architecture and gene regulation in mammalian cells. Nat.
Rev. Genet. 2, 292-301. Creyghton MP, Cheng AW, Welstead GG, Kooistra T, Carey BW, Steine EJ, Hanna J,Cui K, Zang C, Roh T-Y, Schones DE, Childs RW,
Peng W, Zhao K. Dada , R ., Kuma, M ., Jesudasan , R., Fernández , J., Gosálvez , J . and Agarwal , A. (2012). Epigenetics and its role in male infertility. The Journal of Assisted Reproduction and Genetics, 29:213–223 .
Daria Shlyueva, Gerald Stampfel and Alexander Stark. Transcriptional enhancers: from properties to genome-wide predictions.
NATURE REVIEWS | GENETICs. Vol. 15 APRIL 2014, 272-286. De la Barre AE, Gerson V, Gout S, Creaven M, Allis CD, et al. (2000) Core histone N-termini play an essential role in mitotic
chromosome condensation. EMBO J 19(3): 379-391. De Santa F, Barozzi I, Mietton F, Ghisletti S, Polletti S, Tusi BK, Muller H, Ragoussis J, Wei CL, Natoli G. (2010). A large fraction of
extragenic RNA pol II transcription sites overlap enhancers. PLoS Biol. 2010; 8:e1000384. Dekker, J., Rippe, K., Dekker, M., and Kleckner, N. (2002).Capturing Chromosome Conformation. Science 295, 1306-1311.

73
Derrien T, et al. (2012). The GENCODE v7 catalog of human long noncoding RNAs: analysis of their gene structure, evolution, and expression. Genome Res. 2012; 22:1775–1789.
DeveauH,Garneau JE,Moineau S. (2010). CRISPR/Cas system and its role in phage-bacteria interactions.Annu. Rev. Microbiol.
64:475–93. Dey A, Chitsaz F, Abbasi A, Misteli T, Ozato K. (2003). The double bromodomain protein Brd4 binds to acetylated chromatin
during interphase and mitosis. Proc Natl Acad Sci U S A. 2003; 100:8758–8763. Ding, Y., Li, H., Chen, L. L., and Xie, K. (2016). Recent Advances in Genome Editing Using CRISPR/ Cas9. Front. Plant Sci.7. Dixon J.R., Selvaraj S., Yue F., Kim A., Li Y., Shen Y., Hu M., Liu J.S., Ren B.(2012). Topological domains in mammalian genomes
identified by analysis of chromatin interactions. Nature. 2012; 485:376–380. Dostie, J., Richmond, T.A., Arnaout, R.A., Selzer, R.R., Lee, W.L., Honan, T.A., Rubio, E.D., Krumm, A., Lamb, J., Nusbaum, C., et al.
(2006). Chromosome Conformation Capture Carbon Copy (5C): A massively parallel solution for mapping interaction between genomic elements. Genome Res. 16, 1299-1309.
Dowen JM, et al. (2014). Control of cell identity genes occurs in insulated neighborhoods in Mammalian chromosomes. Cell.
2014; 159:374–387. Edelman, L.B., and Fraser, P. (2012). Transcription factories: genetic programming in three dimensions. Curr. Opin. Genet. Dev.
22, 110-114. Elizabeth M. Blackwood and James T. Kadonaga (1998). Going the Distance: enhancer action. Science 281, 60–63 (1998). Ernst J, Kheradpour P, Mikkelsen TS, et al. (2011). Mapping and analysis of chromatin state dynamics in nine human cell types.
Nature 2011;473(7345):43 49.. Ernst J, Melnikov A, Zhang X, et al.: (2016). Genome-scale high-resolution mapping of activating and repressive nucleotides in
regulatory regions.Nat Biotechnol. 2016; 34(11): 1180–90. Esteller, M. (2008). Epigenetics in cancer.New England Journal of Medicine 358:1148–1159, 2008. Euskirchen GM, Auerbach RK, Davidov E, Gianoulis TA, Zhong G, Rozowsky J, Bhardwaj N, Gerstein MB, Snyder M. (2011).
Diverse roles and interactions of the SWI/SNF chromatin remodeling complex revealed using global approaches. PLoS Genet 7: e1002008.
Faure AJ, Schmidt D, Watt S, Schwalie PC, Wilson MD, Xu H, Ramsay RG, Odom DT, Flicek P. (2012). Cohesin regulates tissue-
specific expression by stabilizing highly occupied cis-regulatory modules. Genome Res 22:2163–2175. Fong YW, Zhou Q. (2001). Stimulatory effect of splicing factors on transcriptional elongation. Nature. 2001; 414:929–933. Foster, J. W., M. A. Dominguez-Steglich, Guioli S., Kwok C., Weller P. A., Stevanovic M., Weissenbach J., Mansour S., Young I. D.,
Goodfellow P. N., et al (1994). Campomelic dysplasia and autosomal sex reversal caused by mutations in an SRY-related gene. Nature 372: 525.
Francis O.L., J.L. Payne, R. Su, K.J. Payne (2011). Regulator of myeloid differentiation and function: the secret life of Ikaros. World
J Biol Chem, 2 (6) (2011), pp. 19-125. Fullwood MJ, Liu MH, Pan YF, Liu J, Xu H, Mohamed YB, Orlov YL, Velkov S, Ho A, Mei PH, Chew EG, Huang PY, Welboren WJ, Han
Y, Ooi HS, Ariyaratne PN, Vega VB, Luo Y, Tan PY, Choy PY, Wansa KD, Zhao B, Lim KS, Leow SC, Yow JS, Joseph R, Li H, Desai KV, Thomsen JS, Lee YK, Karuturi RK, Herve T, Bourque G, Stunnenberg HG, Ruan X, Cacheux-Rataboul V, Sung WK, Liu ET, Wei CL, Cheung E, Ruan Y.(2009). An oestrogen-receptor-alpha-bound human chromatin interactome.Nature. 2009 Nov 5;462 (7269):58-64
Fumitaka Inoue, Martin Kircher,Beth Martin, Gregory M. Cooper,Daniela M. Witten, Michael T. McManus, Nadav Ahituv, and Jay
Shendure. (2017). A systematic comparison reveals substantial differences in chromosomal versus episomal encoding of enhancer activity. Genome Res. 2017 Jan; 27(1): 38–52.
Fumitaka Inouea,and Nadav Ahituva,b,(2015). Decoding enhancers using massively parallel reporter assays. Genomics. 2015
September ; 106(3): 159–164. Fung, C ., McKnight, R . and Lane , R . (2013) . Environmental Influences on Epigenetic Gene Regulation .NeoReviews , 14: e121 .

74
Garneau JE, DupuisME, VillionM, Romero DA, Barrangou R, et al. (2010). The CRISPR/Cas bacterial immune system cleaves bacteriophage and plasmid DNA. Nature 468:67–71.
Gerstein MB, Kundaje A, Hariharan M, Landt SG, Yan K-K, Cheng C, et al.(2012). Architecture of the human regulatory network
derived from ENCODE data. Nature [Internet]. Nature Publishing Group; 2012;489(7414):91–100. Geyer PK, Green MM, Corces VG.(1990). Tissue-specific transcriptional enhancers may act in trans on the gene located in the
homologous chromosome: the molecular basis of transvection in Drosophila. EMBO J. 1990; 9:2247–56. Ghavi-Helm, Y., Klein, F.A., Pakozdi, T., Ciglar, L., Noordermeer, D., Huber, W., and Furlong, E.E.M. (2014). Enhancer loops appear
stable during development and are associated with paused polymerase. Nature 512, 96-100. Ghisletti S, Barozzi I, Mietton F, Polletti S, De Santa F, Venturini E, Gregory L Lonie L, Chew A, Wei CL, Ragoussis J, Natoli G.
(2010). Identification and characterization of enhancers controlling the inflammatory gene expression program in macrophages. Immunity 2010, 32:317-328.
Giese, K., C. Kingsley, J. R. Kirshner, and R. Grosschedl. (1995). Assembly andfunction of a TCR␣enhancer complex is dependent on LEF-1-induced DNAbending and multiple protein-protein interactions. Genes Dev. 9:995.
Gillies, S. D., Morrison, S. L., Oi, V. T. & Tonegawa, S. (1983). A tissue-specific transcription enhancer element is located in the
major intron of a rearranged immunoglobulin heavy chain gene. Cell 33, 717–728 (1983). Ginno PA, Lott PL, Christensen HC, Korf I, Chedin F.(2012). R-loop formation is a distinctive characteristic of unmethylated
human CpG island promoters. Mol Cell. 2012; 45:814–825. Gisselbrecht, S.S., Barrera, L.A., Porsch, M., Aboukhalil, A., Estep Jii, P.W., Vedenko, A., Palagi, A., Kim, Y., Zhu, X., Busser, B.W., et
al. (2013). Highly parallel assays of tissue-specific enhancers in whole Drosophila embryos. Nat. Methods 10. 774-780. Goldman F.D., Gurel Z, Al-Zubeidi D et al.,(2012). Congenital pancytopenia and absence of B lymphocytes in a neonate with a
mutation in the Ikaros gene. Gonzalez G a, Yamamoto KK, Fischer WH, Karr D, Menzel P, Biggs W, et al.,(1989). A cluster of phosphorylation sites on the
cyclic AMP-regulated nuclear factor CREB predicted by its sequence, Nature, 1989, p. 749-52. Gorzkiewicz, A. and Walczewska, A. (2014). Functions of the Ikaros transcription factor and the role of IKZF1 gene defects in
hematological malignanciesFunkcje czynnika transkrypcyjnego Ikaros oraz znaczenie defektów genu IKZF1 w nowotworach hematologicznych. https://doi.org/10.1016/j.achaem.2014.10.001.
Green RD, Lobanenkov VV, Stewart R, Thomson JA, Crawford GE, Kellis M, Ren B. Gubbay, J., J. Collignon, P. Koopman, B. Capel, A. Economou, A. Muensterberg, N. Vivian, P. Goodfellow, R. Lovell-Badge. (1990).
A gene mapping to the sex-determining region of the mouse Y chromosome is a member of a novel family of embryonically expressed genes. Nature 346: 245.
Guttman M, Amit I, Garber M, French C, Lin MF, Feldser D, Huarte M, Zuk O, Carey BW, Cassady JP, Cabili MN, Jaenisch R,
Mikkelsen TS, Jacks T, Hacohen N, Bernstein BE, Kellis M, Regev A, Rinn JL, Lander ES.(2009). Chromatin signature reveals over a thousand highly conserved large non-coding RNAs in mammals. Nature. 2009; 458:223–227.
Guttman M, Donaghey J, Carey BW, Garber M, Grenier JK, Munson G, Young G, Lucas AB, Ach R, Bruhn L, Yang X, Amit I, Meissner
A, Regev A, Rinn JL, Root DE, Lander ES. (2011). LincRNAs act in the circuitry controlling pluripotency and differentiation. Nature. 2011; 477:295–300.
Guttman M, Garber M, Levin JZ, Donaghey J, Robinson J, Adiconis X, Fan L, Koziol MJ, Gnirke A, Nusbaum C, Rinn JL, Lander ES,
Regev A. (2010). Ab initio reconstruction of cell type-specific transcriptomes in mouse reveals the conserved multi-exonic structure of lincRNAs. Nat Biotechnol. 2010; 28:503–510.
Guttman M, Russell P, Ingolia NT, Weissman JS, Lander ES. (2013). Ribosome profiling provides evidence that large noncoding
RNAs do not encode proteins. Cell. 2013; 154:240–251. Haberland, M.; Montgomery, R.L.; and Olson, E.N. (2009). The many roles of histone deacetylases in development and
physiology: Implications for disease and therapy. Nature Reviews. Genetics 10:32–42, 2009. Hahm K., P. Ernst, K. Lo, et al.(1994). The lymphoid transcription factor LyF-1 is encoded by specific, alternatively spliced
mRNAs derived from the Ikaros gene. Mol Cell Biol, 14 (11) (1994), pp. 7111-7123. Hall IM, Shankaranarayana GD, Noma K, Ayoub N, Cohen A, Grewal SI.(2002). Establishment and maintenance of a
heterochromatin domain. Science. 2002; 297:2232–2237. Hansen, T.B. et al. (2013). Natural RNA circles function as efficient microRNA sponges. Nature 495, 384–388 (2013).

75
Hargreaves DC, Crabtree GR. (2011). ATP-dependent chromatin remodeling: genetics, genomics and mechanisms. Cell Res 2011,
21:396-420. Harker N, Naito T, Cortes M. et al. (2002). The CD8 Gene locus is regulated by the Ikaros family of proteins. Mol Cell, 10 (6)
(2002), pp. 1403-1415. Hattori, N., H. Kawamoto, S. Fujimoto, K. Kuno, Y. Katsura. (1996). Involvement of transcription factors Tcf-1 and Gata-3 in the
initiation of the earliest step of T cell development in the thymus. J. Exp. Med. 184: 1137. Hay D.,Jim R Hughes, Christian Babbs,James O J Davies,Bryony J Graham,Lars L P Hanssen,Mira T Kassouf,A Marieke
Oudelaar,Jacqueline A Sharpe,Maria C Suciu, Jelena Telenius,Ruth Williams,Christina Rode,Pik-Shan Li,Len A Pennacchio,Jacqueline A Sloane-Stanley,Helena Ayyub,Sue Butler,Tatjana Sauka-Spengler,Richard J Gibbons, Andrew J H Smith,William G Wood& Douglas R Higgs (2016). Genetic dissection of the α-globin super-enhancer in vivo.Nature Genetics 48, 895–903 (2016) doi:10.1038/ng.3605.
Hayashi, K., N. Abe, T. Watanabe, M. Obinata, M. Ito, T. Sato, S. Habu, andM. Satake. (2001). Overexpression of AML1
transcription factor drives thymo-cytes into the CD8 single-positive lineage. J. Immunol. 167:4957. He G., Wenjie Luo, Peng Li, Christine Remmers, William J. Netzer, Joseph Hendrick, Karima Bettayeb, Marc Flajolet, Fred
Gorelick, Lawrence P. Wennogle& Paul Greengard.(2010) Gamma-secretase activating protein is a therapeutictarget for Alzheimer’s disease. NATURE,Vol. 467.2 September 2010.
He HH, Meyer CA, Shin H, Bailey ST, Wei G, Wang Q, Zhang Y, Xu K, Ni M, Lupien M, Mieczkowski P, Lieb JD, Zhao K, Brown M, Liu
XS: Nucleosome dynamics define transcriptional enhancers. Nat Genet 2010, 42:343-347. Heintzman ND, et al. (2009). Histone modifications at human enhancers reflect global cell-type-specific gene expression.
Nature. 2009; 459:108–112. Heintzman ND, Stuart RK, Hon G, Fu Y, Ching CW, Hawkins RD, Barrera LO, Van Calcar S, QuC, Ching KA, Wang W, Weng Z, Green
RD, Crawford GE, Ren B. (2007). Distinct and predictive chromatin signatures of transcriptional promoters and enhancers in the human genome. Nat.Genet. 2007; 39:311–318.
Heler R,Marraffini LA, BikardD. (2014). Adapting to new threats: the generation of memory by CRISPRCas immune systems. Mol.
Microbiol. 93:1–9. Hendrich B, Hardeland U, Ng HH, Jiricny J, Bird A (1999). The thymineglycosylase MBD4 can bind to the product of deamination
at methylated CpGsites. Nature 401: 301–304. Henthorn, P., M. Kiledjian, and T. Kadesch. (1990). Two distinct transcription factors that bind the immunoglobulin enhancer
microE5/kappa 2 motif.Science. 1990 Jan 26;247(4941):467-70. Hernandez-Munain, C., and M. S. Krangel.(1994). Regulation of the T-cell re-ceptor␦enhancer by functional cooperation
between c-Myb and core-bindingfactors. Mol. Cell. Biol. 14:473. Hernandez-Munain, C., and M. S. Krangel. (1995). c-Myb and core-binding factor/PEBP2 display functional synergy but bind
independently to adjacent sites in theT-cell receptor␦enhancer. Mol. Cell. Biol. 15:3090. Herz HM, et al. (2012). Enhancer-associated H3K4 monomethylation by Trithorax-related, the Drosophila homolog of
mammalian Mll3/Mll4. Genes & development.2012; 26:2604–2620. Hnisz D, et al. (2013). Super-enhancers in the control of cell identity and disease. Cell. 2013; 155:934–947. Hnisz D., Schuijers J., Lin C.Y., Weintraub A.S., Abraham B.J., Lee T.I., Bradner J.E., Young R.A. Convergence of developmental and
oncogenic signaling pathways at transcriptional super-enhancers. Mol Cell. 2015;58:362–370. Hnisz D. Krishna Shrinivas, Richard A. Young, Arup K. Chakraborty, and Phillip A. Sharp(2017). A Phase Separation Model for
Transcriptional Control.Cell 169, March 23, 2017. Hogquist, K. A., M. A. Gavin, and M. J. Bevan. (1993). Positive selection of CD8+ T cells induced by major histocompatibility
complex binding peptides in fetal thymic organ culture. J Exp Med 177:1469. Horvath P, Barrangou R. (2010). CRISPR/Cas, the immune system of bacteria and archaea. Science 327:167–70.

76
Hu G, Schones DE, Cui K, Ybarra R, Northrup D, Tang Q, Gattinoni L, Restifo NP, Huang S, Zhao K. (2011). Regulation of nucleosome landscape and transcription factor targeting at tissue-specific enhancers by BRG1. Genome Res 2011, 21:1650-1658.
Hu, J. S., E. N. Olson, and R. E. Kingston. (1992). HEB, a helix-loop-helix protein related to E2A and ITF2 that can modulate the
DNA-binding ability of myogenic regulatory factors. Mol. Cell. Biol. 12:1031. Huang H, Zheng G, Jiang W, Hu H, Lu Y. (2015). One-step high-efficiency CRISPR/Cas9-mediated genome editing in
Streptomyces. Acta Biochim. Biophys. Sin. 47:231–43. Hughes, J.R., Roberts, N., McGowan, S., Hay, D., Giannoulatiou, E., Lynch, M., De Gobbi, M., Taylor, S., Gibbons, R., and Higgs, D.R.
(2014). Analysis of hundreds of cis-regulatory landscapes at high resolution in a single, high-throughput experiment. Nat. Genet. 46, 205-212.
Huh, I. Zeng,V. Park, V and Yi2 , V . (2013). DNA methylation and transcriptional noise . Epigenetics & Chromatin, 6:9-18. Huisinga KL, Brower-Toland B & Elgin SC (2006). The contradictory definitions of heterochromatin: transcription and silencing.
Chromosoma 115(2): 110-122. Hui-Ying Xue, Li-Juan Ji, Ai-Mei Gao, Ping Liu, Jing-Dong He, Xiao-Jie Lu.(2016). CRISPR-Cas9 for medical genetic screens:
applications and future perspectives. J Med Genet 2016;53:91–97. doi:10.1136/jmedgenet-2015-103409. Iacobucci I., Iraci N., Messina M., et al.,(2012). IKAROS deletions dictate a unique gene expression signature in patients with
adult B-cell acute lymphoblastic leukemia. PLoS ONE, 7 (7) (2012), p. e40934. Im, S.H., Horton, H.F., Byrne, M.C., and Rao, A. (2002). Transcriptional Mechanisms Underlying Lymphocyte Tolerance.Immunity
1996;5:537–549. Irimia, M., Jose L. Royo, Demian Burguera, Ignacio Maeso, José L. Gómez-Skarmeta, and Jordi Garcia-Fernandez. (2012).
Comparative genomics of the Hedgehog loci in chordates and the origins of Shh regulatory novelties. Sci Rep. 2012; 2: 433. Jäger R, Gisslinger H, Passamonti F et al.(2010). Deletions of the transcription factor Ikaros in myeloproliferative neoplasms.
Leukemia, 24 (7) (2010), pp. 1290-1298. Jenuwein T, Allis CD: Translating the histone code. Science (2001), 293:1074-1080. Jiang W, Bikard D, Cox D, Zhang F, Marraffini LA. (2013). RNA-guided editing of bacterial genomes using CRISPR-Cas systems.
Nat. Biotechnol. 31:233–39. Jiang Y, Chen B, Duan C, Sun B, Yang J, Yang S. (2015). Multigene editing in the Escherichia coli genome using the CRISPR-Cas9
system. Appl. Environ. Microbiol. 81:2506–14. Jin, F., Li, Y., Dixon, J.R., Selvaraj, S., Ye, Z., Lee, A.Y., Yen, C.A., Schmitt, A.D., Espinoza, C.A., and Ren, B. (2013). A high-resolution
map of the three-dimensional chromatin interaction in human cells. Nature 503, 290-294. Jones ME, Zhuang Y. Acquisition of a functional T cell receptor during T lymphocyte development is enforced by HEB and E2A
transcription factors. Immunity. 2007; 27: 860–870. Kadesch, T. (1992). Helix-loop-helix proteins in the regulation of immunoglobulin Kaestner KH: The FoxA factors in
organogenesis and differentiation. Curr Opin Genet Dev 2010, 20:527-532. Kaikkonen MU, et al. (2013). Remodeling of the enhancer landscape during macrophage activation is coupled to enhancer
transcription. Molecular Cell. 2013; 51:310–325. Kanno, T., Y. Kanno, L. F. Chen, E. Ogawa, W. Y. Kim, and Y. Ito. (1998) .Intrinsic transcriptional activation-inhibition domains of
the polyomavirus en-hancer binding protein 2/core binding factor␣subunit revealed in the presenceof thesubunit. Mol. Cell.
Biol. 18:2444. Karr EA. Transcription Regulation in the Third Domain [Internet]. 1st ed. Advances in Applied Microbiology. Elsevier Inc.;
(2014). Kathrein KL, Lorenz R, Innes AM, Griffiths E, Winandy S. (2005). Ikaros induces quiescence and T-cell differentiation in a
leukemia cell line. Mol Cell Biol 2005;25:1645–1654. Kaye, J., M. L. Hsu, M. E. Sauron, S. C. Jameson, N. R. Gascoigne, and S. M. Hedrick. (1989). Selective development of CD4+ T cells
in transgenic mice expressing a class II MHCrestricted antigen receptor. Nature 341:746.

77
Keller C, Kulasegaran-Shylini R, Shimada Y, Hotz HR, Buhler M. (2013). Noncoding RNAs prevent spreading of a repressive
histone mark. Nat Struct Mol Biol. 2013; 20:994–1000. Kheradpour P, Ernst J, Melnikov A, et al., (2013).Systematic dissection of regulatory motifs in 2000 predicted human enhancers
using a massively parallel reporter assay. Genome Res. 2013; 23(5): 800–11. Kidani Y1, Elsaesser H, Hock MB, Vergnes L, Williams KJ, Argus JP, Marbois BN, Komisopoulou E, Wilson EB, Osborne TF,
Graeber TG, Reue K, Brooks DG, Bensinger SJ.(2013). Sterol regulatory element-binding proteins are essential for the metabolic programming of effector T cells and adaptive immunity. Nat Immunol. 2013 May;14(5):489-99. doi: 10.1038/ni.2570.
Kieffer-Kwon KR, et al. (2013). Interactome maps of mouse gene regulatory domains reveal basic principles of transcriptional
regulation. Cell. 2013; 155:1507–1520. Kim Is, Sinha S, de Crombrugghe B, Maity SN. (1996). Determinayion of functional domains in the C subunit of the CCAAT-
binding factor (CBF) necessary for formation of a CBF-DNA complex: CBF-B interacts simultaneously with both the CBF-A and CBF-C subunits to form a heterotrimeric CBF molecule. Mol Cell Biol;1996;16(8):4003-13.
Kim TK, Hemberg M, Gray JM, Costa AM, Bear DM, Wu J, Harmin DA, Laptewicz M, Barbara-Haley K, Kuersten S, Markenscoff-
Papadimitriou E, Kuhl D, Bito H, Worley PF, Kreiman G, Greenberg ME.(2010).Widespread transcription at neuronal activity-regulated enhancers. Nature. 2010; 465:182–187.
Kiro R, Shitrit D, Qimron U. (2014). Efficient engineering of a bacteriophage genome using the type I-E CRISPR-Cas system. RNA
Biol. 11:42–44. Klattenhoff, C.A., Scheuermann, J.C., Surface, L.E., Bradley, R.K., Fields, P.A., Steinhauser, M.L., Ding, H., Butty, V.L., Torrey, L., Haas,
S., et al. (2013). Braveheart, a Long Noncoding RNA Required for Cadiovascular Lineage Commitment. Cell 152, 570-583. Klein, E. S., D. M. Simmons, L. W. Swanson, and M. G. Rosenfeld. (1993). Tissue specific RNA splicing generates an ankyrin-like
domain that affects the dimerization and DNA-binding properties of a bHLH protein. Genes Dev. 7:55. Kleinjan DA, van Heyningen V. Long-range control of gene expression: emerging mechanisms and disruption in disease. Am J
Hum Genet. 2005;76:8–32. Kleinmann Eva, Anne-Solen Geimer Le Lay, MacLean Sellars, Philippe Kastner and Susan Chan (2008). Ikaros Represses the
Transcriptional Response to Notch Signaling in T-Cell Development. Mol Cell Biol. 2008 Dec; 28(24): 7465–7475. Klug, C.A., Morrison, S.J., Masek, M., Hahm, K., Smale, S.T., and Weissman, I.L. (1998). Hematopoietic stem cells and lymphoid
progenitors express different Ikaros isoforms, and Ikaros is localized to heterochromatin in immature lymphocytes. Proc Nat Acad Sci USA 95, 657-662.
Koch F, Fenouil R, Gut M, et al. (2011). Transcription initiation platforms and GTF recruitment at tissue-specific enhancers and
promoters. Nat Struct Mol Biol 2011;18(8):956-963. Koipally J, Renold A, Kim J., et al.(1999). Repression by Ikaros and Aiolos is mediated through histone deacetylase complexes.
EMBO J, 18 (11) (1999), pp. 3090-3100. Kolovos P., Tobias A Knoch, Frank G Grosveld, Peter R Cook and Argyris Papantonis.(2012) Enhancers and silencers: an
integrated and simple model for their function. Epigenetics & Chromatin 2012, 5:1. Komine, O., K. Hayashi, W. Natsume, T. Watanabe, Y. Seki, N. Seki, R. Yagi,W. Sukzuki, H. Tamauchi, K. Hozumi, et al. (2003). The
Runx1 transcriptionfactor inhibits the differentiation of naive CD4⫹T cells into the Th2 lineage byrepressing GATA3 expression. J. Exp. Med. 198:51.
Koopman, P., J. Gubbay, N. Vivian, P. Goodfellow, R. Lovell-Badge. (1991). Male development of chromosomally female mice
transgenic for Sry. Nature 351: 117. Kouadjo KE, Nishida Y, Cadrin-Girard JF, Yoshioka M, St-Amand J. Housekeeping and tissue-specific genes in mouse tissues. BMC
Genomics. 2007;8:127. Kowalczyk MS, et al. (2012). Intragenic enhancers act as alternative promoters. Mol Cell. 2012; 45:447–458. Kung JT, Colognori D, Lee JT.(2013). Long noncoding RNAs: past, present, and future. Genetics. 2013; 193(3):651–69.

78
Kwasnieski JC, Fiore C, Chaudhari HG, et al.(2014). High-throughput functional testing of ENCODE segmentation predictions. Genome Res. 2014; 24(10): 1595–602.
Lai F, Orom UA, Cesaroni M, Beringer M, Taatjes DJ, Blobel GA, Shiekhattar R.(2013). Activating RNAs associate with Mediator to
enhance chromatin architecture and transcription. Nature. 2013; 494:497–501. Lam MT, Cho H, Lesch HP, Gosselin D, Heinz S, Tanaka-Oishi Y, Benner C, Kaikkonen MU, Kim AS, Kosaka M, Lee CY, Watt A,
Grossman TR, Rosenfeld MG, Evans RM, Glass CK.(2013). Rev-Erbs repress macrophage gene expression by inhibiting enhancer-directed transcription. Nature. 2013; 498:511–515.
Lane, A.A., and Chabner, B.A. (2009). Histone deacetylase inhibitors in cancer therapy.Journal of Clinical Oncology 27:5459–
5468, 2009. Laudet, V., D. Stehelin, H. Clevers. (1993). Ancestry and diversity of the HMG box superfamily. Nucleic Acids Res. 21: 2493. Lee DJ, Minchin SD, Busby SJW. (2012). Activating Transcription in Bacteria. Annu Rev Microbiol. 2012;66:125–52. Lee JE, et al. (2013). H3K4 mono- and di-methyltransferase MLL4 is required for enhancer activation during cell differentiation.
Elife (Cambridge). 2013; 2:e01503. Lepoivre C. et al., (2013). Divergent transcription is associated with promoters of transcriptional regulators. BMC Genomics
2013, 14:914 doi:10.1186/1471-2164-14-914. Lettice LA, Heaney SJ, Purdie LA, Li L, de Beer P, Oostra BA, Goode D, Elgar G, Hill RE, de Graaff EA. (2003). long-range Shh
enhancer regulates expression in the developing limb and fin and is associated with preaxial polydactyly. Hum Mol Genet. 2003; 12:1725–1735.
Levine M. (2010).Transcriptional enhancers in animal development and evolution. Curr Biol. 2010; 20:R754–63. Levine, M., and Tjian, R. (2003).Transcription regulation and animal diversity. Nature 424, 147-151. Li, Z., L.A. Perez-Casellas, A. Savic, C. Song, S. Dovat (2011). Ikaros isoforms: the saga continues. World J Biol Chem, 2 (6) (2011),
pp. 40-145. Lieberman-Aiden, E., Berkum, N.L., van, Williams, L., Imakaev, M., Ragoczy, T., Telling, A., Amit, I., Lajoie, B.R., Sabo, P.J.,
Dorschner, M.O., et al. (2009). Comprehensive Mapping of Long-Range Interactions Reveals Folding Principles of the Human Genome. Science 326, 289-293.
Lin L, DeMartino GN, Greene WC. (2000). Cotranslstional dimerization of the Rel homology domain of NF-kappaB1 generates
p50-p105 heterodimers and is required for effective p50 production. EMBO J.2000;19(17):4712-22. Liu, Z., and Garrard, W.T. (2005). Long-Range interactions between Three Transcriptional Enhancers, Active Vk Gene promoters,
and a 3'Boundary Sequence Spanning 46 Kilobases. Mol. Cell. Biol. 25, 3220-3231. Lodato MA, Frampton GM, Sharp PA, Boyer LA, Young RA, Jaenisch R. Histone Lomberk , G .( 2007). Epigenetics. Pancreatology,7: 396–397. Lomvardas S, et al. (2006). Interchromosomal interactions and olfactory receptor choice. Cell. 2006; 126:403–13. Louise M D’Cruz, Jamie Knell, Jessica K Fujimoto, and Ananda W Goldrath.(2010). An essential role for the transcription factor
HEB in thymocyte survival, Tcra rearrangement and the development of natural killer T cells. Nat Immunol. 2010 Mar; 11(3): 240–249.
Luger K, Mäder AW, Richmond RK, Sargent DF, Richmond TJ (1997). Crystal structure of the nucleosome core particle at 2.8 A
resolution. Nature 389(6648): 251-260. Lund, A. and Lohuizen, M. (2004). Epigenetics and cancer . Genes & Development 18: 2315-2335. Makarova KS,HaftDH, Barrangou R, Brouns SJ, Charpentier E, et al. (2011). Evolution and classification of the CRISPR-Cas
systems. Nat. Rev. Microbiol. 9:467–77. Mali, P. et al. (2013). RNA-guided human genome engineering via Cas. Science 339, 823-826, doi: 10.1126/science. 1232033
(2013). Maninjay K. A., andKatherine A. F., (2014).Long non-coding RNAs and control of gene expression in the immune system.Vol. 20,
Issue 11, p623–631.

79
Martel B, Moineau S. (2014). CRISPR-Cas: an efficient tool for genome engineering of virulent bacteriophages. Nucleic Acids Res.
42:9504–13. Maston GA, Evans SK, Green MR. (2006). Transcriptional regulatory elements in the human genome.Annu Rev Genomics Hum
Genet.2006; 7:29–59. Mattick JS, Rinn JL. (2015). Discovery and annotation of long noncoding RNAs.Nat Struct Mol Biol. 2015; 22:5–7. Matzinger, P., R. Zamoyska, and H. Waldmann. (1984). Self tolerance is H-2-restricted. Nature 308:738. Melnikov A, Murugan A, Zhang X, et al.(2012). Systematic dissection and optimization of inducible enhancers in human cells
using a massively parallel reporter assay. Nat Biotechnol. 2012; 30(3): 271–7. Memczak S, Jens M, Elefsinioti A, Torti F, Krueger J, Rybak A, Maier L, Mackowiak SD, Gregersen LH, Munschauer M, Loewer A,
Ziebold U, Landthaler M, Kocks C, le Noble F, Rajewsky N. (2013). Circular RNAs are a large class of animal RNAs with regulatory potency. Nature. 2013; 495:333–338.
Mifsud, B., Tavares-Cadete, F., Young, A.N., Sugar, R., Schoenfelder, S., Ferrerira, L., Wingett, S.W., Andrews, S., Grey, W., Ewels,
P.A., et al. (2015). Mapping long-range promoter contacts in human cells with high-resolution capture Hi-C, Nat.Genet. 47, 598-606.
Mojica FJ, D´ıez-Villase ˜ nor C, Garc´ıa-Martinez J, Soria E. (2005). Intervening sequences of regularly spaced prokaryotic
repeats derive from foreign genetic elements. J. Mol. Evol. 60:174–82. Molnar, A., and Georgopoulos, K. (1994). The Ikaros gene encodes a family of functionally diverse zinc finger DNA-binding
proteins. Mol Cell Biol 14, 8292-8303. Molnar, A., Wu, P., Largespada, D.A., Vortkamp, A., Scherer, S., Copeland, N.G., Jenkins, N.A., Bruns, G., and Georgopoulos, K.
(1996).The Ikaros gene encodes a family of lymphocyte-restricted zinc finger DNA binding proteins, highly conserved in human and mouse. J Immunol 156, 585-592.
Mombaerts, P., Terhorst, C., Jacks, T., Tonegawa, S. and Sancho, J. (1995). Characterization of immature thymocyte lines derived
from T-cell receptor or recombination activating gene 1 and p53 double mutant mice. Proc Natl Acad Sci U S A 92, 7420-7424 (1995).
Morange, M. (2014). What history tells us XXXv. Enhancers:Their existence and characteristics have raised puzzling issues since
their discovery. J. Biosci. 39,741-745. Moriyama A, et al. (2007). GFP transgenic mice reveal active canonical Wnt signal in neonatal brain and in adult liver and spleen.
Genesis 2007;45:90–100. Mousavi K, Zare H, Dell’orso S, Grontved L, Gutierrez-Cruz G, Derfoul A, Hager GL, Sartorelli V. (2013). ERNAs promote
transcription by establishing chromatin accessibility at defined genomic loci. Mol Cell. 2013; 51:606–617. Muerdter F, Boryń ŁM, Arnold CD (2015). STARR-seq - principles and applications. Genomics. 2015; 106(3): 145–50. Müller CR1, Fregin A, Srsen S, Srsnova K, Halliger-Keller B, Felbor U, Seemanova E, Kress W.(1999) Allelic heterogeneity of
alkaptonuria in Central Europe. Eur J Hum Genet.7(6):645-51. Muller-McNicoll M, Neugebauer KM.(2013). How cells get the message: dynamic assembly and function of mRNA-protein
complexes. Nature reviews. Genetics. 2013; 14:275–287. Mullighan C.G.(2008). BCR-ABL1 lymphoblastic leukaemia is characterized by the deletion of Ikaros. Nature, 453 (7191) (2008),
pp. 110-114. Mullighan C.G.(2012).The molecular genetic makeup of acute lymphoblastic leukemia. Hematology, 2012 (2012), pp. 389-396. Murre, C., P. Schonleber-McCaw, and D. Baltimore.(1989). A new DNA binding and dimerization motif in immunoglobulin
enhancer binding, daughterless, MyoD and myc proteins. Cell 56:777. Murrel, A., Heeson, S., and Reik, W. (2004). Interaction between differentially methylated regions partitions the imprinted genes
Igf2 and H19 into parent-specific chromatin loops. Nat. Genet. 36, 889-893. Naito, Y., Hino, K., Bono, H. and Ui-Tei, K. (2015) CRISPR direct: software for designing CRISPR/Cas guide RNA with reduced off-
target sites. Bioinformatics 31, 1120-1123, doi:10.1093/bioinformatics/btu743 (2015).

80
Natoli G and Andrau JC, (2012). Noncoding transcription at enhancers: general principles and functional models. Annu Rev Genet. 2012; 46:1-19.doi:10. 1146/annurev-genet-110711-155459.
Neph S, Vierstra J, Stergachis AB, Reynolds AP, Haugen E, Vernot B, et al.(2014). An expansive human regulatory lexicon
encoded in transcription factor footprints. Nature [Internet]. Nature Publishing Group; 2012 Sep 6 [cited 2014 Feb 19]; 489 (7414):83–90.
Nguyen TA, Jones RD, Snavely AR, et al.(2016). High-throughput functional comparison of promoter and enhancer
activities.Genome Res. 2016; 26(8): 1023–33.
Nielsen, A. L., N. Pallisgaard, F. S. Pedersen, and P. Jorgensen.(1992). Murine helix-loop-helix transcriptional activator proteins binding to the E-box motif of Akv murine leukemia virus enhancer identified by cDNA cloning. Mol. Cell. Biol. 12:3449.
Nikolic-Zugic, J., and M. J. Bevan.(1990). Role of self-peptides in positively selecting the Tcell repertoire. Nature 344:65. Noboru Jo Sakabe, Daniel Savic and Marcelo A Nobrega (2012).Transcriptional enhancers in development and disease.Genome
Biology 2012, 13:238. Nora,E.P., Lajoie, B.R., Schulz, E.G., Giorgetti, L., Okamoto, I., Servant, N., Piolot, T., van Berkum, N. L., Meisig, J., Sedat, J., et al.
(2012). Spatial partitioning of the regulatory landscape of the X-inactivation centre. Nature 485, 381-385. Ogbourne S, Antalis TM. Transcriptional control and the role of silencers in transcriptional regulation in eukaryotes. Biochem J.
(1998);331 ( Pt 1:1–14). Oh JH, van Pijkeren JP. 2014. CRISPR-Cas9-assisted recombineering in Lactobacillus reuteri. Nucleic Acids Res. 42:e131. Oka, T., Sato, H., Ouchida, M ., Utsunomiya, A. and Yoshino , T . (2011). Cumulative epigenetic abnormalities in host genes with
viral and microbial infection during initiation and progression of malignant lymphoma/leukemia. Cancers, 3: 568-581 . Oosterwegel, M., M. van de Wetering, D. Dooyes, L. Klomp, A. Winoto, K. Georgopoulos, F. Meijlink, H. Clevers. (1991). Cloning of
murine TCF-1, a T cell-specific transcription factor interacting with functional motifs in the CD3-ε and the T cell receptor α enhancers. J. Exp. Med. 173: 1133.
Oosterwegel, M., M. van de Wetering, J. Timmerman, A. M. Kruisbeek, O. Destree, F. Meijlink, H. Clevers. (1993). Differential
expression of the HMG box factors TCF-1 and LEF-1 during murine embryogenesis. Development 118: 439. Orom, U.A., Derrien, T., Beringer, M., Gumireddy, K., Gardini, A., Bussotti, G., Lai, F., Zytnicki, M., Noterdame, C., Huang, Q., et al.
(2010). Long Noncoding RNAs with Enhancer-Like Function in Human Cell 143, 46-58. Padeken, J., and Heun, P. (2014). Nucleolus and nuclear periphery: Velcro for heterochromatin. Curr. Opin. Cell Biol. 28, 54-60. Papantonis, A., and Cook, P. R. (2013). Transcription Factories: Genome Organization and Gene Regulation. Chem. Rev. 113,
8683-8705. Papathanasiou P, Perkins A.C., Cobb B.S. et al. (2003). Widespread failure of hematolymphoid differentiation caused by a
recessive niche-filling allele of the Ikaros transcription factor. Immunity, 19 (1) (2003), pp. 131-144. Parker SC, et al. (2013). Chromatin stretch enhancer states drive cell-specific gene regulation and harbor human disease risk
variants. Proc Natl Acad Sci U S A. 2013; 110:17921–17926. Patwardhan RP, Hiatt JB, Witten DM, et al., (2012). Massively parallel functional dissection of mammalian enhancers in vivo. Nat
Biotechnol. 2012; 30(3): 265–70. Payne, M.A. (2011). Zinc finger structure-function in Ikaros. World J Biol Chem, 2 (6) (2011), pp. 61-166. Pefanis E, Wang J, Rothschild G, Lim J, Kazadi D, Sun J, Federation A, Chao J, Elliott O, Liu ZP, Economides AN, Bradner JE,
Rabadan R, Basu U. RNAexosome-regulated long non-coding RNA transcription controls super-enhancer activity. Cell. 2015; 161:774–789.
Pekowska, A. Touati Benoukraf, Joaquin Zacarias-Cabeza, Mohamed Belhocine, Frederic Koch, Hélène Holota, Jean Imbert, Jean-
Christophe Andrau, Pierre Ferrier,a, and Salvatore Spicuglia.(2011). H3K4 tri-methylation provides an epigenetic signature of active enhancers. EMBO J. 2011 Oct 19; 30(20): 4198–4210.
Perissi V, Aggarwal A, Glass CK, Rose DW, Rosenfeld MG. A (2004). Corepressor / Coactivator Exchange Complex Required for
Transcriptional Activation by Nuclear Receptors and Other Regulated Transcription Factors. Cell. 2004;116:511–26. Petkovic S, Muller S. (2015). RNA circularization strategies in vivo and in vitro. Nucleic Acids Res. 2015; 43:2454–2465.

81
Pognonec, P., K. E. Boulukos, J. C. Gesquie`re, D. Ste´helin, and J. Ghysdael. (1988). Mitogenic stimulation of thymocytes results in
the calcium-dependent phosphorylation of c-Ets-1 proteins. EMBO J. 7:977. Ponjavic, J. et al. (2006). Transcriptional and structural impact of TATA-initiation site spacing in mammalian core
promoters.Genome Biol. 7, R78 (2006). Pott S, and Lieb JD. (2014). What are super-enhancers? Nature genetics. 2014;47:8–12. Pourcel C, Salvignol G, Vergnaud G. (2005). CRISPR elements in Yersinia pestis acquire new repeats by preferential uptake of
bacteriophage DNA, and provide additional tools for evolutionary studies. Microbiology 151:653–63. Rach, E. A. et al. (2011). Transcription initiation patterns indicate divergent strategies for gene regulation at the chromatin level.
PLoS Genet. 7, e1001274 (2011). Rada-Iglesias A, Bajpai R, Swigut T, Brugmann SA, Flynn RA, Wysocka J. (2011).A unique chromatin signature uncovers early
developmental enhancers in humans. Nature 2011, 470:279-283. Rammensee, H. G., and M. J. Bevan. (1984). Evidence from in vitro studies that tolerance to self antigens is MHC-restricted.
Nature 308:741. Ravasi T., Harukazu Suzuki, Carlo Vittorio Cannistraci, Shintaro Katayama, Vladimir B. Bajic, Kai Tan, Altuna Akalin, Sebastian
Schmeier.(2010) An Atlas of Combinatorial Transcriptional Regulation in Mouse and Man. Cell. Vol. 140, Issue 5, 5 March 2010, Pages 744–752.
Rebollo A., Schmitt C., (2003). Ikaros, Aiolos and Helios: transcription regulators and lymphoid malignancies. Immunol Cell Biol,
81 (3) (2003), pp. 171-175. Rinn, J.L. & Chang, H.Y. Genome regulation by long noncoding RNAs. Annu. Rev. Biochem. 81, 145–166 (2012). Robinson PJ, Rhodes D (2006) Structure of the ‘30 nm’ chromatin fibre: a key role for the linker histone. Curr Opin Struct Biol
16(3): 336-343. Rogakou EP, Boon C, Redon C, Bonner WM (1999) Megabase chromatin domains involved in DNA double-strand breaks in vivo. J
Cell Biol 146(5): 905-916. Rogakou EP, Pilch DR, Orr AH, Ivanova VS, Bonner WM (1998) DNA double stranded breaks induce histone H2AX
phosphorylation on serine 139. J Biol Chem 273(10): 5858-5868. Ronni T, Payne KJ, Ho S, et al. (2007). Human Ikaros function in activated T cells is regulated by coordinated expression of its
largest isoforms. J Biol Chem 2007;282 (4):2538–2547. Rossetto D, Avvakumov N, Côté J (2012) Histone phosphorylation: a chromatin modification involved in diverse nuclear events.
Epigenetics 7(10): 1098-1108. Rothenberg E. V. “T cell lineage commitment: identity and renunciation,” Journal of Immunology, vol. 186, no. 12, pp. 6649–
6655, 2011. Rothenberg EV, Moore JE, Yui MA.(2008). Launching the T-cell-lineage developmental programme. Nat.Rev. Immunol. 2008;
8:9–21. Ruan H . X, Cacheux-Rataboul V, Sung WK, Liu ET, Wei CL, Cheung E, Ruan Y.(2009). An oestrogen-receptor-alpha-bound human
chromatin interactome. Nature. 2009; 462:58–64. Ruthenburg AJ, Li H, Patel DJ, Allis CD (2005). Multivalent engagement of chromatin modifications by linked binding modules.
Nat Rev Mol Cell Biol 2007, 8:983-994. Sagai T, Hosoya M, Mizushina Y, Tamura M, Shiroishi T. (2005). Elimination of a long-range cis-regulatory module causes
complete loss of limb-specific Shh expression and truncation of the mouse limb.Development. 2005; 132:797–803. Sakabe NJ, Nobrega MA (2007). Genome-wide maps of transcription regulatory elements. Wiley Interdiscip Rev Syst Biol Med
2010, 2:422-437. Sandelin, A. et al. (2007). Mammalian RNA polymerase II core promoters: insights from genome-wide studies. Nature Rev.
Genet. 8, 424–436 (2007). Santiago David, Lan T.M. Dao, Lydie Pradel, Alexandre España, Salvatore Spicuglia (2017). Recent advances in high-throughput
approaches to dissect enhancer function. 2017 F1000 Faculty Reviews.

82
Sanyal A, Lajoie BR, Jain G, Dekker J. (2014). The long-range interaction landscape of gene promoters.Nature [Internet]. Nature
Publishing Group; 2012 Sep 6 [cited 2014 Jul 14];489(7414): 109–13. Sapranauskas R, Gasiunas G, Fremaux C, Barrangou R, Horvath P, Siksnys V. (2011). The Streptococcus thermophilus
CRISPR/Cas system provides immunity in Escherichia coli. Nucleic Acids Res. 39:9275–82. Satake, M., S. Nomura, Y. Yamaguchi-Iwai, Y. Takahama, Y. Hashimoto,M. Niki, Y. Kitamura, and Y. Ito. (1995). Expression of the
Runt domain-encoding PEBP2genes in T cells during thymic development. Mol. Cell. Biol. 15:1662. Schaukowitch K, et al. (2014). Enhancer RNA Facilitates NELF Release from Immediate Early Genes. Mol Cell. 2014; 56:29–42. Schilham, M. W., Oosterwegel M. A., Moerer P., Ya J., P. A. J. de Boer, M. van de Wetering, Verbeek S., Lamers W. H., Kruisbeek A.
M., Cumano A., et al (1996). Defects in cardiac outflow tract formation and pro-B-lymphocyte expansion in mice lacking Sox-4. Nature 380: 711.
Schmidt D, Wilson MD, Ballester B, Schwalie PC, Brown GD, Marshall A, Kutter C, Watt S, Martinez-Jimenez CP, Mackay S, et al.
(2010). Five-vertebrate ChIP-seq reveals the evolutionary dynamics of transcription factor binding. Science 328: 1036–1040. Schmitz KM, Mayer C, Postepska A, Grummt I (2010). Interaction of noncoding RNA with the rDNA promoter mediates
recruitment of DNMT3b and silencing of rRNA genes. Genes Dev. 2010; 24:2264–2269. Schones DE, Cui K, Cuddapah S, Roh TY, Barski A, Wang Z, Wei G, Zhao K (2008). Dynamic regulation of nucleosome positioning
in the human genome.Cell 2008, 132:887-898. Sebzda, E., S. Mariathasan, T. Ohteki, R. Jones, M. F. Bachmann, and P. S. Ohashi.(1999). Selection of the T cell repertoire. Annu
Rev Immunol 17:829. Sellars McL, Kastner P, Chan S. (2011). Ikaros in B cell development and function. World J Biol Chem 2011;2(6):32–139. Sexton T., E. Yaffe, E. Kenigsberg, F. Bantignies, B. Leblanc, M. Hoichman, H.Parrinello, A.Tanay, G. Cavalli. (2012) Three-
Dimensional Folding and Functional Organization Principles of the Drosophila Genome.Cell,148 (2012), pp. 458-472. Sexton, T. and Cavalli, G. (2015). The role of Chromosome Domains in Shaping the Functional Genome. Cell 160, 1049–1059. Sha, W. C., C. A. Nelson, R. D. Newberry, D. M. Kranz, J. H. Russell, and D. Y. Loh. (1988). Selective expression of an antigen
receptor on CD8-bearing T lymphocytes in transgenic mice. Nature 335:271. Shahbazian, M.D., and Grunstein, M. (2007). Functions of site-specific histone acetylation and deacetylation.Annual Review of
Biochemistry 76:75–100, 2007. Shlyueva D, Stelzer C, Gerlach D, et al.(2014).Hormone-responsive enhancer-activity maps reveal predictive motifs, indirect
repression, and targeting of closed chromatin. Mol Cell. 2014; 54(1):180–92. Shlyueva D., Stampfel G. and Stark A.,(2014). Transcriptional enhancers: from properties to genome-wide predictions. Nat. Rev.
Genet.15, 272–286 (2014) doi:10.1038/nrg3682. Shuman S, Glickman MS. (2007). Bacterial DNA repair by non-homologous end joining.Nat. Rev.Microbiol. 5:852–61. Simeone, A., A. Daga, and F. Calabi. (1995). Expression of runt in the mouse embryo. Dev. Dyn. 203:61. Simonis, M., Klous, P., Splinter, E., Moshkin, Y., willemsen, R., de Wit, E., van Steensel, B., and de Laat, W. (2006). Nuclear
organization of active and inactive chromatin domains uncovered by chromosome conformation capture-on- chip (4C). Nat. Genet. 38, 1348-1354.
Smith MA, Gesell T, Stadler PF, Mattick JS.(2013). Widespread purifying selection on RNA structure in mammals. Nucleic Acids
Res. 2013; 41:8220–8236. Smith RP, Taher L, Patwardhan RP, et al. (2013). Massively parallel decoding of mammalian regulatory sequences supports a
flexible organizational model. Nat Genet. 2013; 45(9): 1021–8. Spilianakis, C.G., and Flavell, R.A. (2004). Long-range intrachromosomal interactions in the T helper type 2 cytokine locus. Nat.
Immunol. 5, 1017-1027. Spizzo, R., Almeida, M.I., Colombatti, A. & Calin, G.A.(2012). Long non-coding RNAs and cancer: a new frontier of translational
research? Oncogene 31,4577–4587 (2012).

83
Splinter, E., Wit, E. de, Nora, E.P., Klouse, P., Werken, H.J.G. van de, Zhu, Y., Kaaij, L.J.T., IJcken, W. van,Gribnau, J., Heard, E., et al.
(2011). The inactive X chromosome adopts a unique three-dimensional conformation that is dependent on Xist RNA. Genes Dev.25,1371-1383.
Staal FJ, Luis TC, Tiemessen MM. WNT signalling in the immune system: WNT is spreading its wings. Nat Rev Immunol
2008a;8:581–593. Staal FJ, Sen JM. (2008). The canonical Wnt signaling pathway plays an important role in lymphopoiesis and hematopoiesis. Eur
J Immunol 2008b;38:1788–1794. Stadhouders R, Thongjuea S, Andrieu-Soler C, Palstra RJ, Bryne JC, van den Heuvel A, Stevens M, de Boer E, Kockx C, van der
Sloot A, van den Hout M, van Ijcken W, Eick D, Lenhard B, Grosveld F, Soler E. (2012). Dynamic long-range chromatin interactions control Myb proto-oncogene transcription during erythroid development. EMBO J. 2012 Feb 15;31(4):986-99. doi: 10.1038/emboj.2011.450.
Sun L, Goodman P.A, Wood C.M. et al.(1999). Expression of aberrantly spliced oncogenic Ikaros isoforms in childhood acute
lymphoblastic leukemia. J Clin Oncol, 17 (12) (1999), pp. 3753-3766. Sun, L., Liu, A., and Georgopoulos, K. (1996). Zing finger-mediated protein interactions modulate Ikaros activity, a molecular
control of lymphocyte development. EMBO J 15, 5358-5369. Sun L, Liu A, Georgopoulos K.,(1996). Zinc finger-mediated protein interactions modulate Ikaros activity, a molecular control of
lymphocyte development. EMBO J, 15 (19) (1996), pp. 5358-5369. Sun L., Heerema N., Crotty L., et al.(1999). Expression of dominant-negative and mutant isoforms of the antileukemic
transcription factor Ikaros in infant acute lymphoblastic leukemia. Proc Natl Acad Sci U S A, 96 (2) (1999), pp. 680-685.
Sun, W., B. J. Graves, and N. A. Speck. 1995. Transactivation of the Moloneymurine leukemia virus and T-cell receptor-chain
enhancers by cbf and etsrequires intact binding sites for both proteins. J. Virol. 69:4941. Suzuki H., Richard A. Young and Phillip A. Sharp.(2017). Super-Enhancer-Mediated RNA Processing Revealed by Integrative
MicroRNA Network Analysis. Cell 168, 1000–1014. Takayama K, et al. (2013). Androgen-responsive long noncoding RNA CTBP1-AS promotes prostate cancer. EMBO J. 2013;
32(12):1665–80. Tanaka, T., K. Tanaka, S. Ogawa, M. Kurokawa, K. Mitani, J. Nishida,Y. Shibata, Y. Yazaki, and H. Hirai. (1995). An acute myeloid
leukemia gene,AML1, regulates hemopoietic myeloid cell differentiation and transcriptional ac-tivation antagonistically by two alternative spliced forms. EMBO J. 14:341.
Taniuchi, I., M. Osato, T. Egawa, M. J. Sunshine, S. C. Bae, T. Komori, Y. Ito,and D. R. Littman. (2002). Differential requirements for
Runx proteins in CD4repression and epigenetic silencing during T lymphocyte development. Cell111:621. Tefferi A,(2010). Novel mutations and their functional and clinical relevance in myeloproliferative neoplasms: JAK2, MPL, TET2,
ASXL1, CBL, IDH and IKZF1. Leukemia, 24 (6) (2010), pp. 1128-1138. Teh, H. S., P. Kisielow, B. Scott, H. Kishi, Y. Uematsu, H. Bluthmann, and H. von Boehmer. (1988). Thymic major
histocompatibility complex antigens and the alpha beta T-cell receptor determine the CD4/CD8 phenotype of T cells. Nature 335:229.
TernsMP, Terns RM. (2011). CRISPR-based adaptive immune systems. Curr. Opin.Microbiol. 14:321–27. Thomas Shafee and Rohan Lowe. (2017). Eukaryotic and prokaryotic gene structure. WikiJournal of Medicine, 2017, 4(1):2 doi:
10.15347/wjm/2017.002. Thurman RE, Rynes E, Humbert R, Vierstra J, Maurano MT, Haugen E, et al.(2012). The accessible chromatin landscape of the
human genome.Nature [Internet]. Nature Publishing Group; 2012 Sep 6 [cited 2014 Feb 19]; 489(7414):75–82. Tolhuis, B., Palstra, R.J., Splinter, E., Grosveld, F., and de Laat, W. (2002). Looping and Interaction between Hypersensitive Sites
in the Active β-globin Locus. Mol. Cell 10, 1453-1465. Ulitsky I, Bartel DP.(2013). lincRNAs: genomics, evolution, and mechanisms. Cell. 2013; 154(1):26–46. Umetsu SE, Winandy S. (2009). Ikaros is a regulator of il10 expression in CD4+ T cells. J Immunol 2009;183(9): 5518–5525.

84
Valen, E. & Sandelin, A. (2011). Genomic and chromatin signals underlying transcription start-site selection. Trends Genet. 27,
475–485 (2011). van Attikum H, Fritsch O, Gasser SM (2007). Distinct roles for SWR1 and INO80 chromatin remodeling complexes at
chromosomal double-strand breaks. EMBO J 26(18): 4113-4125. van de Werken, H.J.G., Landan, G., Holwerda, S.J.B., Hoichman, M. Klous, P., Chachik, R., Splinter, E., Valdes-Quezada, C., Oz, Y.,
Bouwman, B.A.M., et al. (2012). Robust 4C-seq data analysis to screen for regulatory DNA interactions. Nat. Methods 9, 969-972.
van de Wetering, M., M. Oosterwegel, D. Dooijes, H. Clevers. (1991). Identification and cloning of TCF-1, a T cell-specific
transcription factor containing a sequence-specific HMG box. EMBO J. 10: 123. Van Kaer, L., P. G. Ashton-Rickardt, H. L. Ploegh, and S. Tonegawa. (1992). TAP1 mutant mice are deficient in antigen
presentation, surface class I molecules, and CD4-8+ T cells. Cell 71:1205. van Meerwijk, J. P., S. Marguerat, R. K. Lees, R. N. Germain, B. J. Fowlkes, and H. R. MacDonald. (1997). Quantitative impact of
thymic clonal deletion on the T cell repertoire. J Exp Med 185:377. Varier, R.A., and Timmers, H.T. (2011).Histone lysine methylation and demethylation pathways in cancer.Biochimica et
Biophysica Acta 1815:75–89, 2011. Velculescu V, Madden S, Zhang L, Lash A, Yu J, Volgelstein B, et al. (1999). Analysis of human transcriptomes. Nat Genet. 1999;
23(december):387. Venter, J.C., Adams, M.D., Myers, E.W., Li, P.W., Mural, R.J., Sutton, G.G., Smith, H.O., Yandell, M., Evans, C.A., Holt, R.A., et al. (2001).
The sequence of the human genome. Science 291, 1304-1351. Verbeek, S., D. Izon, F. Hofhuis, E. Robanus-Maandag, H. te Riele, M. van de Wetering, M. Oosterwegel, A. Wilson, H. R. MacDonald,
H. Clevers. (1995). An HMG-box-containing T-cell factor required for thymocyte differentiation. Nature 374: 70.
Vickaryous MK,Hall BK. (2006). Human cell type diversity, evolution, development, and classification with special reference to cells derived from the neural crest. Biol Rev Camb Philos Soc. 2006;81 (June): 425 55.
Visel, A.; Blow, M.J.; Li, Z.; Zhang, T.; Akiyama, J.A.; Holt, A.; Plajzer-Frick, I.; Shoukry, M.; Wright, C.; Chen, F., et al. (2009). ChIP-
seq accurately predicts tissue-specific activity of enhancers. Nature 457,854-858. Volpe TA, Kidner C, Hall IM, Teng G, Grewal SI, Martienssen RA. (2002). Regulation of heterochromatic silencing and histone H3
lysine-9 methylation by RNAi. Science. 2002; 297:1833–1837. Wagner, T., Wirth J., Meyer J., Zabel B., Held M., Zimmer J., Pasantes J., Bricarelli F. D., Keutel J., Hustert E., et al (1994). Autosomal
sex reversal and campomelic dysplasia are caused by mutations in and around the SRY-related gene SOX9. Cell 79: 1111.
Wang D, et al. (2011). Reprogramming transcription by distinct classes of enhancers functionally defined by eRNA. Nature. 2011; 474:390–394.
Wang D, et al. (2006). The basic helix-loop-helix transcription factor HEBAlt is expressed in pro-T cells and enhances the
generation of T cell precursors. J Immunol. 2006; 177:109–19. Wang JH1, Nichogiannopoulou A, Wu L, Sun L, Sharpe AH, Bigby M, Georgopoulos K.(1996). Selective defects in the development
of the fetal and adult lymphoid system in mice with an Ikaros null mutation. Immunity. 1996 Dec;5(6):537-49. Wang Y, Zhang ZT, Seo SO, Choi K, Lu T, et al. (2015).Markerless chromosomal gene deletion in Clostridium beijerinckii using
CRISPR/Cas9 system. J. Biotechnol. 200:1–5. Wang, S., Q. Wang, B. E. Crute, I. N. Melnikova, S. R. Keller, and N. A. Speck.(1993). Cloning and characterization of subunits of the
T-cell receptor and murineleukemia virus enhancer core-binding factor. Mol. Cell. Biol. 13:3324. Wenyan Jiang and Luciano A. Marraffini (2015). CRISPR-Cas: New Tools for Genetic Manipulation from Bacterial Immunity
Systems. Annu. Rev. Microbiol. 69: 209-228. Whyte WA, et al. 2013). Master transcription factors and mediator establish super-enhancers at key cell identity genes. Cell.
2013; 153:307–319. Williams, S., (2013). Epigenetics. Proceedings of the National Academy of Sciences, 110: 3209.

85
Willinger T, et al. (2006). Human naive CD8 T cells down-regulate expression of the WNT pathway transcription factors
lymphoid enhancer binding factor 1 and transcription factor 7 (T cell factor-1) following antigen encounter in vitro and in vivo. J Immunol 2006; 176:1439–1446.
Winandy S, Wu L, Wang J, Georgopoulos K. (1999). Pre-T cell receptor (Tcr) and Tcr-controlled checkpoints in T cell
differentiation are set by Ikaros. The Rockefeller University Press. J Exp Med 1999; 190(8):1039–1048. Winandy S, Wu P, Georgopoulos K (1995). A dominant mutation in the Ikaros gene leads to rapid development of leukemia and
lymphoma.Cell, 83 (2) (1995), pp.289-299. Wojciechowski J, Lai A, Kondo M, Zhuang Y. (2007). E2A and HEB are required to block thymocyte proliferation prior to pre-TCR
expression. J Immunol. 2007; 178:5717–5726. Wong WF1, Kohu K, Chiba T, Sato T, Satake M. (2011). Interplay of transcription factors in T-cell differentiation and function:
the role of Runx. Immunology. 2011 Feb; 132(2):157-64. Wong WF1, Kurokawa M, Satake M, Kohu K. (2011). Down-regulation of Runx1 expression by TCR signal involves an
autoregulatory mechanism and contributes to IL-2 production. J Biol Chem. 2011 Apr 1; 286(13):11110-8. Woolf, E., C. Xiao, O. Fainaru, J. Lotem, D. Rosen, V. Negreanu, Y. Bernstein,D. Goldenberg, O. Brenner, G. Berke, D. Levanon, and Y.
Groner. 2011). Runx3 and Runx1 are required for CD8 T cell development during thymopoiesis. Proc.Natl. Acad. Sci. USA 100:7731.World J Biol Chem, 2 (6) (2011), pp. 32-139.
Wu B, Crampton SP, Hughes CC. (2007). Wnt signaling induces matrix metalloproteinase expression and regulates T cell
transmigration. Immunity 2007;26:227–239. Wurtele, H., and Chartrand, P. (2006). Genome- wide scanning of HoxB1-associated loci in mouse Es cells using an open-ended
Chromosome Conformation Capture methodology. Chromosome Res. 14,477-495. Xu Y, Banerjee D, Huelsken J, Birchmeier W, Sen JM.(2003). Deletion of β-catenin impairs T cell development. Nat Immunol
2003; 4:1177–1182. Yáñez-Cuna JO, Arnold CD, Stampfel G, et al.(2014). Dissection of thousands of cell type-specific enhancers identifies
dinucleotide repeat motifs as general enhancer features. Genome Res. 2014; 24(7): 1147–56. Yap W., Yeoh E., Tay A. et al. (2005). STAT4 is a target of the hematopoietic zinc-finger transcription factor Ikaros in T cells.
FEBS Lett, 579 (20) (2005), pp. 4470-4478. Zabidi MA, Arnold CD, Schernhuber K, et al. (2015). Enhancer-core-promoter specificity separates developmental and
housekeeping gene regulation. Nature.2015; 518(7540):556–9. Zaldumbide A, Francoise Carlotti, Philippe Pognonec, and Kim E. Boulukos (2002). The Role of the Ets2 Transcription Factor in
the Proliferation, Maturation, and Survival of Mouse Thymocytes. J Immunol 2002; 169:4873-4881; doi: 10.4049/jimmunol.169.9.4873.
Zhang W, et al. (2012).Bromodomain-containing protein 4 (BRD4) regulates RNA polymerase II serine 2 phosphorylation in
human CD4+ T cells. J Biol Chem. 2012; 287:43137–43155. Zhang Y, Zhang XO, Chen T, Xiang JF, Yin QF, Xing YH, Zhu S, Yang L, Chen LL. (2013). Circular intronic long noncoding RNAs. Mol
Cell. 2013; 51:792–806. Zhang, K., and Dent, S.Y. (2005). Histone modifying enzymes and cancer: Going beyond histones. Journal of Cellular Biochemistry
96:1137–1148, 2005. Zhao H, Dean A (2005). Organizing the genome: enhancers and insulators. Biochem Cell Biol 2005, 83:516-524. Zhao, Z., Tavoosidana, G., Sjolinder, M., Gondor, A., Mariano, P., Wang, S., Kanduri, C., Lezcano, M., Singh Sandhu, K., Singh, U., et
al. (2006). Circular Chromosome Conformation Capture (4C) uncovers extensive networks of epigenetically regulated intra- and interchromosomal interactions. Nat. Genet. 38, 1341-1347.
Zhu X., Asa S.L., Ezzat S. ,(2007). Ikaros is regulated through multiple histone modifications and deoxy ibonucleic acid
methylation in the pituitary. Mol Endocrinol, 21 (5) (2007), pp. 1205-1215. Zijlstra, M., M. Bix, N. E. Simister, J. M. Loring, D. H. Raulet, and R. Jaenisch. (1990). Beta 2-microglobulin deficient mice lack CD4-
8+ cytolytic T cells. Nature 344:742.

86
ANNEX

Nature GeNetics VOLUME 49 | NUMBER 7 | JULY 2017 1073
Regulation of mammalian gene transcription is accomplished through the involvement of transcription start site (TSS)-proximal (promoter) and TSS-distal (enhancer) regulatory elements1. The original defini-tion of a promoter entails the capability to induce local gene expres-sion, whereas the term enhancer implies the property of activating gene expression at a distance. However, this basic dichotomy of cis-regulatory elements has been challenged by broad similarities between promoters and enhancers, such as DNA sequence features, chroma-tin marks, RNA polymerase II (Pol II) recruitment and bidirectional transcription1–5. Despite several findings suggesting that promoters might display enhancer activity6–15, including experimental observa-tions that enhancer elements can work as alternative promoters16, it is unclear what fraction of promoters is concerned by this property and whether their enhancer activity is involved in distal gene regulation. The advent of high-throughput reporter assays, such as STARR-seq13, has enabled the identification of enhancer activity solely on the basis of functionality instead of using epigenomics or location criteria17. We previously developed CapStarr-seq18, a strategy coupling capture of a region of interest with STARR-seq, allowing efficient assessment of enhancer activity in mammals. By performing CapStarr-seq in several mammalian cell lines, we found that 2–3% of coding-gene promoters display enhancer activity in a given cell line. In comparison to classical promoters and distal enhancers, these TSS-overlapping enhancers (hereafter referred to as Epromoters) displayed distinct genomic and epigenomic features and were associated with stress
response. By using comprehensive CRISPR–Cas9 genomic deletions, we demonstrated that Epromoters are involved in the cis regulation of the expression of distal genes in their natural context, therefore func-tioning as bona fide enhancers. Furthermore, human genetic varia-tion within Epromoters was associated with a strong effect on distal gene expression. We suggest that regulatory elements with dual roles as transcriptional promoters and enhancers might ensure rapid and coordinated regulation of gene expression. These finding will enhance understanding of complex gene regulation in normal development and diseases and of how genetic variation influences the control of gene expression programs.
RESULTSMouse TSS-proximal DHSs display enhancer activityTo further decipher the complex relationship between proximal and distal regulatory regions for coding genes, we compared the propor-tions of enhancer activity for subsets of proximal and distal DNase I–hypersensitive sites (DHSs) in T cell precursors based on our previ-ously published CapStarr-seq experiments performed in the mouse P5424 T cell and NIH-3T3 fibroblast cell lines13,18 (Fig. 1a,b and Supplementary Table 1). We observed that the proportions of DHSs with enhancer activity were very similar for the proximal (<1 kb from the TSS) and distal subsets in P5424 cells (Fig. 1c, left). To avoid artifactual calling of enhancer activity due to sporadic tran-scription from the vector19 or initiation from the promoter itself,
Genome-wide characterization of mammalian promoters with distal enhancer functionsLan T M Dao1,6,7, Ariel O Galindo-Albarrán1,7 , Jaime A Castro-Mondragon1, Charlotte Andrieu-Soler2–4, Alejandra Medina-Rivera5, Charbel Souaid1 , Guillaume Charbonnier1, Aurélien Griffon1, Laurent Vanhille1, Tharshana Stephen2,4, Jaafar Alomairi1, David Martin4, Magali Torres1, Nicolas Fernandez1, Eric Soler2–4, Jacques van Helden1 , Denis Puthier1 & Salvatore Spicuglia1
Gene expression in mammals is precisely regulated by the combination of promoters and gene-distal regulatory regions, known as enhancers. Several studies have suggested that some promoters might have enhancer functions. However, the extent of this type of promoters and whether they actually function to regulate the expression of distal genes have remained elusive. Here, by exploiting a high-throughput enhancer reporter assay, we unravel a set of mammalian promoters displaying enhancer activity. These promoters have distinct genomic and epigenomic features and frequently interact with other gene promoters. Extensive CRISPR–Cas9 genomic manipulation demonstrated the involvement of these promoters in the cis regulation of expression of distal genes in their natural loci. Our results have important implications for the understanding of complex gene regulation in normal development and disease.
1Aix-Marseille University, INSERM, TAGC, UMR 1090, Marseille, France. 2INSERM, UMR 967, CEA/DRF/iRCM, Laboratory of Molecular Hematopoiesis, Université Paris–Diderot, Université Paris–Saclay, Fontenay-aux-Roses, France. 3Labex GR-Ex, Université Sorbonne Paris Cité, Paris, France. 4IGMM, CNRS, Université de Montpellier, Montpellier, France. 5Laboratorio Internacional de Investigación sobre el Genoma Humano, Universidad Nacional Autónoma de México, Juriquilla, Mexico. 6Present address: Vinmec Research Institute of Stem Cell and Gene Technology, Hanoi, Vietnam. 7These authors contributed equally to this work. Correspondence should be addressed to S.S. ([email protected]).
Received 10 January; accepted 1 May; published online 5 June 2017; doi:10.1038/ng.3884
A rt i c l e s©
201
7 N
atu
re A
mer
ica,
Inc.
, par
t o
f S
pri
ng
er N
atu
re. A
ll ri
gh
ts r
eser
ved
.

1074 VOLUME 49 | NUMBER 7 | JULY 2017 Nature GeNetics
A rt i c l e s
the STARR-seq procedure was implemented to ensure that the tran-scripts quantified initiated from the synthetic SCP1 promoter and were polyadenylated9,13,18. Reporter assays of CapStarr-seq-defined proximal enhancers confirmed their enhancer activity regardless of their orientation (Fig. 1d and Supplementary Fig. 1a). Distal enhancers identified in the P5424 T cell line were significantly enriched for lymphoid transcription factors, whereas proximal enhancers were generally depleted of these factors (Supplementary Fig. 1b), suggesting that the latter differ from classical distal enhancers. Consistently, the percentage of proximal T cell DHSs with enhancer activity in NIH-3T3 cells was higher than that for distal DHSs (Fig. 1c, right). Moreover, proximal enhancers in P5424 cells were found to be active more often in NIH-3T3 cells than distal enhancers (Fig. 1e)
and the proportion of proximal enhancers active in both cell lines was highly significant (P = 1.8 × 10−106, hypergeometric test; Fig. 1b), sug-gesting that proximal enhancers are less specific to tissue type.
Notably, proximal enhancers were over-represented from −300 bp to +100 bp with respect to the TSS (Fig. 1f), roughly overlapping the core promoter regions where sense and antisense transcription initia-tion occurs and transcription factors usually bind10,20,21. Collectively, these results suggest that TSS-overlapping regions displaying enhancer activity, here defined as Epromoters, might represent regulatory ele-ments with dual promoter and enhancer functions.
Assessment of the enhancer activity of coding-gene promotersTo characterize Epromoters in an unbiased manner, we performed CapStarr-seq with all promoters of RefSeq-defined human coding genes (−200 to +50 bp with respect to the TSS) in the two ENCODE cell lines K562 and HeLa (Fig. 2a and Supplementary Fig. 2a,b). The enhancer activity of each captured region was calculated as the fold change of the STARR-seq signal over the input signal. We observed high correlation between replicates in both cell lines (Fig. 2b). Epromoters were defined as promoters for which the fold change in signal for both replicates was beyond the inflexion point of ranked promoters (Online Methods). Using these stringent criteria, we found 632 (3%) and 493 (2.37%) Epromoters among 20,719 pro-moters analyzed in K562 and HeLa cells, respectively (Fig. 2b,c and Supplementary Table 2). Remarkably, a highly significant propor-tion of Epromoters were found in both cell types, suggesting a rather ubiquitous activity. No difference in the percentage of these promoters overlapping CpG islands or in the phylogenetic conservation of these promoters among mammalian species was observed as compated to non-Epromoters (Supplementary Fig. 2c).
14%
52%
34% 41%
45%
14%
Strong enhancer in P5424
STARR-seq signal in NIH-3T3
Proximal
Strong
e f
0
20
40
60
80
100
STARR-seqactivity
Inac
tive
Active
1/6
6/6%
pos
itive
inre
port
er a
ssay
pSV40 Luc pA
~2.7 kb
Tested candidatesdE
nric
hmen
t sco
re
–1,000 bp +1,000 bp
[–300; +100]
TSS
211815129630
–3
0
2
4
6
8
Proxim
al
Distal
P5424
% o
f DH
Ss
with
str
ong
enha
ncer
act
ivity
c
a
Transfection
Targeted RNA–seq
NIH-3T3 P5424
DHSs(T cells)
GFP pA
Capture
Cloning
Genomic library b Proximal
16
8
4
2
1
0.5
0.25
16
8
4
2
1
0.5
0.250.5
P5424
NIH
-3T
3
Distal
P5424
NIH
-3T
3
0
2
4
6
8
Proxim
al
Distal
NIH-3T3
% o
f DH
Ss
with
str
ong
enha
ncer
act
ivity
InactiveWeak
Distal
1 2 4 8 16 0.5 1 2 4 8 16
34%29%
8%30% 18%50%
19%13%
Figure 1 Comparison of proximal and distal DHSs with enhancer activity in two mouse cell lines. (a) Schematic of the CapStarr-seq protocol to assess the enhancer activity of promoters in NIH-3T3 and P5424 cells. (b) Scatterplots showing the STARR-seq signal (log2 scale) in P5424 and NIH-3T3 cells for proximal (left; 1,546 regions) and distal (right; 5,605 regions) DHSs. DHSs with enhancer activity in both cell lines (brown) or with activity specific to P5424 (purple) or NIH-3T3 (blue) cells are highlighted. DHSs with no enhancer activity are shown in gray. Quadrant panels show the percentage of regions in each subgroup. (c) Percentage of TSS-proximal and TSS-distal DHSs with strong enhancer activity (fold change >3) based on STARR-seq signal in P5424 (left) and NIH-3T3 (right) cells. (d) Top, reporter assay constructs. Bottom, summary of luciferase enhancer assays of proximal DHSs defined as active or inactive enhancers by STARR-seq in P5424 cells; detailed results are shown in supplementary Figure 1a. Numbers correspond to the number of positive sites out of those tested. (e) Pie charts showing the distribution of enhancer activity in NIH-3T3 cells for the strong enhancers from TSS-proximal and TSS-distal DHSs identified in P5424 cells. (f) Distribution of the statistical enrichment of TSS-proximal DHSs for enhancer activity in NIH-3T3 cells. The significantly enriched region around the TSS is highlighted (P < 0.001, hypergeometric test).
a
Transfection
Targeted RNA–seq
HeLa K562
RefSeqpromoters
GFP
Capture
Cloning
Genomic library
b K562
0.25
r = 0.90
0.5 842
4
1
0.5
1
2
8 HeLar = 0.70
0.5 8421 16
1
2
4
8
16
0.5
0.25
Replicate 1
Rep
licat
e 2
Replicate 1
Rep
licat
e 2
cK562 HeLa
146486 347
P = 1 × 10–99
pA
Figure 2 CapStarr-seq with human promoters. (a) Schematic of the CapStarr-seq strategy to assess the enhancer activity of human promoters in K562 and HeLa cells. (b) Scatterplots showing the correlation of two STARR-seq replicates in K562 (left) and HeLa (right) cells. The data plotted are the fold change in STARR-seq signal over the input signal (log2 scale). Promoters with enhancer activity in both replicates are shown in brown. Random genomic regions (green) did not display enhancer activity in these assays. (c) Venn diagram showing the number of Epromoters found in K562 and HeLa cells. The hypergeometric test P value for the overlap between the two sets is shown.
© 2
017
Nat
ure
Am
eric
a, In
c., p
art
of
Sp
rin
ger
Nat
ure
. All
rig
hts
res
erve
d.

Nature GeNetics VOLUME 49 | NUMBER 7 | JULY 2017 1075
A rt i c l e s
Epromoters display specific genomic and epigenomic featuresWe next compared the epigenomic features of Epromoters with those of a set of matched control promoters chosen from a list of common promoters lacking enhancer activity in all replicates of both cell lines (non-Epromoters) but associated with genes with similar expression levels (Supplementary Table 2). Although Epromoters displayed similar levels of DNase I hypersensitivity and histone H3 trimethyla-tion at lysine 4 (H3K4me3) signal as the control promoters, they were generally enriched for the enhancer-associated features monomethyla-tion of histone H3 at lysine 4 (H3K4me1), acetylation of histone H3 at lysine 27 (H3K27ac) and p300 binding (Fig. 3a and Supplementary Fig. 2d). Consistent with these findings, Epromoters displayed a higher H3K27ac/H3K4me3 ratio (Fig. 3b) and were preferentially associated with a strong enhancer state in different ENCODE cell lines (Supplementary Fig. 2e). Moreover, Epromoters had a higher H3K27ac/H3K4me3 ratio in the cell type where they were found to be active (Fig. 3c). There was no significant bias of RefSeq-defined TSSs at Epromoters, as assessed by cap analysis of gene expression (CAGE) (Supplementary Fig. 2f,g), and 94.2% and 95.7% of K562 and HeLa Epromoters, respectively, overlapped with a TSS defined by the FANTOM consortium22 (Supplementary Fig. 2h and Supplementary Table 2). However, 42.7% and 18.2% of the Epromoters active in HeLa and K562 cells lacked a TSS in the respective cell line. This might sug-gest that not all Epromoters are transcriptionally active (see below), although we cannot formally exclude the possibility that some indi-vidual cases could actually be promoter-proximal enhancers owing
to sites being incorrectly annotated as TSSs. While the majority of Epromoters were found in genes with only one TSS, a substantial pro-portion were located in genes with two or more TSSs (Supplementary Fig. 2i), reminiscent of previous findings suggesting that alternative promoters might work as enhancers16. By analyzing 5′ global run-on with sequencing (5′ GRO–seq) data from HeLa cells20, we found that the proportion of Epromoters with divergent transcripts was higher than that for control promoters (P = 3.1 × 10⁻⁵, hypergeometric test; Fig. 3d). Moreover, unstable divergent transcripts, which have been shown to be a hallmark of active enhancers3, were over-represented among K562 Epromoters (P = 5.8 × 10⁻⁸, hypergeometric test; Fig. 3e). Altogether, the Epromoters defined by STARR-seq activity showed clear chromatin-associated enhancer features.
Gene Ontology (GO) analysis for Epromoter-associated genes prima-rily showed enrichment for basic processes (Fig. 3f and Supplementary Table 3), consistent with a previous STARR-seq study in Drosophila melanogaster reporting that many promoters of housekeeping genes can function as enhancers9. We also observed a significant enrich-ment (P < 0.05) for the cellular stress response in both cell lines. K562 Epromoters were particularly associated with genes encoding actin-binding cytoskeleton proteins, which have been shown to be rapidly and transiently upregulated upon heat shock response23, whereas HeLa Epromoters were specifically associated with genes involved in type I and II interferon responses. Indeed, the main interferon-related genes were associated with Epromoters in HeLa cells, including MX1, IRF9, JUND, ISG15, OAS and the IFIT cluster of genes. Epromoter-associated
g
Enrichment score
K562 n = 218 HeLa n = 71
GATA2ATF3STAT5AFOSL1CEBPBMEF2ATEAD4ZBTB7AFOS
HCFC1JUNDJUNUSF2ELK1CEBPBELK4GABPASTAT3MYCZKSCAN1ZNF143
P < 0.001 P < 0.001
–6 0 12
h Epromoter
Control (same exp.)Common
0 20 40 60
Den
sity
K562
3 × 10⁻⁹
5 × 10⁻⁸
2 × 10⁻²
>>
0.34
Number of TFs
Den
sity
HeLa
0 10 20 30Number of TFs
>>
a bEpromoter Control (same exp.)
K562
Cum
ulat
ive
freq
uenc
y
2 × 10⁻⁹> 2 × 10⁻⁸>
0
400
200
H3K27ac/H3K4me3
–3 0 3
HeLa
H3K27ac/H3K4me3
Cum
ulat
ive
freq
uenc
y
–3 0 30
400
200
Control (same exp.)
10
20
30
–5 0 5
K562 p300
Epromoter
P = 0.01
Distance (kb)
Sca
led
sign
al
3
4
5
6
7
8HeLa p300
−5 0 5
P = 4.7 × 10⁻⁹
Distance (kb)
Sca
led
sign
al
d
14326
626
23
5339
Epromoter Control(same exp.)
None AntisenseUnidirectional Divergent
e
S–S S–U U–S U–U05
101520253035
Epromoter
Control (same exp.)
Per
cent
age
–log10 (P value)
Actin filament–based processResponse to stress
Protein localization to nucleusTranscription from RNA Pol II
Reg. of macromol. met. process
1–log10 (P value)
0 42 3 5
K562
Cellular metabolic processViral process
Organelle assemblyRegulation of cell death
Defense response to virusResponse to stress
Interferon-α/β signalingCytoplasmic transport
Nonsense-mediated decay (NMD) HeLa
10 42 3 5
c
K562 signal Hela signal
Med
ian−
norm
aliz
ed
log 2
(H3K
27ac
/H3K
4me3
)
–4
–2
0
2
4
6 2.2 × 10⁻¹⁶
1.2 × 10⁻⁴
8.4 × 10⁻⁹
2.2 × 10⁻¹⁶
Epromoters only in HeLaK562
f
0
0.1
0.2
0
0.04
0.08
100
300
500600
80
8
Figure 3 Genomic and epigenomic properties of Epromoters. (a) Average profiles of p300 in K562 (left) and HeLa (right) cells centered on the TSSs of Epromoters or control promoters with the same expression pattern for associated genes. Statistically significant differences were calculated for a region centered on the TSS (±250 bp) using two-sided Mann–Whitney U tests. (b) Cumulative plots showing the H3K27ac/H3K4me3 ratio at Epromoter and control sets in K562 (left) and HeLa (right) cells (Kolmogorov test). (c) H3K27ac/H3K4me3 ratios at Epromoters as a function of cell type (Mann–Whitney U test). Central values represent the median of the signal, the interquartile range (IQR) corresponds to the 75th to 25th percentile, and whiskers extend to the maximum and minimum values excluding outliers. (d) Percentage of the Epromoter and control sets corresponding to the TSS clusters from 5′ GRO–seq data defined by transcript overlap and orientation in HeLa cells. (e) Proportion of TSS pairs from each stability class (U, unstable; S, stable) associated with Epromoters and control sequences (with the same expression) in K562 cells. (f) Significantly enriched biological processes for Epromoter-associated genes in K562 (top) and HeLa (bottom) cells identified using g:Profiler. (g) Transcription factor enrichment (ENCODE data sets) at Epromoters in K562 and HeLa cells (two-sided Mann–Whitney U test). (h) Density plots showing the number of transcription factors (TFs) per promoter type in K562 (left) and HeLa (right) cells. ‘Common’ refers to the set of Epromoters active in both cell lines (Kolmogorov test).
© 2
017
Nat
ure
Am
eric
a, In
c., p
art
of
Sp
rin
ger
Nat
ure
. All
rig
hts
res
erve
d.

1076 VOLUME 49 | NUMBER 7 | JULY 2017 Nature GeNetics
A rt i c l e s
genes from HeLa cells were also enriched for transcriptional signa-tures including interferon- and tumor necrosis factor (TNF)-induced genes (Supplementary Fig. 3c). Differences in functional enrichment between K562 and HeLa cells might rely on cell-line-specific contexts. Indeed, interferon response genes are highly expressed in HeLa cells but not in K562 cells (Supplementary Fig. 3a,b), consistent with the fact that HeLa cells originated from a papillomavirus-infected tumor. We next assessed transcription factor enrichment at Epromoters using ENCODE data (Fig. 3g, Supplementary Fig. 4a,b and Supplementary Table 4). Consistent with the GO term enrichments, transcription fac-tors involved in stress/interferon responses such as, JUN, FOS, IRF, ATF/CREB and STAT were enriched at Epromoters. We also found enrichment of specific transcription factor binding sites in general agreement with the transcription factor binding profiles, including strong enrichment for FOS/JUN motifs (Supplementary Fig. 5a–d). Moreover, Epromoters harbored a higher density of distinct bound transcription factors (Fig. 3h) and motifs (Supplementary Fig. 5e), consistent with their enhancer properties24. Thus, Epromoters display genomic and epigenomic features associated with enhancer activity. While Epromoters are located close to housekeeping genes, a subset of them might be involved in stress response. In this context, some Epromoters could be required to ensure strong and rapid transcriptional output in response to environmental or intrinsic cellular stimuli.
We next asked whether enhancer and promoter (transcription of the associated gene) activities are correlated for Epromoters. We first observed that Epromoter-associated gene expression was significantly higher than that associated with non-Epromoters (Fig. 4a). However, enhancer activity at Epromoters did not strictly correlate with the expression levels of associated genes (Supplementary Fig. 6a), and differences in the enhancer activity of Epromoters between the K562 and HeLa cell lines did not correlate with significant differences in gene expression (Fig. 4b). This suggests that the promoter and enhancer functions of Epromoters might be partially independent, indicating potential long-range regulation of nearby genes. Chromatin interaction analysis by paired-end tag sequencing (ChIA-PET) stud-ies have shown that promoter–promoter interactions are a frequent phenomenon6. To test whether Epromoters are preferentially involved in promoter–promoter interactions, we analyzed available ChIA-PET data from the K562 and HeLa cell lines (Supplementary Table 5). In both cell lines, promoter–promoter interactions were found more frequently at Epromoters than at control promoters with similar levels of the corresponding histone modifications or transcription factors
(Fig. 4c and Supplementary Fig. 6b). HeLa Epromoters were enriched for HCFC1 and ZNF143 (Fig. 3g), two associated factors suggested to be involved in looping25,26.
Epromoters function as bona fide enhancers To experimentally address the role of Epromoters in the long-distance regulation of gene expression, we performed CRISPR–Cas9-mediated genomic deletion of the FAF2 Epromoter, for which clear interactions with the promoters of the NOP16, CLTB and RNF44 genes were observed by ChIA-PET in both cell lines (Fig. 5a and Supplementary Fig. 7). Deletion of the FAF2 Epromoter (∆Ep.FAF2) resulted in significant reduction of RNF44 expression in both cell lines, while NOP16 expres-sion was reduced only in HeLa cells (Fig. 5b). A decrease in H3K27ac at the RNF44 promoter in ∆Ep.FAF2 K562 cells was also observed (Fig. 5c). We confirmed the interaction between the FAF2 and RNF44 promot-ers by circularized chromosome conformation capture and sequencing (4C–seq) in K562 cells, using either the FAF2 or RNF44 promoter region as the viewpoint, and observed almost complete loss of this interaction in the two ∆Ep.FAF2 clones (Fig. 5d and Supplementary Fig. 8a,b). Consistent with these findings, the FAF2 Epromoter was able to activate the RNF44 promoter, as demonstrated by luciferase assay (Fig. 5e). Note that no luciferase activity was detected for the RNF44 promoter vector without the FAF2 Epromoter, ensuring that the observed enhancer activ-ity is not due to spurious transcription19. Deletion of the endogenous RNF44 promoter did not affect FAF2 expression (Fig. 5f), indicating that distal regulation is directional. Moreover, epigenetic marks were correlated between the FAF2 and RNF44 loci across different cell lines (Supplementary Fig. 8c). To test in vivo whether Epromoters might function independently of their orientation, we inverted the FAF2 Epromoter (including exon 1 of the gene) within its endogenous con-text in K562 cells (Supplementary Fig. 7i–k). Inversion of the FAF2 Epromoter completely abolished FAF2 expression and slightly but sig-nificantly reduced RNF44 expression (Fig. 5g). However, FAF2–RNF44 interaction was maintained in the inversion clones (Supplementary Fig. 8b) and RNF44 expression was significantly higher than in the dele-tion clones (Fig. 5h), suggesting that in vivo enhancer activity is partially retained with the inverted configuration of the FAF2 Epromoter. Finally, rescue of FAF2 expression in either ∆Ep.FAF2 or Inv.Ep.FAF2 clones did not affect RNF44 expression levels (Fig. 5h), indicating direct regulation of neighboring gene expression by the FAF2 Epromoter.
To generalize our finding, we targeted three additional Epromoters with promoter–promoter interactions found either in both cell lines
0
5
10
−15
−5
−10
Epromotersonly in K562
Epromotersonly in HeLa
Epromotersin common
ns ns nsRN
A–s
eq lo
g 2 (R
PK
M)
b K562 HeLa
K562
RN
A–s
eq lo
g 2 (R
PK
M)
HeLa
Epromoter Common Non-Epromoter
7.0 × 10⁻³ 1.0 × 10–37
5.0 × 10–131.0 × 10⁻⁹>>
>>
0
5
10
−15
−5
−10
a Epromoter
Control (same feature)
HeLa
0
20
40
60
10
30
50
Enr
ichm
ent s
core
Pol II
Tang
Pol II
Kuzne
tsova
0
2
4
6
c
Enr
ichm
ent s
core
K562
1
3
5
7
ChIA-PET assays
P1
ChIA-PETP–P interaction
Pol II H3K4me3 RAD21
P2
Figure 4 Expression of neighboring genes and promoter–promoter interactions. (a,b) Box plots comparing the expression levels of Epromoter- and non-Epromoter-associated genes in K562 and HeLa cells (a) and the expression of Epromoter-associated genes as a function of cell-line-specific Epromoter activity (b). The expression of genes associated with Epromoters active in both cell lines (Common) is also shown. Central values represent the median of the signal, the IQR corresponds to the 75th to 25th percentile, and whiskers extend to the maximum and minimum values excluding outliers (two-sided Mann–Whitney U test). ns, not significant. (c) Top, schematic of the strategy to identify promoter–promoter (P–P) interactions. Bottom, ChIA-PET enrichment of promoter–promoter interactions for a list of promoters associated with at least one Epromoter or a non-Epromoter from a control set with the same enriched features. The sources37,38 of the published ChIA-PET data from HeLa cells are indicated by the name of the first author.
© 2
017
Nat
ure
Am
eric
a, In
c., p
art
of
Sp
rin
ger
Nat
ure
. All
rig
hts
res
erve
d.
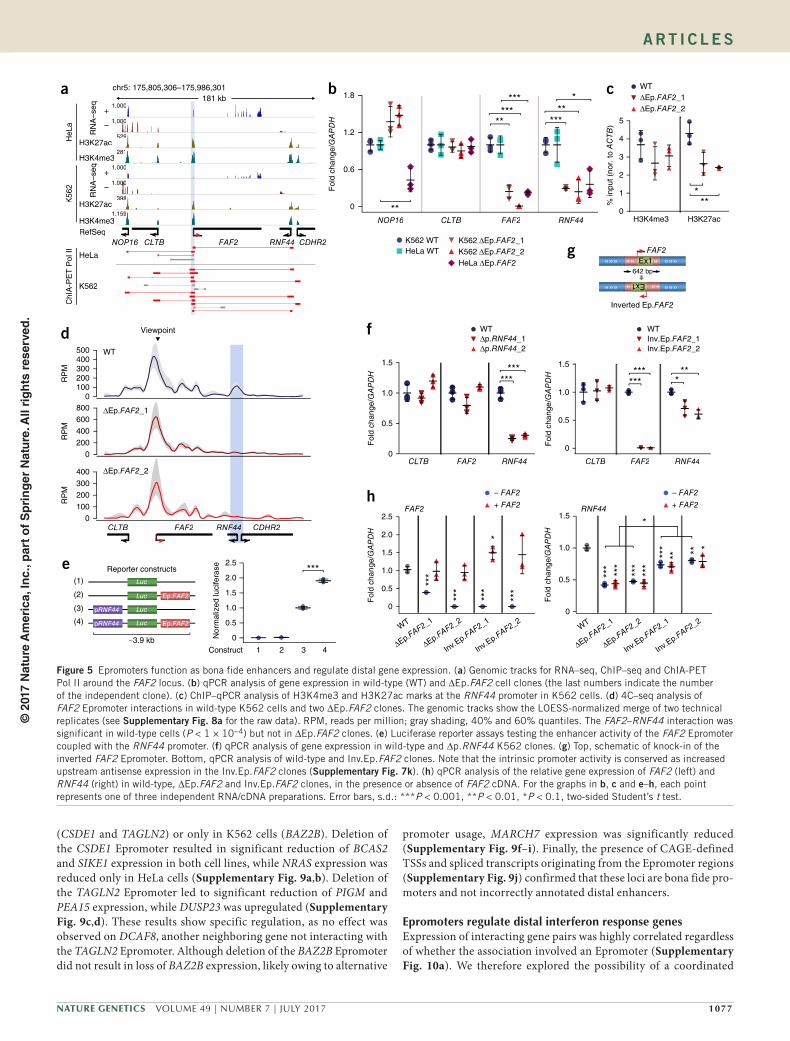
Nature GeNetics VOLUME 49 | NUMBER 7 | JULY 2017 1077
A rt i c l e s
(CSDE1 and TAGLN2) or only in K562 cells (BAZ2B). Deletion of the CSDE1 Epromoter resulted in significant reduction of BCAS2 and SIKE1 expression in both cell lines, while NRAS expression was reduced only in HeLa cells (Supplementary Fig. 9a,b). Deletion of the TAGLN2 Epromoter led to significant reduction of PIGM and PEA15 expression, while DUSP23 was upregulated (Supplementary Fig. 9c,d). These results show specific regulation, as no effect was observed on DCAF8, another neighboring gene not interacting with the TAGLN2 Epromoter. Although deletion of the BAZ2B Epromoter did not result in loss of BAZ2B expression, likely owing to alternative
promoter usage, MARCH7 expression was significantly reduced (Supplementary Fig. 9f–i). Finally, the presence of CAGE-defined TSSs and spliced transcripts originating from the Epromoter regions (Supplementary Fig. 9j) confirmed that these loci are bona fide pro-moters and not incorrectly annotated distal enhancers.
Epromoters regulate distal interferon response genesExpression of interacting gene pairs was highly correlated regardless of whether the association involved an Epromoter (Supplementary Fig. 10a). We therefore explored the possibility of a coordinated
RefSeq
chr5: 175,805,306–175,986,301
1,000
1,000
529
1,000
1,00000
398
1,159
181 kb
NOP16 CLTB FAF2 RNF44 CDHR2
RN
A–s
eq
H3K27ac
H3K4me3
+
–
HeL
a
RN
A–s
eq
H3K27ac
H3K4me3
+
–
K56
2
HeLa
K562
ChI
A-P
ET
Pol
II
a
d
CLTB FAF2 RNFF44 CDHR2
WT
∆Ep.FAF2_1
∆Ep.FAF2_2
0
200
400
600
800
RP
M
Viewpoint
0100200300400500
RP
MR
PM
0
100
200
300
400
e
∼3.9 kb
Reporter constructs
pRNF44 Ep.FAF2Luc
Nor
mal
ized
luci
fera
se ***
pRNF44 Luc
Ep.FAF2Luc
Luc
g
WTInv.Ep.FAF2_1 Inv.Ep.FAF2_2
642 bp
FAF2« Ex1 «««««« «««
« Ex1 «««
Inverted Ep.FAF2
««««««
FAF2 RNF44CLTB
Fol
d ch
ange
/GA
PD
H
0
0.5
1.0
1.5
******
***
c WT∆Ep.FAF2_1∆Ep.FAF2_2
0
1
2
3
4
5
% in
put (
nor.
to A
CTB
)
H3K4me3 H3K27ac
***
b
Fol
d ch
ange
/GA
PD
H
0
0.6
1.2
1.8
RNF44NOP16 CLTB FAF2
K562 WTHeLa WT
K562 ∆Ep.FAF2_1K562 ∆Ep.FAF2_2HeLa ∆Ep.FAF2
***
**
*****
***
***
h
0
Fol
d ch
ange
/GA
PD
H
0.5
1.0
1.5
2.0
2.5
WT
∆Ep.FAF2_1
∆Ep.FAF2_2
Inv.Ep.FAF2_1
Inv.Ep.FAF2_2
FAF2
Fol
d ch
ange
/GA
PD
H
0
0.5
1.0
1.5
WT
∆Ep.FAF2_1
∆Ep.FAF2_2
Inv.Ep.FAF2_1
Inv.Ep.FAF2_2
RNF44
– FAF2
+ FAF2
– FAF2
+ FAF2
***
***
***
***
*
***
***
***
***
***
** ** *
*
f
CLTB FAF2 RNF44
Fol
d ch
ange
/GA
PD
H
WT∆p.RNF44_1∆p.RNF44_2
0
0.5
1.0
1.5
******
0
0.5
1.0
1.5
2.0
2.5
Construct
(1)
(2)
(3)
(4)
2 3 41
281
Figure 5 Epromoters function as bona fide enhancers and regulate distal gene expression. (a) Genomic tracks for RNA–seq, ChIP–seq and ChIA-PET Pol II around the FAF2 locus. (b) qPCR analysis of gene expression in wild-type (WT) and ∆Ep.FAF2 cell clones (the last numbers indicate the number of the independent clone). (c) ChIP–qPCR analysis of H3K4me3 and H3K27ac marks at the RNF44 promoter in K562 cells. (d) 4C–seq analysis of FAF2 Epromoter interactions in wild-type K562 cells and two ∆Ep.FAF2 clones. The genomic tracks show the LOESS-normalized merge of two technical replicates (see supplementary Fig. 8a for the raw data). RPM, reads per million; gray shading, 40% and 60% quantiles. The FAF2–RNF44 interaction was significant in wild-type cells (P < 1 × 10⁻⁴) but not in ∆Ep.FAF2 clones. (e) Luciferase reporter assays testing the enhancer activity of the FAF2 Epromoter coupled with the RNF44 promoter. (f) qPCR analysis of gene expression in wild-type and ∆p.RNF44 K562 clones. (g) Top, schematic of knock-in of the inverted FAF2 Epromoter. Bottom, qPCR analysis of wild-type and Inv.Ep.FAF2 clones. Note that the intrinsic promoter activity is conserved as increased upstream antisense expression in the Inv.Ep.FAF2 clones (supplementary Fig. 7k). (h) qPCR analysis of the relative gene expression of FAF2 (left) and RNF44 (right) in wild-type, ∆Ep.FAF2 and Inv.Ep.FAF2 clones, in the presence or absence of FAF2 cDNA. For the graphs in b, c and e–h, each point represents one of three independent RNA/cDNA preparations. Error bars, s.d.: ***P < 0.001, **P < 0.01, *P < 0.1, two-sided Student’s t test.
© 2
017
Nat
ure
Am
eric
a, In
c., p
art
of
Sp
rin
ger
Nat
ure
. All
rig
hts
res
erve
d.

1078 VOLUME 49 | NUMBER 7 | JULY 2017 Nature GeNetics
A rt i c l e s
response to external stimuli mediated by Epromoters. We initially observed that key interferon response genes were found in interact-ing clusters associated with HeLa Epromoters (IFIT gene cluster, ISG15–HES4 and IRF9–PSME2–RNF31; Supplementary Fig. 10b), suggesting that Epromoters are involved in the coordinated response to interferon signaling and consistent with an active interferon response in these cells (Supplementary Fig. 3a–c). To address whether Epromoters are involved in the activation of distal interferon-induced genes, we looked for interferon (IFN)-α-induced genes in promoter–promoter interactions with Epromoters (Fig. 6a). We found a signifi-cant proportion of Epromoters interacting with interferon response genes in both cell lines (Fig. 6b and Supplementary Table 6). We reasoned that in K562 cells some Epromoters might be required for proper activation of distally associated interferon response genes. To test this hypothesis, we selected two IFN-α response genes, UBE2L6 (interacting with the YPEL4 Epromoter) and CCNYL1 (interact-ing with the METTL21A Epromoter) that were induced ~7.5- and ~2-fold after IFN-α treatment, respectively (Fig. 6c,d). Deletion of the interacting Epromoters did not result in consistent changes in UBE2L6 or CCNYL1 expression in non-stimulated cells; however, induction of these genes upon IFN-α treatment was severely reduced (Fig. 6c,d and Supplementary Fig. 10c–e). We also noted that CLP1, a non-interferon-responsive gene located close to YPEL4, displayed significant upregulation in clones in which the YPEL4 Epromoter was deleted both before and after interferon treatment, suggesting that enhancer–promoter contacts may have been rewired in the Epromoter-knockout clones (Supplementary Fig. 10d). Overall, these results show that some Epromoters are involved in the rapid activation of distal genes upon external stress stimuli, supporting a model in which preformed loops between Epromoters and target genes precede gene induction27.
To further rule out a plausible indirect effect mediated by Epromoter-associated genes, we analyzed allelic expression of wild-type cells and those homozygous and heterozygous for Epromoter deletion for cases where distally regulated genes harbored a SNP within the transcribed region in the K562 cell line. These genes included PIGM and UBE2L6, which are regulated by the TAGLN2 and YPEL4 Epromoters, respectively. In both cases, we found that allelic expression was significantly biased in the heterozygous clones (Supplementary Figs. 9e and 10f), thus suggesting cis-specific regula-tion by the Epromoters.
Genetic variants within Epromoters influence distal genesGenetic variants lying within Epromoters might influence the expres-sion of distal genes. To address this possibility, we isolated all inter-acting promoter pairs (using ChIA-PET data) and those that were associated with expression quantitative trait loci (eQTLs) (Fig. 7a,b and Supplementary Table 7). We found that Epromoters more fre-quently overlapped eQTLs affecting the expression of distal inter-acting genes and that the eQTLs associated with Epromoters had a significantly stronger effect on distal gene expression than the eQTLs associated with non-Epromoters (Fig. 7c). We found eQTLs within three experimentally validated Epromoters (METTL21A, BAZ2B and CSDE1). K562 cells harbor a heterozygous eQTL variant within the CSDE1 Epromoter (Fig. 7d–f) that results in DNase I accessibility and binding of transcription factors with a bias toward the reference allele (Fig. 7g). Allelic replacement of the reference allele resulted in decreased expression of CSDE1 and SIKE1 (Fig. 7h), as predicted by the eQTL association study. Similarly, deletion of the eQTL variant within BAZ2B resulted in reduced expression of the distal associ-ated gene MARCH7 (Fig. 7i). To further explore the implications of Epromoter-associated eQTLs, we analyzed in silico the probability of affecting transcription factor binding. We observed that SNPs poten-tially affecting transcription factor binding within Epromoters were biased toward having a positive effect (β) on distal gene expression, whereas this bias was not observed with non-Epromoters (Fig. 7j,k). Collectively, these results corroborate the functional relevance of eQTL-overlapping Epromoters, raising the intriguing possibility that disease-associated variants lying within Epromoters might directly influence distal gene expression.
DISCUSSIONHere, by implementing a high-throughput reporter assay, we shed light on and characterize a set of mammalian coding-gene promoters carrying both an intrinsic ability to drive local transcription (act as a promoter) and to activate distal gene expression (act as an enhancer). These elements have distinct genomic and epigenomic features, which distinguish them from other promoters and from classical distal enhancers (Figs. 1, 3 and 4). For six of these loci, we demonstrated that they act as bona fide enhancers regulating distal gene expres-sion in vivo. Remarkably, some Epromoters were found to regulate the expression of several distal genes (FAF2, CSDE1 and TAGLN2 Epromoters) over large genomic distances (up to 300 kb in the case of the TAGLN2 Epromoter), implying that they might function as regula-tory hubs. Our results extend and support the increasing amount of evidence pointing to a unified model of transcriptional regulation, highlighting broad similarities between enhancers and promoters1–5. Furthermore, previous studies based on the frequency of promoter–promoter interactions6,12,14 or epigenetic features7,10 suggested that some promoters might display enhancer function. Consistent with our findings, previous reporter assays also showed enhancer activity from TSS-proximal regions9,11,13. It is also worth noting that several
UBE2L6 SERPING1 YPEL4 CLP1RefSeq
ChIA-PETPol II
– IFN-α + IFN-α0
3
6
9WT∆Ep.YPEL4_1∆Ep.YPEL4_2
Epromoter-interacting genes
Type I IFN response genes
1,346 18 77
P = 5.8 × 10⁻⁶IFN-α-induced geneEpromoter
CCNYL1METTL21A
0
0.5
1.0
1.5
2.0
2.5
– IFN-α + IFN-α
WT
∆Ep.METTL21A
a b
c d
UB
E2L
6fo
ld c
hang
e/G
AP
DH
CC
NY
L1fo
ld c
hang
e /G
AP
DH
?
***** * * *** ***
1,346 56 587
P = 2.5 × 10⁻³
K562 HeLa
10 kb
∆1
∆4∆3∆2
ChIA-PETP–P interaction
Figure 6 Epromoters are involved in a long-range response to IFN-α signaling. (a) Schematic of the strategy to identify IFN-α-induced genes associated with Epromoters combining ChIA-PET and STARR-seq data. (b) Venn diagrams showing the overlap between Epromoter-interacting genes and interferon response genes in K562 and HeLa cells (hypergeometric test). (c,d) qPCR analysis of the expression levels of the Epromoter-interacting genes UBE2L6 (c) and CCNYL1 (d) in wild-type and knockout clones with and without IFN-α stimulation. Error bars, s.d. (n = 3 independent RNA/cDNA preparations): ***P < 0.001, **P < 0.01, *P < 0.1, two-sided Student’s t test. The relative locations of genes and ChIA-PET interactions with Epromoters are shown above; Epromoters are highlighted as red arrows.
© 2
017
Nat
ure
Am
eric
a, In
c., p
art
of
Sp
rin
ger
Nat
ure
. All
rig
hts
res
erve
d.

Nature GeNetics VOLUME 49 | NUMBER 7 | JULY 2017 1079
A rt i c l e s
well-characterized enhancers of rapidly induced genes, including met-allothioneins, histones of early cleavage stages, viral immediate-early genes (from SV40 and some cytomegaloviruses and retroviruses), heat-shock genes and the antiviral interferon genes, are located very close to the TSS8. Our study clearly shows that reporter-assay-based approaches can lead to the identification of TSS-overlapping promot-ers with bona fide enhancer activity in vivo.
It is possible that previous studies deleting large genomic regions overlapping promoters have underestimated the potential enhancer function of these regulatory elements (for example, see ref. 28). To our knowledge, only two studies have reported dual promoter and enhancer functions for the same regulatory elements in their endog-enous context in mammals. Kowalczyk et al. showed that intragenic enhancers frequently act as alternative, tissue-specific promoters,
a
ChIA-PET interaction
eQTL interaction
b
05
101520253035
Fra
ctio
n w
ith
dist
al e
QT
L
Eprom
oter
Non-E
prom
oter
Ran
k-no
rmal
ized
gene
exp
ress
ion
–0.2
–0.1
0.2
0.1
0.0
eQTL in thyroid
Homo
ref
n =
65Het
n =
139
Homo
alt
n =
74
MARCH7 P = 8.5e–6
P = 7.28 × 10⁻⁶
d
–0.4
–0.2
0.0
0.2
Homo refn = 156
Hetn = 112
Homo altn = 17
Ran
k-no
rmal
ized
gene
exp
ress
ion
SIKE1 P = 1.1 × 10⁻⁶
eQTL in tibial artery
TRIM33 BCAS2NRAS
CSDE1 SIKE1
RefSeq
ChIA-PET Pol II
SNP: rs6681671 (chr1: 115,300,685 C/T)
e
RefSeqBAZ2B MARCH7
ChIA-PET Pol II
SNP: rs1046496 (chr2: 160,473,399 A/T)
WDSUB1
BAZ2B MARCH7WDSUB1
Fol
d ch
ange
/GA
PD
H
WT ∆rs1046496
0
0.5
1.0
1.5
CSDE1BCAS2 SIKE1TRIM33
Fol
d ch
ange
/GA
PD
H
0
0.02
0.04
0.06
0.08
0.10
0.12
0.14
Epromoters Non-Epromoter
Reg
ulat
ory
eQT
Ls (
frac
tion)
Negative � effect
Positive � effect
P = 1.1 × 10⁻¹⁹
P = 8.7 × 10⁻¹⁴
kEpromoter Non-Epromoter
TF
BS
dis
rupt
ion
−1 0 1 2 −1 0 1 2
No
TF
BS
dis
rupt
ion
j
hg
i
CSDE1G A A G C G T A C T C T C A A
CT A
DNase
P300
Pol II
STAT1
STAT5A
CREB1
JUND
YY1
IRF1Input
RefSeq
Sequence80
% haplotype-resolved reads
Ratio (C/T)
3.3
1.5
3.0
4.0
1.5
3.2
1.7
1.9
1.3
1.0
f
GCA A A CC/T
GCTA A A C
K562 rs6681671[C/T] (WT)
K562 rs6681671[T/T]
–1 0 1 2
� effect
� effect
–2
Epromoter
P = 2.19 × 10⁻²³P = 1.77 × 10–59
Non-Epromoter
P = ns
P = 4.7 × 10–53
0
0.5
1.0
1.5
K562 rs6681671[C/T] (WT)K562 rs6681671[T/T]
* ** **
**
c
TC
−2
1000 20 40 60
Figure 7 eQTL association within Epromoters. (a) Schematic of the eQTLs assessed. (b) Frequency of promoters having eQTLs associated with distal gene expression. Statistical significance was assessed by testing for equality of proportions. (c) Effects associated with eQTLs lying within promoter pairs with ChIA-PET interactions. Statistical significance was assessed independently for negative and positive scores using two-sided Mann–Whitney U tests. (d) Schematic of the eQTL SNP (rs6681671) within the CSDE1 Epromoter associated with SIKE1 expression. (e) eQTL data retrieved from the GTEx Portal. Ref, reference; Alt, alternate. Central values represent the median of the signal, the IQR corresponds to the 75th to 25th percentile, and whiskers extend to the maximum and minimum values excluding outliers. (f) Sequence chromatograms of wild-type and mutant K562 clones. (g) Coverage tracks from IGV (left) and histograms (right) showing the frequency of haplotype-resolved reads at SNP rs6681671 from the indicated ENCODE data in K562 cells. (h) qPCR analyses of gene expression in wild-type cells and eQTL mutants. (i) The eQTL SNP within the BAZ2B Epromoter associated with MARCH7 expression is shown as in d, e and h. ∆rs1046496 denotes deletion of SNP rs1046496 in K562 cells. For h and i, error bars show s.d. (n = 3 independent RNA/cDNA preparations): ***P < 0.001, **P < 0.01, *P < 0.1, two-sided Student’s t test. (j) Effects depending on whether the eQTL disrupts a transcription factor binding site (TFBS). Statistical significance was assessed by a one-sided Mann–Whitney U test and corrected for multiple testing using the Benjamini–Hochberg method. (k) Fraction of regulatory eQTLs (affecting transcription factor binding) with positive and negative β values. Statistical significance was assessed by Fisher’s exact test.
© 2
017
Nat
ure
Am
eric
a, In
c., p
art
of
Sp
rin
ger
Nat
ure
. All
rig
hts
res
erve
d.

1080 VOLUME 49 | NUMBER 7 | JULY 2017 Nature GeNetics
A rt i c l e s
although these promoters produced a class of noncoding transcript16. Another study, published while this manuscript was under review, reported frequent distal cis regulation by loci associated with long noncoding RNAs (lncRNAs) and, to a lesser extent, coding genes15. Interestingly, using genetic manipulations in mouse embryonic stem cells, the authors demonstrated that these effects did not require the specific transcripts themselves, but instead involved general processes associated with their production, including enhancer-like activity of the gene promoters, the process of transcription and splicing of the transcript. On the basis of these findings, it is plausible that some of the experimentally validated Epromoters might function by other proc-esses than enhancer-like activity. Further studies based on our catalog of Epromoters will be needed to precisely characterize the mechanisms by which these elements regulate distal gene expression.
Could it be that some of the Epromoters identified in this study are actually incorrectly annotated as promoter-proximal enhancers? The selection of captured TSS-encompassing regions was based on the annotation of coding-gene transcripts by RefSeq. Despite this conservative approach, we cannot completely rule out the possibil-ity of erroneous TSS calls, leading to incorrectly annotated promoter-proximal enhancers. The vast majority of the tested regions overlapped with a CAGE-defined TSS. Moreover, the experimentally validated Epromoters (with the exception of YPEL4) did overlap with CAGE TSSs identified in the corresponding cell lines and were associated with spliced and polyadenylated transcripts of the nearest gene, confirm-ing that these particular loci are bona fide promoters (Supplementary Fig. 9j). The analyses of CAGE-based TSSs also found that a substantial number of Epromoters did not display CAGE signal in the cell line where they were active (Supplementary Fig. 2h), in line with the poor correlation between Epromoter activity and expression of the closest gene (Supplementary Fig. 6a). However, we also found good correla-tion between gene pairs of interacting promoters involving at least one Epromoter (Supplementary Fig. 10a). This apparent contradiction might be explained by the existence of two types of Epromoters. One type might coordinately regulate the expression of several genes, includ-ing the closest one, therefore displaying simultaneous promoter and enhancer activities. For example, in the case of the FAF2 Epromoter, expression of the FAF2 and RNF44 genes is positively correlated across different cell types (Supplementary Fig. 8c). Another type might dis-play independent promoter and enhancer activities; in these cases, an active Epromoter could be associated with a silent or weakly expressed gene. For example, in the case of the YPEL4 Epromoter, the YPEL4 gene is not expressed in K562 cells, but the Epromoter regulates the expression of UBE2L6 (Fig. 6c,d). This is reminiscent of a previous work showing that the same genomic region can have the epigenetic features of an enhancer or a promoter in different tissues7.
In the current model of transcription factories, the regulatory regions of neighboring genes are clustered together and each con-tributes to the expression of multiple genes by increasing the local concentration of regulatory factors and RNA polymerases29. In this context, multigene interaction complexes have provided a structural framework for the postulated transcription factories6. Our results showing that Epromoters interact more frequently with other distal promoters (Fig. 4) and that eQTLs associated with Epromoters have a significantly stronger effect on distal gene expression (Fig. 7) support a model in which Epromoters have a key role within transcription factories. Whether Epromoter–promoter interactions rely on mech-anisms similar to those previously shown for enhancer–promoter interactions30 and what the specific contribution of Epromoters to the functioning of transcription factories is will need to be investi-gated in the future.
We found that a significant proportion of Epromoters interacted with interferon response genes in both cell lines analyzed (Fig. 6). Interferon response genes are not induced at baseline in K562 cells, suggesting the existence of preformed chromatin loops preceding gene induction of interferon response genes, in line with previous findings showing that TNF-α-responsive enhancers are already in contact with their target promoters before signaling27. This is illustrated by the examples of the YPEL4 and METTL21A Epromoters, which were found to interact with the promoters of distal IFN-α-responsive genes in unstimulated K562 cells, thus preceding gene activation. Further studies will be required to identify the transcription factors and (epi-genetic) mechanisms involved in these interactions.
URLs. ENCODE, https://www.encodeproject.org/; R Core Team, https://www.R-project.org/; Reactome: interferon αβ signaling, http://www.broadinstitute.org/gsea/msigdb/cards/REACTOME_INTERFERON_ALPHA_BETA_SIGNALING.
METHODSMethods, including statements of data availability and any associated accession codes and references, are available in the online version of the paper.
Note: Any Supplementary Information and Source Data files are available in the online version of the paper.
ACkNOwLEDGMENTSWe thank J.-C. Andrau and J. Imbert for critical reading of the manuscript. We thank the IBiSA ‘Transcriptomics and Genomics Marseille-Luminy’ (TGML) platform for sequencing of CapStarr-seq samples and the cell biology platform for management of cell culture. Work in the laboratory of S.S. was supported by recurrent funding from INSERM and Aix-Marseille University and by specific grants from the European Union’s FP7 Programme (282510-BLUEPRINT), ARC (PJA 20151203149) and A*MIDEX (ANR-11-IDEX-0001-02). L.T.M.D., A.G. and G.C. were supported, respectively, by Vietnam International Education Development (911), CONACYT and FRM.
AUTHOR CONTRIBUTIONSL.T.M.D. and S.S. conceptualized and designed the experiments. L.T.M.D. performed most experimental work. A.O.G.A. performed most bioinformatics analyses. J.A.C.-M. and J.v.H. performed motif analysis. C.A.-S., T.S., D.M. and E.S. performed 4C–seq experiments and analyses. C.S., A.G. and L.V. performed and analyzed data from mouse CapStarr-seq. J.A., M.T. and N.F. contributed to CRISPR screening and analyses of allelic expression. G.C. and D.P. performed ChIA-PET analyses. A.M.R. performed eQTL analysis. All authors contributed to reading, discussion and commenting on the manuscript. L.T.M.D. and S.S. wrote the manuscript.
COMPETING FINANCIAL INTERESTSThe authors declare no competing financial interests.
Reprints and permissions information is available online at http://www.nature.com/reprints/index.html. Publisher’s note: Springer Nature remains neutral with regard to jurisdictional claims in published maps and institutional affiliations.
1. Kim, T.K. & Shiekhattar, R. Architectural and Functional Commonalities between Enhancers and Promoters. Cell 162, 948–959 (2015).
2. Andersson, R. Promoter or enhancer, what’s the difference? Deconstruction of established distinctions and presentation of a unifying model. BioEssays 37, 314–323 (2015).
3. Core, L.J. et al. Analysis of nascent RNA identifies a unified architecture of initiation regions at mammalian promoters and enhancers. Nat. Genet. 46, 1311–1320 (2014).
4. Pekowska, A. et al. H3K4 tri-methylation provides an epigenetic signature of active enhancers. EMBO J. 30, 4198–4210 (2011).
5. Koch, F. et al. Transcription initiation platforms and GTF recruitment at tissue-specific enhancers and promoters. Nat. Struct. Mol. Biol. 18, 956–963 (2011).
6. Li, G. et al. Extensive promoter-centered chromatin interactions provide a topological basis for transcription regulation. Cell 148, 84–98 (2012).
7. Leung, D. et al. Integrative analysis of haplotype-resolved epigenomes across human tissues. Nature 518, 350–354 (2015).
8. Schaffner, W. Enhancers, enhancers - from their discovery to today’s universe of transcription enhancers. Biol. Chem. 396, 311–327 (2015).
© 2
017
Nat
ure
Am
eric
a, In
c., p
art
of
Sp
rin
ger
Nat
ure
. All
rig
hts
res
erve
d.

Nature GeNetics VOLUME 49 | NUMBER 7 | JULY 2017 1081
A rt i c l e s
9. Zabidi, M.A. et al. Enhancer-core-promoter specificity separates developmental and housekeeping gene regulation. Nature 518, 556–559 (2015).
10. Scruggs, B.S. et al. Bidirectional Transcription Arises from Two Distinct Hubs of Transcription Factor Binding and Active Chromatin. Mol. Cell 58, 1101–1112 (2015).
11. Nguyen, T.A. et al. High-throughput functional comparison of promoter and enhancer activities. Genome Res. 26, 1023–1033 (2016).
12. Sanyal, A., Lajoie, B.R., Jain, G. & Dekker, J. The long-range interaction landscape of gene promoters. Nature 489, 109–113 (2012).
13. Arnold, C.D. et al. Genome-wide quantitative enhancer activity maps identified by STARR-seq. Science 339, 1074–1077 (2013).
14. Schoenfelder, S. et al. The pluripotent regulatory circuitry connecting promoters to their long-range interacting elements. Genome Res. 25, 582–597 (2015).
15. Engreitz, J.M. et al. Local regulation of gene expression by lncRNA promoters, transcription and splicing. Nature 539, 452–455 (2016).
16. Kowalczyk, M.S. et al. Intragenic enhancers act as alternative promoters. Mol. Cell 45, 447–458 (2012).
17. Dailey, L. High throughput technologies for the functional discovery of mammalian enhancers: new approaches for understanding transcriptional regulatory network dynamics. Genomics 106, 151–158 (2015).
18. Vanhille, L. et al. High-throughput and quantitative assessment of enhancer activity in mammals by CapStarr-seq. Nat. Commun. 6, 6905 (2015).
19. Nejepinska, J., Malik, R., Moravec, M. & Svoboda, P. Deep sequencing reveals complex spurious transcription from transiently transfected plasmids. PLoS One 7, e43283 (2012).
20. Duttke, S.H. et al. Human promoters are intrinsically directional. Mol. Cell 57, 674–684 (2015).
21. Roy, A.L. & Singer, D.S. Core promoters in transcription: old problem, new insights. Trends Biochem. Sci. 40, 165–171 (2015).
22. Forrest, A.R. et al. A promoter-level mammalian expression atlas. Nature 507, 462–470 (2014).
23. Mahat, D.B., Salamanca, H.H., Duarte, F.M., Danko, C.G. & Lis, J.T. Mammalian Heat Shock Response and Mechanisms Underlying Its Genome-wide Transcriptional Regulation. Mol. Cell 62, 63–78 (2016).
24. Hardison, R.C. & Taylor, J. Genomic approaches towards finding cis-regulatory modules in animals. Nat. Rev. Genet. 13, 469–483 (2012).
25. Michaud, J. et al. HCFC1 is a common component of active human CpG-island promoters and coincides with ZNF143, THAP11, YY1, and GABP transcription factor occupancy. Genome Res. 23, 907–916 (2013).
26. Whalen, S., Truty, R.M. & Pollard, K.S. Enhancer-promoter interactions are encoded by complex genomic signatures on looping chromatin. Nat. Genet. 48, 488–496 (2016).
27. Jin, F. et al. A high-resolution map of the three-dimensional chromatin interactome in human cells. Nature 503, 290–294 (2013).
28. Li, Y. et al. CRISPR reveals a distal super-enhancer required for Sox2 expression in mouse embryonic stem cells. PLoS One 9, e114485 (2014).
29. Feuerborn, A. & Cook, P.R. Why the activity of a gene depends on its neighbors. TIG 31, 483–490 (2015).
30. Kagey, M.H. et al. Mediator and cohesin connect gene expression and chromatin architecture. Nature 467, 430–435 (2010).
© 2
017
Nat
ure
Am
eric
a, In
c., p
art
of
Sp
rin
ger
Nat
ure
. All
rig
hts
res
erve
d.

Nature GeNetics doi:10.1038/ng.3884
ONLINE METHODSCell culture. K562 (CCL-243), a chronic myelogenous leukemia cell line, and HeLa-S3 (CCL-2.2), a cervical carcinoma cell line, were obtained from the American Type Culture Collection (ATCC) and maintained in RPMI (Gibco) supplemented with 10% FBS (Gold, PAA) at 37 °C, 5% CO2. The P5424 T cell line31 was cultured as described previously18. Cells were passaged every 2–3 d and routinely tested for mycoplasma contamination. For cell stimulation, 1 × 10⁶ K562 cells were incubated with IFN-α (Sigma, SRP4594) at 50 ng/ml for 6 h.
Mouse CapStarr-seq. Enhancer activity in the mouse P5424 and NIH-3T3 cell lines was retrieved from our previously published CapStarr-seq data18. DHS genomic regions were separated into TSS distal (>1 kb) and proximal (<1 kb) while keeping the previous definition of enhancer activity (Supplementary Table 1).
Luciferase reporter assays. For the reporter assays related to Figure 1c and Supplementary Figure 1a, proximal-defined DHS regions overlapping TSSs were selected on the basis of CapStarr-seq activity in the P5424 cell line. The tested candidates were amplified from mouse genomic DNA and cloned downstream of the luciferase gene in the pGL3-Promoter vector (Promega) at the BamHI site. For the reporter assays related to Figure 5e, the human RNF44 promoter (1,294 bp, chr5:176,537,245–176,538,538) and/or FAF2 Epromoter (661 bp, chr5:176,447,822–176,448,482) was amplified from K562 genomic DNA and cloned into the pGL3-Basic vector (Promega). The RNF44 promoter was cloned upstream of the luciferase gene at the MluI–BglII sites, and the FAF2 Epromoter was cloned downstream of the luciferase gene at the SalI site. For cell transfection, a total of 1 × 10⁶ P5424 or K562 cells were cotrans-fected with 1 µg of the tested construct and 200 ng of Renilla vector using the Neon Transfection System (Thermo Fisher Scientific). Electroporation condi-tions for P5424 cells were described previously18, and conditions for K562 cells are described below (human CapStarr-seq). Twenty-four hours after trans-fection, luciferase activity was measured using the Dual-Luciferase Reporter Assay kit (Promega) on a TriStar LB-941 Reader. For all measurements, firefly luciferase values were first normalized to Renilla luciferase values (control-ling for transfection efficiency and cell number). Data are represented as the fold increase in relative luciferase signal over the pGL3-Promoter vector (Supplementary Fig. 1a) or RNF44-pGL3-Basic vector (Fig. 5e) with s.d. Student’s t tests (one-sided, unpaired) from three independent transfections were used to calculate significance.
Human CapStarr-seq. Construction of the human promoter library is detailed in the Supplementary Note. The principle of CapStarr-seq was described previously18. The detailed step-by-step protocol is accessible on Protocol Exchange32. The human promoter library was transfected into K562 and HeLa cells using the Neon Transfection System (Thermo Fisher Scientific; pulse voltage 1,450 V and 1,005 V, pulse width 10 and 35 ms, pulse number 3 and 2 for K562 and HeLa cells, respectively). For each replicate, 30 × 106 cells were transfected with 150 µg of library; two independent transfection replicates were performed for each cell line. The transfected and non-transfected (plas-mid input) libraries were single-end sequenced on the Illumina NextSeq 500 platform, and reads were mapped to the hg19 reference genome using standard procedures. Supplementary Table 8 summarizes the number of sequenced and mapped reads for each sample. The coverage of each genomic region was cal-culated using BEDTools (v2.17.0), and the ratio of the CapStarr-seq coverage over the input (fold change) was computed for each sample. Promoter regions with enhancer activity were defined by determining the inflexion point of the ranked fold change (Supplementary Table 2a). Epromoters were defined as promoters displaying enhancer activity in both replicates. A common set of non-Epromoters was also defined as promoters lacking enhancer activity in all replicates of both cell lines. STARR-seq-positive controls displayed enhancer activity in our assays (Supplementary Fig. 2a).
Flow cytometry. We primarily observed enhanced GFP expression from the pooled promoter library as compared to the empty vector by FACS analysis (Supplementary Fig. 2b). A total of 5 × 10⁶ K562 or HeLa cells were trans-fected with 25 µg of the empty STARR-seq screening vector13 or the promoter library using the Neon Transfection System (Thermo Fisher Scientific) with the conditions described above. Twenty-four hours after electroporation, GFP
expression was assessed on a FACSCalibur (BD Biosciences). Data were ana-lyzed and visualized with FlowJo software.
RNA transcription and selection of the control set. Transcript quantification by RPKM (K562 and HeLa cell lines, four samples each) was obtained from the ENCODE Consortium (Supplementary Table 9). The data were normalized using the Normalizer package33 with the quartiles −log2 option, and the mean of the four samples was obtained. A control (with the same expression) for each cell line was obtained by comparing Epromoters to promoters without enhancer activity (using transcription values for the nearest gene), and a list was generated of the same number of observations using a tool developed in house. The expression levels of genes associated with Epromoters and control sets in each cell line were compared to each other or to CapStarr-seq fold changes in signal and graphed using R software (R Core Team).
Epigenomic analysis. ChIP–seq data for the H3K4me3, H3K4me1 and H3K27ac histone marks, as well as DNase–seq data, were obtained from the ENCODE Consortium (Supplementary Table 9). Median average profiles were generated by extracting ChIP–seq signal from wiggle files for the 5-kb regions centered on TSSs. To test whether the differences between different classes of promoters were statistically significant, we first extracted the aver-age signal for the top 25% of the signal in 2-kb regions centered on TSSs. A two-sided Mann–Whitney U test was then performed for each pair of pro-moter sets.
TSS analyses. To define promoter classes, clusters of 5′ GRO–seq transcripts from HeLa cells were obtained from Duttle et al.20. The clusters overlapping a 500-bp region extended from the promoter coordinates were retrieved. Bidirectional coding genes (TSS closer than 1.5 kb and in the opposite direc-tion) were omitted. Each promoter was defined as a function of the orientation of the overlapping clusters of 5′ GRO-seq transcripts: unidirectional, only one transcript in the same direction as the gene; divergent, two RNA fragments in opposite directions; antisense, only one transcript in the opposite direction as the gene. Definition of TSS pairs as a function of RNA stability (UU, unstable– unstable; US, unstable–stable; SS, stable–stable) in K562 cells was obtained from Core et al.3. The TSS pairs overlapping a 500-bp region extended from the promoter coordinates were retrieved. Further analyses of TSSs and comparison with CAGE data are provided in the Supplementary Note.
Functional enrichment. GO enrichment in biological processes and pathways was assessed using g:Profiler34 and default options (Supplementary Table 3). For the statistical background, we used the list of all genes associated with the capture promoters. Enrichment scores were calculated using the g:GOSt native method. Enrichment analysis for transcriptomic signatures was per-formed using GREAT35 with all capture promoters as the background. Only gene signatures involved in TNF and interferon responses are shown in Supplementary Figure 3c.
To analyze the expression of type I interferon response genes, transcript quantification data (FPKM) for 23 cell lines (including HeLa and K562 cells) were obtained from the ENCODE Consortium (Supplementary Table 9) and normalized as described above. The FPKM values of genes involved in the ‘Reactome: interferon αβ signaling’ pathway were graphed using R software in a cumulative plot (Supplementary Fig. 3a). A Kolgomorov test was then performed to compare the HeLa and K562 cell lines. Genes in the ‘Reactome: interferon αβ signaling’ pathway that were differentially expressed in HeLa cells relative to the remaining 22 cell lines were identified by performing Significance Analysis of Microarrays (SAM) with TMEV (4.9)36 software using a delta value of 0.5.
Transcription factor enrichment and density. ChIP–seq data (wiggle and peak files) from 71 (56 unique) and 218 (116 unique) transcription factors for the HeLa and K562 cell lines, respectively, were obtained from the ENCODE Consortium (Supplementary Table 9). To test whether the differences between Epromoters and control promoters (with the same expression) were statisti-cally significant, we quantified the ChIP–seq signal from −200 to +50 bp with respect to the TSS. A Mann–Whitney U test was then performed for each pair of promoter sets. An enrichment score was calculated using the following
© 2
017
Nat
ure
Am
eric
a, In
c., p
art
of
Sp
rin
ger
Nat
ure
. All
rig
hts
res
erve
d.

Nature GeNeticsdoi:10.1038/ng.3884
formula: −log10 (P value) if fold change >1 or log10 (P value) if fold change <1. A heat map of the scores was generated using Multiple Experiment Viewer36. We considered transcription factors to be enriched if they had a fold change >1.2 and P < 0.001. The average profiles for significantly enriched transcription factors were generated by extracting ChIP–seq signal from wiggle files for the 5-kb regions centered on TSSs. To assess the number of transcription factors bound per promoter (transcription factor density), the overlap of transcription factor peaks with Epromoters and control promoters (same expression) was assessed using BEDTools. The presence (1) or absence (0) of overlapping tran-scription factors for each promoter was summed and the density of transcrip-tion factors for each promoter was graphed using R software. A Kolgomorov test was then performed for each pair of promoter sets.
Motif analysis in Epromoters. Epromoter sequences from K562 and HeLa cells were scanned with a non-redundant collection of TFBMs (Supplementary Note) to detect over-represented and positionally biased motifs relative to control sequences (non-Epromoters). We detected motifs over-represented in Epromoters relative to non-Epromoters with the program matrix-enrichment (default parameters), which computes the cumulative distributions of scores for a given motif and computes the significance of over-representation at each possible score threshold with the binomial law. In addition to assessing global over-representation, we ran position-scan, which runs a chi-squared homoge-neity test to detect motifs whose positional distribution differs between two sequence sets. We tuned the position-scan parameters to detect motifs showing a specific peak of enrichment near the core promoter (from −250 to +50 with respect to the TSS) of Epromoters relative to non-Epromoters. For graphical representation, the positional distributions of predicted sites were drawn on an extended region (±1 kb relative to the TSS), whereas the chi-squared test was restricted to the core promoter using a bin width of 50 bp and scanning with a threshold of P ≤ 1 × 10⁻³. The background model was a first-order Markov chain trained with dinucleotide frequencies from all human core promoters.
Computations of ChIA-PET enrichment scores for promoter–promoter interactions. Pol II ChIA-PET interactions from HeLa and K562 cells were obtained from published data37,38 and ENCODE Consortium data (Supplementary Table 9), respectively. ChIA-PET fragments for which the two mates intersected a 1-kb region encompassing two distinct TSSs were selected to define promoter–promoter interactions (Supplementary Table 5). Control sets were subsets of promoters without enhancer activity in both cell lines, as defined above. For each mark, each Epromoter was associated with a control promoter with the closest ChIP–seq signal computed from ENCODE Consortium data (Supplementary Table 9) to create a control list matched to the Epromoter list for signal distribution. To obtain enrichment scores, the fraction of promoters with promoter–promoter interactions was com-puted. Next, the number of interacting promoters labeled as Epromoter or control promoter was retrieved. ChIA-PET interactions mediated by H3K27ac, H3K4me2 and H3K4me1 were not significant for any set and are not dis-played in Figure 4c. The corresponding enrichment scores were computed from hypergeometric tests using the following formula: −log10 (P value).
Gene expression correlation for interacting gene pairs. RNA–seq quan-tification data (FPKM) for 23 cell lines were retrieved from the ENCODE Consortium (Supplementary Table 9) and normalized as described above. Pearson’s correlation between coding-gene pairs on the same chromosome and having a ChIA-PET interaction in K562 or HeLa cells (Supplementary Table 5) was assessed using R software (R Core Team). Correlation scores for gene pairs involving at least one Epromoter or only non-Epromoters were graphed using R software. A control set containing shuffled gene pairs from the ChIA-PET interacting pairs was also plotted.
CRISPR–Cas9 genome editing. Targeted Epromoter and promoter regions were defined by CapStarr-seq and DNase–seq peaks ranging from 410 bp to 1,255 bp in length (Supplementary Fig. 7b–h, left). For the knockout experi-ments, the general strategy is shown in Supplementary Figure 7a. Two gRNAs were designed for each end of the targeted region using the CRISPRdirect tool39. The gRNAs were cloned into a gRNA cloning vector (Addgene, 41824) as previously described40. Two million cells were transfected with 15 µg of
the hCas9 vector (Addgene, 41815) and 7 µg of each gRNA using the Neon Transfection System (Thermo Fisher Scientific). Three days after transfection, the bulk of transfected cells were plated in 96-well plates at limiting dilution (0.5 cells per 100 µl per well) for clonal expansion. After 10−14 d, individual cell clones were screened for homologous allele deletion by direct PCR using Phire Tissue Direct PCR Master Mix (Thermo Fisher Scientific) according to the manufacture’s protocol. Forward and reverse primers were designed brack-eting the targeted regions, allowing for the detection of knockout or wild-type alleles. Clones were considered to have undergone homologous allele deletion if they had at least one deletion band of the expected size and no wild-type band (Supplementary Fig. 7b–h, right). If more than two cell clones were obtained for a given locus, the most precise deletion was chosen. All gRNAs and primers are listed in Supplementary Table 10. The generation of clones in which the FAF2 Epormoter was inverted and eQTL SNPs were mutated is described in the Supplementary Note.
Gene expression. Total RNA was extracted using TRIzol reagent (Thermo Fisher Scientific). 3 µg of RNA was then treated with DNase I (Ambion) and reverse transcribed into cDNA using Superscript VILO Master Mix (Thermo Fisher Scientific). Real-time PCR was performed using Power SYBR Master Mix (Thermo Fisher Scientific) on a Stratagene Mx3000P instrument. Primer sequences are listed in Supplementary Table 10. Gene expression was nor-malized to that of GAPDH. Relative expression was calculated by the ∆CT method, and all data shown are reported as the fold change over the control. For each cell clone, the Student’s t test was performed (unpaired, two-tailed, 95% confidence interval) from three independent RNA/cDNA preparations. Data are represented with s.d. For conventional RT–PCR, one-twentieth of the synthesized cDNA was used as the template for one reaction; PCRs were performed with Phusion polymerase (Thermo Fisher Scientific), Tm = 60 °C, 30 cycles.
FAF2 rescue experiments. Human FAF2 cDNA was purchased from Origene (SC100662). K562 cell clones in which the FAF2 Epromoter was knocked out or inverted were transfected with 2 µg of FAF2 cDNA plasmid, and samples were collected 24 h after transfection for gene expression analysis as described above.
Allelic expression. Genetic variants within the transcribed regions of the PIGM (chr1:160,000,435) and UBE2L6 (chr11:57,319,339) genes were iden-tified by visual assessment of RNA–seq data from the K562 cell line using the IGV tool (version 2.3.67)41. PCR primers containing Illumina adaptors were designed flanking each variant (Supplementary Table 10). cDNAs from wild-type K562 clones and clones with homozygous and heterozygous dele-tion of the TAGLN2 and YPEL4 Epromoters were amplified using PIGM- and UBE2L6-specific primers, respectively. In the case of UBE2L6, the cDNA was generated from IFN-α-treated cells. A second PCR was performed using NEBNext Multiplex Oligos for Illumina (New England BioLabs), the product was subjected to single-end sequencing on the Illumina NextSeq 500 platform and reads were mapped to the hg19 reference genome using standard proce-dures. Allelic frequency was computed using the IGV tool.
Haplotype-resolved analysis of DNase–seq and ChIP–seq data. Transcription factors for which a ChIP–seq peak in K562 cells (ENCODE Consortium) overlapped the eQTL SNP rs6681671 in the CSDE1 Epromoter were selected. BAM files from corresponding ChIP–seq data, along with DNase–seq data and input, were directly retrieved with the IGV tool, and the frequency of the haplotype-resolved reads was manually computed. Only samples with at least ten reads were selected.
Chromatin immunoprecipitation and qPCR. Generation of ChIP samples is described in the Supplementary Note. ChIP eluates and input were assayed by real-time PCR (Stratagene Mx3000P instrument) in a 20-µl reaction with one-thirtieth of the elution material using Power SYBR Master Mix (Thermo Fisher Scientific). The primers used in the real-time PCR assays are listed in Supplementary Table 10. Data represent the percentage of input normalized to ACTB with s.d. Student’s t test (two-tailed, unpaired) was used to test for significance from three independent chromatin preparations.
© 2
017
Nat
ure
Am
eric
a, In
c., p
art
of
Sp
rin
ger
Nat
ure
. All
rig
hts
res
erve
d.

Nature GeNetics doi:10.1038/ng.3884
4C analysis. 4C–seq experiments were carried out as described42–44. 4C librar-ies were prepared using NlaIII–DpnII enzyme combinations for the FAF2 and RNF44 promoters. Primer sequences are listed in Supplementary Table 10. For the FAF2 viewpoint, two technical replicates each of one wild-type K562 clone and two ∆Ep.FAF2 clones were analyzed. For the RNF44 viewpoint, one wild-type K562 clone, two ∆Ep.FAF2 clones and one Inv.Ep.FAF2 clone were analyzed. Samples were sequenced and used for downstream analysis as independent replicates and as a merged data set. 4C–seq data process-ing was performed as described45 using the NCBI human assembly GRCh37 (hg19), and detailed analysis and visualization were carried out using r3Cseq and FourCseq software46,47. For a visible data profile, normalized RPM data were smoothed via a running-mean approach and quantiles (40%, 50% and 60%) were further smoothed and interpolated with the R loess function using Basic4Cseq48.
Distal association with interferon response. Human type I interferon response genes were retrieved from Interferome database v2.01 (ref. 49). We then selected the interferon response genes distally interacting with an Epromoter on the basis of ChIA-PET data (Supplementary Table 5). The list of Epromoters distally interacting with interferon response genes is provided in Supplementary Table 6.
eQTL analysis. eQTL data were obtained from GTEx project portal version 6 and lifted over to hg19 coordinates to match capture promoter data. Using GenomicRanges50, capture promoter coordinates were extended 1.5 kb to each side to capture overlapping eQTLs that could be mechanistically related to these promoters. ChIA-PET promoter–promoter pairs were obtained as described below. Promoter–promoter pairs were annotated using capture promoters and eQTL overlaps to determine long- and close-range interaction effects between pairs. We were able to annotate 4,310 of 7,825 pairs (Supplementary Table 7). Customized R scripts were used to analyze the relationship between eQTL β value (effect size) and long- and close-range gene promoter interactions in the annotated promoter–promoter pairs and to determine whether eQTLs were located within the extended region of an Epromoter or a non-Epromoter. Taking only eQTLs affecting the distal gene in the pair, the β-value bimodal distributions of these eQTLs were split into negative and positive values by fitting a two-component mixture model (R mixtool package51) and looking for the cutoff where the probability of a negative value being generated by the left distribution was ≥0.5. To test whether Epromoter-associated β values were stronger than the ones associated with non-Epromoters, we independently compared negative and positive β-value sets using a one-tailed non-parametric Wilcoxon rank-sum test (wilcox.test R function) and corrected for multiple testing using the Benjamini–Hochberg method (p.adjust R function). The statistical analyses to predict the impact of eQTL SNPs on transcription factor binding sites is detailed in the Supplementary Note.
Statistics. All experiments were performed using at least three independent samples or transfections. R/Bioconductor or GraphPad Prism 6.0 was used for statistical analysis. For comparisons in Venn diagram representations, a hypergeometric test was performed. Unless otherwise indicated in the figure legends, for comparisons between two groups of equal sample size and small n (like in qPCR dot plots), an unpaired two-tailed Student’s t test was performed; for comparisons between two groups of equal sample size and large n (as in box-plot representations), a two-tailed Mann–Whitney U test was performed. For comparisons of two distributions, a Kolmogorov–Smirnov test was
performed. P < 0.05 was considered to be statistically significant, and error bars represent s.d. Investigators were not blinded to sample identity.
Data availability. All custom scripts have been made available at https://github.com/arielgalindoalbarran/Epromoters. Human CapStarr-seq and 4C data gen-erated during the current study are available in the Gene Expression Omnibus (GEO) under accessions GSE83296 (Supplementary Table 8) and GSE98194, respectively. Mouse CapStarr-seq data analyzed during the current study were published previously18 and are available in GEO under accession GSE60029. All public data sets and primers used are described in Supplementary Tables 9 and 10, respectively.
31. Mombaerts, P., Terhorst, C., Jacks, T., Tonegawa, S. & Sancho, J. Characterization of immature thymocyte lines derived from T-cell receptor or recombination activating gene 1 and p53 double mutant mice. Proc. Natl. Acad. Sci. USA 92, 7420–7424 (1995).
32. Dao, L.T.M., Vanhille, L., Griffon, A., Fernandez, N. & Spicuglia, S. CapStarr-seq protocol. Protocol Exchange http://dx.doi.org/10.1038/protex.2015.096 (2015).
33. Glusman, G., Caballero, J., Robinson, M., Kutlu, B. & Hood, L. Optimal scaling of digital transcriptomes. PLoS One 8, e77885 (2013).
34. Reimand, J. et al. g:Profiler-a web server for functional interpretation of gene lists (2016 update). Nucleic Acids Res. 44, W1 W83-9 (2016).
35. McLean, C.Y. et al. GREAT improves functional interpretation of cis-regulatory regions. Nat. Biotechnol. 28, 495–501 (2010).
36. Saeed, A.I. et al. TM4: a free, open-source system for microarray data management and analysis. Biotechniques 34, 374–378 (2003).
37. Kuznetsova, T. et al. Glucocorticoid receptor and nuclear factor kappa-b affect three-dimensional chromatin organization. Genome Biol. 16, 264 (2015).
38. Tang, Z. et al. CTCF-Mediated Human 3D Genome Architecture Reveals Chromatin Topology for Transcription. Cell 163, 1611–1627 (2015).
39. Naito, Y., Hino, K., Bono, H. & Ui-Tei, K. CRISPRdirect: software for designing CRISPR/Cas guide RNA with reduced off-target sites. Bioinformatics 31, 1120–1123 (2015).
40. Mali, P. et al. RNA-guided human genome engineering via Cas9. Science 339, 823–826 (2013).
41. Thorvaldsdóttir, H., Robinson, J.T. & Mesirov, J.P. Integrative Genomics Viewer (IGV): high-performance genomics data visualization and exploration. Brief. Bioinform. 14, 178–192 (2013).
42. Stadhouders, R. et al. Multiplexed chromosome conformation capture sequencing for rapid genome-scale high-resolution detection of long-range chromatin interactions. Nat. Protoc. 8, 509–524 (2013).
43. Stadhouders, R. et al. HBS1L-MYB intergenic variants modulate fetal hemoglobin via long-range MYB enhancers. J. Clin. Invest. 124, 1699–1710 (2014).
44. Vieux-Rochas, M., Fabre, P.J., Leleu, M., Duboule, D. & Noordermeer, D. Clustering of mammalian Hox genes with other H3K27me3 targets within an active nuclear domain. Proc. Natl. Acad. Sci. USA 112, 4672–4677 (2015).
45. Stadhouders, R. et al. Control of developmentally primed erythroid genes by combinatorial co-repressor actions. Nat. Commun. 6, 8893 (2015).
46. Thongjuea, S., Stadhouders, R., Grosveld, F.G., Soler, E. & Lenhard, B. r3Cseq: an R/Bioconductor package for the discovery of long-range genomic interactions from chromosome conformation capture and next-generation sequencing data. Nucleic Acids Res. 41, e132 (2013).
47. Klein, F.A. et al. FourCSeq: analysis of 4C sequencing data. Bioinformatics 31, 3085–3091 (2015).
48. Walter, C., Schuetzmann, D., Rosenbauer, F. & Dugas, M. Basic4Cseq: an R/Bioconductor package for analyzing 4C-seq data. Bioinformatics 30, 3268–3269 (2014).
49. Rusinova, I. et al. Interferome v2.0: an updated database of annotated interferon-regulated genes. Nucleic Acids Res. 41, D1040–D1046 (2013).
50. Lawrence, M. et al. Software for computing and annotating genomic ranges. PLOS Comput. Biol. 9, e1003118 (2013).
51. Benaglia, T., Chauveau, D., Hunter, D.R. & Young, D.S. mixtools: An R Package for Analyzing Finite Mixture Models. J. Stat. Softw. 32, 1–29 (2009).
© 2
017
Nat
ure
Am
eric
a, In
c., p
art
of
Sp
rin
ger
Nat
ure
. All
rig
hts
res
erve
d.
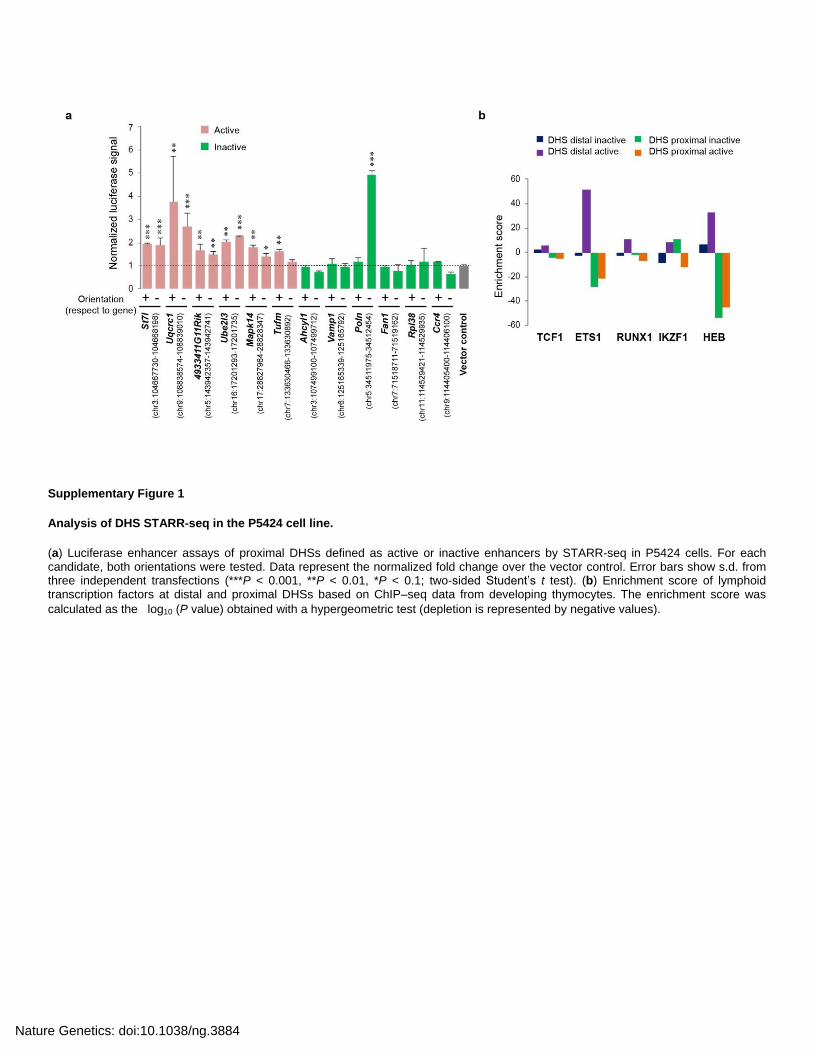
Supplementary Figure 1
Analysis of DHS STARR-seq in the P5424 cell line.
(a) Luciferase enhancer assays of proximal DHSs defined as active or inactive enhancers by STARR-seq in P5424 cells. For each candidate, both orientations were tested. Data represent the normalized fold change over the vector control. Error bars show s.d. from three independent transfections (***P < 0.001, **P < 0.01, *P < 0.1; two-sided Student’s t test). (b) Enrichment score of lymphoid transcription factors at distal and proximal DHSs based on ChIP–seq data from developing thymocytes. The enrichment score was
calculated as the log10 (P value) obtained with a hypergeometric test (depletion is represented by negative values).
Nature Genetics: doi:10.1038/ng.3884

Nature Genetics: doi:10.1038/ng.3884
Supplementary Figure 2
CapStarr-seq experimental control and epigenomic profiles of Epromoters in K562 and HeLa cells.
(a) IGV screenshots of STARR-seq signals for four STARR-seq-positive controls in HeLa cells. (b) FACS analysis of GFP expression in K562 (left) and HeLa (right) cells transfected with a human promoter library or empty vector. Controls were untransfected cells. The increase in GFP expression in transfected cells with the promoter library indicates potential enhancer activity in the pooled library. (c) Overlap with CpG islands (50%) and regions conserved in placental mammals (10%) using the EpiExplorer tool. The control is non-Epromoters with equal levels of gene expression as Epromoters in the same cell type. (d) Average profiles of epigenomic features for Epromoters and control promoters with the same expression pattern of associated genes. Statistical significance was calculated in a
region centered on the TSS ( 1 kb) using two-sided Mann–Whitney U tests. Only significant differences (P < 0.001) are shown. (e)
Percentage of chromatin state 4 (strong enhancers) found in K562 Epromoters (left) and HeLa Epromoters (right) across ENCODE cell lines using the EpiExplorer tool. (f,g) Density plots of TSS positions corresponding to the selected promoter regions using CAGE peaks from ENCODE data in HeLa (f, top) and K562 (f, bottom) cells and data from FANTOM3 (g, top) and FANTOM5 (g, bottom) (Kolmogorov test). (h) Percentage of TSSs assigned to RefSeq-defined TSSs using different CAGE databases (from data in Supplementary Table 2b). (i) Comparison of the number of different RefSeq-defined TSSs per coding gene (one-sided Mann–Whitney U test).
Nature Genetics: doi:10.1038/ng.3884

Supplementary Figure 3
Assessment of the IFN- signaling pathway.
(a) Cumulative plot of normalized RNA levels (FPKM) for genes from the IFN- signaling pathway (Reactome), based on RNA–seq
data from 23 cell lines. The HeLa and K562 cell lines are highlighted (Kolmogorov test). (b) Heat map showing RNA–seq relative
expression (FPKM) for genes from the IFN- signaling pathway (Reactome) expressed at significantly higher levels in HeLa cells as
compared to the 22 remaining cell lines (SAM analysis; = 0.5). (c) Transcription signatures related to stress/interferon response
significantly enriched in the set of Epromoter-associated genes in HeLa cells (GREAT tool).
Nature Genetics: doi:10.1038/ng.3884

Supplementary Figure 4
Enrichment of transcription factors at Epromoters.
(a,b) Average profiles of ChIP–seq signals for ENCODE transcription factors enriched at Epromoters in K562 (a) and HeLa (b) cells.
Statistical significances were calculated in a region centered on the TSS ( 250 bp) using two-sided Mann–Whitney U tests.
Nature Genetics: doi:10.1038/ng.3884
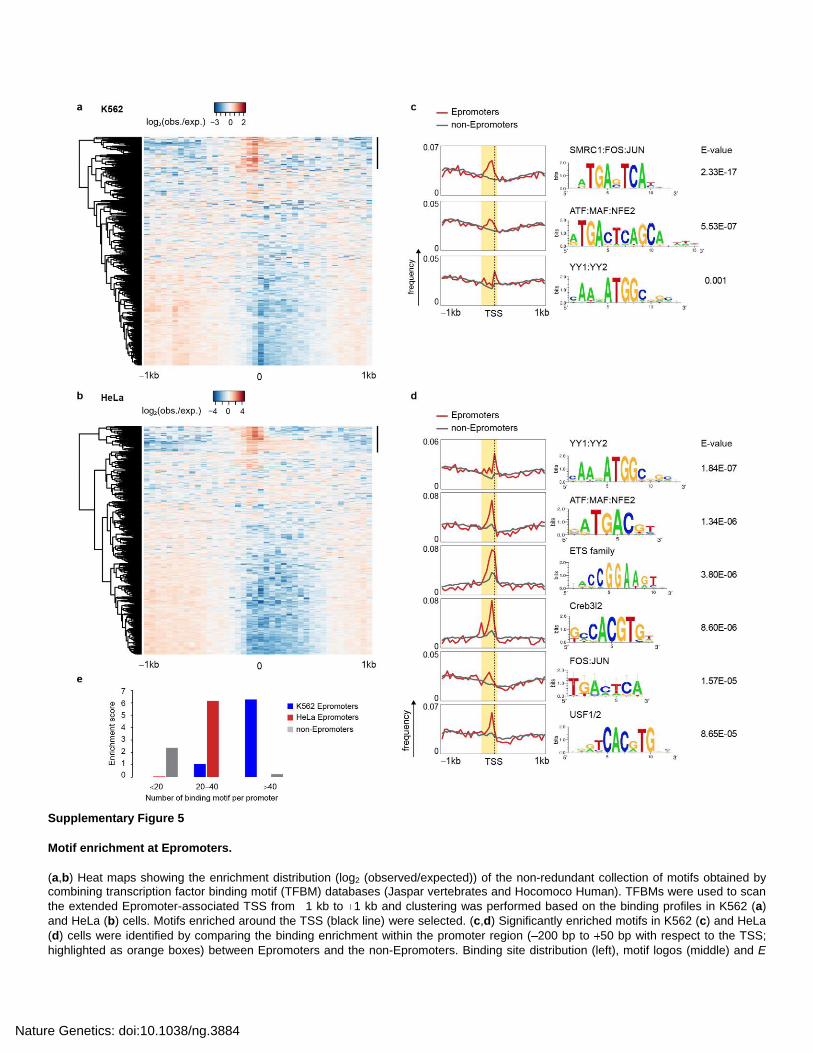
Supplementary Figure 5
Motif enrichment at Epromoters.
(a,b) Heat maps showing the enrichment distribution (log2 (observed/expected)) of the non-redundant collection of motifs obtained by combining transcription factor binding motif (TFBM) databases (Jaspar vertebrates and Hocomoco Human). TFBMs were used to scan
the extended Epromoter-associated TSS from 1 kb to 1 kb and clustering was performed based on the binding profiles in K562 (a)
and HeLa (b) cells. Motifs enriched around the TSS (black line) were selected. (c,d) Significantly enriched motifs in K562 (c) and HeLa
(d) cells were identified by comparing the binding enrichment within the promoter region ( 200 bp to 50 bp with respect to the TSS;
highlighted as orange boxes) between Epromoters and the non-Epromoters. Binding site distribution (left), motif logos (middle) and E
Nature Genetics: doi:10.1038/ng.3884

values (right) are shown only for significantly enriched motifs (E < 0.001; 2 test). (e) Enrichment of Epromoters and non-Epromoters as
a function of the number of different TFBMs found. The enrichment score was calculated as the log10 (P value) obtained by
hypergeometric test.
Nature Genetics: doi:10.1038/ng.3884
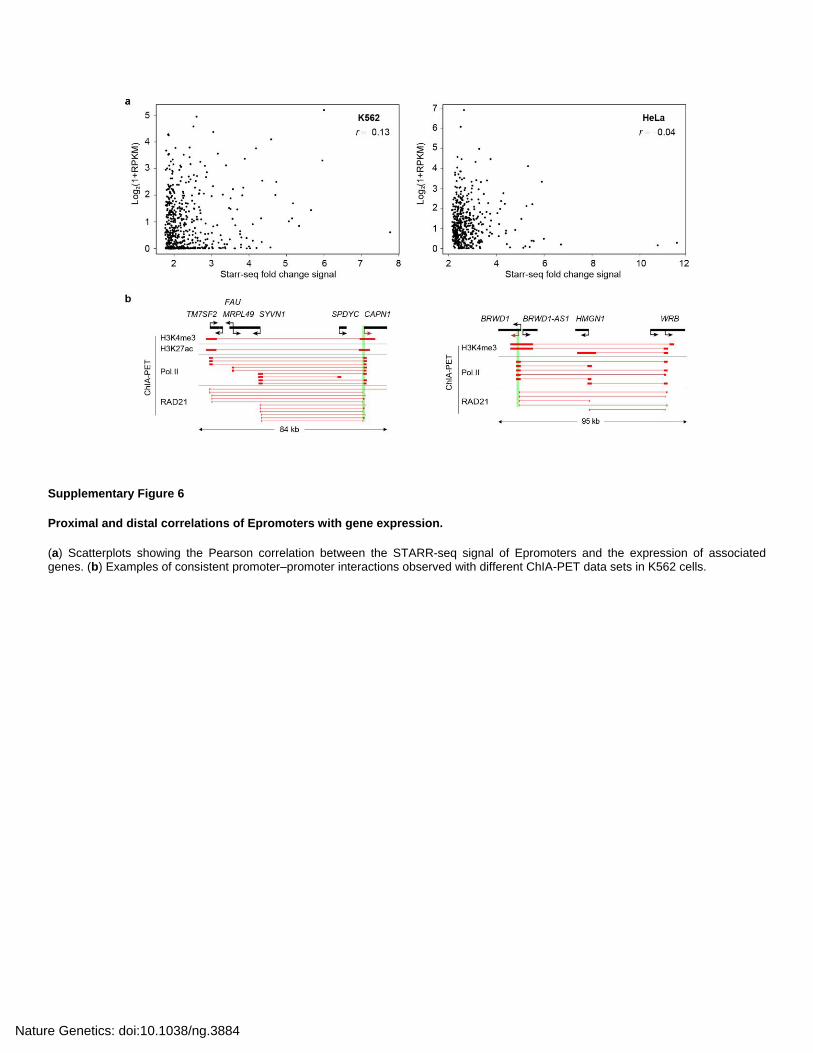
Supplementary Figure 6
Proximal and distal correlations of Epromoters with gene expression.
(a) Scatterplots showing the Pearson correlation between the STARR-seq signal of Epromoters and the expression of associated genes. (b) Examples of consistent promoter–promoter interactions observed with different ChIA-PET data sets in K562 cells.
Nature Genetics: doi:10.1038/ng.3884

Supplementary Figure 7
Generation of knockout and knock-in cell clones via CRISPR–Cas9.
(a) General strategy for the generation of (E)promoter knockouts. Two gRNAs, G1 and G2, were designed flanking the genomic target
to delete the intervening DNA segment. The CRISPR–Cas9 system creates two double-strand breaks (DSBs) at 3 4 nt upstream of
the PAM sequences (red) and releases the excised DNA (purple). The resulting DSB is repaired by the NHEJ pathway. The genomic deletion is detected by PCR using primers P1 and P2. (b–h) Assessment of (E)promoter knockout. Left, IGV screenshots showing the DNase-seq (ENCODE) and RefSeq tracks for targeted regions. The locations of gRNAs (red boxes) and the expected sizes of deleted regions are indicated. Right, PCR validation of biallelic deletion in corresponding cell clones. Details on the gRNA sequences, PCR
Nature Genetics: doi:10.1038/ng.3884

primers and expected PCR fragments are provided in Supplementary Table 9. (i) Strategy for the generation of the inverted FAF2 Epromoter knock-in. The two gRNAs, G1 and G2, used to generate DSBs are as in the knockout experiment. The repair template contains upstream and downstream homologous arms (HAs) flanking the inverted FAF2 Epromoter. The HDR-mediated repair pathway generates the inverted FAF2 Epromoter knock-in, which is detected by PCR with the combination of two primer pairs (1 + 2) and (2 + 3). (j) PCR validation of a successful inverted FAF2 Epromoter knock-in cell clone using the combination of primers shown in i. (k) RT–PCR detection of antisense (AS) transcription in an Inv.Ep.FAF2 clone. GAPDH was used as a cDNA loading control.
Nature Genetics: doi:10.1038/ng.3884
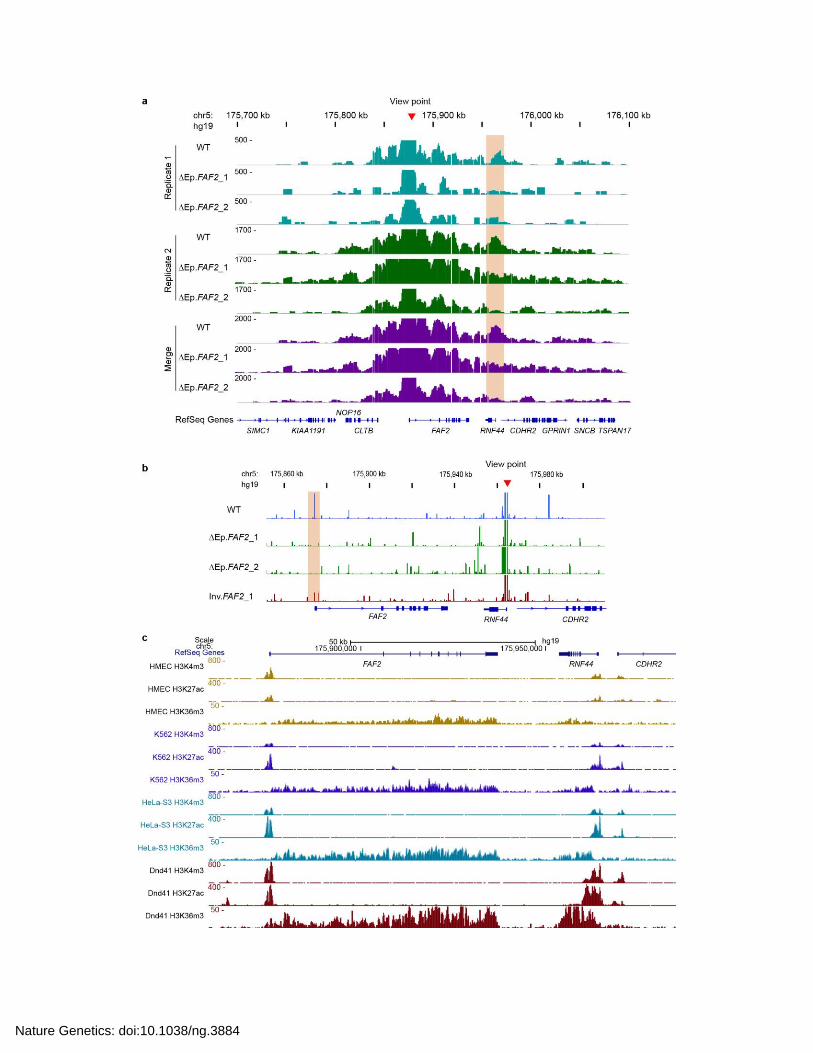
Nature Genetics: doi:10.1038/ng.3884

Supplementary Figure 8
Interaction and epigenetic co-regulation of FAF2 and RNF44.
(a) Genomic tracks showing the 4C–seq analysis of interactions between the FAF2 (a) and RNF44 (b) promoters in WT and knockout K562 clones. The viewpoint from the FAF2 Epromoter is indicated by an arrowhead. The specific interaction between the FAF2 and RNF44 promoters is highlighted by the orange box. (b) UCSC Genome Browser tracks for H3K4me3, H3K27ac and H3K36me3 at the FAF2 locus and nearby regions across the HMEC, K562, HeLa and DND41 cell lines.
Nature Genetics: doi:10.1038/ng.3884
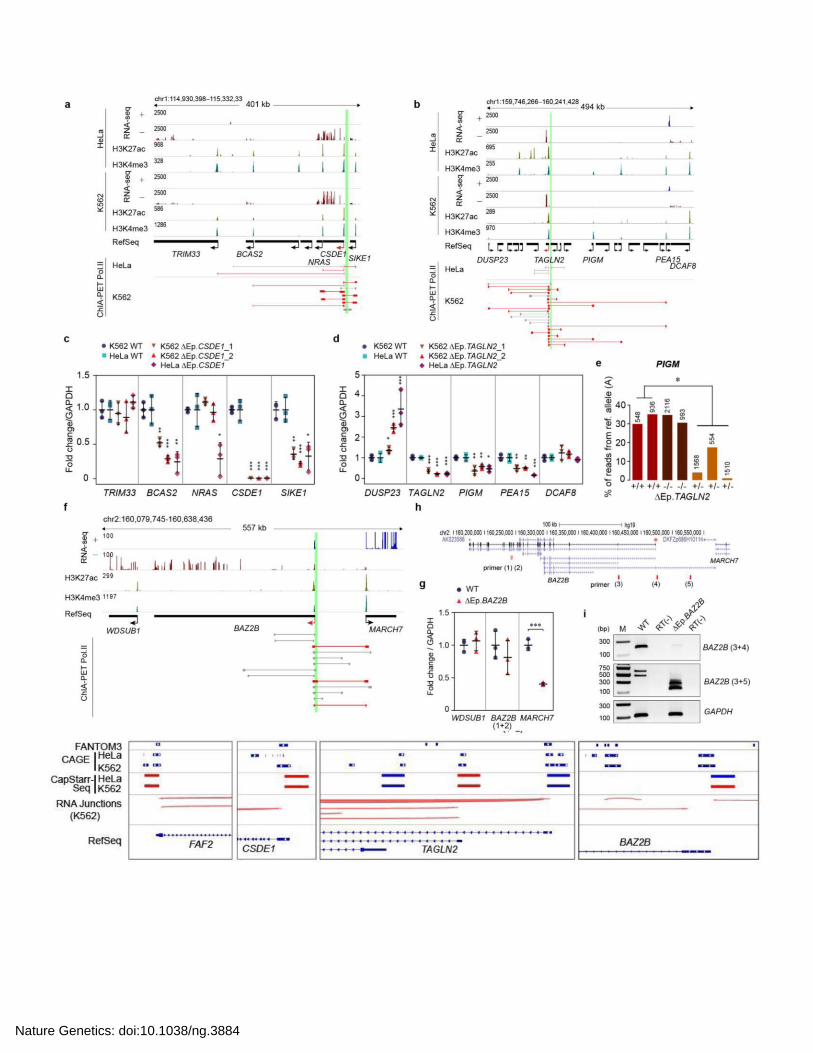
Nature Genetics: doi:10.1038/ng.3884

Supplementary Figure 9
Additional validations of distal gene regulation by Epromoters.
(a,b) IGV tracks for RNA–seq, ChIP–seq and ChIA-PET Pol II data in K562 and HeLa cells at the CSDE1 (a) and TAGLN2 (b) loci and nearby regions. The promoter–promoter interactions for Epromoters are highlighted in red. (c,d) qPCR analysis of gene expression in
WT, Ep.CSDE1 (c) and Ep.TAGLN2 (d) clones. The number following the gene name is the number of independent cell clones. (e)
Allelic frequency of the A versus T variant (chr1:160000435) in PIGM transcripts in WT, Ep.TAGLN2 homozygous and Ep.TAGLN2
heterozygous K562 clones. The total number of reads is indicated for each sample. The significant deviation of allelic frequency in heterozygous clones with respect to homozygous samples was calculated by performing a one-sided Student’s t test. (f) IGV screenshot showing tracks for RNA–seq, ChIP–seq and ChIA-PET Pol II data in K562 cells at the BAZ2B locus and the nearby region.
(g) qPCR analysis of gene expression in WT and Ep.BAZ2B clones. Knockout of the BAZ2B Epromoter resulted in significant
reduction of MARCH7 expression but had no effect on the nearby gene WDSUB1 or BAZ2B (using primers 1 and 2 shown in h). (h) UCSC Genome Browser tracks showing the different BAZ2B transcripts and primers used in g and i. (i) Alternative promoter usage for
the BAZ2B gene was assessed by RT–PCR in K562 cells. The smaller fragment size observed in Ep.BAZ2B clones corresponds to
the deletion of exon 1 (asterisk in h). (j) IGV tracks for FANTOM3 and ENCODE CAGE data, CapStarr-seq regions and RNA junctions around the TSS of the indicated gene. The red color in CapStarr-seq tracks represents active Epromoters. For c, d and g, error bars show s.d. (n = 3 independent RNA/cDNA preparation; ***P < 0.001, **P < 0.01, *P < 0.1, two-sided Student’s t test).
Nature Genetics: doi:10.1038/ng.3884

Supplementary Figure 10
Epromoters involved in IFN- signaling in K562 cells.
(a) Distribution of expression correlation for ChIA-PET interacting gene pairs including at least one Epromoter (red) or excluding Epromoters (gray) and randomly rewired gene pairs (green) using RNA–seq data from ENCODE. Statistical significance was assessed by Kolmogorov test. (b) Examples of clusters of interferon response genes (green labels) associated with Epromoters (red arrows) in
HeLa cells. (c–e) qPCR analysis of gene expression in WT, Ep.YPEL4 (c,d) and Ep.METTL21A (e) cell clones. Error bars show s.d
(n = 3 independent RNA/cDNA preparations). (f) Allelic frequency of the T versus C variant (chr11:57319339) in UBE2L6 transcripts in
WT, Ep.YPEL4 homozygous and Ep.YPEL4 heterozygous K562 clones. The total number of reads is indicated for each sample. The
significant deviation of allelic frequency in heterozygous clones with respect to homozygous samples was calculated by performing a one-sided Student’s t test.
Nature Genetics: doi:10.1038/ng.3884

8
Supplementary Note
Extended Methods
Construction of the human promoter library
Genomic library was generated from a pool of genomic DNA extracted from peripheral blood cells of
healthy donors. For target enrichment, a home-designed 3 bp resolution oligonucleotide microarray
covering from 200 to 50 bp relative to the TSS of 20,719 human protein-coding genes was
constructed using the SureSelect technology (Agilent, 1M format) and the eArray tool default settings
(https://earray.chem.agilent.com/earray/). In addition, 4 STARR-seq positive controls previously
identified as enhancers in HeLa1 and 370 random genomic regions (250 bp) without active
epigenomic features in ENCODE cell lines were included (Supplementary Table 2a).
TSS analyses and comparison with CAGE data
To compare the number of distinct TSS from coding genes associated with Epromoters or non-
Epromoters, the hg19 RefSeq annotation was retrieved from UCSC Table Browser
(http://genome.ucsc.edu/cgi-bin/hgTables) and the number of transcripts from the same coding gene
with different start coordinates was computed and graphed by R software in a bar plot
(Supplementary Fig. 2i). To corroborate the TSS position of Epromoters, CAGE tags TSS data from
FANTOM3 (http://gerg01.gsc.riken.jp/cage_analysis/export/hg17prmtr), FANTOM5
(http://fantom.gsc.riken.jp/5/data/) or HeLa and K562 CAGE peaks from ENCODE
(https://www.encodeproject.org/) were obtained (source data in Supplementary Table 10). The
FANTOM3 data was lifted into hg19 genome annotation (LiftOver by UCSC tools) and processed to
obtain a CAGE set (tag clusters with ≥ 2 tags) according to Hayashizaki et al.2. Intersection between
CAGE-defined TSSs and the promoter regions (from 200 to 50 bp relative to the RefSeq-defined
TSS) was retrieved by BedTools (v2.25.0) (Supplementary Table 2b). The percentages of
intersections are shown in Supplementary Fig. 2h. Density plots were graphed by R software. A
Kolgomorov test was performed between each pair of promoter sets (Supplementary Fig. 2f, g).
Building of a non-redundant database of TFBS
A non-redundant motif database was built by merging 641 motifs from the Hocomoco Human motif
database3, and 519 motifs from the JASPAR core vertebrate4, versions 2016 for both databases. Motif
analysis was performed with the Regulatory Sequence Analysis Tools suite5. The merged collection
was reduced to 486 non-redundant motifs with matrix-clustering. We used very stringent parameters
(correlation ≥ 0.85, width-normalized correlation ≥ 0.7) in order to merge only motifs of high
similarity and sizes. Matrices were regrouped by hierarchical clustering, using the width-normalized
correlation as similarity metric
Generation of FAF2-Epromoter inverted clones
For the inversion of FAF2-Epromoter, the upstream homology arm (796 bp; chr5:176,447,045-
176,447,840) and downstream homology arm (793 bp; chr5:176,448,483-176,449,275) flanking the
inverted FAF2-Epromoter (642 bp; chr5:176,447,841-176,448,482) were PCR amplified, purified and
assembled using Gibson Assembly Master Mix (NEB). The assembled product was then cloned into
Nature Genetics: doi:10.1038/ng.3884
9
pGEM-T Easy vector (Promega) generating the repair template for homologous directed repair
pathway (HDR) (Supplementary Fig. 7i). K562 cells were transfected with 8 g of hCas9 vector, 4
g of each gRNA (same as for the knockout experiment) and 4 g of repair template. After 3 days of
transfection, cells were plated in 96-well plates for clonal expansion as described above. For inversion
detection, the specific primer pairs were designed as shown in Supplementary Fig. 7i and
Supplementary Table 9. Primer 1 and 3 were designed outside of inverted region, while primer 2
was inside and has the same direction as primer 3, allowing the detection of inverted FAF2-Epromoter
in genomic DNA. The inverted FAF2-Epromoter clones were defined as having PCR amplification of
inversion band (with primer 1 and primer 2) and absence of wild-type band (with primer 2 and primer
3) (Supplementary Fig. 7j).
Generation of eQTL-SNP mutated clones
For the study of eQTL SNPs, a gRNA was design to create a break near the target (the 20 nt of gRNA
overlap with the target SNP; Supplementary Table 9). A 100 bp single-stranded Oligo Donor
(ssODN) centered on the SNP was used as HR template. High-quality ssODNs were synthesized and
PAGE purified (Sigma Aldrich). K562 cells were transfected with 5 g of gRNA, 10 g of hCas9 and
1 l of 100 M ssODN template. The clonal expansion was performed as above. For clonal screening,
individual cell clones were subjected to PCR using Phire Tissue PCR Master Mix (ThermoFisher
Scientific) followed manufacture’s protocol. Forward and reverse primers were designed bracketing
the target SNP. The PCR products were then purified using MinElute Purification kit (Qiagen) and
sequenced (Eurofins Genomics). For CSDE1 SNP (rs6681671; NC_000001.10:g.115300685C>T) we
obtained a clone harboring a homozygous replacement of the reference allele (C) by the alternative
allele (T) and selected for further analyses (rs6681671_T/T). For BAZ2B SNP (rs1046496;
NC_000002.11:g.160473399A>T) no homozygous replacement was obtained; instead we selected a
homozygous deletion of the SNP ( rs1046496).
Chromatin immunoprecipitation (ChIP)
ChIP Total 40 106 K562 cells were crosslinked in 1% formaldehyde for 10 min at 20 C, followed
by quenching with glycine at a final concentration of 250 mM. Pelleted cells were washed twice with
ice-cold PBS, and then re-suspended in lysis buffer (20 mM Hepes pH 7.6, 1% SDS, 1X PIC) at final
cell concentration of 15 106 cells/ml. Chromatin was sonicated with Bioruptor (Diagenode) to an
average length of 200-400 bp (5 pulses of 30 sec ON and 30 sec OFF). An aliquot of sonicated cell
lysate equivalent to 0.5 106 cells was diluted with SDS-free dilution buffer (1% Triton X-100, 1.2
mM EDTA, 16.7 mM Tris pH 8.0, 167 mM NaCl) for single immunoprecipitation. Specific antibodies
(1 g per ChIP) and proteinase inhibitor cocktail were added to the lysate and rotated overnight at 4
C. The antibodies used were as follows: H3K4me3 (C15410003-50) and H3K27ac (C15410196)
(Diagenode). On the next day, Protein A magnetic beads (Invitrogen) were washed twice with dilution
buffer (0.15% SDS, 1% Triton X-100, 1.2 mM EDTA, 16.7 mM Tris pH 8, 167 mM NaCl and 0.1%
BSA) and added to the lysate and rotated 1 hour at 4 C. Then, beads were washed with each of the
following buffers: once with Wash Buffer 1 (2 mM EDTA, 20 mM Tris pH 8, 1% Triton X-100, 0.1%
SDS, 150 mM NaCl), twice with Wash Buffer 2 (2 mM EDTA, 20 mM Tris pH 8, 1% Triton X-100,
Nature Genetics: doi:10.1038/ng.3884

10
0.1% SDS, 500 mM NaCl), twice with Wash Buffer 3 (1 mM EDTA, 10 mM Tris pH 8). Finally,
beads were eluted in Elution buffer (1% SDS, 0.1 M NaHCO3) and rotated at RT for 20 min. Eluted
materials were then added with 0.2 M NaCl, 0.1 mg/ml of proteinase K and incubated overnight at 65
C for reverse cross-linking, along with the untreated input (10% of the starting material). The next
day, DNA was purified with QIAquick PCR Purification Kit (Qiagen) and eluted in 30 l of water.
Prediction of eQTL impact on TF binding sites
In order to predict the effect on transcription factor binding of eQTL variants associated with distal
gene regulation (Supplementary Table 7), we used the tool variation-scan from the RSAT tool
suite6. In order to reduce false positives we set out to assesses the impact of each eQTL allele on TF
binding using only motifs for biologically relevant TFs that were found to be over-represented in the
Epromoters sequence set (Supplementary Fig. 4), as suggested previously7. For each eQTL within
the assayed promoters the binding affinity for one motif was assessed for both alleles, if one of the
alleles had a binding score with a P value ≤ 1x10⁻³ then a ratio between the P values for both alleles
from the eQTL were compared, if the ratio was ≥ 10 then the eQTL was considered as having a
putative effect on TFBSs. We compared the number of eQTLs affecting TF binding vs the not
affecting between Epromoters and non-Epromoters using a fisher exact test. Using the same test we
also compared the number of eQTLs affecting binding in Epromoters and non-Epromoters between
eQTLs with positive and negative beta values. P values for fisher tests were corrected using
Benjamini & Hochberg method in p.adjust R command. Distribution of beta-values for eQTLs
putatively affecting and not affecting TF binding were compared between non-Epromoters and
Epromoters using a one tailed non-parametric Wilcoxon Rank Sum Test (wilcox.test R function,
alternative "less"), and corrected for multiple testing using Benjamini & Hochberg (p.adjust R
function).
References
1 Arnold, C. D. et al. Genome-wide quantitative enhancer activity maps identified by STARR-seq. Science 339, 1074-1077, (2013).
2 Carninci, P. et al. Genome-wide analysis of mammalian promoter architecture and evolution. Nature genetics 38, 626-635, (2006).
3 Kulakovskiy, I. V. et al. HOCOMOCO: expansion and enhancement of the collection of transcription factor binding sites models. Nucleic acids research 44, D116-125, (2016).
4 Mathelier, A. et al. JASPAR 2016: a major expansion and update of the open-access database of transcription factor binding profiles. Nucleic acids research 44, D110-115, (2016).
5 Medina-Rivera, A. et al. RSAT 2015: Regulatory Sequence Analysis Tools. Nucleic acids research, (2015).
6 Medina-Rivera, A. et al. RSAT 2015: Regulatory Sequence Analysis Tools. Nucleic acids research 43, W50-56, (2015).
7 Andersen, M. C. et al. In silico detection of sequence variations modifying transcriptional regulation. PLoS Comput Biol 4, e5, (2008).
Nature Genetics: doi:10.1038/ng.3884
Copyright © 2022 FDOKUMEN