Distinguishing migration from isolation using genes with intragenic recombination: detecting...
13
METHODOLOGY ARTICLE Open Access Distinguishing migration from isolation using genes with intragenic recombination: detecting introgression in the Drosophila simulans species complex Miguel Navascués 1,2 , Delphine Legrand 3,4 , Cécile Campagne 4 , Marie-Louise Cariou 4 and Frantz Depaulis 1,5* Abstract Background: Determining the presence or absence of gene flow between populations is the target of some statistical methods in population genetics. Until recently, these methods either avoided the use of recombining genes, or treated recombination as a nuisance parameter. However, genes with recombination contribute additional information for the detection of gene flow (i.e. through linkage disequilibrium). Methods: We present three summary statistics based on the spatial arrangement of fixed differences, and shared and exclusive polymorphisms that are sensitive to the presence and direction of gene flow. Power and false positive rate for tests based on these statistics are studied by simulation. Results: The application of these tests to populations from the Drosophila simulans species complex yielded results consistent with migration between D. simulans and its two endemic sister species D. mauritiana and D. sechellia, and between populations D. mauritiana on the islands of the Mauritius and Rodrigues. Conclusions: We demonstrate the sensitivity of the developed statistics to the presence and direction of gene flow, and characterize their power as a function of differentiation level and recombination rate. The properties of these statistics make them especially suitable for analyzing high-throughput sequencing data or for their integration within the approximate Bayesian computation framework. Keywords: Shared polymorphism, Recombination, Hybridization, Gene flow, Incomplete lineage sorting, Drosophila simulans complex Background Assessing gene flow is essential for any study of speci- ation or local adaptation, as gene flow is a force counter- acting those processes. Classic models of population genetics consider the source of genetic differentiation between populations (F ST ) to result either from an equi- librium between migration and drift (island model) or from drift since the time of divergence (isolation model). Thus, population geneticists would estimate migration rates [1] or time of divergence [2] from F ST based on their (expert) opinion or other non-genetic evidence that their study system fitted best to one of the two alterna- tive models. The first attempt to distinguish between both scenarios using genetic data was made by Wakeley [3], who noted that the variance of pairwise differences was expected to be higher under the migration model and proposed a test statistic based on this prediction. However, a test based on the variance of pairwise differ- ences shows low power [3], is highly influenced by re- combination, and has seen only limited implementation. A significant advance was the development of likelihood- based methods under the isolation-with-migration model e.g. [4]. In this approach, the model consists of two popu- lations that diverge from an ancestral population and ex- change migrants, and the values of these parameters * Correspondence: [email protected] 1 UMR 7625 Écologie et Évolution (CNRS/École Normale Supérieure/Université Pierre et Marie Curie), Paris, France 5 Laboratoire d’Écologie, École Normale Supérieure, 46 rue d’Ulm, 75230 Paris cedex 05, France Full list of author information is available at the end of the article © 2014 Navascués et al.; licensee BioMed Central Ltd. This is an Open Access article distributed under the terms of the Creative Commons Attribution License (http://creativecommons.org/licenses/by/2.0), which permits unrestricted use, distribution, and reproduction in any medium, provided the original work is properly credited. The Creative Commons Public Domain Dedication waiver (http://creativecommons.org/publicdomain/zero/1.0/) applies to the data made available in this article, unless otherwise stated. Navascués et al. BMC Evolutionary Biology 2014, 14:89 http://www.biomedcentral.com/1471-2148/14/89
Transcript of Distinguishing migration from isolation using genes with intragenic recombination: detecting...

Navascués et al. BMC Evolutionary Biology 2014, 14:89http://www.biomedcentral.com/1471-2148/14/89
METHODOLOGY ARTICLE Open Access
Distinguishing migration from isolation usinggenes with intragenic recombination: detectingintrogression in the Drosophila simulans speciescomplexMiguel Navascués1,2, Delphine Legrand3,4, Cécile Campagne4, Marie-Louise Cariou4 and Frantz Depaulis1,5*
Abstract
Background: Determining the presence or absence of gene flow between populations is the target of somestatistical methods in population genetics. Until recently, these methods either avoided the use of recombininggenes, or treated recombination as a nuisance parameter. However, genes with recombination contributeadditional information for the detection of gene flow (i.e. through linkage disequilibrium).
Methods: We present three summary statistics based on the spatial arrangement of fixed differences, and sharedand exclusive polymorphisms that are sensitive to the presence and direction of gene flow. Power and falsepositive rate for tests based on these statistics are studied by simulation.
Results: The application of these tests to populations from the Drosophila simulans species complex yielded resultsconsistent with migration between D. simulans and its two endemic sister species D. mauritiana and D. sechellia,and between populations D. mauritiana on the islands of the Mauritius and Rodrigues.
Conclusions: We demonstrate the sensitivity of the developed statistics to the presence and direction of geneflow, and characterize their power as a function of differentiation level and recombination rate. The properties ofthese statistics make them especially suitable for analyzing high-throughput sequencing data or for their integrationwithin the approximate Bayesian computation framework.
Keywords: Shared polymorphism, Recombination, Hybridization, Gene flow, Incomplete lineage sorting, Drosophilasimulans complex
BackgroundAssessing gene flow is essential for any study of speci-ation or local adaptation, as gene flow is a force counter-acting those processes. Classic models of populationgenetics consider the source of genetic differentiationbetween populations (FST) to result either from an equi-librium between migration and drift (island model) orfrom drift since the time of divergence (isolation model).Thus, population geneticists would estimate migrationrates [1] or time of divergence [2] from FST based on
* Correspondence: [email protected] 7625 Écologie et Évolution (CNRS/École Normale Supérieure/UniversitéPierre et Marie Curie), Paris, France5Laboratoire d’Écologie, École Normale Supérieure, 46 rue d’Ulm, 75230 Pariscedex 05, FranceFull list of author information is available at the end of the article
© 2014 Navascués et al.; licensee BioMed CenCreative Commons Attribution License (http:/distribution, and reproduction in any mediumDomain Dedication waiver (http://creativecomarticle, unless otherwise stated.
their (expert) opinion or other non-genetic evidence thattheir study system fitted best to one of the two alterna-tive models. The first attempt to distinguish betweenboth scenarios using genetic data was made by Wakeley[3], who noted that the variance of pairwise differenceswas expected to be higher under the migration modeland proposed a test statistic based on this prediction.However, a test based on the variance of pairwise differ-ences shows low power [3], is highly influenced by re-combination, and has seen only limited implementation.A significant advance was the development of likelihood-based methods under the isolation-with-migration modele.g. [4]. In this approach, the model consists of two popu-lations that diverge from an ancestral population and ex-change migrants, and the values of these parameters
tral Ltd. This is an Open Access article distributed under the terms of the/creativecommons.org/licenses/by/2.0), which permits unrestricted use,, provided the original work is properly credited. The Creative Commons Publicmons.org/publicdomain/zero/1.0/) applies to the data made available in this
Navascués et al. BMC Evolutionary Biology 2014, 14:89 Page 2 of 13http://www.biomedcentral.com/1471-2148/14/89
(migration rate and divergence time) are inferred. This iscurrently the most widely used method to study geneticdifferentiation between a pair of populations or species(see [5] for a review) and is implemented in IMa [6]. Themodel implemented in IMa assumes the absence of intra-genic recombination and the violation of this assumptioncan produce substantial bias in the estimates from thisanalysis [7]. A framework to specifically analyse recombin-ing genes is essential as nuclear genes, which are widelyused in studies related to divergence and speciation, aresubject to recombination. In order to overcome this limi-tation, likelihood-free methods have also been considerede.g. [8], in which data are summarized by a set of statistics,and the likelihood is approximated by a distance metricbetween the observed summary statistics and summarystatistics simulated from the model. Thus, loci with intra-genic recombination can be simulated under the isolation-with-migration model to approximate the likelihood ofthe parameter values. Similarly, other recent approachesbased on summary statistic or the site frequency spectrume.g. [9,10], use coalescent simulations with recombinationto account for linkage among markers. Recombinationgenerates different linkage disequilibrium patterns de-pending upon the presence or absence of gene flow ([11];see next section for details); so genes with recombinationpotentially provide additional information about geneticexchange. However, because these approximate-likelihoodmethods reduce the data to a set of summary statistics, in-formation on linkage disequilibrium between polymorphicsites is usually lost (for instance, summary statistics usedin MIMAR [8] do not contain this type of information),and any additional information provided by intragenicrecombination cannot be exploited. Among the latestrelated statistical developments, it is worth noting thePAC-likelihood (Product of Approximate Conditionalprobabilities) method [12] and a method based on sharedhaplotype lengths [13], both of which explicitly exploit thespatial arrangement of polymorphism within sequencesto make inferences under the isolation-with-migrationmodel.In this work we propose summary statistics that con-
tain information about the presence and direction ofgene flow as a result of intragenic recombination, andwe describe their properties in the form of statisticaltests for the detection of gene flow (note, however, thattheir use is not necessarily limited to such tests). Inorder to provide an empirical example, these statisticswere calculated in a sample of eleven loci sequencedfrom populations of the Drosophila simulans speciescomplex (D. simulans, D. sechellia and D. mauritiana,Additional file 1: Figure S4), which is one of the mostdocumented models used for speciation and evolution[14-16]. The generalist D. simulans, which probablyevolved on Madagascar [17], has recently extended its
distribution globally, is now a semi-domestic species,exhibiting strong genetic differentiation between ancestraland derived populations [18-20]. In contrast, the endemicD. sechellia, confined to the Seychelles archipelago, pre-sents all the characteristics of a island-syndrome species,being strictly specialized on the ripe fruit of the otherwisetoxic Morinda citrifolia [21], with low reproductive output[22] and presenting limited genetic diversity [23-25]. Des-pite its fragmented distribution, D. sechellia does not ex-hibit strong population structure [25], but rather a localpattern of genetic exchange between neighboring islands[26]. These features strongly contrast with those of its sis-ter species, the island endemic D. mauritiana, which isgeographically and genetically highly structured into twopopulations: the expanding population of Mauritius Islandand the population of Rodrigues Island, 600 km to the eastof Mauritius, which is smaller and at equilibrium [27].Interestingly, D. simulans, D. sechellia and D. mauritianaare incompletely reproductively isolated, and can producefertile female F1 hybrids (males are sterile) [28,29]. How-ever, the question of interspecific hybridization in nature,and its frequency, is unresolved. The existence of sharedpolymorphisms between these species may thus resultfrom introgression due to secondary contact, but couldalso be due to ancestral polymorphism shared amongthese recently diverged species.
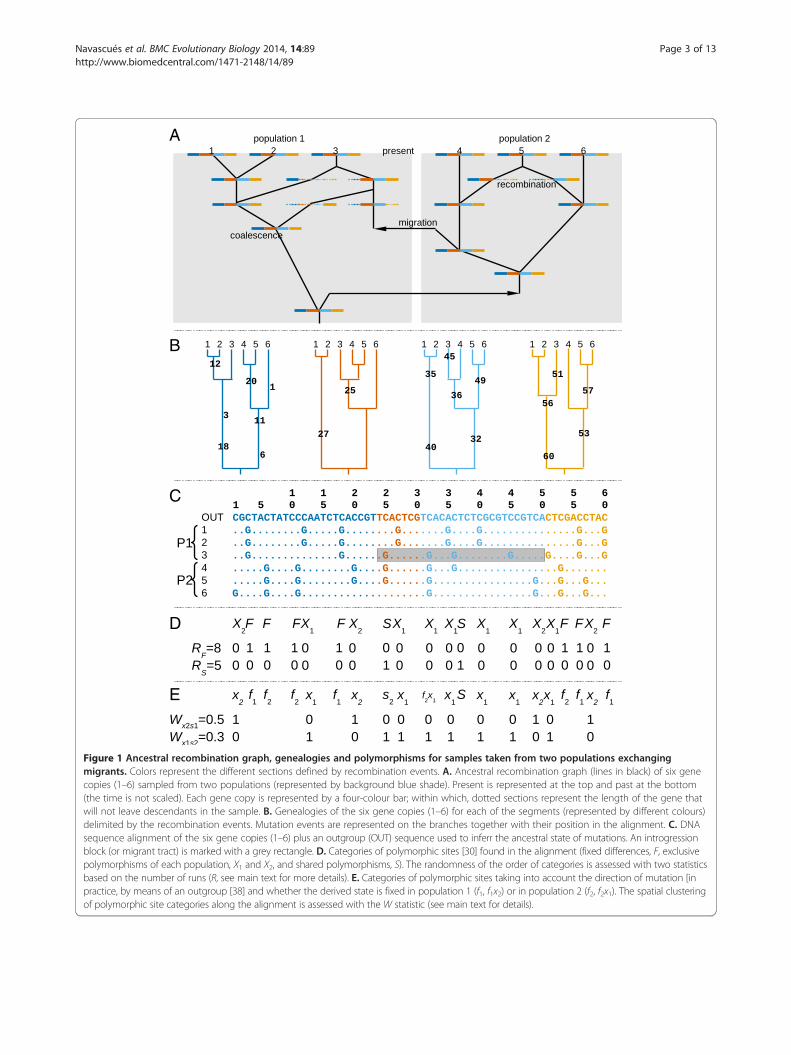
Results and discussionSpatial arrangement of polymorphism withrecombination and gene flowThe segregating sites from a sample of sequences takenfrom two populations can be divided into four categories[30] (see Figure 1): shared polymorphic sites (S), whichare polymorphic in both populations; fixed polymorphicsites (F), which are fixed differences between the twopopulations (i.e. monomorphic for different alleles withinboth populations); exclusive polymorphic sites of popula-tion P1 (X1), which are sites polymorphic in population P1and monomorphic in population P2; and exclusive poly-morphic sites of population P2 (X2).In order to illustrate the problem at hand, we will con-
sider two extreme models: the isolation (two populationsdiverging from an ancestral one) and the migration (twopopulations only connected by gene flow) models. In thecase of the isolation model, the origin of S sites are poly-morphisms from the ancestral population that havesurvived drift in both populations since the time of di-vergence, a process often referred to as incompletelineage sorting e.g. [31]. In the case of the migrationmodel, shared polymorphism is caused by (possibly re-cent) exchange of alleles between the populations. Ithas been argued [11] that S sites had more time to re-combine with other sites under the isolation model thanunder the migration model, and, therefore, stronger linkage
A
B
C
D
E
Figure 1 Ancestral recombination graph, genealogies and polymorphisms for samples taken from two populations exchangingmigrants. Colors represent the different sections defined by recombination events. A. Ancestral recombination graph (lines in black) of six genecopies (1–6) sampled from two populations (represented by background blue shade). Present is represented at the top and past at the bottom(the time is not scaled). Each gene copy is represented by a four-colour bar; within which, dotted sections represent the length of the gene thatwill not leave descendants in the sample. B. Genealogies of the six gene copies (1–6) for each of the segments (represented by different colours)delimited by the recombination events. Mutation events are represented on the branches together with their position in the alignment. C. DNAsequence alignment of the six gene copies (1–6) plus an outgroup (OUT) sequence used to inferr the ancestral state of mutations. An introgressionblock (or migrant tract) is marked with a grey rectangle. D. Categories of polymorphic sites [30] found in the alignment (fixed differences, F, exclusivepolymorphisms of each population, X1 and X2, and shared polymorphisms, S). The randomness of the order of categories is assessed with two statisticsbased on the number of runs (R, see main text for more details). E. Categories of polymorphic sites taking into account the direction of mutation [inpractice, by means of an outgroup [38] and whether the derived state is fixed in population 1 (f1, f1x2) or in population 2 (f2, f2x1). The spatial clusteringof polymorphic site categories along the alignment is assessed with the W statistic (see main text for details).
Navascués et al. BMC Evolutionary Biology 2014, 14:89 Page 3 of 13http://www.biomedcentral.com/1471-2148/14/89
Navascués et al. BMC Evolutionary Biology 2014, 14:89 Page 4 of 13http://www.biomedcentral.com/1471-2148/14/89
disequilibrium (LD) between S sites within each populationwas expected with the presence of gene flow. However, apreliminary study found that classical measures of LD havelittle power for the detection of gene flow. While recentgene exchange leaves little time for recombination to act italso leaves little time for (migrant) allele frequencies to in-crease. Since LD measures are very sensitive to allele fre-quencies, detecting a significant association between raremigrant alleles is challenging (F. Depaulis, unpublished re-sults). In summary, there are two balanced effects: intro-gressed alleles may lead to greater LD because they arerecent, leaving little time for recombination to occur, how-ever they also tend to be rare, which does not favour highLD values. Note, however, that LD measures might be usedto detect admixture [32], i.e. a population originating fromthe mixture of individuals from different populations, be-cause the targeted pattern is not expected to be overly in-fluenced by low allele frequencies.Here we argue that gene flow creates some patterns of
LD distinct from those created under the isolationmodel (for an equivalent differentiation level) and whichrequire non-standard measures of LD to reveal them. Inthe migration model, the fate of a migrant chromosomeis to be fragmented by recombination into “introgressionblocks”, i.e. segments of DNA of migrant ancestry anduntouched by recombination since the migration event(named “migrant tracts” in ref. [33]). Some introgressionblocks may be lost by drift, while others may persist.Figure 1 represents a simplified genealogy with migra-tion and recombination (i.e. an ancestral recombin-ation graph; Figure 1A) and a resulting introgressionblock (Figure 1C, within a grey rectangle). A set ofaligned sequences can be divided into segments delim-ited by the recombination breakpoints (i.e. there wouldbe as many segments as recombination events plusone, represented in Figure 1 with different colours). Asegment of the alignment containing an introgressionblock may contain shared polymorphisms but will rarelycontain any fixed difference (except in less likely scenarios,such as when the last lineage with an ancestral state inone population sample migrates to the other population,leaving the source population sample fixed for the mutantallele and the recipient population sample fixed for the an-cestral allele). Conversely, a segment of the alignment thatdoes not contain any introgression blocks may contain Fsites (lineage sorting is complete) but cannot contain Sand F sites together (Figure 1D). Therefore, F and S sitesalong the alignment are expected to be segregated into asmall number of groups.An alignment can be summarized as a sequence that
represents the order of the different categories of poly-morphic sites (Figure 1D; ignoring X sites results in a se-quence of two elements “FFFFSSFFF” or, in binary coding,“000011000”). We expected the order of elements in this
sequence to depart more drastically from randomness inmodels with migration. The runs test [34] is a statisticaltest for the randomness in the order of elements of twocategories along a sequence. A run is defined as a maximalsegment of consecutive elements of the same type (e.g. thesequence “000011000” contains three runs). A low num-ber of runs (R) within a sequence indicates that identicalelements appear in clusters along the sequence (e.g. threeruns on sequence “000011000” vs. seven runs on sequence“010010010”). Ideally, we would like to apply the test tothe sequence of F and S sites, but it is unlikely that bothtypes of sites are present in the same DNA alignment fora large set of parameter values combinations (differenti-ation level and recombination rate). Therefore, we consid-ered the sequence with the four categories of sites (F, S, X1
and X2) and pooled categories of sites, reducing them intwo categories. Two combinations were considered: F sitesvs. S, X1 and X2 (e.g. Figure 1D; statistic RF) and S sites vs.F, X1 and X2 (e.g. Figure 1D; statistic RS). Since F and Ssites are not often found together, this approach allowstesting for either the clustering of F sites (F vs. X) or Ssites (S vs. X), whichever are found in the alignment. Wepredict that values of run statistics (i.e. number of runs, RFand RS) will be lower under models with migration thanunder models of pure divergence.Pseudo-data generated by coalescent simulations con-
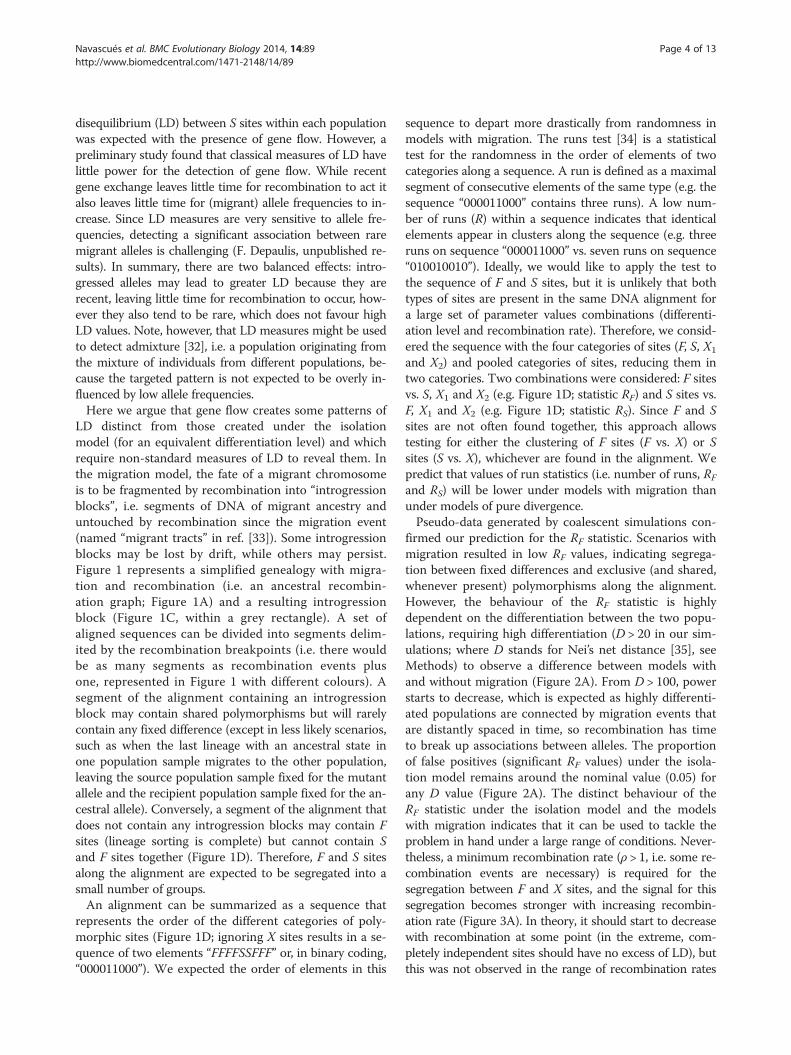
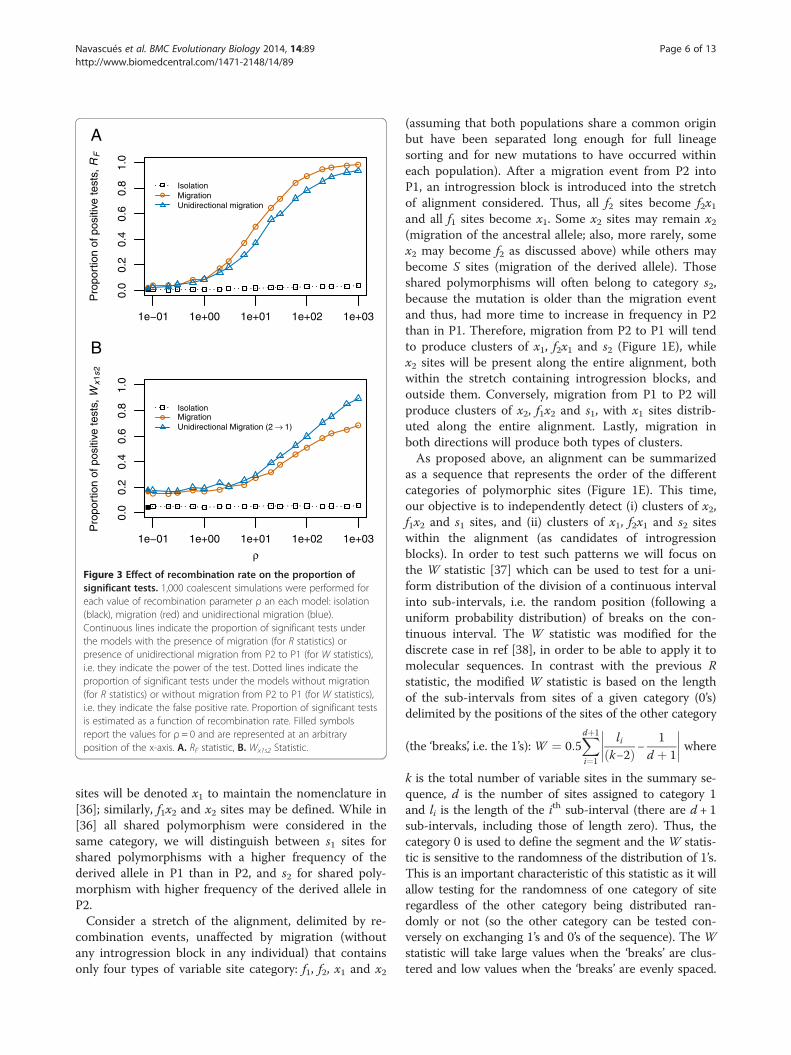
firmed our prediction for the RF statistic. Scenarios withmigration resulted in low RF values, indicating segrega-tion between fixed differences and exclusive (and shared,whenever present) polymorphisms along the alignment.However, the behaviour of the RF statistic is highlydependent on the differentiation between the two popu-lations, requiring high differentiation (D > 20 in our sim-ulations; where D stands for Nei’s net distance [35], seeMethods) to observe a difference between models withand without migration (Figure 2A). From D > 100, powerstarts to decrease, which is expected as highly differenti-ated populations are connected by migration events thatare distantly spaced in time, so recombination has timeto break up associations between alleles. The proportionof false positives (significant RF values) under the isola-tion model remains around the nominal value (0.05) forany D value (Figure 2A). The distinct behaviour of theRF statistic under the isolation model and the modelswith migration indicates that it can be used to tackle theproblem in hand under a large range of conditions. Never-theless, a minimum recombination rate (ρ > 1, i.e. some re-combination events are necessary) is required for thesegregation between F and X sites, and the signal for thissegregation becomes stronger with increasing recombin-ation rate (Figure 3A). In theory, it should start to decreasewith recombination at some point (in the extreme, com-pletely independent sites should have no excess of LD), butthis was not observed in the range of recombination rates
A
B
C
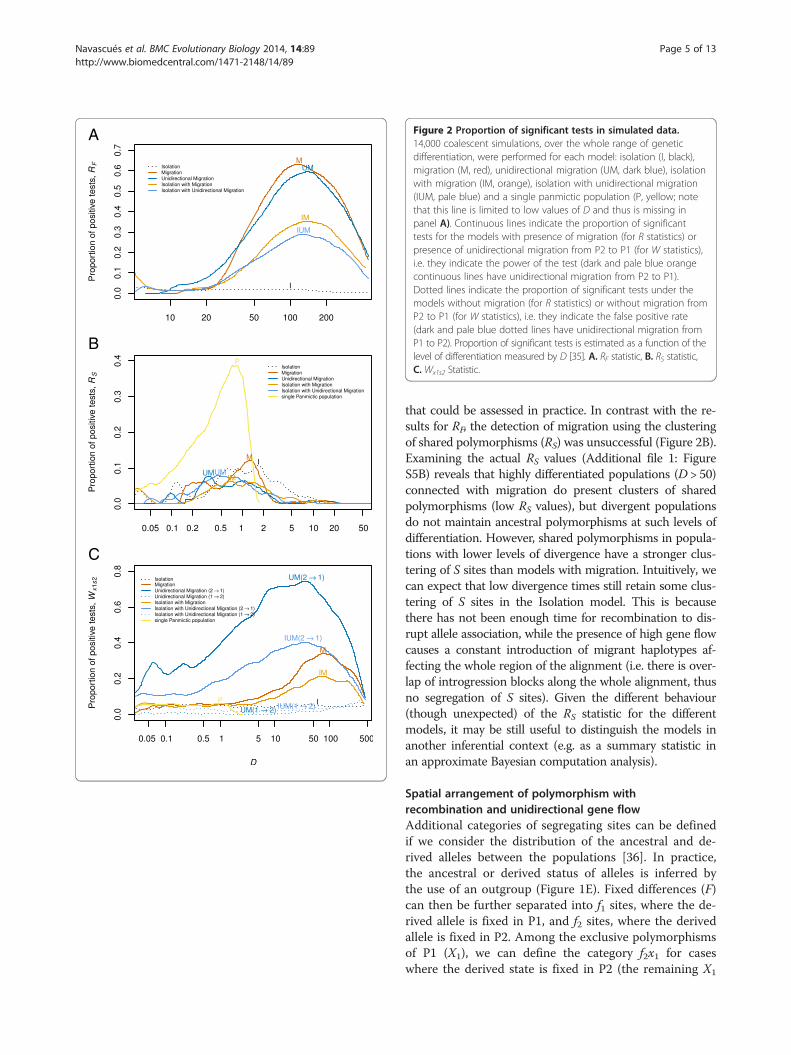
Figure 2 Proportion of significant tests in simulated data.14,000 coalescent simulations, over the whole range of geneticdifferentiation, were performed for each model: isolation (I, black),migration (M, red), unidirectional migration (UM, dark blue), isolationwith migration (IM, orange), isolation with unidirectional migration(IUM, pale blue) and a single panmictic population (P, yellow; notethat this line is limited to low values of D and thus is missing inpanel A). Continuous lines indicate the proportion of significanttests for the models with presence of migration (for R statistics) orpresence of unidirectional migration from P2 to P1 (for W statistics),i.e. they indicate the power of the test (dark and pale blue orangecontinuous lines have unidirectional migration from P2 to P1).Dotted lines indicate the proportion of significant tests under themodels without migration (for R statistics) or without migration fromP2 to P1 (for W statistics), i.e. they indicate the false positive rate(dark and pale blue dotted lines have unidirectional migration fromP1 to P2). Proportion of significant tests is estimated as a function of thelevel of differentiation measured by D [35]. A. RF statistic, B. RS statistic,C. Wx1s2 Statistic.
Navascués et al. BMC Evolutionary Biology 2014, 14:89 Page 5 of 13http://www.biomedcentral.com/1471-2148/14/89
that could be assessed in practice. In contrast with the re-sults for RF, the detection of migration using the clusteringof shared polymorphisms (RS) was unsuccessful (Figure 2B).Examining the actual RS values (Additional file 1: FigureS5B) reveals that highly differentiated populations (D > 50)connected with migration do present clusters of sharedpolymorphisms (low RS values), but divergent populationsdo not maintain ancestral polymorphisms at such levels ofdifferentiation. However, shared polymorphisms in popula-tions with lower levels of divergence have a stronger clus-tering of S sites than models with migration. Intuitively, wecan expect that low divergence times still retain some clus-tering of S sites in the Isolation model. This is becausethere has not been enough time for recombination to dis-rupt allele association, while the presence of high gene flowcauses a constant introduction of migrant haplotypes af-fecting the whole region of the alignment (i.e. there is over-lap of introgression blocks along the whole alignment, thusno segregation of S sites). Given the different behaviour(though unexpected) of the RS statistic for the differentmodels, it may be still useful to distinguish the models inanother inferential context (e.g. as a summary statistic inan approximate Bayesian computation analysis).
Spatial arrangement of polymorphism withrecombination and unidirectional gene flowAdditional categories of segregating sites can be definedif we consider the distribution of the ancestral and de-rived alleles between the populations [36]. In practice,the ancestral or derived status of alleles is inferred bythe use of an outgroup (Figure 1E). Fixed differences (F)can then be further separated into f1 sites, where the de-rived allele is fixed in P1, and f2 sites, where the derivedallele is fixed in P2. Among the exclusive polymorphismsof P1 (X1), we can define the category f2x1 for caseswhere the derived state is fixed in P2 (the remaining X1
1e−01 1e+00 1e+01 1e+02 1e+03
0.0
0.2
0.4
0.6
0.8
1.0
Pro
port
ion
of p
ositi
ve te
sts,
RF
IsolationMigrationUnidirectional migration
A
1e−01 1e+00 1e+01 1e+02 1e+03
0.0
0.2
0.4
0.6
0.8
1.0
ρ
Pro
port
ion
of p
ositi
ve te
sts,
Wx
1s2
IsolationMigrationUnidirectional Migration (2 → 1)
B
Figure 3 Effect of recombination rate on the proportion ofsignificant tests. 1,000 coalescent simulations were performed foreach value of recombination parameter ρ an each model: isolation(black), migration (red) and unidirectional migration (blue).Continuous lines indicate the proportion of significant tests underthe models with the presence of migration (for R statistics) orpresence of unidirectional migration from P2 to P1 (for W statistics),i.e. they indicate the power of the test. Dotted lines indicate theproportion of significant tests under the models without migration(for R statistics) or without migration from P2 to P1 (for W statistics),i.e. they indicate the false positive rate. Proportion of significant testsis estimated as a function of recombination rate. Filled symbolsreport the values for ρ = 0 and are represented at an arbitraryposition of the x-axis. A. RF statistic, B. Wx1s2 Statistic.
Navascués et al. BMC Evolutionary Biology 2014, 14:89 Page 6 of 13http://www.biomedcentral.com/1471-2148/14/89
sites will be denoted x1 to maintain the nomenclature in[36]; similarly, f1x2 and x2 sites may be defined. While in[36] all shared polymorphism were considered in thesame category, we will distinguish between s1 sites forshared polymorphisms with a higher frequency of thederived allele in P1 than in P2, and s2 for shared poly-morphism with higher frequency of the derived allele inP2.Consider a stretch of the alignment, delimited by re-
combination events, unaffected by migration (withoutany introgression block in any individual) that containsonly four types of variable site category: f1, f2, x1 and x2
(assuming that both populations share a common originbut have been separated long enough for full lineagesorting and for new mutations to have occurred withineach population). After a migration event from P2 intoP1, an introgression block is introduced into the stretchof alignment considered. Thus, all f2 sites become f2x1and all f1 sites become x1. Some x2 sites may remain x2(migration of the ancestral allele; also, more rarely, somex2 may become f2 as discussed above) while others maybecome S sites (migration of the derived allele). Thoseshared polymorphisms will often belong to category s2,because the mutation is older than the migration eventand thus, had more time to increase in frequency in P2than in P1. Therefore, migration from P2 to P1 will tendto produce clusters of x1, f2x1 and s2 (Figure 1E), whilex2 sites will be present along the entire alignment, bothwithin the stretch containing introgression blocks, andoutside them. Conversely, migration from P1 to P2 willproduce clusters of x2, f1x2 and s1, with x1 sites distrib-uted along the entire alignment. Lastly, migration inboth directions will produce both types of clusters.As proposed above, an alignment can be summarized
as a sequence that represents the order of the differentcategories of polymorphic sites (Figure 1E). This time,our objective is to independently detect (i) clusters of x2,f1x2 and s1 sites, and (ii) clusters of x1, f2x1 and s2 siteswithin the alignment (as candidates of introgressionblocks). In order to test such patterns we will focus onthe W statistic [37] which can be used to test for a uni-form distribution of the division of a continuous intervalinto sub-intervals, i.e. the random position (following auniform probability distribution) of breaks on the con-tinuous interval. The W statistic was modified for thediscrete case in ref [38], in order to be able to apply it tomolecular sequences. In contrast with the previous Rstatistic, the modified W statistic is based on the lengthof the sub-intervals from sites of a given category (0’s)delimited by the positions of the sites of the other category
(the ‘breaks’, i.e. the 1’s): W ¼ 0:5Xdþ1
i¼1
lik−2ð Þ−
1d þ 1
����
���� where
k is the total number of variable sites in the summary se-quence, d is the number of sites assigned to category 1and li is the length of the ith sub-interval (there are d + 1sub-intervals, including those of length zero). Thus, thecategory 0 is used to define the segment and the W statis-tic is sensitive to the randomness of the distribution of 1’s.This is an important characteristic of this statistic as it willallow testing for the randomness of one category of siteregardless of the other category being distributed ran-domly or not (so the other category can be tested con-versely on exchanging 1’s and 0’s of the sequence). The Wstatistic will take large values when the ‘breaks’ are clus-tered and low values when the ‘breaks’ are evenly spaced.
0.01 0.02 0.05 0.10 0.20 0.50 1.00
0.0
0.2
0.4
0.6
0.8
1.0
Pro
port
ion
of p
ositi
ve te
sts,
Wx1
s2
IsolationMigrationUnidirectional Migration (2 → 1)Unidirectional Migration (1 → 2)
A
0.01 0.02 0.05 0.10 0.20 0.50 1.00
0.0
0.2
0.4
0.6
0.8
1.0
θ2 θ1
Pro
port
ion
of p
ositi
ve te
sts,
Wx
2 s1
IsolationMigrationUnidirectional Migration (2 → 1)Unidirectional Migration (1 → 2)
B
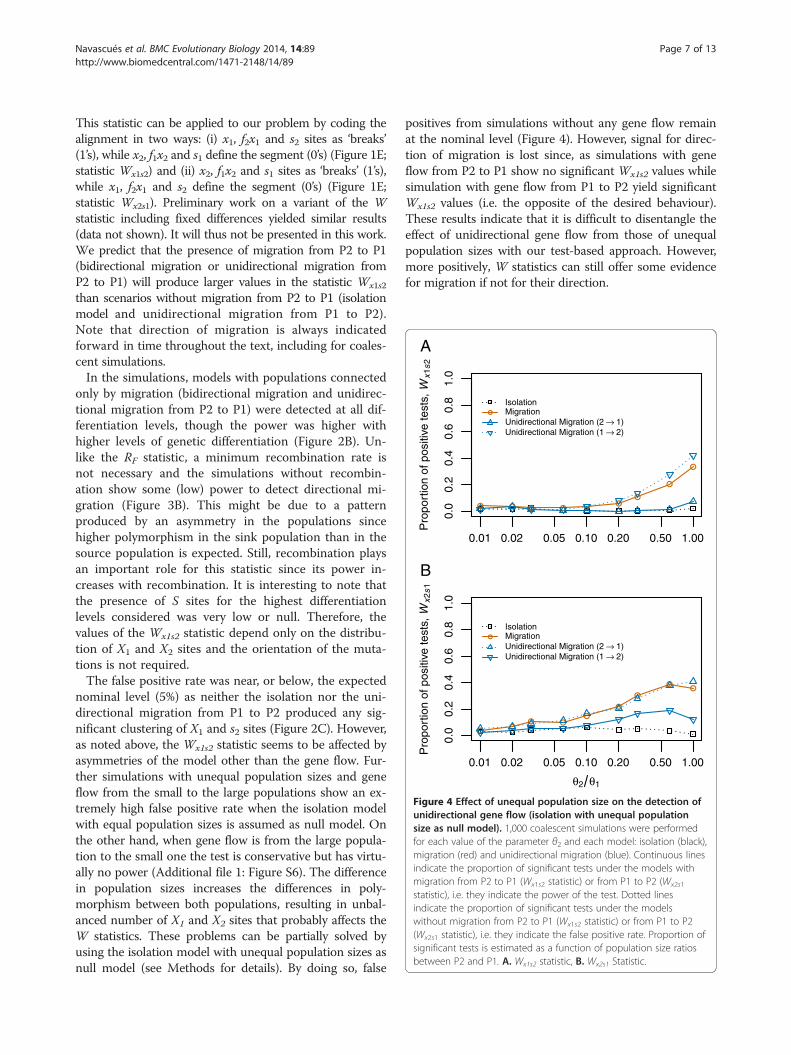
Figure 4 Effect of unequal population size on the detection ofunidirectional gene flow (isolation with unequal populationsize as null model). 1,000 coalescent simulations were performedfor each value of the parameter θ2 and each model: isolation (black),migration (red) and unidirectional migration (blue). Continuous linesindicate the proportion of significant tests under the models withmigration from P2 to P1 (Wx1s2 statistic) or from P1 to P2 (Wx2s1
statistic), i.e. they indicate the power of the test. Dotted linesindicate the proportion of significant tests under the modelswithout migration from P2 to P1 (Wx1s2 statistic) or from P1 to P2(Wx2s1 statistic), i.e. they indicate the false positive rate. Proportion ofsignificant tests is estimated as a function of population size ratiosbetween P2 and P1. A. Wx1s2 statistic, B. Wx2s1 Statistic.
Navascués et al. BMC Evolutionary Biology 2014, 14:89 Page 7 of 13http://www.biomedcentral.com/1471-2148/14/89
This statistic can be applied to our problem by coding thealignment in two ways: (i) x1, f2x1 and s2 sites as ‘breaks’(1’s), while x2, f1x2 and s1 define the segment (0’s) (Figure 1E;statistic Wx1s2) and (ii) x2, f1x2 and s1 sites as ‘breaks’ (1’s),while x1, f2x1 and s2 define the segment (0’s) (Figure 1E;statistic Wx2s1). Preliminary work on a variant of the Wstatistic including fixed differences yielded similar results(data not shown). It will thus not be presented in this work.We predict that the presence of migration from P2 to P1(bidirectional migration or unidirectional migration fromP2 to P1) will produce larger values in the statistic Wx1s2
than scenarios without migration from P2 to P1 (isolationmodel and unidirectional migration from P1 to P2).Note that direction of migration is always indicatedforward in time throughout the text, including for coales-cent simulations.In the simulations, models with populations connected
only by migration (bidirectional migration and unidirec-tional migration from P2 to P1) were detected at all dif-ferentiation levels, though the power was higher withhigher levels of genetic differentiation (Figure 2B). Un-like the RF statistic, a minimum recombination rate isnot necessary and the simulations without recombin-ation show some (low) power to detect directional mi-gration (Figure 3B). This might be due to a patternproduced by an asymmetry in the populations sincehigher polymorphism in the sink population than in thesource population is expected. Still, recombination playsan important role for this statistic since its power in-creases with recombination. It is interesting to note thatthe presence of S sites for the highest differentiationlevels considered was very low or null. Therefore, thevalues of the Wx1s2 statistic depend only on the distribu-tion of X1 and X2 sites and the orientation of the muta-tions is not required.The false positive rate was near, or below, the expected
nominal level (5%) as neither the isolation nor the uni-directional migration from P1 to P2 produced any sig-nificant clustering of X1 and s2 sites (Figure 2C). However,as noted above, the Wx1s2 statistic seems to be affected byasymmetries of the model other than the gene flow. Fur-ther simulations with unequal population sizes and geneflow from the small to the large populations show an ex-tremely high false positive rate when the isolation modelwith equal population sizes is assumed as null model. Onthe other hand, when gene flow is from the large popula-tion to the small one the test is conservative but has virtu-ally no power (Additional file 1: Figure S6). The differencein population sizes increases the differences in poly-morphism between both populations, resulting in unbal-anced number of X1 and X2 sites that probably affects theW statistics. These problems can be partially solved byusing the isolation model with unequal population sizes asnull model (see Methods for details). By doing so, false
positives from simulations without any gene flow remainat the nominal level (Figure 4). However, signal for direc-tion of migration is lost since, as simulations with geneflow from P2 to P1 show no significant Wx1s2 values whilesimulation with gene flow from P1 to P2 yield significantWx1s2 values (i.e. the opposite of the desired behaviour).These results indicate that it is difficult to disentangle theeffect of unidirectional gene flow from those of unequalpopulation sizes with our test-based approach. However,more positively, W statistics can still offer some evidencefor migration if not for their direction.
Navascués et al. BMC Evolutionary Biology 2014, 14:89 Page 8 of 13http://www.biomedcentral.com/1471-2148/14/89
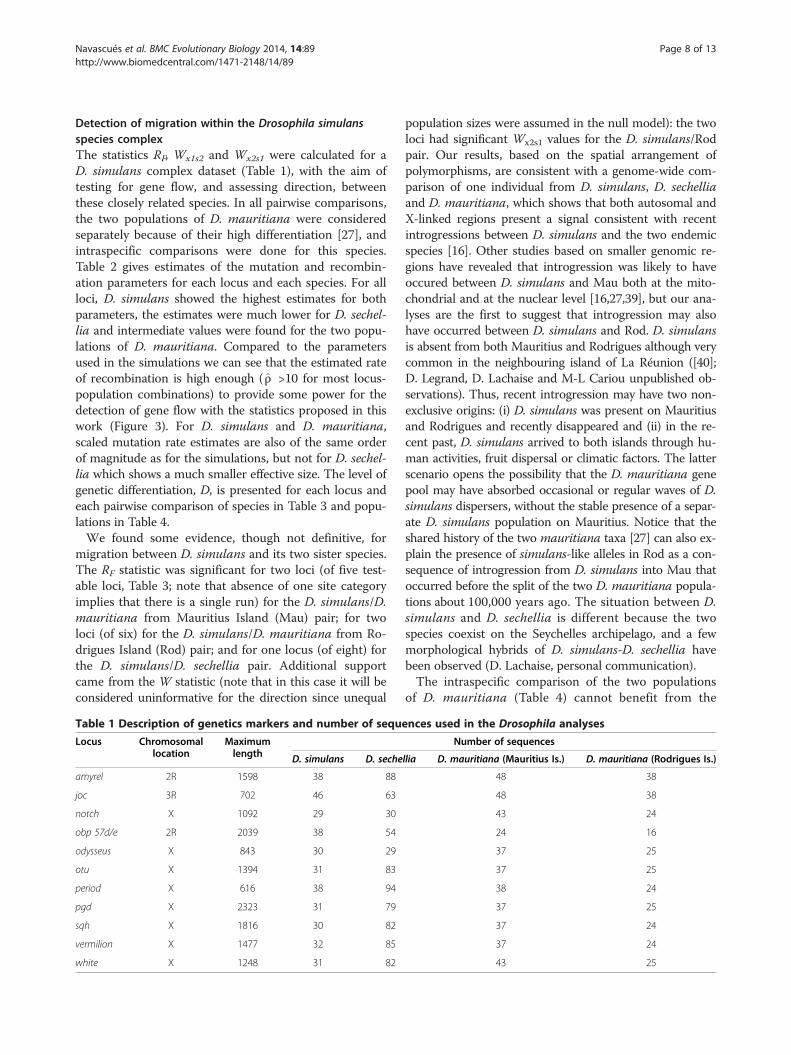
Detection of migration within the Drosophila simulansspecies complexThe statistics RF, Wx1s2 and Wx2s1 were calculated for aD. simulans complex dataset (Table 1), with the aim oftesting for gene flow, and assessing direction, betweenthese closely related species. In all pairwise comparisons,the two populations of D. mauritiana were consideredseparately because of their high differentiation [27], andintraspecific comparisons were done for this species.Table 2 gives estimates of the mutation and recombin-ation parameters for each locus and each species. For allloci, D. simulans showed the highest estimates for bothparameters, the estimates were much lower for D. sechel-lia and intermediate values were found for the two popu-lations of D. mauritiana. Compared to the parametersused in the simulations we can see that the estimated rateof recombination is high enough ( ρ̂ >10 for most locus-population combinations) to provide some power for thedetection of gene flow with the statistics proposed in thiswork (Figure 3). For D. simulans and D. mauritiana,scaled mutation rate estimates are also of the same orderof magnitude as for the simulations, but not for D. sechel-lia which shows a much smaller effective size. The level ofgenetic differentiation, D, is presented for each locus andeach pairwise comparison of species in Table 3 and popu-lations in Table 4.We found some evidence, though not definitive, for
migration between D. simulans and its two sister species.The RF statistic was significant for two loci (of five test-able loci, Table 3; note that absence of one site categoryimplies that there is a single run) for the D. simulans/D.mauritiana from Mauritius Island (Mau) pair; for twoloci (of six) for the D. simulans/D. mauritiana from Ro-drigues Island (Rod) pair; and for one locus (of eight) forthe D. simulans/D. sechellia pair. Additional supportcame from the W statistic (note that in this case it will beconsidered uninformative for the direction since unequal
Table 1 Description of genetics markers and number of seque
Locus Chromosomallocation
Maximumlength D. simulans D. seche
amyrel 2R 1598 38 88
joc 3R 702 46 63
notch X 1092 29 30
obp 57d/e 2R 2039 38 54
odysseus X 843 30 29
otu X 1394 31 83
period X 616 38 94
pgd X 2323 31 79
sqh X 1816 30 82
vermilion X 1477 32 85
white X 1248 31 82
population sizes were assumed in the null model): the twoloci had significant Wx2s1 values for the D. simulans/Rodpair. Our results, based on the spatial arrangement ofpolymorphisms, are consistent with a genome-wide com-parison of one individual from D. simulans, D. sechelliaand D. mauritiana, which shows that both autosomal andX-linked regions present a signal consistent with recentintrogressions between D. simulans and the two endemicspecies [16]. Other studies based on smaller genomic re-gions have revealed that introgression was likely to haveoccured between D. simulans and Mau both at the mito-chondrial and at the nuclear level [16,27,39], but our ana-lyses are the first to suggest that introgression may alsohave occurred between D. simulans and Rod. D. simulansis absent from both Mauritius and Rodrigues although verycommon in the neighbouring island of La Réunion ([40];D. Legrand, D. Lachaise and M-L Cariou unpublished ob-servations). Thus, recent introgression may have two non-exclusive origins: (i) D. simulans was present on Mauritiusand Rodrigues and recently disappeared and (ii) in the re-cent past, D. simulans arrived to both islands through hu-man activities, fruit dispersal or climatic factors. The latterscenario opens the possibility that the D. mauritiana genepool may have absorbed occasional or regular waves of D.simulans dispersers, without the stable presence of a separ-ate D. simulans population on Mauritius. Notice that theshared history of the two mauritiana taxa [27] can also ex-plain the presence of simulans-like alleles in Rod as a con-sequence of introgression from D. simulans into Mau thatoccurred before the split of the two D. mauritiana popula-tions about 100,000 years ago. The situation between D.simulans and D. sechellia is different because the twospecies coexist on the Seychelles archipelago, and a fewmorphological hybrids of D. simulans-D. sechellia havebeen observed (D. Lachaise, personal communication).The intraspecific comparison of the two populations
of D. mauritiana (Table 4) cannot benefit from the
nces used in the Drosophila analyses
Number of sequences
llia D. mauritiana (Mauritius Is.) D. mauritiana (Rodrigues Is.)
48 38
48 38
43 24
24 16
37 25
37 25
38 24
37 25
37 24
37 24
43 25
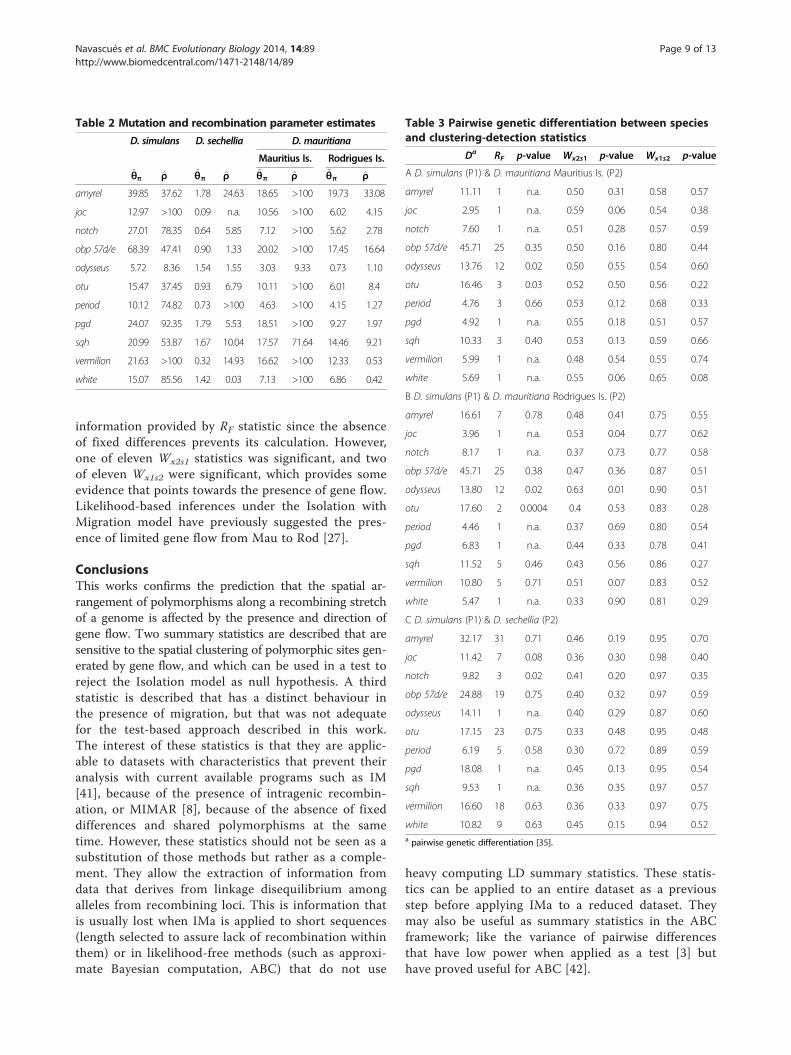
Table 2 Mutation and recombination parameter estimates
D. simulans D. sechellia D. mauritiana
Mauritius Is. Rodrigues Is.
θ̂π ρ̂ θ̂π ρ̂ θ̂π ρ̂ θ̂π ρ̂
amyrel 39.85 37.62 1.78 24.63 18.65 >100 19.73 33.08
joc 12.97 >100 0.09 n.a. 10.56 >100 6.02 4.15
notch 27.01 78.35 0.64 5.85 7.12 >100 5.62 2.78
obp 57d/e 68.39 47.41 0.90 1.33 20.02 >100 17.45 16.64
odysseus 5.72 8.36 1.54 1.55 3.03 9.33 0.73 1.10
otu 15.47 37.45 0.93 6.79 10.11 >100 6.01 8.4
period 10.12 74.82 0.73 >100 4.63 >100 4.15 1.27
pgd 24.07 92.35 1.79 5.53 18.51 >100 9.27 1.97
sqh 20.99 53.87 1.67 10.04 17.57 71.64 14.46 9.21
vermilion 21.63 >100 0.32 14.93 16.62 >100 12.33 0.53
white 15.07 85.56 1.42 0.03 7.13 >100 6.86 0.42
Table 3 Pairwise genetic differentiation between speciesand clustering-detection statistics
Da RF p-value Wx2s1 p-value Wx1s2 p-value
A D. simulans (P1) & D. mauritiana Mauritius Is. (P2)
amyrel 11.11 1 n.a. 0.50 0.31 0.58 0.57
joc 2.95 1 n.a. 0.59 0.06 0.54 0.38
notch 7.60 1 n.a. 0.51 0.28 0.57 0.59
obp 57d/e 45.71 25 0.35 0.50 0.16 0.80 0.44
odysseus 13.76 12 0.02 0.50 0.55 0.54 0.60
otu 16.46 3 0.03 0.52 0.50 0.56 0.22
period 4.76 3 0.66 0.53 0.12 0.68 0.33
pgd 4.92 1 n.a. 0.55 0.18 0.51 0.57
sqh 10.33 3 0.40 0.53 0.13 0.59 0.66
vermilion 5.99 1 n.a. 0.48 0.54 0.55 0.74
white 5.69 1 n.a. 0.55 0.06 0.65 0.08
B D. simulans (P1) & D. mauritiana Rodrigues Is. (P2)
amyrel 16.61 7 0.78 0.48 0.41 0.75 0.55
joc 3.96 1 n.a. 0.53 0.04 0.77 0.62
notch 8.17 1 n.a. 0.37 0.73 0.77 0.58
obp 57d/e 45.71 25 0.38 0.47 0.36 0.87 0.51
odysseus 13.80 12 0.02 0.63 0.01 0.90 0.51
otu 17.60 2 0.0004 0.4 0.53 0.83 0.28
period 4.46 1 n.a. 0.37 0.69 0.80 0.54
pgd 6.83 1 n.a. 0.44 0.33 0.78 0.41
sqh 11.52 5 0.46 0.43 0.56 0.86 0.27
vermilion 10.80 5 0.71 0.51 0.07 0.83 0.52
white 5.47 1 n.a. 0.33 0.90 0.81 0.29
C D. simulans (P1) & D. sechellia (P2)
amyrel 32.17 31 0.71 0.46 0.19 0.95 0.70
joc 11.42 7 0.08 0.36 0.30 0.98 0.40
notch 9.82 3 0.02 0.41 0.20 0.97 0.35
obp 57d/e 24.88 19 0.75 0.40 0.32 0.97 0.59
odysseus 14.11 1 n.a. 0.40 0.29 0.87 0.60
otu 17.15 23 0.75 0.33 0.48 0.95 0.48
period 6.19 5 0.58 0.30 0.72 0.89 0.59
pgd 18.08 1 n.a. 0.45 0.13 0.95 0.54
sqh 9.53 1 n.a. 0.36 0.35 0.97 0.57
vermilion 16.60 18 0.63 0.36 0.33 0.97 0.75
white 10.82 9 0.63 0.45 0.15 0.94 0.52a pairwise genetic differentiation [35].
Navascués et al. BMC Evolutionary Biology 2014, 14:89 Page 9 of 13http://www.biomedcentral.com/1471-2148/14/89
information provided by RF statistic since the absenceof fixed differences prevents its calculation. However,one of eleven Wx2s1 statistics was significant, and twoof eleven Wx1s2 were significant, which provides someevidence that points towards the presence of gene flow.Likelihood-based inferences under the Isolation withMigration model have previously suggested the pres-ence of limited gene flow from Mau to Rod [27].
ConclusionsThis works confirms the prediction that the spatial ar-rangement of polymorphisms along a recombining stretchof a genome is affected by the presence and direction ofgene flow. Two summary statistics are described that aresensitive to the spatial clustering of polymorphic sites gen-erated by gene flow, and which can be used in a test toreject the Isolation model as null hypothesis. A thirdstatistic is described that has a distinct behaviour inthe presence of migration, but that was not adequatefor the test-based approach described in this work.The interest of these statistics is that they are applic-able to datasets with characteristics that prevent theiranalysis with current available programs such as IM[41], because of the presence of intragenic recombin-ation, or MIMAR [8], because of the absence of fixeddifferences and shared polymorphisms at the sametime. However, these statistics should not be seen as asubstitution of those methods but rather as a comple-ment. They allow the extraction of information fromdata that derives from linkage disequilibrium amongalleles from recombining loci. This is information thatis usually lost when IMa is applied to short sequences(length selected to assure lack of recombination withinthem) or in likelihood-free methods (such as approxi-mate Bayesian computation, ABC) that do not use
heavy computing LD summary statistics. These statis-tics can be applied to an entire dataset as a previousstep before applying IMa to a reduced dataset. Theymay also be useful as summary statistics in the ABCframework; like the variance of pairwise differencesthat have low power when applied as a test [3] buthave proved useful for ABC [42].

Table 4 Pairwise genetic differentiation betweenpopulations of D. mauritianaa and clustering-detectionstatistics
Db Wx2s1 p-value Wx1s2 p-value
amyrel 3.59 0.72 0.39 0.49 0.29
joc 0.71 0.81 0.42 0.48 0.16
notch 1.11 0.79 0.23 0.44 0.52
obp 57d/e 0.78 0.79 0.01 0.58 0.01
odysseus 0.15 0.94 0.35 0.59 0.04
otu 2.09 0.83 0.62 0.36 0.75
period 0.47 0.65 0.58 0.41 0.63
pgd 1.99 0.80 0.33 0.42 0.49
sqh 0.92 0.81 0.27 0.38 0.89
vermilion 3.78 0.88 0.28 0.41 0.54
white 1.00 0.73 0.35 0.47 0.30a D. mauritiana Rodrigues Is. (P1) & D. mauritiana Mauritius Is. (P2).b pairwise genetic differentiation [35].
Navascués et al. BMC Evolutionary Biology 2014, 14:89 Page 10 of 13http://www.biomedcentral.com/1471-2148/14/89
Another advantage of the statistics described in thiswork is that genotypes do not need to be phased nor in-dividual genotypes identified, because the statistics de-pend only on the spatial location of sites not on theallelic identity of individuals. Unphased sequence data orsequence data from pooled samples of several individ-uals (pooling within each population) should be as in-formative as phased resequencing data (regarding thepresently discussed statistics). Another advantage is thatknowledge of allele frequencies or the ancestral state isnot necessary (although Wx1s2 was described using thisinformation to classify s1 and s2 sites, the statistic maybe calculated exclusively from X1 and X2 sites, as dis-cussed above). This could be particularly helpful for thestudy of next generation sequencing data derived frompooled individuals e.g. [43], where the number of individ-uals sequenced at each polymorphic site and each allelicstate is unknown and methods based on the PAC-likelihood or the length of shared haplotypes cannot beapplied. As long as the coverage of the sequencing isenough to determine whether the site is polymorphic ineach population, R and W statistics may be calculated.The application of these statistics to the species of the
D. simulans complex was illustrative. Although the highrecombination rates (Table 2) make it an especiallyfavourable case study for the application of these sum-mary statistics, the results were not as compelling asthey could have been. The results suggest genetic ex-change between species and also between populations,that is, in the absence of any fixed differences. This con-clusion is also supported by several independent studieson this system. The confirmation of the presence of geneflow is an important key for the understanding of theevolution of these species. However, we could not ascertain
the presence and direction of migration due to limitedpower of our statistics in case of unequal population sizes.Resolving issue will be a major step toward a better com-prehension of the evolutionary history of the simulanscomplex.
MethodsModels and simulationsSignificance of each observed statistic was estimatedfrom the distribution of the statistic under the nullmodel (isolation model). The distribution of the teststatistic was obtained by coalescent simulation [44] withrecombination, with parameter values estimated fromthe data (see below). The isolation model (see Additionalfile 1: Figure S1) consists of two populations (P1 and P2,with same effective size), with no exchange of migrants,that have diverged for a period of time from a commonancestral population (with effective size equal to that ofthe present day populations). This model is character-ized by three parameters: (i) the population-scaled muta-tion rate θ = 4Nμ (where N is the effective populationsize and μ is the mutation rate per locus per generation),(ii) the population-scaled time of divergence T = t/(2N)(where t is the divergence time expressed in genera-tions), and (iii) the population-scaled recombination rateρ = 4Nc (where c is the recombination rate per locus pergeneration). Parameters θ and T for this model were es-timated from the data by using the average number ofpairwise differences within (dx and dy) and between (dxy)populations [3]. Recombination parameter for Drosoph-ila data was estimated with LDhat ([45]; see below)while the true value was taken for simulated data (assum-ing a good estimate could be obtained, since properly ap-plying LDhat for each simulation was computationallyinfeasible). In some instances, a more complex null modelwas also used with unequal population sizes. This modelhas one scaled mutation rate parameter for each popula-tion (θ1, θ2 and θA, respectively for populations P1, P2 andancestral; note that in all our simulations θA = θ1). Whenunequal population sizes were used as the null model, par-ameter values were estimated from the number of F, S, X1
and X2 sites [30] with J. Hey’s Sites software (http://bio.cst.temple.edu/~hey/software/software.htm). Sites softwarenumerically solves the equations of the expected numberof F, S, X1 and X2 sites in function of θ1, θ2, θA and T forthe observed number of F, S, X1 and X2 sites.Power and the false positive rate of the proposed statis-
tics were evaluated on datasets generated with coalescentsimulations. Six demographic models were used for thisevaluation: the isolation (I), migration (M), unidirectionalmigration (UM), isolation-with-migration (IM), isolation-with-unidirectional-migration (IUM) and panmictic popu-lation (P) models (see Additional file 1: Figure S1). Theisolation model is as described above. The migration

Navascués et al. BMC Evolutionary Biology 2014, 14:89 Page 11 of 13http://www.biomedcentral.com/1471-2148/14/89
model (also known as two-island model) consists of twopopulations (with the same effective size) that have neverbeen in contact except for a constant rate of symmetricmigration. The parameters of this model are: (i) thepopulation-scaled mutation rate θ, (ii) the population-scaled migration rate M = 4Nm (where m is the migra-tion rate per generation), and (iii) the population-scaledrecombination rate ρ. The unidirectional migration modelis the same as the migration model, but with migrationonly occurring from one population to the other. Theisolation-with-migration and -with-unidirectional-migrationare intermediate models with both parameters of divergence(T) and migration (M), with migration occurring betweenthe two derived populations after the split of the ancestralpopulation. The panmictic population corresponds to a sin-gle population of size θ with a sample of genes divided ran-domly in two. Unequal population size was also consideredfor I, M and UM models (see Additional file 1: Figure S2),requiring an additional parameter for each population(scaled mutation rates θ1 and θ2).For each model, at least 14,000 pseudo-samples were
generated by coalescent simulation with ms [44]. Eachpseudo-sample consisted of a sample of 40 gene copiesfor each population (in the panmictic model 80, dividedinto two groups). Mutations were simulated accordingto an infinitely-many sites mutation model. Parametervalues were fixed for scaled mutation and recombinationrates to θ = 10 and ρ = 10 for the first set of simulations.Divergence time and migration rate parameter valueswere taken randomly from the intervals (0.004–40) forM and (0.0125–125) for T (see Additional file 1: TableS1). The range of values used for M and T allowed forsimulations with a range of genetic differentiation repre-senting from low-divergence populations of the samespecies (D ≈ 0) to highly differentiated species (D ≈ 300),and also similar levels of differentiation between diver-gence and migration models. A second set of simula-tions was produced to study the effect of recombinationrate. For these simulations only I, M and UM modelswere used. Migration rate was fixed to M = 0.04 and di-vergence time to T = 12.5 (expected D = 135, for I and Mmodels without recombination [3]). Recombination rate(ρ) took the following values: 0, 0.1, 0.2, 0.3, 0.6, 1, 2, 3,6, 10, 20, 30, 60, 100, 200 and 300 (with 1000 simula-tions for each value) (see Additional file 1: Table S2). Athird set of simulations was produced to study the effectof unequal population size. For these simulations only I,M and UM models were used. Migration rate was fixedto M = 0.04, divergence time to T = 12.5, recombinationrate to ρ = 100 and scaled mutation rate for populationP1 to θ1 = 10. Scaled mutation rate for population P2 to(θ2) took the following values: 0.1, 0.2, 0.3, 0.6, 1, 2, 3,6 and 10 (with 1000 simulations for each value) (seeAdditional file 1: Table S3).
The differentiation statistic D = dxy-(dx + dy)/2 (oftenreferred to as Nei’s net distance or Da [35]) was calcu-lated for each simulation to compare simulations fromdifferent models (and experimental data) with similarlevels of differentiation. Polymorphic sites were classifiedinto categories (i.e. F, S, X1 and X2; f1, f2, s1, s2, x1, x2,f2x1 and f1x2) and the statistics RF, RS, Wx1s2 and Wx2s1
were calculated from the alignment for each replicate.Power and false positive rates were calculated as theproportion of significant tests (with nominal level α =0.05) under the different models. For the detection ofmigration with RF and RS statistics, M, UM, IM andIUM models were used to estimate power and I model(the null model) was used to estimate the false positiverate; while for the detection of unidirectional migrationwith Wx1s2 statistic, M, UM (from P2 to P1), IM andIUM (from P2 to P1) models were used to estimatepower and I, UM (from P1 to P2) and IUM (from P1 toP2) models were used to estimate the false positive rate.For the first set of simulations, power and false positiverate were estimated as a function of D (for each value Di
of D from the simulations, all simulations with Dj withininterval [Di-0.2Di, Di + 0.2Di] were used to estimate toestimate power at D =Di, provided there were at least100 simulations within the interval). The proportion ofsignificant tests for Di was estimated from the simula-tions from the above-defined interval using a weighted(using an Epanechnikov kernel) logistic regression. Forthe other simulations the observed proportion of signifi-cant tests for each pre-set value of ρ or θ1/θ2 ratio wasused. All computations were done in R [46] and thescripts are available from M. Navascués upon request.
Drosophila simulans species complexThe statistics described above were applied to popula-tions and species of the D. simulans complex in order totest for introgression between D. sechellia and D. simu-lans, between the two populations of D. mauritiana andD. simulans, and within D. mauritiana (Mauritius andRodrigues populations). We specifically wanted to distin-guish between the hypotheses of an absence of gene flowbetween all pairs of species, similar exchanges betweenthe species or unidirectional gene flow (this later object-ive could not be addressed as discussed above). We ex-tended datasets of D. sechellia and D. mauritiana usedin previous studies [25,27] to construct a larger set of se-quences which includes D. simulans and additionalmarkers. D. simulans flies were representative of thespecies and primarily from its region of origin. Theywere from Madagascar, the Seychelles archipelago,Comoros, La Réunion, South Africa, Uganda, Tanzania andAnnobon Island (Guinean gulf, West Africa; Additionalfile 1: Figure S4). D. sechellia flies originated fromAride, Denis, Silhouette, Coco, Cousin, Cousine, Frégate,
Navascués et al. BMC Evolutionary Biology 2014, 14:89 Page 12 of 13http://www.biomedcentral.com/1471-2148/14/89
Mahé and Praslin islands of the Seychelles archipelago. Fi-nally, the D. mauritiana sample consisted of two distantpopulations, the Mau population from Mauritius and theRod population from the island of Rodrigues, as in [27].Flies were collected from the wild and directly conservedin absolute alcohol until sequencing, with the exception ofsome D. simulans lines from Madagascar and Comorosthat have been kept in the laboratory for 20 to 200 genera-tions. Experimental procedures comply with institutional,national and international ethical guidelines. Drosophilawere collected with the permission of the National Parksand Conservation Service of the Ministry of Agro IndustryFood Production and Security of Mauritius, the Ministryof Environment and conservation department of theSeychelles, The Ministry of Environnement of Madagascar.The global dataset consisted of 11 nuclear genes, amyrel,joc, notch, obp57d/e, odysseus, otu, period, pgd, sqh, vermil-ion and white, representing a total of 15 kb, for at least 29gene copies per species (Table 1). Sequencing was per-formed following [25] and primers for each locus and eachspecies are available upon request. Sequences were alignedby visual inspection using Bioedit v7.0.9.0; estimates of thescaled recombination rate, ρ, for each locus and taxon wereperformed by the composite likelihood method imple-mented in LDhat [45] (for estimates of ρ > 100 a valueof ρ = 100 was used in the null hypothesis), and esti-mates of scaled mutation rate from nucleotide poly-morphism, θπ, were computed with DnaSP v5 [47].Polymorphic sites were classified in categories (i.e. F, Sand X; s1, s2, x1, x2, f2x1 and f1x2), and the statistics RF,RS, Wx2s1 and Wx1s2 were calculated from the align-ments. Given the clear differences in size among popu-lations, significance of the statistics was tested usingthe isolation models with unequal population sizes asnull model. Ancestral and derived states were deducedby the use of D. melanogaster as an outgroup, forwhich sequences were obtained from the whole genomeof D. melanogaster available in GenBank under the fol-lowing accession numbers: AE014298 (chromosome X),AE013599 (chromosome 2R), AE014297 (chromosome 3R).The Drosophila sequence data set supporting the results ofthis article is available in the Dryad Digital Repository, withidentifier doi: 10.5061/dryad.67f8v (http://doi.org/10.5061/dryad.67f8v).
Additional file
Additional file 1: Supplementary Materials and Methods sectionand supplementary Tables and Figures.
Competing interestsThe authors declare that they have no competing interests.
Authors’ contributionsFD and MN conceived and developed the new statistics. MN performed thesimulation work and analysed the simulated data. MLC and DL collected theDrosophila samples. DL and CC performed the molecular work for obtainingthe DNA sequences. DL, CC and MN analysed the Drosophila data. MN, DL,MLC and FD wrote the article. All authors approved the final version of thearticle.
AcknowledgementsWe thank M. Debiais-Thibaud for collecting Drosophila simulans flies fromSouth Africa and C. Biémont for making lines of D. simulans from Madagascarand Comoros available. We thank B. Emerson for correcting and improvingthe English of this article. The input from several reviewers (in particular onethat revised three different versions of the manuscript) contributed to improvethe text and the analyses. This work was supported by Agence Nationale de laRecherche, Biodiversity program ANR-06-BDIV-003. DL benefited frommembership of the “Laboratoire d’Excellence” TULIP (ANR-10-LABX-41).MN has also been funded by the Jeune Équipe INRA 2010 “Inférence enGénétique et Génomique des Populations”.
Author details1UMR 7625 Écologie et Évolution (CNRS/École Normale Supérieure/UniversitéPierre et Marie Curie), Paris, France. 2INRA, UMR1062 CBGP, F-34988Montferrier-sur-Lez, France. 3USR 2936, Station d’Écologie Expérimentale duCNRS, 09200 Moulis, France. 4UPR 9034 Évolution, Génomes et Spéciation,CNRS, avenue de la Terrasse, 91198 Gif sur Yvette, France. 5Laboratoired’Écologie, École Normale Supérieure, 46 rue d’Ulm, 75230 Paris cedex 05,France.
Received: 14 November 2013 Accepted: 3 April 2014Published: 24 April 2014
References1. Dobzhansky T, Wright S: Genetics of natural populations. v. relations
between mutation rate and accumulation of lethals in populations ofdrosophila pseudoobscura. Genetics 1941, 26:23–51.
2. Cavalli-Sforza LL: Human Diversity. In Proceedings of the 12th InternationalCongress on Genetics. Volume 3. Tokyo; 1969:405–416.
3. Wakeley J: Distinguishing migration from isolation using the variance ofpairwise differences. Theor Popul Biol 1996, 49:369–386.
4. Nielsen R, Wakeley J: Distinguishing migration from isolation: a Markovchain Monte Carlo approach. Genetics 2001, 158:885–896.
5. Pinho C, Hey J: Divergence with gene flow: models and data. Annu RevEcol Evol Syst 2010, 41:215–230.
6. Hey J, Nielsen R: Integration within the Felsenstein equation forimproved Markov chain Monte Carlo methods in population genetics.Proc Natl Acad Sci U S A 2007, 104:2785–2790.
7. Strasburg JL, Rieseberg LH: How robust are “Isolation with Migration”analyses to violations of the IM model? A simulation study. Mol Biol Evol2010, 27:297–310.
8. Becquet C, Przeworski M: A new approach to estimate parameters ofspeciation models with application to apes. Genome Res 2007, 17:1505–1519.
9. Gutenkunst RN, Hernandez RD, Williamson SH, Bustamante CD: Inferringthe joint demographic history of multiple populations frommultidimensional SNP frequency data. PLoS Genet 2009, 5:e1000695.
10. Tellier A, Pfaffelhuber P, Haubold B, Naduvilezhath L, Rose LE, Städler T,Stephan W, Metzler D: Estimating parameters of speciation models basedon refined summaries of the joint site-frequency spectrum. PLoS One2011, 6:e18155.
11. Machado CA, Kliman RM, Markert JA, Hey J: Inferring the history ofspeciation from multilocus DNA sequence data: the case of Drosophilapseudoobscura and close relatives. Mol Biol Evol 2002, 19:472–488.
12. Davison D, Pritchard JK, Coop G: An approximate likelihood for geneticdata under a model with recombination and population splitting. TheorPopul Biol 2009, 75:331–345.
13. Harris K, Nielsen R: Inferring Demographic History from a Spectrum ofShared Haplotype Lengths. PLoS Genet 2013, 9:e1003521.
14. Lachaise D, Capy P, Cariou M-L, Joly D, Lemeunier F, David JR: Nine relativesfrom one African ancestor: population biology and evolution of theDrosophila melanogaster subgroup species. In The Evolution of Population
Navascués et al. BMC Evolutionary Biology 2014, 14:89 Page 13 of 13http://www.biomedcentral.com/1471-2148/14/89
Biology. Edited by Singh RS, Uyenoyama MK. Cambridge: Cambridge UniversityPress; 2004:315–343.
15. Mallet J: What does Drosophila genetics tell us about speciation? TrendsEcol Evol 2006, 21:386–393.
16. Garrigan D, Kingan SB, Geneva AJ, Andolfatto P, Clark AG, Thornton KR,Presgraves DC: Genome sequencing reveals complex speciation in theDrosophila simulans clade. Genome Res 2012, 22:1499–1511.
17. Dean MD, Ballard JWO: Linking phylogenetics with population genetics toreconstruct the geographic origin of a species. Mol Phylogenet Evol 2004,32:998–1009.
18. Irvin SD, Wetterstrand KA, Hutter CM, Aquadro CF: Genetic Variation andDifferentiation at Microsatellite Loci in Drosophila simulans: Evidence forFounder Effects in New World Populations. Genetics 1998, 150:777–790.
19. Veuille M, Baudry E, Cobb M, Derome N, Gravot E: Historicity and thepopulation genetics of Drosophila melanogaster and D. simulans.Genetica 2004, 120:61–70.
20. Schöfl G, Schlötterer C: Microsatellite variation and differentiation inAfrican and non-African populations of Drosophila simulans. Mol Ecol2006, 15:3895–3905.
21. R’Kha S, Capy P, David JR: Host-plant specialization in the Drosophilamelanogaster species complex: a physiological, behavioral, and geneticalanalysis. Proc Natl Acad Sci U S A 1991, 88:1835–1839.
22. R’Kha S, Moreteau B, Coyne JA, David JR: Evolution of a lesser fitness trait:egg production in the specialist Drosophila sechellia. Genet Res 1997,69:17–23.
23. Cariou M-L, Solignac M, Monnerot M, David JR: Low allozyme andmtDNA variability in the island endemic species Drosophila sechelia(D. melanogaster complex). Experientia 1990, 46:101–104.
24. Kliman RM, Andolfatto P, Coyne JA, Depaulis F, Kreitman M, Berry AJ,McCarter J, Wakeley J, Hey J: The population genetics of the origin anddivergence of the Drosophila simulans complex species. Genetics 2000,156:1913–1931.
25. Legrand D, Tenaillon MI, Matyot P, Gerlach J, Lachaise D, Cariou M-L:Species-wide genetic variation and demographic history ofDrosophila sechellia, a species lacking population structure. Genetics2009, 182:1197–1206.
26. Legrand D, Vautrin D, Lachaise D, Cariou M-L: Microsatellite variationsuggests a recent fine-scale population structure of the island endemicspecies Drosophila sechellia. Genetica 2011, 139:909–919.
27. Legrand D, Chenel T, Campagne C, Lachaise D, Cariou M-L: Inter-islanddivergence within Drosophila mauritiana, a species of the D. simulanscomplex: Past history and/or speciation in progress? Mol Ecol 2011,20:2787–2804.
28. Lachaise D, Cariou M-L, David JR, Lemeunier F, Tsacas L, Ashburner M:Historical biogeography of the Drosophila melanogaster species subgroup.Evol Biol 1988, 22:159–225.
29. Cariou M-L, Silvain J-F, Daubin V, Da Lage J-L, Lachaise D: Divergencebetween Drosophila santomea and allopatric or sympatric populations ofD. yakuba using paralogous amylase genes and migration scenarios alongthe Cameroon volcanic line. Mol Ecol 2008, 10:649–660.
30. Wakeley J, Hey J: Estimating ancestral population parameters. Genetics1997, 145:847–855.
31. DeMarais BD, Dowling TE, Douglas ME, Minckley WL, Marsh PC: Origin ofGila seminuda (Teleostei: Cyprinidae) through introgressivehybridization: implications for evolution and conservation. Proc Natl AcadSci U S A 1992, 89:2747–2751.
32. Plagnol V, Wall JD: Possible ancestral structure in human populations.PLoS Genet 2006, 2:e105.
33. Pool JE, Nielsen R: Inference of historical changes in migration rate fromthe lengths of migrant tracts. Genetics 2009, 181:711–719.
34. Wald A, Wolfowitz J: On a test whether two samples are from the samepopulation. Ann Math Stat 1940, 11:147–162.
35. Nei M, Li W-H: Mathematical model for studying genetic variation interms of restriction endonucleases. Proc Natl Acad Sci U S A 1979,76:5269–5273.
36. Ramos-Onsins SE, Stranger BE, Mitchell-Olds T, Aguadé M: Multilocus analysisof variation and speciation in the closely related species Arabidopsis halleriand A. lyrata. Genetics 2004, 166:373–388.
37. Sherman B: A random variable related to the spacing of sample values.Ann Math Stat 1950, 21:339–361.
38. Sneath PHA: The distribution of the random division of a molecularsequence. Binary Comput Microb 1995, 7:148–152.
39. Nunes MDS, Orozco-Ter Wengel P, Kreissl M, Schlötterer C: Multiplehybridization events between Drosophila simulans and Drosophilamauritiana are supported by mtDNA introgression. Mol Ecol 2010,19:4695–4707.
40. David JR, McEvey SF, Solignac M, Tsacas L: Drosophila communities onMauritius and the ecological niche of D. mauritiana (Diptera,Drosophilidae). J Afr Zool 1989, 103:107–116.
41. Hey J, Nielsen R: Multilocus methods for estimating population sizes,migration rates and divergence time, with applications to thedivergence of Drosophila pseudoobscura and D. persimilis. Genetics 2004,167:747–760.
42. Huang W, Takebayashi N, Qi Y, Hickerson M: MTML-msBayes: approximateBayesian comparative phylogeographic inference from multiple taxa andmultiple loci with rate heterogeneity. BMC Bioinforma 2011, 12:1.
43. Futschik A, Schlotterer C: The next generation of molecular markers frommassively parallel sequencing of pooled DNA samples. Genetics 2010,186:207–218.
44. Hudson RR: Generating samples under a Wright-Fisher neutral model ofgenetic variation. Bioinformatics 2002, 18:337–338.
45. McVean G, Awadalla P, Fearnhead P: A coalescent-based method fordetecting and estimating recombination from gene sequences.Genetics 2002, 160:1231–1241.
46. R Development Core Team: R: A Language and Environment for StatisticalComputing. Vienna, Austria: R Foundation for Statistical Computing; 2009.
47. Librado P, Rozas J: DnaSP v5: a software for comprehensive analysis ofDNA polymorphism data. Bioinformatics 2009, 25:1451–1452.
doi:10.1186/1471-2148-14-89Cite this article as: Navascués et al.: Distinguishing migration fromisolation using genes with intragenic recombination: detectingintrogression in the Drosophila simulans species complex. BMC EvolutionaryBiology 2014 14:89.
Submit your next manuscript to BioMed Centraland take full advantage of:
• Convenient online submission
• Thorough peer review
• No space constraints or color figure charges
• Immediate publication on acceptance
• Inclusion in PubMed, CAS, Scopus and Google Scholar
• Research which is freely available for redistribution
Submit your manuscript at www.biomedcentral.com/submit