Epithelial StructureRevealed by Chemical Dissection and Unembedded ElectronMicroscopy

RESEARCH ARTICLE Open Access
Genetic dissection of maize phenology usingan intraspecific introgression librarySilvio Salvi1*, Simona Corneti1, Massimo Bellotti1, Nicola Carraro1,2, Maria C Sanguineti1,Sara Castelletti1, Roberto Tuberosa1
Abstract
Background: Collections of nearly isogenic lines where each line carries a delimited portion of a donor sourcegenome into a common recipient genetic background are known as introgression libraries and have alreadyshown to be instrumental for the dissection of quantitative traits. By means of marker-assisted backcrossing, wehave produced an introgression library using the extremely early-flowering maize (Zea mays L.) variety Gaspé Flintand the elite line B73 as donor and recipient genotypes, respectively, and utilized this collection to investigate thegenetic basis of flowering time and related traits of adaptive and agronomic importance in maize.
Results: The collection includes 75 lines with an average Gaspé Flint introgression length of 43.1 cM. Thecollection was evaluated for flowering time, internode length, number of ears, number of nodes (phytomeres),number of nodes above the ear, number and proportion of nodes below the ear and plant height. Five QTLs forflowering time were mapped, all corresponding to major QTLs for number of nodes. Three additional QTLs fornumber of nodes were mapped. Besides flowering time, the QTLs for number of nodes drove phenotypic variationfor plant height and number of nodes below and above the top ear, but not for internode length. A number ofapparently Mendelian-inherited phenotypes were also observed.
Conclusions: While the inheritance of flowering time was dominated by the well-known QTL Vgt1, a number ofother important flowering time QTLs were identified and, thanks to the type of plant material here utilized,immediately isogenized and made available for fine mapping. At each flowering time QTL, early floweringcorrelated with fewer vegetative phytomeres, indicating the latter as a key developmental strategy to adapt themaize crop from the original tropical environment to the northern border of the temperate zone (southernCanada), where Gaspé Flint was originally cultivated. Because of the trait differences between the two parentalgenotypes, this collection will serve as a permanent source of nearly isogenic materials for multiple studies of QTLanalysis and cloning.
BackgroundThe production and the phenotypic analysis of pairs ofnearly isogenic lines (NILs) differing only for the alleleconstitution at given chromosome regions provides theopportunity to test for the presence at such regions ofgenetic factors involved in the inheritance of a quantita-tive trait [1,2]. In comparison with Quantitative TraitLocus (QTL) analysis carried out based on classicalbiparental mapping populations such as F2, recombinantinbred lines (RILs), etc., this should in principle enhance
the statistical power of QTL detection by eliminatingthe blurring effect of multiple, and possibly interacting,segregating QTLs. A collection of NILs, each one differ-ing from a reference recipient genotype for a knownlimited chromosome region, and altogether representingmost of a donor genome, is known as introgressionlibrary (IL) [3,4]. In an IL, the donor genome is usuallyprovided by an interfertile accession (usually a landraceor a wild relative), while a breeding elite strain is usedas the recipient genetic stock. The process of IL produc-tion invariably involves some backcrossing scheme withthe assistance of marker surveys during or after thebackcross. ILs have been produced for a number ofmodel and crop plant species (Reviewed in [5]; see also
* Correspondence: [email protected] of Agroenvironmental Sciences and Technologies, University ofBologna, viale Fanin 44, 40127 Bologna, ItalyFull list of author information is available at the end of the article
Salvi et al. BMC Plant Biology 2011, 11:4http://www.biomedcentral.com/1471-2229/11/4
© 2011 Salvi et al; licensee BioMed Central Ltd. This is an Open Access article distributed under the terms of the Creative CommonsAttribution License (http://creativecommons.org/licenses/by/2.0), which permits unrestricted use, distribution, and reproduction inany medium, provided the original work is properly cited.

[6,7]), and even for model animal species such as mouse[8] and Caenorhabditis [9]. A pair of fully reciprocal ILpopulations were produced in Arabidopsis [10], with thetwo accessions used once as donor and once as recipi-ent. One IL was described in maize involving two inbredlines, Tx303 and B73, as donor and recipient genotypes,respectively [11].An IL enables moving and testing alleles from wild or
landraces accessions into the elite gene pool of a crop,thus making possible their exploitation in plant breeding[4]. Accordingly, introgression lines belonging to partialor complete IL were proven to have breeding potentialin cotton [12], maize [13], rice [14] and tomato [15].Additionally, IL lines played a major role in enabling thepositional cloning of major QTLs (eg. [16,17]), by pro-viding the starting plant material where the geneticeffect of the target QTL could be followed as any otherMendelian locus.Here we describe the general features and the initial
phenotyping of a maize intraspecific IL obtained usingGaspé Flint as the donor genotype and the elite line B73as the recipient genotype. Gaspé Flint is a varietybelonging to the Northern Flint maize race group [18],which was cultivated by American Native populations insoutheastern Canada [19]. It is virtually the earliestknown maize genotype and such earliness is the basis ofits adaptation to the very short summer growing seasonof Canada. One of the genetic determinants of GaspéFlint extreme earliness, the Vegetative to generative tran-sition1 (Vgt1) QTL [20,21] has already been identified bypositional cloning and shown to correspond to a non-coding, enhancer-like regulatory element of the AP-2class transcription factor ZmRap2.7 [22]. The hereindescribed B73 × Gaspé Flint IL lays the foundations forthe genetic and molecular characterization of additionalgenetic determinants of flowering time and other traitsof agronomic and adaptive importance in maize.
ResultsFeatures and coverage of the introgression libraryThe IL was produced following an SSR-based marker-assisted backcross procedure (Summarized in Methods)started from the cross B73 × Gaspé Flint. The genotypiccomposition of the 75 IL lines is shown in Figure 1A.Among these lines, 66 showed a single introgression,eight showed one additional introgression on a differentchromosome and one showed two additional introgres-sions. The average introgression length, including lineswith multiple introgressions, was 43.1 cM per lines (ca.2.4% of the maize genome) and ranged between 4.5 and104.0 cM (Table 1). Most of the lines carried homozy-gous introgressions, although partial heterozygosity wasobserved at six lines and total heterozygosity at twolines (ILL35 and ILL69). The majority of the lines
carried unique introgressions, with the exception of sixpairs of lines (ILL6 and ILL7, ILL43 and ILL44, ILL45and ILL46, ILL62 and ILL63, ILL67 and ILL68, ILL71and ILL72), where two lines per region were identifiedas showing similar introgressions. For each of these pairof lines, the second line was maintained in the IL setbecause derived from a partially different pedigree (i.e.from different BC1 - BC4 plants) within the IL back-cross, implying that the two lines could carry differentcrossover events at the target introgression or differenthidden introgressions. Additional redundancy of GaspéFlint introgressions was intentionally maintained at bin8.04-05 (covered by five different lines), bin 3.05-07(four lines) and bin 9.03-04 (seven lines), which are sitesof major flowering time QTLs (see below), in order toprovide enhanced opportunities for further geneticinvestigations. Additional details about IL compositionare reported in Table 1.Among the 173 informative SSR markers, 101 showed
a polymorphism between B73 and Gaspé Flint. Althoughmonomorphic and polymorphic SSRs alternated alongthe chromosomes, regions with contiguous mono-morphic SSRs were observed. Such regions hamperedthe recovery of the corresponding Gaspé Flint chromo-some segments. By arbitrarily considering only segmentswith four or more contiguous monomorphic SSR, weidentified six chromosome regions (Table 2), for a totalof 220.5 cM, corresponding to 12.2% of the maize refer-ence linkage map (see Methods). Such chromosomeportions were technically non-representable within thelibrary genome, at least with the markers used here.Given the low-resolution power of the standardagarose-gel electrophoresis utilized herein, the absenceof polymorphism does not necessarily imply identity ofnucleotide sequence between Gaspé Flint and B73 atsuch chromosome regions.The non-overlapping fraction of the Gaspè Flint gen-
ome represented in the library corresponded to 1207.1cM or to 66.9% of the maize reference map, which roseto 76.2% if we only consider the genome portion foundpolymorphic based on SSR profiles. Table 3 summarizesthe IL coverage by chromosome.With the only aim to support and verify the QTL ana-
lysis results based on the IL population, we additionallycharacterized two small populations, a BC1 (88 plants)and an F2 (65 plants) both derived from B73 × GaspéFlint crosses (see Methods).
Phenotypic analysisTable 4 lists the phenotypic traits (and correspondingacronyms) analysed in this study. As expected, Gaspé Flintshowed much lower ND, DPS and PH values (10.7 nodes,45.0 days and 106 cm, respectively) when compared toB73 (20.2 nodes, 74.7 days and 223 cm) (Table 4).
Salvi et al. BMC Plant Biology 2011, 11:4http://www.biomedcentral.com/1471-2229/11/4
Page 2 of 15

Figure 1 Graphical genotype and QTL effect. (A) Graphical genotype of the B73 × Gaspé Flint introgression library (IL). IL lines arerepresented horizontally and chromosome positions (polymorphic SSR markers as reported in Figure 2) are indicated vertically. Red and greenrectangles indicate homozygous and heterozygous Gaspé Flint introgression, respectively. (B) Phenotypic differences between IL lines and B73,represented as horizontal columns. Black columns indicate IL lines significantly different from B73 (P < 0.05). Units are ‘no. of days from planting’for days to pollen shed (DPS), ‘cm’ for internode length (INDL), ‘node number’ (ND), ‘node number’ below the top ear (NDBE), ‘node number’above the top ear (NDAE) and ‘cm’ for plant height (PH).
Salvi et al. BMC Plant Biology 2011, 11:4http://www.biomedcentral.com/1471-2229/11/4
Page 3 of 15
Additionally, Gaspè Flint showed proportionally lowervalues for NDAE and NDBE (3.1 and 7.6 nodes) whencompared with B73 (6.1 and 14.1 nodes, respectively), andno significant difference was observed for PNDBE. On theother hand, Gaspé Flint showed significantly higher EARNand INDL (3.4 and 15.8 cm) than B73 (1.5 ears and 13.8cm, respectively). The B73 × Gaspé Flint F1 hybrid showedintermediate values between the parental genotypes for alltraits except PNDBE for which no significance differencewas observed, and for INDL for which it was shown to besignificantly (P < 0.01) higher than B73 and Gaspé Flint(23.9, 13.8 and 15.8, cm respectively).The majority of the IL lines had DPS, GDU, ND,
NDBE and PH values close to B73 and only mildlyskewed distributions toward the Gaspé Flint values wereobserved, accordingly with the recovery of most of the
B73 genome (and therefore QTL alleles) in all lines(Additional file 1). ND, NDAE and NDBE values werenon-normally distributed (P < 0.01). EARN and NDresulted non-normally distributed in the BC1, similarlyto EARN, ND and ND-related traits in the F2.The BC1 population showed a DPS frequency distri-
bution shifted to lower values when compared with theF2 population (Additional file 1). The shift was likelyobserved because the BC1 population was grown laterin the summer, in conditions of higher mean tempera-tures (not shown). As a confirmation, the shiftdisappeared when GDU were considered instead ofDPS (Additional file 1). The ANOVA (or Kruskal-Wallis test), evidenced significant variation among ILlines (P < 0.001; not shown) for all traits. Broad senseheritability values ranged between 0.57 for PNDBE to0.98 for ND (Table 4). Generally, plant (for F2 andBC1) or line (for IL) values were within parental valuesand little or no transgressivity was observed for thethree populations with the exceptions of PH and INDL(Additional file 1). For PH and INDL, transgressionwas observed in the F2 and BC1 populations, withvalues higher than the high parent. This type of trans-gression (beyond the high-value parent) for plantheight and related phenotypes is not unexpected giventhe inherent heterozygosity of F2 and BC1 populationsthat typically positively influences hybrid vigor. Thetransgressivity observed in the IL population is specifi-cally treated in the QTL section.
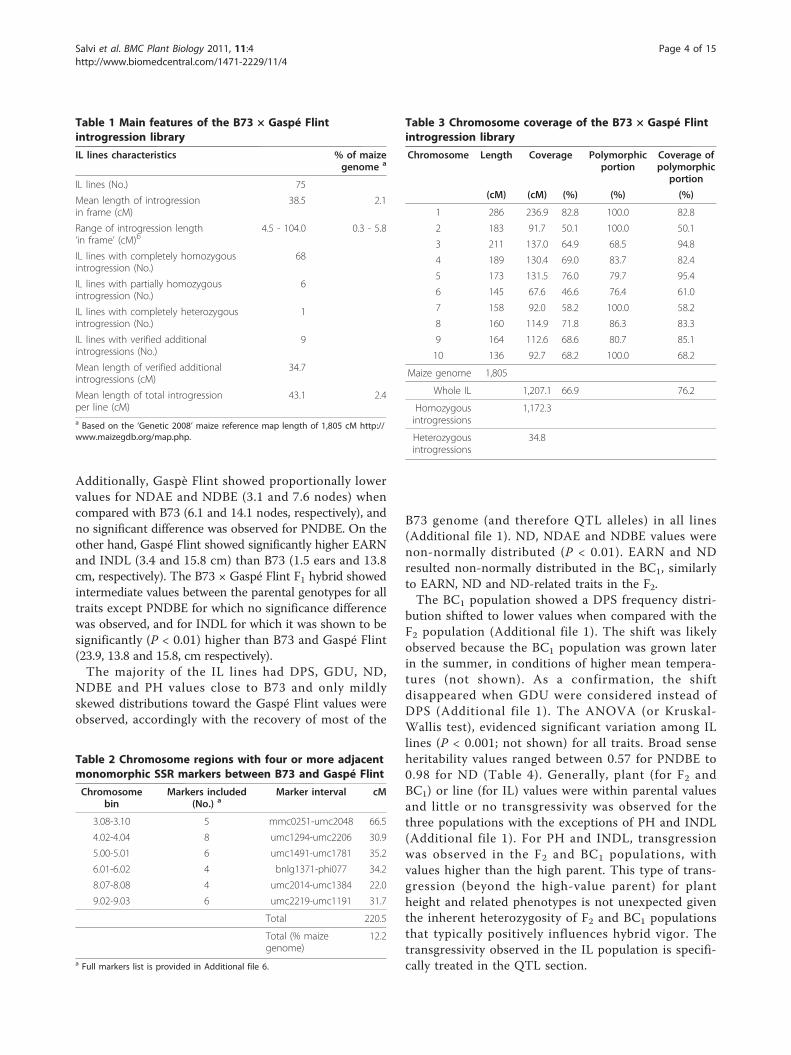
Table 1 Main features of the B73 × Gaspé Flintintrogression library
IL lines characteristics % of maizegenome a
IL lines (No.) 75
Mean length of introgressionin frame (cM)
38.5 2.1
Range of introgression length‘in frame’ (cM)b
4.5 - 104.0 0.3 - 5.8
IL lines with completely homozygousintrogression (No.)
68
IL lines with partially homozygousintrogression (No.)
6
IL lines with completely heterozygousintrogression (No.)
1
IL lines with verified additionalintrogressions (No.)
9
Mean length of verified additionalintrogressions (cM)
34.7
Mean length of total introgressionper line (cM)
43.1 2.4
a Based on the ‘Genetic 2008’ maize reference map length of 1,805 cM http://www.maizegdb.org/map.php.
Table 2 Chromosome regions with four or more adjacentmonomorphic SSR markers between B73 and Gaspé Flint
Chromosomebin
Markers included(No.) a
Marker interval cM
3.08-3.10 5 mmc0251-umc2048 66.5
4.02-4.04 8 umc1294-umc2206 30.9
5.00-5.01 6 umc1491-umc1781 35.2
6.01-6.02 4 bnlg1371-phi077 34.2
8.07-8.08 4 umc2014-umc1384 22.0
9.02-9.03 6 umc2219-umc1191 31.7
Total 220.5
Total (% maizegenome)
12.2
a Full markers list is provided in Additional file 6.
Table 3 Chromosome coverage of the B73 × Gaspé Flintintrogression library
Chromosome Length Coverage Polymorphicportion
Coverage ofpolymorphic
portion
(cM) (cM) (%) (%) (%)
1 286 236.9 82.8 100.0 82.8
2 183 91.7 50.1 100.0 50.1
3 211 137.0 64.9 68.5 94.8
4 189 130.4 69.0 83.7 82.4
5 173 131.5 76.0 79.7 95.4
6 145 67.6 46.6 76.4 61.0
7 158 92.0 58.2 100.0 58.2
8 160 114.9 71.8 86.3 83.3
9 164 112.6 68.6 80.7 85.1
10 136 92.7 68.2 100.0 68.2
Maize genome 1,805
Whole IL 1,207.1 66.9 76.2
Homozygousintrogressions
1,172.3
Heterozygousintrogressions
34.8
Salvi et al. BMC Plant Biology 2011, 11:4http://www.biomedcentral.com/1471-2229/11/4
Page 4 of 15

Correlation among traitsAcross the three populations, ND was strongly positivelycorrelated with NDBE, NDAE, DPS and PH. Addition-ally, ND was negatively correlated with INDL in the F2and BC1 populations, while this correlation was not sig-nificant within the IL (Table 5 and Additional files 2and 3). GDU and DPS were highly correlated (r = 0.99).PH was correlated (positively) with all traits exceptEARN and PNDBE. The genotypic and phenotypic cor-relation matrices based on the IL experiment providedalmost identical results (Table 5).
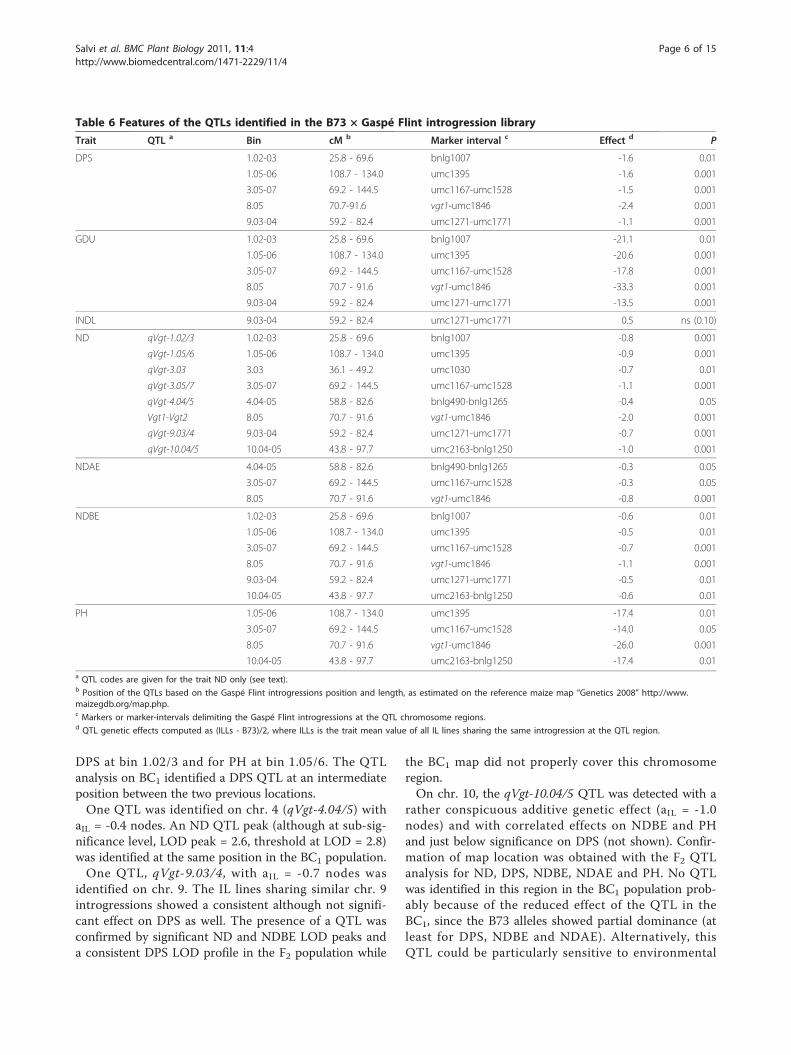
QTLs for flowering timeEight ND QTLs, on bins 1.02/3, 1.05/6, 3.03, 3.05/7,4.04/5, 8.05, 9.03/4, and 10.04/5 were identified. In allcases, the direction of the genetic effect of ND and DPSQTLs was univocal, as previously noted for the well-characterized flowering time QTLs Vgt1 and Vgt2[20-22], and in other studies [23]. This prompted us toname these flowering time loci as qVgt, followed by thebin number of their map location, with the exception ofthe QTLs on bins 8.04 and 8.05, for which we kept theformer Vgt1 and Vgt2 acronyms. Summaries of QTLparameters and positions are provided in Table 6, Addi-tional files 4 and 5, and Figure 2. A visualization of the
phenotypic differences between each IL line and B73 isprovided in Figure 1B.The strongest QTL was identified at bin 8.04-8.05 inthe IL, F2 and BC1 populations, accordingly with theknown position of Vgt1 and Vgt2 [20]. The additiveeffect (ai, with i = IL or F2) attributed to Vgt1-Vgt2complex locus in this study was estimated as aIL = -2.0and aF2 = -1.5 nodes (sign indicates direction of effectinduced by a Gaspé Flint allele). The Gaspé alleleshowed partial dominance. The Vgt1-Vgt2 regionshowed additional effects on DPS, NDBE, NDAE, andPH in the IL, on NDBE, DPS, and PH in the F2, and onDPS and PH in the BC1.The second strongest effect QTL was qVgt-3.05/7 (aIL =
-1.1). Additional significant effects were recorded for DPS,NDBE, NDAE, and PH. On the same chromosome, weidentified qVgt-3.03 (aIL = -0.7). The BC1 QTL analysisconfirmed the presence of flowering time QTL(s) onchr. 3, although the small population size likely precludedthe clear separation of LOD peaks.Two QTLs, qVgt-1.02/3 and qVgt-1.05/6, were identi-
fied on chr. 1. Such QTLs showed similar genetic effectsfor ND (aIL = ca. -0.8 and -0.9 nodes, respectively) andthe same effect for DPS (aIL = ca. -1.6 days). The F2 LODprofiles indicated the presence of small effect QTLs for
Table 4 Summary of phenotypic values for B73, F1 B73 × Gaspé Flint and Gaspé Flint, and trait heritability (h2)
Trait Acronym (unit) B73 F1 Gaspé Flint h2 (%)a
Days from planting to pollen shed DPS (days) 74.7 60.7 45.0 88.8
Number of ears EARN (count) 1.5 1.9 3.4 61.5
Growing degree unit GDU (unit) 646 458 313 89.1
Internode length INDL (cm) 13.8 23.9 15.8 75.3
Number of nodes ND (count) 20.2 12.1 10.7 98.2
Number of nodes above the top ear NDAE (count) 6.1 4.4 3.1 88.0
Number of nodes below the top ear NDBE (count) 14.1 7.7 7.6 95.9
Plant height PH (cm) 223.3 193.8 106.0 92.1
Proportion of nodes below the top ear PNDBE (rate) 0.7 0.6 0.7 57.0a Computed based on the introgression library field experiment.
Table 5 Genotypic (above diagonal) and phenotypic (below diagonal) correlations between traits based on the B73 ×Gaspé Flint introgression library
EARN DPS GDU INDL ND NDAE NDBE PH PNDBE
EARN - 0.10 0.09 0.01 0.10 -0.02 0.23* 0.14 0.44*
DPS 0.07 - 0.99** -0.09 0.89** 0.78** 0.91** 0.71** 0.18
GDU 0.07 0.99** - -0.08 0.89** 0.78** 0.91** 0.71** 0.17
INDL -0.06 -0.10 -0.09 - -0.11 0.01 -0.09 0.40** -0.18
ND 0.08 0.82** 0.83** -0.13 - 0.92** 0.98** 0.86** -0.11
NDAE -0.10 0.65** 0.66** -0.09 0.88** - 0.84** 0.81** -0.34*
NDBE 0.17 0.83** 0.83** -0.14 0.97** 0.73** - 0.83** 0.23*
PH 0.06 0.66** 0.66** 0.46** 0.82** 0.72** 0.79** - -0.02
PNDBE 0.35** -0.03 -0.03 -0.04 -0.19 -0.64** 0.05 -0.17 -
*, **: significance at P 0.05 and 0.01, respectively.
Salvi et al. BMC Plant Biology 2011, 11:4http://www.biomedcentral.com/1471-2229/11/4
Page 5 of 15
DPS at bin 1.02/3 and for PH at bin 1.05/6. The QTLanalysis on BC1 identified a DPS QTL at an intermediateposition between the two previous locations.One QTL was identified on chr. 4 (qVgt-4.04/5) with
aIL = -0.4 nodes. An ND QTL peak (although at sub-sig-nificance level, LOD peak = 2.6, threshold at LOD = 2.8)was identified at the same position in the BC1 population.One QTL, qVgt-9.03/4, with aIL = -0.7 nodes was
identified on chr. 9. The IL lines sharing similar chr. 9introgressions showed a consistent although not signifi-cant effect on DPS as well. The presence of a QTL wasconfirmed by significant ND and NDBE LOD peaks anda consistent DPS LOD profile in the F2 population while
the BC1 map did not properly cover this chromosomeregion.On chr. 10, the qVgt-10.04/5 QTL was detected with a
rather conspicuous additive genetic effect (aIL = -1.0nodes) and with correlated effects on NDBE and PHand just below significance on DPS (not shown). Confir-mation of map location was obtained with the F2 QTLanalysis for ND, DPS, NDBE, NDAE and PH. No QTLwas identified in this region in the BC1 population prob-ably because of the reduced effect of the QTL in theBC1, since the B73 alleles showed partial dominance (atleast for DPS, NDBE and NDAE). Alternatively, thisQTL could be particularly sensitive to environmental
Table 6 Features of the QTLs identified in the B73 × Gaspé Flint introgression library
Trait QTL a Bin cM b Marker interval c Effect d P
DPS 1.02-03 25.8 - 69.6 bnlg1007 -1.6 0.01
1.05-06 108.7 - 134.0 umc1395 -1.6 0.001
3.05-07 69.2 - 144.5 umc1167-umc1528 -1.5 0.001
8.05 70.7-91.6 vgt1-umc1846 -2.4 0.001
9.03-04 59.2 - 82.4 umc1271-umc1771 -1.1 0.001
GDU 1.02-03 25.8 - 69.6 bnlg1007 -21.1 0.01
1.05-06 108.7 - 134.0 umc1395 -20.6 0.001
3.05-07 69.2 - 144.5 umc1167-umc1528 -17.8 0.001
8.05 70.7 - 91.6 vgt1-umc1846 -33.3 0.001
9.03-04 59.2 - 82.4 umc1271-umc1771 -13.5 0.001
INDL 9.03-04 59.2 - 82.4 umc1271-umc1771 0.5 ns (0.10)
ND qVgt-1.02/3 1.02-03 25.8 - 69.6 bnlg1007 -0.8 0.001
qVgt-1.05/6 1.05-06 108.7 - 134.0 umc1395 -0.9 0.001
qVgt-3.03 3.03 36.1 - 49.2 umc1030 -0.7 0.01
qVgt-3.05/7 3.05-07 69.2 - 144.5 umc1167-umc1528 -1.1 0.001
qVgt-4.04/5 4.04-05 58.8 - 82.6 bnlg490-bnlg1265 -0.4 0.05
Vgt1-Vgt2 8.05 70.7 - 91.6 vgt1-umc1846 -2.0 0.001
qVgt-9.03/4 9.03-04 59.2 - 82.4 umc1271-umc1771 -0.7 0.001
qVgt-10.04/5 10.04-05 43.8 - 97.7 umc2163-bnlg1250 -1.0 0.001
NDAE 4.04-05 58.8 - 82.6 bnlg490-bnlg1265 -0.3 0.05
3.05-07 69.2 - 144.5 umc1167-umc1528 -0.3 0.05
8.05 70.7 - 91.6 vgt1-umc1846 -0.8 0.001
NDBE 1.02-03 25.8 - 69.6 bnlg1007 -0.6 0.01
1.05-06 108.7 - 134.0 umc1395 -0.5 0.01
3.05-07 69.2 - 144.5 umc1167-umc1528 -0.7 0.001
8.05 70.7 - 91.6 vgt1-umc1846 -1.1 0.001
9.03-04 59.2 - 82.4 umc1271-umc1771 -0.5 0.01
10.04-05 43.8 - 97.7 umc2163-bnlg1250 -0.6 0.01
PH 1.05-06 108.7 - 134.0 umc1395 -17.4 0.01
3.05-07 69.2 - 144.5 umc1167-umc1528 -14.0 0.05
8.05 70.7 - 91.6 vgt1-umc1846 -26.0 0.001
10.04-05 43.8 - 97.7 umc2163-bnlg1250 -17.4 0.01a QTL codes are given for the trait ND only (see text).b Position of the QTLs based on the Gaspé Flint introgressions position and length, as estimated on the reference maize map “Genetics 2008” http://www.maizegdb.org/map.php.c Markers or marker-intervals delimiting the Gaspé Flint introgressions at the QTL chromosome regions.d QTL genetic effects computed as (ILLs - B73)/2, where ILLs is the trait mean value of all IL lines sharing the same introgression at the QTL region.
Salvi et al. BMC Plant Biology 2011, 11:4http://www.biomedcentral.com/1471-2229/11/4
Page 6 of 15

cues, since the BC1 population was grown in a differentyear as compared to the IL and the F2, and with a lateplanting date. Interestingly, a QTL for photoperiod sen-sitivity was mapped right at bin 10.04 in several otherstudies [24-26].The results of the QTL analysis for GDU were vir-
tually equivalent to those for DPS (Table 6) and will notbe discussed further.
Other IL lines showing remarkable flowering phenotypesA limited number of IL lines, namely ILL4, ILL12, ILL44,ILL51 and ILL63 (Figure 1B), showed flowering time-related phenotypes and yet their introgressed regionswere not considered in the QTL summary because oflack of further experimental evidence from other lines orlack of coincidence with the F2 and the BC1 results. Itshould be noted that ILL4, ILL12 and ILL44, while notshowing any ND change when compared to B73, flow-ered significantly later than the latter. Such subtle effectlikely went undetected in the BC1 and F2 populations.
QTLs for other traitsIn keeping with the high phenotypic and genotypic cor-relation values, lines showing an effect on ND almostinvariably influenced NDBE, with the only exceptionbeing the two minor QTLs qVgt-3.03 and qVgt-4.04/5.A similar trend was observed for NDAE, although inthis case only three Vgt QTLs reached significance. TheF2 QTL analysis confirmed the effects of Vgt QTLs onNDBE and NDBE, albeit at fewer QTLs, in accordancewith the lower detection power of the F2 experiment.The Gaspé Flint introgressions corresponding to qVgt-
1.05/6, qVgt-3.05/7, Vgt1-Vgt2 and qVgt-10.04/5 signifi-cantly affected PH within the IL, with the Gaspé allelereducing PH. Additionally, PH mean values were simi-larly reduced, albeit not significantly, by the Gaspé alleleat the other qVgts. The analyses of the F2 and BC1 iden-tified two additional PH QTLs, at bins 8.06/8 and 10.01/4, respectively, which did not correspond to any qVgts.For the latter QTL, Gaspé Flint provided the allele withthe positive effect.
Figure 2 Summary of QTLs identified in the B73 × Gaspé Flint Introgression Library (IL), BC1 and F2 populations. QTLs are identifiedwith the name of the traits (Table 1) and the population and represented as vertical bars (white, hatched or black, for BC1, F2 or IL, respectively)on the left of chromosomes. Large and thin bars indicate the 1-LOD and 2-LOD drop supporting intervals for the BC1 and the F2 QTL analyses,while for the IL QTLs the solid black bar indicates the region of Gaspé Flint introgression with significant phenotypic effect. Grey portions withinchromosome bars indicate segments for which four or more SSR markers resulted monomorphic between B73 and Gaspé Flint. Chromosomerepresentation includes polymorphic SSR markers utilized for IL production and the non-polymorphic SSRs delimiting the monomorphic regionsbetween B73 and Gaspé Flint. Additionally, telomeres (based on the ‘Genetic 2008’ maize reference map available at http://www.maizegdb.org)are shown in order to provide indication of genome coverage.
Salvi et al. BMC Plant Biology 2011, 11:4http://www.biomedcentral.com/1471-2229/11/4
Page 7 of 15

One line (ILL71, bin 9.03/4) showed a significant effecton INDL, with the Gaspé Flint allele increasing the traitvalue (aIL = 1.0 cm; P < 0.05). Additionally, all other linescarrying introgressions at the same bin (corresponding toqVgt-9.03/4) showed a concordant direction of geneticeffect (aIL = 0.5 cm; P < 0.10). The presence of the INDLQTL was confirmed in the F2 (aF2 = 2.1 cm). The lack ofany detectable effect on PH at this chromosome region isprobably caused by the balancing effect on PH due to adecrease of ND with a contemporary increase of INDL.Minor effect INDL QTLs were identified at bins 5.06/8and 8.05/7 in the BC1, with Gaspé Flint providing thepositive allele in both cases.No EARN and PNDBE QTLs were detected in the
three populations.
IL lines with multiple Vgt introgressionsA number of IL lines were identified with trait valuessignificantly different from B73 and carrying multipleintrogressed Vgt QTLs. While their phenotypic valueswere not utilized to estimate the QTL effects, such linesare potentially useful for downstream analyses of QTLinteraction or for marker-assisted applications. Examplesof such lines are ILL25 (introgressions at qVgt-3.03 andqVgt-3.05/7), ILL28, ILL54, ILL55 and ILL57 (introgres-sions at qVgt-3.05/7 and Vgt1).
Qualitative traitsA number of clearly qualitative phenotypes segregatedwithin the IL. A locus (here tentatively named Field ker-nel cracking, Fkc) was found to influence the cracking(popping) of the kernel on the maturing ear (Figure 3A)and shown to map at bin 1.04 as confirmed by four ILlines carrying overlapping Gaspè Flint introgressions. Alocus responsible for the presence of a pigmented redband on the tassel outer glumes (which we tentativelynamed Red band on glumes, Rbg) was confirmed bythree IL lines carrying overlapping introgressions at bin2.03/4 (Figure 3B). Other IL lines showed clear distinctphenotypes (Glossy for ILL63, White stripes for ILL72,Zebra crossbands for ILL14. Figure 3C-E). However,because each phenotype was observed based on one ILline only, the attribution of these loci to a given chro-mosome region remains uncertain. We further observedILL4 as the only IL line with white cobs whereas allother lines and B73 had red cobs (not shown). This is inaccordance with ILL4 introgression at bin 1.03 encom-passing the p1 locus, known to provide pigmentation ofthe soft floral parts of the cob [27].
DiscussionGenetic basis of flowering time in maizeThe molecular dissection of quantitative traits is movingquickly from QTL to trait mapping, which is not only
mapping and cloning one or few QTLs but rather theidentification of all the major components responsiblefor the genetic variability of a given trait in a crop spe-cies. Buckler and co-workers [28], using the nested-asso-ciation mapping approach identified ca. 50 QTLs forflowering time at relatively high-resolution. However,even if such QTL map information can now be linkeddirectly to the maize genome sequence [29] and thus tocandidate genes, the identification of the causal genes orsequence features (also known as quantitative traitnucleotides - QTN [30]) remains unsolved, and will stillrequire the development of targeted cross populationsfor positional cloning.The IL lines and the QTL results described here pro-
vide a starting point for the positional cloning of sevenadditional flowering time QTLs, similarly to what hasbeen achieved for Vgt1. Although the genetic effectsestimated for these Vgt loci were considerably smallerthan the Vgt1 one (ca. a = 1.8 ND [22]), the Mendeliza-tion of even the smallest effect QTL (qVgt-4.04/5, a =0.4 ND), assuming a single causal gene per locus, couldbe obtained by phenotyping the segmental nearly-iso-genic lines for ND based on a low level of replication(ca. three, on an eight-plant plot basis).The full genetic dissection of the phenotypic differ-
ences between B73 and Gaspé Flint undoubtedly suf-fered by the incomplete coverage of the Gaspé Flintgenome (ca 70%) and by the partial genotyping. Theincomplete coverage could have prevented the identifi-cation of additional flowering time QTLs while the par-tial genotyping could have precluded the identificationof multiple introgressions within IL lines. The lattersituation could have lead to both false positive (theeffect was wrongly attributed to an introgressed chro-mosome region while it was actually due to a QTL lay-ing into a hidden introgression) and false negative (theeffect of an identified introgression was counterbalancedby the effect of a hidden one), or more generally tobiased estimation of effects. Such drawbacks were atleast partially prevented by carrying out parallel QTLanalyses on the B73 × Gaspé Flint-derived BC1 and F2populations. In this regard, the comparison of theresults of the QTL analyses from the three populationsshowed that all flowering time QTLs (in terms of NDand DPS) highlighted within the BC1 and the F2 popula-tions were identified in the analysis of the IL. SuchQTLs were the strongest in terms of genetic effect esti-mated in the IL, making unlikely that additional majorQTLs went unnoticed within the IL.Several important biological questions can be
addressed based on the availability of this IL. As pre-viously observed [20,23], we confirmed a high correla-tion between ND and DPS. Such correlation was alsoevident if direction and intensity of gene effect at the
Salvi et al. BMC Plant Biology 2011, 11:4http://www.biomedcentral.com/1471-2229/11/4
Page 8 of 15

DPS and ND QTL are considered (Table 6). Correlationbetween two traits paralleled by the coincidence ofQTLs and concurrent direction of QTL genetic effectshave been recognized as indications of prevalent pleio-tropy [31]. In our case, the causative QTNs at the flow-ering time QTLs would influence both ND and DPS.Because of the developmental architecture of cereals,
this translates in allele variation influencing primarilyND and consequently DPS. However, linkage of differ-ent genes for ND and DPS at some of the floweringtime QTLs cannot be excluded until molecular cloningof these QTLs will be accomplished. Additionally, weshowed that QTLs for DPS were fewer than QTLs forND and that QTLs for DPS coincided with QTLs for
Figure 3 Qualitative phenotypes observed within the B73 × Gaspé Flint introgression library. (A) to (C) and (E): qualitative phenotypes asshown by relevant IL lines and comparison with B73 (right of each pair of images). (D): IL line plot showing phenotypic segregation withmutant/altered and wild-type plants.
Salvi et al. BMC Plant Biology 2011, 11:4http://www.biomedcentral.com/1471-2229/11/4
Page 9 of 15

ND. Such observations imply that allelic variation atgenes influencing the time of switch to the reproductivephase prevails over genetic variation for the rate ofdevelopment (both plastochron and/or phyllochron, thatis, the rate of phytomere differentiation and distension,respectively). Accordingly, genes known to be involvedin maize plastochron (corngrass1/mir156 mapped onchr. 3, at 24.4 cM and PLA3/Vp8, mapped on chr. 1, at243 cM [32,33]) map outside the confidence interval ofthe Vgt QTLs. The lack of any QTL involved in plasto-chron/phyllochron is puzzling. Perhaps strong allelicvariation for plastochron/phyllochron genes is not com-patible with extreme earliness and satisfactory crop pro-duction, in such a way that strong plastochron/phyllochron new early alleles were (are) eliminatedunconsciously during the domestication and/or thebreeding processes. Alternatively, in the early phases ofmaize domestication and expansion, variation at suchgenes (at least between B73 and Gaspé Flint) was lost. Itis noteworthy that three lines (ILL4, ILL12, and ILL44)were identified that showed delayed DPS without signifi-cant effect on ND. Unfortunately, the existence of suchQTLs was not corroborated by multiple IL lines and bythe BC1 and F2 QTL results. For these lines, the GaspéFlint allele contributed the late allele. Altogether, theexistence of Gaspé Flint alleles delaying DPS withoutaffecting ND cannot be completely excluded. Theobserved delay in flowering time could result from i) ageneral slow plant development or ii) specific delay oftassel and/or flower development and anther extrusion.As expected and previously observed [23], ND varia-
tion also tightly drove variation for PH (the morenumerous the phytomeres, the higher the plant) andNDBE (if apical dominance is constant or independentlycontrolled from ND, a change in ND will directly reflectto NDBE). Unexpectedly, ND variation (and thereforeVgt QTLs) also correlated with NDAE, with the ND vs.NDAE phenotypic correlation r = 0.88 (P < 0.01) (Table5). One explanation is that NDAE (therefore the exten-sion of the apical dominance signal) is related to plantheight by the presence of a root- or crown-originatedacropetal promoting-signal counterbalancing the apicaldominance basipetally driven by auxin [34]. Alterna-tively, co-segregation for QTLs influencing apical domi-nance along with flowering time is possible. As a matterof fact, the NDAE effect detected in this study at bin3.05/7 coincides with a QTL previously reported for thesame trait [23,35], and a well-supported candidate gene(barren stalk1 [36]). Additionally, the Lfy locus, influen-cing the number of leaves above the ear [37], maps on3L [27].Only bin 9.02/4 consistently showed an effect on
INDL, based on IL and F2 QTL analyses. Interestingly,the gene Dwarf3, that codes for a P-450 cytochrome
involved in gibberelline biosynthetic pathway [38] mapswithin such interval.PH and INDL QTLs with positive Gaspé Flint allelic
effect were identified in the BC1 and F2 populations andnot in the IL (Additional files 4 and 5). Such result waslikely the consequence of the residual heterozygosity ofthe BC1 and F2 populations, which drove the expressionof heterotic effects on PH and INDL.By producing and testing IL lines with introgressions
at two or more loci, epistatic interactions among QTLscan be addressed in a (statistically) powerful way[39,40]. Within the B73 × Gaspé Flint genetic back-ground and for flowering traits, the presence of suchinteractions can be anticipated. The ND genetic effectsof all Vgt QTLs under a fully additive mode summed to14.7 nodes where the B73 - Gaspé Flint difference was9.5 nodes; on the contrary Vgt QTL effects on DPSsummed to 18.2 days, whereas the B73 - Gaspé Flint dif-ference was 29.7 days. Such discrepancy is likely theconsequence of multiple epistatic effects between differ-ent Vgt QTLs, which could reflect upon ND and DPS indifferent ways. However, additional causes could be (i)the segregation between B73 and Gaspé Flint of addi-tional flowering loci lacking the strict ND-DPS pleio-tropism and not represented within the IL, and (ii) theeffect on the Gaspé Flint phenotypic mean value of adominance component originated by the inherent GaspéFlint heterozygosity.
Molecular bases of flowering timeThis IL provides the opportunity to test the oldhypothesis that the amount of nuclear DNA (C-value)influences flowering time. Maize genome size wasshown to be negatively correlated with latitude andlength of growing season [41,42] and selection for ear-liness was linked with a reduction of C-values [43].Similarly, a correlation was found between the pre-sence of knobs (cytologically-detectable centromere-related chromosome regions, known to contain a largenumber of repeat units [44]) and delayed floweringtime [45]. Gaspé Flint has been repeatedly shown tohave one of the lowest C-values among the genus Zea[46] and to carry the least number of knobs-residentDNA repetitive elements in comparison with otherinvestigated inbreds [47].A number of coincidences of Vgt QTLs with flowering
time QTLs mapped in other studies were found. Vgt1-Vgt2 and qVgt-10.04/5 coincided with two of the threehighly recurrent consensus QTLs identified in a recentsurvey of 441 flowering time QTLs [48] and four VgtQTLs (qVgt-1.05/6, Vgt1 and Vgt2, qVgt-9.03/4 an qVgt-10.04/5) overlapped with ‘hot-spot’ QTLs identified afterQTL meta-analysis [49]. Additionally, all the other VgtQTLs mapped at regions of relatively high QTL density
Salvi et al. BMC Plant Biology 2011, 11:4http://www.biomedcentral.com/1471-2229/11/4
Page 10 of 15

[47]. Part of the explanation for such coincidence islikely the redundant use of B73 and related inbred linesas parents in many experimental populations [48].Beside Vgt1, no other Vgt locus has been resolved at
the level of candidate sequence and/or QTN. However,evidence of genes possibly involved in flowering timeand corresponding to Vgt loci (based on comparativeand/or fine mapping) have been collected in at leastfour studies. An FT-like gene, ZCN8, co-mapping withVgt2 (bin 8.04) was proposed as candidate based on theFT strict homology and pattern of expression profile[50]. Glossy15, an Ap2-like gene closely related withZmRap2.7 and shown to regulate the juvenility traitsand the time to flowering [51] co-maps with qVgt-9.03.qVgt-1.05/6 overlaps with bif2, a gene for which naturalallelic variation has been correlated with flowering timeand node number [52] and with an SPL-like gene impli-cated with flowering time in Arabidopsis [23]. Theregion of qVgt-10.04/5 harbors a photoperiod-sensitivelocus shown to include a CTT-like gene homologous toa heading-date gene of rice [25].
Genetics of adaptation to a short growing seasonenvironmentOur results showed that the extreme earliness of GaspéFlint, if compared to standard Corn Belt lines, is due toallelic variation at several loci, generally detected inother crosses [48], one of which (Vgt1, in this studylinked with Vgt2) with sizeable effect. As a next step, itwould be valuable to verify to what extent Gaspé Flintearliness is due to the combination of early alleles com-monly present in the maize germplasm or to uniqueearly alleles. The first hypothesis seems to be supportedby the results obtained from the positional cloning ofVgt1, the major of such flowering time QTLs. At Vgt1,Gaspé has been shown to carry a relatively commonhaplotype, shared even by medium-late Corn Belt dentlines [22], tropical germplasms and teosintes [53]. Addi-tionally, the coincidence of the Vgt QTLs with manyother flowering time QTLs supports the notion thatGaspé Flint alleles are present in other genetic back-grounds. Therefore, Gaspé Flint could be the prototypeof an unconscious QTL-allele pyramidization process,carried out by pre-Columbian, Native American farmersto adapt a tropical species to cultivation at the northernlimit of the temperate zone by recruiting alleles for ear-liness at a number of loci. The importance of the mole-cular verification of such hypothesis cannot beoveremphasized, since QTL pyramiding is at the core ofthe current genomics-assisted breeding paradigm [5].Nonetheless, it is possible that mutations contributing
new early alleles arose uniquely in the gene-pool underselection for earliness, and such mutations remainedconfined in the Northern Flints. Recurrent mutation at
the sugary1 locus has already been shown to haveoccurred during the process that led to the release ofmodern sweet maize inbreds and cultivars [54]. A highmutation rate was also hypothesized to be responsiblefor the linear response to selection for flowering time, ina selection experiment starting from a small, highlyinbred maize population [55]. Additionally, the extremeplasticity of the maize genome caused by the activity oftransposable elements at coding as well as at intergenicregions [56,57] makes it likely that changes at the regu-latory region of flowering time genes could have causedearly flowering, and could have recurrently beenselected. Reinforcing this hypothesis, Gaspé Flint wasalready reported to show an unusually high rate ofspontaneous mutations [58]. If confirmed, such highmutation rate could have provided the unique earlyalleles upon which selection for earliness acted.The adaptation of maize, a tropical species, to the
northern latitudes, and the molecular changes enablingit, can be set in a rather precise timeframe. Maize wasdomesticated from teosinte in the Balsas basin of south-ern Mexico ca. 6,000 - 10,000 years ago [59], thenreached south western United States ca. 3,000 years agoand northern United States and Canada only 1,000 yearsago, at the time when the very well-defined maize racegroup, the Northern Flint, originated [18,60]. The shortearly maize grown by the Penobscot Algonkins peoplein the Gaspé peninsula and described by the Canadianexplorer Jacques Cartier in 1555 was likely Gaspé Flint[61]. The relatively late northward expansion of maizecould have partially been caused by the complex geneticadaptations (e.g. extreme early flowering) required forthe short growing season [18].
ConclusionsThe genetic basis of maize flowering time was investi-gated using an introgression library developed using thevirtually earliest maize cultivar, Gaspé Flint, and theelite reference inbred line B73. At least eight chromo-some regions, including the well-known flowering timelocus Vgt1, showed allelic variation influencing floweringtime. These detected flowering time QTLs are involvedin determining the number of vegetative phytomeresdeveloped by the maize plant before switching to repro-ductive phase and do not appear to influence the rate ofdevelopment (i.e.: plastochron/phyllochron). Thus, redu-cing the number of phytomeres seems to have been thekey developmental feature enabling the adaptation of atropical crop species like maize to much northern envir-onments such as southern Canada. Thanks to thegenetic constitution of the plant material (nearly iso-genic lines) here described, all QTLs have been isoge-nized and are thus available for fine mapping. Weanticipate that the availability of this introgression
Salvi et al. BMC Plant Biology 2011, 11:4http://www.biomedcentral.com/1471-2229/11/4
Page 11 of 15

library will further contribute to the dissection and iden-tification of the molecular bases of the rather impressiveadapting plasticity of maize.
MethodsPlant material and production of the libraryGaspé Flint is an open-pollinated cultivar belonging tothe Northern Flint germplasm race group [18] and char-acterized by extreme earliness, low stature, high tilleringand multiple ears. Seed of Gaspé Flint was kindlydonated by Ronald Phillips, University of Minnesota, St.Paul, USA. B73 is an elite inbred line belonging to theIowa Stiff Stalk Synthetic heterotic group [62]. From thestarting cross (B73 × Gaspé Flint), two F1 plants wereutilized in a backcross with B73. Following the produc-tion of 88 B73 × (B73 × Gaspé Flint) BC1 plants, eachplant was sampled for DNA extraction and profiled with140 SSR markers (see below). Based on this molecularprofiling, a set of heterozygous target chromosomeregions (approximately one per BC1 plant), marked bytwo SSR flanking markers, were defined. From suchplants, four additional generations of backcross usingB73 as recurrent genotype were carried out, followed bythree cycles of selfing. For each backcross or self genera-tion and for each backcross family, approximately 20plants were grown in the field and genotyped for thetwo markers flanking the target chromosome region.From BC2 to BC5, for each family, one plant (the onewith more seed) heterozygous at the target region wasadvanced to the subsequent backcross generation. Atthe BC5 stage, plants heterozygous for the target intro-gression were selfed, producing BC5F2 seed. Plants ofeach BC5F2 family were screened with the assignedflanking SSR in order to identify and self plants (one perfamily) carrying the homozygous Gaspé Flint introgres-sion. BC5F3 families were then grown and selfed forseed increase and storage. The plants utilized for thisexperiment corresponded to BC5F4 whereas available ILseed stocks correspond to BC5F4 or BC5F5.
Marker analysisGenomic DNA was prepared from young leaf tissues aspreviously described [63]. A total of 180 SSR markers(Additional file 6) were utilized for searching poly-morphisms between B73 and Gaspé Flint, 173 of whichwere informative and seven failed to do so. From thesame set, SSR markers were selected for genotyping theIL. Primer information was downloaded from the MaizeGenome Database at http://www.maizegdb.org. Oneadditional marker, Vgt1-Mite, was utilized based on theinformation provided in [22]. PCR analyses for SSRwere carried out as described [21] and separation andvisualization followed standard agarose-gel electrophor-esis protocols.
Genome coverage and features of the ILPosition for all markers as well as the length of chromo-somes and introgressions are given in cM based on themaize reference map ‘Genetic 2008’ (available at http://www.maizegdb.org/map.php). Coverage of the IL wascomputed by summing unique Gaspé introgressionsacross the IL. Introgression start- and end-points weretaken as the mid-points from/to the nearest evaluatedmarkers or the telomeres. The same approach was usedto estimate the proportion of the Gaspé genome poly-morphic with B73 and not represented in the library.Chromosome regions containing four or more adjacentmonomorphic SSR markers were also similarly sized andconsidered technically non-representable (see Results).
Production of the F2 and BC1 populationsand linkage mapsAlong with the IL, an F2 population and a BC1 popula-tion were produced and utilized for linkage map con-struction and QTL analysis. The 88 (B73 × Gaspé Flint)× B73 BC1 plants corresponded to the ones used toestablish the IL and were genotyped with 70 SSRs evenlyspread on the 10 maize chromosome. Linkage map con-struction was carried out using JoinMap 3.0 [64], with aLOD threshold for linkage grouping of 3.0 and produced10 linkage groups which covered 1278 cM (71% of thereference map). The B73 × Gaspé Flint F2 populationincluded 65 plants and was genotyped with 26 poly-morphic SSR markers covering maize chromosomes 1,3, 8, 9 and 10. This linkage map covered 641 cM, corre-sponding to 78% of the same five linkage groups fromthe reference maize map ‘Genetic 2008’. For the twomaps, marker order was always in agreement with theone in the reference map.
Field experiment and collection of phenotypic dataAll field experiments were carried out at the experimen-tal station of the University of Bologna, near Cadriano(Lat.: N 44°33’03’’, Lon.: E 11°24’36’’, 33 m altitude),Italy. For the IL, 77 genotypes (75 IL lines, B73 and B73× Gaspè Flint F1) were planted following a randomizedcomplete block design, with four repetitions. Gaspé Flintwas grown in adjacent plots and not included in the ILexperiment because its reduced stature and vigor wouldhave biased the phenotypic score of neighbouring plots.The experiment was planted on April, 20, 2006, in 1.4m-long and 0.8 m-wide single-row plots, with eightplants per row, for a final density of 6.25 plants m-2.Nine phenotypic traits were recorded or computed(Table 1): number of days from planting to pollen shed(DPS) measured when 50% of the plants in a plot hadextruded at least one anther; number of ears (EARN)per plant counted at flowering; growing degree units(GDU) as alternative score for flowering time as
Salvi et al. BMC Plant Biology 2011, 11:4http://www.biomedcentral.com/1471-2229/11/4
Page 12 of 15
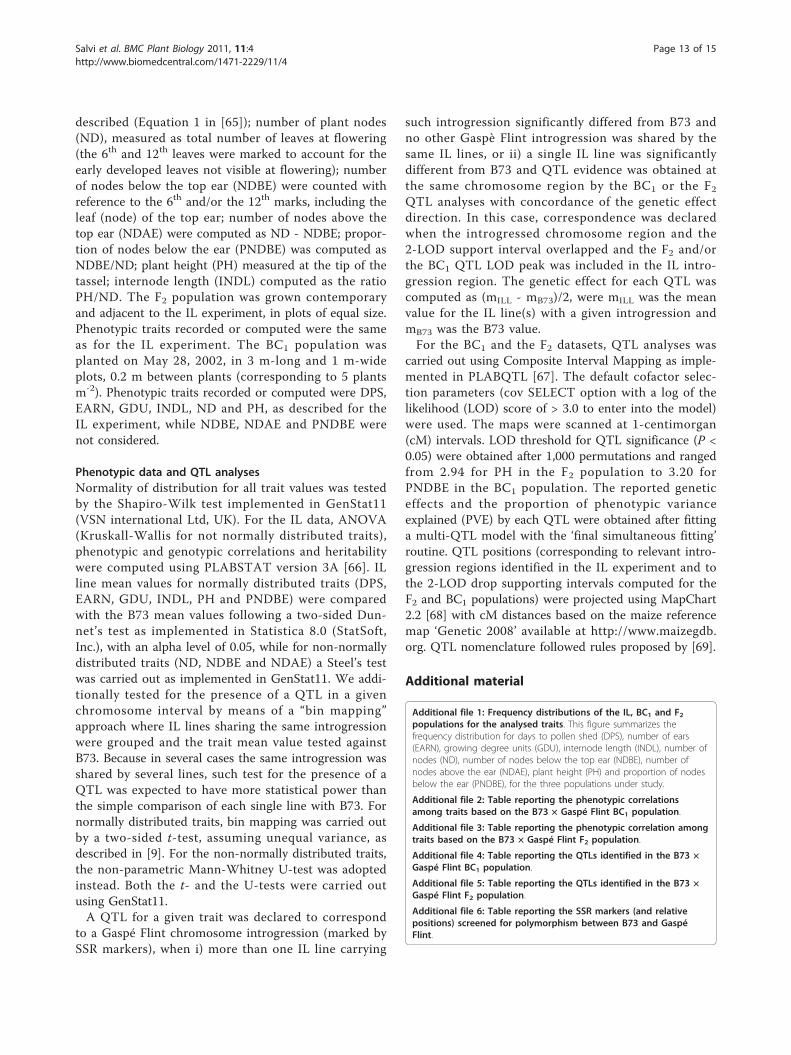
described (Equation 1 in [65]); number of plant nodes(ND), measured as total number of leaves at flowering(the 6th and 12th leaves were marked to account for theearly developed leaves not visible at flowering); numberof nodes below the top ear (NDBE) were counted withreference to the 6th and/or the 12th marks, including theleaf (node) of the top ear; number of nodes above thetop ear (NDAE) were computed as ND - NDBE; propor-tion of nodes below the ear (PNDBE) was computed asNDBE/ND; plant height (PH) measured at the tip of thetassel; internode length (INDL) computed as the ratioPH/ND. The F2 population was grown contemporaryand adjacent to the IL experiment, in plots of equal size.Phenotypic traits recorded or computed were the sameas for the IL experiment. The BC1 population wasplanted on May 28, 2002, in 3 m-long and 1 m-wideplots, 0.2 m between plants (corresponding to 5 plantsm-2). Phenotypic traits recorded or computed were DPS,EARN, GDU, INDL, ND and PH, as described for theIL experiment, while NDBE, NDAE and PNDBE werenot considered.
Phenotypic data and QTL analysesNormality of distribution for all trait values was testedby the Shapiro-Wilk test implemented in GenStat11(VSN international Ltd, UK). For the IL data, ANOVA(Kruskall-Wallis for not normally distributed traits),phenotypic and genotypic correlations and heritabilitywere computed using PLABSTAT version 3A [66]. ILline mean values for normally distributed traits (DPS,EARN, GDU, INDL, PH and PNDBE) were comparedwith the B73 mean values following a two-sided Dun-net’s test as implemented in Statistica 8.0 (StatSoft,Inc.), with an alpha level of 0.05, while for non-normallydistributed traits (ND, NDBE and NDAE) a Steel’s testwas carried out as implemented in GenStat11. We addi-tionally tested for the presence of a QTL in a givenchromosome interval by means of a “bin mapping”approach where IL lines sharing the same introgressionwere grouped and the trait mean value tested againstB73. Because in several cases the same introgression wasshared by several lines, such test for the presence of aQTL was expected to have more statistical power thanthe simple comparison of each single line with B73. Fornormally distributed traits, bin mapping was carried outby a two-sided t-test, assuming unequal variance, asdescribed in [9]. For the non-normally distributed traits,the non-parametric Mann-Whitney U-test was adoptedinstead. Both the t- and the U-tests were carried outusing GenStat11.A QTL for a given trait was declared to correspond
to a Gaspé Flint chromosome introgression (marked bySSR markers), when i) more than one IL line carrying
such introgression significantly differed from B73 andno other Gaspè Flint introgression was shared by thesame IL lines, or ii) a single IL line was significantlydifferent from B73 and QTL evidence was obtained atthe same chromosome region by the BC1 or the F2QTL analyses with concordance of the genetic effectdirection. In this case, correspondence was declaredwhen the introgressed chromosome region and the2-LOD support interval overlapped and the F2 and/orthe BC1 QTL LOD peak was included in the IL intro-gression region. The genetic effect for each QTL wascomputed as (mILL - mB73)/2, were mILL was the meanvalue for the IL line(s) with a given introgression andmB73 was the B73 value.For the BC1 and the F2 datasets, QTL analyses was
carried out using Composite Interval Mapping as imple-mented in PLABQTL [67]. The default cofactor selec-tion parameters (cov SELECT option with a log of thelikelihood (LOD) score of > 3.0 to enter into the model)were used. The maps were scanned at 1-centimorgan(cM) intervals. LOD threshold for QTL significance (P <0.05) were obtained after 1,000 permutations and rangedfrom 2.94 for PH in the F2 population to 3.20 forPNDBE in the BC1 population. The reported geneticeffects and the proportion of phenotypic varianceexplained (PVE) by each QTL were obtained after fittinga multi-QTL model with the ‘final simultaneous fitting’routine. QTL positions (corresponding to relevant intro-gression regions identified in the IL experiment and tothe 2-LOD drop supporting intervals computed for theF2 and BC1 populations) were projected using MapChart2.2 [68] with cM distances based on the maize referencemap ‘Genetic 2008’ available at http://www.maizegdb.org. QTL nomenclature followed rules proposed by [69].
Additional material
Additional file 1: Frequency distributions of the IL, BC1 and F2populations for the analysed traits. This figure summarizes thefrequency distribution for days to pollen shed (DPS), number of ears(EARN), growing degree units (GDU), internode length (INDL), number ofnodes (ND), number of nodes below the top ear (NDBE), number ofnodes above the ear (NDAE), plant height (PH) and proportion of nodesbelow the ear (PNDBE), for the three populations under study.
Additional file 2: Table reporting the phenotypic correlationsamong traits based on the B73 × Gaspé Flint BC1 population.
Additional file 3: Table reporting the phenotypic correlation amongtraits based on the B73 × Gaspé Flint F2 population.
Additional file 4: Table reporting the QTLs identified in the B73 ×Gaspé Flint BC1 population.
Additional file 5: Table reporting the QTLs identified in the B73 ×Gaspé Flint F2 population.
Additional file 6: Table reporting the SSR markers (and relativepositions) screened for polymorphism between B73 and GaspéFlint.
Salvi et al. BMC Plant Biology 2011, 11:4http://www.biomedcentral.com/1471-2229/11/4
Page 13 of 15
AcknowledgementsWe thank Ronald Phillips for providing seed of Gaspé Flint and Matteo Ferri,Stefano Vecchi and Elena Govoni for technical support. We thank FrancescaVentura for providing meteorological data (temperature) for the GDUanalysis. We acknowledge the contribution of the Interdepartmental Centrefor Biotechnology, University of Bologna.
Author details1Department of Agroenvironmental Sciences and Technologies, University ofBologna, viale Fanin 44, 40127 Bologna, Italy. 2Department of Horticultureand Landscape Architecture, 625 Agriculture Mall Drive, Purdue University,West Lafayette, IN 47907, USA.
Authors’ contributionsSS conceived the study, participated to the field and molecular work anddrafted the manuscript; CSimona, BM, CN, CSara performed field andmolecular work and participated to statistical analyses; SMC supervised fieldexperiment design and performed statistical analysis; TR participated inconceiving the study, coordinating the field and molecular work and indrafting the manuscript. All authors read and approved the final manuscript.
Received: 4 June 2010 Accepted: 6 January 2011Published: 6 January 2011
References1. Thoday J: Location of polygenes. Nature 1961, 191:368-370.2. Wehrhahn C, Allard R: The detection and measurements of the effects of
individual genes involved in the inheritance of a quantitative characterin wheat. Genetics 1965, 51:109-119.
3. Eshed Y, Zamir D: An introgression line population of Lycopersiconpennellii in the cultivated tomato enables the identification and finemapping of yield-associated QTL. Genetics 1995, 141(3):1147-1162.
4. Zamir D: Improving plant breeding with exotic genetic libraries. Nat RevGenet 2001, 2(12):983-989.
5. Grandillo S, Tanksley S, Zamir D: Exploitation of natural biodiversitythrough genomics. In Genomics-Assisted Crop Improvement: GenomicsApproaches and Platforms. Edited by: Varshney RK, Tuberosa R. New York:Springer; 2007:121-150.
6. Keurentjes JJB, Bentsink L, Alonso-Blanco C, Hanhart CJ, Vries HBD, Effgen S,Vreugdenhil D, Koornneef M: Development of a near-isogenic linepopulation of Arabidopsis thaliana and comparison of mapping powerwith a recombinant inbred line population. Genetics 2007, 175(2):891-905.
7. Schmalenbach I, Korber N, Pillen K: Selecting a set of wild barleyintrogression lines and verification of QTL effects for resistance topowdery mildew and leaf rust. Theor Appl Genet 2008, 117(7):1093-1106.
8. Takada T, Mita A, Maeno A, Sakai T, Shitara H, Kikkawa Y, Moriwaki K,Yonekawa H, Shiroishi T: Mouse inter-subspecific consomic strains forgenetic dissection of quantitative complex traits. Genome Res 2008,18(3):500-508.
9. Doroszuk A, Snoek LB, Fradin E, Riksen J, Kammenga J: A genome-widelibrary of CB4856/N2 introgression lines of Caenorhabditis elegans.Nucleic Acids Res 2009, 37(16).
10. Torjek O, Meyer RC, Zehnsdorf M, Teltow M, Strompen G, Witucka-Wall H,Blacha A, Altmann T: Construction and analysis of 2 reciprocalArabidopsis introgression line populations. J Hered 2008, 99(4):396-406.
11. Szalma SJ, Hostert BM, LeDeaux JR, Stuber CW, Holland JB: QTL mappingwith near-isogenic lines in maize. Theor Appl Genet 2007,114(7):1211-1228.
12. Saha S, Jenkins JN, Wu JX, McCarty JC, Gutierrez OA, Percy RG, Cantrell RG,Stelly DM: Effects of chromosome-specific introgression in upland cottonon fiber and agronomic traits. Genetics 2006, 172(3):1927-1938.
13. Stuber CW, Polacco M, Lynn M: Synergy of empirical breeding, marker-assisted selection, and genomics to increase crop yield potential. CropSci 1999, 39(6):1571-1583.
14. Ashikari M, Matsuoka M: Identification, isolation and pyramiding ofquantitative trait loci for rice breeding. Trends Plant Sci 2006,11(7):344-350.
15. Lippman ZB, Semel Y, Zamir D: An integrated view of quantitative traitvariation using tomato interspecific introgression lines. Curr Opin Genet &Dev 2007, 17(6):545-552.
16. Frary A, Nesbitt TC, Grandillo S, van der Knaap E, Cong B, Liu JP,Meller J, Elber R, Alpert KB, Tanksley SD: fw2.2: A quantitative traitlocus key to the evolution of tomato fruit size. Science 2000,289(5476):85-88.
17. Fridman E, Pleban T, Zamir D: A recombination hotspot delimits a wild-species quantitative trait locus for tomato sugar content to 484 bpwithin an invertase gene. Proc Natl Acad Sci USA 2000, 97(9):4718-4723.
18. Vigouroux Y, Glaubitz JC, Matsuoka Y, Goodman MM, Jesus SG, Doebley J:Population structure and genetic diversity of new world maize racesassessed by DNA microsatellites. Am J Bot 2008, 95(10):1240-1253.
19. Goodman MM, Brown WL: Races of corn. In Corn and corn improvement. 3edition. Edited by: Sprague GF, Dudley JW. Madison: American Society ofAgronomy; 1988:33-79.
20. Vladutu C, McLaughlin J, Phillips RL: Fine mapping and characterization oflinked quantitative trait loci involved in the transition of the maizeapical meristem from vegetative to generative structures. Genetics 1999,153(2):993-1007.
21. Salvi S, Tuberosa R, Chiapparino E, Maccaferri M, Veillet S, van Beuningen L,Isaac P, Edwards K, Phillips RL: Toward positional cloning of Vgt1, a QTLcontrolling the transition from the vegetative to the reproductive phasein maize. Plant Mol Biol 2002, 48(5):601-613.
22. Salvi S, Sponza G, Morgante M, Tomes D, Niu X, Fengler K, Meeley R,Ananiev E, Svitashev S, Bruggemann E, Niu X, Li B, Rafalski A, Tingey SV,Miao G-H, Phillips RL, Tomes D, Tuberosa R: Conserved noncodinggenomic sequences associated with a flowering-time quantitative traitlocus in maize. Proc Natl Acad Sci USA 2007, 104(27):11376-11381.
23. Lauter N, Moscou M, Habiger J, Moose S: Quantitative genetic dissectionof shoot architecture traits in maize: towards a functional genomicsapproach. Plant Genome 2008, 1:99-110.
24. Coles ND, McMullen MD, Balint-Kurti PJ, Pratt RC, Holland JB: Geneticcontrol of photoperiod sensitivity in maize revealed by joint multiplepopulation analysis. Genetics 2010, 184(3):799-812.
25. Ducrocq S, Giauffret C, Madur D, Combes V, Dumas F, Jouanne S,Coubriche D, Jamin P, Moreau L, Charcosset A: Fine mapping andhaplotype structure analysis of a major flowering time quantitative traitlocus on maize chromosome 10. Genetics 2009, 183(4):1555-1563.
26. Wang CL, Cheng FF, Sun ZH, Tang JH, Wu LC, Ku LX, Chen YH: Geneticanalysis of photoperiod sensitivity in a tropical by temperate maizerecombinant inbred population using molecular markers. Theor ApplGenet 2008, 117(7):1129-1139.
27. Neuffer MG, Coe EH, Wessler SR: Mutants of maize New York: Cold SpringHarbour Laboratory Press; 1997.
28. Buckler ES, Holland JB, Bradbury PJ, Acharya CB, Brown PJ, Browne C,Ersoz E, Flint-Garcia S, Garcia A, Glaubitz JC, Goodman MM, Harjes C, Guill K,Kroon DE, Larsson S, Lepak NK, Li HH, Mitchell SE, Pressoir G, Peiffer JA,Rosas MO, Rocheford TR, Romay MC, Romero S, Salvo S, Villeda HS, DaSilva HS, Sun Q, Tian F, Upadyayula N, Ware D, Yates H, Yu JM, Zhang ZW,Kresovich S, McMullen MD: The genetic architecture of maize floweringtime. Science 2009, 325(5941):714-718.
29. Schnable PS, Ware D, Fulton RS, Stein JC, Wei F, Pasternak S, Liang C,Zhang J, Fulton L, et al: The B73 maize genome: complexity, diversity,and dynamics. Science 2009, 326(5956):1112-1115.
30. Salvi S, Tuberosa R: To clone or not to clone plant QTLs: present andfuture challenges. Trends Plant Sci 2005, 10(6):297-304.
31. Tuberosa R, Salvi S, Sanguineti MC, Landi P, Maccaferri M, Conti S: MappingQTLs regulating morpho-physiological traits and yield in drought-stressed maize: case studies, shortcomings and perspectives. Ann Bot2002, 89(7):941-963.
32. Chuck G, Cigan AM, Saeteurn K, Hake S: The heterochronic maize mutantCorngrass1 results from overexpression of a tandem microRNA. NatGenet 2007, 39(4):544-549.
33. Kawakatsu T, Taramino G, Itoh J, Allen J, Sato Y, Hong SK, Yule R,Nagasawa N, Kojima M, Kusaba M, Sakakibara H, Sakai H, Nagato Y:PLASTOCHRON3/GOLIATH encodes a glutamate carboxypeptidaserequired for proper development in rice. Plant J 2009, 58(6):1028-1040.
34. Shimizu-Sato S, Tanaka M, Mori H: Auxin-cytokinin interactions in thecontrol of shoot branching. Plant Mol Biol 2009, 69(4):429-435.
35. Ragot M, Sisco PH, Hoisington DA, Stuber CW: Molecular-marker-mediatedcharacterization of favorable exotic alleles at quantitative trait loci inmaize. Crop Sci 1995, 35(5):1306-1315.
Salvi et al. BMC Plant Biology 2011, 11:4http://www.biomedcentral.com/1471-2229/11/4
Page 14 of 15
36. Gallavotti A, Zhao Q, Kyozuka J, Meeley RB, Ritter M, Doebley JF, Pe ME,Schmidt RJ: The role of barren stalk1 in the architecture of maize. Nature2004, 432(7017):630-635.
37. Shaver D: Genetics and breeding of maize with extra leaves above theear. 38th Annual Corn and Sorghum Research Conference: 7-8 Dec. 1983Washington, DC: American Seed Trade Association; 1983, 161-180.
38. Winkler RG, Helentjaris T: The maize Dwarf3 gene encodes a cytochromep450-mediated early step in gibberellin biosynthesis. Plant Cell 1995,7(8):1307-1317.
39. Melchinger AE, Piepho HP, Utz HF, Muminovic J, Wegenast T, Torjek O,Altmann T, Kusterer B: Genetic basis of heterosis for growth-related traitsin Arabidopsis investigated by testcross progenies of near-isogenic linesreveals a significant role of epistasis. Genetics 2007, 177(3):1827-1837.
40. Reif JC, Kusterer B, Piepho HP, Meyer RC, Altmann T, Schon CC,Melchinger AE: Unraveling epistasis with triple testcross progenies ofnear-isogenic lines. Genetics 2009, 181(1):247-257.
41. Laurie DA, Bennett MD: Nuclear-DNA content in the genera Zea andSorghum - intergeneric, interspecific and intraspecific variation. Heredity1985, 55:307-313.
42. Rayburn AL, Price HJ, Smith JD, Gold JR: C-band heterochromatin andDNA content in Zea mays. Am J Bot 1985, 72(10):1610-1617.
43. Rayburn AL, Dudley JW, Biradar DP: Selection for early flowering results insimultaneous selection for reduced nuclear DNA content in maize. PlantBreed 1994, 112(4):318-322.
44. Dawe R: Maize centromeres and knobs (neocentromeres). In MaizeHandbook Volume II Genetics and Genomics. Edited by: Bennetzen J, Hake S.New York: Springer; 2009.
45. Chughtai SR, Steffensen DM: Heterochromatic knob composition ofcommercial inbred lines of maize. Maydica 1987, 32(3):171-187.
46. Grant WF, Owens ET: Zea mays assays of chemical/radiation genotoxicityfor the study of environmental mutagens. Mutat Res Rev Mutat Res 2006,613(1):17-64.
47. Ananiev EV, Phillips RL, Rines HW: Complex structure of knob DNA onmaize chromosome 9: Retrotransposon invasion into heterochromatin.Genetics 1998, 149(4):2025-2037.
48. Salvi S, Castelletti S, Tuberosa R: An updated consensus map for floweringtime QTLs in maize. Maydica 2009, 54:501-512.
49. Chardon F, Virlon B, Moreau L, Falque M, Joets J, Decousset L, Murigneux A,Charcosset A: Genetic architecture of flowering time in maize as inferredfrom quantitative trait loci meta-analysis and synteny conservation withthe rice genome. Genetics 2004, 168(4):2169-2185.
50. Danilevskaya ON, Meng X, Hou ZL, Ananiev EV, Simmons CR: A genomicand expression compendium of the expanded PEBP gene family frommaize. Plant Physiol 2008, 146(1):250-264.
51. Lauter N, Kampani A, Carlson S, Goebel M, Moose SP: microRNA172 down-regulates glossy15 to promote vegetative phase change in maize. ProcNatl Acad Sci USA 2005, 102(26):9412-9417.
52. Pressoir G, Brown PJ, Zhu WY, Upadyayula N, Rocheford T, Buckler ES,Kresovich S: Natural variation in maize architecture is mediated by allelicdifferences at the PINOID co-ortholog barren inflorescence2. Plant J 2009,58(4):618-628.
53. Ducrocq S, Madur D, Veyrieras JB, Camus-Kulandaivelu L, Kloiber-Maitz M,Presterl T, Ouzunova M, Manicacci D, Charcosset A: Key impact of Vgt1 onflowering time adaptation in maize: Evidence from association mappingand ecogeographical information. Genetics 2008, 178(4):2433-2437.
54. Tracy WF, Whitt SR, Buckler ES: Recurrent mutation and genomeevolution: example of Sugary1 and the origin of sweet maize. Crop Sci2006, 46(S1):S-49-S-54.
55. Durand E, Tenaillon M, Ridel C, Coubriche D, Jamin P, Jouanne S,Ressayre A, Charcosset A, Dillmann C: Standing variation and newmutations both contribute to a fast response to selection for floweringtime in maize inbreds. BMC Evol Biol 2010, 10:2.
56. Morgante M, Brunner S, Pea G, Fengler K, Zuccolo A, Rafalski A: Geneduplication and exon shuffling by helitron-like transposons generateintraspecies diversity in maize. Nat Genet 2005, 37(9):997-1002.
57. Wang QH, Dooner HK: Remarkable variation in maize genome structureinferred from haplotype diversity at the bz locus. Proc Natl Acad Sci USA2006, 103(47):17644-17649.
58. Vladutu CI, Phillips RL: Spontaneous activation of transposable elementsfollowing an interracial cross in maize. Maize Genetics CooperationNewsletter 1998, 72:70-71.
59. Matsuoka Y, Vigouroux Y, Goodman MM, Sanchez GJ, Buckler E, Doebley J:A single domestication for maize shown by multilocus microsatellitegenotyping. Proc Natl Acad Sci USA 2002, 99(9):6080-6084.
60. Fritz GJ: New dates and data on early agriculture - The legacy ofcomplex hunter-gatherers. Ann Miss Bot Gard 1995, 82(1):3-15.
61. Byers D: Review of “The Native Americans: Prehistory and Ethnology ofthe North American Indians” by Spencer RF and Jennings JD. AmAntiquity 1966, 31:582-584.
62. Gerdes JT, Behr CF, Coors JG, Tracy WF: In Compilation of North AmericanMaize Breeding Germplasm. Edited by: Tracy WF, Coors JG, Geadelmann JL.Madison: Crop Science Society of America; 1993:.
63. Salvi S, Phillips RL, Tuberosa R: Development of PCR-based assays forallelic discrimination in maize by using the 5’-nuclease procedure. MolBreed 2001, 8(2):169-176.
64. Van Ooijen J, Voorrips R: Join Map® 3.0, Software for the calculation ofgenetic linkage maps. Plant Research International, Wageningen, theNetherlands; 2001.
65. Dwyer LM, Stewart DW, Carrigan L, Ma BL, Neave P, Balchin D: Guidelinesfor comparisons among different maize maturity rating systems. Agron J1999, 91(6):946-949.
66. Utz HF: PLABSTAT: a computer program for the statistical analysis ofplant breeding experiments. University of Hohenheim, Stuttgart, Germany:Institute of Plant Breeding, Seed Science and Population Genetics; 1998.
67. Utz HF, Melchinger AE: PLABQTL: A program for composite intervalmapping of QTL. J Quant Trait Loci 1996, 2(1).
68. Voorrips RE: MapChart: Software for the graphical presentation of linkagemaps and QTLs. J Hered 2002, 93(1):77-78.
69. McCouch S, Cho Y, Yano M, Paul E, Blinstrub M, Morishima H, Kinoshita T:Report on QTL nomenclature. Rice Genetics Newsletter 1997, 14:11-13.
doi:10.1186/1471-2229-11-4Cite this article as: Salvi et al.: Genetic dissection of maize phenologyusing an intraspecific introgression library. BMC Plant Biology 2011 11:4.
Submit your next manuscript to BioMed Centraland take full advantage of:
• Convenient online submission
• Thorough peer review
• No space constraints or color figure charges
• Immediate publication on acceptance
• Inclusion in PubMed, CAS, Scopus and Google Scholar
• Research which is freely available for redistribution
Submit your manuscript at www.biomedcentral.com/submit
Salvi et al. BMC Plant Biology 2011, 11:4http://www.biomedcentral.com/1471-2229/11/4
Page 15 of 15
Copyright © 2022 FDOKUMEN