Efficiency of markers and methods for detecting hybrids and introgression in stocked populations
12
RESEARCH ARTICLE Efficiency of markers and methods for detecting hybrids and introgression in stocked populations Nuria Sanz Rosa M. Araguas Raquel Ferna ´ndez Manuel Vera Jose ´-Luis Garcı ´a-Marı ´n Received: 28 September 2007 / Accepted: 5 March 2008 / Published online: 16 March 2008 Ó Springer Science+Business Media B.V. 2008 Abstract Detection of hybridization and introgression in wild populations that have been supplemented by hatchery fish is necessary during development of conservation and management strategies. Initially, allozyme data and more recently highly polymorphic microsatellite markers have been used to obtain this information. We used both markers to assess the effectiveness of four assignment methods (STRUCTURE,NEWHYBRIDS,BAPS and GeneClass) to detect hatchery introgression in wild stocked populations. Simu- lations of hybrid genotypes from real parental data revealed that the number and type of markers used with STRUCTURE, NEWHYBRIDS and BAPS can identify as admixed most first and second generation hybrids as well as first generation backcrosses. In wild populations, introgression rates esti- mated from different markers and methods were correlated. However, slight disagreements were observed at both population and individual levels. Overall, the fully Bayesian (STRUCTURE,NEWHYBRIDS and BAPS) performed better than partially Bayesian (GeneClass) assignment tests. In wild collections, BAPS analyses were limited because of the lack of a native baseline. In all cases, the efficiency of methods was reduced as introgression increased. Keywords Allozymes Assignment methods Brown trout Introgression Microsatellites Introduction Hybridizations resulting from introductions of exotic indi- viduals are eroding genetic integrity and threatening extinction at many levels (species, subspecies and locally adapted populations; Frankham et al. 2002). Some manage- ment programs focus on identifying and protecting pure native gene pools. Others deal with situations where pure exogenous or introgressed fish are present by selective removal of non-native or introgressed individuals or by translocation of pure ones (Allendorf et al. 2004). In all cases, identification of native and hybridized individuals is a primary concern in developing conservation and manage- ment strategies. Thus genetic information becomes essential to identify hybrids and to estimate levels of introgression in a population (Ferguson et al. 1995). Beyond first generation (F1) hybrids, it is difficult to decide when an individual is no longer viewed as a hybrid but rather as a member of one of the two parental populations undergoing introgression (Rhymer and Simberloff 1996). Moreover, the identification of hybrids can be particularly challenging when the hybrid- izing groups are closely related, and divergence between them is based primarily on allele frequency differences rather than on unique (diagnostic) alleles. Advances in molecular genetics in recent years have provided a range of tools to detect hybridization and introgression (Hewitt 2001). In contrast to protein-coding loci, highly polymorphic markers such as microsatellites are capable of more fine-scale discrimination required for distinguishing conspecific cultured and native populations (Aurelle et al. 2002). The capability of these markers for individual genotyping has shifted the focus for monitoring releases on wild populations from populations to assign- ment tests of individuals (Hansen et al. 2001a). Computer simulations suggested that model-based Bayesian statistical N. Sanz (&) R. M. Araguas R. Ferna ´ndez M. Vera J.-L. Garcı ´a-Marı ´n Laboratori d’Ictiologia Gene `tica, Universitat de Girona, Facultat de Cie `ncies, Campus Montilivi s/n, 17071 Girona, Spain e-mail: [email protected] 123 Conserv Genet (2009) 10:225–236 DOI 10.1007/s10592-008-9550-0
-
Upload
quetimporta -
Category
Documents
-
view
0 -
download
0
Transcript of Efficiency of markers and methods for detecting hybrids and introgression in stocked populations
RESEARCH ARTICLE
Efficiency of markers and methods for detecting hybridsand introgression in stocked populations
Nuria Sanz Æ Rosa M. Araguas Æ Raquel Fernandez ÆManuel Vera Æ Jose-Luis Garcıa-Marın
Received: 28 September 2007 / Accepted: 5 March 2008 / Published online: 16 March 2008
� Springer Science+Business Media B.V. 2008
Abstract Detection of hybridization and introgression in
wild populations that have been supplemented by hatchery
fish is necessary during development of conservation and
management strategies. Initially, allozyme data and more
recently highly polymorphic microsatellite markers have
been used to obtain this information. We used both markers
to assess the effectiveness of four assignment methods
(STRUCTURE, NEWHYBRIDS, BAPS and GeneClass) to detect
hatchery introgression in wild stocked populations. Simu-
lations of hybrid genotypes from real parental data revealed
that the number and type of markers used with STRUCTURE,
NEWHYBRIDS and BAPS can identify as admixed most first
and second generation hybrids as well as first generation
backcrosses. In wild populations, introgression rates esti-
mated from different markers and methods were correlated.
However, slight disagreements were observed at both
population and individual levels. Overall, the fully
Bayesian (STRUCTURE, NEWHYBRIDS and BAPS) performed
better than partially Bayesian (GeneClass) assignment
tests. In wild collections, BAPS analyses were limited
because of the lack of a native baseline. In all cases, the
efficiency of methods was reduced as introgression
increased.
Keywords Allozymes � Assignment methods �Brown trout � Introgression � Microsatellites
Introduction
Hybridizations resulting from introductions of exotic indi-
viduals are eroding genetic integrity and threatening
extinction at many levels (species, subspecies and locally
adapted populations; Frankham et al. 2002). Some manage-
ment programs focus on identifying and protecting pure
native gene pools. Others deal with situations where pure
exogenous or introgressed fish are present by selective
removal of non-native or introgressed individuals or by
translocation of pure ones (Allendorf et al. 2004). In all
cases, identification of native and hybridized individuals is a
primary concern in developing conservation and manage-
ment strategies. Thus genetic information becomes essential
to identify hybrids and to estimate levels of introgression in a
population (Ferguson et al. 1995). Beyond first generation
(F1) hybrids, it is difficult to decide when an individual is no
longer viewed as a hybrid but rather as a member of one of
the two parental populations undergoing introgression
(Rhymer and Simberloff 1996). Moreover, the identification
of hybrids can be particularly challenging when the hybrid-
izing groups are closely related, and divergence between
them is based primarily on allele frequency differences rather
than on unique (diagnostic) alleles.
Advances in molecular genetics in recent years have
provided a range of tools to detect hybridization and
introgression (Hewitt 2001). In contrast to protein-coding
loci, highly polymorphic markers such as microsatellites
are capable of more fine-scale discrimination required for
distinguishing conspecific cultured and native populations
(Aurelle et al. 2002). The capability of these markers for
individual genotyping has shifted the focus for monitoring
releases on wild populations from populations to assign-
ment tests of individuals (Hansen et al. 2001a). Computer
simulations suggested that model-based Bayesian statistical
N. Sanz (&) � R. M. Araguas � R. Fernandez � M. Vera �J.-L. Garcıa-Marın
Laboratori d’Ictiologia Genetica, Universitat de Girona,
Facultat de Ciencies, Campus Montilivi s/n, 17071 Girona, Spain
e-mail: [email protected]
123
Conserv Genet (2009) 10:225–236
DOI 10.1007/s10592-008-9550-0
techniques are more effective than most frequent likeli-
hood-based methods when genetic data from wild
populations before hybridization are not available (Vaha
and Primmer 2006). Additionally, some analyses allow the
classification of individuals into distinct hybrid classes
(F1, F2, or backcrosses classes), which is especially
important for accurately documenting introgression
(Anderson and Thompson 2002). Simulated studies sug-
gested that at least 48 loci with an average pairwise
FST = 0.21 between hybridizing populations would be
necessary for reliable F2 and backcrosses as well as F1
identification (Vaha and Primmer 2006). However, these
simulated conditions are sometime unrealistic. Further-
more, such a large number of loci is not always available
where population genetics studies on fish species often
involved 6–10 microsatellite loci (Koskinen et al. 2004).
Even in salmonids, where a large number of microsatellites
have been described (Gharbi et al. 2006), practical limi-
tations have restricted the number of loci used in genetic
analyses (Paterson et al. 2004; Lerceteau-Kohler and
Weiss 2006). Reduced equipment expenses suggest that
allozyme genotyping could be still used to monitor
hatchery releases. Among studies that have evaluated the
efficiency of the different assignment methods on wild
stocked populations (Hansen et al. 2001a, b; Manel et al.
2002), none have compared the efficiency of methods and
markers simultaneously to assess introgression.
In Spain, extensive interbreeding between native Med-
iterranean brown trout (Salmo trutta) and hatchery fish of
North-European origin have created a valuable source
material for evaluating the efficiency of different methods
and markers to assess introgression. We selected six Ibe-
rian brown trout collections having contrasting levels of
hatchery releases to compare the efficiency of the assign-
ment methods provided by STRUCTURE, NEWHYBRIDS, BAPS
and GeneClass in detecting introgression in wild popula-
tions. Based on 19 allozyme and 9 microsatellite loci, we
simulated genotypes from real parental data to assess the
power of methods to detect F1, F2 and first generation
backcrosses with each kind of marker.
Material and methods
Collections and genetic diversity
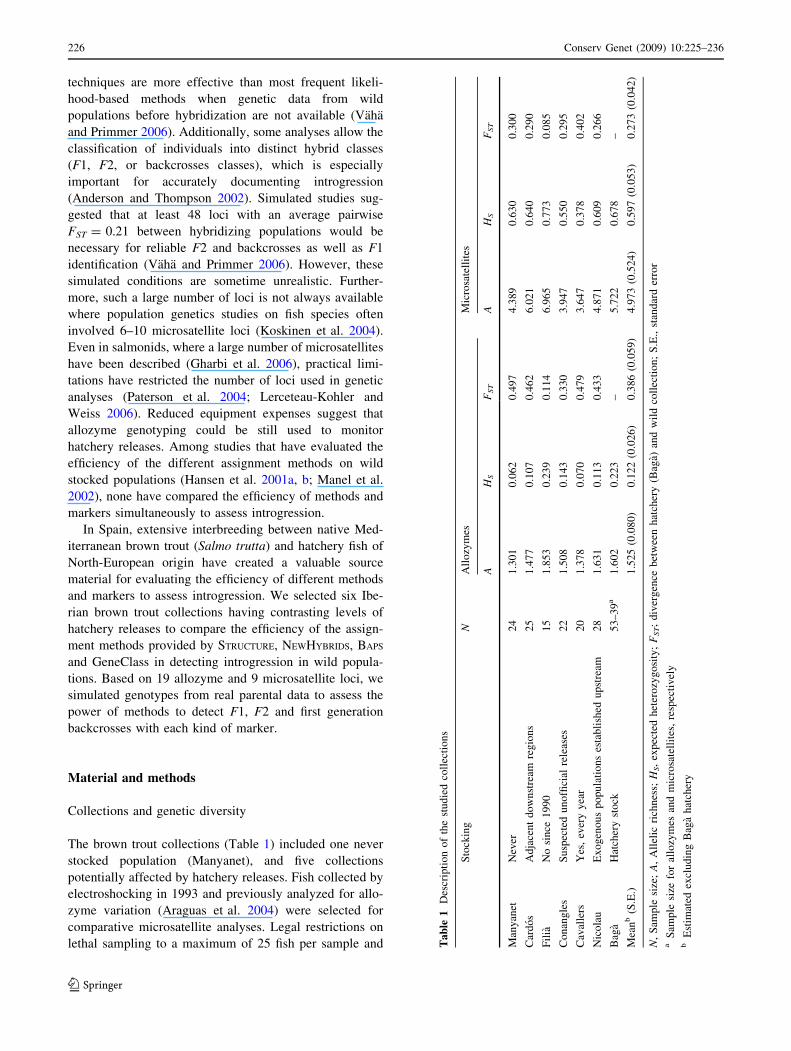
The brown trout collections (Table 1) included one never
stocked population (Manyanet), and five collections
potentially affected by hatchery releases. Fish collected by
electroshocking in 1993 and previously analyzed for allo-
zyme variation (Araguas et al. 2004) were selected for
comparative microsatellite analyses. Legal restrictions on
lethal sampling to a maximum of 25 fish per sample and Ta
ble
1D
escr
ipti
on
of
the
stu
die
dco
llec
tio
ns
Sto
ckin
gN
All
ozy
mes
Mic
rosa
tell
ites
AH
SF
ST
AH
SF
ST
Man
yan
etN
ever
24
1.3
01
0.0
62
0.4
97
4.3
89
0.6
30
0.3
00
Car
do
sA
dja
cen
td
ow
nst
ream
reg
ion
s2
51
.47
70
.10
70
.46
26
.02
10
.64
00
.29
0
Fil
iaN
osi
nce
19
90
15
1.8
53
0.2
39
0.1
14
6.9
65
0.7
73
0.0
85
Co
nan
gle
sS
usp
ecte
du
no
ffici
alre
leas
es2
21
.50
80
.14
30
.33
03
.94
70
.55
00
.29
5
Cav
alle
rsY
es,
ever
yy
ear
20
1.3
78
0.0
70
0.4
79
3.6
47
0.3
78
0.4
02
Nic
ola
uE
xo
gen
ou
sp
op
ula
tio
ns
esta
bli
shed
up
stre
am2
81
.63
10
.11
30
.43
34
.87
10
.60
90
.26
6
Bag
aH
atch
ery
sto
ck5
3–
39
a1
.60
20
.22
3–
5.7
22
0.6
78
–
Mea
nb
(S.E
.)1
.52
5(0
.08
0)
0.1
22
(0.0
26
)0
.38
6(0
.05
9)
4.9
73
(0.5
24
)0
.59
7(0
.05
3)
0.2
73
(0.0
42
)
N,
Sam
ple
size
;A
,A
llel
icri
chn
ess;
HS,
exp
ecte
dh
eter
ozy
go
sity
;F
ST;
div
erg
ence
bet
wee
nh
atch
ery
(Bag
a)an
dw
ild
coll
ecti
on
;S
.E.,
stan
dar
der
ror
aS
amp
lesi
zefo
ral
lozy
mes
and
mic
rosa
tell
ites
,re
spec
tiv
ely
bE
stim
ated
excl
ud
ing
Bag
ah
atch
ery
226 Conserv Genet (2009) 10:225–236
123
the availability of fish limited numbers of some collections,
as typified in many endangered species (Frankham et al.
2002). A restricted sample length within a 15–20 cm range
approximated a common age class of 1–2 years for all fish.
Published allozyme data from the Baga hatchery stock
(Garcıa-Marın et al. 1991; Araguas et al. 2004), were
included in the analyses to represent the pure hatchery
population. These hatchery fish were no longer preserved
and a new collection representing random descendents of
the earlier one (Baga Hatchery personnel, personal com-
munication) was obtained for microsatellite analysis. Exact
probability test on the allele frequencies at the diagnostic
LDH-C* locus showed no significant differences between
these two samples (P = 0.838).
Araguas et al. (2004) included genotypes for the 19
variable loci involving the selected collections. For
microsatellite genotyping, DNA was extracted using the
Chelex-proteinase K procedure (Estoup et al. 1996). Nine
microsatellite loci were amplified: Str15, Str73 (Estoup
et al. 1993), Str591INRA (Presa and Guyomard 1996),
Ssa85 (O’Reilly et al. 1996), Ssa408 (Cairney et al. 2000),
SsHaeIII14.20 (Goodier unpublished, Genbank Accession
no. U10050), SsoSL417 (Slettan et al. 1995), SsoSL438
(Slettan et al. 1996), SSsp2213 (Paterson et al. 2004).
Forward primers were end-labelled with fluorescence dye.
PCR reactions (25 ll) contained 1 ll of DNA extraction,
1.25 units of Amplitaq Gold� DNA polymerase (Applied
Biosystems), 2.5 ll BufferGold, 2 ll dNTP MIX 10 mM,
3 ll-2.5 ll MgCl2 25 mM and were performed on a
GENEAMP�PCR SYSTEM 9700 (Applied Biosystems).
The heating cycle parameters used for a multiplex
involving the Str73, Ssa85, SsoSL438, Str591INRA and
SsHaeIII14.20 loci were initial denaturation at 95�C for
10 min; following by 35 PCR cycles (denaturation at 95�C
for 1 min, annealing at 54�C for 1 min, and extension at
72�C, for 2 min). For a second multiplex reaction,
including Str15, SsoSL417, Ssa408 and SSsp2213 loci,
temperature cycling conditions were initial denaturation
step at 95�C for 10 min, nine touchdown cycles (denatur-
ation at 95�C for 30 s, annealing at 65–57�C for 45 s,
extension at 72�C for 45 s) and 25 PCR cycles (denatur-
ation at 95�C for 1 min, annealing at 58�C for 1 min and
extension at 72�C for 2 min). In all cases, final extension
was at 72�C for 30 min. Genotypes were visualized using
an Applied Biosystem 3130 Genetic Analyzer.
Genetic variability within samples was estimated by the
mean unbiased expected heterozygosity (HS) and the allelic
richness (A) using Pop100gene (http://www.montpellier.
inra.fr/URLB/pop100gene/pop100gene.html) and FSTAT
(Goudet 1995) programs. Genotypic distributions were tes-
ted for conformance to Hardy-Weinberg expectations by
the exact probability test implemented in GENEPOP (Raymond
and Rousset 1995). Nei’s estimators of gene diversity and
differentiation assessed genetic differentiation among sam-
ples. In addition, Weir and Cockerham estimators with 1,000
permutations evaluated FST values and their significance for
all population pairs. All these estimates were computed using
FSTAT.
Assessing the power of markers and methods to detect
hybrids by simulated genotypes
Simulations based on observed parental data tested the
power of assignment methods to detect first (F1) and sec-
ond (F2) generation hybrids, and backcrosses between F1
and parental native (Bnat). Backcrosses of F1 with parental
hatchery (Bhat) were excluded because of minimal survival
in the wild of released hatchery fish (Arias et al. 1995;
Poteaux et al. 2001; Araguas et al. 2004). Based on the
official stocking records, the collection from Manyanet was
used as a pure native source to simulate 250 parental native
individuals. We also generated 250 individuals from the
Baga collection to be used as a parental hatchery. All real
individuals used to simulate both parental source popula-
tions to the pure native or pure hatchery were confirmed by
admixture analysis with STRUCTURE. We generated 50 of
each F1, F2 and backcrosses of F1 with parental native
classes from 50 parental native (Manyanet) and 50 parental
hatchery (Baga) individuals randomly selected from the
above simulated genotypes. All simulations were done with
HYBRIDLAB (Nielsen et al. 2006) software. These simulated
data were used to carry out admixture analysis using
STRUCTURE (Pritchard et al. 2000), NEWHYBRIDS (Anderson
and Thompson 2002), BAPS (Corander and Marttinen 2006)
and GeneClass (Piry et al. 2004). Running conditions for
these programs were as used with wild samples (see
below). The proportion of hybrid individuals (F1, F2,
Bnat) in the simulated data set that were correctly identi-
fied as hybrids (Vaha and Primer 2006) evaluated the
efficiency of all methods. Following Barilani et al. (2005;
2007), we used initial threshold q-values of 0.10 (STRUC-
TURE) and posterior probability of 0.9 (NEWHYBRIDS) to
assign individuals to parental or admixed classes. In BAPS
we initially used 20 runs of a trained clustering to group all
simulated individuals into two partitions (K = 2) using the
hatchery Baga collection as reference individuals. Then,
the resulting clusters were used as a basis for running an
admixture analysis to identify hybrid genotypes (F1, F2
and Bnat) as admixed. This approach was similar to the one
performed with STRUCTURE. An alternative analysis with
BAPS used 20 runs of a trained clustering of all simulated
individuals using the original Baga collection as reference
and five as a maximum number of clusters. In the optimal
partition, clusters were assigned to native or hybrid classes
based on their Kullback-Leibler divergence from the Baga
fish. The most divergent cluster and Baga fish were then
Conserv Genet (2009) 10:225–236 227
123
used as pre-defined native and hatchery baselines for
admixture analysis of all simulated individuals.
Identifying genetic admixture and evaluating
introgression in wild populations
In addition to Hardy–Weinberg deviations, the presence of
several genetically homogeneous groups (K) in each wild
collection was checked by the Bayesian Markov Chain
Monte Carlo (MCMC) approach method of STRUCTURE. For
each sample, we selected the optimal K values according to
Garnier et al. (2004). A burn-in period of 10,000 steps
followed by 10,000 Monte Carlo replicates was simulated
with K = 1, 2, 3, 4. Each simulation was further replicated
20 times to verify the consistence of the estimated K.
The presence of the LDH-C*90 allele frequency, fixed in
hatchery stocks and absent in native populations of the
Mediterranean rivers (Garcıa-Marın et al. 1991; Poteaux
et al. 2001) was the primary evidence of genetic intro-
gression in the studied populations. The MCMC method of
STRUCTURE was also used to estimate individual admixture
coefficients (the proportion of the genome of individual
fish derived from native and hatchery trout, respectively)
by allozymes and microsatellites. The average proportion
of hatchery ancestry (q) was calculated for each sample
incorporating data from Baga sample as hatchery baseline
and assuming an admixture model with two populations
(hatchery and native) where hatchery individuals were
forced to be non-admixed. Because of the high differenti-
ation reported between Iberian native populations and
hatchery stock (Table 1), we used a model of independent
allele frequencies. STRUCTURE was run with a burn-in period
of 50,000 steps followed by 200,000 Monte Carlo repli-
cates. For each sample, the 95% confidence intervals of
each estimated q value were calculated according to
Hansen et al. (2001b).
In addition, hybridization between native and hatchery
fish was examined by the Bayesian statistical method
implemented in the NEWHYBRIDS. This method estimates
the posterior probability (P) that each individual in a wild
sample falls into different parental (native (Pnat) or
hatchery (Phat)) or hybrid classes (F1, F2, Bnat). Fol-
lowing results from simulated data, individuals were
assigned to one of the five genotypic classes if P C 0.5. For
each data set, which included the wild population and the
Baga hatchery genotypes, posterior probabilities were
evaluated after 100,000 iterations of the Monte Carlo
Markov Chains. The program ran without any prior infor-
mation about the hybrid status of collected individuals and
populations, and with the ‘Uniform’ prior option for both
mixing proportions and allele frequencies.
As suggested by BAPS results on simulated data, we used
BAPS to identify a native cluster based on the largest
Kullback-Leibler divergence from the Baga reference
collection in the optimal partition after 20 runs of the
individual trained clustering of all wild fish. In this case,
runs were set to a maximum of seven partitions (the six
wild collections plus Baga stock). The putative native
cluster and the Baga fish were then used as pre-defined
baselines for the admixture analysis of all wild fish.
Finally, individuals were classified into groups of wild
or hatchery trout using the assignment test provided by
GeneClass 2 with the six wild and the hatchery populations
as reference samples. We used a modified version of the
assignment test where population allele frequencies were
estimated using a Bayesian approaches (Rannala and
Mountain 1997). We also used the ‘simulation option’ of
Paetkau et al. (2004) for assessing the probability of each
individual being rejected from the reference populations.
Results
Genetic diversity within and among samples
On average, population diversity was higher for microsat-
ellite (A = 4.973, range 3.647–6.965; HS = 0.597, range
0.378–0.773) than for allozyme loci (A = 1.525, range
1.301–1.853; HS = 0.122, range 0.062–0.239). Both kinds
of markers indicated the highest level of genetic variability
in Filia. However, the lowest value of variability was
observed in Cavallers by microsatellites but in Manyanet
by allozymes (Table 1). Significant and large genetic dif-
ferentiation was detected among wild populations and
between pooled wild populations and hatchery stocks using
either allozyme or microsatellite loci. In the allozyme
analyses, those differences remained large when the diag-
nostic LDH-C locus was removed from the analyses
(Table 2). None of the nine microsatellite loci showed
fixed alleles to distinguish hatchery from native fish.
However, some of the alleles detected in a high frequency
in Baga hatchery stock (Str-73*144, *146, Str-
591INRA*148, SsHaeIII-14.20*312, *322, *324, SsoSL-
417*177, *183, SsoSL-438*105) were observed only in
wild samples in concurrence with specific hatchery alleles
for allozyme loci (G3PDH-2*50; LDH-C*90, sMDH-
A2*120, sMDH-B1, 2*80).
Performance of markers and methods by simulated
hybrid populations
At an initial threshold q-value of 0.10 (0.10 B q B 0.9
admixed) STRUCTURE correctly identified as admixed most
of the simulated hybrid individuals by both allozymes and
microsatellites genotypes: 100% of F1, 98% of F2, and
96% of Bnat (Fig. 1). However, a proportion of 12–4%
228 Conserv Genet (2009) 10:225–236
123
(allozymes–microsatellites) of parental hatchery individu-
als showed q \ 0.9 and could not be distinguished from
hybrid genotypes. The use of a threshold q-value of 0.2
increased the efficiency of detecting hatchery fish up to 98–
100% (allozymes–microsatellites), but then decreased the
efficiency for hybrids since some F2 and Bnat individuals
were misclassified as parental hatchery and parental native
respectively (Fig. 1). Therefore we selected the threshold
of 0.1 to be used in the analyses of wild collections.
Analysis with NEWHYBRIDS, using the posterior probability
value of 90% as a threshold for assigning individuals and
regardless of specific hybrid class, correctly identified as
hybrid 100% of simulated genotypes from F1 but failed on
identify a proportion of hybrid individuals from F2
(14–8%, allozymes–microsatellites) and Bnat (30–34%,
allozymes–microsatellites). The efficiency of this method
increased with a posterior probability of 50%, though still
a proportion of 8–4% (allozymes–microsatellites) of F2
genotypes were misclassified as parental hatchery fish and
6–10% (allozymes–microsatellites) of Bnat as parental
native specimens (Fig. 1).
Analyses with BAPS using the trained clustering with a
maximum of two partitions largely failed on the identifi-
cation of the simulated hybrid genotypes, which were
mostly considered native (98–98% of F1, 80–84% of F2,
100–100% of Bnat, allozymes–microsatellites). The
alternative BAPS analysis using a maximum of five parti-
tions to detect a native source for admixture analysis
identified five clusters in the optimal trained analysis on
simulated allozyme genotypes. The first one grouped all
simulated hatchery specimens and four F2 genotypes to the
reference fish from Baga. The most divergent cluster from
the Baga fish incorporated 38 simulated native fish and one
Bnat fish. A third cluster included the rest of native indi-
viduals and 28 hybrid individuals. The other two clusters
grouped individuals despite of their specific hybrid class.
Three clusters were identified in simulated microsatellite
genotypes. One of them joined all the simulated hatchery
parental fish and one F2 genotype to the reference fish from
Baga. A second cluster grouped all the simulated native
fish with one F1 and 13 Bnat, while the third one clustered
the remained hybrid fish. Using Baga fish and the most
divergent cluster as reference hatchery and native baselines
for admixture analysis of all simulated individuals, most of
the F1, F2 and Bnat fish were identified as admixed.
However, still the 12–4% (allozymes–microsatellites) of
F2 genotypes were misclassified as parental hatchery fish
and 14–30% (allozymes–microsatellites) of Bnat as
parental native specimens (Fig. 1).
Analysis of simulated hybrid genotypes carried out by
GeneClass assigned most of simulated hybrids to a hybrid
class (F1, F2 or Bnat). The simulation option of GeneClass
rejected all simulated parentals from the other parental
class. GeneClass rejected almost all simulated hybrids
from both hatchery and native parental classes, except for a
proportion of 16% of F2 genotypes that were not rejected
from parental hatchery and a proportion of 6% of Bnat that
were not rejected from parental native, using allozymes.
Genetic admixture and evaluation of introgression in
wild populations
Hardy–Weinberg test of allozyme loci revealed significant
deviation in two of the 46 tests, at the 5% significance level
and after Bonferroni sequential adjustment (locus MEP-1
in Manyanet and locus ME in Conangles). Only one out of
Table 2 Genetic differences among collections
Locus FST among
wild samples
FST between pooled
wild samples and
hatchery stock
Allozymes
sAAT-4 0.017 0.127
CK-A1 0.115 0.167
bGALA-2 0.214 0.339
GAPDH-2 0.011 0.000
bGLUA 0.083 0.405
G3PDH-2 0.000 0.222
GPI-A 0.005 0.000
IDHP-2 0.160 0.048
IDHP-3 0.109 0.069
LDH-A2 0.351 0.770
LDH-C 0.230 0.871
sMDH-A2 0.065 0.123
sMDH-B1 0.127 0.307
ME 0.276 0.307
MEP-1 0.132 0.019
MEP-3 0.079 0.052
MPI-2 0.092 0.218
PEPLT 0.016 0.000
SOD-1 0.018 0.001
Average 0.189 0.411
Average without LDH-C 0.185 0.327
Microsatellites
Ssa85 0.262 0.082
Ssa408 0.240 0.052
SsHaeIII14.20 0.234 0.206
SsoSL417 0.259 0.101
SsoSL438 0.310 0.223
SSsp2213 0.221 0.082
Str15 0.290 0.282
Str73 0.109 0.382
Str591INRA 0.393 0.343
Average 0.261 0.192
Conserv Genet (2009) 10:225–236 229
123

the 54 tests was significant for microsatellite loci (locus
Str591INRA in Cardos). Thus, apparently all collections
were consistent with a single random mating unit. How-
ever, following Garnier et al. (2004), STRUCTURE suggested
two genetically homogeneous groups (K = 2) in Conan-
gles, Cavallers and Nicolau from both allozymes and
microsatellites. In all three populations, the occurrence of
two units persisted when individuals from Baga hatchery
were included in the analysis.
The LDH-C*90 allele provided evidence of hatchery
genes in all stocked populations other than Cavallers.
However, the proportion of hatchery genes estimated by
the fully Bayesian methods confirmed the hatchery releases
made in Cavallers as well as in all other stocked locations,
and indentified Manyanet as a pure native population at
that time (Fig. 2, Table 3). STRUCTURE suggested a large
proportion of native genes remaining in all collections
except Filia and similar results were detected by
NEWHYBRIDS and BAPS. All individual fish that were more
likely to be of hybrid or hatchery origin according to
NEWHYBRIDS had moderate or high hatchery ancestry esti-
mations in STRUCTURE and BAPS analyses. Agreement
(a)
(a)
(a)
(b)
(b)
(b)
Fig. 1 Admixture analyses of
simulated genotypes (phat,parental hatchery; Pnat,parental native; F1, first
generation hybrid; F2, second
generation hybrid; Bnat,backcrosses of F1 with parental
native). For STRUCTURE and BAPS
each individual is represented as
a vertical bar partitioned into
two segments according to the
proportion of hatchery (black)
and native (white) genome. For
NEWHYBRIDS each individual is
represented as a vertical bar
partitioned into segments whose
length is proportional to the
likelihood of belonging to a
parental hatchery (black),
parental native (white) or hybrid
(grey) class. (a) Allozymes and
(b) microsatellites
230 Conserv Genet (2009) 10:225–236
123
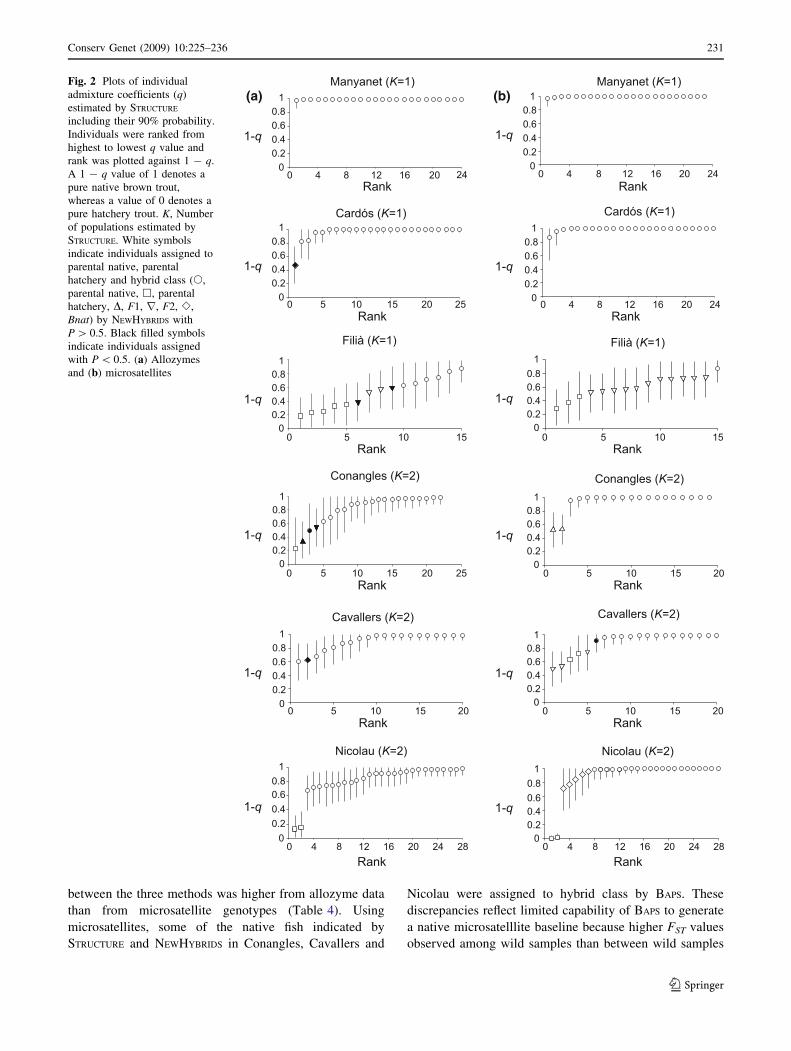
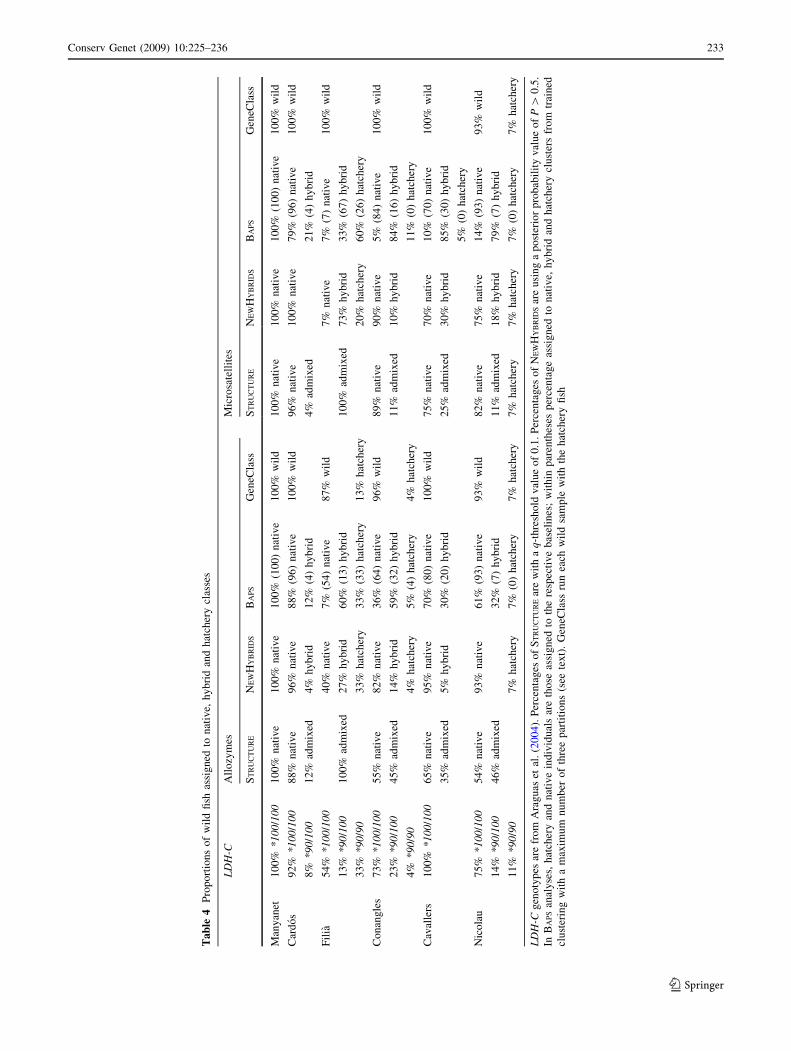
between the three methods was higher from allozyme data
than from microsatellite genotypes (Table 4). Using
microsatellites, some of the native fish indicated by
STRUCTURE and NEWHYBRIDS in Conangles, Cavallers and
Nicolau were assigned to hybrid class by BAPS. These
discrepancies reflect limited capability of BAPS to generate
a native microsatelllite baseline because higher FST values
observed among wild samples than between wild samples
(a) (b)Fig. 2 Plots of individual
admixture coefficients (q)
estimated by STRUCTURE
including their 90% probability.
Individuals were ranked from
highest to lowest q value and
rank was plotted against 1 - q.
A 1 - q value of 1 denotes a
pure native brown trout,
whereas a value of 0 denotes a
pure hatchery trout. K, Number
of populations estimated by
STRUCTURE. White symbols
indicate individuals assigned to
parental native, parental
hatchery and hybrid class (s,
parental native, h, parental
hatchery, D, F1, r, F2, e,
Bnat) by NEWHYBRIDS with
P [ 0.5. Black filled symbols
indicate individuals assigned
with P \ 0.5. (a) Allozymes
and (b) microsatellites
Conserv Genet (2009) 10:225–236 231
123

and hatchery fish (Table 2). Agreement between STRUCTURE
and NEWHYBRIDS was better using microsatellite than
allozymes. Some of the admixed fish indicated by STRUC-
TURE in Filia, Conangles, Cavallers and Nicolau were
assigned to native class by NEWHYBRIDS with allozyme
data. As suggested for the simulation results, these dis-
crepancies could reflect some Bnat fish originating in these
locations. Additionally, it is also possible that NEWHYBRIDS
identified as parental native some wild admixed fish
beyond second generation hybrid in these moderately int-
rogressed populations. Multilocus based methods failed to
identify the hybrid origin of some individuals genotyped as
LDH-C*90/*90 or *90/*100.
The partially Bayesian method of GeneClass assigned
most individuals to their original sample. Using allozymes,
some fish from stocked populations were misassigned, but
only a few specimens from Filia, Conangles and Nicolau
were considered of hatchery origin and assigned to the
Baga stock (Table 4). In fact, the simulation option rejec-
ted a large proportion of wild trout of the hatchery stock in
all samples but Filia.
Discussion
A common management strategy to maintain or improve
freshwater fisheries is the extensive release of cultured fish
(Brown and Day 2002). However, these activities mandate
development of conservation and management strategies to
identify remaining pure native and hybridized populations
(Ferguson et al. 1995). Comparisons between microsatel-
lites and allozymes in hybrid identification have indicated a
higher efficiency of microsatelllites when hatchery strains
and wild fish are weakly differentiated (Aurelle et al. 2002;
Corujo et al. 2004), but microsatellites appear to be less
effective when differentiation is large (Poteaux et al.
2001). In addition, simulations have reported comparable
efficiencies of STRUCTURE and NEWHYBRIDS (Vaha and
Primmer 2006) and STRUCTURE and BAPS (Latch et al.
2006).
The present study analyzed the efficiency of classifica-
tion methods and different allelic markers in the context of
the introduction of evolutionary divergent non-native
stocks. This practice is wide-spread where native cultured
stocks have not been developed (Cowx 1999; Brown and
Day 2002). Our simulated data showed that any combina-
tion of markers and methods were equally useful in
detecting hatchery releases (Fig. 1) and estimates of
introgression in wild collections were highly correlated
(r [ 0.9, P \ 0.01, Tables 3, 4). However, at the individ-
ual level, the simulated genotypes indicated that
STRUCTURE, NEWHYBRIDS and BAPS erroneously classified
some F2 and Bnat specimens respectively into hatchery or
native genotypic class. The empirical data indicated those
errors accumulated in the most introgressed populations,
where some hatchery fish could be considered admixed fish
originated in the wild by STRUCTURE and some Bnat wild
fish as native by NEWHYBRIDS. The combinations allo-
zymes-NEWHYBRIDS and microsatellites-BAPS resulted in
questionable results in some introgressed populations
(Table 4). With regard to discrepancies being larger in the
Filia collection, where Hardy–Weinberg test and STRUC-
TURE suggested a single panmictic unit, NEWHYBRIDS may
lead to erroneous conclusions in those populations where
Table 3 Proportion of relative ancestries in wild collections
Allozymes Microsatellites
LDH-C STRUCTURE (C.I.) NEWHYBRIDS (S.E.) BAPS (S.E.) STRUCTURE (C.I.) NEWHYBRIDS (S.E.) BAPS (S.E.)
Manyanet 1.000 0.995 (0.975–1.000) Pnat: 0.999 (0.000) 1.000 (0.000) 0.995 (0.984–1.000) Pnat: 0.999 (0.000) 1.000 (0.000)
Cardos 0.960 0.955 (0.897–0.995) Pnat: 0.923 (0.009) 0.965 (0.022) 0.989 (0.956–1.000) Pnat: 0.983 (0.001) 0.940 (0.027)
Filia 0.571 0.518 (0.379–0.649) Pnat: 0.323 (0.029) 0.368 (0.080) 0.595 (0.470–0.701) 0.188 (0.074)
F2: 0.233 (0.012) F2: 0.664 (0.038)
Phat: 0.339 (0.044) Phat: 0.195 (0.034)
Conangles 0.941 0.803 (0.683–0.901) Pnat: 0.797 (0.021) 0.744 (0.058) 0.941 (0.864–0.995) Pnat: 0.891 (0.021) 0.551 (0.062)
Cavallers 1.000 0.895 (0.958–0.815) Pnat: 0.892 (0.008) 0.914 (0.032) 0.889 (0.806–0.964) Pnat: 0.716 (0.040) 0.627 (0.052)
Bnat: 0.100 (0.006) F2: 0.175 (0.022)
Bnat: 0.105 (0.007)
Nicolau 0.821 0.820 (0.731–0.901) Pnat: 0.851 (0.013) 0.849 (0.050) 0.891 (0.781–0.974) Pnat: 0.727 (0.028) 0.576 (0.049)
Bnat: 0.190 (0.018)
The LDH-C*100 native allele frequencies are from Araguas et al. (2004). Using STRUCTURE, native ancestry (1 – q) is indicated. C.I., 95%
confidence interval. Using NEWHYBRIDS, the samples were assigned to one (with P [ 0.9) or more than one (with P [ 0.1) of the following
genotypic classes (Pnat, parental native; Phat, parental hatchery; F1, first generation hybrid; F2, second generation hybrid; Bnat, backcrosses of
F1 with Pnat. In BAPS, the average admixture coefficient with respect to the native baseline is indicated. S.E., standard error
232 Conserv Genet (2009) 10:225–236
123
Ta
ble
4P
rop
ort
ion
so
fw
ild
fish
assi
gn
edto
nat
ive,
hy
bri
dan
dh
atch
ery
clas
ses
LD
H-C
All
ozy
mes
Mic
rosa
tell
ites
ST
RU
CT
UR
EN
EW
HY
BR
IDS
BA
PS
Gen
eCla
ssS
TR
UC
TU
RE
NE
WH
YB
RID
SB
AP
SG
eneC
lass
Man
yan
et1
00
%*
10
0/1
00
10
0%
nat
ive
10
0%
nat
ive
10
0%
(10
0)
nat
ive
10
0%
wil
d1
00
%n
ativ
e1
00
%n
ativ
e1
00
%(1
00
)n
ativ
e1
00
%w
ild
Car
do
s9
2%
*1
00
/10
08
8%
nat
ive
96
%n
ativ
e8
8%
(96
)n
ativ
e1
00
%w
ild
96
%n
ativ
e1
00
%n
ativ
e7
9%
(96
)n
ativ
e1
00
%w
ild
8%
*9
0/1
00
12
%ad
mix
ed4
%h
yb
rid
12
%(4
)h
yb
rid
4%
adm
ixed
21
%(4
)h
yb
rid
Fil
ia5
4%
*1
00
/10
04
0%
nat
ive
7%
(54
)n
ativ
e8
7%
wil
d7
%n
ativ
e7
%(7
)n
ativ
e1
00
%w
ild
13
%*
90/1
00
10
0%
adm
ixed
27
%h
yb
rid
60
%(1
3)
hy
bri
d1
00
%ad
mix
ed7
3%
hy
bri
d3
3%
(67
)h
yb
rid
33
%*
90/9
03
3%
hat
cher
y3
3%
(33
)h
atch
ery
13
%h
atch
ery
20
%h
atch
ery
60
%(2
6)
hat
cher
y
Co
nan
gle
s7
3%
*1
00
/10
05
5%
nat
ive
82
%n
ativ
e3
6%
(64
)n
ativ
e9
6%
wil
d8
9%
nat
ive
90
%n
ativ
e5
%(8
4)
nat
ive
10
0%
wil
d
23
%*
90/1
00
45
%ad
mix
ed1
4%
hy
bri
d5
9%
(32
)h
yb
rid
11
%ad
mix
ed1
0%
hy
bri
d8
4%
(16
)h
yb
rid
4%
*9
0/9
04
%h
atch
ery
5%
(4)
hat
cher
y4
%h
atch
ery
11
%(0
)h
atch
ery
Cav
alle
rs1
00
%*
10
0/1
00
65
%n
ativ
e9
5%
nat
ive
70
%(8
0)
nat
ive
10
0%
wil
d7
5%
nat
ive
70
%n
ativ
e1
0%
(70
)n
ativ
e1
00
%w
ild
35
%ad
mix
ed5
%h
yb
rid
30
%(2
0)
hy
bri
d2
5%
adm
ixed
30
%h
yb
rid
85
%(3
0)
hy
bri
d
5%
(0)
hat
cher
y
Nic
ola
u7
5%
*1
00
/10
05
4%
nat
ive
93
%n
ativ
e6
1%
(93
)n
ativ
e9
3%
wil
d8
2%
nat
ive
75
%n
ativ
e1
4%
(93
)n
ativ
e9
3%
wil
d
14
%*
90/1
00
46
%ad
mix
ed3
2%
(7)
hy
bri
d1
1%
adm
ixed
18
%h
yb
rid
79
%(7
)h
yb
rid
11
%*
90/9
07
%h
atch
ery
7%
(0)
hat
cher
y7
%h
atch
ery
7%
hat
cher
y7
%h
atch
ery
7%
(0)
hat
cher
y7
%h
atch
ery
LD
H-C
gen
oty
pes
are
fro
mA
rag
uas
etal
.(2
00
4).
Per
cen
tag
eso
fS
TR
UC
TU
RE
are
wit
ha
q-t
hre
sho
ldv
alu
eo
f0
.1.
Per
cen
tag
eso
fN
EW
HY
BR
IDS
are
usi
ng
ap
ost
erio
rp
rob
abil
ity
val
ue
of
P[
0.5
.
InB
AP
San
aly
ses,
hat
cher
yan
dn
ativ
ein
div
idu
als
are
tho
seas
sig
ned
toth
ere
spec
tiv
eb
asel
ines
;w
ith
inp
aren
thes
esp
erce
nta
ge
assi
gn
edto
nat
ive,
hy
bri
dan
dh
atch
ery
clu
ster
sfr
om
trai
ned
clu
ster
ing
wit
ha
max
imu
mn
um
ber
of
thre
ep
arti
tio
ns
(see
tex
t).
Gen
eCla
ssru
nea
chw
ild
sam
ple
wit
hth
eh
atch
ery
fish
Conserv Genet (2009) 10:225–236 233
123
extensive hybridization is beyond second generation as
with assignment of Filia fish only to purebreds and F2
classes (Fig. 2). STRUCTURE analyses on wild populations
resulted in more robust results using either allozymes or
microsatellites. Admixture analyses using BAPS require the
identification of all source populations (Corander and
Marttinen 2006) but in stocking activities the ancestral
composition of the recipient wild population is usually
unknown. Our approach generating a native baseline from
an initial trained clustering of all wild fish worked well
with allozyme data, but overestimated hatchery ancestry in
some samples (Conangles, Cavallers and Nicolau) with
microsatellites. The distinct pattern of FST values between
wild samples and hatchery fish observed using allozymes
or microsatellites (Table 2), generated a good native
baseline for allozymes because of the larger divergence
between wild collections and Baga fish. Better agreement
between BAPS results and those obtained in STRUCTURE and
NEWHYBRIDS were observed from individual trained clus-
tering of each wild collection using a maximum of three
partitions (hatchery, hybrid and native). In these BAPS
analyses, the hybrid and native clusters were identified
according with intermediate (hybrid) and large (native)
Kullback-Leibler divergence from Baga collection
(Table 4).
In simulated analyses, GeneClass distinguished among
fish from distinct random mating units. However, because
native and hybrid fish (F1, F2 and Bnat) were both rejected
from the hatchery baseline, it may be impossible to suspect
hatchery releases in stocked populations once Hardy–
Weinberg equilibrium is attained (Table 4). Therefore, it is
not surprising that GeneClass considered as native most of
the fish from the wild stocked collections, and only fish
from the hatchery or having strong hatchery ancestry were
separated from the rest. Even including the hatchery
baseline, GeneClass approaches have not detected admixed
fish in random mating populations (Hansen et al. 2001a, b;
Manel et al. 2002).
The detection by STRUCTURE of two distinct units in
Conangles and Cavallers concurs with the stocking records
at these localities (Table 1), and in Nicolau, confirmed the
downstream migration of fish from an exogenous hatchery-
like population established upstream (Garcıa-Marın et al.
1998). STRUCTURE represents then, a complement to clas-
sical Hardy–Weinberg tests when historical records of the
populations do not fully agree with adjusted Hardy–
Weinberg proportions. We checked the efficiency of
Hardy–Weinberg test and STRUCTURE to detect departures
from panmixia by generating 25 random introductions of
one hatchery fish from the Baga stock into pure (e.g. Ma-
nyanet), moderately admixed (10% hatchery genes) and
more introgressed (25% hatchery genes) populations. The
two admixed populations were generated using HYBRIDLAB
(Nielsen et al. 2006) and the Manyanet and Baga samples
as parental populations. From simulated F3 individuals, a
sample of 24 fish was randomly collected to add a hatchery
specimen. This rate of hatchery introduction by a single
release (4%) agrees with estimates observed among Med-
iterranean brown trout populations (Araguas et al. 2004).
In the native population, the presence of the hatchery
specimen was detected in all replicates either using allo-
zymes or microsatellites and exact probabilities Hardy–
Weinberg test or STRUCTURE. The hatchery specimen
introduced in the moderately introgressed population was
never noticed by Hardy–Weinberg deviations, and only
STRUCTURE detected introduction in 13–10 (allozymes–
microsatellites) out of 25 replicates. In the most intro-
gressed population, introductions were unnoticed by any
marker or method combination. Vaha and Primmer (2006)
showed that the efficiency to detect purebreds remained at
the same level in the simulation of a low (1%) and higher
(10%) hybridization scenario. Our results demonstrate that
the increase of the level of hybridization decreases the
efficiency to detect purebred hatchery fish, even in a situ-
ation of 10% of hatchery genes. With regard to ongoing
introductions reducing divergence between wild popula-
tions and hatchery stocks, the ability to identify hybrid fish
generated by future releases is compromised (Berry et al.
2004).
Diagnostic markers
Diagnostic genetic tags between stocks can be of major
importance for the rehabilitation of natural populations
(Ferguson et al. 1995). The fixed allele differences at the
LDH-C locus between wild Spanish populations and
exogenous hatchery stocks have been used definitively to
assess the survival and reproductive success of released
hatchery fish (Arias et al. 1995; Araguas et al. 2004).
However, this diagnostic locus suggested a native gene
pool in the yearly stocked population in Cavallers, where
all multilocus analyses reflected the genetic impact of those
hatchery releases. This observation in Cavallers suggests
caution in using a single diagnostic locus to exclude
introgression in native populations despite a significant
correlation between the LDH-C*90 allele frequency and
the admixture level estimated by STRUCTURE or BAPS from
both allozymes and microsatellites. Actually, a non-
destructive DNA based RFLP technique identifies quickly
and cheaply the LDH-C locus genotypes (McMeel et al.
2001). Because results obtained from such DNA analyses
agree with historical records on hatchery releases, the
LDH-C*90 allele frequency will persists as a primary
estimator of hatchery effects on Mediterranean brown trout
populations. When results do not match stocking records or
when such official records are doubtful, microsatellite
234 Conserv Genet (2009) 10:225–236
123
based analyses from the same DNA extractions are
warranted.
Conclusions
Simulated data indicated that allozymes and microsatellite
genotyping could identify hybrids and introgression at
similar efficiencies with all statistical methods assessed.
However, analyses on stocked wild populations indicated a
limited capability of GeneClass to detect admixtures and a
lower discriminatory capability of allozymes compared to
NEWHYBRIDS. In wild collections, BAPS analyses were lim-
ited because of the lack of a native baseline. STRUCTURE
using microsatellite data appears to be the best combination
for wild studies. Our number of microsatellite loci and
level of population divergence between wild populations
and hatchery stocks approached acceptable conditions (12
loci when FST is around 0.21, Vaha and Primmer 2006). In
fact, 6–10 microsatellite loci usually are involved in fish
population genetics (Koskinen et al. 2004), but this number
of loci could be enough even when population divergences
are reduced (Hauser et al. 2006). In the particular case of
Mediterranean brown trout, the pattern of population
divergences among wild collections (FST = 0.261,
Table 2) suggests that the nine microsatellite loci used also
would be suitable to detect introgression of hatchery stocks
originated from native Mediterranean populations.
The strong allozymic genetic divergence between native
Mediterranean brown trout populations and the hatchery
stocks originated from Atlantic populations (FST = 0.411,
Table 2) limited the extension of our conclusions on this
kind of marker to other fish species. Mediterranean and
Atlantic populations represent evolutionary divergence of
lineages (Cortey et al. 2004), and FST value of 0.411, or
0.327 excluding LDH-C (Table 2), are unusual among co
specific freshwater fish populations (Ward et al. 1994). As
indicated, this large FST value at allozyme loci improved
identification of a native baseline in BAPS analyses.
Finally, our results indicate that introgression by ongo-
ing stocking practices reduces efficiency for detecting
future stocking activities. This discriminatory loss is
especially dangerous for fisheries without historical records
on stocking practices because admixed populations may be
used as sources for the development of native hatchery
strains. Moreover, this insensitivity also excludes man-
agement options intended to eliminate hybridized
populations (Allendorf et al. 2004), because practically all
wild specimens can be potentially admixed in some degree.
Acknowledgements This research meets the objectives of the REN-
2003–05931/GLO project of the Spanish MCYT. R. Fernandez and M.
Vera were fellows of the Spanish MCYT. We thank FM Utter for English
revision and for valuable suggestions to improve this manuscript.
References
Allendorf FW, Leary RF, Hitt NP, Knudsen KL, Lundguist LL,
Spruell P (2004) Intercrosses and the U.S. endangered species
act: should hybridrised populations be included as westslope
cutthroat trout? Conserv Biol 18:1203–1213
Anderson EC, Thompson EA (2002) A model-based method for
identifying species hybrids using multilocus genetic data.
Genetics 160:1217–1229
Araguas RM, Sanz N, Pla C, Garcıa-Marın JL (2004) Breakdown of
the brown trout evolutionary history due to hybridization
between native and cultivated fish. J Fish Biol 65:28–37
Arias J, Sanchez L, Martınez P (1995) Low stocking incidence in
brown trout populations from north-western Spain monitored by
LDH-5* diagnostic marker. J Fish Biol 47:170–176
Aurelle D, Cattaneo-Berrebi G, Berrebi PL (2002) Natural and
artificial secondary contact in brown trout (Salmo trutta L.) in
the French western Pyrenees assessed by allozymes and
microsatellites. Heredity 89:171–183
Barilani M, Deregnaucourt S, Gallego S, Galli L, Mucci N, Piombo
R, Puigcerver M, Rimondi S, Rodrıguez-Teijeiro JD, Spano S,
Randi E (2005) Detecting hibridization in wild (Coturnix c.coturnix) and domesticated (Coturnix c. japonica) quail popu-
lations. Biol Conserv 126:445–455
Barilani M, Sfougaris A, Giannakopoulos A, Mucci N, Tabarroni C,
Randi E (2007) Detecting introgressive hybridization in rock
partridge populations (Alectoris graeca) in Greece through
Bayesian admixture analyses of multilocus genotypes. Conserv
Genet 8:343–354
Berry O, Tocher MD, Sarre SD (2004) Can assignment tests measure
dispersal? Mol Ecol 13:551–561
Brown C, Day RL (2002) The future of stock enhancements: lessons for
hatchery practice from conservation biology. Fish Fish 3:79–94
Cairney M, Taggart JB, Høyheim B (2000) Characterization of
microsatellite and minisatellite loci in Atlantic salmon (Salmosalar L.) and cross-species amplification in other salmonids. Mol
Ecol 9:2155–2234
Corander J, Marttinen P (2006) Bayesian identification of admixture
events using multilocus molecular markers. Mol Ecol 15:
2833–2843
Corujo M, Blanco G, Vazquez E, Sanchez JA (2004) Genetic
structure of northwestern Spanish brown trout (Salmo trutta L.)
populations, differences between microsatellite and allozyme
loci. Hereditas 141:258–271
Cortey M, Pla C, Garcıa-Marın JL (2004) Historical biogeography of
Mediterranean trout. Mol Phylogenet Evol 33:831–844
Cowx IG (1999) An appraisal of stocking strategies in the light of
developing country constraints. Fish Manag Ecol 6:21–34
Estoup A, Presa P, Krieg F, Vaiman D, Guyomard R (1993) (CT)n
and (GT)n microsatellites: a new class of genetic markers for
Salmo trutta L. (brown trout). Heredity 71:488–496
Estoup A, Largiader CR, Perrot E, Chourrout D (1996) Rapid one-tube
DNA extraction for reliable PCR detection of fish polymorphic
markers and transgenes. Mol Mar Biol Biotechnol 5:295–298
Frankham R, Ballou JD, Briscoe DA (2002) Introduction to conser-
vation genetics. Cambridge University Press, UK
Ferguson M, Taggart JB, Prodohl PA, McMeel O, Thompson C,
Stone C, McGinnity P, Hynes RA (1995) The application of
molecular markers to the study and conservation of fish
populations, with special reference to Salmo. J Fish Biol
47:103–126
Garcıa-Marın JL, Jorde PE, Ryman N, Utter F, Pla C (1991)
Management implications of genetic differentiation between
native and hatchery populations of brown trout (Salmo trutta) in
Spain. Aquaculture 95:235–249
Conserv Genet (2009) 10:225–236 235
123
Garcıa-Marın JL, Sanz N, Pla C (1998) Proportions of native and
introduced Brown trout in adjacent fished and unfished Spanish
Rivers. Conserv Biol 12:313–319
Garnier S, Alibert P, Audiot P, Prieur B, Rasplus JY (2004) Isolation
by distance and sharp discontinuities in gene frequencies:
implications for the phylogeographyy of an alpine insect species,
Carabus solieri. Mol Ecol 13:1883–1897
Gharbi K, Gautier A, Danzmann RG, Gharbi S, Sakamoto T,
Hoyheim B, Taggart JB, Cairney M, Powell R, Krieg F,
Okamoto N, Ferguson MM, Holm LE, Guyomard R (2006) A
linkage map for brown trout (Salmo trutta): chromosome
homeologies and comparative genome organization with other
salmonid fish. Genetics 172:2405–2419
Goudet J (1995) Fstat version 1.2: a computer program to calculate
Fstatistics. J Hered 86:485–486
Hansen MM, Kenchington E, Nielsen EE (2001a) Assigning
individuals fish to populations using microsatellite DNA mark-
ers. Fish Fish 2:93–112
Hansen MM, Nielsen EE, Bekkevold D, Mensberg KLD (2001b)
Admixture analysis and stocking impact assessment in brown
trout (Salmo trutta), estimated with incomplete baseline data.
Can J Fish Aquat Sci 58:1853–1860
Hauser L, Seamons TR, Dauer M, Naish KA, Quinn TP (2006) An
empirical verification of population assignment methods by
marking and parentage data: hatchery and wild steelhead
(Oncorhynchus mykiss) in Forks Creek, Washington, USA.
Mol Ecol 15:3157–3173
Hewitt G (2001) Speciation, hybrid zones and phylogeography—or
seeing genes in space and time. Mol Ecol 10:537–549
Koskinen MT, Hirvonen H, Landry PA, Primmer CR (2004) The
benefits of increasing the number of microsatellites utilized in
genetic populations studies: an empirical perspective. Hereditas
141:61–67
Latch EK, Dharmarajan G, Glaubitz JC, Rhodes OE Jr (2006)
Relative performance of Bayesian clustering software for
inferring population substructure and individual assignment at
low levels of population differentiation. Conserv Genet 7:
295–302
Lerceteau-Kohler E, Weiss S (2006) Development of a multiplex
PCR microsatellite assay in brown trout Salmo trutta, and its
potential application for the genus. Aquaculture 258:641–645
Manel S, Berthier P, Luikart G (2002) Detecting wildlife poaching:
identifying the origin of individuals with Bayesian assignment
tests and multilocus genotypes. Conserv Biol 16:650–659
McMeel OM, Hoey EM, Ferguson A (2001) Partial nucleotide
sequences, and routine typing by polymerase chain reaction-
restriction fragment length polymorphism, of the brown trout
(Salmo trutta) lactate dehydrogenase, LDH-C1*90 and *100alleles. Mol Ecol 10:29–34
Nielsen EE, Bach LA, Kotlicki P (2006) HYBRIDLAB (version 1.0): a
program for generating simulated hybrids from population
samples. Mol Ecol Notes 6:971–973
O’Reilly PT, Hamilton LC, McConnell SK, Wright JM (1996) Rapid
analysis of genetic variation in Atlantic salmon (Salmo salar) by
PCR multiplexing of dinucleotids and tetranucleotide microsat-
ellites. Can J Fish Aquat Sci 53:2292–2298
Paetkau D, Slade R, Burden M, Estoup A (2004) Genetic assignment
methods for the direct, real-time estimation of migration rate: a
simulation-based exploration of accuracy and power. Mol Ecol
13:55–65
Paterson S, Piertney SB, Knox D, Gilbey J, Verspoor E (2004)
Characterization and PCR multiplexing of novel highly variable
tetranucleotide Atlantic salmon (Salmo salar L.) microsatellites.
Mol Ecol Notes 4:160–162
Piry S, Alapetite A, Cornuet JM, Paetkau D, Baudouin L, Estoup A
(2004) GeneClass2: a software for genetic assignment and first-
generation migrant detection. J Hered 95:536–539
Poteaux C, Berrebi P, Bonhomme J (2001) Allozymes, mtDNA and
microsatellites study introgression in a stocked trout population
in France. Rev Fish Biol Fisher 10:281–292
Presa P, Guyomard R (1996) Conservation of microsatellites in three
species of salmonids. J Fish Biol 49:1326–1329
Pritchard JK, Stephens M, Donnelly P (2000) Inference of population
structure using multilocus genotype data. Genetics 155:945–959
Rannala B, Mountain JL (1997) Detecting immigration by using
multilocus genotypes. Proc Natl Acad Sci USA 94:9197–9201
Raymond M, Rousset F (1995) GENEPOP (ver. 3.3): a population
genetics software for exact test and ecumenicism. J Hered
86:248–249
Rhymer JM, Simberloff D (1996) Extinction by hybridization and
introgression. Annu Rev Ecol Syst 27:83–109
Slettan A, Olsaker I, Lie Ø (1995) Atlantic salmon, Salmo salar,
microsatellites at the SSOSL25, SSOSL85, SSOSL311,
SSOSL417 loci. Anim Genet 26:281–282
Slettan A, Olsaker I, Lie Ø (1996) Polymorphic Atlantic salmon
(Salmo salar L.) microsatellites at the SSOSL438, SSOSL439
and SSOSL444 loci. Anim Genet 27:57–58
Vaha JP, Primmer CR (2006) Efficiency of model-based Bayesian
methods for detecting hybrid individuals under different hybrid-
ization scenarios and with different numbers of loci. Mol Ecol
15:63–72
Ward RD, Woodwark M, Skibinski DOF (1994) A comparison of
genetic diversity levels in marine, fresh-water, and anadromous
fishes. J Fish Biol 44:213–232
236 Conserv Genet (2009) 10:225–236
123