Estimation of introgression in cutthroat trout populations using microsatellites
19
ORIGINAL ARTICLE Estimation of introgression in cutthroat trout populations using microsatellites Victoria L. Pritchard Ken Jones David E. Cowley Received: 24 April 2006 / Accepted: 20 December 2006 Ó Springer Science+Business Media B.V. 2007 Abstract Introgressive hybridization, mediated by anthropogenic activity, poses a threat to numerous and diverse taxa. The management of introgressed indi- viduals or populations within species of conservation concern is currently the subject of scientific and political debate. We investigate the utility of 10 non- diagnostic microsatellite loci for investigating admix- ture from introduced Yellowstone cutthroat trout (Oncorhynchus clarkii bouvieri) and rainbow trout (O. mykiss) within 25 putative Rio Grande cutthroat trout (O. c. virginalis) populations. We apply five different approaches (correspondence analysis, maxi- mum-likelihood assignment tests, an admixture esti- mator based on allele frequencies, an admixture estimator based on coalescent theory and an admixture estimator implementing a Bayesian method) and use two alternative O. c. virginalis reference samples. All approaches were capable of identifying one population that consisted entirely of introduced O. c. bouvieri, and three out of five approaches enabled us to discriminate those populations with relatively high levels of non- native introgression from those populations with little or none. Actual estimates of admixture coefficients within a test population, varied, however, with the approach and reference sample used. These results have important implications for policies dividing populations into different management categories according to the estimated proportion of non-native genetic material that they contain. Keywords Conservation Á Endangered Species Act Á Hybrid Á Introgression Á Oncorhynchus clarkii Á Microsatellite Introduction Introgressive hybridization, mediated by human activ- ity, poses a threat to numerous and diverse taxa (Rhymer and Simberloff 1996; Wolf et al. 2001; Jensen et al. 2005). Incorporation of even small amounts of non-native genetic material into the genome could in- crease the extinction risk of a native population by causing outbreeding depression (Edmands 1999; Montalvo and Ellstrand 2001; Marr et al. 2002; Gilk et al. 2004). Ongoing introgression can cause the pop- ulation to be replaced by one genetically and pheno- typically resembling the non-native form (Huxel 1999). The identification and management of introgressed (admixed) populations within taxa of conservation concern present a number of challenges. Individuals containing non-native genetic material may be mor- phologically indistinguishable from those containing an intact native genome (Daniels et al. 1998; Weigel et al. 2002; Chan et al. 2006). While admixed populations can pose a hybridization threat to extant pure popu- lations, they may also contain native genetic diversity not represented in those populations (Porath and Nielsen 2003; Peacock and Kirchoff 2004; Campton and Kaeding 2005). Decisions regarding treatment of introgressed individuals or populations are best V. L. Pritchard (&) Á D. E. Cowley Department of Fishery and Wildlife Sciences, New Mexico State University, MSC 4901, P.O. Box 30003, Las Cruces, NM 88003, USA e-mail: [email protected]; [email protected] K. Jones Genetic Identification Services, Chatsworth, CA 91311, USA 123 Conserv Genet DOI 10.1007/s10592-006-9280-0
-
Upload
independent -
Category
Documents
-
view
4 -
download
0
Transcript of Estimation of introgression in cutthroat trout populations using microsatellites

ORIGINAL ARTICLE
Estimation of introgression in cutthroat trout populationsusing microsatellites
Victoria L. Pritchard Æ Ken Jones Æ David E. Cowley
Received: 24 April 2006 / Accepted: 20 December 2006� Springer Science+Business Media B.V. 2007
Abstract Introgressive hybridization, mediated by
anthropogenic activity, poses a threat to numerous and
diverse taxa. The management of introgressed indi-
viduals or populations within species of conservation
concern is currently the subject of scientific and
political debate. We investigate the utility of 10 non-
diagnostic microsatellite loci for investigating admix-
ture from introduced Yellowstone cutthroat trout
(Oncorhynchus clarkii bouvieri) and rainbow trout
(O. mykiss) within 25 putative Rio Grande cutthroat
trout (O. c. virginalis) populations. We apply five
different approaches (correspondence analysis, maxi-
mum-likelihood assignment tests, an admixture esti-
mator based on allele frequencies, an admixture
estimator based on coalescent theory and an admixture
estimator implementing a Bayesian method) and use
two alternative O. c. virginalis reference samples. All
approaches were capable of identifying one population
that consisted entirely of introduced O. c. bouvieri, and
three out of five approaches enabled us to discriminate
those populations with relatively high levels of non-
native introgression from those populations with little
or none. Actual estimates of admixture coefficients
within a test population, varied, however, with the
approach and reference sample used. These results
have important implications for policies dividing
populations into different management categories
according to the estimated proportion of non-native
genetic material that they contain.
Keywords Conservation � Endangered Species Act �Hybrid � Introgression � Oncorhynchus clarkii �Microsatellite
Introduction
Introgressive hybridization, mediated by human activ-
ity, poses a threat to numerous and diverse taxa
(Rhymer and Simberloff 1996; Wolf et al. 2001; Jensen
et al. 2005). Incorporation of even small amounts of
non-native genetic material into the genome could in-
crease the extinction risk of a native population by
causing outbreeding depression (Edmands 1999;
Montalvo and Ellstrand 2001; Marr et al. 2002; Gilk
et al. 2004). Ongoing introgression can cause the pop-
ulation to be replaced by one genetically and pheno-
typically resembling the non-native form (Huxel 1999).
The identification and management of introgressed
(admixed) populations within taxa of conservation
concern present a number of challenges. Individuals
containing non-native genetic material may be mor-
phologically indistinguishable from those containing an
intact native genome (Daniels et al. 1998; Weigel et al.
2002; Chan et al. 2006). While admixed populations
can pose a hybridization threat to extant pure popu-
lations, they may also contain native genetic diversity
not represented in those populations (Porath and
Nielsen 2003; Peacock and Kirchoff 2004; Campton
and Kaeding 2005). Decisions regarding treatment
of introgressed individuals or populations are best
V. L. Pritchard (&) � D. E. CowleyDepartment of Fishery and Wildlife Sciences,New Mexico State University, MSC 4901, P.O. Box 30003,Las Cruces, NM 88003, USAe-mail: [email protected]; [email protected]
K. JonesGenetic Identification Services, Chatsworth,CA 91311, USA
123
Conserv Genet
DOI 10.1007/s10592-006-9280-0
made on a case-by-case basis (Allendorf et al. 2001,
2004). However in practice many bodies concerned
with the conservation of native taxa might prefer to
work with strict guidelines that they can use, for
example, to justify decisions in a court of law.
The problem of introgressive hybridization with
introduced non-natives is well documented in fresh-
water fishes, where isolation in different water bodies
can allow evolutionary diversification in the absence of
intrinsic barriers to gene exchange (Epifanio and
Nielsen 2000; Perry et al. 2002; Rosenfield et al. 2004).
The issue has been particularly well studied in salmo-
nids, which are threatened by the widespread stocking
of hatchery-reared individuals for the purpose of
commercial or recreational fishing (Utter 2001). For
example, in Europe, marble trout (Salmo marmoratus)
and geographically distinct lineages of brown trout
(S. trutta) and Arctic charr (Salvelinus alpinus) are at
risk from introgression from introduced congeneric
hatchery strains (Brunner et al. 1998; Machordom
et al. 1999; Hansen et al. 2001; Fumagalli et al. 2002).
Similarly, in interior North America, Apache trout
(Oncorhynchus apache), Gila trout (O. gilae), golden
trout (O. aguabonita), rainbow trout (O. mykiss) and
all eight extant subspecies of inland cutthroat trout
(O. clarkii) are threatened by hybridization with vari-
ous Oncorhynchus species stocked as sport fish
(Behnke 1992; Kruse et al. 2000; Porath and Nielsen
2003; Wares et al. 2004; Rubidge and Taylor 2005). In
response to the problem of introgressive hybridization,
management of cutthroat trout in seven U.S. states is
currently guided by a Position Paper (Anonymous
2000) which divides populations into management
categories according to the proportion of non-native
genetic material that they are estimated to contain.
The ‘Core Conservation’ category includes all popu-
lations exhibiting < 1% introgression from non-native
trout. The ‘Conservation’ category includes popula-
tions that correspond phenotypically to pure native
cutthroat trout but which contain more non-native
genetic material; most agencies include populations
with < 10% introgression within this category. All
remaining populations are termed ‘Sportfish’, and
generally managed as non-native trout.
Categorization of populations using such quantita-
tive thresholds necessitates a method to accurately
assess admixture levels. In practice the precision of an
admixture estimate will depend upon multiple factors,
including the sampling design, the type of marker used,
and the degree to which the true situation conforms to
the assumptions underlying the statistical methodology
chosen. The ideal genetic marker for estimation of
introgression levels is selectively neutral, biparentally
inherited, co-dominant, diagnostic between the taxa of
interest at multiple loci, and allows non-lethal sam-
pling. Discovery of such ideal markers, however, may
be difficult. For example, the closely related cutthroat
trout subspecies O. c. pleuriticus, O. c. stomias and O.
c. virginalis are all known to have hybridized with
introduced Yellowstone cutthroat trout (O. c. bouvieri)
within their native range, but diagnostic markers cur-
rently available to distinguish between the native and
non-native taxa either require lethal sampling (allo-
zymes, Keeler-Foster 2003), are inherited through the
maternal line only (mtDNA, J. L. Metcalf, personal
communication) or are not co-dominant (Paired
Interspersed Nuclear Elements or PINEs, Kanda et al.
2002; Colorado Division of Wildlife unpublished data).
A further complication arises where all populations in
a taxon’s range have potentially been exposed to
hybridization, in which case identification of pure
populations may be difficult. Even where pure popu-
lations can be unambiguously identified, they may not
be suitable for reference purposes. Specifically, where
gene exchange between populations has been histori-
cally limited, the available pure reference sample may
be genetically quite different from the native ancestors
that contributed to the admixed population under
consideration. In such a situation, an admixture esti-
mate may vary with the reference sample used.
Microsatellites have recently become a marker of
choice in population genetic studies. Their high muta-
tion rate and limited number of possible allelic states
means that taxa frequently exhibit overlapping allele
size distributions, and hence microsatellite loci are
rarely completely diagnostic between hybridizing
populations. However a number of alternative
approaches are available to investigate admixture
using such highly variable markers (Choisy et al. 2004;
Freeman et al. 2004), several of which can be applied
to situations where more than two parental taxa are
involved. All these approaches are, by necessity, based
on simplifying assumptions that are unlikely to be
fulfilled in the true situation under consideration,
hence different approaches are expected to generate
different admixture estimates. In this paper, we
examine the efficacy of five of these approaches,
applied to data from 10 microsatellite loci, for identi-
fying or quantifying non-native introgression in popu-
lations of Rio Grande cutthroat trout, O. c. virginalis.
Native to the Canadian, Pecos and Rio Grande river
drainages of Colorado and New Mexico, O. c. virginalis
has declined to a fraction of its historic range and
currently has a highly fragmented distribution, being
primarily restricted to small headwater streams (Prit-
chard and Cowley 2006). The taxon exhibits substantial
Conserv Genet
123

genetic structuring at both the inter-population and
inter-drainage level (global Fst within the Rio Grande
drainage = 0.4, Pritchard and Cowley 2006). Although
non-natives are no longer stocked into waters known to
contain O. c. virginalis, all extant populations have
potentially been exposed over the past century to
introgression from introduced O. c. bouvieri and O.
mykiss. First, we examine whether all five approaches
can similarly discriminate introgressed and non-intro-
gressed populations. Second, we investigate whether
three methods generating quantitative estimates of
admixture provide sufficiently congruent results to
allow unambiguous assignment of populations to
management categories that are delineated by thresh-
old levels of introgression. Third, we examine the
influence of using alternative parental reference sam-
ples on these admixture estimates.
Methods
Tissue collection
Tissue samples (n = 23–60) were obtained from 31
populations of putative Rio Grande cutthroat trout
(RGCT) in New Mexico (Table 1). These comprised
17 populations from the Rio Grande drainage, eight
populations from the Pecos drainage, five populations
from the Canadian drainage and a single population of
unknown origin occurring in the closed Tularosa basin
of southern New Mexico. Tissue samples were pri-
marily in the form of fin-clips taken from individuals
captured via electrofishing between 1996 and 2004,
however for four populations (CLF, Rito Murphy,
Gavilan Canyon and Yerba Creek) archived liver or
muscle tissue collected at an earlier date was also in-
cluded. Exact sampling pattern varied according to fish
density and stream characteristics, however at all sites
fish of multiple age classes were systematically sampled
over a stream reach of several hundred meters or more
in an attempt to minimize the effects of habitat struc-
turing or family grouping (Hansen et al. 1997). For
samples HDN, ELR and UTE, individuals were col-
lected from two or more separate stream reaches.
In addition, tissue samples were obtained from the
following: a broodstock line of O. c. virginalis main-
tained by Colorado Division of Wildlife; five domestic
strains of rainbow trout which have been stocked
throughout the western United States since the late
1800s; a hatchery strain of Yellowstone cutthroat trout
(YSCT) originating from Yellowstone Lake and a
hatchery strain of fine-spotted Snake River cutthroat
trout (SRCT) which has been stocked into New Mex-
ico waters since the 1970s (Table 1). For one of the
rainbow trout samples, Steelhead we combined two
sets of tissue samples collected at different times.
Yellowstone and Snake River cutthroat trout are
currently considered to be the same subspecies (O. c.
bouvieri) and we found very similar allele distributions
within these strains at all loci. Therefore we tested the
putative Rio Grande cutthroat trout populations for
their level of admixture from three different sources:
Rio Grande cutthroat trout (RGCT), rainbow trout
(RNBW) and Yellowstone/Snake River cutthroat trout
(Y/SRCT). (Table 2)
Microsatellite analysis
DNA was extracted using the PureGene DNA
Extraction Kit (Gentra Systems, Minneapolis, MN,
USA) following the manufacturer’s instructions. We
amplified ten tetranucleotide microsatellite loci (J3,
J14, K216, K222, H12, H18, H114, H118, H126, H220)
all of which exhibit overlap in allele sizes between
O. c. virginalis, O. c. bouvieri and O. mykiss (Prit-
chard et al. in press b). Microsatellites were amplified
in 20 ll reactions and products labelled using an M13
procedure (Pritchard et al. in press b) We used the
following reaction mix: 1 ll template DNA, 2 ng/ml;
reverse and M13-modified forward primers, 0.2 mM
each; M13-labelled oligo, 0.1 mM; dNTPs, 0.2 mM
each; MgCl2, 1.5 mM; Biotaq DNA polymerase
(Bioline USA Inc., Canton, MA), 0.25 units; and
Biotaq buffer, 1X. PCR was conducted using a MJ
Research PTC-100 96 V thermocycler with the fol-
lowing conditions: initial denaturation 95�C (5 min),
followed by 10 cycles of 94�C (30 s), 57�C (60 s), and
72�C (30 s), followed by 22 cycles of 94�C (30 s), 55�C
(60 s), and 72�C (30 s), and terminating with a final
extension at 72�C for 10 min. Amplification products
were mixed 1:1 with 98% formamide loading dye,
denatured for 3 min at 95�C, and then cooled on ice
before running on 5% denaturing acrylamide gels at
35 W for 70 min. Products were detected using the
ABI-377. Initial results showed multiple alleles with
1 bp, 2 bp or 3 bp size differences. Comparison of
alleles between replicate genotyping runs of 15 indi-
viduals, and examination of allele size distribution
over the entire dataset, suggested that the majority of
observed 1–3 bp size differences were due to allele
sizing errors. We therefore binned all alleles into 4 bp
size categories.
Conserv Genet
123

Choice of reference populations
The a-priori identification of pure populations of Rio
Grande cutthroat trout is problematic. Stocking of
non-native Oncorhynchus taxa has been intensive and
widespread within the subspecies’ range, even in
remote wilderness areas, and migration of stocked fish
between streams is to be expected. We used a combi-
nation of approaches to select suitable Rio Grande
cutthroat trout reference samples for this study. First,
we used historical stocking records, maintained by New
Mexico Department of Game and Fish since the late
1800s, to identify populations on public land that were
not recorded as receiving transplants of non-native
Table 1 Test and reference samples used in this study
Code Description N Current managementcategory
Purity assessment Stocking record?
Test populationRito Angostura ANG RGCT Rio Grande 30 Sportfish m, a YBitter Creek BIT RGCT Rio Grande 30 Core m, a R, YCabresto Creek CAB RGCT Rio Grande 30 Conservation? m R, Y, SRCanones Creek CAN RGCT Rio Grande 30 Core m, a, mtDNA R, YCabresto Lake Fork CLF RGCT Rio Grande 30 Core m, a R, YColumbine Creek COL RGCT Rio Grande 30 Core m, a R, YEl Rito Creek ELR RGCT Rio Grande 40 Core m, a R, YHolden Prong HDN RGCT Rio Grande 23 Conservation m, a R, YOsha Creek OSH RGCT Rio Grande 24 Unknown none R?, Y?Polvadera Creek PVA RGCT Rio Grande 30 Core m, a R, YRio de las Vacas1 RLV RGCT Rio Grande 30 Core m, a R?, Y?Upper Comanche UCO RGCT Rio Grande 30 Core m, a R, YUte Creek UTE RGCT Rio Grande 60 Unknown none R?, Y?Cow Creek COW RGCT Pecos 30 Unknown none R, Y, SRDalton Creek DAL RGCT Pecos 30 Unknown none R, YDoctor Creek DOC RGCT Pecos 29 Core m, a R, YRito los Esteros EST RGCT Pecos 31 Unknown none noneRio Mora MOR RGCT Pecos 30 Core? m R, YRio Mora Tributary MTR RGCT Pecos 30 Unknown none noneRito del Padre PDR RGCT Pecos 29 Core m, a R, Y, SRRio Valdez VDZ RGCT Pecos 30 Core m, a R, Y, SRMiddle Ponil MPO RGCT Canadian 30 Sportfish m, a R, YRicardo Creek RIC RGCT Canadian 40 Core m, a R, YLittle Vermejo VJO RGCT Canadian 30 Core m, a YIndian Creek IND RGCT Tularosa 37 Core? m R?, Y?Reference populationGavilan Canyon US-RGCT RGCT Rio Grande 30 Core m, a nonePalociento Creek US-RGCT RGCT Rio Grande 28 Core m, a nonePolicarpio Creek US-RGCT RGCT Rio Grande 30 Core m, a noneYerba Creek US-RGCT RGCT Rio Grande 29 Core m, a noneMcCrystal Creek US-RGCT RGCT Canadian 30 Core m, a, mtDNA noneRito Murphy US-RGCT RGCT Canadian 14 Core m, a noneCO Hatchery Stock CO-RGCT RGCT Rio Grande 30 Core a, PINE –Black Canyon strain RNBW Rainbow hatchery 15 – – –McConaughey strain RNBW Rainbow hatchery 29 – – –Shasta strain RNBW Rainbow hatchery 30 – – –Steelhead RNBW Rainbow hatchery 44 – – –Tasmania strain RNBW Rainbow hatchery 15 – – –Yellowstone cutthroat Y/SRCT YSCT hatchery 30 – – –Snake River cutthroat Y/SRCT SRCT hatchery 16 – – –
‘Current management category’ indicates the current management classification of a population (New Mexico Department of Gameand Fish 2002) based upon previous assessments of levels of introgression using morphometrics (m), allozymes (a), mitochondrialDNA (mtDNA) and/ or paired interspersed nuclear elements (PINEs) (Colorado Division of Wildlife, unpublished data; New MexicoDepartment of Game and Fish, unpublished data; Keeler-Foster 2003). ‘Stocking record?’ indicates whether records held by NewMexico Department of Game and Fish show trout stocking into a stream. Stocking is indicated by R (rainbow trout), Y (Yellowstonecutthroat trout, also recorded as ‘black spotted trout’ or ‘native black spotted’) or S (Snake River cutthroat trout, also recorded as‘cutthroat’). ‘?’ indicates that the stocking record may refer to more than one stream with the same name1 The population in Rio de las Vacas was transplanted from Rio Puerco: stocking records refer to Rio Puerco
Conserv Genet
123

Oncorhynchus taxa. Although levels of introgression
from O. c. bouvieri had not been quantified for any
population, six populations within this subset had
previously been estimated to have zero introgression
from O. mykiss, based on allozyme data (New Mexico
Department of Game and Fish, unpublished data). We
combined these six populations to form our first ref-
erence sample, hereafter referred to as ‘unstocked
RGCT’ (US-RGCT). The sample included populations
from the Rio Grande and Canadian drainage, however
no suitable population was identified from the Pecos
drainage. As an alternative reference sample, we
utilized a broodstock line of Rio Grande cutthroat
trout maintained by Colorado Division of Wildlife,
hereafter referred to as ‘CO RGCT’. This line contains
genetic material from several O. c. virginalis popula-
tions within the Rio Grande drainage in Colorado and
has previously been confirmed as containing < 0.1%
non-native genetic material using PINEs (Colorado
Division of Wildlife unpublished data).
Population genetic statistics
Observed and unbiased expected heterozygosity (Nei
1978) and inbreeding coefficients (Fis, Weir and
Cockerham 1984) were calculated for all loci in each
population sample using Genetix 4.02 (Belkhir et al.
2001). Tests for conformation to Hardy Weinberg
equilibrium were performed for each locus in each
population using an exact test implemented in Gene-
pop 3.4 (Raymond and Rousset 1995). We also used an
exact test implemented in Genepop to test for linkage
equilibrium over all locus pairs in each population.
Significance of Hardy–Weinberg tests over all loci in
each population, and significance of linkage equilib-
rium tests over all locus pairs in each population, and
over all populations for each locus pair, was assessed
by calculating the likelihood of obtaining the observed
number of significant tests by chance alone. To do this
we used the binomial likelihood function (Chapman
et al. 1999; Kinnison et al. 2002). The null hypothesis,
for example no deviation from Hardy–Weinberg
equilibrium or linkage equilibrium, was rejected where
L < 0.05.
It can be difficult to ascertain the cause of statisti-
cally significant linkage disequilibrium or heterozygote
deficiency within a microsatellite dataset. Significant
linkage disequilibria may arise as a result of the recent
mixing of genetically distinct lineages (Nei and Li
1973) or a low effective population size (Bartley et al
1992), even where loci are on different chromosomes.
Similarly, although heterozygote deficiencies may
indicate the presence of null alleles or other genotyp-
ing artefacts, they may also reflect actual population
genetic processes. Populations of trout isolated in small
streams may frequently deviate from Hardy-Weinberg
equilibrium, both because these populations may con-
tain a relatively few families (Hansen and Jensen 2005)
and because fine-scale population sub-structuring may
be present (Wofford et al. 2005). Both linkage dis-
equilibria and deviations from Hardy-Weinberg equi-
librium can also be a by-product of the sampling
scheme used when collecting tissue for analysis. In an
attempt to identify whether heterozygote deficiencies
in our dataset were caused by genotyping artefacts, we
Table 2 Observed and unbiased expected heterozygosity and Fis
over all loci for each population sample
He Ho Fis
Test populationRito Angostura 0.56 0.72 –0.29*Bitter Creek 0.47 0.46 0.03*Cabresto Creek 0.70 0.66 0.05Canones Creek 0.15 0.11 0.29*Cabresto Lake Fork 0.57 0.53 0.06Columbine Creek 0.51 0.46 0.10El Rito Creek 0.56 0.59 –0.05*Holden Prong 0.80 0.74 0.08*Osha Creek 0.19 0.20 –0.05Polvadera Creek 0.05 0.05 0.05Rio de las Vacas 0.62 0.62 –0.01Upper Comanche 0.56 0.52 0.07*Ute Creek 0.53 0.49 0.09*Cow Creek 0.65 0.67 –0.02*Dalton Creek 0.26 0.24 0.10Doctor Creek 0.45 0.49 –0.09Rio Mora 0.22 0.20 0.06Rio Mora Tributary 0.32 0.32 0.00Rito los Esteros 0.43 0.35 0.18*Rito del Padre 0.51 0.50 0.01Rio Valdez 0.55 0.67 –0.21Middle Ponil 0.75 0.71 0.05*Ricardo Creek 0.60 0.58 0.03Little Vermejo 0.54 0.56 –0.02Indian Creek 0.58 0.57 0.02
Reference populationGavilan Canyon 0.53 0.48 0.09*Palociento Creek 0.45 0.44 0.02Policarpio Creek 0.42 0.45 -0.07Yerba Creek 0.49 0.43 0.12*McCrystal Creek 0.30 0.34 -0.12Rito Murphy 0.31 0.31 0.00CO Hatchery Stock 0.67 0.66 0.01Black Canyon strain 0.65 0.51 0.23*McConaughey strain 0.64 0.57 0.12*Shasta strain 0.59 0.63 -0.06Steelhead 0.75 0.63 0.17*Tasmania strain 0.62 0.57 0.08Snake River 0.71 0.70 0.02Yellowstone 0.78 0.77 0.00
Samples deviating significantly from Hardy–Weinberg equilib-rium (L < 0.05) are indicated by *
Conserv Genet
123

first assumed that all sampled populations were, in
reality, in Hardy–Weinberg equilibrium and used the
program Micro-checker (van Oosterhout et al. 2004) to
identify sample-locus combinations where null alleles
might be present, based on the observed excess of
homozygotes. We then examined these sample-locus
combinations for the presence of non-amplifying indi-
viduals, which would imply the existence of null
homozygotes. Where Micro-checker suggested a locus
in a population to contain null alleles, and non-ampli-
fying individuals were observed, we concluded that one
or more null alleles were truly present.
Correspondence analysis
We made a preliminary exploration of the data using
factorial correspondence analysis (FCA), adapted for
use with diploid genetic data following She et al.
(1987), and implemented in Genetix. FCA is an
exploratory technique, suitable for categorical data,
which allows investigation of correspondence between
rows (e.g., individuals) and columns (e.g., alleles) in a
two-way table. It enables visualization of individuals in
multidimensional space, with no a-priori assumptions
about grouping, using each allele as an independent
variable. Axes are generated from combinations of
alleles that explain portions of the total observed
‘inertia’ of the table, defined as the Pearson v2 statistic
for the table divided by the overall number of obser-
vations. Hence those alleles which exhibit the strongest
non-random association with groups of individuals will
contribute most to the axes. Missing data at one or
more loci can create bias in the FCA projection
(Roques et al. 2001), however in this study exclusion of
individuals with incomplete multilocus genotypes did
not substantially change the results, and we therefore
included all 1,164 individuals in the analysis.
Maximum-likelihood assignment tests
Several authors have used maximum-likelihood based
genetic classification methods to investigate introgres-
sion within populations, by examining the likelihood
with which individuals are assigned to a non-native
reference sample (Wares et al. 2004; Taylor et al.
2007). We implemented a Bayesian approach (Rannala
and Mountain 1997) available in Geneclass 1.0.02
(Cornuet et al. 1999), first to assign individuals to their
most likely population of origin based on observed
microsatellite allele frequencies, and second to assess
the probability that an individual belonged to each
alternative population, by comparing its genotype to
that of 10,000 simulated genotypes generated by ran-
domly taking alleles according to their estimated fre-
quencies in that population. The method assumes
Hardy–Weinberg equilibrium within populations. We
initially provided Geneclass with a reference dataset
containing microsatellite data for Yellowstone
cutthroat trout, Snake River cutthroat trout, all rain-
bow trout samples, and either ‘CO RGCT’ or
‘unstocked RGCT’, and forced the program to assign
each test individual to one of the 8 or 13 reference
samples. Subsequently, we provided the program with
the entire microsatellite dataset, and enabled it to
assign an individual to any one of the 39 possible pop-
ulation samples, implementing the ‘leave one out’
option, which causes the individual of interest to be
removed from the data set prior to calculation of sam-
ple allele frequencies. We considered an individual to
contain non-native genetic material when its estimated
probability of belonging to one of the non-native
reference samples was > 0.01.
Allele frequency approach
The genetic contribution of two or more parental
populations to an admixed population can be esti-
mated simply from the observed allele frequencies in
those populations using a least-squares method
(sensu Chakrabory 1986) implemented in the pro-
gram Admix 2.0 (Dupanloup and Bertorelle 2001).
This approach assumes that allelic frequencies esti-
mated from the reference and test samples are
identical to those in the true parental and hybrid
populations immediately after the admixture event,
which occurred at a single point in time. We pro-
vided the program with an input file containing allele
frequencies for a test population and three putative
‘parental populations’: the pooled rainbow trout
samples, the pooled Yellowstone and Snake River
cutthroat trout samples, and a sample of Rio Grande
cutthroat trout. We chose to pool samples to create
our parental groups, following Dupanloup et al.
(2004), as a pooled sample is more likely to contain
at least some of the alleles present in the true
parental population. In order to investigate the
influence of using different Rio Grande cutthroat
trout reference samples on the estimation of admix-
ture levels, we ran the analysis twice for each pop-
ulation, once using ‘unstocked RGCT’ as a parental
reference sample and once using ‘CO RGCT’ as a
parental reference sample. We calculated 95% con-
fidence limits of admixture proportions from 2,000
bootstrap replicates.
Conserv Genet
123

Coalescent approach
Bertorelle and Excoffier (1998) and Dupanloup and
Bertorelle (2001) have developed a method, based on
coalescent theory to estimate admixture proportions
(mY) in a population utilizing information about both
allele frequencies and the mutational distance between
alleles in the hybrid and parental population. This
method is also implemented in Admix 2.0. It is
expected to perform better than the simple frequency
based estimator where parental taxa have been iso-
lated for a sufficient time for mutational changes to
contribute to inter-taxonomic allele size variation, as is
expected to have been the case with O. mykiss, O. c.
bouvieri and O. c. virginalis (Bertorelle and Excoffier
1998). The method assumes, amongst other things, that
the reference samples are taken from the true parental
populations and that the admixture event occurred at a
single point in time. We provided the program with
input files as described previously and ran the analysis
with the two alternative RGCT reference samples. As
recommended by Bertorelle and Excoffier (1998), we
used the squared difference in tetranucleotide repeat
number as an estimation of coalescence time, assuming
a strict stepwise model of microsatellite mutation. As
the admixture event is expected to be relatively recent,
we assumed no subsequent mutational changes in al-
leles. Again, we calculated confidence limits from 2,000
bootstrap replicates.
Bayesian estimation of admixture proportions
Structure (Pritchard et al. 2000) is a model-based
Bayesian, Markov chain Monte Carlo (MCMC) ap-
proach that uses the assumption of Hardy–Weinberg
equilibrium and linkage equilibrium within populations
to estimate, amongst other things, the number of dis-
crete populations within a sample and the admixture
coefficient (q) of each individual within a sample. The
program can be used to estimate admixture coefficients
where no pure native reference population is available
(Beaumont et al. 2001; Hansen et al. 2001). We ini-
tially used Structure to confirm that there were 7 dis-
tinct populations represented by our Yellowstone
cutthroat trout, Snake River cutthroat trout and rain-
bow trout reference samples, and 6 distinct populations
represented by our ‘unstocked RGCT’ reference sam-
ple. This was done by pooling all reference samples
and comparing the likelihood of the data assuming that
they originated from 1 to 20 populations. We then used
Structure to estimate levels of admixture in each test
population. For each run of Structure we provided the
program with microsatellite data for all rainbow trout,
Yellowstone cutthroat trout and Snake River cutthroat
trout reference samples and the RGCT test sample of
interest. The model was forced to consider each of the
reference populations as ‘pure’ (i.e., non-admixed
individuals), while individuals within the test sample
were allowed to have an admixed ancestry. Allele
frequencies were assumed to be uncorrelated between
populations. We used a burn-in period of 50,000 steps
and then proceeded with 100,000 MCMC replicates.
Each analysis for each population was repeated three
times to ensure consistency of results. In cases where
the three replicate MCMC runs were found to con-
verge on different solutions, we ran more replicates
and selected the solution with the highest log likeli-
hood.
First, we ran Structure for each test population using
no RGCT reference sample. The program was in-
formed that there were 8 populations in the data set.
For each individual in the test sample, the proportion
of its ancestry derived from population 8 (q8) was as-
sumed to approximate the Rio Grande cutthroat trout
admixture coefficient for that individual. Second, we
provided Structure with microsatellite data for the ‘CO
RGCT’ reference sample. The program was again in-
formed that there were 8 populations in the data set,
hence in this case the program was forced to assign
each RGCT test individual to one or more of the ref-
erence populations. Again, q8 (proportion of ancestry
derived from CO RGCT) was assumed to approximate
the RGCT admixture coefficient for each individual.
Third, we provided Structure with microsatellite data
for the ‘unstocked RGCT’ reference sample. The
program was informed that there were 13 populations
in the data set, and the RGCT admixture coefficient
for each test individual was assumed to approximate
the sum of q8–q13 (proportion of ancestry derived
from each of the 6 RGCT reference populations,
hereafter referred to as ‘sum q8–q13’).
The mean individual q8 or sum q8–q13 in each of
the 25 Rio Grande cutthroat trout test samples was
used as an estimate of population-level admixture. We
estimated 95% confidence levels of this population-
level admixture following Hansen et al. (2001). In or-
der to account for variation among individuals and
variation in q8 or sum q8–q13 values in different
MCMC replicates we sampled individual q8 or sum q8–
q13 values from 20 single steps of the Markov chain
(that is, a burn-in period of 50,000 steps followed by
just one MCMC replicate). We drew 2,000 bootstrap
samples of size n from these 20n individual q8 or sum
q8–q13 values and estimated confidence intervals from
the distribution of mean q8 or sum q8–q13 values.
Where replicate runs converged on different solutions,
Conserv Genet
123

we performed additional single step MCMC runs and
sampled only from those that converged on the solu-
tion which we had previously determined to have the
maximum log likelihood.
Results
Population genetic statistics
Observed and expected heterozygosities over all loci
for each sample, and significance of deviations from
Hardy–Weinberg equilibrium are shown in Table 1.
Results for each locus-sample combination are pro-
vided in Appendix 1. Ten of the 25 samples from test
populations and 4 of the 14 samples from reference
populations deviated significantly from Hardy–Wein-
berg equilibrium. The majority of these deviations
were due to significant heterozygote deficiencies at
multiple loci (CAN, EST, HDN, UCO, Yerba Creek,
Steelhead) or significant heterozygote deficiencies at
some loci combined with significant heterozygote ex-
cess at other loci (BIT, COW, ELR, MPO, Gavilan
Canyon, McConaughey), however sample ANG
exhibited overall heterozygote excess. Some hetero-
zygote deficiencies in Gavilan Canyon, Yerba Creek
and Steelhead may have arisen because these samples
combined tissues collected in different years. Hetero-
zygote excess in ANG does not appear to be due to the
presence of F1 hybrids within the sample. Assuming
that all samples were, in reality, in Hardy–Weinberg
equilibrium, Micro-checker suggested the presence of
null alleles for 31 locus-sample combinations (J3: 3
samples; J14: 1 sample; K216: 6 samples; K222: 5
samples; H12: 3 samples; H18: 7 samples; H114: 2
samples; H118: 1 sample; H126: 3 samples; H220: no
samples). We observed non-amplifying individuals in
nine of these locus-sample combinations (J3: none; J14:
Black Canyon; K216: McConaughey, Steelhead; K222:
McConaughey, Steelhead; H18: McConaughey, Steel-
head; H114: none; H118: Black Canyon; H126: COL).
These results suggest that null alleles may be present at
loci K216, K222 and H18 within O. mykiss and at locus
H126 within at least one sample of O. c. virginalis.
Locus K216 amplifies poorly in most O. mykiss sam-
ples, and we have previously noted evidence for null
alleles at H126 within other population samples of O. c.
virginalis, O. c. pleuriticus and O. c. stomias (Pritchard
et al. in press b).
We observed significant overall linkage disequilib-
rium within nine samples (CAB: 23 significant devia-
tions from linkage equilibrium observed within 45
possible pairs of polymorphic loci, L < 0.0001; COW:
19 significant deviations within 45 pairs, L < 0.0001;
MPO: 20 significant deviations within 45 pairs,
L < 0.0001; McConaughey: 12 significant deviations
within 43 pairs, L < 0.0001; Shasta: 11 significant
deviations within 45 pairs, L < 0.0001; EST: 10 signif-
icant deviations within 45 pairs, L = 0.0003; MTR: 7
significant deviations within 28 pairs, L = 0.001; COL:
8 significant deviations within 45 pairs, L = 0.008;
Yerba Creek: 7 significant deviations within 45 pairs,
L < 0.038). We have previously noted evidence for
fine-scale population genetic structuring within rem-
nant O. c. virginalis populations (Pritchard et al. in
press a), and we suspect that this phenomenon, rather
than recent hybridization, may be responsible for
the significant deviations from linkage equilibrium
observed in samples COL, EST, MTR and Yerba
Creek. In contrast, results from subsequent admixture
analyses suggested that the high levels of linkage dis-
equilibrium observed in CAB, COW and MPO were
due to recent hybridization events. Similarly, although
we did not know the recent history of the McCon-
aughey and Shasta O. mykiss strains, the significant
linkage disequilibrium observed within these samples
suggested that they might contain two or more rainbow
trout lines that had recently been mixed. We therefore
omitted these latter five samples when assessing the
significance of linkage disequilibrium for each locus
pair over all populations. Following omission of these
samples, 2 locus pairs exhibited overall significant
deviation from linkage equilibrium, (J3 and K216: 5
significant linkage disequilibria within 25 samples,
L = 0.03; H12 and H18: 6 significant linkage disequi-
libria within 32 samples, L = 0.02). These deviations
were no longer significant when COL, EST, MTR and
Yerba Creek were also removed.
To test whether physical linkage between J3 and
K216, or H12 and H18, or the presence of null alleles at
K216, K222, H18 and H126, were biasing our results,
we repeated all analyses omitting the latter four loci.
We did not omit loci J14 and H118 as strong evidence
for null alleles at these loci was restricted to the small
Black Canyon O. mykiss sample and may reflect spe-
cific conditions when this sample was genotyped.
Correspondence analysis
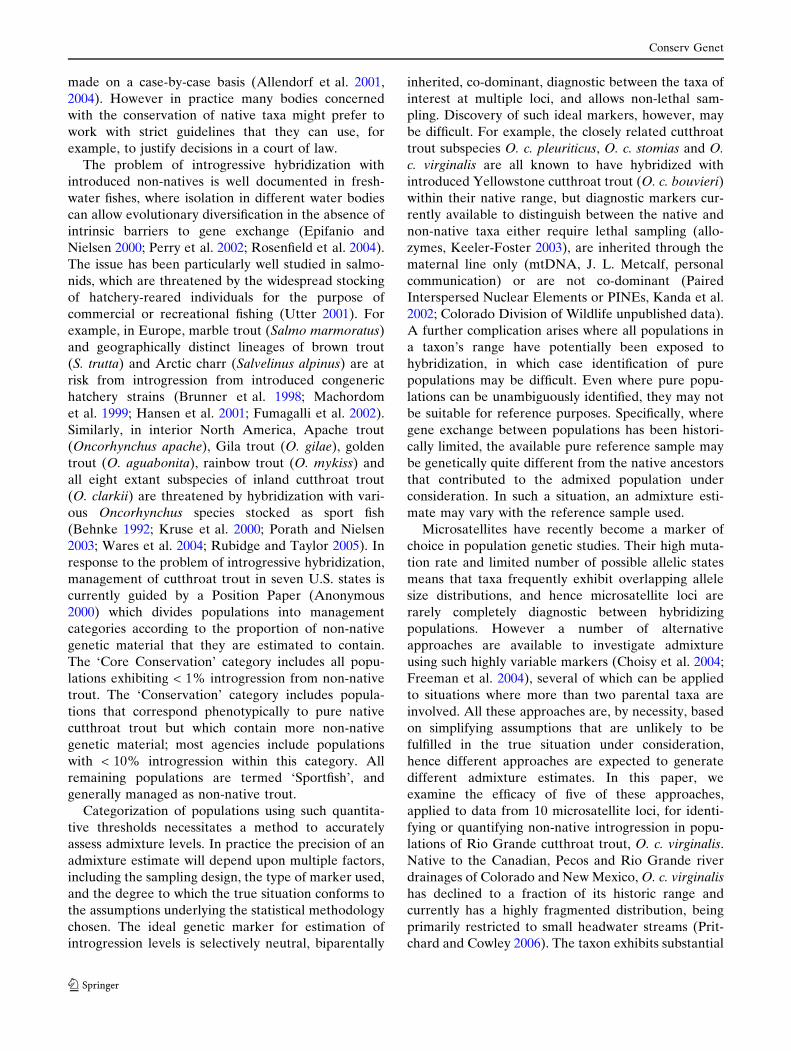
Figure 1 illustrates the results of the factorial corre-
spondence analysis. Although the analysis was per-
formed on the entire dataset, populations are plotted
on four different scattergraphs for ease of interpreta-
tion. Alleles at all loci contributed to each of the two
axes shown. Rio Grande cutthroat trout and rainbow
trout separated along Axis 1 (4.2% of total inertia),
Conserv Genet
123

and RGCT and Y/SRCT separated along Axis 2 (2.9%
of total inertia). Whilst the majority of individuals from
the RGCT test samples clustered together closely on
the scattergraph, the position of some individuals
clearly suggested a non-native genetic influence. All
individuals from IND clustered with individuals from
the Y/SRCT reference sample. Individuals from CLF,
COW, HDN and MPO were located midway between
the Y/SRCT and RGCT clusters, demonstrating that
these populations contain some alleles characteristic of
RGCT and some alleles more characteristic of Y/
SRCT. Similarly, individuals from CAB clustered be-
tween RGCT and rainbow trout, demonstrating the
presence of alleles characteristic of rainbow trout
within this population. The position of a small number
of individuals from DOC, ELR, RIC, RLV and PDR
also suggested some possible non-native introgression
within these populations.
The relative position of most individuals on the
scattergraph was not greatly changed when loci K216,
K222, H18 and H126 were removed from the analysis,
however, results were more strongly suggestive of non-
native introgression in PDR, RLV and a single indi-
vidual from RIC, and also suggested the presence of
non-native genetic material within some individuals
from BIT, UCO and UTE.
Maximum-likelihood assignment tests
When CO-RGCT was included as the O. c. virginalis
reference, 653 (80%) of test individuals were not as-
signed to any reference sample with P > 0.01. Of those
that could be assigned to a sample, all were assigned to
CO-RGCT, with the exception of 26 individuals from
IND, which were assigned to Yellowstone cutthroat
trout. No individual was assigned to any rainbow trout
-1
-1 -0.5 0 0.5 1 1.5 2 2.5 3 3.5 -1 -0.5 0 0.5 1 1.5 2 2.5 3 3.5.5
-1
-0.5
0
0.5
1
1.5
2
2.5
3
Axis 1 (4.2%) Axis 1 (4.2%)
-1 -0.5 0 0.5 1 1.5 2 2.5 3 3.5 -1 -0.5 0 0.5 1 1.5 2 2.5 3 3.5
Axis 1 (4.2%) Axis 1 (4.2%)
Axi
s 2
(2.9
%)
-1.5
-1
-0.5
0
0.5
1
1.5
2
2.5
3
Axi
s 2
(2.9
%)
-1.5
-1
-0.5
0
0.5
1
1.5
2
2.5
3
Axi
s 2
(2.9
%)
-1.5
-1
-0.5
0
0.5
1
1.5
2
2.5
3
Axi
s 2
(2.9
%)
RNBW Y/SRCT US-RGCT CO-RGCTANG BIT CAB CANCOL ELR CLF
RNBW Y/SRCT US-RGCT CO-RGCTHDN OSH PVA RLVUCO UTE
RNBW Y/SRCT US-RGCT CO-RGCTCOW DAL DOC MORMTR PDR EST VDZ
RNBW YS/SRCT US-RGCT CO-RGCT
VJO MPO RIC IND
Fig. 1 Scattergraphs showingposition of individuals alongAxes 1 and 2 generated by theFactorial CorrespondenceAnalysis. Population codesare defined in Table 1
Conserv Genet
123

sample with P > 0.01. Results were almost identical
when unstocked RGCT was included as the O. c. vir-
ginalis reference sample: 647 individuals were not
assigned to any reference sample; 143 individuals
were assigned to one of the US-RGCT samples; 26
individuals from IND were assigned to YSCT and no
individuals were assigned to rainbow trout. When we
provided Geneclass with the entire dataset, and
allowed individuals to originate from any of the 39
alternative population samples, the majority of indi-
viduals were assigned with the highest probability to
their population of origin. Again, all RGCT test indi-
viduals were rejected from any rainbow trout sample
(P < 0.01), however, 25 individuals from IND were not
rejected from the Yellowstone cutthroat trout sample.
No individual from IND was assigned to any other
RGCT sample with P > 0.01 in any analysis.
Results of assignment tests were only slightly chan-
ged when loci K216, K222, H18 and H126 were re-
moved from the analyses, and differences could be
attributed to the reduced number of loci rather than
specifically to the exclusion of null alleles or linked
markers. Where Geneclass was forced to assign
individuals to reference samples, with either the US-
RGCT or CO-RGCT sample included, 30 or 32 indi-
viduals from IND, 3 individuals from COW and 3
individuals from HDN were assigned to Yellowstone
cutthroat trout. Similarly, when we allowed individuals
to be assigned to any population, 32 individuals from
Indian Creek and 3 individuals each from Cow Creek
and Holden Prong were not rejected from YSCT and/
or SRCT.
Allele frequency approach
Figure 2a shows RGCT admixture coefficients esti-
mated using the allele frequency approach imple-
mented in Admix 2.0. Dotted lines indicate RGCT
admixture coefficients of 0.99 and 0.90, assumed to
correspond to the threshold levels of 1% and 10% non-
native introgression used to assign cutthroat trout
populations to different genetic management categories
(Anonymous 2000). Estimated levels of RNBW and Y/
SRCT admixture are shown in Figures 2b and c, with
dotted lines indicating admixture coefficients of 0.01
and 0.1. The allele frequency approach estimated a
RGCT admixture coefficient > 0.9 for only four of the
25 test populations, and for some populations estimates
varied substantially with the RGCT reference sample
used. All populations within the Canadian and Pecos
drainages were estimated to contain 30–70% non-na-
tive genetic material, which was primarily attributed to
rainbow trout. Samples COW, CLF, HDN and IND
were estimated to contain a substantial amount of ge-
netic material originating from Y/SRCT. In some cases,
estimated RNBW admixture coefficients were negative.
Removal of K216, K222, H18 and H126 from the
data set did not have a consistent effect on the results:
estimated RGCT admixture coefficient increased or
decreased, in most cases by a relatively small amount,
depending upon the test sample and RGCT reference
sample provided. In all but three cases (COL and ELR
with the US-RGCT reference sample; RLV with the
CO-RGCT reference sample), this change was not
sufficient to cause a population to be assigned into a
different ‘management category’ as defined by the
Position Paper.
Coalescent approach
Figures 3a, b and c show the levels of RGCT, RNBW
and Y/SRCT admixture estimated for each population
using the coalescent approach implemented in Admix
2.0. Again, dotted lines indicate non-native RGCT
admixture coefficients of 0.99 and 0.9, or non-native
admixture coefficients of 0.01 and 0.1. Results differed
substantially from those obtained using allele fre-
quencies alone. Estimated RGCT admixture coeffi-
cients were high for the majority of test populations,
with only eight: CAB, CLF, COW, DOC, HDN, IND,
MPO and RLV, estimated to have a RGCT admixture
coefficient < 0.9. Sample IND exhibited a very low
estimated RGCT admixture coefficient in combination
with a high Y/SRCT admixture coefficient. Hence,
results were qualitatively similar to those obtained
using correspondence analysis, even thought the latter
approach does not take into account information about
allele size. Generally similar results were obtained
when using the two alternative reference samples, al-
though RGCT admixture coefficient estimated using
the CO-RGCT reference sample was often smaller
than that estimated using the US-RGCT reference
sample. Again, Admix frequently estimated negative
RNBW or Y/SRCT admixture coefficients for test
populations. Populations exhibiting a RGCT admix-
ture coefficient > 0.99, therefore, could also exhibit a
RNBW or Y/SRCT admixture coefficient > 0.01 as a
result of a negative admixture coefficient being esti-
mated for the third putative parental population. For
the same reason, estimated RGCT admixture coeffi-
cients for several populations were > 1.
Removal of K216, K222, H18 and H126 from the
analyses resulted in a decreased, and frequently nega-
tive, estimated RNBW admixture coefficient for most
samples. This was accompanied with an increase in the
estimated RGCT and YSCT admixture coefficients.
Conserv Genet
123

Irrespective of the RGCT reference sample provided,
samples CAB, CLF, HDN, COW, MPO and IND
continued to exhibit a RGCT admixture coefficient
> 0.9; samples DOC and RLV exhibited a RGCT
admixture coefficient < 0.99 and all other samples
exhibited a RGCT admixture coefficient > 1.
Structure
When we used Structure to estimate the number of
populations present in our pooled reference sample,
log likelihood of the solution increased from K = 1
until it reached a plateau at K = 14. However, the
value of DK (Evanno et al. 2005) was maximized at
K = 4, with the four identified groups comprising Y/
SRCT, RNBW, Rio Grande RGCT and Canadian
River RGCT. We chose to define K = 14 as we know
a-priori that the majority of our reference samples are
taken from demographically independent populations.
However, for many test populations, we have previ-
ously run the same analyses defining the reference
samples to comprise just three groups: Y/SRCT,
0.0
0.1
0.2
0.3
0.4
0.5
0.6
0.7
0.8
0.9
1.0
1.1
AN
G
BIT
CA
B
CA
NC
LF
CO
L
ELR
HD
N
OS
H
PV
A
RLV
UC
O
UTE
CO
W
DA
L
DO
C
ES
TM
OR
MTR
PD
RV
DZ
MP
O
RIC
VJO IND
US-RGCT reference CO-RGCT reference
0.0
1.2
AN
G
BIT
CA
B
CA
N
CLF
CO
L
EL
R
HD
N
OS
HP
VA
RLV
UC
O
UT
E
CO
W
DA
L
DO
C
ES
T
MO
RM
TR
PD
R
VD
Z
MP
O
RIC
VJO IND
-0.3
0.0
0.1
0.2
0.3
0.4
0.5
0.6
0.7
0.8
0.9
AN
G
BIT
CA
BC
AN
CLF
CO
LE
LR
HD
N
OS
HP
VA
RLV
UC
OU
TE
CO
W
DA
LD
OC
ES
T
MO
RM
TR
PD
R
VD
Z
MP
O
RIC
VJO IND
RNBW
RGCT
Y/SRCT
-0.2
-0.1
RN
BW
adm
ixtu
re c
oeff
icie
nt ±
95%
CL
0.1
0.2
0.3
0.4
0.5
0.6
0.7
0.8
0.9
1.0
1.1
RG
CT
adm
ixtu
re c
oeff
icie
nt ±
95%
CL
-0.1Y/S
RC
T a
dmix
ture
coe
ffic
ient
± 9
5% C
L
(a)
(b)
(c)
Fig. 2 Admixture coefficientsas calculated using the allelefrequency approachimplemented Admix 2.0.(a) RGCT admixturecoefficient; (b) RNBWadmixture coefficient; (c)Y/SRCT admixturecoefficient
Conserv Genet
123

RNBW and RGCT, and found very similar results to
those presented here (V. L. Pritchard, unpublished
data).
Figure 4 shows mean population-level RGCT
admixture coefficient (q8 or sum q8–q13) for all test
populations as estimated using Structure. In all cases,
mean q8 or sum q8–q13 was less than one. This is
because Structure estimated a non-zero, but often
negligible, contribution of each of the reference pop-
ulations to each test individual irrespective of its
genotype. Results clearly varied according to the
reference sample used. Where no reference sample was
provided, all replicate runs converged on the same
solution, and Structure estimated relatively high
RGCT admixture coefficients for all populations.
However those populations that exhibited the lowest
values of q8 were generally also those that appeared
most introgressed using the alternative approaches.
Where the ‘CO RGCT’ reference sample, derived from
the Rio Grande drainage, was used, estimated RGCT
admixture coefficient varied greatly between test pop-
ulations. All test populations within the Rio Grande
-0.1
0.0
0.1
0.2
0.3
0.4
0.5
0.6
0.7
0.8
0.9
1.0
1.1
1.2
US-RGCT reference sample CO-RGCT reference sample
0.0
0.1
0.2
0.3
0.4
0.5
0.6
0.7
0.8
0.9
1.0
1.1
1.2
AN
G
BIT
CA
B
CA
N
CLF
CO
L
ELR
HD
N
OS
HP
VA
RLV
UC
O
UT
E
CO
W
DA
L
DO
C
ES
T
MO
RM
TR
PD
R
VD
Z
MP
O
RIC
VJO IN
D
AN
G
BIT
CA
B
CA
N
CLF
CO
L
ELR
HD
N
OS
HP
VA
RLV
UC
O
UT
E
CO
W
DA
L
DO
C
ES
T
MO
RM
TR
PD
R
VD
Z
MP
O
RIC
VJO IN
D
AN
G
BIT
CA
B
CA
N
CLF
CO
L
ELR
HD
N
OS
HP
VA
RLV
UC
O
UT
E
CO
W
DA
L
DO
C
ES
T
MO
RM
TR
PD
R
VD
Z
MP
O
RIC
VJO IN
D
-0.3
-0.2
-0.1
0.0
0.1
0.2
0.3
0.4
0.5
0.6
0.7
0.8
0.9RNBW
Y/SRCT
RGCT
mY
(R
NB
W)
± 9
5% C
Lm
Y (
Y/S
RC
T)
± 9
5% C
L
mY
(R
GC
T)
± 9
5% C
L
(a)
(b)
(c)
Fig. 3 Admixture coefficientsas calculated using thecoalescent approachimplemented Admix 2.0.(a) RGCT admixturecoefficient; (b) RNBWadmixture coefficient; (c)Y/SRCT admixturecoefficient
Conserv Genet
123

drainage exhibited a high mean q8, which was constant
over Structure runs: that is, individuals in the popula-
tion were estimated to derive most of their ancestry
from ‘CO RGCT’. In contrast, for most populations
within the Canadian and Pecos drainages, replicate
Structure runs converged on different solutions, and
the solution with the highest log likelihood generally
estimated a low mean q8. Hence, most individuals in
these population samples were estimated to derive
most of their ancestry from a reference sample other
than ‘CO RGCT’. When using the ‘unstocked RGCT’
reference sample, which contained individuals from
both the Rio Grande and the Canadian drainages,
replicate structure runs generally converged on the
same solution, and estimated population-level RGCT
admixture coefficients (sum q8–q13) were relatively
high for all test populations except Indian Creek,
Holden Prong and Cow Creek. Again, a number of
populations that appeared to be more introgressed in
other analysis also exhibited lower estimated RGCT
admixture coefficients using Structure.
RGCT admixture coefficients estimated using
Structure from the dataset omitting K216, K222, H18
and H126 were generally slightly smaller than those
estimated from the full dataset, irrespective of the
reference sample provided. The difference between
the two estimates was always less than 0.05. Excep-
tions to this pattern were CLF, HDN and COW,
which exhibited a slightly higher RGCT admixture
coefficient estimated from the reduced dataset when
the ‘CO-RGCT’ or ‘US-RGCT’ reference sample was
provided, and RIC and VDZ, for which a large
RGCT admixture coefficient became the marginally
more likely solution when using the ‘CO RGCT’
reference sample.
Discussion
Utility of alternative approaches for investigation
of admixture in O. c. virginalis
In this paper we have used five different approaches,
applied to data from 10 microsatellite loci, to investi-
gate non-native admixture within a taxon of conser-
vation concern. All approaches reveal one population
that appears to consist entirely of non-native individ-
uals, and three out of the five approaches identify five
populations that appear to contain substantial amounts
of non-native introgression. However quantitative
estimates of admixture for each population vary both
with the method used and the reference sample pro-
vided. Thus, results do not clearly discriminate
between pure populations and those with low levels of
non-native admixture, and hence do not enable
unambiguous assignment of populations into manage-
ment categories defined by threshold levels of intro-
gression.
Factorial correspondence analysis was developed as
a method to visually explore the variance in a data set
and cannot be used to provide a quantitative estimate
of admixture levels. Nevertheless, comparison of the
position of individuals in the FCA scattergraphs with
admixture coefficients estimated using Structure or the
0.0
0.1
0.2
0.3
0.4
0.5
0.6
0.7
0.8
0.9
1.0
1.1
AN
GB
IT
CA
B
CA
NC
LF
CO
LE
LR
HD
NO
SH
PV
A
RLV
UC
O
UT
E
CO
WD
AL
DO
C
ES
TM
OR
PD
RM
TR
VD
Z
MP
O
RIC
VJO IND
AN
GB
IT
CA
B
CA
NC
LF
CO
LE
LR
HD
NO
SH
PV
A
RLV
UC
O
UT
E
CO
WD
AL
DO
C
ES
TM
OR
PD
RM
TR
VD
Z
MP
O
RIC
VJO IND
AN
GB
IT
CA
B
CA
NC
LF
CO
LE
LR
HD
NO
SH
PV
A
RLV
UC
O
UT
E
CO
WD
AL
DO
C
ES
TM
OR
PD
RM
TR
VD
Z
MP
O
RIC
VJO IND
0.0
0.1
0.2
0.3
0.4
0.5
0.6
0.7
0.8
0.9
1.0
1.1
0.0
0.1
0.2
0.3
0.4
0.5
0.6
0.7
0.8
0.9
1.0
1.1
Mea
n q8
± 9
5% C
LM
ean
q8 ±
95%
CL
Mea
n su
m q
8-q1
3 ±
95%
CL
(a)
(b)
(c)
Fig. 4 Mean q8 or mean sum q8-q13, calculated by Structure andassumed to approximate RGCT admixture coefficient. (a) Noreference sample; (b) ‘CO RGCT’ used as reference sample;(c) ‘Unstocked RGCT’ used as reference sample
Conserv Genet
123

coalescent approach in Admix 2.0 shows that clearly
introgressed individuals and populations in the data set
can be readily identified visually. Hence FCA is a
valuable first step in identifying hybridized populations
from a set of non-diagnostic microsatellite data. This
approach has the additional advantage of not requiring
pure reference samples to be pre-defined.
Assignment tests, as implemented by Geneclass, are
clearly not suitable for discriminating introgressed
from non-introgressed populations using our dataset.
Several O. c. virginalis populations appeared, from the
results of other analyses, to contain substantial
amounts of non-native genetic material, however no
individual from these populations was assigned to a
non-native reference sample with P > 0.01. Although
assignment tests may perform better where the
hybridizing taxa are more closely related and hence
less divergent in allelic composition, we suggest that
results of such tests should not be used to make
inferences about the purity of a population in the ab-
sence of additional supporting analyses. We note that
individuals from populations which we believe to be
introgressed were frequently not rejected from other
introgressed samples, hence the utility of the assign-
ment test may be improved by including a known
hybrid population as a reference sample.
Estimates of RGCT admixture based on allele fre-
quencies alone implied the presence of non-native
introgression in most populations tested, and non-native
genetic contributions of more than 50% to all popula-
tions in the Canadian and Pecos drainages. We consider
that these results are unlikely to reflect reality for
several reasons. First the allele frequencies in the
reference samples that we provided are expected to
differ substantially from those that occurred in the true
parental populations at the time of the admixture event.
Second, we would expect a population containing 50%
genetic material from rainbow trout to exhibit evidence
of its hybrid origin in the morphological appearance of
its constituent individuals. With the exception of MPO,
and COW, which was previously suspected on the basis
of spotting pattern to contain some non-native genetic
material, the superficial morphology of fish in the
Canadian and Pecos test populations conforms to that
expected for pure O. c. virginalis (Y. Paroz, personal
communication).
Both approaches implemented in Admix frequently
resulted in estimated admixture coefficients less than 0
or greater than 1. This has been frequently observed in
other studies (Bertorelle and Excoffier 1998; Vernesi
et al. 2003; Choisy et al. 2004; Dupanloup et al. 2004;
Fraser and Bernatchez 2005), and is expected to occur
when the admixture model assumed by Admix is
violated, for example, when the allele frequencies in a
putative parental samples differ from those in the true
parental population, or when more than one admixture
event took place. A negative admixture coefficient for
a putative parental population indicates that it did not
plausibly contribute to the test population under con-
sideration. In a situation where populations are to be
placed in management categories according to their
level of non-native introgression, this phenomenon
further complicates the interpretation of results as,
when more that two parental taxa are involved, a
population with a native admixture coefficient of 1 can
also have a non-native admixture coefficient > 0. A
management agency might chose to estimate the level
of introgression in a population by taking only the
native admixture coefficient into account, or by sum-
ming all positive non-native admixture coefficients,
alternative approaches that could lead to the same
population being placed in different management cat-
egories, and hence subject to very different manage-
ment activities, on the basis of the same results. For
example, taking the former approach, and basing our
categories on admixture coefficients estimated using
the CO-RGCT reference sample, 18 of the 25 O. c.
virginalis populations in this study conform to the
‘Conservation’ category; taking the latter approach,
only 12 populations conform to this category.
In contrast to the results generated using Admix 2.0,
estimates of RGCT admixture coefficient using Struc-
ture were strongly influenced by the use of different
RGCT reference samples. Where no RGCT reference
sample was used, a ‘RGCT admixture coefficient’
(mean q8) >0.9 was estimated for every population
except Cabresto Creek. Notably, Indian Creek indi-
viduals were estimated to derive most of their ancestry
from population 8 rather than from the Yellowstone
cutthroat trout or Snake River cutthroat trout refer-
ence sample. This is not surprising: even though the
Indian Creek fish, on the basis of all other analyses,
appear to be introduced O. c. bouvieri, they are clearly
a distinct population from the Y/SRCT reference
populations, and Structure recognizes them as such.
Such a result demonstrates that mean q8 cannot nec-
essarily be assumed to approximate ‘RGCT admixture
coefficient’ when no RGCT reference sample is pro-
vided. Where Structure was provided with a RGCT
reference sample containing only genetic material from
the Rio Grande drainage, the majority of individuals
from Pecos and Canadian populations were estimated,
with the highest likelihood, to derive most of their
ancestry from Y/SRCT or rainbow trout. In contrast,
when the reference sample contained genetic material
from both the Rio Grande and Canadian drainages,
Conserv Genet
123

admixture coefficients estimated using Structure most
closely corresponded with those estimated using
Admix. Such variation in results when using two dif-
ferent RGCT reference samples emphasizes the
importance of taking into account possible genetic
differences between populations and drainages when
choosing putative parental reference populations for
the estimation of admixture coefficient. Oncorhynchus
clarkii virginalis populations in the Rio Grande
drainage are known to be moderately genetically dif-
ferentiated from those in the Pecos and Canadian
drainages, as can be noted from the presence of two
separate RGCT clusters in the FCA scattergraph
(Fig. 1, Pritchard and Cowley 2006). The low estimates
of RGCT admixture in populations from the Pecos and
Canadian drainages when using a reference sample
derived from the Rio Grande drainage alone are
clearly an artifactual result of the limited range of ge-
netic variation present in this sample. The poor reli-
ability of results when using this reference sample
could be inferred from the observation that replicate
runs of the MCMC frequently converged on different
solutions.
We chose to investigate admixture in O. c. virginalis
using five readily accessible approaches that had fre-
quently been applied in published studies on other taxa.
There are several alternative methods for estimating
admixture proportions from microsatellite data, appli-
cable to situations where more than two parental pop-
ulations have contributed to the admixed population,
that we have not explored in this paper. Wang (2003)
presents a maximum likelihood approach, implemented
in the program Leadmix, which estimates the contribu-
tion of two or more parental populations to an admixed
population, taking into account genetic drift in the
parental and admixed populations since the hybridiza-
tion event. This approach is highly applicable to the
situation considered here, and has been used to investi-
gate admixture involving two parental groups in several
taxa (Larsen et al. 2005; Belle et al. 2006; DeKoning
et al. 2006; Hansen et al. 2006). However we found Le-
admix to be extremely computationally intensive: for
most populations tested we terminated the program
after it had been running on a fast personal PC for sev-
eral weeks, but before it had reached a solution. We did
not, however, exhaustively investigate the reason for
these long run times. Excoffier et al. (2005) have re-
cently introduced an approach based on Approximate
Bayesian Computation which performs similarly to
Wang’s approach where the admixture event is recent,
and which we have not tested using our data. The pro-
gram BAPS 4.13 (Corander and Marttinen 2006)
implements a Bayesian approach to fulfil many of the
functions available in Structure, but with a more rapidly
performing algorithm. Although estimating admixture
levels using additional independent approaches may
improve our discrimination of relative levels of intro-
gression in different populations, we have no a-priori
reason to assume any quantitative admixture estimate is
less biased than any other, and hence we anticipate that
ambiguity in assigning populations to different genetic
management categories will remain.
Genetic status of O. c. virginalis populations
Although we are unable to unambiguously assign all
O. c. virginalis populations included in this study to a
specific genetic management category, as defined by
the Position Paper (Anonymous 2000), our results do
suggest that some populations are currently mis-cate-
gorized. For example, the putative ‘Core O. c. virgin-
alis’ population in Indian Creek actually appears to
consist entirely of introduced O. c. bouvieri. This
population is located in a closed basin and was previ-
ously believed to have originated from a transplant of
Rio Grande cutthroat trout from the adjacent Sacra-
mento Mountains, where the subspecies no longer oc-
curs (Behnke 1992). The population was utilized as a
source for an abandoned O. c. virginalis broodstock
project in the 1980s (Behnke 1992). It is unclear whe-
ther historically present Rio Grande cutthroat trout
were displaced by introduced O. c. bouvieri, or whether
O. c. virginalis never actually existed at this site.
Results presented in this paper also confirm that the
O. c. virginalis populations in Cabresto Creek, Cab-
resto Lake Fork, Cow Creek and Holden Prong all
contain substantial amounts of non-native genetic
material, and that the population in Middle Ponil is
also introgressed. Three of these populations were
already known to be hybridized from morphometric or
allozyme studies. We suggest that Cow Creek and
Holden Prong be re-assigned into the ‘Sportfish’ cate-
gory, while Cabresto Lake Fork should be removed
from the ‘Core’ category. It also appears that there is
some genetic material derived from O. c. bouvieri
present in several populations currently classified as
‘Core Conservation’ populations, in particular Rito del
Padre and Rio de las Vacas, and probably also Doctor
Creek. Such a result is not surprising: despite extensive
stocking of Yellowstone cutthroat trout into New
Mexico waters, no study has previously quantified
introgression from this taxon into native O. c. virginalis
and current genetic management categories are
assigned on the basis of hybridization with O. mykiss
only.
Conserv Genet
123

Encouragingly, at least six populations whose
genetic status was previously unknown or doubtful
(DAL, EST, MOR, MTR, OSH, UTE), and six pop-
ulations currently assigned to the ‘Core Conservation’
category (BIT, CAN, COL, ELR, PVA, RIC, VDZ,
VJO) appear to contain little or no non-native intro-
gression on the basis of our microsatellite data. We
also find little evidence for non-native genetic material
in the sample from Angostura Creek, previously clas-
sified as a ‘Sportfish’ population, probably because the
sample analysed here was taken from a population in
the upper stream reaches that was yet to be impacted
by the hybrid individuals downstream. It is notable that
the genetic integrity of these populations has largely
been retained despite records indicating previous
stocking of non-natives into many of these streams
(Table 1). In many cases this may be because stocking
occurred below a migration barrier that protected
upstream populations of O. c. virginalis. However it
may also indicate poor survival or reproduction of
introduced hatchery-reared fry. A similar pattern,
where the native gene pool has been largely retained
despite the intensive stocking of genetically divergent
hatchery strains, has been observed in some studies of
European brown trout (Garcıa-Marın et al. 1998;
Heggnes et al. 2002).
In contrast to results presented by Hitt et al. (2003)
and Rubidge and Taylor (2005), who noted rapid
spread of rainbow trout alleles into previously pure
populations of westslope cutthroat trout (O. c. lewisi),
we found little evidence for recent O. mykiss intro-
gression into populations that previously tested free of
genetic material from this taxon. Many extant O. c.
virginalis populations in New Mexico are protected
from non-native invasion by the presence of natural or
artificial migration barriers, some of which have been
constructed specifically to conserve ‘Core’ populations,
and these appear to have limited the further spread of
introgression despite ongoing introduction of non-na-
tive Oncorhynchus into adjacent waters. In contrast,
the observation of significant linkage disequilibrium
within samples from Cabresto Creek, Cow Creek and
Middle Ponil, three streams not currently protected as
‘Core Conservation’ populations, suggests that non-
native introgression into these populations may be
recent or ongoing.
Identification and management of introgressed
populations within threatened taxa
Management of introgression within taxa of conserva-
tion concern is the subject of ongoing political and sci-
entific debate (O’Brien and Mayr 1991; Allendorf et al.
2004, 2005; Campton and Kaeding 2005). There is
continuing controversy in many countries regarding the
status of hybrid individuals and populations under leg-
islation intended to protect threatened taxa. In Europe,
for example, the legal protection of the Scottish wildcat
(Felis silvestris) is ineffective due to difficulties in dis-
criminating pure individuals from those containing ge-
netic material from the domestic cat (Beaumont et al.
2001), and in the United States similar issues have
bedevilled the legal protection of, amongst other taxa,
wolves (Canus spp., Fredrickson and Hedrick 2006; Kyle
et al. 2006) and spotted owls (Strix occidentalis, Haig
et al. 2004). The situation is exemplified by the con-
trasting criteria used by the U.S. Fish and Wildlife Ser-
vice (USFWS) to enumerate populations of three
different cutthroat trout subspecies recently rejected for
protection under the U.S. Endangered Species Act.
When considering the status of the westslope cutthroat
trout, O. c. lewisi, the USFWS included all populations
containing < 20% non-native introgression within the
subspecies, on the basis that such populations were
phenotypically and behaviourally indistinguishable
from pure populations (Department of the Interior
2003). A similar status review for O. c. bouvieri included
all populations in the ‘Conservation’ category (generally
< 10% introgression), whilst the status review for O. c.
virginalis included only populations in the ‘Core Con-
servation’ category (< 1% introgression, Department of
the Interior 2002, 2006). In some cases, the level of
introgression which a threatened population is esti-
mated to contain can overwhelmingly influence that
population’s fate. For example, under the guidance of
the Position Paper on cutthroat trout management,
populations within either the ‘Conservation’ or ‘Sport-
fish’ category may be eliminated and replaced with wild
or broodstock fish originating from populations within
the ‘Core’ category. Similarly, populations of the fed-
erally listed Gila trout (O. gilae) containing ‘high per-
centages of hybrid individuals’ are not managed under
the Endangered Species Act and may be destroyed
(Porath and Nielsen 2003).
In such a context, it is important that the assessment of
introgression levels in a population of conservation
concern be as accurate as possible. This can be a difficult
task, even in cases where co-dominant, diagnostic
markers are available to discriminate the taxa of inter-
est. For example, an admixture estimate can be biased by
the sampling scheme: many taxa exhibit intra-popula-
tion structuring or non-random association of kin, hence
a genetic sample taken from a restricted area or a single
age-group may be unrepresentative of the population as
a whole (Hansen et al. 1997). Furthermore, alleles which
appear to be diagnostic in limited reference samples may
Conserv Genet
123

appear to become non-diagnostic as number of tested
individuals increases, in which case judgement as to
whether a shared allele represents recent hybridization
or ancestral polymorphism may be largely subjective. As
an additional complication, recommendations regarding
the management of introgression in threatened taxa may
be open to alternative interpretations. In the case of
cutthroat trout, it appears that the ‘Core Conservation’
category, as defined in the Position Paper (Anonymous
2000), was originally intended only to include those
populations with no detectable introgression: that is, no
non-native alleles are observed in the population sam-
ple, and the sample is of sufficient size that the upper
confidence limit of the population-wide estimate of
introgression is less than 1%. However, in some cases it
appears that management agencies include populations
in this category when the introgression level observed in
the sample is less than 1%, irrespective of the confidence
limits of the population estimate. As there is no theo-
retical reason to suppose that a population containing
0.9% genetic material from non-natives is at any less risk
from inbreeding depression than one containing 1.5%
genetic material, this approach renders the distinction
between ‘Core Conservation and ‘Conservation’ popu-
lations essentially arbitrary. Finally we note that the
relationship between admixture levels as estimated from
neutral genetic markers, and the proportion of coding
non-native genome within the native form, is poorly
understood.
In this paper, we have demonstrated that, within a
taxon of conservation concern, the estimated level of
non-native admixture, based on data from microsatellite
loci with overlapping allele size distributions between
the putative parental forms, can vary both with the sta-
tistical approach used and the reference samples pro-
vided. Although we have not explicitly addressed the
following issues, we would also expect a population-le-
vel admixture estimate to vary between different sam-
ples collected from the same stream, and with factors
such as the sampling scheme implemented, the size of
the sample collected and the number of loci used. In
some cases, decisions regarding the binning of micro-
satellite alleles or the pooling of reference samples may
also affect results. Clearly, when using such non-diag-
nostic and highly variable genetic markers to estimate
admixture, it is vitally important to compare results from
different analytical approaches and using different
parental references before coming to any conclusion
about the hybrid condition of a population. In cases
where management agencies wish to unambiguously
assign populations to management categories based on
threshold levels of introgression, continuing efforts to
develop diagnostic markers would be warranted.
Irrespective of whether or not available markers are
diagnostic, accurate assessment of the level of intro-
gression in a population also requires a carefully
designed sampling scheme. We urge further debate on
the implications of assigning populations to such rigidly
defined management categories. In particular, we note
that populations of threatened taxa containing some
non-native genetic material may also contain native
genetic diversity not present in other populations.
Hence the rationale for eliminating these populations
and replacing them with ‘pure’ stock should be carefully
considered, especially in cases where assessment of
introgression levels is difficult and the definition
of stocks considered ‘pure’ is open to alternative
interpretations.
Acknowledgements This research was funded by New MexicoDepartment of Game and Fish through the Federal Aid in SportFish Restoration Act, and by the New Mexico AgriculturalExperiment Station. We are grateful to personnel of ColoradoDivision of Wildlife, NMDGF and the United States ForestService who collected tissue samples, and staff of Genetic Iden-tification Services who provided technical support. Special thanksgo to Yvette Paroz, Kirk Patten and John Alves for providingdata and advice. Comments from Daniel Ruzzante and threeanonymous referees substantially improved the manuscript.
References
Allendorf FW, Leary RF, Hitt NP, Knudsen KL, Boyer MC,Spruell P (2005) Cutthroat trout hybridization and the U.S.Endangered Species Act: one species, two policies. ConservBiol 19:1326–1328
Allendorf FW, Leary RF, Hitt NP, Knudsen KL, Lundquist LL,Spruell P (2004) Intercrosses and the U.S. EndangeredSpecies Act: should hybridized populations be included aswestslope cutthroat trout? Conserv Biol 18:1203–1213
Allendorf FW, Leary RF, Spruell P, Wenburg JK (2001) Theproblems with hybrids: setting conservation guidelines.Trend Ecol Evol 16:613–622
Anonymous (2000) Cutthroat trout management: a positionpaper. Publication Number 00–26, Utah Division of WildlifeResources. Available: http://www.wildlife.utah.gov/fishing/pdf/cutthroat_genetics.pdf. Cited 13 Aug 2006
Bartley D, Bagley M, Gall G, Bentley B (1992) Use of linkagedisequilibrium data to estimate effective size of hatcheryand natural fish populations. Conserv Biol 6:365–375
Beaumont MA, Barratt EM, Gottelli D, Kitchener AC, DanielsMJ, Pritchard JK, Bruford MW (2001) Genetic diversity andintrogression in the Scottish wildcat. Mol Ecol 10:319–336
Behnke RJ (1992) Native trout of western North America.American Fisheries Society Monograph 6, Bethesda, MD
Belkhir K, Borsa P, Chiki L, Raufaste N, Bonhomme F (2001)GENETIX 4.02, logiciel sous Windows TM pour la gene-tique des populations. Laboratoire Genome, Populations,Interactions CNRS UMR 5000, Universite de MontpellierII, Montpellier (France)
Belle EMS, Landy P-A, Barbujani G (2006) Origin and evolu-tion of the Europeans’ genome: evidence from multiplemicrosatellite loci. Proc R Soc Lond B 273:1595–1602
Conserv Genet
123

Bertorelle G, Excoffier L (1998) Inferring admixture propor-tions from molecular data. Mol Biol Evol 15:1298–1311
Brunner PC, Douglas MR, Bernatchez L (1998) Microsatelliteand mitochondrial DNA assessment of population structureand stocking effects in Arctic charr Salvelinus alpinus(Teleostei: Salmonidae) from central Alpine lakes. MolEcol 7:209–223
Campton DE, Kaeding LR (2005) Westslope cutthroat trout,hybridization and the U.S. Endangered Species Act.Conserv Biol 19:1325–1327
Chakraborty R (1986) Gene admixture in human populations:models and predictions. Yearb Phys Anthropol 29:1–43
Chan C, Ballantyne KN, Aikman H, Fastier D, Daugherty CH,Chambers GK (2006) Genetic analysis of interspecifichybridization in the world’s only Forbes’ parakeet (Cyan-oramphus forbesi) natural population. Conserv Genet7:493–506
Chapman RW, Sedberry GR, Koenig CC, Eleby BM (1999)Stock identification of gag, Mycteroperca microlepis, alongthe southeast coast of the United States. Mar Biotechnol1:137–146
Choisy M, Franck P, Cornuet JM (2004) Estimating admixtureproportions with microsatellites: comparison of methodsbased on simulated data. Mol Ecol 13:955–968
Corander J, Marttinen P (2006) Bayesian identification ofadmixture events using multilocus molecular markers. MolEcol 15:2833–2843
Cornuet JM, Piry S, Luikart G, Estoup A, Solignac M (1999).New methods employing multilocus genotypes to select orexclude populations as origins of individuals. Genetics153:1989–2000
Daniels MJ, Balharry D, Hirst D, Kitchener AC, Aspinall RJ(1998) Morphological and pelage characteristics of wild-living cats in Scotland: implications for defining the ‘wild-cat.’ J Zool Lond 244:231–247
DeKoning J, Keatley K, Phillips R, Rhydech J, Janssen J,Noakes M (2006) Genetic analysis of wild lake troutembryos recovered from Lake Michigan. Trans Am FishSoc 135:399–407
Department of the Interior (2002) Endangered and threatenedwildlife and plants: candidate status review for RioGrande cutthroat trout. Fed Reg 67:39936–39947
Department of the Interior (2003) Endangered and threatenedwildlife and plants: reconsidered finding for an amendedpetition to list the westslope cutthroat trout as threatenedthroughout its range. Fed Reg 68:46989–47009
Department of the Interior (2006) Endangered and threatenedwildlife and plants: 12 month finding for a petition to list theYellowstone cutthroat trout as threatened. Fed Reg71:8818–8831
Dupanloup WE, Bertorelle G (2001) Inferring admixtureproportions from molecular data: extension to any numberof parental populations. Mol Biol Evol 18:672–675
Dupanloup WE, Bertorelle G, Chikhi L, Barbujani G (2004)Estimating the impact of prehistoric admixture on thegenome of Europeans. Mol Biol Evol 21:1361–1372
Edmands S (1999) Heterosis and outbreeding depression ininterpopulation crosses spanning a wide range of diver-gence. Evolution 53:1757–1768
Epifanio J, Nielsen J (2000) The role of hybridization in thedistribution, conservation and management of aquatic spe-cies. Rev Fish Biol Fisher 10:245–251
Evanno G, Regnaut S, Goudet J (2005) Detecting the number ofclusters of individuals using the software structure: simula-tion study. Mol Ecol 14:2611–2620
Excoffier L, Estoup A, Cornuet J-M (2005) Bayesian analysisof an admixture model with mutations and arbitrarilylinked markers. Genetics 169:1727–1738
Fraser D, Bernatchez L (2005) Allopatric origins of sympatricbrook charr populations: colonization history and admix-ture. Mol Ecol 14:1497–1510
Fredrickson RJ, Hedrick PW (2006) Dynamics of hybridizationand introgression in red wolves and coyotes. Conserv Biol20:1272–1283
Freeman AR, Meghan CM, MacHugh DE, Loftus T, AchukwiMD, Bado A, Sauveroche B, Bradley DG (2004) Admixtureand diversity in West African cattle populations. Mol Ecol13:3477–3487
Fumagalli L, Snoj A, Jesensek D, Balloux F, Jug T, Duron O,Brossier F, Crivelli AJ, Berrebi P (2002) Extreme geneticdifferentiation among the remnant populations of marble trout(Salmo marmoratus) in Slovenia. Mol Ecol 11:2711–2716
Garcıa-Marın JL, Sanz L, Pla C (1998) Proportions of native andintroduced brown trout in adjacent fished and unfishedSpanish rivers. Conserv Biol 12:313–319
Gilk SE, Wang IA, Hoover CL, Smoker WW, Taylor SG, GrayAK, Gharrett AJ (2004) Outbreeding depression in hybridsbetween spatially separated pink salmon, Oncorhynchusgorbuscha, populations: marine survival, homing ability, andvariability in family size. Environ Biol Fish 69:287–297
Haig SM, Thomas D, Mullins TD, Forsman Ed, Trail PW,Wennerberg L (2004) Genetic identification of SpottedOwls, Barred Owls, and their hybrids: legal implications ofhybrid identity. Conserv Biol 18:1347–1357
Hansen MM, Jensen LF (2005) Sibship within samples of browntrout Salmo trutta and implications for supportive breeding.Conserv Genet 6:297–305
Hansen MM, Neilsen EE, Bekkevold D, Jensen LF, MensbergK-LD (2006) Genetic restoration of a stocked brown trout(Salmo trutta) population using microsatellite DNA analysisof historic and contemporary samples. J App Ecol 43:669–679
Hansen MM, Neilsen EE, Bekkevold D, Mensberg K-LD (2001)Admixture analysis and stocking impact assessment inbrown trout (Salmo trutta), estimated with incompletebaseline data. Can J Fish Aquat Sci 58:1853–1860
Hansen MM, Nielsen EE, Mensberg K–LD (1997) The problemof sampling families rather than populations: relatednessamong individuals in samples of juvenile brown trout Salmotrutta L. Mol Ecol 6:469–474
Heggnes J, Røed KH, Høyheim B, Rosef L (2002) Microsatellitediversity assessment of brown trout (Salmo trutta) popula-tion structure indicate limited genetic impact of stocking in aNorwegian alpine lake. Ecol Freshw Fish 11:93–100
Hitt NP, Frissell CA, Muhlfeld CC, Allendorf FW (2003) Spreadof hybridization between native westslope cutthroat trout,Oncorhynchus clarki lewisi, and nonnative rainbow trout,Oncorhynchus mykiss. Can J Fish Aquat Sci 60:1440–1451
Huxel GR (1999) Rapid displacement of native species byinvasive species: effect of hybridization. Biol Conserv89:143–152
Jensen AB, Palmer KA, Boomsma JJ, Pedersen BV (2005)Varying degrees of Apis mellifera ligustica introgression inprotected populations of the black honeybee, Apis melliferamellifera, in northwest Europe. Mol Ecol 14:93–106
Kanda N, Leary RF, Spruell P, Allendorf FW (2002) Moleculargenetic markers identifying hybridization between theColorado River- greenback cutthroat trout complex andYellowstone cutthroat trout or rainbow trout. Trans AmFish Soc 131:312–319
Conserv Genet
123

Keeler-Foster CL (2003) Rio Grande cutthroat trout (Oncorhyn-chus clarki virginalis): population genetics and hybridizationwith introduced rainbow trout (Oncorhynchus mykiss).Ph.D. thesis, New Mexico State University
Kinnison MT, Bentzen P, Unwin MJ, Quinn TP (2002) Recon-structing recent divergence: evaluating nonequilibriumpopulation structure in New Zealand chinook salmon. MolEcol 11:739–754
Kruse CG, Hubert WA, Rahel FJ (2000) Status of Yellowstonecutthroat trout in Wyoming waters. N Am J Fish Manage20:693–705
Kyle CJ, Johnson AR, Patterson BR, Wilson RJ, Shamai K,Grewal SK, White BN (2006) Genetic nature of easternwolves: past, present and future. Conserv Genet 7:273–287
Larsen PF, Hansen MM, Nielsen EE, Jensen LF, Loeschcke V(2005) Stocking impact and temporal stability of geneticcomposition in a brackish northern pike population (Esoxlucius L.), assessed using microsatellite DNA analysis ofhistorical and contemporary samples. Heredity 95:136–143
Machordom A, Garcıa-Marın JL, Sanz N, Almodovar A, Pla C(1999) Allozyme diversity in brown trout (Salmo trutta)from central Spain: genetic consequences of restocking.Freshw Biol 41:707–717
Marr AB, Keller LF, Arcese P (2002) Heterosis and outbreedingdepression in descendants of natural immigrants to aninbred population of song sparrows (Melospiza melodia).Evolution 56:131–142
Montalvo AM, Ellstrand NC (2001) Nonlocal transplantationand outbreeding depression in the subshrub Lotus scoparius(Fabaceae). Am J Bot 88:258–269
Nei M (1978) Estimation of average heterozygosity and geneticdistance from a small number of individuals. Genetics89:583–590
Nei M, Li WH (1973) Linkage disequilibrium in subdividedpopulations. Genetics 75:213–219
New Mexico Department of Game, Fish (2002) Long range planfor the management of Rio Grande cutthroat trout in NewMexico. Santa Fe, NM
O’Brien SJ, Mayr E (1991) Species hybridization and protectionof endangered animals. Science 253:251–252
Peacock MM, Kirchoff VS (2004) Assessing the conservationvalue of hybridized cutthroat trout populations. Trans AmFish Soc 133:309–325
Perry WL, Lodge DM, Feder JL (2002) Importance of hybrid-ization between indigenous and nonindigenous freshwaterspecies: an overlooked threat to North American biodiver-sity. Syst Zool 51:255–275
Porath MT, Neilsen JL (2003) Evidence of sexually dimorphicintrogression in Pinaleno Mountain Apache trout. N Am JFish Manage 23:172–180
Pritchard JK, Stephens M, Donnelly P (2000) Inference ofpopulation structure using multilocus genotype data. Genet-ics 155:945–959
Pritchard VL, Cowley DE (2006) Rio Grande cutthroat trout(Oncorhynchus clarkii virginalis): a technical conservationassessment. USDA Forest Service, Rocky Mountain Re-gion. Available:http://www.fs.fed.us/r2/projects/scp/assess-ments/riograndecutthroattrout.pdf. Cited 13 Aug 2006
Pritchard VL, Jones K, Cowley DE (in press a) Genetic diversityin fragmented cutthroat trout populations. Trans Am FishSoc doi 10.1111/j.1471-8286.2007.01695.x
Pritchard VL, Jones K, Metcalf JL, Martin A, Wilkinson P,Cowley DE (in press b) Characterization of tetranucleotidemicrosatellites for Rio Grande cutthroat trout (Oncorhyn-
chus clarkii virginalis) and rainbow trout (O. mykiss), andtheir cross-amplification in other cutthroat trout subspecies.Mol Ecol Notes
Rannala B, Mountain JL (1997) Detecting immigration by usingmultilocus genotypes. Proc Natl Acad Sci USA 94:9197–9201
Raymond M, Rousset F (1995) GENEPOP (version 1.2):population genetics software for exact tests and ecumeni-cism. J Hered 86:248–249
Rhymer JM, Simberloff D (1996) Extinction by hybridizationand introgression. Ann Rev Ecol Syst 27:83–109
Roques S, Sevigny J-M, Bernatchez L (2001) Evidence forbroadscale introgressibve hybridization between two redfish(genus Sebastes) in the North-west Atlantic: a rare marineexample. Mol Ecol 10:149–165
Rosenfield JA, Nolasco S, Lindauer S, Sandoval C, Kodric-Brown A (2004) The role of hybrid vigor in the replacementof Pecos pupfish by its hybrids with sheepshead minnow.Conserv Biol 18:1589–1598
Rubidge EM, Taylor EB (2005) An analysis of spatial andenvironmental factors influencing hybridization betweennative westslope cutthroat trout (Oncorhynchus clarkiilewisi) and introduced rainbow trout (O. mykiss) in theupper Kootenay River drainage, British Columbia. ConservGenet 6:369–384
She J-X, Autem M, Kotoulas G, Pasteur N, Bonhomme F (1987)Multivariate analysis of genetic exchanges between Soleaaegyptiaca and Solea senegalensis (Teleosts, Soleidae). BiolJ Linn Soc 32:357–371
Taylor EB, Tamkee P, Sterling G, Hughson W (2007) Microsat-ellite DNA analysis of rainbow trout (Oncorhynchusmykiss) from western Alberta, Canada: native status andevolutionary distinctiveness of ‘‘Athabasca’’ rainbow trout.Conserv Genet 8:1–15
Utter F (2001) Patterns of subspecific anthropogenic introgres-sion in two salmonid genera. Rev Fish Biol Fisher 10:265–279
van Oosterhout C, Hutchinson WF, Wills DPM, Shipley P (2004)Micro-checker: software for identifying and correctinggenotyping errors in microsatellite data. Mol Ecol Notes4:535–538
Vernesi C, Crestanello B, Pecchioloi E, Tartari D, Caramelli D,Hauffe H, Bertorelle G (2003) The genetic impact ofdemographic decline and reintroduction in the wild boar(Sus scrofa): a microsatellite analysis. Mol Ecol 12:585–595
Wang J (2003) Maximum-likelihood estimation of admixtureproportions from genetic data. Genetics 164:747–765
Wares JP, Alo D, Turner TF (2004) A genetic perspective onmanagement and recovery of federally endangered trout(Oncorhynchus gilae) in the American Southwest. Can JFish Aquat Sci 61:1890–1899
Weigel DE, Peterson JT, Spruell P (2002) A model usingphenotypic characteristics to detect introgressive hybridiza-tion in wild westslope cutthroat trout and rainbow trout.Trans Am Fish Soc 131:389–403
Weir BS, Cockerham CC (1984) Estimating F-statistics for theanalysis of population structure. Evolution 38:1358–1370
Wofford JB, Gresswell RE, Banks MA 2005. Influence ofbarriers to movement on within-watershed genetic variationof coastal cutthroat trout. Ecol Appl 15:628–637
Wolf DE, Takebayashi N, Rieseberg LH (2001) Predicting therisk of extinction through hybridization. Conserv Biol15:1039–1053
Conserv Genet
123