Applying microsatellites to the management of farmed turbot stocks ( Scophthalmus maximus L.) in...
18
Applying microsatellites to the management of farmed turbot stocks (Scophthalmus maximus L.) in hatcheries Yaisel Juan Borrell a,b , Jorge A ´ lvarez a , Emilia Va ´zquez a , Carlos Ferna ´ndez Pato c , Concha Martı ´nez Tapia c , Jose ´ Antonio Sa ´nchez a , Gloria Blanco a, * a Laboratorio de Gene ´tica Acuı ´cola, Departamento de Biologı ´a Funcional, Universidad de Oviedo, 33071 Oviedo, Spain b Departamento de Bioquı ´mica, Universidad de la Habana, Calle 25 entre J e I. # 455, Vedado, Plaza, Ciudad de la Habana, Cuba c I.E.O. Planta de Experimentacio ´n en Acuicultura bEl BocalQ, Apdo. 240, 39080 Santander, Spain Received 5 April 2004; received in revised form 19 August 2004; accepted 23 August 2004 Abstract Eight microsatellite loci reported previously to exhibit high levels of variability were assessed for their utility for determining pedigrees in five turbot (Scophthalmus maximus L.) broodstocks from two hatcheries in Spain and for estimating genetic relatedness between pairs of individuals with unknown origin through relatedness coefficients. Discrepancies were found among expected levels of correct parentage assignment obtained by simulation procedures (using Cervus or Probmax) and those obtained working with real descendants. Besides the genetic variability levels found in broodstocks, other factors such as mutation, occurrence of null alleles and genetic similarities among parents of the same sex significantly affected parentage assignment test results. On the other hand, selection of breeding pairs for avoiding inbreeding in progenies would be possible with more than 80% accuracy using relatedness coefficients below zero as the cut-off between the selected 0044-8486/$ - see front matter D 2004 Elsevier B.V. All rights reserved. doi:10.1016/j.aquaculture.2004.08.021 * Corresponding author. Tel.: +34 985 103889; fax: +34 985 103534. E-mail address: [email protected] (G. Blanco). Aquaculture 241 (2004) 133 – 150 www.elsevier.com/locate/aqua-online
-
Upload
independent -
Category
Documents
-
view
4 -
download
0
Transcript of Applying microsatellites to the management of farmed turbot stocks ( Scophthalmus maximus L.) in...
Aquaculture 241 (2004) 133–150
www.elsevier.com/locate/aqua-online
Applying microsatellites to the management of
farmed turbot stocks (Scophthalmus maximus L.)
in hatcheries
Yaisel Juan Borrella,b, Jorge Alvareza, Emilia Vazqueza,
Carlos Fernandez Patoc, Concha Martınez Tapiac,
Jose Antonio Sancheza, Gloria Blancoa,*
aLaboratorio de Genetica Acuıcola, Departamento de Biologıa Funcional,
Universidad de Oviedo, 33071 Oviedo, SpainbDepartamento de Bioquımica, Universidad de la Habana, Calle 25 entre J e I. # 455, Vedado, Plaza,
Ciudad de la Habana, CubacI.E.O. Planta de Experimentacion en Acuicultura bEl BocalQ, Apdo. 240, 39080 Santander, Spain
Received 5 April 2004; received in revised form 19 August 2004; accepted 23 August 2004
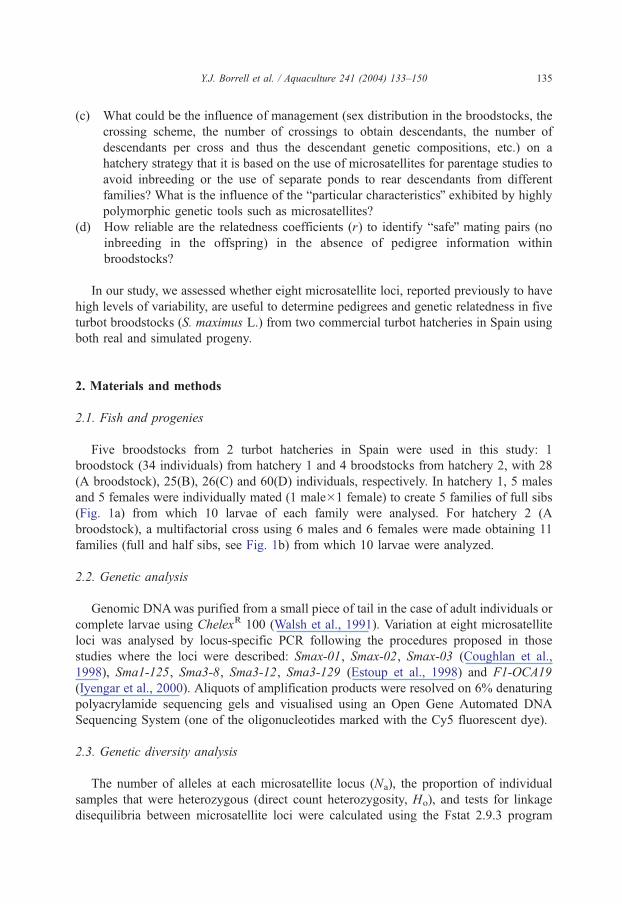
Abstract
Eight microsatellite loci reported previously to exhibit high levels of variability were assessed for
their utility for determining pedigrees in five turbot (Scophthalmus maximus L.) broodstocks from
two hatcheries in Spain and for estimating genetic relatedness between pairs of individuals with
unknown origin through relatedness coefficients. Discrepancies were found among expected levels
of correct parentage assignment obtained by simulation procedures (using Cervus or Probmax) and
those obtained working with real descendants. Besides the genetic variability levels found in
broodstocks, other factors such as mutation, occurrence of null alleles and genetic similarities among
parents of the same sex significantly affected parentage assignment test results. On the other hand,
selection of breeding pairs for avoiding inbreeding in progenies would be possible with more than
80% accuracy using relatedness coefficients below zero as the cut-off between the selected
0044-8486/$ -
doi:10.1016/j.
* Corresp
E-mail add
see front matter D 2004 Elsevier B.V. All rights reserved.
aquaculture.2004.08.021
onding author. Tel.: +34 985 103889; fax: +34 985 103534.
ress: [email protected] (G. Blanco).
Y.J. Borrell et al. / Aquaculture 241 (2004) 133–150134
individuals. In summary, microsatellite markers are useful tools for parentage studies in hatcheries
but their efficacy is not based only on the genetic variability found.
D 2004 Elsevier B.V. All rights reserved.
Keywords: Microsatellite loci; Turbot; Scophthalmus maximus; Aquaculture; Parentage; Relatedness; Pedigrees;
Cervus; Probmax
1. Introduction
The turbot Scophthalmus maximus (L.) is a commercially important flatfish with a wide
distribution throughout the eastern North Atlantic and Mediterranean Sea. The popularity
of this species in some fish markets and the significant decrease of wild catches over the
last decade have promoted an increase in hatchery-reared turbot production in European
countries (Josupeit, 1996; Coughlan et al., 1998). In 2000, Spain produced 70.3% (3650
mt) of the total European hatchery turbot production (Spanish General Secretariat of
Marine Fishing), but other countries like France and Norway are rapidly increasing their
turbot hatchery production. As a consequence of farmer’s interest in turbot production
after culture methodology was established, requests came to biologists and geneticists to
apply molecular tools to turbot breeding programs.
Genetic gains from a selective breeding program depend upon genetic variation,
selection intensity and heritability of the trait. High selection intensities can be practiced at
both family and individual level in fish; however, increases in inbreeding should be kept to
a minimum by avoiding mating of related individuals (Kincaid, 1983; Gjerde et al., 1983;
Su et al., 1996). In order to have pedigreed progeny from fish families, progeny groups
must be reared separately until they are large enough to be tagged using physical methods.
This approach is cost-, space- and labour-intensive and affordable under laboratory
conditions, but not at production farms. Recently, parentage assignment using genetic
markers has been suggested for use in aquaculture (Estoup et al., 1998; Norris et al., 2000;
Jackson et al., 2003). DNA microsatellites make possible retrospective assignment of
individuals to family groups reared communally (Garcıa de Leon et al., 1998; Estoup et al.,
1998; Perez-Enriquez et al., 1999; Norris et al., 2000; Sekino et al., 2003; Jackson et al.,
2003), or estimation of relatedness between pairs of individuals among different progeny
(Queller and Goodnight, 1989; Blouin et al., 1996; Norris et al., 2000). They also make
possible comparison of viability of offspring of different parental origins without bias from
unknown variations in laboratory systems or farm environments (Herbinger et al., 1999;
Selvamani et al., 2001; Boudry et al., 2002). However, some topics need still to be
empirically assessed or confirmed:
(a) Would a set of microsatellite loci, previously tested in wild populations and found
highly polymorphic, be useful for parentage studies in a particular hatchery? Would
they be equally useful for managing all broodstocks in the hatchery?
(b) Should predictions about the utility of a set of microsatellite loci for parentage
studies, and improving hatchery management, be done taking into account only the
levels of genetic variation found in a broodstock? How close to reality are simulation
procedures for parentage assignment included in software such as Cervus?
Y.J. Borrell et al. / Aquaculture 241 (2004) 133–150 135
(c) What could be the influence of management (sex distribution in the broodstocks, the
crossing scheme, the number of crossings to obtain descendants, the number of
descendants per cross and thus the descendant genetic compositions, etc.) on a
hatchery strategy that it is based on the use of microsatellites for parentage studies to
avoid inbreeding or the use of separate ponds to rear descendants from different
families? What is the influence of the bparticular characteristicsQ exhibited by highly
polymorphic genetic tools such as microsatellites?
(d) How reliable are the relatedness coefficients (r) to identify bsafeQ mating pairs (no
inbreeding in the offspring) in the absence of pedigree information within
broodstocks?
In our study, we assessed whether eight microsatellite loci, reported previously to have
high levels of variability, are useful to determine pedigrees and genetic relatedness in five
turbot broodstocks (S. maximus L.) from two commercial turbot hatcheries in Spain using
both real and simulated progeny.
2. Materials and methods
2.1. Fish and progenies
Five broodstocks from 2 turbot hatcheries in Spain were used in this study: 1
broodstock (34 individuals) from hatchery 1 and 4 broodstocks from hatchery 2, with 28
(A broodstock), 25(B), 26(C) and 60(D) individuals, respectively. In hatchery 1, 5 males
and 5 females were individually mated (1 male�1 female) to create 5 families of full sibs
(Fig. 1a) from which 10 larvae of each family were analysed. For hatchery 2 (A
broodstock), a multifactorial cross using 6 males and 6 females were made obtaining 11
families (full and half sibs, see Fig. 1b) from which 10 larvae were analyzed.
2.2. Genetic analysis
Genomic DNAwas purified from a small piece of tail in the case of adult individuals or
complete larvae using ChelexR 100 (Walsh et al., 1991). Variation at eight microsatellite
loci was analysed by locus-specific PCR following the procedures proposed in those
studies where the loci were described: Smax-01, Smax-02, Smax-03 (Coughlan et al.,
1998), Sma1-125, Sma3-8, Sma3-12, Sma3-129 (Estoup et al., 1998) and F1-OCA19
(Iyengar et al., 2000). Aliquots of amplification products were resolved on 6% denaturing
polyacrylamide sequencing gels and visualised using an Open Gene Automated DNA
Sequencing System (one of the oligonucleotides marked with the Cy5 fluorescent dye).
2.3. Genetic diversity analysis
The number of alleles at each microsatellite locus (Na), the proportion of individual
samples that were heterozygous (direct count heterozygosity, Ho), and tests for linkage
disequilibria between microsatellite loci were calculated using the Fstat 2.9.3 program
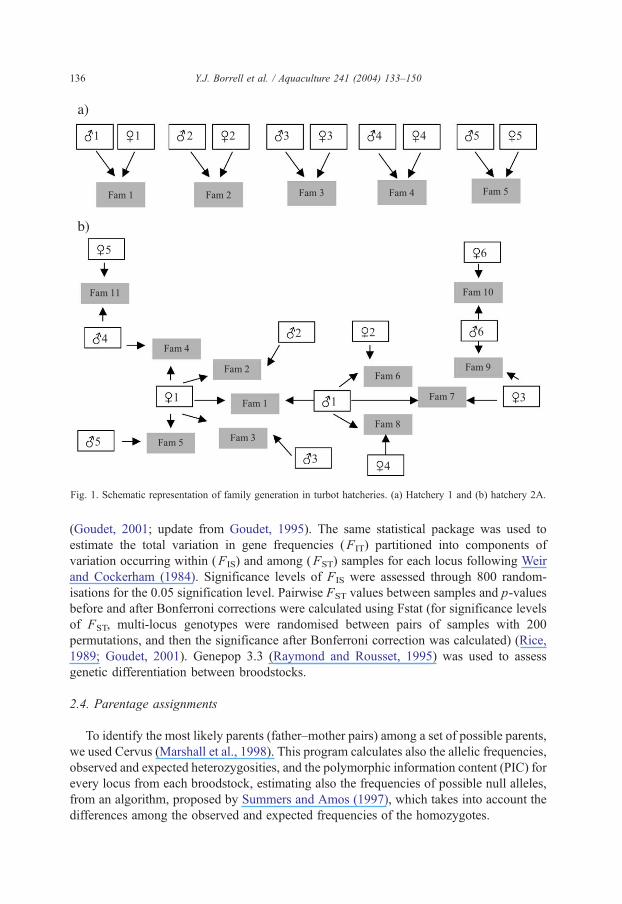
Fig. 1. Schematic representation of family generation in turbot hatcheries. (a) Hatchery 1 and (b) hatchery 2A.
Y.J. Borrell et al. / Aquaculture 241 (2004) 133–150136
(Goudet, 2001; update from Goudet, 1995). The same statistical package was used to
estimate the total variation in gene frequencies (FIT) partitioned into components of
variation occurring within (FIS) and among (FST) samples for each locus following Weir
and Cockerham (1984). Significance levels of FIS were assessed through 800 random-
isations for the 0.05 signification level. Pairwise FST values between samples and p-values
before and after Bonferroni corrections were calculated using Fstat (for significance levels
of FST, multi-locus genotypes were randomised between pairs of samples with 200
permutations, and then the significance after Bonferroni correction was calculated) (Rice,
1989; Goudet, 2001). Genepop 3.3 (Raymond and Rousset, 1995) was used to assess
genetic differentiation between broodstocks.
2.4. Parentage assignments
To identify the most likely parents (father–mother pairs) among a set of possible parents,
we used Cervus (Marshall et al., 1998). This program calculates also the allelic frequencies,
observed and expected heterozygosities, and the polymorphic information content (PIC) for
every locus from each broodstock, estimating also the frequencies of possible null alleles,
from an algorithm, proposed by Summers and Amos (1997), which takes into account the
differences among the observed and expected frequencies of the homozygotes.
Y.J. Borrell et al. / Aquaculture 241 (2004) 133–150 137
The PIC (Botstein et al., 1980) is a metric which characterizes how informative a
genetic marker is; it was defined for measuring the usefulness of a codominant genetic
marker to identify the allele, transmitted by an heterozygote parent which is affected from
a genetic disease, whose expression is from the dominant allele. PIC is always smaller than
the heterozygosity, as some crossings among heterozygous individuals may not be
informative. For a locus with k alleles, PIC can be calculated as:
PIC ¼ 2Xk�1
i¼1
Xk
j¼iþ1
pipj 1� pipj� �
where pi is the population frequency of the i-th allele and k is the total number of alleles.
The program Cervus can carry out a simulation to assess the significance of D values
(LOD difference). This program emulate the steps of paternity inference using allele
frequencies at loci screened and predicts the success rate of paternity analysis using
relaxed (80%) and strict (95%) criteria from D distribution. Thus, when working with real
data (descendants and parents), each descendant is assigned to the most-likely parent
(maximum LOD with significant D value).
Three different levels of assignment were assessed in this work and compared:
(a) The theoretical predictions of correct assignments in case of unknown parents using
allelic frequencies found in each broodstock under study (Cervus 1.0) (10,000
iterative simulation cycles of assignments). This value could be interpreted as a
measure of the markers’ efficiency for parentage studies, we sought to assess how
well it works in real situations?
(b) Correct assignment of bvirtualQ descendants generated using Probmax 1.02 routines
(Danzmann, 1997). In this case, we generated 250 descendants from 25 families (all
possible families from mating of 5 males and 5 females selected by random from
hatchery 1), and they were assigned among the 34 individuals that form the
broodstock in this hatchery. The most probable fathers (maximum LOD), after Cervus
assignation, were compared with the real parents to determine the percentage of
correct assignment. The same procedure was made for the four broodstocks from
hatchery 2. All bvirtualQ descendants were then assigned among the 28, 25, 26 and 60
individuals that form the four broodstocks in hatchery 2 (A, B, C and D, respectively).
(c) Correct assignment of both parents to the real descendants obtained through mating
of individuals in each hatchery (see fish and progenies). Fifty descendants from 5
families were assigned among 34 individuals in hatchery 1, and 108 descendants
from 11 families were assigned among 28 individuals that from broodstock A of
hatchery 2. Again, the most probable fathers (maximum LOD), after Cervus
assignation, were compared with the real parents to determine the percentage of
correct assignment.
2.5. Genetic relatedness
Relatedness (Queller and Goodnight, 1989) is a package that calculates average genetic
relatedness among sets of individuals defined by demographic variables, either on average
Y.J. Borrell et al. / Aquaculture 241 (2004) 133–150138
or by pairs. Relatedness, r, is estimated as:
r ¼
X
x
X
k
X
l
Fqy � Fq4� �
X
x
X
k
X
l
Fqx � Fq4ð Þ:
Where x is individuals, k loci and l allelic positions (E.g.: l=1 for haploid individuals
and 2 for diploid individuals). The variables in the equation are: Fqx: frequency, found in
the x individual, locus k and allelic position l (this frequency value in a diploid individual
must be 0, 0.5 or 1.0); Fqy: frequency of the same allele in the group of individuals with
which x is compared (those whose genetic relationship we seek to measure); Fq*:
frequency of this allele in all population, excluding al possible relations of x.
Theoretically, full-sib individuals share, on average, 50% of their genome constitution
and hence the reladtedness coefficient (r) among them should be near 0.5, while for pairs
of half-sibs, it is expected that rc0.25 and among pairs of unrelated individuals rc0
(Queller and Goodnight, 1989). We used this program to estimate r values among pairs of
offspring (in real progenies and also in those progenies generated by Probmax). Since the
degrees of genetic relationship that exists among them is known (full-sibs, half-sibs and
unrelated individuals), it is possible then to analyse whether there is concordance between
r values and the real genetic relatedness that exists among individuals. This evaluation is
then useful to see how reliable are r values to identify bsafeQ mating pairs (no inbreeding in
the offspring) in the absence of pedigree information within broodstocks in hatcheries.
2.6. Statistical procedures
The linear regression analysis and the regression curves estimates included in the SPSS
statistical package (version 10) were used to assess the influence of various parameters
(number of crosses carried out to obtain offspring, PIC, number of alleles present, etc.) on
the correct assignment percentages found. For the comparison of means, a simple ANOVA
included in the same statistic package was used, using the Bonferroni test for post-hoc
multiple comparison after tests for equal variances (SPSS, 10.0).
3. Results
3.1. Genetic variation in turbot broodstocks
Levels of genetic variability found in hatcheries 1 and 2 are presented in Table 1.
Among the three parameters used to compare genetic variability levels (mean number of
alleles per locus (Na), observed heterozygosity (Ho) and PIC), two (Na, PIC) exhibited
significant differences between broodstocks (Na: F=4.260, P=0.007; PIC: F=6.338,
P=0.001). Observed heterozygosity levels were not significantly different between groups
(Ho: F=2.037, P=0.110). The Bonferroni test used for post-hoc comparisons revealed that
differences in Na were detected between the hatchery 1 broodstock and the D broodstock
from hatchery 2 (P=0.017) and between the C and D broodstocks from hatchery 2
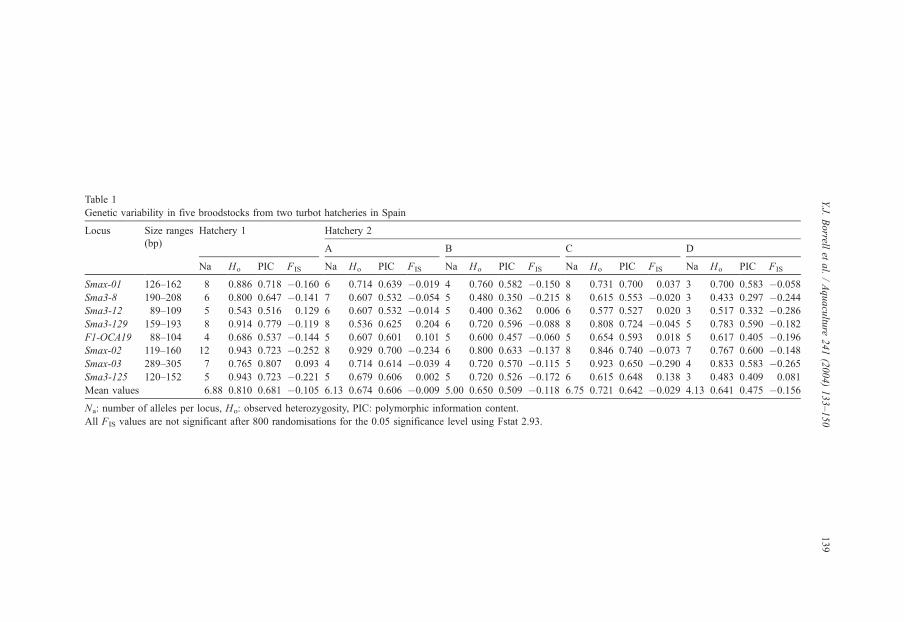
Table 1
Genetic variability in five broodstocks from two turbot hatcheries in Spain
Locus Size ranges Hatchery 1 Hatchery 2
(bp)A B C D
Na Ho PIC FIS Na Ho PIC FIS Na Ho PIC FIS Na Ho PIC FIS Na Ho PIC FIS
Smax-01 126–162 8 0.886 0.718 �0.160 6 0.714 0.639 �0.019 4 0.760 0.582 �0.150 8 0.731 0.700 0.037 3 0.700 0.583 �0.058
Sma3-8 190–208 6 0.800 0.647 �0.141 7 0.607 0.532 �0.054 5 0.480 0.350 �0.215 8 0.615 0.553 �0.020 3 0.433 0.297 �0.244
Sma3-12 89–109 5 0.543 0.516 0.129 6 0.607 0.532 �0.014 5 0.400 0.362 0.006 6 0.577 0.527 0.020 3 0.517 0.332 �0.286
Sma3-129 159–193 8 0.914 0.779 �0.119 8 0.536 0.625 0.204 6 0.720 0.596 �0.088 8 0.808 0.724 �0.045 5 0.783 0.590 �0.182
F1-OCA19 88–104 4 0.686 0.537 �0.144 5 0.607 0.601 0.101 5 0.600 0.457 �0.060 5 0.654 0.593 0.018 5 0.617 0.405 �0.196
Smax-02 119–160 12 0.943 0.723 �0.252 8 0.929 0.700 �0.234 6 0.800 0.633 �0.137 8 0.846 0.740 �0.073 7 0.767 0.600 �0.148
Smax-03 289–305 7 0.765 0.807 0.093 4 0.714 0.614 �0.039 4 0.720 0.570 �0.115 5 0.923 0.650 �0.290 4 0.833 0.583 �0.265
Sma3-125 120–152 5 0.943 0.723 �0.221 5 0.679 0.606 0.002 5 0.720 0.526 �0.172 6 0.615 0.648 0.138 3 0.483 0.409 0.081
Mean values 6.88 0.810 0.681 �0.105 6.13 0.674 0.606 �0.009 5.00 0.650 0.509 �0.118 6.75 0.721 0.642 �0.029 4.13 0.641 0.475 �0.156
Na: number of alleles per locus, Ho: observed heterozygosity, PIC: polymorphic information content.
All FIS values are not significant after 800 randomisations for the 0.05 significance level using Fstat 2.93.
Y.J.
Borrell
etal./Aquacultu
re241(2004)133–150
139
Y.J. Borrell et al. / Aquaculture 241 (2004) 133–150140
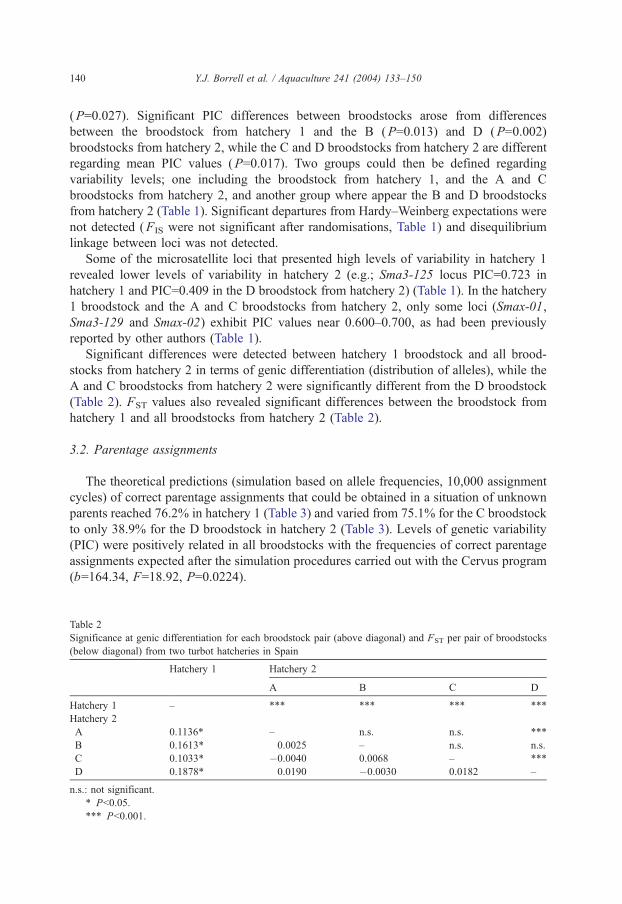
(P=0.027). Significant PIC differences between broodstocks arose from differences
between the broodstock from hatchery 1 and the B (P=0.013) and D (P=0.002)
broodstocks from hatchery 2, while the C and D broodstocks from hatchery 2 are different
regarding mean PIC values (P=0.017). Two groups could then be defined regarding
variability levels; one including the broodstock from hatchery 1, and the A and C
broodstocks from hatchery 2, and another group where appear the B and D broodstocks
from hatchery 2 (Table 1). Significant departures from Hardy–Weinberg expectations were
not detected (FIS were not significant after randomisations, Table 1) and disequilibrium
linkage between loci was not detected.
Some of the microsatellite loci that presented high levels of variability in hatchery 1
revealed lower levels of variability in hatchery 2 (e.g.; Sma3-125 locus PIC=0.723 in
hatchery 1 and PIC=0.409 in the D broodstock from hatchery 2) (Table 1). In the hatchery
1 broodstock and the A and C broodstocks from hatchery 2, only some loci (Smax-01,
Sma3-129 and Smax-02) exhibit PIC values near 0.600–0.700, as had been previously
reported by other authors (Table 1).
Significant differences were detected between hatchery 1 broodstock and all brood-
stocks from hatchery 2 in terms of genic differentiation (distribution of alleles), while the
A and C broodstocks from hatchery 2 were significantly different from the D broodstock
(Table 2). FST values also revealed significant differences between the broodstock from
hatchery 1 and all broodstocks from hatchery 2 (Table 2).
3.2. Parentage assignments
The theoretical predictions (simulation based on allele frequencies, 10,000 assignment
cycles) of correct parentage assignments that could be obtained in a situation of unknown
parents reached 76.2% in hatchery 1 (Table 3) and varied from 75.1% for the C broodstock
to only 38.9% for the D broodstock in hatchery 2 (Table 3). Levels of genetic variability
(PIC) were positively related in all broodstocks with the frequencies of correct parentage
assignments expected after the simulation procedures carried out with the Cervus program
(b=164.34, F=18.92, P=0.0224).
Table 2
Significance at genic differentiation for each broodstock pair (above diagonal) and FST per pair of broodstocks
(below diagonal) from two turbot hatcheries in Spain
Hatchery 1 Hatchery 2
A B C D
Hatchery 1 – *** *** *** ***
Hatchery 2
A 0.1136* – n.s. n.s. ***
B 0.1613* 0.0025 – n.s. n.s.
C 0.1033* �0.0040 0.0068 – ***
D 0.1878* 0.0190 �0.0030 0.0182 –
n.s.: not significant.
* Pb0.05.
*** Pb0.001.
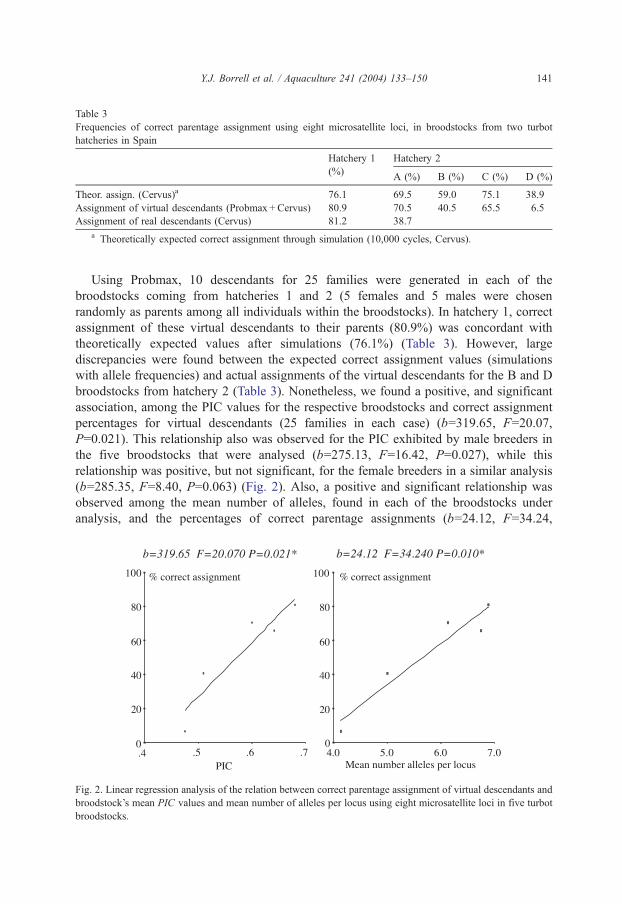
Table 3
Frequencies of correct parentage assignment using eight microsatellite loci, in broodstocks from two turbot
hatcheries in Spain
Hatchery 1
(%)
Hatchery 2
A (%) B (%) C (%) D (%)
Theor. assign. (Cervus)a 76.1 69.5 59.0 75.1 38.9
Assignment of virtual descendants (Probmax + Cervus) 80.9 70.5 40.5 65.5 6.5
Assignment of real descendants (Cervus) 81.2 38.7
a Theoretically expected correct assignment through simulation (10,000 cycles, Cervus).
Y.J. Borrell et al. / Aquaculture 241 (2004) 133–150 141
Using Probmax, 10 descendants for 25 families were generated in each of the
broodstocks coming from hatcheries 1 and 2 (5 females and 5 males were chosen
randomly as parents among all individuals within the broodstocks). In hatchery 1, correct
assignment of these virtual descendants to their parents (80.9%) was concordant with
theoretically expected values after simulations (76.1%) (Table 3). However, large
discrepancies were found between the expected correct assignment values (simulations
with allele frequencies) and actual assignments of the virtual descendants for the B and D
broodstocks from hatchery 2 (Table 3). Nonetheless, we found a positive, and significant
association, among the PIC values for the respective broodstocks and correct assignment
percentages for virtual descendants (25 families in each case) (b=319.65, F=20.07,
P=0.021). This relationship also was observed for the PIC exhibited by male breeders in
the five broodstocks that were analysed (b=275.13, F=16.42, P=0.027), while this
relationship was positive, but not significant, for the female breeders in a similar analysis
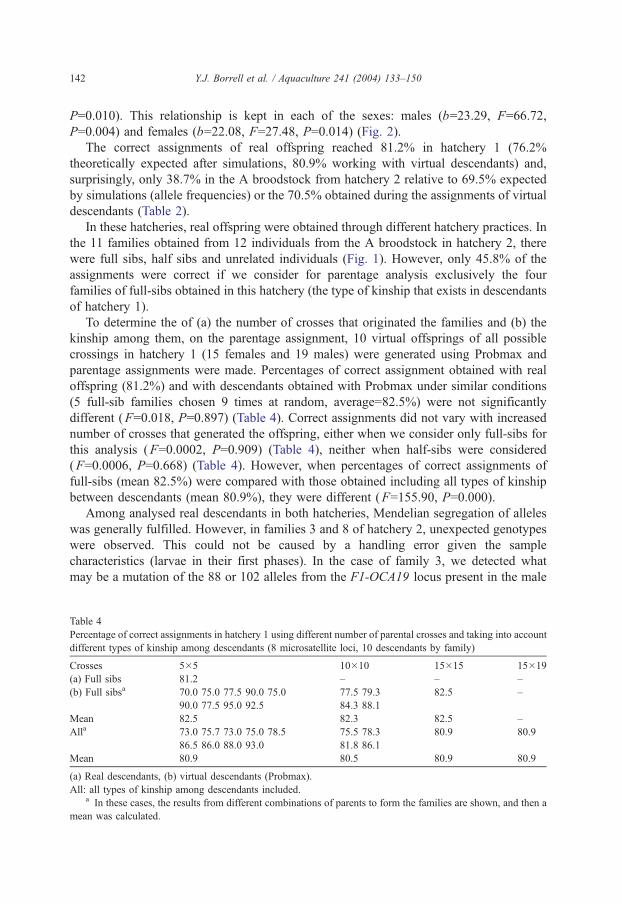
(b=285.35, F=8.40, P=0.063) (Fig. 2). Also, a positive and significant relationship was
observed among the mean number of alleles, found in each of the broodstocks under
analysis, and the percentages of correct parentage assignments (b=24.12, F=34.24,
Fig. 2. Linear regression analysis of the relation between correct parentage assignment of virtual descendants and
broodstock’s mean PIC values and mean number of alleles per locus using eight microsatellite loci in five turbot
broodstocks.
Y.J. Borrell et al. / Aquaculture 241 (2004) 133–150142
P=0.010). This relationship is kept in each of the sexes: males (b=23.29, F=66.72,
P=0.004) and females (b=22.08, F=27.48, P=0.014) (Fig. 2).
The correct assignments of real offspring reached 81.2% in hatchery 1 (76.2%
theoretically expected after simulations, 80.9% working with virtual descendants) and,
surprisingly, only 38.7% in the A broodstock from hatchery 2 relative to 69.5% expected
by simulations (allele frequencies) or the 70.5% obtained during the assignments of virtual
descendants (Table 2).
In these hatcheries, real offspring were obtained through different hatchery practices. In
the 11 families obtained from 12 individuals from the A broodstock in hatchery 2, there
were full sibs, half sibs and unrelated individuals (Fig. 1). However, only 45.8% of the
assignments were correct if we consider for parentage analysis exclusively the four
families of full-sibs obtained in this hatchery (the type of kinship that exists in descendants
of hatchery 1).
To determine the of (a) the number of crosses that originated the families and (b) the
kinship among them, on the parentage assignment, 10 virtual offsprings of all possible
crossings in hatchery 1 (15 females and 19 males) were generated using Probmax and
parentage assignments were made. Percentages of correct assignment obtained with real
offspring (81.2%) and with descendants obtained with Probmax under similar conditions
(5 full-sib families chosen 9 times at random, average=82.5%) were not significantly
different (F=0.018, P=0.897) (Table 4). Correct assignments did not vary with increased
number of crosses that generated the offspring, either when we consider only full-sibs for
this analysis (F=0.0002, P=0.909) (Table 4), neither when half-sibs were considered
(F=0.0006, P=0.668) (Table 4). However, when percentages of correct assignments of
full-sibs (mean 82.5%) were compared with those obtained including all types of kinship
between descendants (mean 80.9%), they were different (F=155.90, P=0.000).
Among analysed real descendants in both hatcheries, Mendelian segregation of alleles
was generally fulfilled. However, in families 3 and 8 of hatchery 2, unexpected genotypes
were observed. This could not be caused by a handling error given the sample
characteristics (larvae in their first phases). In the case of family 3, we detected what
may be a mutation of the 88 or 102 alleles from the F1-OCA19 locus present in the male
Table 4
Percentage of correct assignments in hatchery 1 using different number of parental crosses and taking into account
different types of kinship among descendants (8 microsatellite loci, 10 descendants by family)
Crosses 5�5 10�10 15�15 15�19
(a) Full sibs 81.2 – – –
(b) Full sibsa 70.0 75.0 77.5 90.0 75.0 77.5 79.3 82.5 –
90.0 77.5 95.0 92.5 84.3 88.1
Mean 82.5 82.3 82.5 –
Alla 73.0 75.7 73.0 75.0 78.5 75.5 78.3 80.9 80.9
86.5 86.0 88.0 93.0 81.8 86.1
Mean 80.9 80.5 80.9 80.9
(a) Real descendants, (b) virtual descendants (Probmax).
All: all types of kinship among descendants included.a In these cases, the results from different combinations of parents to form the families are shown, and then a
mean was calculated.
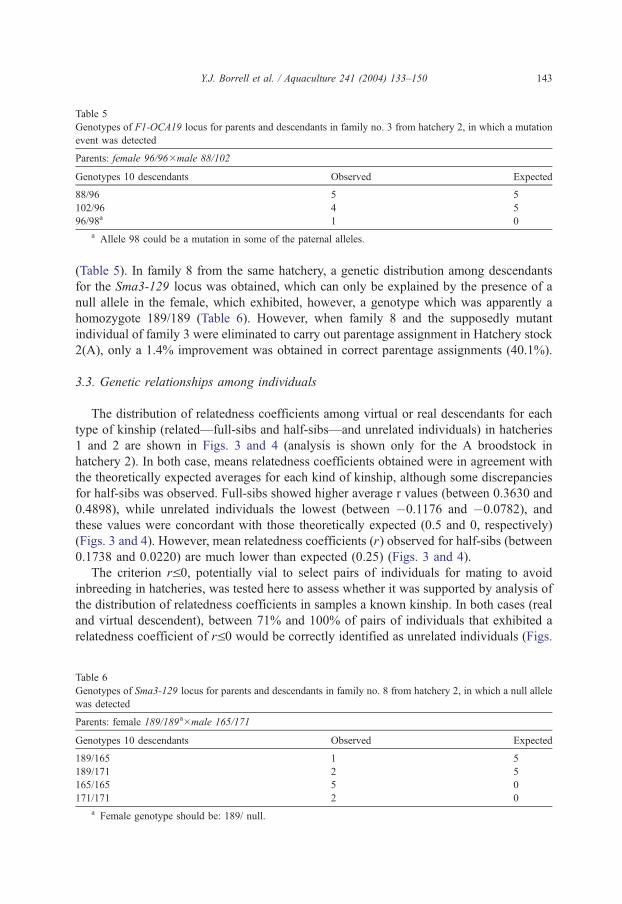
Table 5
Genotypes of F1-OCA19 locus for parents and descendants in family no. 3 from hatchery 2, in which a mutation
event was detected
Parents: female 96/96�male 88/102
Genotypes 10 descendants Observed Expected
88/96 5 5
102/96 4 5
96/98a 1 0
a Allele 98 could be a mutation in some of the paternal alleles.
Y.J. Borrell et al. / Aquaculture 241 (2004) 133–150 143
(Table 5). In family 8 from the same hatchery, a genetic distribution among descendants
for the Sma3-129 locus was obtained, which can only be explained by the presence of a
null allele in the female, which exhibited, however, a genotype which was apparently a
homozygote 189/189 (Table 6). However, when family 8 and the supposedly mutant
individual of family 3 were eliminated to carry out parentage assignment in Hatchery stock
2(A), only a 1.4% improvement was obtained in correct parentage assignments (40.1%).
3.3. Genetic relationships among individuals
The distribution of relatedness coefficients among virtual or real descendants for each
type of kinship (related—full-sibs and half-sibs—and unrelated individuals) in hatcheries
1 and 2 are shown in Figs. 3 and 4 (analysis is shown only for the A broodstock in
hatchery 2). In both case, means relatedness coefficients obtained were in agreement with
the theoretically expected averages for each kind of kinship, although some discrepancies
for half-sibs was observed. Full-sibs showed higher average r values (between 0.3630 and
0.4898), while unrelated individuals the lowest (between �0.1176 and �0.0782), and
these values were concordant with those theoretically expected (0.5 and 0, respectively)
(Figs. 3 and 4). However, mean relatedness coefficients (r) observed for half-sibs (between
0.1738 and 0.0220) are much lower than expected (0.25) (Figs. 3 and 4).
The criterion rV0, potentially vial to select pairs of individuals for mating to avoid
inbreeding in hatcheries, was tested here to assess whether it was supported by analysis of
the distribution of relatedness coefficients in samples a known kinship. In both cases (real
and virtual descendent), between 71% and 100% of pairs of individuals that exhibited a
relatedness coefficient of rV0 would be correctly identified as unrelated individuals (Figs.
Table 6
Genotypes of Sma3-129 locus for parents and descendants in family no. 8 from hatchery 2, in which a null allele
was detected
Parents: female 189/189a�male 165/171
Genotypes 10 descendants Observed Expected
189/165 1 5
189/171 2 5
165/165 5 0
171/171 2 0
a Female genotype should be: 189/ null.
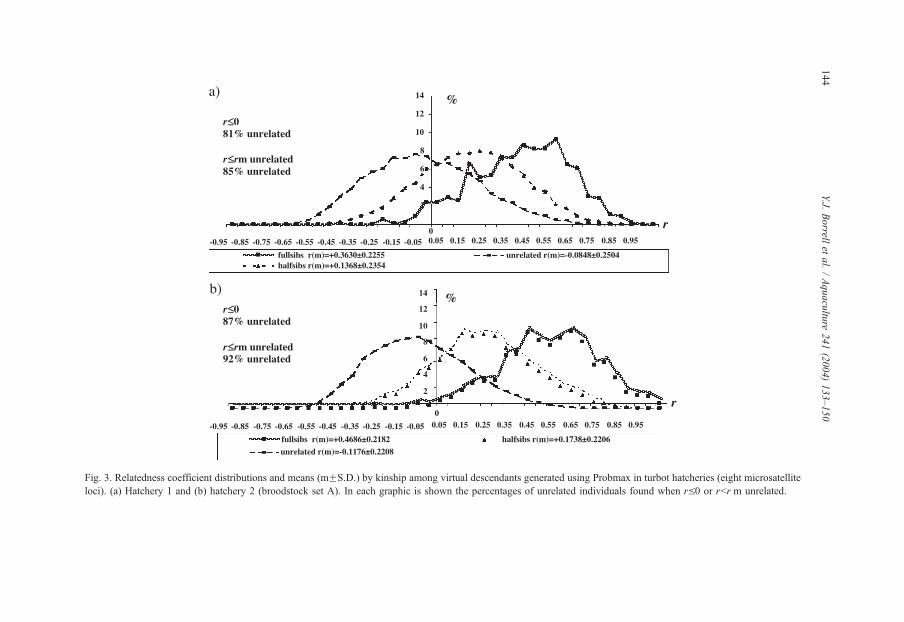
Fig. 3. Relatedness coefficient distributions and means (mFS.D.) by kinship among virtual descendants generated using Probmax in turbot hatcheries (eight microsatellite
loci). (a) Hatchery 1 and (b) hatchery 2 (broodstock set A). In each graphic is shown the percentages of unrelated individuals found when rV0 or rbr m unrelated.
Y.J.
Borrell
etal./Aquacultu
re241(2004)133–150
144
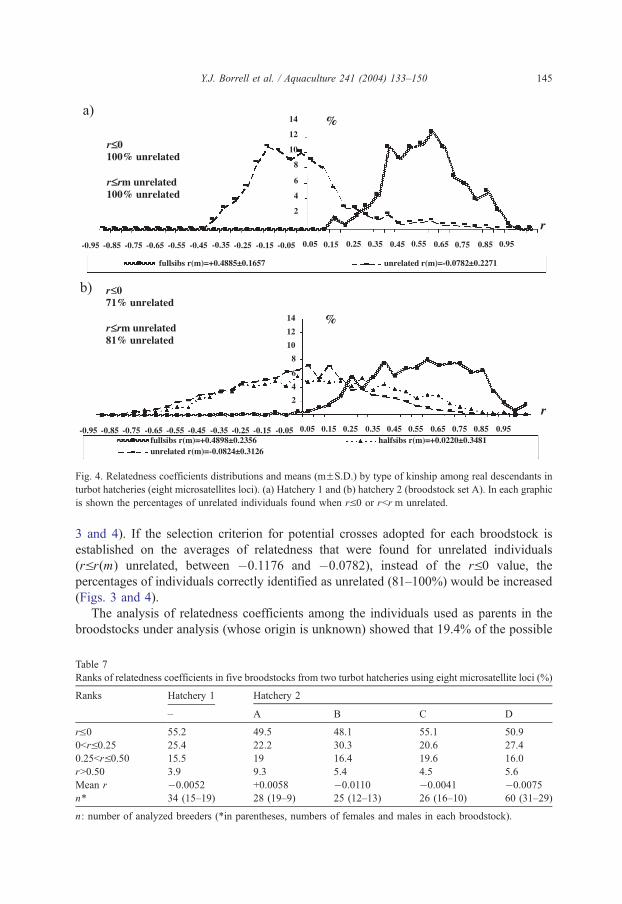
Fig. 4. Relatedness coefficients distributions and means (mFS.D.) by type of kinship among real descendants in
turbot hatcheries (eight microsatellites loci). (a) Hatchery 1 and (b) hatchery 2 (broodstock set A). In each graphic
is shown the percentages of unrelated individuals found when rV0 or rbr m unrelated.
Y.J. Borrell et al. / Aquaculture 241 (2004) 133–150 145
3 and 4). If the selection criterion for potential crosses adopted for each broodstock is
established on the averages of relatedness that were found for unrelated individuals
(rVr(m) unrelated, between �0.1176 and �0.0782), instead of the rV0 value, the
percentages of individuals correctly identified as unrelated (81–100%) would be increased
(Figs. 3 and 4).
The analysis of relatedness coefficients among the individuals used as parents in the
broodstocks under analysis (whose origin is unknown) showed that 19.4% of the possible
Table 7
Ranks of relatedness coefficients in five broodstocks from two turbot hatcheries using eight microsatellite loci (%)
Ranks Hatchery 1 Hatchery 2
– A B C D
rV0 55.2 49.5 48.1 55.1 50.9
0brV0.25 25.4 22.2 30.3 20.6 27.4
0.25brV0.50 15.5 19 16.4 19.6 16.0
rN0.50 3.9 9.3 5.4 4.5 5.6
Mean r �0.0052 +0.0058 �0.0110 �0.0041 �0.0075
n* 34 (15–19) 28 (19–9) 25 (12–13) 26 (16–10) 60 (31–29)
n: number of analyzed breeders (*in parentheses, numbers of females and males in each broodstock).

Table 8
Ranks of relatedness coefficients in five broodstocks from two turbot hatcheries using eight microsatellite loci, by
sex (%)
Ranks Hatchery 1 Hatchery 2
– A B C D
Females rV0 42.8 39.8 36.3 43.8 34.1
Males rV0 58.5 68.8 57.7 50.3 66.6
Y.J. Borrell et al. / Aquaculture 241 (2004) 133–150146
crosses in hatchery 1 (relatedness coefficients rz0.25) posed risk because of inbreeding in
the offspring generation. In the broodstocks of hatchery 2, the risks were higher (28.3% in
the A broodstock, 21.8% in B, 24.1% in C and 21.6% in D) (Table 7). Relatedness
coefficients in broodstocks from the two hatcheries showed that broodstocks with higher
numbers of pairs with low genetic relatedness are in the hatchery 1 broodstock (55.2%)
and in the C broodstock from hatchery 2 (55.1%) (Table 7).
Sex is an important element in parentage assignment, since sex helps in the assignment
procedures. This means that where the more probable parent (higher LOD) is selected,
then a second parent from the other sex group of individuals is selected. The analysis of
relatedness coefficients between broodstocks taking into account the sexes showed that
females were always more related. (Note in Table 8 that females always exhibited the
lower percentages of individuals with relatedness coefficients below zero, thus
determining the Ne for the management design.) In the cases of D and B broodstocks
from hatchery 2, the difference is quite significant, since they exhibited the lowest
relatedness coefficients among females below zero among all sets under study (34.1% and
36.3%, respectively).
No relationship was found between the percentages of unrelated individuals (assuming
rV0 as the cut-off) in these five broodstocks and the percentages of correct parentage
assignments using virtual descendants carried out with Cervus (Fig. 5). However, a similar
analysis, in this case taking into account sexes, showed that correct parentage assignments
had a positive and significant relationship with the percentages of females that appear in
Fig. 5. Linear regression analysis between correct parentage assignment and percentages of unrelated broodstocks
following rV0 using eight microsatellite loci in five turbot broodstocks from two turbot hatcheries.
Y.J. Borrell et al. / Aquaculture 241 (2004) 133–150 147
broodstocks with rV0 among them (unrelated) (b=6.42, F=11.87, P=0.041). There was no
relationship with the same estimated value in males (b=�1.29, F=0.35, P=0.596) (Fig. 5).
4. Discussion
We assessed the usefulness of eight microsatellite loci reported previously to exhibit
high levels of variability to determine pedigrees in five turbot (Scophthalmus maximus L.)
broodstocks from two hatcheries in Spain and to estimate genetic relatedness between
pairs of individuals with unknown origin. Estoup et al. (1998) analysed 45 individuals of
natural origin selected as breeders in a French hatchery, and found that the Sma1-125
(PIC=0.795), Sma3-8 (PIC=0.855), Sma3-12 (PIC=0.775) and Sma3-129 (PIC=0.886)
loci presented high PIC. Iyengar et al. (2000) found observed heterozygosity of 0.880 for
the F1-OCA19 locus in wild individuals. To keep variability levels in a hatchery
comparable to those exhibited by wild individuals, appropriate management is needed in
terms of adequate numbers of effective parents to create the broodstocks to avoid
significant genetic variability reduction (Estoup et al., 1998). The broodstocks analysed in
this study could exhibit loss of variability that may be a consequence of one or more
domestication generations, especially in broodstocks from hatchery 2.
In this study, heterogeneity was found regarding variability of the eight microsatellite
loci in the broodstocks from two turbot hatcheries. Some broodstocks, such as those from
hatchery 1 and the A and C broodstocks from hatchery 2, showed higher levels of
variability, and theoretically correct parentage assignment results were expected over 70%,
Meanwhile, the B and D broodstocks from hatchery 2 showed lower levels of variability
(PICb0.600) and lower results in the assignment tests. Each broodstock represents,
therefore, a unique entity with peculiar characteristics in order of genetic composition,
which will depend on the origin of the individuals (natural or cultivated individuals),
culture cycles which they have undergone, and type of handling established to obtain those
breeders. In this context, data about microsatellite variability taken from the literature may
serve only as a reference for selecting a wide range of marker with an expected high
variability that should be confirmed during a preliminary study of the genetic composition
of the broodstocks of interest.
We found some elements, apart from the genetic variability present in a certain stock
(PIC, number of alleles), that significantly influenced the frequency of correct parentage
assignments. The experimental design used in this work, in which breeders and offspring
are available and the origin of all descendants is known (Norris et al., 2000 published an
equivalent design), allowed identification of mutations and null alleles (Pemberton et al.,
1995; McGoldrick et al., 2000) as factors affecting parentage studies using microsatellite
loci. The mating designs used to generate the offspring, and the genetic similarity among
breeders of the same sex also could affect frequencies of correct parentage assignment
tests using real offspring.
In this work, a mutation rate of 10�4 was found. This rate is within the range described
for microsatellite variation (Amos, 1999). This would determine that only one out of
10,000 individuals would not be assigned to any possible parents when the mutation
produce a new allele which can not be found in broodstocks, or it would be incorrectly
Y.J. Borrell et al. / Aquaculture 241 (2004) 133–150148
assigned if the change is towards one of the existing alleles. The assignment mistakes that
could be made due to null alleles makes a more important element. In our case, 70% of the
breeder’s offspring that had a null allele were incorrectly assigned. In this study, both
factors explain only 1.4% of the differences among correct parentage assignments
theoretically expected in A broodstock of hatchery 2 (69.5%) and those obtained when
considering a real situation (38.7%) (Table 3). In a situation in which a breeder that carries
a null allele is responsible for an important contribution to a group of mixed offspring
reared together, parentage inferences based on the microsatellite loci would be
significantly erroneous. Thus, those responsible for genetic programs in a hatchery must
be concerned about it. It is advisable to consider the possibility of null alleles’ when
considering of microsatellite loci to be used for parentage studies in a hatchery.
The problem of quantifying the influence of null alleles in a real situation is complex
because unequivocal detection requires analysing descendants of all breeders. Never-
theless, an estimate of the presence of null alleles can be carried out through an algorithm
proposed by Summers and Amos (1997), also available in the Cervus program. If in the
analysis for a certain locus in a natural or cultured population the program estimates that a
null allele with a frequency higher than 0.02 may exist, then must be considered the
possibility that this alleles exists with a high probability. In the A broodstock from
hatchery 2, the Sma3-129 and F1-OCA19 loci showed estimates for null alleles
frequencies of 0.1262 and 0.0749, respectively. In the C broodstock, the Sma3-125 locus
showed a frequency of a possible null allele of 0.0647. The algorithm works from
differences among expected and observed frequencies in homozygotes. These differences
also can originate because the sample is a mixture of individuals from different
populations (genetic subdivision) (Wahlund effect), because of selection at this locus or
genes linked to that locus, or because of sampling error (error type I). In the case of
population mixing, it is expected that more than one locus in the analysis shows the same
pattern.
Although the number of crosses which generates the families in a hatchery did not
significantly affect the correct assignments using microsatellite in hatchery 1, in the A
broodstock from hatchery 2, the genetic similarity among the females which participated
in the creation of the 11 families (e.g.: females 1 and 3) constitutes, in addition to
mutation and null alleles in that broodstock, a factor which could explain differences
between expected and observed correct parentage assignments. Genetic similarities
among breeders of the same sex (in this case, females) also explains the divergences
among correct assignments percentages expected after simulations in the B (59.5%) and
D (38.9%) broodstocks and those obtained using virtual descendants (B: 40.5% and D:
6.5%), as they where the broodstocks in which females are presumably more genetically
related.
The use of relatedness coefficients as a tool for the appropriate selection of breeding
pairs in hatcheries when their origin (pedigree) is unknown is a method that would
contribute to inbreeding avoidance (Norris et al., 2000). In this study, we tested certain
bcut-off valuesQ for relatedness coefficients (e.g.: rV0), which proved to have acceptable
levels of confidence (80%) when identifying unrelated individuals.
In each broodstock, there are always a limited number of possible pairing to generate
offspring, which depends on the number of individuals that comprise the broodstock and
Y.J. Borrell et al. / Aquaculture 241 (2004) 133–150 149
the sex distribution. For instance, in hatchery 1, breeders were 15 females and 19 males,
which would allow 285 different crosses. From them, applying the criterion of selecting
couples as individuals with rV0, 157 of them (55.2%) are reasonably out of inbreeding
risk. This number is enough for executing a genetic program in a hatchery and also, given
the high fecundity in fishes, to meet production goals. Nevertheless, a proposed crossing
between two individuals with rV0 to avoid inbreeding would not imply that better results
would be obtained in parentage assignments. In fact, if among the breeders, there are two
females (or two males) with the same genotype, the offspring of these families may present
very similar genotypes and the percentages of correct paternity assignment would be
affected.
In summary, microsatellite loci are useful tools to design broodstock management in a
hatchery through parentage studies (assignments and selection of appropriate pairs of
breeders to create progenies) if various elements are taken into account, such as the
previous genetic variability analysis in broodstocks with the selected loci (PIC and number
of alleles, in general and by sexes), the mating design used to obtain the offspring, the
possibility of mutations and presence of null alleles in those microsatellite loci in use and
the existing genetic relationships among breeders of the same sex.
Acknowledgements
This research was funded with grants from DGES project (MAR 1999-1190-CO2-01)
and AECI (PhD fellowship for Borrell Y.J.).
References
Amos, W., 1999. A comparative approach to the study of microsatellite evolution. In: Goldstein, D.B.,
Schlotterer, Ch. (Eds.), Microsatellites, Evolution and Applications. Oxford University Press, pp. 66–79.
Blouin, M.S., Parson, M., Lacaille, V., Lotz, S., 1996. Use of microsatellite loci to classify individuals by
relatedness. Molecular Ecology 5, 393–401.
Botstein, D., White, R., Skolnik, M., Dawis, R.W., 1980. Construction of a genetic linkage map using restriction
fragment length polymorphisms. American Journal of Human Genetics 32, 314–331.
Boudry, P., Collet, B., Cornette, F., Hervouet, V., Bonhomme, F., 2002. High variance in reproductive success of
the Pacific oyster (Crassostrea gigas, Thunberg) revealed by microsatellite-based parentage analysis of
multifactorial crosses. Aquaculture 204 (3–4), 283–296.
Coughlan, J., MacCarthy, E., McGregor, D., O’Donoghue, P., Galvin, P., Fitzgerald, R., Daemen, E., Imsland, A.,
Stefansson, S., Cross, T., 1998. Four polymorphic microsatellites in turbot Scophthalmus maximus. Animal
Genetics 27, 441–442.
Danzmann, R.G., 1997. Probmax: a computer program for assigning unknown parentage in pedigree analysis
from known genotypic pools of parents and progeny. Journal of Heredity 88, 333.
Estoup, A., Gharbi, K., SanCristobal, M., Chevalet, C., Haffray, P., Guyomard, R., 1998. Parentage assignment
using microsatellites in turbot (Scophthalmus maximus) and rainbow trout (Oncorhynchus mykiss) hatchery
populations. Canadian Journal of Fisheries and Aquatic Sciences 55, 715–725.
Garcıa de Leon, F.J., Cannonne, M., Quillet, E., Bonhomme, F., Chatain, B., 1998. The application of
microsatellite markers to breeding programmes in the sea bass, Dicentrarchus labrax. Aquaculture 159,
303–316.
Gjerde, B., Gunnes, K., Gjedrem, T., 1983. Effect of inbreeding on survival and growth in rainbow trout.
Aquaculture 34, 327–332.
Y.J. Borrell et al. / Aquaculture 241 (2004) 133–150150
Goudet, J., 1995. FSTAT (vers. 1.2): a computer program to calculate F-statistics. Journal of Heredity 86,
485–486.
Goudet, J., 2001. FSTAT, a program to estimate and test gene diversities and fixation indices (version 2.9.3).
http://www.unil.ch/izea/softwares/fstat.html.
Herbinger, C.M., O’Reilly, P.T., Doyle, R.W., Wright, J.M., O’Flynn, F., 1999. Early growth performance of
Atlantic salmon full-sib families reared in single family tanks versus in mixed family tanks. Aquaculture 173
(1–4), 105–116.
Iyengar, A., Piyapattanakorn, S., Heipel, D.A., Stone, D.M., Howell, B.R., Child, A.R., Maclean, N., 2000. A
suite of highly polimorphic microsatellite markers in turbot (Scophthalmus maximus L.) with potential for use
across several flatfish species. Molecular Ecology 9, 365–378.
Jackson, T.M., Martin-Robichaud, D.J., Reith, M.E., 2003. Application of DNA markers to the management of
Atlantic halibut (Hippoglossus hippoglossus) broodstock. Aquaculture 220, 245–259.
Josupeit, H., 1996. European markets for seabass, seabream and turbot. Aquaculture Europe 20, 6–12.
Kincaid, H.L., 1983. Inbreeding in fish populations used for aquaculture. Aquaculture 33, 215–227.
Marshall, T.C., Slate, J., Kruuk, L.E.B., Pemberton, J.M., 1998. Statistical confidence for likelihood-based
paternity inference in natural populations. Molecular Ecology 7, 639–655.
McGoldrick, D.J., Hedgecock, D., English, L., Baoprasertkul, P., Ward, R.D., 2000. The transmission of
microsatellite alleles in Australian and North American stocks of the Pacific oyster (Crassostrea gigas):
selection and null alleles. Journal of Shellfish Research 19 (2), 779–788.
Norris, A.T., Bradley, D.G., Cunningham, E.P., 2000. Parentage and relatedness determination in farmed Atlantic
salmon (Salmo salar) using microsatellite markers. Aquaculture 182, 73–83.
Pemberton, J.M., Slate, J., Bancroft, D.R., Barrett, J.A., 1995. Non amplifying alleles at microsatellite loci: a
caution for parentage and population studies. Molecular Ecology 4, 249–252.
Perez-Enriquez, R., Takagi, M., Taniguchi, N., 1999. Genetic variability and pedigree tracing of a hatchery-reared
stock of red sea bream (Pagrus major) used for stock enhancement, based on microsatellite markers.
Aquaculture 173, 413–423.
Queller, D.C., Goodnight, K.F., 1989. Estimating relatedness using genetic markers. Evolution 43, 258–275.
Raymond, M., Rousset, F., 1995. GENEPOP (version 1.2): population genetics software for exact tests and
ecumenicism. Journal of Heredity 86, 248–249.
Rice, W.R., 1989. Analysing tables of statistical tests. Evolution 43, 223–225.
Sekino, M., Saitoh, K., Yamada, T., Kumagai, A., Hara, M., Yamashita, Y., 2003. Microsatellite-based pedigree
tracing in a Japanese flounder Paralichthys olivaceus hatchery strain: implications for hatchery management
related to stock enhancement program. Aquaculture 221, 255–263.
Selvamani, M.J.P., Degnan, S.M., Degnan, B.M., 2001. Microsatellite genotyping of individual abalone larvae:
parentage assignment in aquaculture. Marine Biotechnology 3, 478–485.
Su, G.S., Liljedabl, L.E., Gall, G.A.E., 1996. Effects of inbreeding on growth and reproductive traits in rainbow
trout (Oncorhynchus mykiss). Aquaculture 142, 139–148.
Summers, K., Amos, B., 1997. Behavioral ecological and molecular genetic analyses of reproductive strategies in
the Amazonian dart-poison frog, Dendrobates ventrimaculatus. Behavioral Ecology 8, 260–267.
Walsh, P.S., Metzger, D.A., Higuchi, R., 1991. ChelexR 100 as a medium for simple extraction of DNA for PCR-
based typing form forensic material. Biotechnics 10, 506–510.
Weir, B.S., Cockerham, C.C., 1984. Estimating F-statistics for the analysis of population structure. Evolution 38,
1358–1370.