Using stable isotopes of nitrogen to study its source and transformation in a heavily farmed...
10
ORIGINAL ARTICLE Using stable isotopes of nitrogen to study its source and transformation in a heavily farmed watershed S. Gautam M. Z. Iqbal Received: 17 November 2008 / Accepted: 8 April 2009 Ó Springer-Verlag 2009 Abstract Twenty private wells and ten stream locations were sampled to assess the source and fate of dissolved nitrate in the Cedar River watershed of Iowa, USA. The average levels of nitrate in groundwater decreased from 39.5 mg/L in May, to 38 mg/L in July, to 30 mg/L in September. Although several surface water samples exceeded MCL in May, most values dropped to below 20 mg/L by July and September. The decreasing N levels were attributed to the gradual uptake of nitrate by growing crops as well as the cyanobacterial growth in the aquatic systems. The d 15 N values of dissolved nitrate in ground- water ranged from ?0.45 to ?5.35%, whereas those in surface water ranged from ?1.48 to ?5.16%. The results suggested that commercial fertilizers and soil organic nitrogen were probably mixed up in their transport path- ways. A fertilizer-only source would provide much lower delta values, whereas soil nitrogen would provide higher than observed delta values. Denitrification was considered unlikely because of the low d 15 N values, high nitrate concentrations, and moderately high DO content in groundwater. Animal wastes were not found as a possible source of nitrate in the water. This is supported by the low chloride concentrations and lower than 10% delta values in the water samples. The study demonstrates that nitrogen isotope data in coordination with the dissolved nitrate levels and land use can be effectively used in nitrogen source identification and its transformation studies. Keywords Nitrogen Á Fertilizers Á Isotopes Á Groundwater Á Watershed Introduction The groundwater table of northern and northeastern Iowa is affected by non-point sources nitrogen coming from cul- tivated, row-cropped fields on well-drained soils in the area. Many drinking water wells in these areas are charac- terized by nitrate concentrations higher than maximum contaminant levels (MCL) of 45 mg/L as NO 3 - or 10 mg/L as NO 3 - N (U.S. EPA 2007). Agricultural leachate from commercial nitrogen fertilizer and manures are the major contributors. In the past two decades, the use of nitrogen fertilizer in Iowa has increased drastically and now it is a major threat to groundwater. As nitrate builds up in the aquifer over time, a part of it leaves the system with base flow discharge into the nearby streams (Iqbal 2002). The median discharge-weighted nitrate concentrations also are significantly greater in Eastern Iowa streams than in streams sampled elsewhere in the Corn Belt as well as the Northern Great Plains ecoregion (Omernik 2000). Nitrate- nitrogen averages 5.1 mg/L in groundwater compared to 11 mg/L in surface water. In one study conducted in the Cedar River basin, 41% of the wells tested for nitrate exceeded the MCL (Iqbal 1996). Nitrogen compounds are primarily a water quality con- cern because they contribute to aquatic plant growth, eutrophication, and toxicity. Increased nitrate concentration has negative impacts on human health. A high concentra- tion of nitrate in drinking water causes methemoglobine- mia, or blue baby syndrome, because it interferes with the oxygen-carrying capacity of blood. Exposure to nitrates has been studied in a number of illnesses having long latency, S. Gautam Biological Systems Engineering Department, Virginia Tech, Blacksburg, VA 24061, USA M. Z. Iqbal (&) Earth Science Department, University of Northern Iowa, Cedar Falls, IA 50614, USA e-mail: [email protected] 123 Environ Earth Sci DOI 10.1007/s12665-009-0165-7
-
Upload
independent -
Category
Documents
-
view
1 -
download
0
Transcript of Using stable isotopes of nitrogen to study its source and transformation in a heavily farmed...
ORIGINAL ARTICLE
Using stable isotopes of nitrogen to study its sourceand transformation in a heavily farmed watershed
S. Gautam Æ M. Z. Iqbal
Received: 17 November 2008 / Accepted: 8 April 2009
� Springer-Verlag 2009
Abstract Twenty private wells and ten stream locations
were sampled to assess the source and fate of dissolved
nitrate in the Cedar River watershed of Iowa, USA. The
average levels of nitrate in groundwater decreased from
39.5 mg/L in May, to 38 mg/L in July, to 30 mg/L in
September. Although several surface water samples
exceeded MCL in May, most values dropped to below
20 mg/L by July and September. The decreasing N levels
were attributed to the gradual uptake of nitrate by growing
crops as well as the cyanobacterial growth in the aquatic
systems. The d15N values of dissolved nitrate in ground-
water ranged from ?0.45 to ?5.35%, whereas those in
surface water ranged from ?1.48 to ?5.16%. The results
suggested that commercial fertilizers and soil organic
nitrogen were probably mixed up in their transport path-
ways. A fertilizer-only source would provide much lower
delta values, whereas soil nitrogen would provide higher
than observed delta values. Denitrification was considered
unlikely because of the low d15N values, high nitrate
concentrations, and moderately high DO content in
groundwater. Animal wastes were not found as a possible
source of nitrate in the water. This is supported by the low
chloride concentrations and lower than 10% delta values in
the water samples. The study demonstrates that nitrogen
isotope data in coordination with the dissolved nitrate
levels and land use can be effectively used in nitrogen
source identification and its transformation studies.
Keywords Nitrogen � Fertilizers � Isotopes �Groundwater � Watershed
Introduction
The groundwater table of northern and northeastern Iowa is
affected by non-point sources nitrogen coming from cul-
tivated, row-cropped fields on well-drained soils in the
area. Many drinking water wells in these areas are charac-
terized by nitrate concentrations higher than maximum
contaminant levels (MCL) of 45 mg/L as NO3- or 10 mg/L
as NO3- N (U.S. EPA 2007). Agricultural leachate from
commercial nitrogen fertilizer and manures are the major
contributors. In the past two decades, the use of nitrogen
fertilizer in Iowa has increased drastically and now it is a
major threat to groundwater. As nitrate builds up in the
aquifer over time, a part of it leaves the system with base
flow discharge into the nearby streams (Iqbal 2002). The
median discharge-weighted nitrate concentrations also are
significantly greater in Eastern Iowa streams than in
streams sampled elsewhere in the Corn Belt as well as the
Northern Great Plains ecoregion (Omernik 2000). Nitrate-
nitrogen averages 5.1 mg/L in groundwater compared to
11 mg/L in surface water. In one study conducted in the
Cedar River basin, 41% of the wells tested for nitrate
exceeded the MCL (Iqbal 1996).
Nitrogen compounds are primarily a water quality con-
cern because they contribute to aquatic plant growth,
eutrophication, and toxicity. Increased nitrate concentration
has negative impacts on human health. A high concentra-
tion of nitrate in drinking water causes methemoglobine-
mia, or blue baby syndrome, because it interferes with the
oxygen-carrying capacity of blood. Exposure to nitrates has
been studied in a number of illnesses having long latency,
S. Gautam
Biological Systems Engineering Department,
Virginia Tech, Blacksburg, VA 24061, USA
M. Z. Iqbal (&)
Earth Science Department, University of Northern Iowa,
Cedar Falls, IA 50614, USA
e-mail: [email protected]
123
Environ Earth Sci
DOI 10.1007/s12665-009-0165-7

including incidences of gastric and esophageal cancers and
the risk of non-Hodgkin’s Lymphoma (NHL) (Forman
1989; Ward et al. 1996).
Higher nitrate levels are found in drinking water wells
all over the Cedar River basin. In one study, nine out of 20
private wells sampled had nitrate concentrations exceeding
the U.S. EPA recommended MCL of 45 mg/L (as NO3-)
for drinking purposes (Iqbal 2000). Major forms of N that
are applied to increase crop productivity include urea [CO
(NH2)2], ammonium nitrate (NH4NO3), ammonia (NH3),
and various animal manures. Although different forms of
fertilizers are applied to agricultural fields, NO3- is usually
the major form of N (other than dissolved atmospheric N2)
in agricultural recharge (Bohlke 2002).
Monitoring fate and transport of stable nitrogen isotopes
in hydrologic systems has become an efficient method of
studying water quality in the recent decades. The stable
isotopic compositions of low-mass elements such as
nitrogen are usually reported as delta (d) values in parts per
thousand (denoted as %) enrichments or depletions relative
to a standard of known composition. As nitrogen com-
pounds are chemically altered within a system, stable iso-
topes of nitrate, 15N and 14N, may undergo isotopic
fractionation. One of the nitrogen isotopes is either incor-
porated into or depleted from the system depending on the
existing geochemical environment. Therefore, nitrogen
isotopes can be used to determine major sources of nitrate
in natural systems. Stable isotope ratios are expressed as
d15N = {[(15N/14N)x/(15N/14N)AIR] - 1}91,000, where
x = sample and AIR = the reference standard gas. The
standard is atmospheric nitrogen gas.
Several studies have been conducted over the last
30 years to identify nitrate sources in groundwater and
surface water (Showers et al. 1990; Kreitler 1975; Fogg et al.
1998). Gormly and Spalding (1979) used isotopes of nitro-
gen to find the primary sources of N in groundwater of
Nebraska. They found that the corresponding d15N range of
values were ?5 to ?9% for soil nitrogen, -2 to ?7% for
commercial fertilizer, and ?10 to ?23% for livestock.
Kreitler et al. (1978) used isotopes of nitrogen in the
groundwater of Long Island, New York and found that the N
in groundwater shifted from lighter values in the eastern part
of the island where land is used predominantly for agricul-
ture, to heavier values toward New York City, where land is
used for suburban residences with septic systems or sewers.
On an average, d15N values for inorganic fertilizer, unfer-
tilized cultivated fields, and animal wastes show a shift from
low to high values such as -3 to ?2%, ?2 to ?8%, and
?10 to ?20%, respectively. The feasibility of using nitro-
gen and oxygen isotope ratios of nitrate for elucidating
sources and transformations of riverine nitrate was evalu-
ated in a comparative study of 16 watersheds in the north-
eastern USA (Mayer et al. 2002). In conjunction with
information about land use and nitrogen fluxes, d15N and
d18O values of NO3- provided important information about
sources of riverine nitrate in these studies. In many studies,
d15N has demonstrated to be an effective discriminator
between plant or commercial fertilizer-derived nitrate and
animal-derived nitrate. In a recent study, Avisar et al. (2009)
successfully used nitrogen isotopes to confirm that the levels
of nitrate in groundwater went down as a result of their
initiative to replace cesspits for waste disposals with a
central sewage system in two Israeli villages. Within several
years after the cesspit disposal was terminated, the d15N
values of groundwater dropped from around ?8% to the
natural background level. However, division between mul-
tiple human sources and animal sources are less well defined
(Fogg et al. 1998; Kendall 1998). Although d15N of nitrate
can be used to distinguish between animal and organic N or
inorganic fertilizer derived nitrate, it has not been success-
fully used alone to distinguish between subcategories of
animal-derived nitrate in groundwater. Even coupling d15N
with other isotopes, such as d18O, has not been particularly
successful for determining differences between animal
sources.
The isotopic composition of NO3- sources can be
altered by transformations, principally denitrification, that
results in fractionation of the stable isotopes, thereby lim-
iting the utility of d15N analyses. More recent studies uti-
lized both d15N and d18O to trace the progression of N
transformations and to help separate NO3- sources. In one
study stable isotope data suggested that assimilation, not
denitrification, is the process likely to be affecting N
transport in the Mississippi River during late spring to early
summer (Battaglin et al. 2001).
Hypothesis and objectives
The objective of this study was to identify the sources of
nitrate in groundwater as well as surface water by using N-
isotope technique within the rural community of the Cedar
River watershed in Iowa. Additionally, temporal variations
in nitrate levels were examined to verify the nitrogen
source indicators.
The hypothesis of this project was that chemical fertil-
izers are the major sources of nitrate contamination in the
Cedar River watershed, which can be confirmed by stable
isotope studies. It is also hypothesized that agricultural
activities are negatively impacting the area water.
Study area
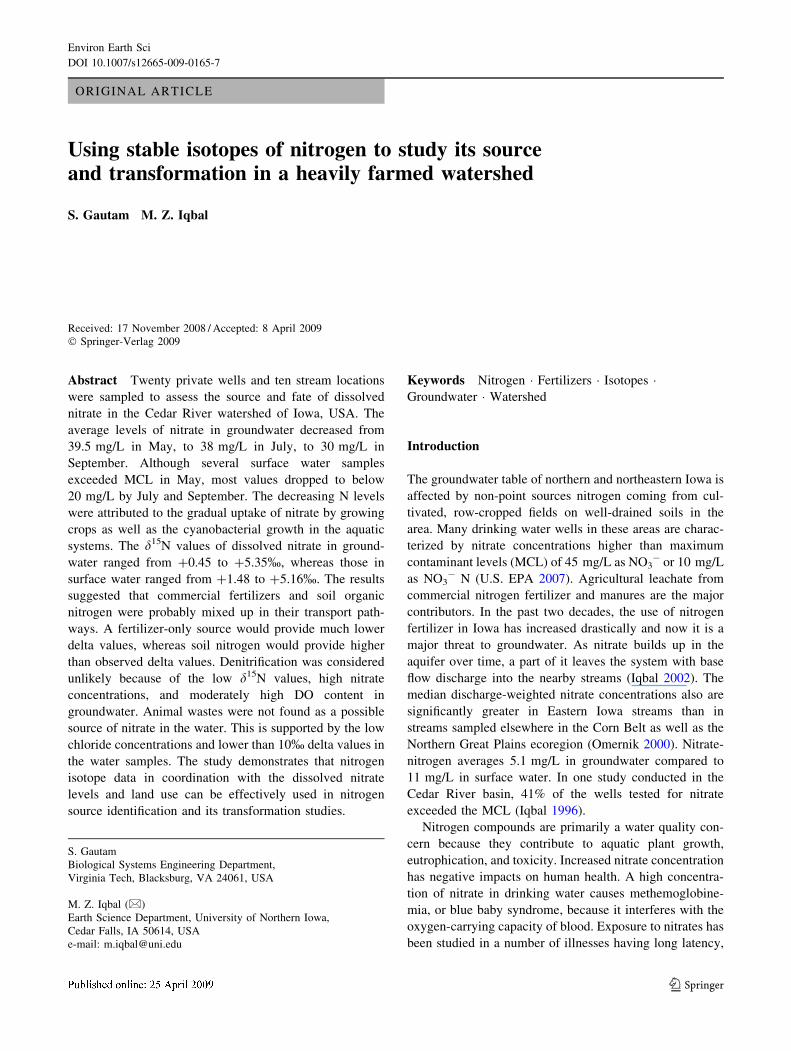
The study area is located in the Black Hawk County and
the Bremer County of the Cedar River Watershed (Fig. 1).
Environ Earth Sci
123
The area is characterized by intensive agricultural activities
with corn and soybean as major crops (Kalkhoff et al.
2000). Twenty groundwater sampling sites and ten surface
water sampling sites were selected and tested from May to
September 2006. Groundwater was sampled from private
drinking water wells, including seven wells that were
drilled into the shallow alluvial aquifer and 13 wells drilled
into the bedrock aquifers. The wells in the alluvial aquifer
range in depth from 3.7 to 9.1 m and those in the bedrock
aquifer range in depth from 15.2 to 48.8 m. The bedrock
aquifers are of Silurian, Devonian, and Ordovician time,
whereas the alluvial aquifers are composed of recent
stream deposits. Eight surface water sites were in the Cedar
River and two were in its tributaries namely the Beaver
Creek and the Shell Rock River.
The study site is located in the landform region known
as the Iowan Surface (Prior 1991). The land surface usually
appears slightly inclined to gently rolling with long slopes,
low relief, and open views to the horizon. Drainage net-
works are well established, although stream gradients
Fig. 1 Study area in the Cedar
River Watershed, Iowa
Environ Earth Sci
123

usually are low and some scattered areas of poor drainage
and original wetlands occur in the region. Erosion on a
large scale is the key to the geological origins of the Iowan
surface. Earlier, before the Wisconsinan glacial events,
the region was part of the Southern Iowa Drift Plain. It
was last glaciated in Pre-Illinoian time and since then
remained exposed to various episodes of weathering and
soil development, erosion, and loess deposition. One of the
latest episodes of erosion occurred between 16,500 and
21,000 years ago during the coldest part of the Wiscons-
inan (Prior 1991).
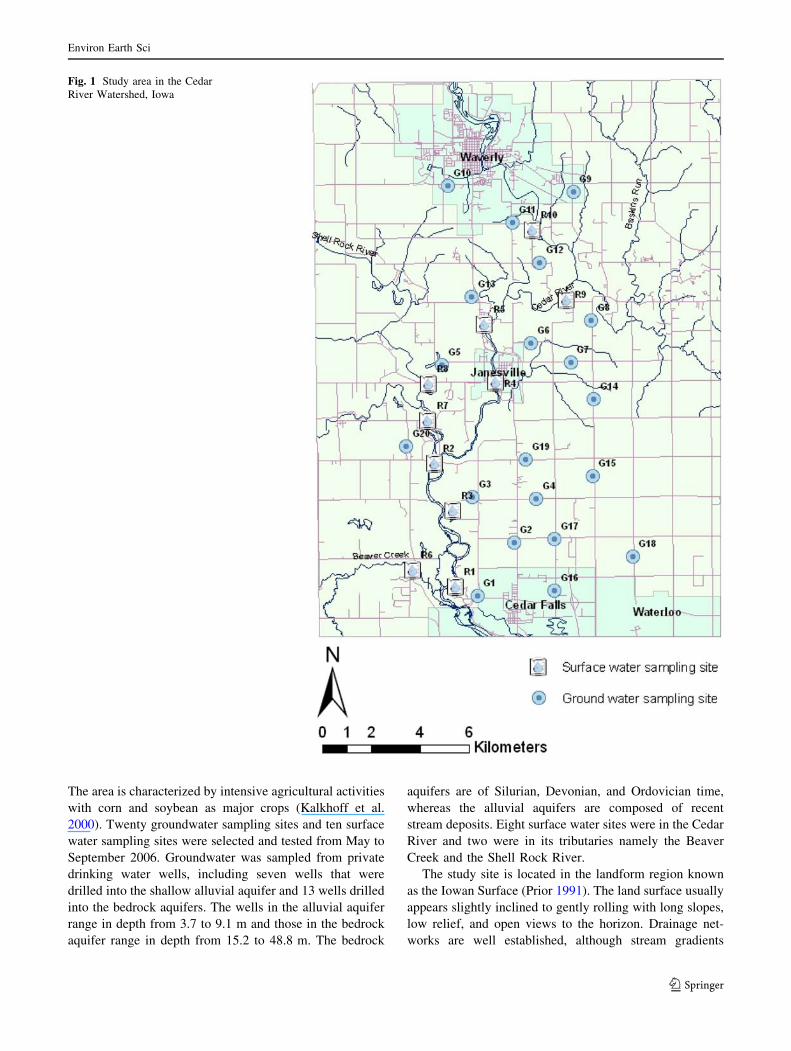
Hydrologic systems
The Cedar River watershed has a total drainage area of
20,242 km2, of which approximately 87% is in Iowa (Iowa
Department of Environmental Quality 1976) (Fig. 2).
There are eight main tributaries that feed the Cedar River.
The average discharge of the Cedar River where it joins the
Iowa River is 136 m3/s. During rain events, overland flow
is the main constituent of stream flow, and the source of
water during dry periods is base flow (Squillance et al.
1996). On an annual basis, it is estimated that 96% of the
flow is base flow, and the remaining 4% is surface runoff
(Squillance and Engberg 1988).
Surficial alluvial deposits are restricted to Holocene-
age river valleys and commonly consist of 9.1–30.5 m of
unconsolidated sands and gravels interbedded with less
permeable silts and clays (Wahl et al. 1978). Depth to the
water table in these alluvial aquifers typically is 1.5–
6.1 m. Recharge to alluvial aquifers is primarily from
precipitation that infiltrates through overlying unsaturated
surficial materials. Besides, water enters the aquifers
along losing stream reaches. Groundwater in alluvial
aquifers discharges to gaining stream reaches, providing
base flow (Olcott 1992). Underlying or laterally adjacent
bedrock aquifers may either receive or contribute
groundwater to alluvial aquifers (Olcott 1992). The pres-
ence of permeable sands and gravels, shallow depths to
water table, and the absence of overlying confining units
make alluvial aquifers susceptible to agricultural con-
tamination from land use activities (Hoyer and Hallberg
1991).
Bedrock aquifers are another basic class of Iowa’s
groundwater resources. Bedrock consists of sedimentary
rock layers, primarily limestone and dolomite, inter-lay-
ered with shale, siltstone, and sandstone. These rocks
originated as sediments deposited in ancient seas, rivers,
and deltas that occupied Iowa between 75 million (Creta-
ceous age) and 550 million years (Cambrian age). The total
thickness of these formations ranges from 1585 m in
southwest Iowa to about 244 m in the north-east (Prior
et al. 2003). This sequence of sedimentary rocks varies
widely in its ability to store and transmit water. The study
site has two types of bedrock aquifers, the Silurian-Devo-
nian Aquifer and the Ordovician aquifer.
Land use
About 89% of the land area in the state of Iowa is in farms.
Land use is based primarily on agriculture and agriculture-
related industry. The principal crops are corn, soybeans,
oats, hay, and pasture on unirrigated lands. Iowa produces
approximately 19% of the nation’s corn for grain and about
17% of the nation’s soybeans (USDA 2006). In addition to
row-crop agriculture, Iowa produces large quantities of
hogs, cattle, sheep and poultry. The land use of the area is
greatly influenced by agricultural activities, which are
primarily associated with growing corn and soybeans.
Consequently, pollution of groundwater in the area is of
primary concern to various groups including land use
developers, water quality researchers, and multiple end-
users.
Materials and methods
Sampling methods
Twenty private wells were sampled from May through
September 2006 in Cedar Falls, Janesville, and Waverly
areas of northeast Iowa. Additionally, ten surface water
sites were sampled, including eight in the Cedar River
main channel and its tributaries, one in the Shell Rock
River, and one in the Beaver Creek. Each site was sampled
in May, July, and September. Water samples were col-
lected in High Density Polyethylene (HDPE) plastic bottles
of 120 mL capacity. At the time of collection, on-site
testing was done for dissolved oxygen (DO). After col-
lection, samples were placed in an ice cooler to transport
back to the laboratory, and then refrigerated until they were
analyzed. Some of the water samples were sent to the
Cornell Isotope Lab (COIL) in Cornell University, New
York for nitrogen isotope analysis.
Lab analysis
The concentrations of dissolved chloride, nitrate, and sul-
fate in water were determined by ion chromatography
(Dionex� Model DX-120) under suppressed conductivity.
Ion elution was accomplished by using a CO3–HCO3
solution. The flow rate was set at 1.75 mL/min. The ana-
lytical margin of error was ±0.5 mg/L.
At Cornell Isotope Lab, samples were analyzed by using
a Thermo Delta plus isotope ratio mass spectrometer that is
specifically designed for analysis of the light element
Environ Earth Sci
123
isotope ratios of C, N, O, and H. Interfaced to the machine
is a Carlo Erba NC2500 elemental analyzer. Samples were
combusted at 1,000�C in the presence of chromium and
copper oxides and reduced to N2 using copper wire at
650�C. Water was removed from the sample using a
magnesium perchlorate water trap. The N2 was then sep-
arated in a 3 m gas chromatography column and analyzed
in the isotope ratio mass spectrometer. All of this was done
in continuous flow mode (which means that ultra-high
purity helium was the carrier gas). Samples were measured
against various in-house standards, which are biannually
calibrated against international reference materials. Both
samples and standards were calibrated against the Atmo-
spheric Air reference scale.
Fig. 2 Location of the Cedar River Basin in east-central Iowa (USGS 2000)
Environ Earth Sci
123
Results and discussion
Dissolved oxygen
There was a general decrease in Dissolved Oxygen (DO) in
groundwater from the month of May to September. In
alluvial aquifers, the wells are less than 9.1 m deep. The
DO levels in these wells ranged from 4.9 to 7 mg/L in
May. In the bedrock aquifer, wells range from 15.2 to
48.8 m in depth where the observed levels of DO were 2.9–
6.9 mg/L. The DO concentrations were within the expected
range in both aquifers. The observed levels of DO in sur-
face water were generally higher in comparison to
groundwater. According to Iowa DNR water quality stan-
dards, surface water DO must be 5 mg/L or greater (Iowa
DNR 2002). The Cedar River and its tributaries, the Shell
Rock River, and the Beaver Creek, are all perennial water
bodies. The average DO concentration in these streams
ranged from 2.9 to 9.6 mg/L. The DO levels gradually
decreased in July. During this month, the water level was
very low, which prevented mixing and aeration of atmo-
spheric oxygen into the water.
Nitrate
Ten out of 20 groundwater wells exceeded MCL of 45 mg/L
in NO3- concentration during this study. In addition, eight
out of ten surface water sites exceeded the MCL.
Nitrate concentration ranged from below detection at
site 18 (depth 38.1 m) and site 20 (depth 22.9 m) to
75.5 mg/L at site 14 (depth 36.6 m). Refer to Fig. 1 for site
locations. Sampling site 20 is purely a residential area with
no agricultural activities around it. Site 14 has barnyards,
horse farming, lawn and agricultural activities in the area,
which is likely to have contributed to the high concentra-
tion of nitrate in groundwater. The fields in the area receive
direct application of chemical fertilizers in April. The
recorded averages of dissolved nitrate in groundwater were
39.47 mg/L in May, 38 mg/L in July, and 30 mg/L in
September. The decreasing trend is attributed to the grad-
ual uptake of nitrate by growing crops as well as the
cyanobacterial growth in the aquatic systems.
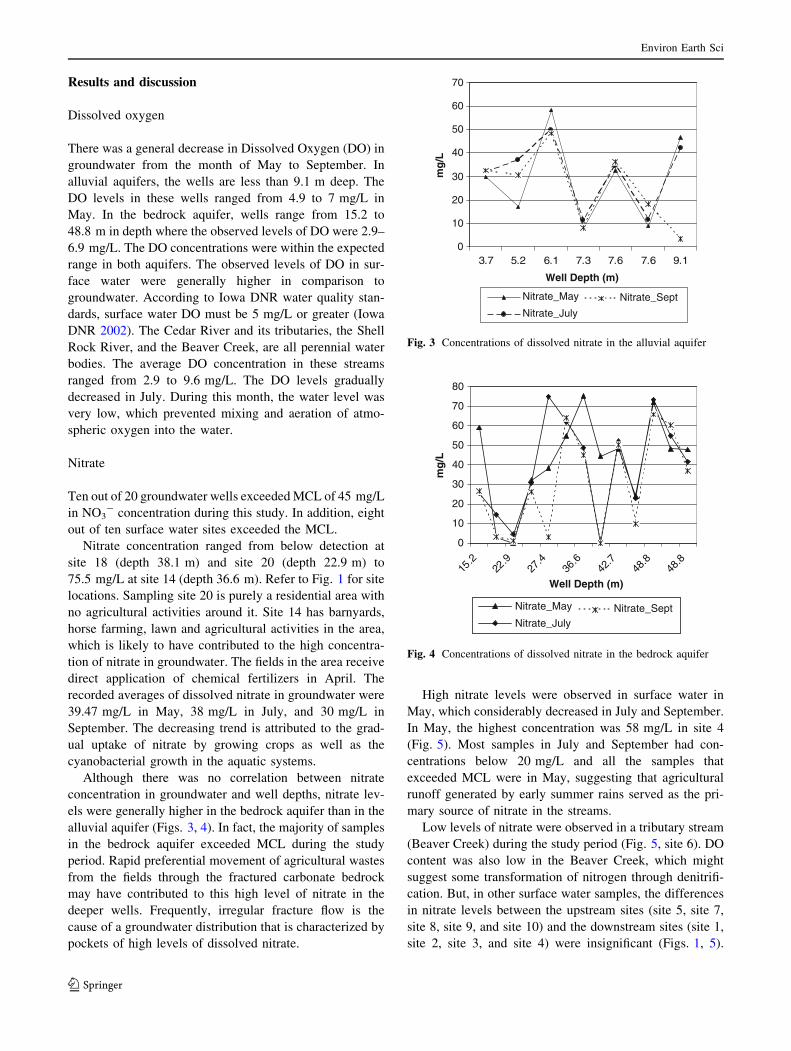
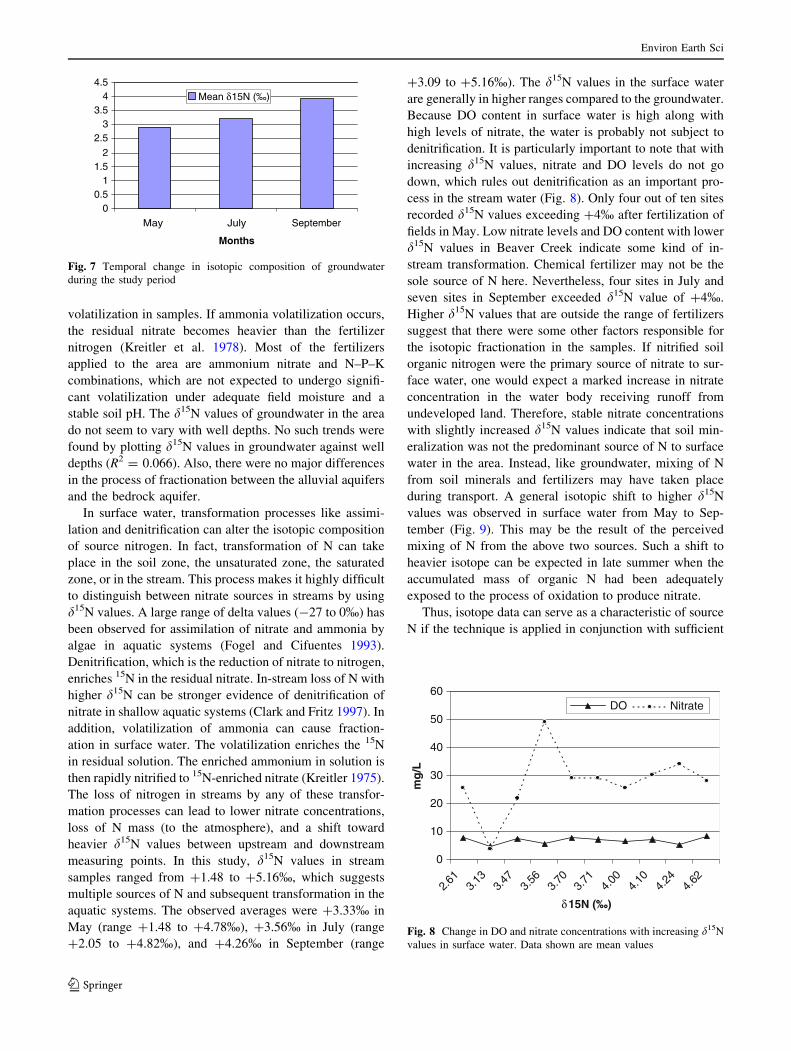
Although there was no correlation between nitrate
concentration in groundwater and well depths, nitrate lev-
els were generally higher in the bedrock aquifer than in the
alluvial aquifer (Figs. 3, 4). In fact, the majority of samples
in the bedrock aquifer exceeded MCL during the study
period. Rapid preferential movement of agricultural wastes
from the fields through the fractured carbonate bedrock
may have contributed to this high level of nitrate in the
deeper wells. Frequently, irregular fracture flow is the
cause of a groundwater distribution that is characterized by
pockets of high levels of dissolved nitrate.
High nitrate levels were observed in surface water in
May, which considerably decreased in July and September.
In May, the highest concentration was 58 mg/L in site 4
(Fig. 5). Most samples in July and September had con-
centrations below 20 mg/L and all the samples that
exceeded MCL were in May, suggesting that agricultural
runoff generated by early summer rains served as the pri-
mary source of nitrate in the streams.
Low levels of nitrate were observed in a tributary stream
(Beaver Creek) during the study period (Fig. 5, site 6). DO
content was also low in the Beaver Creek, which might
suggest some transformation of nitrogen through denitrifi-
cation. But, in other surface water samples, the differences
in nitrate levels between the upstream sites (site 5, site 7,
site 8, site 9, and site 10) and the downstream sites (site 1,
site 2, site 3, and site 4) were insignificant (Figs. 1, 5).
0
10
20
30
40
50
60
70
3.7 5.2 6.1 7.3 7.6 7.6 9.1
Well Depth (m)
mg
/L
Nitrate_May
Nitrate_July
Nitrate_Sept
Fig. 3 Concentrations of dissolved nitrate in the alluvial aquifer
0
10
20
30
40
50
60
70
80
15.2
22.9
27.4
36.6
42.7
48.8
48.8
Well Depth (m)
mg
/L
Nitrate_May
Nitrate_JulyNitrate_Sept
Fig. 4 Concentrations of dissolved nitrate in the bedrock aquifer
Environ Earth Sci
123

Also, the DO contents were fairly high in these sites,
suggesting that denitrification was probably not an impor-
tant N transformation process occurring in surface water.
Isotope analysis
The study area is dominated by agricultural activities, with
the majority of land cover being corn, soybean, and forest.
These are the sources that have high potential to contam-
inate groundwater in the area. The observed d15N values in
groundwater ranged from ?0.45% in May to ?5.35% in
September. The range of d15N values indicates inorganic
chemical fertilizers and soil organic nitrogen as the
potential sources of nitrate in groundwater. These fertiliz-
ers have very low original d15N values, which reflect the
characteristics of source nitrogen (d15N: -4 to ?4%).
However, some fertilizers can have d15N ranges from -8
to ?7% (Hubner 1986). Consequently, information on land
use practices must be accurately incorporated while
applying isotope techniques in source determination of
nitrogen.
The isotopic composition of inorganic N in groundwater
is not only controlled by its origin but may also be influ-
enced by microbial and physical processes such as ion
exchange, nitrification, and denitrification (Mariotti et al.
1981). A major difficulty associated with the use of d15N to
assess the origins of nitrate is its inability to distinguish
between conservative and non-conservative fractionation
of isotopes resulting from microbial processes. For exam-
ple, loss of nitrate through denitrification can result in a
marked enrichment in 15N content of the remaining nitrate
(Mariotti et al. 1981). But, enrichment in 14N content of the
nitrate occurs during nitrification (Delwiche and Steyn
1970). In the area samples, d15N values remain low even
when the levels of dissolved nitrate in groundwater go up
or remain unchanged. In addition, there is no marked
depletion in DO content of the groundwater (Fig. 6). The
maximum d15N value in these samples is ?5.35%, which
indicates that either fertilizer or soil nitrate is the primary
source of N in groundwater.
In May, the maximum d15N value in groundwater was
?4.15% at site 17 (well depth 48.8 m). The observed
minimum in the area was ?0.45 % at site 16 (well depth:
7.3 m). The average d15N value in May was ?2.91%(Fig. 7). In July, the maximum d15N value of ?4.35% and
the minimum of ?1.35% were observed, the average being
?3.20 %. In September, the d15N values of groundwater
further increased to an average of ?3.91% (max ?5.35%;
min ?1.65%). In May, d15N value exceeded ?4% in four
out of 20 sites. Besides, five sites in July and 11 sites in
September recorded d15N values exceeding ?4%. The
general isotopic shift to higher d15N values from May to
September could be attributed to a variety of reasons
(Fig. 7). One could be the mineralization of soil nitrate
where organic nitrogen is oxidized to nitrate. Many
investigators have reported the resulting d15N values to be
greater than ?5% where soil mineralization is the major
transformation process. Clearly, the delta values of
groundwater obtained in this study are mostly below ?5%.
One way to explain the data is to interpret them by a
mixing model. It is possible that N from soil minerals and
fertilizers are mixed together at some point in their trans-
port pathways. This would place the final delta values
somewhere between the expected values for the two dif-
ferent sources. Given the land use and the observed data,
this may well have been the primary mechanism behind the
isotopic make up of groundwater in the area. Nitrification
alone could not have been the mechanism because it
generally gives the samples delta values that are much
lower than those observed in the study area. Another pos-
sible mechanism of isotopic transformation is ammonia
0
10
20
30
40
50
60
70
1 2 3 4 5 6 7 8 9 10Site
mg
/L
Nitrate_May
Nitrate_July
Nitrate_Sept
Fig. 5 Concentrations of dissolved nitrate in surface water
0
10
20
30
40
50
60
70
1.86
2.50
2.93
3.27
3.35
3.47
3.51
3.64
3.96
4.15
δ15N
mg
/L
DO Nitrate
Fig. 6 Change in DO and nitrate concentrations with increasing d15N
values in groundwater. Data shown are mean values
Environ Earth Sci
123
volatilization in samples. If ammonia volatilization occurs,
the residual nitrate becomes heavier than the fertilizer
nitrogen (Kreitler et al. 1978). Most of the fertilizers
applied to the area are ammonium nitrate and N–P–K
combinations, which are not expected to undergo signifi-
cant volatilization under adequate field moisture and a
stable soil pH. The d15N values of groundwater in the area
do not seem to vary with well depths. No such trends were
found by plotting d15N values in groundwater against well
depths (R2 = 0.066). Also, there were no major differences
in the process of fractionation between the alluvial aquifers
and the bedrock aquifer.
In surface water, transformation processes like assimi-
lation and denitrification can alter the isotopic composition
of source nitrogen. In fact, transformation of N can take
place in the soil zone, the unsaturated zone, the saturated
zone, or in the stream. This process makes it highly difficult
to distinguish between nitrate sources in streams by using
d15N values. A large range of delta values (-27 to 0%) has
been observed for assimilation of nitrate and ammonia by
algae in aquatic systems (Fogel and Cifuentes 1993).
Denitrification, which is the reduction of nitrate to nitrogen,
enriches 15N in the residual nitrate. In-stream loss of N with
higher d15N can be stronger evidence of denitrification of
nitrate in shallow aquatic systems (Clark and Fritz 1997). In
addition, volatilization of ammonia can cause fraction-
ation in surface water. The volatilization enriches the 15N
in residual solution. The enriched ammonium in solution is
then rapidly nitrified to 15N-enriched nitrate (Kreitler 1975).
The loss of nitrogen in streams by any of these transfor-
mation processes can lead to lower nitrate concentrations,
loss of N mass (to the atmosphere), and a shift toward
heavier d15N values between upstream and downstream
measuring points. In this study, d15N values in stream
samples ranged from ?1.48 to ?5.16%, which suggests
multiple sources of N and subsequent transformation in the
aquatic systems. The observed averages were ?3.33% in
May (range ?1.48 to ?4.78%), ?3.56% in July (range
?2.05 to ?4.82%), and ?4.26% in September (range
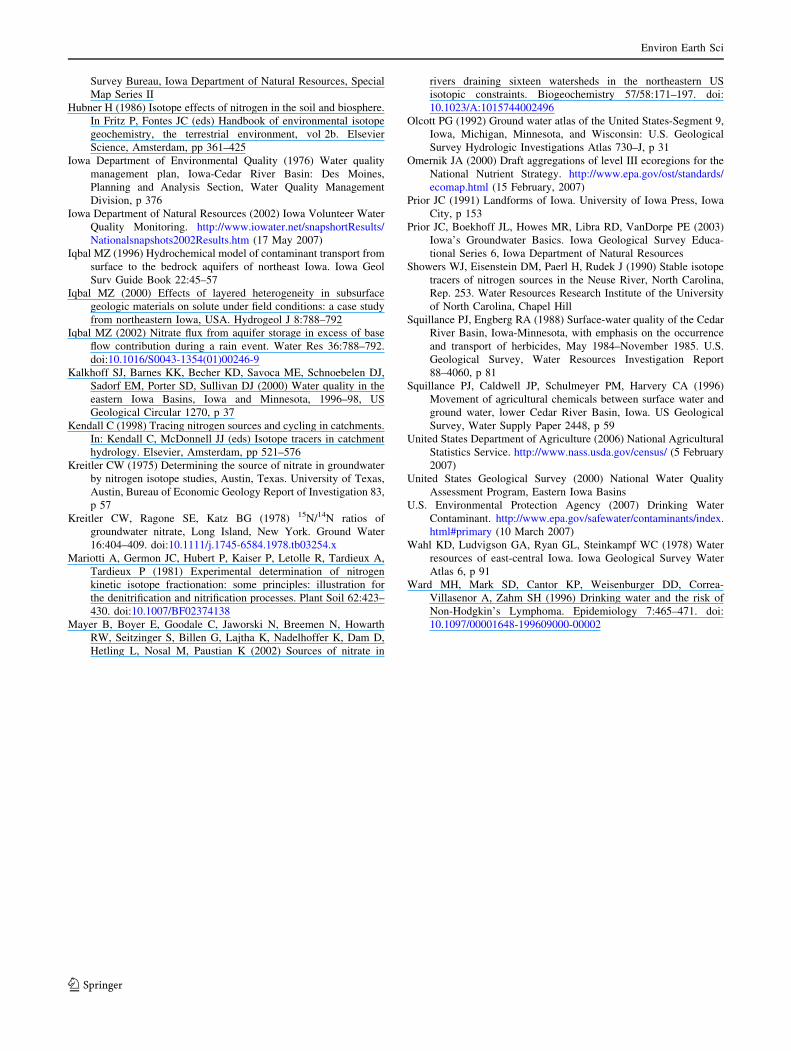
?3.09 to ?5.16%). The d15N values in the surface water
are generally in higher ranges compared to the groundwater.
Because DO content in surface water is high along with
high levels of nitrate, the water is probably not subject to
denitrification. It is particularly important to note that with
increasing d15N values, nitrate and DO levels do not go
down, which rules out denitrification as an important pro-
cess in the stream water (Fig. 8). Only four out of ten sites
recorded d15N values exceeding ?4% after fertilization of
fields in May. Low nitrate levels and DO content with lower
d15N values in Beaver Creek indicate some kind of in-
stream transformation. Chemical fertilizer may not be the
sole source of N here. Nevertheless, four sites in July and
seven sites in September exceeded d15N value of ?4%.
Higher d15N values that are outside the range of fertilizers
suggest that there were some other factors responsible for
the isotopic fractionation in the samples. If nitrified soil
organic nitrogen were the primary source of nitrate to sur-
face water, one would expect a marked increase in nitrate
concentration in the water body receiving runoff from
undeveloped land. Therefore, stable nitrate concentrations
with slightly increased d15N values indicate that soil min-
eralization was not the predominant source of N to surface
water in the area. Instead, like groundwater, mixing of N
from soil minerals and fertilizers may have taken place
during transport. A general isotopic shift to higher d15N
values was observed in surface water from May to Sep-
tember (Fig. 9). This may be the result of the perceived
mixing of N from the above two sources. Such a shift to
heavier isotope can be expected in late summer when the
accumulated mass of organic N had been adequately
exposed to the process of oxidation to produce nitrate.
Thus, isotope data can serve as a characteristic of source
N if the technique is applied in conjunction with sufficient
00.5
11.5
2
2.53
3.54
4.5
May
Months
SeptemberJuly
Mean δ15N (‰)
Fig. 7 Temporal change in isotopic composition of groundwater
during the study period
0
10
20
30
40
50
60
2.61
3.13
3.47
3.56
3.70
3.71
4.00
4.10
4.24
4.62
δ15N (‰)
mg
/L
DO Nitrate
Fig. 8 Change in DO and nitrate concentrations with increasing d15N
values in surface water. Data shown are mean values
Environ Earth Sci
123

knowledge of land use practices in the area. The method is
effective even when nitrate concentrations vary consider-
ably. The isotopic analysis of water samples from the
current study demonstrates that inorganic fertilizers along
with some overlapping sources of organic nitrogen provide
dissolved nitrate in the area’s groundwater. Animal and
human wastes were not detected as the potential contami-
nant in any samples. Similarly, d15N values were not high
enough to indicate denitrification as an important process
of fractionation. High DO and stable nitrate levels support
this idea.
Summary and conclusion
In this study, groundwater from 20 private wells and sur-
face water from ten stream locations were sampled. Of
those, ten groundwater and eight surface water samples had
dissolved nitrate that exceeded MCL, most of them in early
summer. Nitrate concentrations ranged from below detec-
tion to 75.5 mg/L in groundwater, and from below detec-
tion to 58 mg/L in surface water. However, nitrate
concentrations in surface water decreased dramatically by
late summer because most agricultural runoff occurred
during the rainfall events of May and June. Nitrate con-
centrations also varied with well depths. Levels were
higher in the bedrock aquifers than the alluvial aquifers.
This may be due to the presence of residual nitrate in the
bedrock from previous years and its slower response to
rainfall events.
The analysis of d15N of dissolved nitrate in groundwater
and surface water indicated commercial fertilizers and
organic nitrate as the possible sources of N in the area.
However, in-stream transformation of nitrogen made such
interpretations somewhat difficult for the surface water.
The observed d15N values in groundwater ranged from
?0.45 to ?5.35%. Besides, the DO was high and the
nitrate concentrations were relatively stable, suggesting
that denitrification was unlikely in the area’s groundwater.
The observed d15N values also indicate that there was no
nitrification in the soil, which generally releases very light
isotopes. Besides, no correlation was found between d15N
values and the well depths.
The d15N values in surface water ranged from ?1.48 to
?5.16%, which again suggests inorganic fertilizers and
soil mineral nitrate as the possible sources of N. As indi-
cated by the d15N values, nitrogen from animal and human
wastes was not present in any sample. This is further
supported by the low chloride concentrations in the water.
In this study, the d15N distribution in water confirms the
extensive use of fertilizers in the area. Best Management
Practices (BMP) in agriculture is the only way to reduce
the over-application of inorganic fertilizers, thereby low-
ering the concentrations of dissolved nitrate. Since no
single set of BMP applies to all situations, multiple mea-
sures should be taken to address the problem. In addition,
use of manure as a nutrient source should be widely pro-
moted to decrease the use of inorganic fertilizers. Finally,
the study shows that agricultural activities are negatively
impacting the water quality of the area and that stable
isotope technique can be quite useful in both source iden-
tification and nitrogen transformation studies.
References
Avisar D, Kronfeld J, Talma AS (2009) Amelioration of groundwater
nitrate contamination following installation of a central sewage
system in two Israeli villages. Environ Geol. doi:10.1007/
s00254-008-1525-4
Battaglin W, Kendall C, Cecily C, Chang Y, Steven RS, Campbell D
(2001) Chemical and isotopic evidence of nitrogen transforma-
tion in the Mississippi River, 1997–98. Hydrol Process 15:1285–
1300. doi:10.1002/hyp.214
Bohlke JK (2002) Groundwater recharge and agricultural contami-
nation. Hydrogeol J 10:153–179. doi:10.1007/s10040-001-
0183-3
Clark I, Fritz P (1997) Environmental isotopes in hydrogeology. CRC
Press LLC, Boca Raton, p 328
Delwiche CC, Steyn PL (1970) Nitrogen isotope fractionation in soils
and microbial reactions. Environ Sci Technol 4:929–935.
doi:10.1021/es60046a004
Fogel ML, Cifuentes LA (1993) Isotope fractionation during primary
production. In: Engel MH, Macko SA (eds) Organic geochem-
istry. Plenum Press, New York, pp 73–98
Fogg G, Rolston D, Decker D, Louie D, Grismer M (1998) Spatial
variations in nitrogen isotope values beneath nitrate contamina-
tion sources. Ground Water 36:418–426. doi:10.1111/j.1745-
6584.1998.tb02812.x
Forman D (1989) Are nitrates a significant risk factor in human
cancer? Cancer Surv 8:443–458
Gormly JR, Spalding RF (1979) Sources and concentrations of
nitrate-nitrogen in groundwater of the Central Plate Region,
Nebraska. Ground Water 17:291–301. doi:10.1111/j.1745-
6584.1979.tb03323.x
Hoyer BE, Hallberg GR (1991) Groundwater vulnerability regions of
Iowa: Energy and Geological Resources Division, Geological
00.5
11.5
2
2.53
3.54
4.5
May July September
Months
Mean δ15N (‰)
Fig. 9 Temporal change in isotopic composition of surface water
during the study period
Environ Earth Sci
123
Survey Bureau, Iowa Department of Natural Resources, Special
Map Series II
Hubner H (1986) Isotope effects of nitrogen in the soil and biosphere.
In Fritz P, Fontes JC (eds) Handbook of environmental isotope
geochemistry, the terrestrial environment, vol 2b. Elsevier
Science, Amsterdam, pp 361–425
Iowa Department of Environmental Quality (1976) Water quality
management plan, Iowa-Cedar River Basin: Des Moines,
Planning and Analysis Section, Water Quality Management
Division, p 376
Iowa Department of Natural Resources (2002) Iowa Volunteer Water
Quality Monitoring. http://www.iowater.net/snapshortResults/
Nationalsnapshots2002Results.htm (17 May 2007)
Iqbal MZ (1996) Hydrochemical model of contaminant transport from
surface to the bedrock aquifers of northeast Iowa. Iowa Geol
Surv Guide Book 22:45–57
Iqbal MZ (2000) Effects of layered heterogeneity in subsurface
geologic materials on solute under field conditions: a case study
from northeastern Iowa, USA. Hydrogeol J 8:788–792
Iqbal MZ (2002) Nitrate flux from aquifer storage in excess of base
flow contribution during a rain event. Water Res 36:788–792.
doi:10.1016/S0043-1354(01)00246-9
Kalkhoff SJ, Barnes KK, Becher KD, Savoca ME, Schnoebelen DJ,
Sadorf EM, Porter SD, Sullivan DJ (2000) Water quality in the
eastern Iowa Basins, Iowa and Minnesota, 1996–98, US
Geological Circular 1270, p 37
Kendall C (1998) Tracing nitrogen sources and cycling in catchments.
In: Kendall C, McDonnell JJ (eds) Isotope tracers in catchment
hydrology. Elsevier, Amsterdam, pp 521–576
Kreitler CW (1975) Determining the source of nitrate in groundwater
by nitrogen isotope studies, Austin, Texas. University of Texas,
Austin, Bureau of Economic Geology Report of Investigation 83,
p 57
Kreitler CW, Ragone SE, Katz BG (1978) 15N/14N ratios of
groundwater nitrate, Long Island, New York. Ground Water
16:404–409. doi:10.1111/j.1745-6584.1978.tb03254.x
Mariotti A, Germon JC, Hubert P, Kaiser P, Letolle R, Tardieux A,
Tardieux P (1981) Experimental determination of nitrogen
kinetic isotope fractionation: some principles: illustration for
the denitrification and nitrification processes. Plant Soil 62:423–
430. doi:10.1007/BF02374138
Mayer B, Boyer E, Goodale C, Jaworski N, Breemen N, Howarth
RW, Seitzinger S, Billen G, Lajtha K, Nadelhoffer K, Dam D,
Hetling L, Nosal M, Paustian K (2002) Sources of nitrate in
rivers draining sixteen watersheds in the northeastern US
isotopic constraints. Biogeochemistry 57/58:171–197. doi:
10.1023/A:1015744002496
Olcott PG (1992) Ground water atlas of the United States-Segment 9,
Iowa, Michigan, Minnesota, and Wisconsin: U.S. Geological
Survey Hydrologic Investigations Atlas 730–J, p 31
Omernik JA (2000) Draft aggregations of level III ecoregions for the
National Nutrient Strategy. http://www.epa.gov/ost/standards/
ecomap.html (15 February, 2007)
Prior JC (1991) Landforms of Iowa. University of Iowa Press, Iowa
City, p 153
Prior JC, Boekhoff JL, Howes MR, Libra RD, VanDorpe PE (2003)
Iowa’s Groundwater Basics. Iowa Geological Survey Educa-
tional Series 6, Iowa Department of Natural Resources
Showers WJ, Eisenstein DM, Paerl H, Rudek J (1990) Stable isotope
tracers of nitrogen sources in the Neuse River, North Carolina,
Rep. 253. Water Resources Research Institute of the University
of North Carolina, Chapel Hill
Squillance PJ, Engberg RA (1988) Surface-water quality of the Cedar
River Basin, Iowa-Minnesota, with emphasis on the occurrence
and transport of herbicides, May 1984–November 1985. U.S.
Geological Survey, Water Resources Investigation Report
88–4060, p 81
Squillance PJ, Caldwell JP, Schulmeyer PM, Harvery CA (1996)
Movement of agricultural chemicals between surface water and
ground water, lower Cedar River Basin, Iowa. US Geological
Survey, Water Supply Paper 2448, p 59
United States Department of Agriculture (2006) National Agricultural
Statistics Service. http://www.nass.usda.gov/census/ (5 February
2007)
United States Geological Survey (2000) National Water Quality
Assessment Program, Eastern Iowa Basins
U.S. Environmental Protection Agency (2007) Drinking Water
Contaminant. http://www.epa.gov/safewater/contaminants/index.
html#primary (10 March 2007)
Wahl KD, Ludvigson GA, Ryan GL, Steinkampf WC (1978) Water
resources of east-central Iowa. Iowa Geological Survey Water
Atlas 6, p 91
Ward MH, Mark SD, Cantor KP, Weisenburger DD, Correa-
Villasenor A, Zahm SH (1996) Drinking water and the risk of
Non-Hodgkin’s Lymphoma. Epidemiology 7:465–471. doi:
10.1097/00001648-199609000-00002
Environ Earth Sci
123