
Evidence of elevation effect on stable isotopes of water along ...
69
HAL Id: hal-02180290 https://hal.archives-ouvertes.fr/hal-02180290 Submitted on 22 Oct 2021 HAL is a multi-disciplinary open access archive for the deposit and dissemination of sci- entific research documents, whether they are pub- lished or not. The documents may come from teaching and research institutions in France or abroad, or from public or private research centers. L’archive ouverte pluridisciplinaire HAL, est destinée au dépôt et à la diffusion de documents scientifiques de niveau recherche, publiés ou non, émanant des établissements d’enseignement et de recherche français ou étrangers, des laboratoires publics ou privés. Distributed under a Creative Commons Attribution - NonCommercial| 4.0 International License Evidence of elevation effect on stable isotopes of water along highlands of a humid tropical mountain belt (Western Ghats, India) experiencing monsoonal climate M. Tripti, L. Lambs, I. Moussa, D. Corenblit To cite this version: M. Tripti, L. Lambs, I. Moussa, D. Corenblit. Evidence of elevation effect on stable isotopes of water along highlands of a humid tropical mountain belt (Western Ghats, India) experiencing monsoonal climate. Journal of Hydrology, Elsevier, 2019, 573, pp.469-485. 10.1016/j.jhydrol.2019.03.086. hal- 02180290
-
Upload
khangminh22 -
Category
Documents
-
view
1 -
download
0
Transcript of Evidence of elevation effect on stable isotopes of water along ...

HAL Id: hal-02180290https://hal.archives-ouvertes.fr/hal-02180290
Submitted on 22 Oct 2021
HAL is a multi-disciplinary open accessarchive for the deposit and dissemination of sci-entific research documents, whether they are pub-lished or not. The documents may come fromteaching and research institutions in France orabroad, or from public or private research centers.
L’archive ouverte pluridisciplinaire HAL, estdestinée au dépôt et à la diffusion de documentsscientifiques de niveau recherche, publiés ou non,émanant des établissements d’enseignement et derecherche français ou étrangers, des laboratoirespublics ou privés.
Distributed under a Creative Commons Attribution - NonCommercial| 4.0 InternationalLicense
Evidence of elevation effect on stable isotopes of wateralong highlands of a humid tropical mountain belt
(Western Ghats, India) experiencing monsoonal climateM. Tripti, L. Lambs, I. Moussa, D. Corenblit
To cite this version:M. Tripti, L. Lambs, I. Moussa, D. Corenblit. Evidence of elevation effect on stable isotopes of wateralong highlands of a humid tropical mountain belt (Western Ghats, India) experiencing monsoonalclimate. Journal of Hydrology, Elsevier, 2019, 573, pp.469-485. �10.1016/j.jhydrol.2019.03.086�. �hal-02180290�

1
Evidence of elevation effect on stable isotopes of water along highlands of a humid 1
tropical mountain belt (Western Ghats, India) experiencing monsoonal climate 2
M. Tripti1, 2, L. Lambs1, *, I. Moussa1, D. Corenblit1, 3 3
1Ecolab, Université de Toulouse III, Paul Sabatier University, CNRS, INPT, 118 route de 4
Narbonne, F‐31062 Toulouse, France. 5
2National Centre for Earth Science Studies, Ministry of Earth Sciences, Akkulam, 695011 6
Thiruvananthapuram, India. 7
3Université Clermont Auvergne, CNRS, GEOLAB, F-63000 Clermont-Ferrand, France. 8
*Corresponding author: [email protected] 9
10
Abstract 11
Forest ecosystem plays a major role in controlling moisture dynamics over the continents, 12
particularly in the humid tropics. The montane forest ecosystem in South India supports a 13
characteristic warm tropical climate which affects the weather pattern and the monsoon 14
system. This study focuses on better understanding of the influence of dual monsoonal rainfall 15
on the surface water and groundwater in south-west India, and the role of the Western Ghats 16
mountain belt in governing the water isotope characteristics (i.e., isotopic elevation, rainfall 17
amount and continental effects) in the humid tropics of South India. This is achieved through 18
a spatial study of stable isotope ratios of surface and subsurface water (oxygen, δ18O and 19
hydrogen, δ2H), collected from different tropical river basins located between Kozhikode 20
(Kerala, 10° 30’ N) and Udupi (Karnataka, 13° 30’ N), in the wettest places and highest peaks 21
of the Western Ghats between 2011 and 2014. The results on stable isotope ratios of ground 22
© 2019 published by Elsevier. This manuscript is made available under the CC BY NC user licensehttps://creativecommons.org/licenses/by-nc/4.0/
Version of Record: https://www.sciencedirect.com/science/article/pii/S0022169419303154Manuscript_d1d19a09d8b291d4247b8d5c4e599149

2
water and springs show that the water from the tropical mountain belt of the Western Ghats 23
exhibit a low elevation effect with an isotopic lapse rate of 0.09 ‰/100 m for δ18O up to 2050 24
m asl. Beyond 2050 m asl, a considerable effect of elevation with an isotopic lapse rate of 2.5 25
‰/100 m for δ18O is observed. The water samples from the Nilgiri ranges (1950-2300 m asl) 26
exhibited higher isotopic lapse rate of 1.5 ‰/100 m for δ18O unlike that of the mountains 27
(Ezhimala, Agumbe and Chembra) close to the eastern Arabian Sea. The difference in 28
isotopic lapse rate is mainly dependent on (i) the dominating seasonality of oceanic source 29
moisture over the subcontinent leading to higher depletion of heavy isotopes for more inland 30
groundwater during the winter monsoon on the eastern slopes of the Western Ghats (ii) the 31
degree of terrestrial moisture feedback mechanisms along the windward slopes of the Ghats 32
belt (i.e., Arabian Sea coast of India) leading to relative enrichment of heavy isotopes in 33
groundwater fed by the highly recycled vapour sources rather than depletion due to amount, 34
elevation or continental effect, and iii) deep cooling of orographically uplifted air moisture at 35
high elevations of inland tropical mountains. The observed isotopic elevation effect on the 36
groundwater and surface water is unique and constrained by specific time scale and mountain 37
ranges within the Western Ghats belt. This study provides new understanding on factors 38
controlling hydrological budget along higher parts of the Western Ghats mountain belt in 39
South India experiencing humid tropical climate. 40
Keywords 41
Water cycle; stable isotope; isotopic elevation (altitude) effect; tropical mountainous river, 42
spring, groundwater, Indian monsoon; Western Ghats 43
44
45
46

3
1. Introduction 47
The rich terrestrial biodiversity in the world is harboured by the humid tropical forests, which 48
cover about 19.6 million km2 of Earth’s surface (Pimm and Sugden, 1994). Asia has the 49
second largest humid tropical forest area, after South America with its huge Amazon basin. 50
The humid tropical forests are localized over the hills and mountains in Asia, particularly in 51
the Indian subcontinent, and play a crucial role in controlling the regional moisture dynamics. 52
About half the world population lives in this part of Asia where agriculture (mainly rice and 53
wheat) depends on the monsoon rainfall. The disequilibrium in heating system of water and 54
land over the Earth’s surface leads to change in moisture laden wind direction which in turn 55
supports seasonality of monsoon rainfall. During the summer monsoon season (June - 56
September), there is a large flow of air moisture from the ocean towards land and this flow is 57
reversed during the winter monsoon season (October – December) leading to dual monsoon 58
system in the subcontinent. The availability of continuous flow of moisture over the humid 59
tropical regions makes it a prominent zone of anthropogenic activities. Although 60
anthropogenic influence has been active in tropical regions for thousands of years, the 61
encroachment over the humid forest ecosystem has been intense in recent decades. This rapid 62
pace of change in the humid tropical forest directly impacted the global climate (Vitousek et 63
al., 1997). However, the seasonal climatic variability over the tropics is caused by the 64
monsoonal precipitation which is largely influenced by the Inter-Tropical Convergence Zone 65
(ITCZ). As the ITCZs do not remain the same throughout the year, the tropical zones 66
experience a wet summer monsoon and a dry winter monsoon as a part of the Hadley cycle. 67
Consequently, the tropical regions exhibit less seasonal variability in stable isotope ratios 68
(oxygen isotope ratio, δ18O and hydrogen isotope ratio, δ2H) of precipitation with temperature 69
compared to other climatic regions, as the precipitation is predominantly convective in nature 70
(Sturm et al., 2007). In addition, the small seasonal temperature variability in the tropical 71

4
region results in lesser seasonal variability of δ18O and δ2H in precipitation (Clark and Fritz, 72
1997). Thus, it is necessary to determine whether the variability in precipitation over the 73
tropics is limited to the strong seasonality of monsoon moisture source, or strongly influenced 74
by topography and the moisture feedback mechanisms over the continent. 75
76
1.1. Motivation 77
The impact of land-sea thermal contrast between Indian Ocean and Tibetan Plateau has been 78
critical for the onset and variability of Asian Summer Monsoon (Li and Yanai, 1996). The 79
major source of Indian Summer Monsoon (ISM) is the moisture brought by south-westerly 80
winds from northern Indian Ocean and Arabian Sea leading to rain along the west coast of 81
India and in the central and eastern parts of the Peninsula. The winter monsoon rain derives 82
moisture carried by the north-easterly winds moving from the Bay of Bengal, South China 83
Sea and continental vapour sources to provide precipitation to the eastern and south-eastern 84
parts of the Peninsular India (Mooley and Shukla, 1987). These two sources of moisture in the 85
two monsoon seasons are known to have distinct stable isotope ratios (δ18O and δ2H) whose 86
imprints are identifiable in the geographic distribution of isotopes in groundwater and surface 87
water (Deshpande et al., 2003; Tripti et al. 2016) and rain water (Lekshmy et al 2014; Warrier 88
et al., 2010). 89
A swift transition in monsoonal moisture distribution across short distances due to orography 90
is also well documented in the south Asian region (Biasutti et al., 2012; Xie et al., 2006). In 91
India, the two mountain ranges, i.e. the Himalayas (5000 - 8000 m asl) in the north and the 92
Western Ghats (700 - 2500 m asl) in the south, act as critical barriers for the moisture laden 93
winds leading to non-uniform monsoon rains over the subcontinent. In general, the 94
orographically induced monsoon regions experience heavy rainfall on the windward side 95

5
whereas a higher aridity is observed on the leeward side of the mountain ranges (Day et al., 96
2015). This non-uniform distribution of moisture over the continent is evident from the 97
distinct signatures of stable isotope ratios of rain water monitored for a particular location, 98
plateau and individual river basin in South India (Rahul et al., 2016; Resmi et al., 2016; 99
Yadava et al 2007). The δ2H data compiled for the precipitation and surface water over the 100
Indian subcontinent shows homogenous signature in southern part with relatively higher 101
isotope ratio (δ2H > -20 ‰) than the north and northeast India due to larger influence of 102
southwest monsoon (Hobson et al., 2012). The initial analysis on impact of climatic 103
conditions on water budgeting and local moisture recycling in the central part of the Western 104
Ghats through stable isotopes of rainwater, river water and groundwater have been reported in 105
our earlier study (Tripti et al., 2016). This study is carried out to provide a spatial monitoring 106
of water isotopes on a synoptic scale of the Western Ghats to account for the hydrological 107
budgeting and monsoonal climate along the humid tropical high mountains. 108
109
1.2. Historical background and current status of knowledge 110
To understand the hydrological cycle and its controlling secondary processes in large 111
ecologically sensitive and critical geomorphic area, there is a need to apply adapted tools and 112
models (McDonnell and Beven, 2014). Stable isotope hydrology is based on interpretation of 113
isotope ratio (δ2H, δ18O) and its secondary parameter (deuterium-excess, d = δ2H - 8 x δ18O; 114
Dansgaard, 1964) variability in precipitation which are governed by the origin of moisture 115
and cloud processes (Kaseke et al., 2018; Stumpp et al., 2014). Following the pioneering 116
stable isotope works in 1960s (Craig, 1961; Dansgaard, 1964; Epstein and Mayeda, 1953), 117
there has been a significant improvement in our understanding of hydrological cycle on a 118
global scale. Several studies have reported the main factors controlling composition of natural 119
6
isotopes in precipitation, and established their huge potential for the identification of water 120
origin and characterization of hydrological systems (Froehlich et al., 1998; Vitvar et al., 121
2004). Stable isotopes were used to address watershed scale analysis only later in 1970s. 122
Stable isotope tracers have proven to be useful in addressing basic water-focused questions 123
such as origin, flow path, mixing and residence time in the watershed (Dincer et al., 1970; 124
Kendall and McDonnell, 1998; Sklash, 1990). These questions form the basis for 125
understanding water availability, biogeochemical cycling, microbial production and other 126
ecological processes (McGuire and McDonnell, 2007). 127
It has been well documented that the distribution of precipitation isotopes depends on the 128
local temperature, latitude and elevation (Dansgaard, 1964; Friedman et al., 1964). For 129
instance, in the temperate regions, isotopic variations in precipitation have been correlated 130
with mean surface air temperatures (Aggarwal et al., 2012; Araguas-Araguas et al., 2000; 131
Bowen, 2008; Dansgaard, 1964; Rozanski et al., 1993; Sanchez-Murillo et al., 2013) whereas 132
in the tropics, several studies have reported the rainfall amount effect as the main controlling 133
factor (Bowen and Revenaugh, 2003; Rozanski et al., 1993). These controlling parameters 134
create an observable spatial and temporal variability in isotopic composition of water over a 135
geographic region which is large enough to trace regional and global patterns (Bowen et al., 136
2009). 137
Further, few studies on the mountainous tropical regions (Lachniet and Patterson, 2002, 2009; 138
Vuille et al., 2003) highlight the need for long-term monitoring networks to trace the impact 139
of orographic effect, moisture recycling and canopy interception, intense evapotranspiration, 140
and microclimate on the variability of isotopic composition of water. This study on the 141
Western Ghats, India aims to bring a better understanding on this tropical mountain belt 142
influencing the monsoonal rainfall characteristics through stable isotope investigation of 143
surface and sub-surface water over a period of four years observation (2011-2014). In 144
7
particular, this work deals with three major factors: (i) the elevation effect, (ii) the rainfall 145
amount effect and (iii) the continental effect. This is discussed in detail below. 146
(i) The elevation effect: Stable isotopes of water have been a useful proxy for understanding 147
the paleo-elevation changes of the mountains from different geographical regions 148
(Chamberlain and Poage, 2000). Moreover, the stable isotopes of water are conservative in 149
their mixing relationship and for explaining flow paths (McGuire and McDonnell, 2007). It is 150
well documented that water at higher elevation is highly depleted in heavy isotopes (18O and 151
2H) because of Rayleigh distillation and orography (Poage and Chamberlain, 2001) although 152
there are several secondary processes such as evaporation and isotope exchange with ambient 153
vapour which can modify these isotopic signatures (Dansgaard, 1964; Siegenthaler and 154
Oeschger, 1980). In general, the orographically uplifted cooler air mass condenses to form 155
vapour and precipitation which are lighter (16O and 1H) in their isotopic composition relative 156
to the original oceanic moisture brought by advection. Consequently, there is a relatively 157
higher input of lighter isotopes (resulting in low δ18O) to groundwater and surface water at 158
high elevations and/or on the leeward side of mountain ranges than on the lower elevations of 159
the windward side (Gonfiantini et al., 2001). 160
(ii) The rainfall amount effect: In addition to the elevation effect, there is a substantial 161
temporal and spatial variability in the stable isotope ratios of precipitation in different 162
ecosystems due to the rainfall amount effect (Dansgaard, 1964; Garcia et al., 1998; Gat, 1996; 163
Gonfiantini et al., 2001; Rozanski et al., 1992; Siegenthaler and Oeschger, 1980; Windhorst et 164
al., 2013). These studies have reported that the precipitation of higher amount exhibits lower 165
stable isotope ratio due to enrichment of lighter isotopes whereas the lower precipitation 166
amount exhibits higher stable isotope ratio due to enrichment of heavy isotopes. However, 167
this difference in the stable isotope ratios with precipitation amount tends to be smaller in the 168
tropical ecosystems (Scholl et al., 2009; Tripti et al., 2016) although there is a large variability 169

8
in precipitation amount. There are also studies reporting the reversed rainfall amount effect on 170
the stable isotope ratios (i.e., a positive correlation of δ18O and δ2H with precipitation amount) 171
of precipitation in the tropical region (Yadava et al., 2007). 172
(iii) The continental effect: This effect explains how the rainout system affects the isotopic 173
composition of the rainfall and groundwater. The mean δ18O of groundwater in both across 174
and along the region between eastern Arabian Sea coast and the western slopes of the Western 175
Ghats is around -3 ± 0.5 ‰, and depicts the signature of homogeneous summer monsoon 176
moisture input rather than that from the rainout history (Deshpande et al., 2003; Tripti et al., 177
2016). Recently the rain out effect has been reported for the west draining river basins of the 178
Western Ghats where it is observed that the effect is limited only to the onset of summer 179
monsoon and before the availability of excess moisture for undergoing recycling process 180
(Tripti et al., 2018). Several studies (Deshpande et al., 2003, Kumar et al., 1982; Negrel et al. 181
2011) have reported that more inland in the Deccan plateau, the contribution of the north-east 182
monsoon is significant and the mean groundwater exhibits higher depletion of heavy isotopes 183
with δ18O varying from -4 to -6 ‰. However, in the tropical semi-arid climatic region, 184
evaporation and post-evaporation processes have a greater impact on water isotopes. Most of 185
the streams are ephemeral and evapotranspiration exceeds rainfall. Farmers rely on 186
groundwater for agriculture which leads to over-pumping problems and water table decline in 187
this region of South India. 188
The identification of potential influence of these three effects on stable isotope ratio of water 189
is crucial for a better understanding of hydrological budgeting, microclimate conditions and 190
the past climatic changes as observed from paleo-records preserved in natural archives like 191
paleowater, tree ring, speleothem, paleosol, etc. 192
193

9
1.3. Objectives of this study 194
The present study focuses on determining the elevation effect on the isotopic composition of 195
surface and sub-surface water along the Western Ghats and its adjacent plateau in South India. 196
The aim is to account for the major factors controlling the surface and sub-surface hydrology 197
along the higher parts of mountain belt experiencing tropical monsoonal climate using stable 198
water isotopes as a tracer. The study involves investigation of stable isotopic composition of 199
groundwater from the Arabian Sea coast and contrasting hydrologic and climatic regions 200
towards inland, between latitude 10° 30’ N and 13° 30’ N, i.e. from Thrissur (Kerala) to 201
Agumbe (Karnataka). Whenever there was no well to access groundwater, water samples 202
were taken from spring/rivulet and pond/lake. 203
The three objectives of this study were to evaluate the following effects: 204
(i) The elevation effect on the stable isotope ratio of surface and sub-surface water in the 205
humid tropical mountain belt. Water samples were collected from higher peaks of the Western 206
Ghats in Kudremukh (1100 m asl), Charmadi Ghats (1800 m asl), Mullayanagiri peak (1930 207
m asl) and the Doddabetta peak in the Nilgiri range (2600 m asl), and compared with samples 208
from lower elevations. 209
(ii) The rainfall amount effect along the tropical monsoon forest belt where there are 210
discernible differences in the rainfall amount. The surface and sub-surface water from wetter 211
inland places of the Western Ghats, such as Agumbe (Karnataka) and the Wayanad plateau 212
around Sultan Bathery (Kerala) were sampled, and compared with those of coastal stations, 213
such as Bakrabail and Kozhikode (Kerala). 214
(iii) The effect of terrestrial factors (continental effect) on the stable isotope ratios of water in 215
the humid tropical mountain ecosystem. Water samples were collected from different hills of 216
the Western Ghats that are very close to the Arabian Sea (within 5 km) at Ezhimala (200 m 217
10
asl) up to the peaks inland within a distance of about 110 km from the sea at Doddabetta 218
(2600 m asl). 219
These objectives primarily provide the structural sub-headings used in the following sections 220
of Materials and Methods, Results and Discussion. 221
222
2. Study area and sampling sites 223
2.1. Study area 224
The Western Ghats (or the Sahyadri range) are often referred as the water tower of South 225
Indian rivers as they form the headwaters of several major and small (in terms of length) 226
rivers in South India (Ramachandra et al., 2016). The Western Ghats mountain belt stretches 227
in parallel to the eastern Arabian Sea coast for about 1600 km covering an area of around 228
140,000 km² which is interrupted only by the 30 km Palghat Gap at around 11 °N latitude in 229
Kerala, South India. This mountain belt hosts a globally significant geomorphic feature with 230
its unique influence on the wide-scale biophysical and ecological processes over the Indian 231
Peninsula (UNESCO, 2012). The Western Ghats provide orography required for the summer 232
monsoon winds in its western part and acts as a climate barrier (Gunnell, 1998; Tawde and 233
Singh., 2015) which makes the plateau arid in the eastern part due to rain shadow effect. The 234
monsoon current strikes the west coast of Peninsula from west and south-west, meets the 235
Western Ghats which presents an almost uninterrupted barrier ranging from 610 to 2134 m 236
asl. The air mass moving across the Western Ghats deposits most of its moisture on the 237
windward side of the mountain ranges, and then sweeps across the leeward side and interior 238
of the Peninsula in the east. The orographic rainfall system leads to variability in the amount 239
of precipitation along the mountain ranges of the Western Ghats. The higher monsoon 240
moisture deposited over the Ghats crest results in the origin of several rivers at higher 241
11
elevations and the formation of different upper watersheds on either side of the Ghats slopes 242
(Jain et al., 2007). On the western part of the Western Ghats scarp, several indentations have 243
been created by a large number of short, perennial, torrential west flowing rivers (e.g., 244
Nethravati, Gurupur, Swarna, Chaliyar, Periyar, Sharavati, Kali, etc) which traverse the 245
narrow coastal plains before discharging into the Arabian Sea through narrow outlets, creeks 246
and estuaries (see Figure 1.a.). 247
Most of the larger South Indian Rivers (e.g., Godavari, Krishna and Kaveri) which flow in the 248
east towards the Bay of Bengal have their origin in the Western Ghats. The Krishna River 249
which is the fourth largest river in terms of basin area in India originates in the middle of the 250
Western Ghats, near Mahabaleshwar at an elevation of about 1300 m asl. The southern basins 251
are formed by its major tributaries, Tunga and Bhadra Rivers which originate at elevations 252
~1100 m asl on the leeward side of Kudremukh peak in Karnataka (see Figure 1.a.). Further 253
south, the Kaveri (Cauvery) River originates at Talakaveri on the Brahmagiri Hills of the 254
Kodagu district at an elevation of 1341 m asl. The river flows in a south-eastern direction for 255
about 800 km through states like Karnataka, Kerala and Tamil Nadu, and descending the 256
Eastern Ghats in a series of great falls (Achyuthan et al., 2010). It also hosts tributaries from 257
the Nilgiris (Bhavani) and Annamalai (Amaravati), the two highest peaks (~ 2600 m asl) in 258
South India. These river basins host larger tropical forest ecosystems. 259
The river basins of South India receive their maximum rainfall during the south-west 260
monsoon. However, the depressions in the Bay of Bengal causing widespread heavy rains and 261
cyclones contribute moisture to the river basins in the eastern part of the Western Ghats 262
during the winter monsoon period. The rainfall map of South India is given in Figure 1.b., 263
where the asymmetry induced by the Western Ghats is well represented. On the windward 264
side, the narrow Arabian Sea coast of India exhibit annual monsoon rainfall from 2500 to 265
4000 mm with mostly a unimodal type (dominant summer monsoon). On the leeward side, the 266
12
monsoon is of bimodal type (dual monsoon system representing summer and winter 267
monsoons) with annual rainfall dropping rapidly from 2500 to 500 mm. The regional monthly 268
rainfall (India Meteorological Department, Government of India) of the sampling locations during 269
2013 - 2014 is given in Figure 1.c. and the sampling month is marked by blue rectangle, 270
between October and December representing the period after the summer monsoon. The 271
annual rainfall amount and oxygen isotope ratio for selected locations is given in Figure 1.d. 272
273
2.2. Sampling sites 274
Earlier works (Gurumurthy et al., 2015; Lambs et al., 2011; Tripti et al., 2013, 2016, 2018) 275
involved groundwater and river water sampling from southern Karnataka on the Arabian Sea 276
coast within the river basins of Swarna and Nethravati and the nearby Ghats (Kudremukh and 277
Charmadi Ghats). For the purpose of this study, we sampled mainly groundwater, springs and 278
pond water at higher elevations on the Arabian Sea coastal side of the Western Ghats, and 279
also groundwater and lake water at the sources of east flowing rivers with their watersheds 280
draining the eastern part of the Western Ghats. 281
<Please insert here Figure 1.a.> 282
<Please insert here Figure 1.b.> 283
<Please insert here Figure 1.c.> 284
<Please insert here Figure 1.d.> 285
< Please insert here Table 1> 286

13
Field sites have been selected for collecting representative samples to address the three major 287
factors like elevation, rainfall amount and continental effects as described in the following 288
sections. 289
2.2.1. Elevation effect 290
To test the elevation effect, we have sampled water from isolated peaks exhibiting elevation 291
greater than 2000 m asl from the Nilgiri ranges (covers 2500 km2 area and hosts 24 peaks) 292
which include Doddabetta peak (2640 m asl) and Mukurthi peak (2550 m asl). The elevations 293
of these isolated peaks are higher than the average typical mountain hills (600 to 1300 m asl) 294
of the Western Ghats. Before stating of minimal isotopic elevation effect in the Western 295
Ghats, there was a need for spatial sampling at the level of the highest mountain belt of the 296
Nilgiris. 297
2.2.2. Rainfall amount effect 298
Outside the rain shadow effects of eastern side of the Western Ghats, there is strong rainfall 299
amount variability along the west coast and at higher peaks in South India (Figures 1b and 300
1c). The mean annual rainfall increases from South to North, i.e., Thrissur (latitude 10° 30’ N; 301
annual rainfall = 3000 mm) to Udupi (latitude 13° 30’ N; annual rainfall = 4500 mm) which is 302
nearly the maximum for a coastal station (Gunnel, 1998). 303
To test the rainfall effect, we sampled two wettest places of the Western Ghats, in Karnataka 304
at Agumbe with rainfall traversing through Udupi with a mean value of 5500 mm, and in 305
Kerala, i.e., the Wayanad plateau at Vythiri with rainfall traversing through Kozhikode with a 306
mean value of 3800 mm. These stations display similar geographic features: relatively lower 307
elevation (600 - 800 m asl), close to the Arabian Sea (40-45 km) and surrounded by higher 308
peaks to intercept the monsoon rainfall with an increase of 500-1000 mm/year relative to the 309
corresponding coastal station. 310

14
2.2.3. Continental effect 311
To test the distance from the sea/coastline and possible continental effect, sampling was 312
performed in a midland station of north Kerala at Bakrabail and in the inland mountains like 313
Agumbe and Nilgiris during November 2013 which are located at different distances from the 314
Arabian Sea (refer Table 1). Additional sampling was undertaken during October 2014 from 315
locations adjacent to coast at Ezhimala hill (12°01’N, 75°12’E) and Thottada (11° 50’ N, 75° 316
24’E) to obtain the signatures of the direct sea moisture. This area of North Kerala is unique 317
as it is the single place of abrupt rocky spur (286 m asl), facing directly the Arabian Sea, 318
along the long sandy coast in southwest India which was sampled for this study. 319
320
3. Materials and Methods 321
The methodology followed to investigate the three research questions, i.e. isotopic elevation 322
effect, rainfall amount effect and continental effect, in view to understand the hydrological 323
cycle in the study area (geographic stretch from Agumbe to Ooty) include sampling of the 324
available groundwater, spring and lake on a wider scale of elevation, dry and wet areas, and 325
their distance from the Arabian Sea (here after referred as ‘distance to coastline/sea’). In this 326
study, water sampling has been performed with the same hydrological condition under 327
average water level condition during the end of the monsoon, from October to December 328
depending on the location (Figure 1.c.). The main criteria of the sampled water were its 329
isotopic composition (δ18O and δ2H values), and water conductivity and temperature, 330
whenever available. 331
332
3.1. Sampling and analysis of water for Stable isotopes 333

15
About 50 water samples were collected during the winter monsoon season, soon after the 334
withdrawal of summer monsoon, in November 2013 and October 2014 (Figure 1.c.). For the 335
study of the elevation effect, thirteen water samples (groundwater, rivulet, spring and lake) 336
were collected during November 2013 in the area of Mukurthi peak (Pykara lake) and 337
Doddabetta peak between 1990 m to 2630 m asl. For the study of the rainfall amount effect, 338
six water samples (groundwater, rivulet and pond) were collected in the area of Agumbe 339
during November 2013 and seven (groundwater, rivulet and spring) in the area of the 340
Wayanad plateau during October 2014. In addition, water samples (rivulet, ponds and pipe 341
flow water from soil sub-surface layer) were collected during November 2013 in the area of 342
Bakrabail (n = 5) and during October 2014 in the area of Ezhimala (n = 16) for the study of 343
the continental effect. 344
The groundwater samples were collected from dug wells (or open well: OW) and hand pumps 345
(or bore well: BW). Dug wells and hand pumps that are regularly used were chosen for 346
sampling. In case of dug well sampling, the samples were collected by lifting the water using 347
a polythene bucket. When dug well or hand pump were not available, water samples were 348
taken from spring or rivulet and pond or lake, at a depth of 50 cm to avoid any surface 349
evaporation effect. For each location, water samples in 10 ml glass vials with tight capswere 350
collected for isotopic measurements. Water temperature (°C, only in 2013) and electrical 351
conductivity (µS cm-1) were determined on-site using HACH multi-parameter probes. The 352
exact positions of the sample sites were located with a GPS. All the sampling sites are shown 353
in Figure 1.a. and details are given in Table 1. 354
The samples were kept under room temperature until analysis of their stable isotope ratios 355
(δ18O and δ2H) on an Isoprime 100 continuous flow isotope ratio mass spectrometer 356
(Isoprime, Cheadle Hulme, UK) coupled with a Geo-Multiflow for water–gas equilibration 357
16
(Elementar, Hanau, Germany). The stable isotope ratios of oxygen and hydrogen are defined 358
with δ notation and ‰ unit as suggested by Craig (1961) and redefined by Coplen (2011). 359
The δ18O value of oxygen isotope is defined as: 360
δ18O VSMOW-SLAP = (((18O/16O) sample / (
18O/16O) standard) - 1) ‰ 361
For hydrogen isotope, the δ2H value is defined as: 362
δ2H VSMOW-SLAP = (((2H/1H) sample / (
2H/1H) standard) - 1) ‰ 363
In the laboratory, 0.3 mL aliquot of water was transferred into capped 3.7 mL vial for 364
analysis. The sample vials used for δ18O measurements were flushed offline with a gas 365
mixture of 5% CO2 in helium. The operating vials were then left to equilibrate at 40°C for 366
about 8 hr. The analytical precision of the measurements was ~ 0.2 ‰. In order to measure 367
the δ2H signatures of the samples, Hokko beads were added to the 3.7 mL vials containing 368
water samples and internal standards, before the vials were flushed offline with a gas mixture 369
of 5% H2 in helium. The operating vials were then left to equilibrate at 40°C for about 8 hr. 370
The measurements were made in duplicate, and the typical reproducibility was ~2.0 ‰. Four 371
internal standards were used, namely: 372
W1 (δ18O = –1.5 ± 0.21 ‰, δ2H = -5.0 ± 2.1 ‰), 373
W2 (δ18O = –6.2 ± 0.23 ‰, δ2H = -38.0 ± 2.4 ‰), 374
W3 (δ18O = –10.5 ± 0.25 ‰, δ2H = -68.0 ± 1.7 ‰), 375
W4 (δ18O = –15.5 ± 0.24 ‰, δ2H = -110.0 ± 2.7 ‰), 376
They were regularly checked against international reference standards, V-SMOW and V-377
SLAP provided by the International Atomic Energy Agency (IAEA, Vienna). 378
The deuterium excess (d-excess) was calculated according to Craig’s formula (Craig, 1961) as 379
explained by Dansgaard (1964), i.e., d-excess (‰) = δ2H - 8 x δ18O. 380
381

17
3.2. Air masses trajectory analysis 382
In order to better understand the hydrological conditions during sampling and origin of the 383
previous rainfall, an air mass back trajectory model was used. The program for ‘Hybrid Single 384
Particle Lagrangian Integrated Trajectory Model’ (HYSPLIT) developed by National 385
Oceanic and Atmospheric Administration (NOAA) has been run for the sampling dates of 386
main stations. This model is run for the air masses back trajectories upto five days to check if 387
any short term severe cyclonic event (generally the case during the winter monsoon over 388
Indian subcontinent) has impacted the hydrological systems in the Western Ghats prior to 389
sampling. 390
391
3.3. Statistical analysis 392
The simple mean, standard deviation and regression were calculated using Microsoft Excel 393
2016, whereas the multiple linear regression analysis was performed using Past v. 3.15. The 394
dependent variable was the δ18O values, and the independent variables were the elevation 395
(elevation effect), the distance to coastline (continental effect) and the annual rainfall amount 396
(rainfall amount effect). 397
398
4. Results 399
The physico-chemical parameters (temperature and electrical conductivity) and stable isotopic 400
composition of water samples collected in hills and plateaus along the Western Ghats stretch 401
are given in Table 2. The temperature of water measured onsite is reported here to understand 402
its influence on the stable isotope ratios. It is observed that the water samples display lower 403
oxygen isotope ratios, i.e., more negative δ18O values at low temperature regions (Figure 404

18
2.a.). The relationship of measured δ18O with water temperature for the study period exhibits 405
a similar trend as observed for the global water (dδ18O/dT = 0.66 ‰/˚C; Dansgaard, 1964) but 406
with a lower slope (dδ18O/dT = 0.36 ‰/˚C) as the monitored water samples correspond to 407
higher temperature range (10-30 ˚C). The electrical conductivity is also provided as it forms a 408
proxy to predict the geologic bedrock composition and the water residence time. Most of the 409
sampled groundwater and spring water (except in the bore well, BW and lake) display low 410
ionic content, with a mean conductivity of 39 ± 20 µS/cm (n = 33) and close to that of 411
rainwater (~20 µS/cm). This is due to the presence of the dominant silicate rock in the basin 412
and the abundant tropical monsoon rainfall which further leads to dilution. The highest 413
conductivity values are measured in lakes where the water is stored for a longer time, and in 414
bore well compared to open well with a mean value of 229 ± 126 µS/cm (n = 11). Human 415
activity also leads to an increased conductivity as observed for the open well in the middle of 416
the town of Sultan Bathery (231 µS/cm) and for the Ooty Lake (450 µS/cm). The high values 417
for the coastal sampling of the river and rivulet at Thottada (up to 387 µS/cm) arise certainly 418
from moderate saline intrusion. Thus, the conductivity of sampled water in these tropical 419
mountainous regions varies between 20 µS/cm and 500 µS/cm depicting higher rainwater 420
input to more water-rock interaction and anthropogenic interventions respectively. The 421
relationship between conductivity and δ18O values is shown in Figure 2.b. 422
<please insert here Fig 2.a.> 423
<please insert here Fig 2.b.> 424
The overall relationship of δ18O versus δ2H is shown in Figure 3. Most of the samples fall on 425
the Global Meteoric Water Line (GMWL) as defined by Craig (1961). Few samples of pond 426
and lake are located below the GMWL with deuterium excess (d-excess) values ranging from 427
-2.1 to 5.3 ‰, showing evaporation effect on the isotope ratios of larger surface water bodies. 428

19
On the contrary, mainly at low elevation of the forested area, high d-excess suggests that the 429
source vapour of the available water was formed from recycled moisture, with d-excess 430
values ranging from 13.25 to 18.68 ‰. It is for the first time that such depletion in heavy 431
isotopes of oxygen (δ18O < -8 ‰) in water has been observed in South India. Few rainfall 432
samples obtained at Ooty during the nighttime in November 2013 display δ18O values 433
between -16 ‰ and -17.9 ‰ (not plotted in Figure 3). 434
<please insert here Fig 3.> 435
436
4.1. Elevation effect 437
In general, under the influence of warm tropical climate, the surface and sub-surface water 438
temperature is close to air temperature, 26 ± 2 °C, for the low to middle elevation (<1500 m 439
asl). But, in the Nilgiri mountains, as the elevation reaches 2000 m asl, the temperature 440
decreases rapidly (Table 2). On the summit of the Nilgiris in the Doddabetta peak, spring 441
water temperature of about 12 °C has been measured during November 2013, and the case of 442
frost was reported earlier at the meteorological station on the hilltop (Negi, 1996). 443
The δ18O values of water samples from mountainous regions between Arabian Sea coast and 444
Western Ghats are plotted against the elevation of sampling location to identify the presence 445
of elevation effect on the stable isotope ratios of water (Figure 4). Clearly, two groups of 446
samples are observed: the first set of samples for elevation below 2050 m asl, with a low 447
slope (-0.09 ‰/100m, R2 = 0.4) and a second set beyond 2050 m asl with a higher slope (-2.5 448
‰/100 m, R2 = 0.7). Table 3 summarizes the reported studies on isotopic elevation effect 449
from the pioneer works to more focus on tropical areas and Indian terrain. 450
<please insert here Fig 4.> 451

20
<please insert Table3> 452
The multiple linear regression shows that for the 51 data points reported in Table 1, the 453
elevation effect is very significant (R2 = 0.7, p < 0.0001; Table 4) to explain the δ18O values. 454
<please insert Table 4> 455
456
4.2. Rainfall amount effect 457
The mean stable isotope ratios of rain water, groundwater and river water in the wettest river 458
basins (annual rainfall amount of 5500 ± 1500 mm in Swarna and Nethravati basins) of the 459
Western Ghats in Karnataka was reported to be around -3.05 ± 0.2 ‰ for δ18O with d-excess 460
of about 17.7 ± 3.1 ‰ (Tripti et al., 2016). Water samples of Agumbe, the wettest place in 461
South India as well as along the spatial stretch of the Western Ghats display an average 462
isotope ratio of about -3.14 ± 0.6 ‰ for δ18O with d-excess of about 10.16 ± 4.7 ‰ 463
(excluding pond and waterfall; Table 2). The observed stable isotope ratios of groundwater in 464
the wet locations of the Western Ghats stretch in Karnataka show less depletion of heavy 465
isotopes in water compared to its coastal track at Udupi and Bakrabail (rain water δ18O = -466
2.84 ± 0.28 ‰ and d-excess = 16.5 ± 2.1 ‰; Tripti et al., 2016) which receives relatively 467
lower annual rainfall amount of about 4000 ± 500 mm. 468
The isotope ratios of water samples from the Wayanad plateau, around Sultan Battery, the 469
wettest place (annual rainfall up to 4000 mm) in Kerala, display mean values of about -3.36 ± 470
0.57 ‰ for δ18O and 12.95 ± 5.06 ‰ for d-excess (Table 2). This isotopic ratio of 471
groundwater is relatively lower than that of the long-term mean rainfall (δ18O = -2.97 ± 0.73 472
‰ and d-excess = 10.66 ± 0.72 ‰; Warrier et al., 2010) in the corresponding coastal station 473
of Kozhikode receiving annual rainfall amount of 3000 mm. It can be observed from Figure 5 474

21
that except the near shore areas like Ezhimala and Thottada, and the inland region close to the 475
Nilgiri range (Pykara and Doddabetta), all other water sample locations independent of their 476
annual rainfall, present a mean δ18O value similar to that of the west coast groundwater (δ18O 477
= -3.1 ± 0.3‰; Tripti et al., 2016). 478
The multiple linear regression shows that for the 51 points reported in Table 1, the annual 479
rainfall parameter or rainfall amount effect is not significant (R2 = 0.4, p = 0.39; Table 4) to 480
explain the δ18O values. 481
482
4.3. Continental effect 483
When the air masses move away from the Arabian Sea towards the inland, until the Western 484
Ghats mountain belt, there is a significant continental effect on stable isotope ratios of water. 485
The variability in mean δ18O values as a function of distance to the Arabian Sea for nine 486
sampling regions is plotted in Figure 5. Water samples located close to the sea (distance < 5 487
km) show δ18O values of about -2 ‰ which then decreases to -3 ‰ towards the inland (i.e., 5 488
km < distance < 40 km) along the western part of the Western Ghats, including the sample 489
location on the moderate elevation mountains like Agumbe and Wayanad. Only the water 490
samples from stations located far away from the sea (distance > 100 km), like the Nilgiris, 491
display more depleted oxygen isotopes of about -8 ‰. 492
<please insert here Fig 5.> 493
The multiple linear regression shows that for the 51 data points reported in Table 1, the 494
distance to the sea or continental effect is not significant (R2 = 0.56, p = 0.18; Table 4) to 495
explain the δ18O values. 496
497

22
4.4. Air masses trajectories 498
The results of the HYSPLIT simulations are given in Figure 6. For the stations along the 499
Arabian Sea coast (Agumbe and Bakrabail) of mid November 2013, there is an influence of 500
north-east monsoon with continental effect at low elevation, and an influence of the Arabian 501
Sea side is observed at higher elevation. For the lower elevation stations on the Nilgiris (Ooty 502
and Pykara) of November 19, 2013, the air masses come from the north-east monsoon, with 503
coastal and maritime effect. For the sampling stations in Doddabetta, Madikeri, Thrissur 504
(respectively on November 18, December 02 and December 05 during 2013) and Ezhimala 505
(October 14, 2014), mainly it is the influence of Bay of Bengal with maritime trajectories as 506
observed in Figure 6. Overall, the sampling was performed under north-east winter monsoon 507
conditions, with more continental effects for mid-November sampling to more maritime 508
effects for the early December sampling. 509
<please insert here Fig 6.> 510
511
5. Discussion 512
In this section, we review the main factors (elevation, amount and continental effects) 513
controlling the water isotope ratios in perspective with the new results obtained for the 514
Western Ghats mountain belt covering a latitudinal stretch of about 500 km between 10° 30’ 515
N and 14° N in South India. 516
5.1. Elevation effect 517
Most of the climatological, ecological, and geophysical studies reported the effect of elevation 518
on stable isotope ratio of water as altitude effect which has been now rephrased as ‘elevation 519
effect’ (McVicar and Körner, 2013). The compilation of 68 studies by Poage and Chamberlain 520

23
(2001) reports an isotopic lapse rate ranging from -0.10 to -0.51 ‰/100 m asl on δ18O values 521
(except extreme latitudes, -0.62 to -1.83 ‰/100 m asl), with a mean value of -0.28 ± 0.03 522
‰/100 m asl. In the Himalayas, the isotopic lapse rate ranges between -0.14 ‰/100 m asl on 523
the Indian slope and up to -0.25 ‰/100 m asl on the Tibetan plateau (Poage and Chamberlain 524
2001). Limited studies focused on the elevation effect in South India. The study on 525
groundwater isotopes by Deshpande et al. (2003) detected a possible elevation effect of -0.4 526
‰/100 m asl for δ18O in well water located at an elevation between 400 and 1000 m asl in 527
Southwest India. But, from the recalculation of slope for the whole set of points located 528
between Arabian Sea coast and 914 m asl, as displayed in Figure 8a of Deshpande et al. 529
(2003), the isotopic lapse rate is only -0.11 ‰/100 m asl. Similar values (-0.12 ‰/100 m asl; 530
Scholl et al., 2009) of isotopic depletion with elevation has been reported for the tropical 531
coastal forest in Puerto Rico. Recent study on the precipitation across the Pamba River, 532
Kerala suggest an isotopic lapse rate of about -0.10 ‰/100 m asl (Resmi et al., 2016). Table 3 533
summarizes the reported studies on isotopic elevation effect from the pioneer works to more 534
focus on tropical areas and Indian terrain. In Sri Lanka, Edirisinghe et al. (2017) have 535
reported the isotopic lapse rate of -0.6 ‰/100 m asl for the north-east monsoon, but no value 536
for the south-west monsoon has been reported as there was no enough rain water collectors on 537
the south-west of Sri Lanka. 538
In our previous studies (Lambs et al., 2011; Tripti et al., 2016), the sampling along the hill 539
slopes of Kudremukh, Charmadi Ghats (1300 to 1800 m asl) and Mullayanigiri (1900 m asl; 540
highest peak of Karnataka) did not show any isotopic elevation effect. The data on stable 541
isotope ratio of water samples from this work show an isotopic lapse rate of -0.09 ‰/100 m 542
for stations below 2050 m asl which is similar to that reported in other tropical areas (Table 543
3). But for the region at elevation greater than 2050 m asl in the Western Ghats belt of South 544
India, a stronger isotopic lapse rate of about -2.5 ‰/100 m asl is found with water highly 545
24
depleted in heavy isotopes of oxygen (δ18O = -9.5 ‰) as recorded in high mountains of the 546
Nilgiri ranges at Doddabetta peak. The water samples from the Nilgiri ranges (1950-2300 m 547
asl) exhibit higher isotopic lapse rate of 1.5 ‰/100 m asl for δ18O whereas the mountains 548
close to the eastern Arabian Sea like Ezhimala, Agumbe and Chembra exhibit no such 549
depletion in heavy isotopes of oxygen with elevation (Figure 4). This indicates that there 550
exists a unique relationship between elevation and stable isotope ratios of surface and sub-551
surface water in different mountain ranges of the Western Ghats. When we recalculate the 552
overall isotopic elevation effect from 0 to 2300 m asl, the overall slope value is -0.31 ‰/100 553
m. The overall isotopic effect observed for the water of the Western Ghats is slightly higher 554
than the global mean isotopic lapse rate. In the humid tropical areas, the isotopic elevation 555
effect on the stable isotope ratios of water is lower (around -0.10 ‰/100 m asl) due to the 556
moisture contribution from higher air vapour recycling. But when reaching higher elevation of 557
relatively less humid region, our study reveals that the stable isotope ratios of water are 558
largely controlled by elevation effect in the Western Ghats mountain belt. 559
Until now, such depletion in heavy isotope (18O) of oxygen (-9.5‰ < δ18O < -7.3 ‰, present 560
study) has not been reported for river and groundwater in the literature for South India, 561
although the closer values are reported in few studies (Achyuthan et al., 2010; Hameed et al., 562
2015). Firstly, for the west flowing Chaliyar River, the lowest δ18O reported is -5.30 ‰ 563
(Hameed et al., 2015) for the water originating at the foothills of the Chembra and Mukurthi 564
range. Secondly, lower oxygen isotope ratios (δ18O = -7.7 ‰; Achyuthan et al., 2010) have 565
been reported for the east flowing Kaveri river near Mettur Dam due to significant 566
contribution of the tributary flowing from the Nilgiri range. Similar depleted water isotopes 567
were observed during our sampling in November 2013, where a river in Mule hole basin 568
display δ18O = -6.7 ‰ (Lambs et al., under preparation). All these studies, with oxygen 569
isotope ratios much lower than -4.5 ‰, indicate a possible depletion of heavy isotopes in 570

25
water at higher peaks of the Western Ghats with elevation greater than 2000 m asl. For other 571
east flowing rivers of South India originating in the Western Ghats, higher variability of stable 572
isotope ratios has been reported, i.e., for the Maheshwaram watershed (δ18O = -4.7 ‰; Negrel 573
et al., 2011) and for the Mahanadi and Godavari rivers (respectively-6.1 ‰ and -5.5 ‰; 574
Lambs et al., 2005) as they are largely influenced by north-east monsoon. 575
It can be noted that the small isotopic elevation effect (less than 1 ‰ on the δ18O scale) 576
observed here for the Western Ghats below 2000 m asl is similar to that reported for the cloud 577
forest where there is a secondary control from strong water vapour recycling process (Scholl 578
et al., 2009) with a slope of -0.12 ‰/100m as given in Table 3. On the contrary, in the same 579
Arabian Sea coast, further North as well as in the South, higher isotopic elevation effect is 580
found even below 2000 m asl in the drier regions. For instance, the stable isotope 581
measurements carried out on groundwater in Sri Lanka (north-west and south-west slopes on 582
the central mountains) and Rajasthan (on the south-west slope of the Aravalli mountain range) 583
represent an isotopic lapse rate of -0.18 ‰/100 m asl (Figure 7; data from Lambs, under 584
preparation) for the δ18O values. It is also observed that these water samples display lower 585
oxygen isotope ratios, -8 ‰ < δ18O < -6 ‰ at 1400 m asl. 586
<please insert here Fig 7.> 587
It is also important to consider the possible contribution by isotopic spike effect (Lambs et al., 588
2018) of storm during the north-east monsoon which leads to higher depletion of heavy 589
isotopes in precipitation water. Compared with normal tropical rainfall, the tropical storms 590
display distinct depletion of heavy isotopes of oxygen in water. During large tropical storms, 591
the strong convective effect generates 18O - depleted rainfall with much lower oxygen isotope 592
ratios between -12 and -8 ‰, as reported by Lawrence (1998) and more recently by Lambs et 593
al. (2018). The water samples obtained from inland regions in the Nilgiri ranges during 594

26
November 17-19, 2013 show an impact from the isotopic spike effect of storms. There was 595
effectively an extremely severe cyclonic storm named “Phailin” over the Bay of Bengal 596
during October 04 - 14, 2013, but entered the Indian coast further north-east (in Orissa) of the 597
sampling sites. At a later stage during November 13 - 17, the storm originating from a strong 598
depression in the Bay of Bengal entered the Tamil Nadu coast, and during November 18 - 21, 599
severe cyclone “Helen” made its entry through Andhra Pradesh in South India. The HYSPLIT 600
simulation (Figure 6) shows effectively that the air mass over the Doddabetta peak had its 601
original path from the Bay of Bengal more close to the Andaman Island, from where the 602
cyclone Helen originated. However, the sampled water will not have much influence of storm 603
from cyclone Helen as samples were collected prior to its first landfall rain over the Indian 604
coast. The water isotope ratios for the rainfall obtained during this period in the Nilgiri range 605
were effectively depleted in heavy isotopes with δ18O of about -17 ± 0.9 ‰ (rain water in 606
equilibrium with cooler water vapour), but the results are from only few samples (n = 2). 607
Nevertheless, the huge water reservoir in Ooty (the Ooty lake) which covers an area of 3.9 608
km2 displays depletion in heavy oxygen isotope with δ18O value of about -5.3 ‰. It is noted 609
that the water from this lake has a d-excess value of -2.1 ‰ which shows a strong evaporation 610
of the lake water. This suggests that the original lake water exhibited more depletion of 18O in 611
water before undergoing evaporation, certainly similar to the groundwater isotope ratios (δ18O 612
= -7.3 ‰) as observed for the Ooty village. This also indicates that the storm effect was 613
uniform over the Nilgiris and the immediate water sampling displayed a strong elevation 614
effect in this region of the Western Ghats. Thus, it is important to note that along with the 615
northeast monsoon influence, the earlier storms from cyclone Phailin and Bay of Bengal 616
depression had an effective contribution towards the surface water and sub-surface water in 617
the Nilgiris. This has led to lower water isotope ratios at higher elevations inland compared to 618
the coastal groundwater along the eastern Arabian Sea side. The study determines that the 619

27
water from the higher mountains of the Western Ghats depicts the global elevation effect soon 620
after the strong influence of the monsoon and much before the dominance of secondary 621
processes like evaporation and contribution of recycled vapours from evapo-transpiration. 622
This reveals that the time scale of observation plays a major factor (Poage and Chamberlain, 623
2001) in monitoring the relationship between elevation and stable isotope ratios of surface and 624
sub-surface water in the Western Ghats mountain belt. 625
626
5.2. Rainfall amount effect 627
The highest rainfall (21.32 mm/day; Tawde and Singh, 2015) in South India during summer 628
monsoon season is observed over windward side of the Western Ghats mountain range in 629
Karnataka, centered at 13° 13’ N latitude, close to Udupi. The variability in monsoonal 630
rainfall (Figure 1.d.) with changing longitude (west-east direction) and latitude (south- north 631
direction) i.e., across and along the Western Ghats (Gunnel, 1997) corresponds to the 632
topographic structures of the mountain barriers and the contribution from seasonal monsoon 633
sources. It is reported that the maximum rainfall due to orography of the Western Ghats 634
during summer monsoon season is on an average 50 km before the highest peak and 635
corresponds to an elevation of about 600 m asl, beyond that the rainfall decreases (Tawde and 636
Singh, 2015). It is at this middle elevation that the wettest places are found in Karnataka 637
(Hulikal at 13° 43’ N and Agumbe at 13° 30’ N) and in Kerala (Vythiri on the edge of the 638
Wayanad plateau at 11° 33’ N and Walakkad in the Silent Valley at 11° 03’ N). 639
Tropical coastal areas are typically characterized by rain water with δ18O of about -3 ± 1 ‰ 640
(GNIP database) and the groundwater of several tropical coasts and islands reflect similar 641
mean δ18O values (Lambs et al., 2016, 2018). This is also the case for the west coast of South 642
India, with similar groundwater stable isotope ratios at Udupi (δ18O = -3.09 ± 0.05 ‰, n=34; 643

28
Tripti et al., 2016). This δ18O value corresponds with the rainfall mean weighted values in the 644
nearest GNIP station, Kozhikode (δ18O = -2.97 ± 0.73 ‰; Warrier et al., 2010). Only the 645
water from the eastern part of South India which is mainly influenced by the north-east winter 646
monsoon and higher continental effect display lower isotope ratios (δ18O = -6 ‰; Deshpande 647
et al., 2003). 648
In this study, the mean oxygen isotope ratios of water at sampling stations of Agumbe (δ18O = 649
-2.95 ± 0.66 ‰; n = 6), Bakrabail (δ18O = -3.05 ± 0.34 ‰; n = 5) and Thrissur (δ18O = -650
3.11‰) are very similar, although these stations received contrasting annual rainfall amount 651
from 6000 mm (Agumbe) to 3000 mm (Thrissur). Similar case is found further south between 652
the Wayanad plateau around Sultan Bathery (mean groundwater δ18O = -3.1 ± 0.5 ‰) and the 653
relative drier coastal station at Kozhikode (δ18O = -2.97 ± 0.73 ‰; Warrier et al., 2010). All 654
these sampling stations confirm the low rainfall amount effect on the water isotopic ratio 655
along the spatial stretch of the Western Ghats belt. 656
The study on stable isotope ratios (δ18O and δ2H) of groundwater, surface water and rainfall 657
from coast to inland in south-west of Karnataka shows weaker rainfall amount effect on the 658
water isotope ratios due to the influence of higher continental vapour recycling process (as 659
represented by higher d-excess values of about 15 ‰) in the two humid tropical basins of the 660
Western Ghats (Tripti et al., 2016). On the contrary, a reversed rainfall amount effect on the 661
δ18O variability was observed for the precipitation over Mangalore (Yadava et al., 2007), 662
although they still show a weaker rainfall amount effect within the monsoonal months. At 663
Kunnamangalam, 12 km inland of Kozhikode (Kerala), the study by Warrier et al. (2010) 664
shows a poor correlation between rainfall amount and δ18O/δ2H values over the three years 665
period from 2005 to 2007. The authors stated that the region receives a continuous supply of 666
moist air masses as the south-west monsoon currents move across extended marine regions 667

29
before reaching Kozhikode. In addition, the study on the δ18O variability in precipitation 668
along the Kerala stretch suggests the influence of large-scale convection and cloud spread 669
(Lekshmy et al., 2014) rather than the rainfall amount effect. Recent studies (Hameed et al., 670
2016; Resmi et al., 2016) on the spatial variability of stable isotope ratios (δ18O and δ2H) of 671
precipitation over the Kerala region also support weaker rainfall amount effect and have 672
attributed it to the steady state supply of moisture and also vapour recycling over the 673
continent. Thus, the water in the west coast and along moderate elevations of the Western 674
Ghats stretch in South India does not display a high correlation between the stable isotope 675
ratios of water and precipitation amount. 676
677
5.3. Continental and seasonal effects 678
As stated in the previous section, precipitation (rain water) along the tropical coasts display 679
δ18O value of about -3 ± 1 ‰ (GNIP database) and represents relative depletion of heavy 680
isotopes than that of the seawater (δ18O = 0 ‰, by definition). The two GNIP stations in 681
South India, Kozhikode and Tirunelveli (Figure 1.b.) display very similar weighted mean 682
δ18O values of about -2.97 and -2.79 ‰ respectively. In our earlier studies (Lambs et al., 683
2011; Tripti et al., 2013, 2016), it was reported that there is a homogeneity in the groundwater 684
isotopic signature from coastal plain up to the moderate elevation (< 1500 m asl) of the Ghats. 685
The mean value of δ18O in water samples was around -3.15 ± 0.63 ‰, close to the GNIP 686
rainwater δ18O value (-2.97 ‰) of Kozhikode (Figure 1.b.). Only the coastal stations adjacent 687
to the Arabian Sea, like the groundwater in the estuarine zone of the Swarna River at Hude 688
displayed enrichment of heavy isotopes with δ18O value of about -2.26 ‰ (Tripti et al., 2016). 689
In this study, the costal stations of Ezhimala and Thottada which receive directly the sea 690
moisture display respectively, δ18O = -1.92 ± 0.55 ‰ (n=8) and δ18O = -2.31 ± 0.74 ‰ 691
30
(n = 8). Further inland, the groundwater at low elevation stations show a homogenous 692
groundwater with δ18O around -3 ‰. This is clearly represented in Figure 5, where the water 693
isotope ratios (δ18O) vary between -2.95 ‰ and -3.36 ‰, except for the sample stations of 694
Ezhimala and Thottada. This represents that for the region stretching to about 500 km distance 695
along the Western Ghats i.e., from Udupi (Karnataka) to Thrissur (Kerala), the groundwater 696
and surface water display a similar oxygen isotope ratio (δ18O) of about -3.0 ± 0.5 ‰, before 697
any evaporation. It is interesting that water homogeneity extends till 50 to 70 km inland, 698
including moderately elevated plateaus like Agumbe, Madikeri and Wayanad of the Western 699
Ghats. The higher moisture availability and the thick vegetation cover favour higher 700
continental vapour recycling in this region. The higher continental moisture recycling in the 701
western part of the Western Ghats and the uniform distribution of recycled moisture over the 702
short distance led to homogenous signatures in the stable isotope ratios of groundwater (Tripti 703
et al. 2016). However, there is a shift in this homogeneity further inland, extending beyond 704
100 km from the Arabian Sea coast, at higher elevations in the Western Ghats with 705
groundwater exhibiting higher depletion of heavy isotopes (δ18O = -7.0 ± 1.5 ‰) as observed 706
for the Nilgiri ranges. The water in this inland region exhibited colder temperature relative to 707
that of the coastal and moderate elevation stations in the Western Ghats. In addition, these 708
inland stations receive relatively higher north-east monsoon precipitation than the west coast, 709
and thus, the surface water and sub-surface water are recharged with more continental rainfall 710
characterized by water with higher depletion of heavy isotopes. 711
712
5.4. Variability of deuterium-excess 713
There is a higher variability of d-excess in the surface and subsurface water of the Western 714
Ghats with mean values ranging from + 6.5 to + 13.42 ‰. The plot (Figure 8) of d-excess as a 715

31
function of distance from the coastline and elevation displays a lower increasing trend unlike 716
that of the global water (Bershaw, 2018) associated either with source moisture mixing or 717
sub-cloud evaporation. The calculated d-excess ranges between 3 ‰ and 20 ‰. The observed 718
d-excess variability in this humid tropical region corresponds to that reported in the Jeju 719
Island, Korea and northeast Asia (Lee et al., 2003). However, the d-excess variability 720
observed in this study corresponds less to the seasonal moisture source contribution as the 721
west coast samples which are dominated by precipitation input from hot humid tropical 722
marine air mass from Arabian Sea exhibit higher values and a larger range of d-excess. This is 723
mainly dependent on the degree of regional continental moisture recycling process and 724
distribution of the recycled vapours (Tripti et al., 2016) influencing the incoming marine 725
source moisture along the eastern Arabian Sea coast of India. 726
<please insert here Fig. 8> 727
728
5.5. Statistical analysis 729
Multiple linear regression analysis was carried out for determining the extent to which the 730
elevation effect, continental effect and rainfall amount effect influence the δ18O values. When 731
running the statistical test for the whole set of points (n = 51), the elevation effect appears to 732
be the most significant explicative parameter, and the influence of two other effects remain 733
insignificant. If we split the dataset into two groups, like in Figure 4, for the first 42 points 734
with elevation lower than 2050 m asl (Table 4), there is neither a strong nor a significant 735
contribution from one specific parameter. It is a global contribution which enables 736
observation of the δ18O values to decrease from -2 ‰ along the eastern coast of Arabian Sea 737
to -4.0‰ more inland at 1800 m asl in the Western Ghats. For the last 9 points, i.e. above 738
2050 m asl, the elevation effect and the rainfall amount effect become significant (R2 = 0.77, p 739

32
< 0.1 and R2 = 0.81, p < 0.05 respectively) in controlling stable isotope ratios of water at high 740
elevation of the Western Ghats. This suggests that for the tropical mountains of high elevation 741
and with less relative humidity, the lower isotopic ratios of surface water and sub-surface 742
water were characteristics of deep cooling due to high orographic upliftment of seasonal air 743
moisture, severe storm effect and higher annual rainfall input. 744
745
5.6. Implications of stable isotopes of water in the Western Ghats mountain belt 746
This study and the earlier reported work (Lambs et al., 2011; Tripti et al., 2013, 2016) suggest 747
that in the tropical monsoon climate region of the Western Ghats, the high water vapour 748
recycling is due to higher precipitation, warmer temperature, wetlands and large vegetation 749
cover (around 40% of forest). The higher moisture input (~ 2000 mm < annual precipitation < 750
6000 mm; Figure 1.b.) from the nearby oceanic source coupled with suitable temperature (i.e., 751
~ 20 < t < 30° C) and land-use/land cover (i.e., vegetation) in the continent supports high 752
relative air humidity (75-100 %) which triggers higher vapour recycling (Breitenbach et al., 753
2010) in this region. This indicates the dominance of terrestrial moisture recycling process 754
over the Western Ghats rather than the Rayleigh distillation process of moisture from oceanic 755
source. This is reflected by the higher stable isotope ratios of water over the continent leading 756
to less depletion of heavy isotopes (~ δ18O = -3 ‰) and higher d-excess values (~15 ‰) for 757
the wetter regions of west coast. However, the effect of vapour recycling on the isotopic 758
signature of incoming moisture becomes less dominant in the region where the moisture input 759
is relatively minimal (~ annual precipitation < 2000 mm) from the summer monsoon mainly 760
due to the rain shadow effect. However, these inland regions exhibit relatively cooler 761
temperature (i.e., T < 20 °C) due to high air lifting and contribution from north-east monsoon. 762
There is a higher reflection of original moisture source and the mixing process on the stable 763

33
isotope ratios of water in such semi-arid tropical regions. Thus, a clear indication of Rayleigh 764
distillation or elevation effect is observed on the isotopic signatures of moisture which in turn 765
leads to more depletion of heavy isotopes (~ δ18O < - 6‰) in water present in inland regions. 766
This shows that the continental vapour recycling process and their role in controlling moisture 767
flux (Froehlich et al., 2002; Risi et al., 2013; Sturm et al., 2007) are important factors even in 768
the humid coastal regions receiving higher precipitation. Although there could be several 769
factors that control the moisture isotopic signatures and their subsequent reflection in the 770
groundwater and surface water, this study shows that temperature coupled with higher 771
seasonal moisture input (mainly precipitation amount) and vegetation cover play a significant 772
role in governing the stable isotope ratios of water over the regional scale and the subsequent 773
water cycle over the highlands of the Western Ghats mountain belt in India. Also, it is 774
important to note that the stable isotopes of water show homogenous signature up to moderate 775
elevation (i.e., 2000 m asl) for the humid tropical mountains, and the isotopic elevation effect 776
is observed only in the mountains of elevation greater than 2000 m asl of the Western Ghats. 777
The findings of this study are significant as it has implications on the studies involving past 778
climate and paleoelevation of the tropical mountain belt using records preserved in 779
paleoarchives. This will help in improving the understanding of isotopic signatures of 780
paleowater, tree ring, speleothem and other geological records found in South India. With less 781
GNIP observations stationed in South India, the present study (though the observation is 782
mainly from surface and subsurface water) adds to the global database, as it provides the new 783
evidence on the isotopic elevation effect along the highlands of tropical mountain rainforest 784
ecosystem of India. This also has larger implications on the hydrological and Indian 785
monsoonal climatic systems, and further helps in the sustainable water resource management 786
of South India. 787
788

34
6. Conclusions 789
Humid tropical mountains display a lower isotopic elevation effect due to limited temperature 790
gradient, high relative humidity, evergreen forest evapotranspiration and high water vapour 791
recycling. The Western Ghats mountain belt of South India has similar characteristics, and as 792
such the stable isotope ratios of rainfall and water bodies exhibits lower variability with 793
elevation up to 2000 m asl with a mean oxygen isotope ratio (δ18O) of about -2.5 ± 0.5 ‰ and 794
a limited seasonal effect (maximum difference in mean δ18O between seasons is ± 0.5 ‰ for 795
larger river basins and ± 0.2 ‰ for smaller basins). The homogeneity in the ground water 796
isotope ratio along the western coastal plain from Udupi to Thrissur in South India is 797
explained by the wide-scale marine moisture distribution from the dominant south-west 798
summer monsoon system. The moisture characteristics on the foothills of the Western Ghats 799
are more affected by the water vapour recycling as observed from the higher d-excess (around 800
15 ‰), particularly in the vegetation covered and wetland regions. 801
The present study reveals for the first time that beyond 2000 m asl in the Western Ghats, such 802
as in the Nilgiri ranges, the surface and subsurface water exhibit relatively lower stable 803
isotope ratios with δ18O values ranging from -5.3 ‰ for the lake to -9.5 ‰ for the springs and 804
open wells of hills at higher elevation. This reflects a very strong isotopic elevation effect (1.8 805
‰/100 m for δ18O) for the water from the Western Ghats mountain belt between 2000 and 806
2600 m asl where the cold air temperature (i.e., 10 - 20 ̊ C) prevails. The water contribution 807
from the recycled vapours masks the strong effect of elevation, rainfall amount and 808
continental effect on water isotope ratios under the following conditions: i) when there is an 809
increased availability of terrestrial moisture to undergo secondary processes like recycling and 810
evaporation, and ii) after the vapours from short severe storm effect recedes. As the Western 811
Ghats mountain belt forms the source of major South Indian Rivers and provides a platform 812
for the dual monsoon system observation, this study has a global implication with a new 813

35
understanding on the dynamic role of tropical mountains in monitoring the humid climatic 814
system, the Indian monsoon and regional hydrology of South India. The monsoon arrival and 815
its interannual variability affect numerous people living in these fertile mountain ranges, and 816
in the context of global climate change, emphasize the sensitive response of these tropical 817
mountains to anthropogenic influences. Thus, a minor change in the land use/land cover (such 818
as deforestation, agricultural activities and urbanization) and topography of the Western Ghats 819
can have a significant impact on the degree of atmospheric moisture feedback mechanisms 820
and is directly reflected by the climatic conditions of tropical monsoon forest ecosystem in 821
India. 822
823
Acknowledgements 824
This work was funded by the International Unit of Toulouse III University (Toulouse, 825
France). We thank Dr. Balakrishna K and Manipal Academy of Higher Education (earlier 826
Manipal University), Manipal for the Structured PhD fellowship of TM during November 827
2013, Dr. Ajitkumar MP for assistance during the field work at Kannur, and the Associate 828
Editor and three anonymous reviewers for their critical comments and constructive 829
suggestions on the earlier version of manuscript. We are thankful to NOAA Air Resources 830
Laboratory for accessibility to HYSPLIT Trajectory model. We also acknowledge Indian 831
National Science Academy (INSA), Government of India for the DST-INSPIRE Faculty 832
award to TM and sponsoring the present research on the Western Ghats. 833
834
In Memoriam 835

36
We dedicate this work to our esteemed colleague, Dr. C. Unnikrishnan Warrier, former Head 836
of Isotope Hydrology Divison, Centre for Water Resources Development and Management, 837
Kozhikode, Kerala. He passed away untimely in a tragic road accident during October 2017. 838
He initiated the monitoring of rainfall for isotopic composition in 2004 at Kunnamangalam, 839
Kozhikode the data which was subsequently included in the GNIP-data base. 840
We also dedicate our work to Dr. R. Ramesh, Professor (rtd.), Geosciences Division, Physical 841
Research Laboratory, Ahmedabad and National Institute of Science Education and Research, 842
Bhubaneswar. He passed away during April 2018. He was one of the meritorious researchers 843
in India in implementing stable isotope techniques to address multidisciplinary questions in 844
the field of Earth Sciences. 845
Their contributions in the field of stable isotopes provide strong base for future research. 846
847
References 848
Achyuthan, H.M., Michelini, M., Sengupta, S.D., Kale, V.S., Stenni, B., Flora O., 2010. 849
Oxygen and hydrogen isotopic characteristics of the Kaveri river surface waters, southern 850
peninsular, India. IAEA report, ICTP, IC/2010/103. 851
Aggarwal, P.K., Alduchov, O.A., Froehlich, K.O., Araguas-Araguas, L.J., Sturchio, N.C., 852
Kurita, N., 2012. Stable isotopes in global precipitation: A unified interpretation based on 853
atmospheric moisture residence time. Geophysical Research Letters 39, L11705. 854
Araguás-Araguás, L.J., Froehlich, K.O., Rozanski, K., 2000. Deuterium and oxygen-18 855
isotope composition of precipitation and atmospheric moisture. Hydrological Processes 14, 856
1341-1355. 857
Bershaw, J., 2018. Controls on deuterium excess across Asia. Geosciences 8, 257. 858

37
Biasutti, M., Yuter, S.E., Burleyson, C.D., Sobel A.H., 2012. Very high resolution rainfall 859
patterns measured by TRMM precipitation radar: Seasonal and diurnal cycles. Climate 860
Dynamics 39, 239-258. 861
Bowen G.J., 2008. Spatial analysis of the intra-annual variation of precipitation isotope ratios 862
and its climatological corollaries. Journal of Geophysical Research 113, D05113. 863
Bowen, G.J., Revenaugh, J., 2003. Interpolating the isotopic composition of modern meteoric 864
precipitation. Water Resources Research 39, 1299, 9.1-9.13. 865
Breitenbach, S.F.M., Adkins, J.F., Meyer, H., Marwan, N., Kumar, K.K., Haug, G.H., 2010. 866
Strong influence of water vapor source dynamics on stable isotopes in precipitation observed 867
in Southern Meghalaya, NE India. Earth and Planetary Science Letters 292, 212-220. 868
Chamberlain, C.P., Poage M.A., 2000.Reconstructing the paleotopography of mountain belts 869
from the isotopic composition of authigenic minerals. Geology 28, 115-118. 870
Clark, I.D., Fritz, P., 1997. Environmental isotopes in hydrogeology, Lewis Publishers, New 871
York, 328. 872
Coplen, T.B., 2011. Guidelines and recommended terms for expression of stable‐isotope‐ratio 873
and gas‐ratio measurement results. Rapid Communications in Mass Spectrometry 25, 2538-874
2560. 875
Craig, H., 1961. Isotopic variations in meteoric waters. Science 133, 1702-1703. 876
Dansgaard, W., 1964. Stable isotopes in precipitation. Tellus 16, 436-468. 877
Day, J.A., Fung, I., Rissi, C., 2015. Coupling of South and East Asian Monsoon precipitation 878
in July-August. Journal of Climate 28, 4330-4356. 879
38
Deshpande, R.D., Bhattacharya, S.K., Jani, R.A., Gupta, S.K., 2003. Distribution of oxygen 880
and hydrogen isotopes in shallow groundwaters from Southern India: influence of a dual 881
monsoon system. Journal of Hydrology 271, 226-239. 882
Dinçer, T., Payne, B.R., Florkowski, T., Martinec, J., Tongiorgi, E.G.E.I., 1970. Snowmelt 883
runoff from measurements of tritium and oxygen-18. Water Resources Research 6, 110-124. 884
Edirisinghe, E.A.N.V., Pitawala, H.M.T.G.A., Dharmagunawardhane, H.A., Wijayawardane, 885
R.L., 2017. Spatial and temporal variation in the stable isotope composition (δ18O and δ2H) of 886
rain across the tropical island of Sri Lanka. Isotopes in Environmental Health Studies 53, 628-887
645. 888
Epstein, S., Mayeda, T., 1953. Variation of O18 content of water from natural sources. 889
Geochimica et Cosmochimica Acta 4, 213-214. 890
Friedman, I., Redfield, A.C., Schoen, B., Harris, J., 1964. The variation of the deuterium 891
content of natural waters in the hydrologic cycle. Reviews of Geophysics 2, 177-224. 892
Froehlich K., Rozanski K., Araguas-Araguas L. 1998. Isotope hydrology: applied discipline in 893
Earth sciences. In Causse C. and Gasse F. (eds.) Hydrologie et géochimie isotopique. Paris, 894
Orstom, 55-72. 895
Froehlich, K., Gibson, J., Aggarwal, P.K., 2002. Deuterium excess in precipitation and its 896
climatological significance (IAEA-CSP-13/P), International Atomic Energy Agency, 54-66. 897
Garcia, M., Villalba, F., Araguas-Araguas, L., Rozanski, K., 1998. The role of atmospheric 898
circulation patterns in controlling the regional distribution of stable isotope contents in 899
precipitation: Preliminary results from two transects in the Ecuadorian Andes. In: Isotope 900
Techniques in the Study of Environmental Change, International Atomic Energy Agency, 901
Vienna, 127-140. 902

39
Gat, J.R., 1996. Oxygen and hydrogen isotopes in the hydrological processes. Hydrology and 903
Earth System Sciences 24, 225-262. 904
Gonfiantini, R., Roche, M.A., Olivry, J.C., Fontes, J.C., Zuppi, G.M., 2001. The altitude 905
effect on the isotopic composition of tropical rains. Chemical Geology 181, 147-167. 906
Gunnell, Y., 1997. Relief and climate in South Asia: the influence of the Western Ghats on 907
the current climate pattern of peninsular India. International Journal of Climatology17, 1169-908
1182. 909
Gunnell, Y., 1998. Passive margin uplifts and their influence on climatic change and 910
weathering patterns of Tropical shield regions. Global Planetary Change 18, 47-57. 911
Gurumurthy, G.P., Balakrishna, K., Tripti, M., Riotte, J., Audry, S., Braun, J.J., Lambs, L., 912
Udaya Shankar, H.N., 2015. Sources and processes affecting the chemistry of subsurface 913
waters along a tropical river basin, Southwestern India. Environ. Earth Sci. 73, 333-346. 914
Hameed, A.S., Resmi, T.R., Suraj, S., Warrier, C. U., Sudheesh, M., Deshpande R.D., 2015. 915
Isotopic characterization and mass balance reveals groundwater recharge pattern in Chaliyar 916
river basin, Kerala, India. Journal of Hydrology: Regional Studies 4, 48-58. 917
Hameed, A.S., Resmi, T.R., Praveenbabu, M., Sudheesh, M., Deshpande, R.D., 2016. 918
Synoptic variation of stable isotopes in precipitation and ground level vapour in a humid 919
tropical region, Kerala, India. Environmental Earth Sciences 75, 1412. 920
Hobson, K. A., Anderson, R.C, Soto, D.X., Wassenaar, L.I., 2012. Isotopic evidence that 921
dragonflies (Pantala flavescens) migrating through the Maldives come from the northern 922
Indian subcontinent. PLOS One 7, e52594, pp. 1-4. 923
Jain, S.K., Agarwal, P.K., Singh, V.P., 2007. Hydrology and water resources of India. Series: 924
Water science and technology library, Springer, 57, 1260. 925

40
Kaseke, K.F., Wang, L., Wanke, H., Turewicz, V., Koeniger, P., 2018. An analysis of 926
precipitation isotope distribution across Namibia using historical data. PLOS One 11, 927
e0154598. 928
Kendall, C., McDonnell J.J.,1993. Effect of intrastorm isotopic heterogeneities of rainfall, soil 929
water, and groundwater in runoff modeling. In: Tracers in Hydrology, Proceedings of the 930
Yokohama Symposium, 41-48. Publication 215, International Association of Hydrological 931
Sciences, Wallingford. 932
Kumar, B., Athavale, R.N., Sahay, K.S.N., 1982. Stable isotope geohydrology of the lower 933
Maner basin, Andhra Pradesh, India. Journal of Hydrology 59, 315-330. 934
Lachniet, M.S., Patterson, W.P., 2002. Stable isotope values of Costa Rican surface waters. 935
Journal of Hydrology 260, 135-150. 936
Lachniet, M.S., Patterson, W.P., 2006. Use of correlation and stepwise regression to evaluate 937
physical controls on the stable isotope values of Panamanian rain and surface waters. Journal 938
of Hydrology 324, 115-140. 939
Lachniet, M.S., Patterson, W.P., 2009. Oxygen isotope values of precipitation and surface 940
waters in northern Central America (Belize and Guatemala) are dominated by temperature 941
and amount effects. Earth and Planetary Science Letters 284, 435-446. 942
Lambs, L., Balakrishna, K., Brunet, F., Probst, J.L., 2005. Oxygen and hydrogen isotopic 943
composition of major Indian rivers: a first global assessment. Hydrological Processes 19, 944
3345-3355. 945
Lambs, L., Bompy, F., Dulormne, M., 2018. Using isotopic spike from tropical storm to 946
understand water exchange on large scale: case study of Rafael storm in the Lesser Antilles 947
archipelago. Rapid Communications in Mass Spectrometry 32, 457-468. 948

41
Lambs, L., Gurumurthy, G.P., Balakrishna, K., 2011. Tracing the sources of water using 949
stable isotopes: first results along the Mangalore-Udupi region, south-west coast of India. 950
Rapid Communications in Mass Spectrometry 25, 2769-2776. 951
Lambs, L., Mangion, P., Mougin, E., Fromard, F., 2016. Water cycle and salinity dynamics in 952
the mangrove forests of Europa and Juan de Nova Islands, southwest Indian Ocean. Rapid 953
Communications in Mass Spectrometry 30, 311-320. 954
Lawrence, J.R., 1998. Isotopic spikes from tropical cyclones in surface waters: opportunities 955
in hydrology and paleoclimatology. Chemical Geology 144, 153-160. 956
Lee, K-S., Grundstein, A.J., Wenner, D.B., Choi, M-S., Woo, N-C., Lee, D-H., 2003. 957
Climatic controls on the stable isotopic composition of precipitation in Northeast Asia. 958
Climate Research 23, 137-148. 959
Li, C., Yanai, M., 1996. The onset and interannual variability of the Asian Summer Monsoon 960
in relation to land-sea thermal contrast. Journal of Climate 9, 358-375. 961
McDonnell, J.J., Beven, K., 2014. Debates-the future of hydrological sciences: A (common) 962
path forward? A call to action aimed at understanding velocities, celerities and residence time 963
distributions of the headwater hydrograph. Water Resources Research 50, 5342-5350. 964
McGuire, K., McDonnell, J.J., 2007. Stable isotope tracers in watershed hydrology. In: K. 965
Lajtha and R. Michener (eds.), Stable isotopes in ecology and environmental science, 2nd 966
editions, Blackwell Publishing, Oxford, UK, 334-374. 967
McVicar, T.R., Körner, C., 2013. On the use of elevation, altitude and height in the ecological 968
and climatological literature. Oecologia 171, 335-337. 969

42
Mooley, D.A., Shukla, J., 1987. Variability and forecasting of the summer monsoon rainfall 970
over India. In: C. P. Chang and T. N. Krishnamurti (eds.) Monsoon Meteorology, Oxford 971
University Press, pp. 26-59. 972
Negi, S.S., 1996. Biosphere reserves in India: land use, biodiversity and conservation. Indus 973
publication, Delhi, 221 pages. 974
Negrel, P.H., Pauwels, H., Dewandel, B., Gandolfi, J.M., Mascré, C., Ahmed, S. 2011. 975
Understanding groundwater systems end their functioning through the study of stable water 976
isotopes in a hard-rock aquifier (Maheswaram watershed, India). Journal of Hydrology 397, 977
55-70. 978
Pimm, S.L., Sugden, A.M., 1994. Tropical diversity and global change. Science 263, 933-934. 979
Poage, M.A., Chamberlain, C.P., 2001. Empirical relationships between elevation and the 980
stable isotope composition of precipitation and surface waters: considerations for studies of 981
paleoelevation change. American Journal of Science 301, 1-15. 982
Rahul, P., Ghosh, P., Bhattacharya, S.K., 2016. Rainouts over the Arabian Sea and Western 983
Ghats during moisture advection and recycling explain the isotopic composition of Bangalore 984
summer rains. Journal of Geophysical Research 6148-6163. 985
Ramachandra, T.V., Vinay, D., Bharath, H.A., 2016. Environmental flow assessment in a 986
lotic ecosystem of central Western Ghats, India. Hydrology Current Research 7, 1-14. 987
Resmi, T.R., Sudharma, K.V., Hameed, A.S., 2016. Isotope characteristics of precipitation in 988
the Pamba river basin, Kerala, India. Journal of Earth System Sciences 125, 1481-1493. 989
Risi, C., Noone D., Frankenberg, C., Worden J., 2013. Role of continental recycling in 990
intraseasonal variations of continental moisture as deduced from model simulations and water 991
vapor isotopic measurements. Water Resources Research 49, 4136-4156. 992
43
Rozanski, K., Araguás-Araguás, L., Gonfiantini, R., 1992. Relation between long-term trends 993
of oxygen-18 isotope composition of precipitation and climate. Science 258, 981-985. 994
Rozanski, K., Araguás-Araguás, L., Gonfiantini, R., 1993. Isotopic patterns in modern global 995
precipitation. Geophysical Monograph Series 78, 1-36. 996
Sánchez-Murillo R., Birkel C., Welsh K., Esquivel-Hernández, G., Corrales-Salazar, J., Boll, 997
J., Brooks, E., Roupsard, O., Sáenz-Rosales, O., Katchan, I., Arce-Mesén, R., Soulsby, C., 998
Araguás-Araguás, L.J. 2016. Key drivers controlling stable isotope variations in daily 999
precipitation of Costa Rica: Caribbean Sea versus Eastern Pacific Ocean moisture sources. 1000
Quaternary Science Reviews 131, 250-261. 1001
Scholl, M.A., Shanley, J.B., Zegarra, J.P., Coplen, T.B., 2009. The stable isotope amount 1002
effect: new insights from NEXRAD echo tops, Luquillo Mountains, Puerto Rico. Water 1003
Resources Research 45, W12407. 1004
Siegenthaler, U., Oeschger, H., 1980. Correlation of 18O in precipitation with temperature 1005
and altitude. Nature 285, 314-317. 1006
Sklash, M.G., 1990. Environmental isotope studies of storm and snowmelt runoff generation. 1007
In: M.G. Anderson and T.P. Burt (eds.), Process studies in Hillslope Hydrology, John Wiley 1008
and Sons, Chichester, UK, pp. 401-435. 1009
Stumpp, C., Klaus, J., Stichler, W., 2014. Analysis of long-term stable isotopic composition 1010
in German precipitation. Journal of Hydrology 517, 351-61. 1011
Sturm, C., Hoffmann, G., Langmann, B., 2007. Simulation of the Stable Water Isotopes in 1012
Precipitation over South America: Comparing Regional to Global Circulation Models. Journal 1013
of Climate 20, 3730-3750. 1014

44
Tawde, S.A., Singh, C., 2015. Investigation of orographic features influencing spatial 1015
distribution of rainfall over the Western Ghats of India using satellite data. International 1016
Journal of Climatology 35, 2280-2293. 1017
Tripti, M., Lambs, L., Otto, T., Gurumurthy, G.P., Teisserenc, R., Moussa, I, Balakrishna, K., 1018
Probst, J.L., 2013. First assessment of water and carbon cycles in two tropical coastal rivers of 1019
south-west India - an isotopic approach. Rapid Communications in Mass Spectrometry 27, 1020
1681-1689. 1021
Tripti, M., Lambs, L., Gurumurthy, G.P., Moussa, I., Balakrishna, K., Chadaga, M.D., 2016. 1022
Water circulation and governing factors in humid tropical river basins in the central Western 1023
Ghats, Karnataka, India. Rapid Communications in Mass Spectrometry 30, 175-190. 1024
UNESCO, 2012. World Heritage list for Western Ghats, ID No. 1342 Rev, 1025
http://whc.unesco.org/en/list/1342. 1026
Vitousek, P.M., Mooney, H.A., Lubchenco, J., Mellilo, J.M., 1997. Human domination of 1027
Earth’s ecosystems. Science 277, 494-499. 1028
Vitvar, T., Aggarwal, P.K., McDonnell, J.J., 2004. A review of isotope applications in 1029
catchment hydrology. In: P.K. Aggarwal, J. Gat and K. Froehlich (eds.), Isotopes in the water 1030
cycle: Past, present and future of a developing science. International Atomic Energy Agency 1031
Publication, Netherlands, pp 151-169. 1032
Warrier, C.U., Babu, M.P., Manjula, P., Velayudhan, K.T., Shahul Hameed, A., Vasu, K., 1033
2001. Isotopic characterization of dual monsoon precipitation-evidence from Kerala, India. 1034
Current Science 98, 1487-1495. 1035

45
Windhorst, D., Waltz, T., Timbe, E., Frede, H.G., Breuer, L., 2013. Impact of elevation and 1036
weather patterns on the isotopic composition of precipitation in a tropical montane forest. 1037
Hydrology and Earth System Sciences 17, 409-419. 1038
Xie, S.P., Xu, H., Saji, N.H., Wang, Y., Liu, W.T., 2006. Role of narrow mountains in large-1039
scale organization of Asian monsoon convection. Journal of Climate 19, 3420-3429. 1040
Yadava, M.G., Ramesh, R.N., Pandarinath, K. 2007. A positive ‘amount effect’ in the 1041
Sahayadri (Western Ghats) rainfall. Current Science 93, 560-564. 1042
1043
List of Tables 1044
Table 1: Sampling places during November / December 2013 and October 2014 with location, 1045
elevation range, distance to the Arabian Sea coast, number of samples (n) and date. 1046
1047
Table 2: Physicochemical parameters, elevation, stable water isotope ratio (δ18O and δ2H) and 1048
calculated d-excess for the November/December 2013 and October 2014 samples. Note that GW is for 1049
groundwater, OW for open well, BW for bore well and sd is for standard deviation. 1050
1051
Table 3: Summary of relevant studies on the isotopic elevation effect. 1052
1053
Table 4: Multiple Linear Regression results as obtained from the Past program version 3.15. The 1054
dependent variable was oxygen isotope ratio (δ18O) and the independent variables were the elevation 1055
above mean sea level (elevation effect), the distance from the coast (Rayleigh distillation and 1056
continental effect) and the annual rainfall amount (amount effect). 1057
1058
46
List of Figures 1059
Fig. 1.a.: Hydrographic map of Southwest India showing different river basins (written in 1060
blue) from North to South, of the Krishna river (Tunga, Badra and Vedavati), of the Cauvery 1061
river (Cauvery itself, Kabini, Moyar and Bhavani) and the main coastal rivers (Swarna, 1062
Nethravati and Chaliyar). The river basin boundary is represented as black line and the white 1063
dashed lines correspond to state borders. The higher peaks of the Western Ghats are localised 1064
in white (Mullayanagiri 1930 m, Kudremukh and Charmadi 1800 m, Tadiandamol 1850 m, 1065
Chembra 2100 m and Doddabetta 2600 m; above mean sea level). The sampling sites for the 1066
present study during November 2013 and October 2014 are underlined in black (details in 1067
Table 1), and the sites previously sampled in dashed line. The different type of sampled water 1068
is given by the following symbol: rainfall samples as triangle, stream, rivulet and spring as 1069
circle, groundwater as square, lake and ponds by plus. 1070
1071
Fig. 1.b.: Rainfall map of South India showing higher amount along the west coast, parallel to the 1072
eastern Arabian Sea due to the orographic barrier effect of the Western Ghats for the major southwest 1073
monsoonal moisture and the drier leeward eastern slopes (Map adapted from C. Sudhakar Reddy et al. 1074
2015). The study area corresponding with Fig. 1.a. is given by the black frame. The location name in 1075
white corresponds to the available GNIP (Global Network of Isotopes in Precipitation) station except 1076
for Bakrabail (2013 samples; this study) with values in brackets corresponding to the weighted mean 1077
δ18O values. Note: Belgaum in North Karnataka, elevation 747 m asl, average annual rainfall 1200 1078
mm, temperature 24.4 °C. Bangalore, in East of Karnataka, elevation 897 m asl, annual rainfall 850 1079
mm, temperature 24.1°C. Kozhikode (Kunnamangalam) in North Kerala, elevation 20 m asl, annual 1080
rainfall 3050 mm, temperature 27.9°C. Tirunelveli in Tamil Nadu, elevation 4 m asl, annual rainfall 1081
750 mm, temperature 29.1°C. 1082
1083

47
Fig. 1.c.: Monthly rainfall (India Meteorological Department, Government of India) during 2013 and 1084
2014 in coastal districts (include regions stretching between west coast to highlands in the western 1085
slopes of Western Ghats) like Udupi/Dakshin Kannada (for stations Agumbe and Bakrabail), 1086
Kasaragod/Kannur (Ezhimala, Thottada), Kozhikode and Thrissur receiving mainly the summer 1087
monsoon during June – September, and the inland districts (include regions from the Ghats top to 1088
eastern foothills of the Western Ghats) like Shivamogga (eastern part of Agumbe), Kodagu 1089
(Madikeri), Wayanad (Gudalur, Sultan Bathery) and Nilgiris (Ooty, Pykara) receiving additional 1090
winter monsoon during October-December. The sampling period is given by the navy blue rectangles. 1091
The x-axis represents the months from January to December and the y-axis represents the monthly 1092
rainfall amount (mm) data. Annual rainfall (mm) of corresponding sampling year is given in legend. 1093
1094
Fig. 1.d.: Rainfall variability (rainfall amount data from www.worldweatheronline.com and 1095
corresponding station spring/groundwater isotope ratio from our study) along the west coast 1096
and inland regions adjacent to the Western Ghats, South India. 1097
1098
Fig. 2.a.: Relationship between water temperature and oxygen isotope ratio (δ18O) for the 1099
November 2013 samples. 1100
1101
Fig. 2.b.: Relationship between conductivity and oxygen isotope ratio (δ18O) for the 1102
November/December 2013 water samples (Agumbe, Bakrabail, Pykara, Doddabetta, Sultan 1103
Bathery and Thrissur) and the October 2014 water samples (Ezhimala and Thottada). 1104
1105
Fig. 3: Relationship between oxygen isotope ratio (δ18O) and hydrogen isotope ratio (δ2H) for 1106
the water samples of November/December 2013 and October 2014. The solid blue line 1107

48
represents the Global Meteoric Water Line (δ2H = (8 x δ18O) + 10; Craig, 1961). The 1108
sampling sites are given from the Northern location i.e. Agumbe (13° 30’N) to the Southern 1109
location i.e. Thrissur (10° 30’N). All these locations are marked in Figure 1.a. Pykara and 1110
Ooty samples correspond to the sampling in the Nilgiri range with elevation around 2000 m 1111
asl. 1112
1113
Fig. 4: Relationship between elevation and oxygen isotope ratio (δ18O) along the mountain 1114
belt of the Western Ghats. The first regression line in green colour is for the stations below 1115
2050 m asl and the second line in blue is for the stations beyond 2050 m asl in the Nilgiri 1116
ranges. The overall slope of 0.31 ‰/100 m for the isotope ratios of water from the west coast 1117
to the highest elevation (sampled here at 2300 m asl) of the Western Ghats is given in red to 1118
compare with the reported global isotopic lapse rate (0.28 ‰/100 m; Poage and Chamberlain, 1119
2001). Note the data for Mullyanagiri - Charmadi Ghat (Lambs et al. 2011) and Kudremukh 1120
(Tripti et al. 2016) are from published work. 1121
1122
Fig. 5: The variability of oxygen isotope ratio (δ18O) for nine major sampling locations as a 1123
function of their distance to the Arabian Sea coast. The grey box corresponds to the mean 1124
oxygen isotope ratio (δ18O = -3.1 ± 0.3‰; Tripti et al. 2016) of groundwater in southwest 1125
coast of India. 1126
1127
Fig. 6: Results from NOAA Hysplit simulations for the eight main sampling stations with air 1128
masses back trajectory up to 5 days. 1129
1130
49
Fig. 7: Plot showing relationship between elevation and oxygen isotope ratio (δ18O) for 1131
groundwater in Sri Lanka (July 2012) and Rajasthan (December 2011 and November 2014), 1132
India (data from Lambs, under preparation). 1133
1134
Fig. 8: The variability of deuterium-excess in the sampled water (lake, pond and bore well 1135
samples are not included to avoid any effect from evaporation) along the Western Ghats and 1136
its adjacent slopes during this study. Note that water from the mountains close to the west 1137
coast of India exhibit higher d-excess range between 3 ‰ and 20 ‰ whereas lower variability 1138
is observed in inland region corresponding to highest elevations in the Western Ghats 1139
monitored during this study. 1140

1
Fig. 1.a.: Hydrographic map of Southwest India showing different river basins (written in
blue) from North to South, of the Krishna river (Tunga, Badra and Vedavati), of the Cauvery
river (Cauvery itself, Kabini, Moyar and Bhavani) and the main coastal rivers (Swarna,
Nethravati and Chaliyar). The river basin boundary is represented as black line and the white
dashed lines correspond to state borders. The higher peaks of the Western Ghats are localised
in white (Mullayanagiri 1930 m, Kudremukh and Charmadi 1800 m, Tadiandamol 1850 m,
Chembra 2100 m and Doddabetta 2600 m; above mean sea level). The sampling sites for the
present study during November 2013 and October 2014 are underlined in black (details in
Table 1), and the sites previously sampled in dashed line. The different type of sampled water
is given by the following symbol: rainfall samples as triangle, stream, rivulet and spring as
circle, groundwater as square, lake and ponds by plus.

2
Fig. 1.b.: Rainfall map of South India showing higher amount along the west coast, parallel to the
eastern Arabian Sea due to the orographic barrier effect of the Western Ghats for the major southwest
monsoonal moisture and the drier leeward eastern slopes (Map adapted from C. Sudhakar Reddy et al.
2015). The study area corresponding with Fig. 1.a. is given by the black frame. The location name in
white corresponds to the available GNIP (Global Network of Isotopes in Precipitation) station except
for Bakrabail (2013 samples; this study) with values in brackets corresponding to the weighted mean
δ18O values. Note: Belgaum in North Karnataka, elevation 747 m asl, average annual rainfall 1200
mm, temperature 24.4 °C. Bangalore, in East of Karnataka, elevation 897 m asl, annual rainfall 850
mm, temperature 24.1°C. Kozhikode (Kunnamangalam) in North Kerala, elevation 20 m asl, annual
rainfall 3050 mm, temperature 27.9°C. Tirunelveli in Tamil Nadu, elevation 4 m asl, annual rainfall
750 mm, temperature 29.1°C.

3
0
30
0
60
0
90
0
12
00
15
00
18
00
Jan
Fe
bM
ar
Ap
rM
ay
Jun
Jul
Au
gS
ep
Oct
No
vD
ec
Rainfall (mm)U
du
pi/
Da
ksh
in K
an
na
da
20
13
(4
85
0 m
m)
20
14
(4
15
0 m
m)
0
30
0
60
0
90
0
12
00
15
00
18
00
Jan
Fe
bM
ar
Ap
rM
ay
Jun
Jul
Au
gS
ep
Oct
No
vD
ec
Sh
iva
mo
gga
/Ch
ikk
am
aga
luru
20
13
(2
76
0 m
m)
20
14
(2
98
0 m
m)
20
13
0
30
0
60
0
90
0
12
00
15
00
18
00
Jan
Fe
bM
ar
Ap
rM
ay
Jun
Jul
Au
gS
ep
Oct
No
vD
ec
Rainfall (mm)
Ka
sara
go
d/K
an
nu
r
20
13
(4
02
0 m
m)
20
14
(3
53
0 m
m)
20
14
0
30
0
60
0
90
0
12
00
15
00
18
00
Jan
Fe
bM
ar
Ap
rM
ay
Jun
Jul
Au
gS
ep
Oct
No
vD
ec
Ko
da
gu
20
13
(3
03
0 m
m)
20
14
(2
63
0 m
m)
20
13
20
13

4
F
ig.
1.c.
: M
onth
ly r
ainf
all
(Ind
ia M
eteo
rolo
gica
l Dep
artm
ent,
Gov
ernm
ent
of I
ndia
) du
ring
201
3 an
d 20
14
in c
oast
al d
istr
icts
(in
clud
e re
gion
s st
retc
hing
betw
een
wes
t co
ast
to
high
land
s in
th
e w
este
rn
slop
es
of
Wes
tern
G
hats
) lik
e U
dupi
/Dak
shin
K
anna
da
(fo
r st
atio
ns
Agu
mbe
an
d B
akr
abai
l),
Kas
arag
od/K
annu
r (E
zhim
ala,
Tho
ttada
), K
ozhi
kode
an
d T
hris
sur
rece
ivin
g m
ainl
y th
e su
mm
er m
onso
on d
uri
ng J
une
– S
epte
mbe
r, a
nd t
he i
nlan
d di
stri
cts
(inc
lude
reg
ions
fro
m t
he G
hats
top
to
east
ern
foot
hills
of
the
Wes
tern
Gha
ts)
like
Shi
vam
ogg
a (e
aste
rn
part
of
Agu
mbe
), K
odag
u (M
adik
eri),
Way
anad
(Gud
alur
, S
ulta
n B
athe
ry)
and
Nilg
iris
(Oot
y, P
ykar
a) r
ecei
ving
add
ition
al w
inte
r m
onso
on d
urin
g O
ctob
er-D
ece
mbe
r. T
he s
ampl
ing
peri
od i
s gi
ven
by t
he
navy
blu
e re
ctan
gles
. T
he x
-axi
s re
pres
ents
the
mon
ths
from
Jan
uary
to
Dec
embe
r an
d th
e y-
axis
rep
rese
nts
the
mon
thly
rai
nfal
l am
ount
(m
m)
data
. A
nnua
l
rain
fall
(mm
) of
cor
resp
ondi
ng s
ampl
ing
year
is g
iven
in le
gend
.
0
30
0
60
0
90
0
12
00
15
00
18
00
Jan
Fe
bM
ar
Ap
rM
ay
Jun
Jul
Au
gS
ep
Oct
No
vD
ec
Rainfall (mm)K
ozh
iko
de
20
13
(3
84
0 m
m)
20
14
(3
57
0 m
m)
0
30
0
60
0
90
0
12
00
15
00
18
00
Jan
Fe
bM
ar
Ap
rM
ay
Jun
Jul
Au
gS
ep
Oct
No
vD
ec
Wa
ya
na
d2
01
3 (
31
70
mm
)
20
14
(3
26
0 m
m)
0
30
0
60
0
90
0
12
00
15
00
18
00
Jan
Fe
bM
ar
Ap
rM
ay
Jun
Jul
Au
gS
ep
Oct
No
vD
ec
Rainfall (mm)
Mo
nth
Th
riss
ur
20
13
(3
18
0 m
m)
20
14
(2
78
0 m
m)
0
30
0
60
0
90
0
12
00
15
00
18
00
Jan
Fe
bM
ar
Ap
rM
ay
Jun
Jul
Au
gS
ep
Oct
No
vD
ec
Mo
nth
Nil
gir
is 20
13
(1
53
0 m
m)
20
14
(1
96
0 m
m)
20
13
20
14
20
13
20
13
20
14
20
13
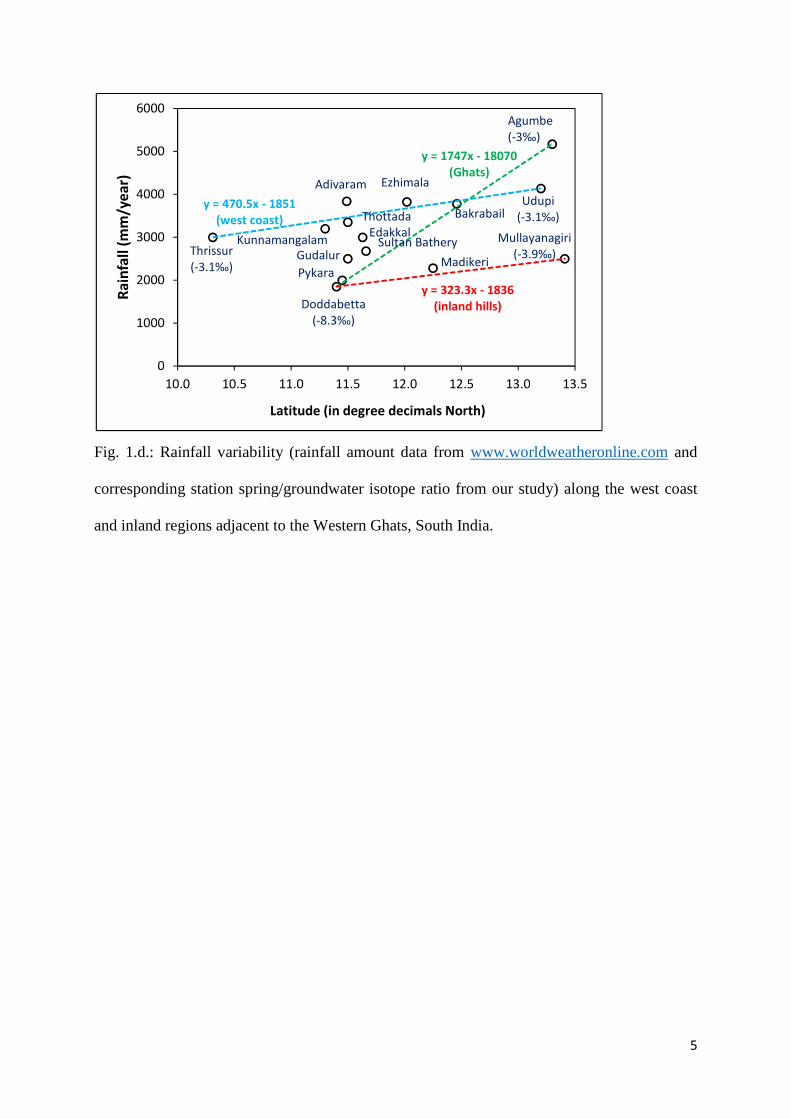
5
Fig. 1.d.: Rainfall variability (rainfall amount data from www.worldweatheronline.com and
corresponding station spring/groundwater isotope ratio from our study) along the west coast
and inland regions adjacent to the Western Ghats, South India.
Udupi
(-3.1‰)Bakrabail
MadikeriPykara
Gudalur
Edakkal
Adivaram
KunnamangalamThrissur
(-3.1‰)
Mullayanagiri
(-3.9‰)
Doddabetta
(-8.3‰)
y = 470.5x - 1851
(west coast)
y = 1747x - 18070
(Ghats)
y = 323.3x - 1836
(inland hills)
0
1000
2000
3000
4000
5000
6000
10.0 10.5 11.0 11.5 12.0 12.5 13.0 13.5
Ra
infa
ll (
mm
/ye
ar)
Latitude (in degree decimals North)
Agumbe
(-3‰)
Ezhimala
Sultan Bathery
Thottada

6
Fig. 2.a.: Relationship between water temperature and oxygen isotope ratio (δ18O) for the
November 2013 samples.
Fig. 2.b.: Relationship between conductivity and oxygen isotope ratio (δ18O) for the
November/December 2013 water samples (Agumbe, Bakrabail, Pykara, Doddabetta, Sultan
Bathery and Thrissur) and the October 2014 water samples (Ezhimala and Thottada).
y = -0.032x2 + 1.683x - 24.99
R² = 0.87
-10
-8
-6
-4
-2
0
10 15 20 25 30
δ1
8O
V-S
MO
W(
‰)
Conductivity (µS/cm)
Agumbe
Bakrabail
Pykara
Doddabetta
-10
-8
-6
-4
-2
0
0 100 200 300 400 500
δ1
8O
V-S
MO
W(
‰)
Conductivity (µS/cm)
Agumbe
Bakrabail
Madikeri
Ezhimala
Thottada
Thrissur
Sultan Bathery
Pykara
Doddabetta
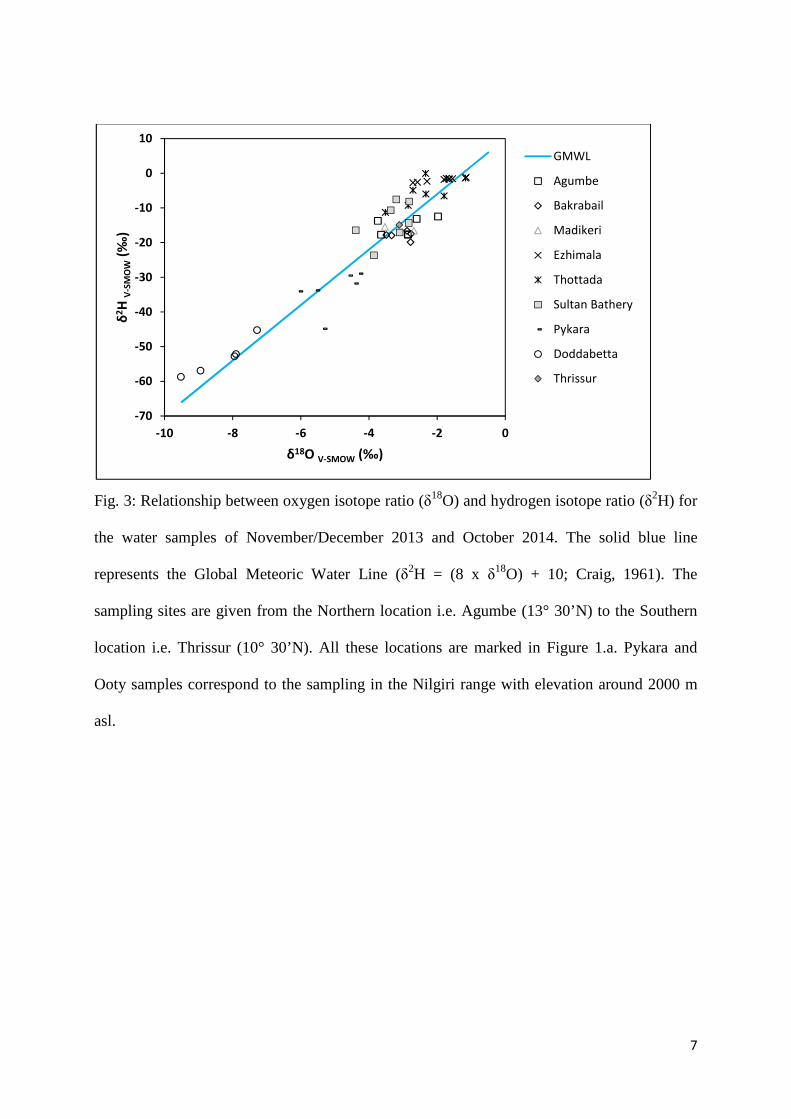
7
Fig. 3: Relationship between oxygen isotope ratio (δ18O) and hydrogen isotope ratio (δ2H) for
the water samples of November/December 2013 and October 2014. The solid blue line
represents the Global Meteoric Water Line (δ2H = (8 x δ18O) + 10; Craig, 1961). The
sampling sites are given from the Northern location i.e. Agumbe (13° 30’N) to the Southern
location i.e. Thrissur (10° 30’N). All these locations are marked in Figure 1.a. Pykara and
Ooty samples correspond to the sampling in the Nilgiri range with elevation around 2000 m
asl.
-70
-60
-50
-40
-30
-20
-10
0
10
-10 -8 -6 -4 -2 0
δ2H
V-S
MO
W(‰
)
δ18O V-SMOW (‰)
GMWL
Agumbe
Bakrabail
Madikeri
Ezhimala
Thottada
Sultan Bathery
Pykara
Doddabetta
Thrissur

8
Fig. 4: Relationship between elevation and oxygen isotope ratio (δ18O) along the mountain
belt of the Western Ghats. The first regression line in green colour is for the stations below
2050 m asl and the second line in blue is for the stations beyond 2050 m asl in the Nilgiri
ranges. The overall slope of 0.31 ‰/100 m for the isotope ratios of water from the west coast
to the highest elevation (sampled here at 2300 m asl) of the Western Ghats is given in red to
compare with the reported global isotopic lapse rate (0.28 ‰/100 m; Poage and Chamberlain,
2001). Note the data for Mullyanagiri - Charmadi Ghat (Lambs et al. 2011) and Kudremukh
(Tripti et al. 2016) are from published work.
y = -0.003x - 2.1
(overall effect)
y = -0.025x + 49.4
R² = 0.773
(Elevation > 2050 m)
y = -0.0009x - 2.4
R² = 0.4
(Elevation < 2050 m)
-12
-10
-8
-6
-4
-2
0
0 500 1000 1500 2000 2500
δ18O
V-S
MO
W(‰
)
Elevation (m asl)
Agumbe
Bakrabail
Madikeri
Ezhimala
Thottada
Sultan Bathery
Pykara
Doddabetta
Thrissur
Mullayanagiri
Charmadi Ghat
Kudremukh

9
Fig. 5: The variability of oxygen isotope ratio (δ18O) for nine major sampling locations as a
function of their distance to the Arabian Sea coast. The grey box corresponds to the mean
oxygen isotope ratio (δ18O = -3.1 ± 0.3‰; Tripti et al. 2016) of groundwater in southwest
coast of India.
-10
-8
-6
-4
-2
0
0 20 40 60 80 100 120
δ18O
V-S
MO
W(‰
)
Distance from coastline (km)
Agumbe
Doddabetta
Madikeri
Ezhimala
Thottada
PykaraKozhikode
Bakrabail
Thrissur

10

11
Fig. 6: Results from NOAA Hysplit simulations for the eight main sampling stations with air
masses back trajectory up to 5 days.

12
Fig. 7: Plot showing relationship between elevation and oxygen isotope ratio (δ18O) for
groundwater in Sri Lanka (July 2012) and Rajasthan (December 2011 and November 2014),
India (data from Lambs, under preparation).
y = -0.0018 x - 5.24
R² = 0.7
-9
-8
-7
-6
-5
-4
-3
0 500 1000 1500 2000 2500
δ1
8O
V-S
MO
W(‰
)
Elevation (m asl)
Sri Lanka (July 2012, n=8)
y = -0.0018x - 3.83
R² = 0.5
-7
-6
-5
-4
-3
-2
0 500 1000 1500 2000 2500
δ1
8O
V-S
MO
W(‰
)
Elevation (m asl)
Rajasthan (Dec 2011, Nov 2014, n=13)

13
Fig. 8: The variability of deuterium-excess in the sampled water (lake, pond and bore well
samples are not included to avoid any effect from evaporation) along the Western Ghats and
its adjacent slopes during this study. Note that water from the mountains close to the west
coast of India exhibit higher d-excess range between 3 ‰ and 20 ‰ whereas lower variability
is observed in inland region corresponding to highest elevations in the Western Ghats
monitored during this study.
y = 0.020x + 10.31
R² = 0.03
0
500
1000
1500
2000
2500
3000
0
4
8
12
16
20
0 20 40 60 80 100 120
Ele
va
tio
n (
m a
sl)
d-e
xce
ss (
‰)
Distance from coastline (km)

1
Table 1: Sampling places during November / December 2013 and October 2014 with location, elevation range, distance to the Arabian Sea coast, number of
samples (n) and date.
_________________________________________________________________________________________________ Place State Location Elevation Sea distance n Date _________________________________________________________________________________________________
Agumbe Karnataka 13°30’N, 75°05’E 605-657 m 45 km 6 Nov 2013
Bakrabail Kerala 12°46’N, 74°59’E 59-100 m 14 km 5 Nov 2013
Madikeri Karnataka 12°25’N, 75°44’E 1080-1120 m 75 km 2 Dec 2013
Ezhimala Kerala 12°02°’N, 75°12’E 20- 200 m 0.3-2.0 km 8 Oct 2014
Tottada Kerala 11°50’N, 75°24’E 2-60 m 0.2-18 km 8 Oct 2014
Pykara Tamil Nadu 11°27’N, 76°35’E 1990-2220 m 90 km 6 Nov 2013
Doddabetta Tamil Nadu 11°24’N, 76°44’E 2225-2600 m 106 km 7 Nov 2013
Sultan Bathery Kerala 11°42’N, 76°17’E 27-1300 m 12-85 km 7 Nov 2013, Oct 2014
Thrissur Kerala 10°31’N, 76°12’E 15 m 18 km 1 Dec 2013
__________________________________________________________________________________________________________
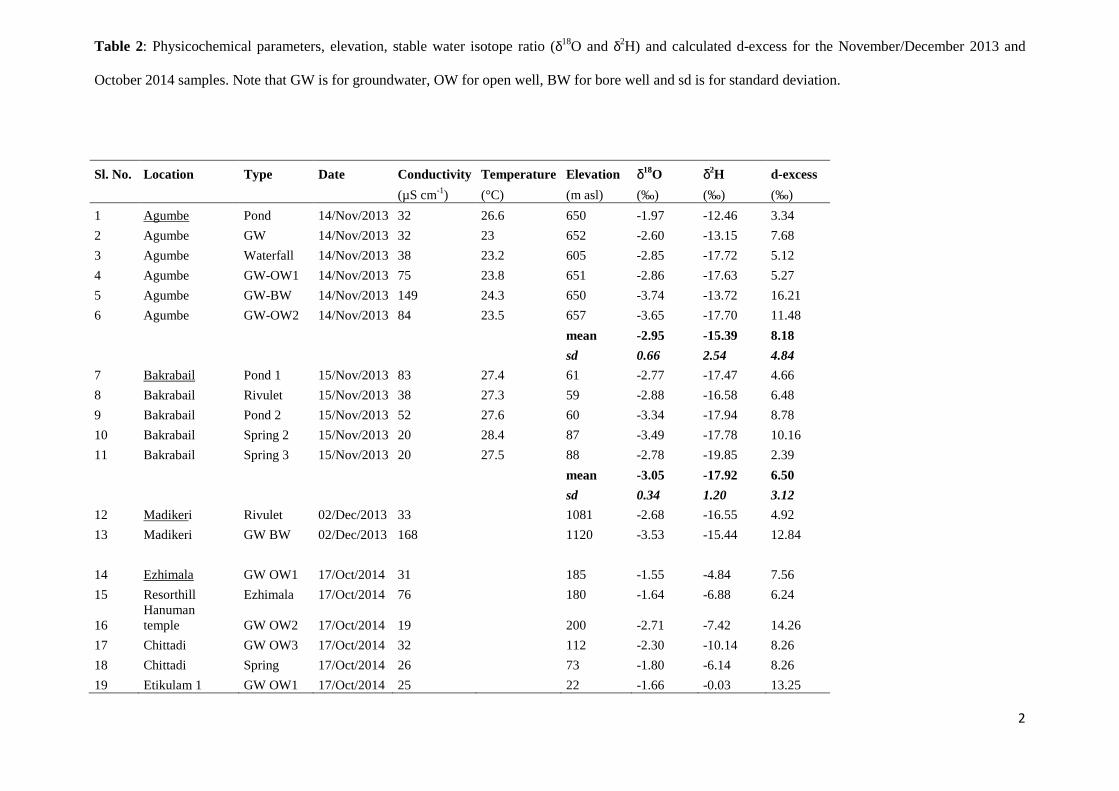
2
Table 2: Physicochemical parameters, elevation, stable water isotope ratio (δ18O and δ2H) and calculated d-excess for the November/December 2013 and
October 2014 samples. Note that GW is for groundwater, OW for open well, BW for bore well and sd is for standard deviation.
Sl. No. Location Type Date Conductivity Temperature Elevation δ18O δ2H d-excess
(µS cm-1) (°C) (m asl) (‰) (‰) (‰)
1 Agumbe Pond 14/Nov/2013 32 26.6 650 -1.97 -12.46 3.34
2 Agumbe GW 14/Nov/2013 32 23 652 -2.60 -13.15 7.68
3 Agumbe Waterfall 14/Nov/2013 38 23.2 605 -2.85 -17.72 5.12
4 Agumbe GW-OW1 14/Nov/2013 75 23.8 651 -2.86 -17.63 5.27
5 Agumbe GW-BW 14/Nov/2013 149 24.3 650 -3.74 -13.72 16.21
6 Agumbe GW-OW2 14/Nov/2013 84 23.5 657 -3.65 -17.70 11.48
mean -2.95 -15.39 8.18
sd 0.66 2.54 4.84
7 Bakrabail Pond 1 15/Nov/2013 83 27.4 61 -2.77 -17.47 4.66
8 Bakrabail Rivulet 15/Nov/2013 38 27.3 59 -2.88 -16.58 6.48
9 Bakrabail Pond 2 15/Nov/2013 52 27.6 60 -3.34 -17.94 8.78
10 Bakrabail Spring 2 15/Nov/2013 20 28.4 87 -3.49 -17.78 10.16
11 Bakrabail Spring 3 15/Nov/2013 20 27.5 88 -2.78 -19.85 2.39
mean -3.05 -17.92 6.50
sd 0.34 1.20 3.12
12 Madikeri Rivulet 02/Dec/2013 33 1081 -2.68 -16.55 4.92
13 Madikeri GW BW 02/Dec/2013 168 1120 -3.53 -15.44 12.84
14 Ezhimala GW OW1 17/Oct/2014 31 185 -1.55 -4.84 7.56
15 Resorthill Ezhimala 17/Oct/2014 76 180 -1.64 -6.88 6.24
16 Hanuman temple GW OW2 17/Oct/2014 19 200 -2.71 -7.42 14.26
17 Chittadi GW OW3 17/Oct/2014 32 112 -2.30 -10.14 8.26
18 Chittadi Spring 17/Oct/2014 26 73 -1.80 -6.14 8.26
19 Etikulam 1 GW OW1 17/Oct/2014 25 22 -1.66 -0.03 13.25
3
20 Etikulam 2 GW OW2 17/Oct/2014 34 31 -2.58 -2.74 17.90
21 Etikulam 3 GW OW3 17/Oct/2014 57 20 -1.15 -6.46 2.74
mean -1.92 -5.58 9.81
sd 0.55 3.08 4.93
22 Venagara temple GW OW1 17/Oct/2014 27 18 -2.71 -4.88 16.80
23 Venagara road GW OW2 17/Oct/2014 61 37 -1.17 -1.36 8.00
24 Pariyaram GW OW 17/Oct/2014 29 60 -3.52 -11.27 16.89
25 Pariyaram Rivulet 17/Oct/2014 21 58 -1.80 -6.52 7.88
26 Tottada River 18/Oct/2014 365 6 -2.85 -9.25 13.55
27 Tottada Rivulet 18/Oct/2014 387 5 -2.33 -5.99 12.65
28 Tottada Rainfall 18/Oct/2014 36 2 -1.73 -1.44 12.40
29 Tottada GW OW 18/Oct/2014 211 2 -2.34 -0.04 18.68
mean -2.31 -5.09 13.36
sd 0.74 3.99 4.02
30 Pykara Lake 19/Nov/2013 65 18.5 2034 -4.42 -31.77 3.55
31 Terrace estate Rivulet 19/Nov/2013 18 17.2 2219 -6.05 -34.04 14.33
32 Bellevue estate Rivulet 19/Nov/2013 23 16.2 2127 -5.54 -33.78 10.57
33 TR Bazzar Rivulet 19/Nov/2013 30 15.5 1990 -4.59 -29.48 7.21
34 Sandynulla Lake 19/Nov/2013 279 18.4 2153 -4.28 -28.94 5.30
35 Ooty lake Lake 19/Nov/2013 450 18.6 2213 -5.34 -44.79 -2.10
mean -5.03 -33.80 6.48
sd 0.71 5.78 5.70
36 Ooty Rainfall 1 17/Nov/2013 30 2225 -17.91 -125.68 17.60
37 Doddabetta Rainfall 2 17/Nov/2013 13 13.8 2632 -16.03 -107.41 20.82
38 Ooty GW 18/Nov/2013 136 14.7 2225 -7.29 -45.21 13.09
39 Doddabetta GW tank 18/Nov/2013 32 13.4 2300 -7.95 -52.77 10.80
40 Doddabetta Spring 18/Nov/2013 16 12.2 2302 -9.52 -58.69 17.47
41 Doddabetta Tank-rivulet 18/Nov/2013 62 12.8 2280 -8.94 -56.89 14.66
42 Kodapamund GW BW 18/Nov/2013 72 17.2 2260 -7.90 -52.14 11.08
mean -8.32 -53.14 13.42
sd 0.90 5.22 2.76
43 Gudalur GW 20/Nov/2013 415 938 -2.83 -14.34 8.31

4
44 Sultan Bathery GW 20/Nov/2013 231 904 -4.39 -16.43 18.66
45 Sultan Bathery GW OW 23/Oct/2014 181 892 -3.10 -17.06 7.74
46 Edakkal Spring 23/Oct/2014 20 1300 -3.20 -7.51 18.09
47 Adivaram Rivulet 23/Oct/2014 19 345 -3.36 -10.65 16.23
48 Kunnamangalam GW 21/Nov/2013 50 55 -3.85 -23.65 7.19
49 Karanthur GW BW 23/Oct/2014 104 27 -2.82 -8.13 14.43
mean -3.36 -13.97 12.95
sd 0.57 5.72 5.06
50 Thrissur GW BW 05/Dec/2013 332 5 -3.11 -14.91 9.99

5
Table 3: Summary of relevant studies on the isotopic elevation effect.
Sl. No. Study Aim of the study Location Key findings
1 Dansgaard (1964) Determining factors influencing fractionation of water isotopes.
Worldwide The heavy isotope composition in freshwater decreases with latitude and elevation.
2 Ambach et al. (1968) To measure isotopic elevation, change of rainfall in mountains.
Alps Isotopic elevation effect of -0.2 ‰/100 m.
3 Siegenthaler and Oeschger (1980)
Variation of δ18O with temperature and elevation.
Alps Isotopic elevation effect of -0.45 ± 0.1 ‰/100 m.
4 Yurtsever and Gat (1981)
Elevation effect on water isotope ratios.
GNIP data, worldwide Isotopic elevation effect of -0.15 to -0.5 ‰/100 m.
5 Gonfiantini et al. (2001)
Elevation effect on the isotopic composition of tropical rains.
Cameroon and Bolivia Cameroon -0.16 ‰ and Bolivia -0.24 ‰/100 m.
6 Poage and Chamberlain (2001)
Review of 68 studies on isotopic elevation effect.
World wide Global mean: -0.28 ‰/100 m; Less effect in tropical area: -0.12 to -0.20 ‰/100 m; Higher effect in extreme conditions: -0.62 to -1.83 ‰/100m.
7 Deshpande et al. (2003)
Study of groundwater isotopic composition.
South India Possible elevation effect of -0.4 ‰/100 m.
8 Scholl et al. (2009) Orographic rainfall and amount effects.
Puerto Rico Isotopic elevation effect of -0.12 ‰/100 m.
9 Windhorst et al. (2013)
Effect of elevation and weather condition on event based precipitation.
Ecuador Isotopic elevation effect of -0.22 ‰/100 m for elevation range of 1800 – 2800 m asl.
10 Resmi et al. (2016) Precipitation in Pamba river basin. Kerala, India Isotopic elevation effect of -0.1 ‰/100 m. 11 Edirisinghe et al.
(2017) Precipitation over northeast and central Sri Lanka.
Sri Lanka Isotopic elevation effect of -0.6 ‰/100 m.
12 This study Orographic upliftment effect on isotope ratios of groundwater and spring water.
South India Isotopic elevation effect of: -0.09 ‰/100m, below 2050 m asl; -1.5 to -2.5 ‰/100m, beyond 2000 m asl; Mean value of -0.30 ‰/100m (0 - 2500 m asl).

6
Table 4: Multiple Linear Regression results as obtained from the Past program version 3.15. The dependent variable was oxygen isotope ratio (δ18O) and the
independent variables were the elevation above mean sea level (elevation effect), the distance from the coast (Rayleigh distillation and continental effect) and
the annual rainfall amount (amount effect).
___________________________________________________________________________ Number of point Variable F R2 p Significance ___________________________________________________________________________ 51 (all) isotope values 35.91 0.70 <0.0001 yes elevation 0.68 0.0002 yes continental 0.56 0.18 no amount 0.40 0.39 no 42 (below 2050 m) isotope values 10.61 0.46 <0.0001 yes elevation 0.41 0.96 no continental 0.45 0.11 no amount 0.12 0.62 no 9 (over 2050 m) isotopes values 17.33 0.96 0.004 yes elevation 0.77 0.08 yes continental 0.36 0.21 no amount 0.81 0.04 yes ____________________________________________________________________