A conductive polypyrrole based ammonium ion selective electrode
Upload
universitatdevicCategory
view
0download
0
BGD6, 11479–11499, 2009
Variability inmountain lake water
N isotopes
M. Bartrons et al.
Title Page
Abstract Introduction
Conclusions References
Tables Figures
J I
J I
Back Close
Full Screen / Esc
Printer-friendly Version
Interactive Discussion
Biogeosciences Discuss., 6, 11479–11499, 2009www.biogeosciences-discuss.net/6/11479/2009/© Author(s) 2009. This work is distributed underthe Creative Commons Attribution 3.0 License.
BiogeosciencesDiscussions
This discussion paper is/has been under review for the journal Biogeosciences (BG).Please refer to the corresponding final paper in BG if available.
Nitrogen stable isotopes of ammoniumand nitrate in high mountain lakes of thePyreneesM. Bartrons, L. Camarero, and J. Catalan
Limnology Unit (CSIC-UB), Centre for Advanced Studies of Blanes (CEAB-CSIC), Acces CalaSt. Francesc, 14, Blanes, 17300, Spain
Received: 20 November 2009 – Accepted: 25 November 2009 – Published: 11 December2009
Correspondence to: M. Bartrons ([email protected])
Published by Copernicus Publications on behalf of the European Geosciences Union.
11479

BGD6, 11479–11499, 2009
Variability inmountain lake water
N isotopes
M. Bartrons et al.
Title Page
Abstract Introduction
Conclusions References
Tables Figures
J I
J I
Back Close
Full Screen / Esc
Printer-friendly Version
Interactive Discussion
Abstract
Nitrogen stable isotopes (δ15N) are increasingly used to trace food web relationshipsand the flow of matter in lakes. However, there is high variability in δ15N among primaryproducers and other primary energy resources that can eventually propagate through-out the lake food web. To increase our understanding of the origin of this variability, we5
measured ammonium and nitrate δ15N in atmospheric deposition (AD), epilimnetic wa-ter (EW), deep chlorophyll maximum water (DCMW), and sediment porewater (SPW) ineight mountain lakes. A general δ15N (−3.4‰) for AD was estimated as the signaturefor AD ammonium and nitrate did not differ. All lakes showed similar high δ15N-NH+
4values for SPW (ca. 2.2‰). In contrast, the variability among lakes in water column10
values was high, although differences between EW and DCMW within a lake were low.δ15N-NO−
3 correlated with the altitude of the lakes, and its variability was interpreted
as the influence of catchment nitrification, which is higher in talus landscapes. δ15N-NH+
4 distribution had two modes, positive values (ca. 3‰) were associated to DCMWof shallow lakes, and probably reflect the SPW influence. Lower values (ca. −3‰) oc-15
cur in EW and DCMW of deep lakes, and its variability was related to the degree thatNO−
3 was up taken by primary producers and recycled within the food-web when NH+4
availability was low compared to demand. Overall, altitude, lake depth and seasonalcumulative primary production largely explain the patterns of δ15N variability observedin nitrogen dissolved compounds.20
1 Introduction
Stable isotopes of nitrogen are increasingly used to trace food web relationships andthe flow of matter in aquatic ecosystems (Fry, 2006). Beyond discussions of the frac-tionation values at each trophic level, a key aspect that is still a source of major uncer-tainty is the understanding of the variability in primary producers (Vander Zanden and25
Rasmussen, 1999). Occasionally, this variability can be so high locally that researchers
11480

BGD6, 11479–11499, 2009
Variability inmountain lake water
N isotopes
M. Bartrons et al.
Title Page
Abstract Introduction
Conclusions References
Tables Figures
J I
J I
Back Close
Full Screen / Esc
Printer-friendly Version
Interactive Discussion
prefer to use primary consumers as the trophic level for reference (Post, 2000). Much ofthe variability of the nitrogen stable isotope ratio in primary producers comes from thespecific source of nitrogen used and the biogeochemical pathways behind it. Ammo-nium and nitrate are the predominant inorganic nitrogen forms in natural waters. Theyare the main nitrogen sources for algal and bacterial growth and, consequently, for the5
food web as a whole. In this study, we examine the patterns of variability of the nitrogenstable isotope ratio of dissolved ammonium (δ15N-NH+
4 ) and nitrate (δ15N-NO−3 ) in high
mountain lakes.Atmospheric deposition is the dominant source of N compounds in most high moun-
tain catchments (Wookey et al., 2009). Although nitrate and ammonium are deposited10
in similar proportions (Camarero and Catalan, 1996), nitrate is the major N form thatenters lakes from catchments (Hood et al., 2003). Indeed, ammonium is either highlyretained in the catchment, by biological assimilation and sorption in mineral soil hori-zons, or transformed into nitrate by bacterial nitrification (Campbell et al., 2000). Withinthe lake, ammonium is abundant in the sediment porewater, due to organic matter min-15
eralization, and diffuses to overlying water. NH+4 is also excreted by organisms living
in the lake as a by-product of their metabolic activity. In general, NH+4 is preferred
over NO−3 as the N source by primary producers, as it does not require internal reduc-
tion (Falkowski, 1983). However, it is advantageous to use NO−3 when NH+
4 is scarce
(ca. <1µmol L−1; McCarthy (1980)). NO−3 and NH+
4 can also be resources or products20
in several bacteria-mediated biogeochemical pathways.Any reactive or diffusive process where NO−
3 and NH+4 are involved can provide N
isotopic fractionation, e.g., nitrification (Mariotti et al., 1981), denitrification (Choi etal., 2001), N uptake by osmotrophs (Hogberg, 1997), ammonia volatilization (Hog-berg 1997), organic matter mineralization (Lehmann et al., 2002), atmospheric N2 fix-25
ation (Shearer and Kohl, 1986), assimilation (Wada and Hattori, 1978; Doi et al., 2004)and diffusive processes between compartments (e.g., sediment-water (Owens, 1987)).However, not all the potential processes are equally relevant in a specific ecosystemas sources of variability in nitrogen stable isotope ratios. On the one hand, some
11481

BGD6, 11479–11499, 2009
Variability inmountain lake water
N isotopes
M. Bartrons et al.
Title Page
Abstract Introduction
Conclusions References
Tables Figures
J I
J I
Back Close
Full Screen / Esc
Printer-friendly Version
Interactive Discussion
processes require particular environmental conditions, for instance, concerning oxy-gen or light conditions. On the other hand, fractionation generally occurs if there is alarge pool of substrate and the amount actually used in the process is small comparedto the pool size (Hoch et al., 1992; York et al., 2007).
In mountain lakes there are two main large pools of nitrogen that can supply the wa-5
ter column, namely, soil catchment and sediment pools. They have contrasting char-acteristics. Supply from the catchment is mostly in nitrate form (Campbell et al., 2002),which originates directly from deposition or from catchment nitrification of ammonium.Talus landscapes show higher nitrification and mineralization rates (Campbell et al.,2000), and eventually higher nitrate loadings to the lakes, than flatter and more vege-10
tated areas which retain more nitrogen from deposition. In contrast, sediments are richin ammonium from recycled organic matter. Nitrogen stable isotope ratios in the watercolumn (δ15N-NO−
3 and δ15N-NH+4 ) largely depend on the relative importance of the
contribution of these two large pools and the characteristics of their use and recyclingwithin the water column.15
High mountain lakes are essentially oligotrophic ecosystems. Variability in catch-ment characteristics mostly depend on the altitudinal position (Korner, 2007), whichalso has a large influence on lake thermal characteristics (Catalan et al., 2009b). Lakearea or depth, which are highly correlated between them in these systems (Catalan etal., 2009b), provide an additional source of variability in lake dynamics. However, while20
lake changes in altitude are relatively gradual, depth mostly divides lakes into two typesof contrasting characteristics (Catalan et al., 2009a): deep lakes (ca. >15 m depth) arecharacterised by a large volume hypolimnion with a zone where processes of mineral-isation of organic matter permanently predominate over photosynthetic ones; whereasshallow lakes (ca. <15 m depth), show a relatively small hypolimnion, highly affected25
by metalimnetic and boundary layer transport, and mostly phototrophic because of thehigh transparency of the water in these lakes (Buchaca and Catalan, 2008). Therefore,to investigate the variability in δ15N-NO−
3 and δ15N-NH+4 , we selected an altitudinal
gradient of lakes including deep and shallow types. For each lake we measured the
11482

BGD6, 11479–11499, 2009
Variability inmountain lake water
N isotopes
M. Bartrons et al.
Title Page
Abstract Introduction
Conclusions References
Tables Figures
J I
J I
Back Close
Full Screen / Esc
Printer-friendly Version
Interactive Discussion
NO−3 and NH+
4 concentrations and their nitrogen isotopic ratio in three compartmentsduring stratification, namely, epilimnetic water (EW), deep chlorophyll maximum wa-ter (DCMW), which typically occurs in the hypolimnion in these lakes, and sedimentporewater (SPW). In addition, we also measured the isotopic composition of both com-pounds in atmospheric deposition. The aims of our study were:5
1. to assess how the two main phototrophic areas in these lakes (i.e., EW, DCMW)differentiate in δ15N-NO−
3 and δ15N-NH+4 depending on the lake position in the
altitudinal gradient, and lake size; and
2. to what extent in each case it may depend on catchment (mostly NO−3 ) and sedi-
ment loadings (mostly NH+4 ), and water column processes.10
2 Materials and methods
2.1 Study sites
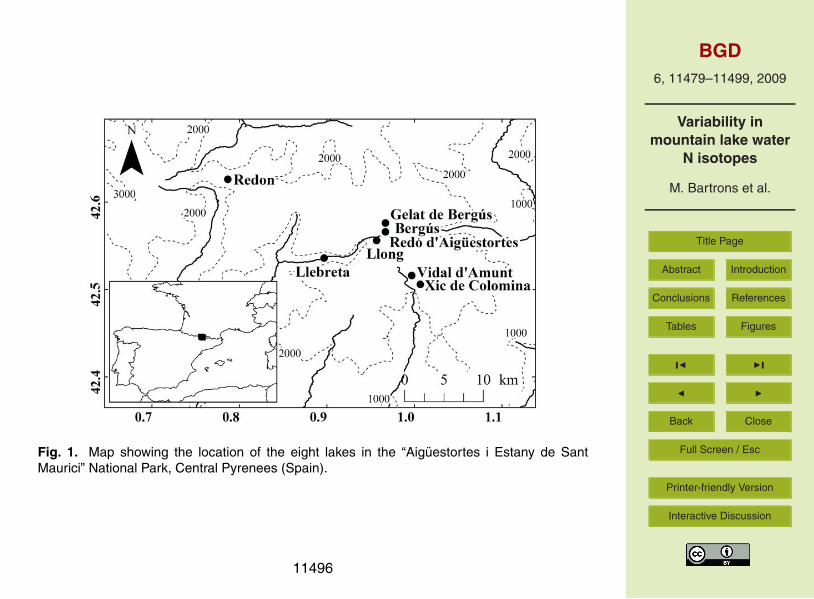
The lakes are located in three catchments within an area of less than 15 km radius. Allbasins are on granodioritic bedrock of the Maladeta batholith in the Central Pyrenees(NE Spain) (Fig. 1). The eight lakes cover an altitudinal gradient of 1068 m (Table 1).15
This gradient reflects a shift in land-cover type from bare rock and thin and poor soilsin high altitude areas to extensive vegetation and well-developed soils at lower sites.The tree line is at ca. 2200 m a.s.l. Other general physical and chemical characteristicsof the lakes are relatively similar (Table 1), with the exception of depth. The lakesare dimictic, covered by ice for 5 to 8 months a year, oligotrophic, and with low ionic20
content and acid-buffering capacity. After the snow and ice cover melting, deep watercolumn mixes and ammonium and nitrate concentrations homogenise throughout thewater column (Catalan, 1992). As soon as lake water reaches 4◦C, the water columnstratifies and phytoplankton blooms. During summer stratification, the photic zone isdeeper than the thermocline. Light penetration is high and the Secchi disk depth may25
reach up to 20 m in the deep lakes and usually reaches the bottom in shallow lakes.11483

BGD6, 11479–11499, 2009
Variability inmountain lake water
N isotopes
M. Bartrons et al.
Title Page
Abstract Introduction
Conclusions References
Tables Figures
J I
J I
Back Close
Full Screen / Esc
Printer-friendly Version
Interactive Discussion
Deep chlorophyll maximum develops at about 1.5 times the Secchi disk depth or justa few centimetres above the bottom in shallow lakes (Catalan et al., 2002). We useddissolved reactive silica (DRSi) as a proxy for water column productivity during earlysummer, as it is a primary nutrient for diatoms, we assumed that the lower DRSi thehigher the seasonally accumulated primary productivity (Catalan et al., 2002).5
2.2 Sampling
Deposition sampling was carried out fortnightly from 1 June to 25 August 2006. Sam-ples were collected at 2240 m a.s.l., which corresponds to the centre of the lake alti-tudinal distribution. Deposition at this point was considered representative, due to thepreviously observed lack of significant differences in the chemistry of bulk precipitation10
within the altitudinal range in this area (Camarero and Catalan, 1996). Water samplesfor δ15N-NO−
3 analysis were field-filtered (pre-ashed Whatman GF/F, 0.7µm pore size)into clean polypropylene hermetic bottles and refrigerated (−20◦C) until analysis, fol-lowing Spoelstra et al. (2004). With this method, Spoelstra et al. (2004) found no de-tectable nitrate production or assimilation in the samples during a two-week incubation15
period, and, that atmospheric nitrate isotopic ratios were preserved.Lakes were surveyed during the first week of August 2004. Within each lake, EW,
DCMW and SPW were sampled for NO−3 , NH+
4 , δ15N-NO−3 and δ15N-NH+
4 analyses.EW was sampled at 1 m depth, DCMW at 1.5 times the Secchi disk depth or, alter-natively, from 1 m above the bottom when the Secchi disk was still visible at the lake20
bottom. These two water column samples were collected by means of a Ruttner bottleand treated in the same way as described for deposition samples. SPW was sampledusing a gravity core. Immediately, the first five centimetres were extruded and storedin a polypropylene hermetic bag without air. This bag was transported cold to thelab where it was frozen. SPW was finally obtained after defrosting by high-pressure25
squeezing-filtration with Whatman GF/F 0.7µm pore size. NO−3 concentrations in SPW
were very low. As a result, SPW NO−3 isotopic composition could not be determined as
it would have required about 4 L of porewater.11484

BGD6, 11479–11499, 2009
Variability inmountain lake water
N isotopes
M. Bartrons et al.
Title Page
Abstract Introduction
Conclusions References
Tables Figures
J I
J I
Back Close
Full Screen / Esc
Printer-friendly Version
Interactive Discussion
2.3 Chemistry analysis
NH+4 was determined according to Solorzano (1969). NO−
3 was determined using aWaters Quanta 4000 Capillary Electrophoresis system. pH was measured with anOrion Research model 720 A pHmeter, with a low ionic strength filling solution in thepH electrode (KCl1M). Sediment loss on ignition (LOI) was carried out at 550◦C, as5
an estimation of the organic content of the sediment samples (Heiri et al., 2001). Acidneutralising capacity (ANC) was determined by Gran titration. Conductivity was de-termined with an Instran-10 conductimeter. Dissolved inorganic carbon (DIC) was de-termined on a Shimadzu TOC-5000 analyzer by IR absorption. Total phosphorus wasdetermined according to the Malachite green method, with previous acid persulphate10
digestion (Camarero, 1994). Dissolved reactive silica (DRSi) was determined with theblue silicon-molybdenum method (Grasshoff et al., 1983).
Stable isotopic ratios of NH+4 and NO−
3 were determined by the alkaline headspacediffusion methods of Holmes et al. (1998) and Sigman et al. (1997), respectively. Forthe δ15N of NH+
4 , magnesium oxide (MgO) was added to increase the pH and to con-15
vert NH+4 to NH3. A filter pack consisting of an acidified (KHSO4 2.5 M) glass fibre filter
sandwiched between two Teflon filters was placed in each sample bottle in the field.Back in the lab, the samples were incubated on a shaker table at 40◦C for 14 days,to promote diffusion of NH3 towards the filter pack. To determine the δ15N of NO−
3 ,samples were initially boiled, with MgO added, and vaporised up to 100 mL to con-20
centrate and drive off NH+4 as NH3. Thereafter, Devarda’s alloy was added to sam-
ples, which were placed in an oven at 60◦C for 48 h to reduce NO−3 to NH+
4 . The rest
of the δ15N-NO−3 procedure continued as for the δ15N-NH+
4 procedure. Filter packsfrom these analyses were analysed for the nitrogen isotopic ratio on a Europa Integramass spectrometer (Sercon) at the University of California Davis Stable Isotope Facil-25
ity. During analysis, samples were interspersed with several replicates of at least twodifferent laboratory standards. These laboratory standards, which were selected to becompositionally similar to the samples being analysed, had been previously calibrated
11485

BGD6, 11479–11499, 2009
Variability inmountain lake water
N isotopes
M. Bartrons et al.
Title Page
Abstract Introduction
Conclusions References
Tables Figures
J I
J I
Back Close
Full Screen / Esc
Printer-friendly Version
Interactive Discussion
against NIST Standard Reference Materials (IAEA-N1, IAEA-N2, IAEA-N3 and IAEA-CH7) (Gonfiantini, 1978). A sample’s preliminary isotope ratio was measured relativeto reference gases analysed with each sample. These preliminary values were fi-nalised by adjusting the values for the entire batch based on the known values of theincluded laboratory standards. The precision of replicate analyses of standards was5
0.2%. Corrections to isotope values were calculated according to Holmes et al. (1998)and Sigman et al. (1997). Standards were analysed concurrently, with every set ofsamples analysed for NO−
3 and NH+4δ
15N. They were prepared by adding an ammo-nium stock solution of known isotopic composition to the same bottles to achieve anammonium concentration similar to that expected. We used deviations between the10
known concentration and isotopic composition of the standards and the values ob-tained after the procedure to correct the sample results. δ15N-NO−
3 values were alsocorrected for any N added due to Devarda’s alloy contamination (Devarda’s blanks), asdescribed in Sigman et al. (1997). Deviations due to the different bottle volumes usedduring the analysis were also corrected according to Holmes et al. (1998).15
3 Results
3.1 General patterns
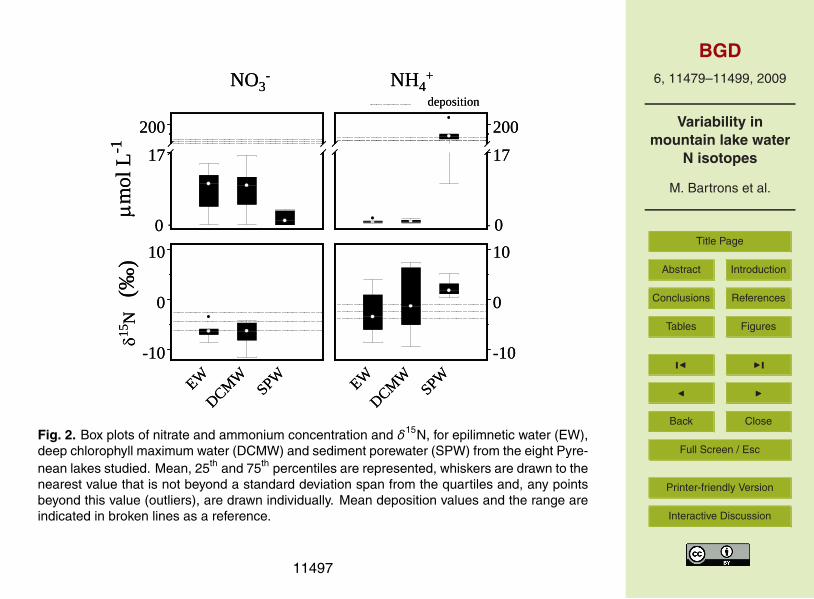
There were very distinctive patterns in NO−3 and NH+
4 concentrations and stable isotoperatios among the compartments studied (Fig. 2). The largest concentrations were foundin deposition and porewater, but stable isotope ratios were contrasting between them.20
NO−3 and NH+
4 concentrations in atmospheric deposition were 40±17µmol L−1 and
47±29µmol L−1, respectively, differences between them being not significant (t=−0.6,df=10, p-value>0.5), which was also the case for δ15N-NO−
3 and δ15N-NH+4 (t=0.6,
df=10, p-value>0.5). Therefore, a tentative weighted average value of −3.43±1.13‰was estimated for atmospheric δ15N in the area. SPW NH+
4 concentrations were re-25
markably high, 98±72µmol L−1, whereas SPW NO−3 was below 1µmol L−1 in four
11486
BGD6, 11479–11499, 2009
Variability inmountain lake water
N isotopes
M. Bartrons et al.
Title Page
Abstract Introduction
Conclusions References
Tables Figures
J I
J I
Back Close
Full Screen / Esc
Printer-friendly Version
Interactive Discussion
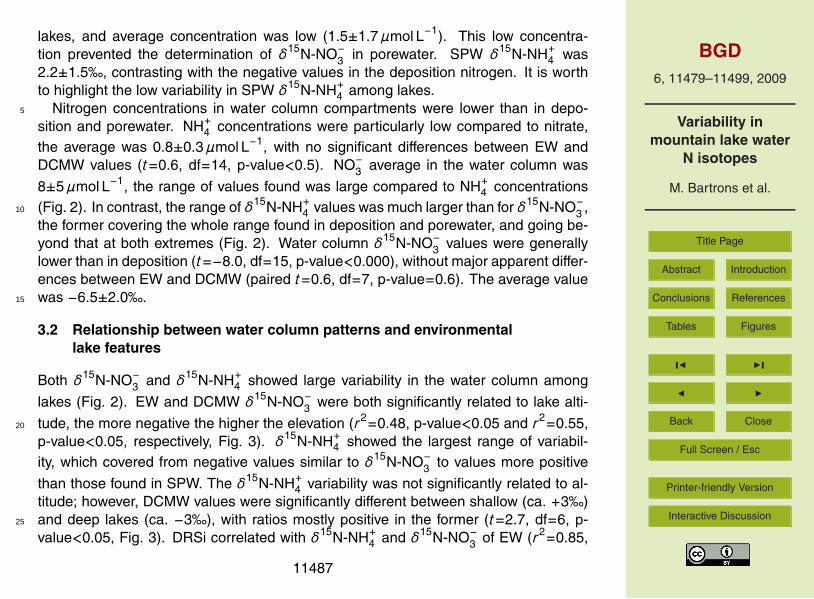
lakes, and average concentration was low (1.5±1.7µmol L−1). This low concentra-tion prevented the determination of δ15N-NO−
3 in porewater. SPW δ15N-NH+4 was
2.2±1.5‰, contrasting with the negative values in the deposition nitrogen. It is worthto highlight the low variability in SPW δ15N-NH+
4 among lakes.Nitrogen concentrations in water column compartments were lower than in depo-5
sition and porewater. NH+4 concentrations were particularly low compared to nitrate,
the average was 0.8±0.3µmol L−1, with no significant differences between EW andDCMW values (t=0.6, df=14, p-value<0.5). NO−
3 average in the water column was
8±5µmol L−1, the range of values found was large compared to NH+4 concentrations
(Fig. 2). In contrast, the range of δ15N-NH+4 values was much larger than for δ15N-NO−
3 ,10
the former covering the whole range found in deposition and porewater, and going be-yond that at both extremes (Fig. 2). Water column δ15N-NO−
3 values were generallylower than in deposition (t=−8.0, df=15, p-value<0.000), without major apparent differ-ences between EW and DCMW (paired t=0.6, df=7, p-value=0.6). The average valuewas −6.5±2.0‰.15
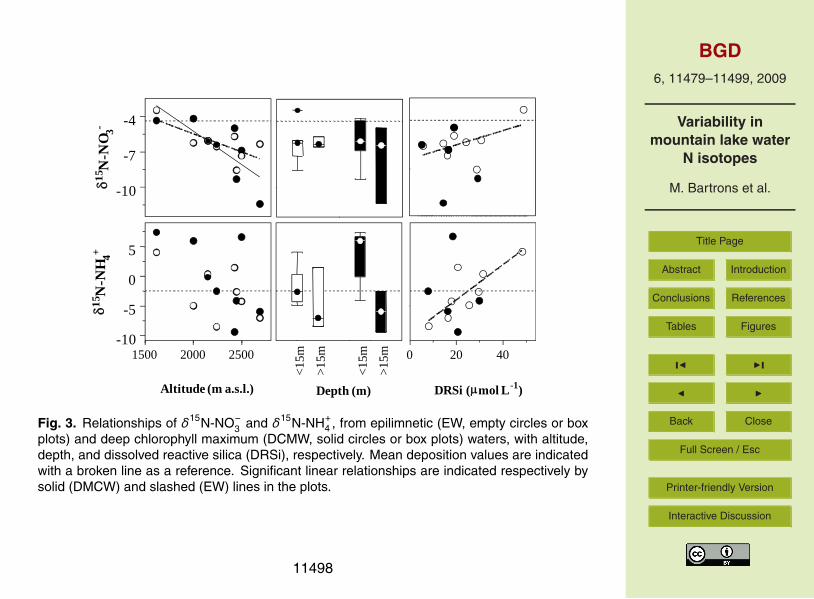
3.2 Relationship between water column patterns and environmentallake features
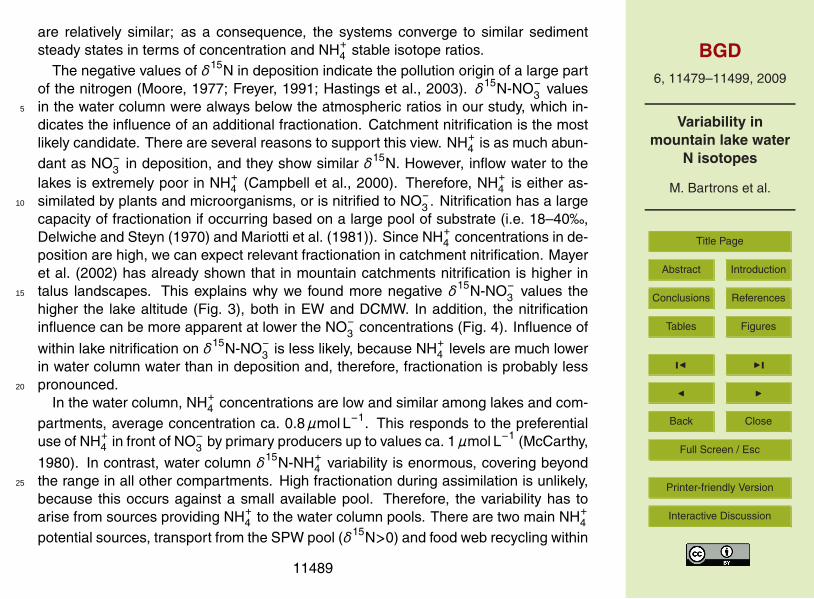
Both δ15N-NO−3 and δ15N-NH+
4 showed large variability in the water column among
lakes (Fig. 2). EW and DCMW δ15N-NO−3 were both significantly related to lake alti-
tude, the more negative the higher the elevation (r2=0.48, p-value<0.05 and r2=0.55,20
p-value<0.05, respectively, Fig. 3). δ15N-NH+4 showed the largest range of variabil-
ity, which covered from negative values similar to δ15N-NO−3 to values more positive
than those found in SPW. The δ15N-NH+4 variability was not significantly related to al-
titude; however, DCMW values were significantly different between shallow (ca. +3‰)and deep lakes (ca. −3‰), with ratios mostly positive in the former (t=2.7, df=6, p-25
value<0.05, Fig. 3). DRSi correlated with δ15N-NH+4 and δ15N-NO−
3 of EW (r2=0.85,
11487

BGD6, 11479–11499, 2009
Variability inmountain lake water
N isotopes
M. Bartrons et al.
Title Page
Abstract Introduction
Conclusions References
Tables Figures
J I
J I
Back Close
Full Screen / Esc
Printer-friendly Version
Interactive Discussion
p-value<0.001 and r2=0.56, p-value<0.05, respectively) but not with DCMW ratios(Fig. 3).
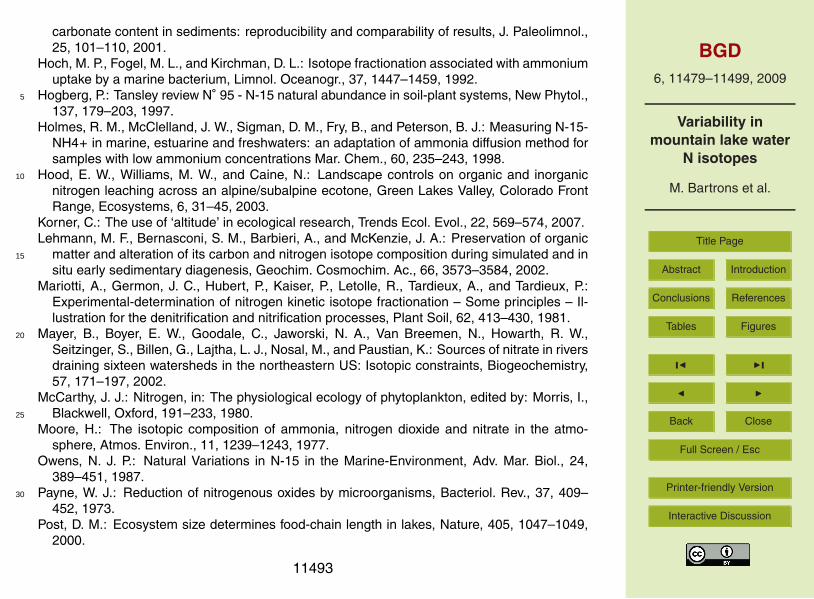
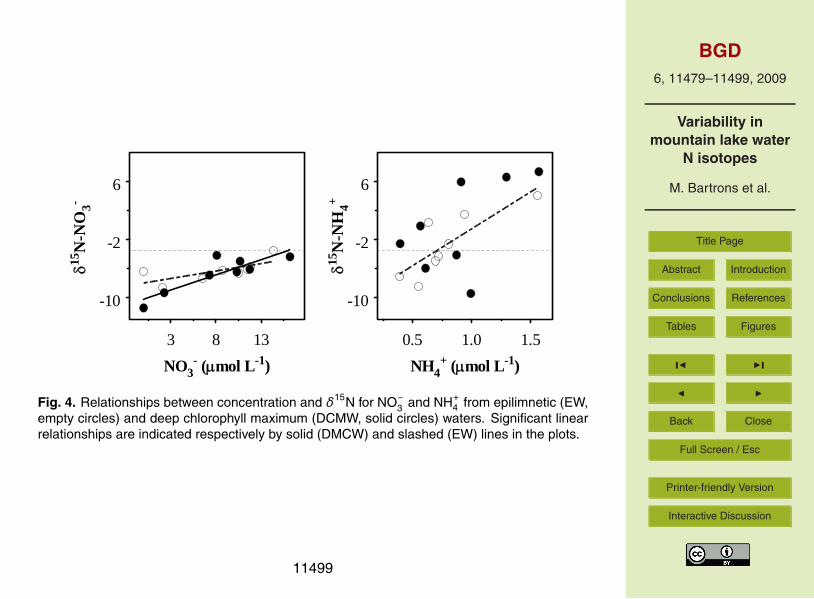
The stable isotope ratios were not fully independent of the compound concentrations(Fig. 4). For NO−
3 , ratio and concentration were correlated for both EW and DCMW
(r2=0.50, p-value<0.05 and r2=0.75, p-value<0.05, respectively). In the case of NH+45
only EW correlated (r2=0.68, p-value<0.05).
4 Conclusions
In high mountain lakes there are two large pools potentially supplying nitrogen to thewater column: catchment soils through runoff, and sediments through diffusion andseasonal mixing. Catchment nitrogen loading is mostly in form of NO−
3 (Hood et al.,10
2003), whereas internal loading from sediments is mostly NH+4 . Interestingly, these
two main nitrogen sources show contrasting δ15N values and, as a consequence, theirinfluence on the lake water column nitrogen pool can be traced. From our results, itis remarkable the scarce variability of NH+
4 sediment porewater among lakes, both interms of concentration and δ15N, despite the large changes in catchment characteris-15
tics (i.e., altitudinal gradient) and lake size. The SPW constancy contrasts with the highvariability in the water column values. This fact suggests a powerful buffering mecha-nism within the nitrogen cycling from the water column to sediments and back to watercolumn. Preferential use of NH+
4 by primary producers could be a candidate mecha-nism; however, δ15N-NH+
4 variability in the water column is extremely large (Fig. 2).20
Therefore, the SPW convergence among lakes has to occur during the process oforganic matter mineralisation in the sediments and subsequent NH+
4 diffusion to thewater column. Because diffusion is slow, mineralization builds up high NH+
4 concen-trations in SPW, and thus fractionation during the diffusive process tends to be high.Lake primary productivity, oxygen conditions and bottom temperature in these lakes25
11488
BGD6, 11479–11499, 2009
Variability inmountain lake water
N isotopes
M. Bartrons et al.
Title Page
Abstract Introduction
Conclusions References
Tables Figures
J I
J I
Back Close
Full Screen / Esc
Printer-friendly Version
Interactive Discussion
are relatively similar; as a consequence, the systems converge to similar sedimentsteady states in terms of concentration and NH+
4 stable isotope ratios.The negative values of δ15N in deposition indicate the pollution origin of a large part
of the nitrogen (Moore, 1977; Freyer, 1991; Hastings et al., 2003). δ15N-NO−3 values
in the water column were always below the atmospheric ratios in our study, which in-5
dicates the influence of an additional fractionation. Catchment nitrification is the mostlikely candidate. There are several reasons to support this view. NH+
4 is as much abun-dant as NO−
3 in deposition, and they show similar δ15N. However, inflow water to thelakes is extremely poor in NH+
4 (Campbell et al., 2000). Therefore, NH+4 is either as-
similated by plants and microorganisms, or is nitrified to NO−3 . Nitrification has a large10
capacity of fractionation if occurring based on a large pool of substrate (i.e. 18–40‰,Delwiche and Steyn (1970) and Mariotti et al. (1981)). Since NH+
4 concentrations in de-position are high, we can expect relevant fractionation in catchment nitrification. Mayeret al. (2002) has already shown that in mountain catchments nitrification is higher intalus landscapes. This explains why we found more negative δ15N-NO−
3 values the15
higher the lake altitude (Fig. 3), both in EW and DCMW. In addition, the nitrificationinfluence can be more apparent at lower the NO−
3 concentrations (Fig. 4). Influence of
within lake nitrification on δ15N-NO−3 is less likely, because NH+
4 levels are much lowerin water column water than in deposition and, therefore, fractionation is probably lesspronounced.20
In the water column, NH+4 concentrations are low and similar among lakes and com-
partments, average concentration ca. 0.8µmol L−1. This responds to the preferentialuse of NH+
4 in front of NO−3 by primary producers up to values ca. 1µmol L−1 (McCarthy,
1980). In contrast, water column δ15N-NH+4 variability is enormous, covering beyond
the range in all other compartments. High fractionation during assimilation is unlikely,25
because this occurs against a small available pool. Therefore, the variability has toarise from sources providing NH+
4 to the water column pools. There are two main NH+4
potential sources, transport from the SPW pool (δ15N>0) and food web recycling within
11489

BGD6, 11479–11499, 2009
Variability inmountain lake water
N isotopes
M. Bartrons et al.
Title Page
Abstract Introduction
Conclusions References
Tables Figures
J I
J I
Back Close
Full Screen / Esc
Printer-friendly Version
Interactive Discussion
the water column (δ15N<0, if NO−3 is the main N source for primary producers). Lake
external sources are only relevant during thawing, and are quickly depleted (Catalan,1992).
The significantly higher δ15N-NH+4 values in DCMW of shallow lakes (<15 m depth)
agree with an internal supply from the sediments. Hypolimnion characteristics, where5
DCMW occur, with a relatively small volume and high influence of transport linked toturbulent mixing in boundary layers and internal wave fields, favour a higher relativeinfluence of NH+
4 pool in shallow lake DCMW and thus significantly higher δ15N-NH+4
values respect DCMW in deep lakes and EW of any lake.Influence of N food web recycling on water column δ15N-NH+
4 would be more rele-10
vant the higher the contribution of NO−3 to primary producer nitrogen assimilation, for
two reasons. First, because δ15N values of NO−3 uptaken are usually much lower than
those of NH+4 (Fig. 2). Second, because during organism excretation there is fractiona-
tion that enhances the shift towards more δ15N negatives values. Low NH+4 availability
in EW or DCMW will make the use of alternative NO−3 source (δ15N<0) more likely15
and, as a result, there is a correspondence between low NH+4 concentration values
and negative δ15N-NH+4 (Fig. 4). This might be ultimately related to factors driving pri-
mary production that were not considered in this study. However, correlation betweenlow silicate, as a proxy of seasonal cumulative production, and δ15N-NH+
4 points to-wards the same interpretation. The higher the productivity, the higher the relative use20
of NO−3 compared to NH+
4 and thus eventual low δ15N-NH+4 values in the excretion.
Certainly, there are many other processes taking place in the nitrogen cycle of highmountain lakes than here discussed (Robinson, 2001). However, if we apply the prin-ciple that high fractionation requires a large pool of substrate, the processes here de-pictured, and the environmental factors affecting them, appear as the most relevant.25
For instance, the influence of denitrification in sediments (Payne, 1973) probably hasirrelevant consequences for δ15N-NO−
3 values in the water column, as the remainingsediment NO−
3 concentrations are extremely low. In summary, variability in nitrogen
11490

BGD6, 11479–11499, 2009
Variability inmountain lake water
N isotopes
M. Bartrons et al.
Title Page
Abstract Introduction
Conclusions References
Tables Figures
J I
J I
Back Close
Full Screen / Esc
Printer-friendly Version
Interactive Discussion
stable isotopes of dissolved ammonium and nitrate in high mountain lakes mostly re-spond to factors determining the relative influence of three components:
1. the nitrate loading from the catchment with a negative δ15N, due to the startingatmospheric deposition values and the added nitrification influence;
2. the ammonium loading from the sediments with a positive δ15N, due to organic5
matter mineralization and slow diffusion from porewater to water column; and
3. the relative influence of NO−3 uptake and organism NH+
4 excretion in the withinwater column nitrogen cycling.
Acknowledgements. This study was supported by the EU project Euro-limpacs (GOCE-CT-2003-505540) and the Spanish Government project Graccie (CSD2007-00067). We are grate-10
ful for technical advice from E. Martı, D. von Schiller and M. Ribot and for the field assistance ofM. Bacardit, E. O. Casamayor, J. C. Auguet, A. Hervas and J. Arola. One of the authors, M. B.,thanks the Ministerio de Educacion y Ciencia for an FPU grant.
References
Buchaca, T. and Catalan, J.: On the contribution of phytoplankton and benthic biofilms to the15
sediment record of marker pigments in high mountain lakes, J. Paleolimnol., 40, 369–383,2008.
Camarero, L.: Assay of soluble reactive phosphorus at nanomolar levels in nonsaline waters,Limnol. Oceanogr., 39(5), 707–711, 1994.
Camarero, L. and Catalan, J.: Variability in the chemistry of precipitation in the Pyrenees (north-20
eastern Spain): Dominance of storm origin and lack of altitude influence, J. Geophys. Res.,101, 29491–29498, 1996.
Campbell, D. H., Baron, J. S., Tonnessen, K. A., Brooks, P. D., and Schuster, P. F.: Controlson nitrogen flux in alpine/subalpine watersheds of Colorado, Water Resour. Res., 36, 37–47,2000.25
Campbell, D. H., Kendall, C., Chang, C. C. Y., Silva, S. R., and Tonnessen, K. A.: Pathways fornitrate release from an alpine watershed: Determination using delta N-15 and delta O-18,Water Resour. Res., 38(5), 1052–1060, 2002.
11491

BGD6, 11479–11499, 2009
Variability inmountain lake water
N isotopes
M. Bartrons et al.
Title Page
Abstract Introduction
Conclusions References
Tables Figures
J I
J I
Back Close
Full Screen / Esc
Printer-friendly Version
Interactive Discussion
Catalan, J.: Evolution of dissolved and particulate matter during the ice-covered period in adeep, high-mountain lake, Can. J. Fish. Aquat. Sci., 49, 945–955, 1992.
Catalan, J., Ventura, M., Brancelj, A., Granados, I., Thies, H., Nickus, U., Korhola, A., Lotter,A. F., Barbieri, A., Stuchlik, E., Lien, L., Bitusık, P., Buchaca, T., Camarero, L., Goudsmit, G.H., Kopacek, J., Lemcke, G., Livingstone, D. M., Muller, B., Rautio, M., Sisko, M., Sorvari, S.,5
Sporka, F., Strunecky, O., and Toro, M.: Seasonal ecosystem variability in remote mountainlakes: implications for detecting climatic signals in sediment records, J. Paleolimnol., 28,25–46, 2002.
Catalan, J., Barbieri, M. G., Bartumeus, F., Bitusık, P., Botev, I., Brancelj, A., Cogalniceanu, D.,Manca, M., Marchetto, A., Ognjanova-Rumenova, N., Pla, S., Rieradevall, M., Sorvari, S.,10
Stefkova, E., Stuchlik, E., and Ventura, M.: Ecological thresholds in European alpine lakes,Freshwater Biol., 54, 2494–2517, 2009a.
Catalan, J., Curtis, C. J., and Kernan, M.: Remote European mountain lake ecosystems: re-gionalisation and ecological status, Freshwater Biol., 54(4), 2419–2432, 2009b.
Choi, W. J., Lee, S. M., and Yoo, S. H.: Increase in δ15N of nitrate through kinetic isotope15
fractionation associated with denitrification in soil, Agricultural Chemistry and Biotechnology,44, 135–139, 2001.
Delwiche, C. C. and Steyn, P. L.: Nitrogen isotope fractionation in soils and microbial reactions,Environ. Sci. Technol., 4, 929–935, 1970.
Doi, H., Kikuchi, E., Shikano, S., and Takagi, S.: A study of the nitrogen stable isotope dynamics20
of phytoplankton in a simple natural ecosystem, Aquat. Microb. Ecol., 36, 285–291, 2004.Falkowski, P. G.: Enzymology of nitrogen assimilation, in: Nitrogen in the marine environment,
edited by: Carpenter, E. J., and Capone, D. C., Academic Press, New York, 839–868, 1983.Freyer, H. D.: Seasonal-variation of N-15-N-14 ratios in atmospheric nitrate species, Tellus B,
43, 30–44, 1991.25
Fry, B.: Stable isotope ecology, Springer, 1–308, 2006.Gonfiantini, R.: Standards for stable isotope measurements in natural compounds, Nature, 271,
534–536, 1978.Grasshoff, K., Ehrhardt, M., and Kremling, K.: Methods of seawater analysis, 2nd Edn.,
Chemie, Weinheim, 419 pp., 1983.30
Hastings, M. G., Sigman, D. M., and Lipschultz, F.: Isotopic evidence for source changes ofnitrate in rain at Bermuda, J. Geophys. Res., 108, 4790–4801, 2003.
Heiri, O., Lotter, A. F., and Lemcke, G.: Loss on ignition as a method for estimating organic and
11492
BGD6, 11479–11499, 2009
Variability inmountain lake water
N isotopes
M. Bartrons et al.
Title Page
Abstract Introduction
Conclusions References
Tables Figures
J I
J I
Back Close
Full Screen / Esc
Printer-friendly Version
Interactive Discussion
carbonate content in sediments: reproducibility and comparability of results, J. Paleolimnol.,25, 101–110, 2001.
Hoch, M. P., Fogel, M. L., and Kirchman, D. L.: Isotope fractionation associated with ammoniumuptake by a marine bacterium, Limnol. Oceanogr., 37, 1447–1459, 1992.
Hogberg, P.: Tansley review N◦ 95 - N-15 natural abundance in soil-plant systems, New Phytol.,5
137, 179–203, 1997.Holmes, R. M., McClelland, J. W., Sigman, D. M., Fry, B., and Peterson, B. J.: Measuring N-15-
NH4+ in marine, estuarine and freshwaters: an adaptation of ammonia diffusion method forsamples with low ammonium concentrations Mar. Chem., 60, 235–243, 1998.
Hood, E. W., Williams, M. W., and Caine, N.: Landscape controls on organic and inorganic10
nitrogen leaching across an alpine/subalpine ecotone, Green Lakes Valley, Colorado FrontRange, Ecosystems, 6, 31–45, 2003.
Korner, C.: The use of ‘altitude’ in ecological research, Trends Ecol. Evol., 22, 569–574, 2007.Lehmann, M. F., Bernasconi, S. M., Barbieri, A., and McKenzie, J. A.: Preservation of organic
matter and alteration of its carbon and nitrogen isotope composition during simulated and in15
situ early sedimentary diagenesis, Geochim. Cosmochim. Ac., 66, 3573–3584, 2002.Mariotti, A., Germon, J. C., Hubert, P., Kaiser, P., Letolle, R., Tardieux, A., and Tardieux, P.:
Experimental-determination of nitrogen kinetic isotope fractionation – Some principles – Il-lustration for the denitrification and nitrification processes, Plant Soil, 62, 413–430, 1981.
Mayer, B., Boyer, E. W., Goodale, C., Jaworski, N. A., Van Breemen, N., Howarth, R. W.,20
Seitzinger, S., Billen, G., Lajtha, L. J., Nosal, M., and Paustian, K.: Sources of nitrate in riversdraining sixteen watersheds in the northeastern US: Isotopic constraints, Biogeochemistry,57, 171–197, 2002.
McCarthy, J. J.: Nitrogen, in: The physiological ecology of phytoplankton, edited by: Morris, I.,Blackwell, Oxford, 191–233, 1980.25
Moore, H.: The isotopic composition of ammonia, nitrogen dioxide and nitrate in the atmo-sphere, Atmos. Environ., 11, 1239–1243, 1977.
Owens, N. J. P.: Natural Variations in N-15 in the Marine-Environment, Adv. Mar. Biol., 24,389–451, 1987.
Payne, W. J.: Reduction of nitrogenous oxides by microorganisms, Bacteriol. Rev., 37, 409–30
452, 1973.Post, D. M.: Ecosystem size determines food-chain length in lakes, Nature, 405, 1047–1049,
2000.
11493
BGD6, 11479–11499, 2009
Variability inmountain lake water
N isotopes
M. Bartrons et al.
Title Page
Abstract Introduction
Conclusions References
Tables Figures
J I
J I
Back Close
Full Screen / Esc
Printer-friendly Version
Interactive Discussion
Robinson, D.: delta N-15 as an integrator of the nitrogen cycle, Trends Ecol. Evol., 16, 153–162,2001.
Shearer, G. and Kohl, D. H.: N2-Fixation in field settings – estimations based on natural N-15abundance, Aust. J. Plant Physiol., 13, 699–756, 1986.
Sigman, D. M., Altabet, M. A., Michener, R., McCorkle, D. C., Fry, B., and Holmes, R. M.: Natu-5
ral abundance-level measurement of the nitrogen isotopic composition of oceanic nitrate: anadaptation of the ammonia diffusion method, Mar. Chem., 57, 227–242, 1997.
Solorzano, L.: Determination of ammonia in natural waters by phenolhypochlorite method,Limnol. Oceanogr., 14, 799–801, 1969.
Spoelstra, J., Schiff, S. L., Jeffries, D. S., and Semkin, R. G.: Effect of storage on the isotopic10
composition of nitrate in bulk precipitation, Environ. Sci. Technol., 38, 4723–4727, 2004.Vander Zanden, M. J., and Rasmussen, J. B.: Primary consumer δ13C and δ15N and the trophic
position of aquatic consumers, Ecology, 80, 1395–1404, 1999.Wada, E. and Hattori, A.: Nitrogen isotope effects in the assimilation of inorganic nitrogenous
compounds by marine diatoms, Geomicrobiol. J., 1, 85–101, 1978.15
Wookey, P. A., Aerts, R., Bardgett, R. D., Baptist, F., Brathen, K. A., Cornelissen, J. H. C.,Gough, L., Hartley, I. P., Hopkins, D. W., Lavorel, S., and Shaver, G. R.: Ecosystem feed-backs and cascade processes: understanding their role in the responses of Arctic and alpineecosystems to environmental change, Global Change Biol., 15, 1153–1172, 2009.
York, J. K., Tomasky, G., Valiela, I., and Repeta, D. J.: Stable isotopic detection of ammo-20
nium and nitrate assimilation by phytoplankton in the Waquoit Bay estuarine system, Limnol.Oceanogr., 52, 144–155, 2007.
11494

BGD6, 11479–11499, 2009
Variability inmountain lake water
N isotopes
M. Bartrons et al.
Title Page
Abstract Introduction
Conclusions References
Tables Figures
J I
J I
Back Close
Full Screen / Esc
Printer-friendly Version
Interactive Discussion
Table 1. Physical and chemical characteristics of the lakes.
Llebreta Llong Redo Redon Xic de Bergus Gelat de Vidald’Aiguestortes Colomina Bergus d’Amunt
Latitude – N 42.55 42.57 42.58 42.64 42.52 42.59 42.59 42.53
Longitude – E 0.89 0.95 0.96 0.78 1.00 0.96 0.96 0.99
Altitude (m) 1620 2000 2150 2240 2425 2449 2500 2688
Catchment area (ha) 5438 1111 322 153 35 101 24 17
Lake area (ha) 8.0 7.1 6.0 24.1 1.8 6.5 1.4 2.3
Depth (m) 10.5 12 10 73 11 50 7.5 18
Secchi disk depth (m) 10.5 12 10 30 11 20 7.5 7
Sediment organic 26.4 23.3 22.9 22.1 26.0 18.3 16.3 24.5matter (%)
pH 7.4 7.5 7.0 7.0 7.5 7.0 6.8 7.5
Acid-neutralizing capacity 327 235 71 59 209 73 42 201(µeq L−1)
Conductivity (µS cm−1) 42 29 12 11 25 13 8 24
Dissolved organic carbon 1.4 1.7 1.0 1.3 2.1 1.0 1.1 2.2(mg L−1)
Total phosphorous 7.8 9.5 7.5 5.2 6.3 4.3 5.4 7.9(µg L−1)
Dissolved reactive silica 48 25 31 8 21 30 18 16(µmol L−1)
11495
BGD6, 11479–11499, 2009
Variability inmountain lake water
N isotopes
M. Bartrons et al.
Title Page
Abstract Introduction
Conclusions References
Tables Figures
J I
J I
Back Close
Full Screen / Esc
Printer-friendly Version
Interactive Discussion
1
1
f01 2 Fig. 1. Map showing the location of the eight lakes in the “Aiguestortes i Estany de SantMaurici” National Park, Central Pyrenees (Spain).
11496
BGD6, 11479–11499, 2009
Variability inmountain lake water
N isotopes
M. Bartrons et al.
Title Page
Abstract Introduction
Conclusions References
Tables Figures
J I
J I
Back Close
Full Screen / Esc
Printer-friendly Version
Interactive Discussion
1
1
17200
μmol
L-1
0 -
17200
0-
EWDCMW
SPW
-10
0
10
δ15N
EWDCMW
SPW
-10
0
10
NO3- NH4
+
(‰)
deposition
17200
μmol
L-1
0 -
17200
0-
EWDCMW
SPW
-10
0
10
δ15N
EWDCMW
SPW
-10
0
10
NO3- NH4
+
(‰)
deposition
2
f02 3 Fig. 2. Box plots of nitrate and ammonium concentration and δ15N, for epilimnetic water (EW),deep chlorophyll maximum water (DCMW) and sediment porewater (SPW) from the eight Pyre-nean lakes studied. Mean, 25th and 75th percentiles are represented, whiskers are drawn to thenearest value that is not beyond a standard deviation span from the quartiles and, any pointsbeyond this value (outliers), are drawn individually. Mean deposition values and the range areindicated in broken lines as a reference.
11497
BGD6, 11479–11499, 2009
Variability inmountain lake water
N isotopes
M. Bartrons et al.
Title Page
Abstract Introduction
Conclusions References
Tables Figures
J I
J I
Back Close
Full Screen / Esc
Printer-friendly Version
Interactive Discussion
1
δ15 N
-NH 4+
-10
-7
-4δ1
5 N-N
O 3-
0 20 40
DRSi (μmol L-1)Altitude (m a.s.l.)
1500 2000 2500-10
-5
0
5
<15m
>15m
<15m
>15m
Depth (m) 1
f03 2 Fig. 3. Relationships of δ15N-NO−3 and δ15N-NH+
4 , from epilimnetic (EW, empty circles or boxplots) and deep chlorophyll maximum (DCMW, solid circles or box plots) waters, with altitude,depth, and dissolved reactive silica (DRSi), respectively. Mean deposition values are indicatedwith a broken line as a reference. Significant linear relationships are indicated respectively bysolid (DMCW) and slashed (EW) lines in the plots.
11498
BGD6, 11479–11499, 2009
Variability inmountain lake water
N isotopes
M. Bartrons et al.
Title Page
Abstract Introduction
Conclusions References
Tables Figures
J I
J I
Back Close
Full Screen / Esc
Printer-friendly Version
Interactive Discussion
1
3 8 13NO3
- (μmol L-1)
-10
-2
6
δ15N
-NO
3-
0.5 1.0 1.5NH4
+ (μmol L-1)
-10
-2
6
δ15N
-NH
4+
1
f04 2 Fig. 4. Relationships between concentration and δ15N for NO−
3 and NH+4 from epilimnetic (EW,
empty circles) and deep chlorophyll maximum (DCMW, solid circles) waters. Significant linearrelationships are indicated respectively by solid (DMCW) and slashed (EW) lines in the plots.
11499
Copyright © 2022 FDOKUMEN