Multistage carbon dioxide compressor efficiency ... - DiVA portal
Upload
khangminh22Category
view
2download
0
Cover Page
The following handle holds various files of this Leiden University dissertation: http://hdl.handle.net/1887/61142 Author: Perez Gallant, E. Title: Electroreduction of nitrate and carbon dioxide on copper electrodes: a mechanistic study Issue Date: 2018-02-01

ELECTROREDUCTION OF NITRATE
AND CARBON DIOXIDE ON COPPER
ELECTRODES
A mechanistic study
Proefschrift
ter verkrijging van
de graad van Doctor aan de Universiteit Leiden,
op gezag van Rector Magnificus Prof. Mr. C. J. J. M. Stolker
volgens besluit van het College voor Promoties
te verdedigen op donderdag 1 februari 2018
klokke 11:15 uur
door
Elena Pérez Gallent
geboren te Valencia, Spanje in 1988

Promotiecommissie
Promotor : Prof. Dr. M. T. M. Koper
Co-promotor : Dr. F. Calle-Vallejo
Overige leden : Prof. Dr. H. S. Overkleeft (Universiteit Leiden)
Prof. Dr. E. Bouwman (Universiteit Leiden)
Prof. Dr. Ir. B.M. Weckhuysen (Universiteit Utrecht)
Dr. W.A. Smith (Technische Universiteit Delft)
Dr. B.S. Yeo (National University of Singapore)
ISBN 978-94-6299-842-1
Printed by Ridderprint BV
Cover designed by Elena Pérez Gallent and Marta Ramirez Angulo

Life is and will ever remain an equation incapable of solution, but it
contains certain known factors. Nikola Tesla


Contents
1. Introduction ..................................................................................................... 9
1.1 The Birth of Electrochemistry .............................................................. 10
1.2 Electrocatalysis ........................................................................................... 11
1.3 The potential of electrochemistry in industrial processes ....... 12
1.4 Electrocatalytic reduction of nitrate .................................................. 15
1.5 Electrocatalytic reduction of CO2 ........................................................ 18
1.5.1 Electroreduction of CO2 to hydrocarbons .............................. 19
1.5.2 Electroreduction of CO2 to cyclic carbonates ....................... 22
1.6 Copper, an extraordinary catalyst ...................................................... 23
1.7 Scope and outline of this thesis............................................................ 25
2. Electroreduction of nitrate on copper single crystals in acidic
and alkaline media .......................................................................................... 29
2.1 Introduction ................................................................................................. 30
2.2 Experimental ...................................................................................................... 31
2.3 Results and Discussion ................................................................................... 34
2.3.1 Nitrate reduction in alkaline media .................................................. 34
2.3.2 Nitrate reduction in acidic media ...................................................... 43
2.3 General discussion ........................................................................................... 48
2.4 Conclusions ......................................................................................................... 49

3. Structure-sensitive electroreduction of acetaldehyde to ethanol
on copper and its mechanistic implications for CO and CO2
reduction ............................................................................................................. 51
3.1 Introduction ........................................................................................................ 52
3.2 Experimental ...................................................................................................... 53
3.3 Computational details ..................................................................................... 54
3.4 Results and discussion .................................................................................... 57
3.5 Mechanistic implications ............................................................................... 61
3.5 Conclusions ......................................................................................................... 64
4. Spectroscopic Observation of a Hydrogenated CO Dimer
Intermediate During CO Reduction on Cu(100) Electrodes ............. 65
4.1 Introduction ........................................................................................................ 66
4.2 Experimental ...................................................................................................... 67
4.3 Results and discussion .................................................................................... 68
4.4 Conclusion ........................................................................................................... 75
5. Structure and potential dependent cation effects on CO reduction
at copper single crystal electrodes ............................................................ 77
5.1 Introduction ........................................................................................................ 78
5.2 Experimental ...................................................................................................... 80
5.3 Results and discussion .................................................................................... 84
5.3.1 OLEMS and HPLC ...................................................................................... 84
5.3.2 FTIR ................................................................................................................ 89
5.3.3 DFT calculations ....................................................................................... 92
5.3.4 Mechanistic implications....................................................................... 95
5.4 Conclusions ......................................................................................................... 99

6. Mechanistic study of the electrosynthesis of propylene carbonate
from propylene oxide and CO2 on copper electrodes ....................... 101
6.1 Introduction ...................................................................................................... 102
6.2 Experimental .................................................................................................... 103
6.3 Results and discussion .................................................................................. 105
6.3.1 Cyclic voltammetry ................................................................................ 105
6.3.2 FTIR and HPLC characterization of intermediates and
products ................................................................................................................ 106
6.3.3 Proposed mechanism ........................................................................... 114
6.3.3 Electrosynthesis of propylene carbonate on other metals ... 119
6.4 Conclusion ......................................................................................................... 120
Summary ........................................................................................................... 121
References ........................................................................................................ 125
Appendix I ......................................................................................................... 141
Appendix II ....................................................................................................... 143
Appendix III ...................................................................................................... 147
Appendix IV ...................................................................................................... 151
Appendix V ....................................................................................................... 173
Samenvatting ................................................................................................... 175
Resumen ............................................................................................................ 181
List of publications ........................................................................................ 187
Curriculum vitae ............................................................................................ 189


Chapter 1
Introduction

10
1.1 The Birth of Electrochemistry
Despite the broad knowledge of electricity gained during the 17th and
the 18th century by scientists like William Gilbert, Stephen Gray, Charles
Francois, Jean-Antoine Nollet, William Watson and Charles-Augustin
Coulomb, among others, it was not until the late 18th century that Luigi
Galvani pronounced the birth of electrochemistry by creating a bridge
between muscular contractions of a frog’s leg and electricity. In 1791
Galvani established that animals hold a vital force, namely “animal
electricity”, which activates muscles when placed between two metals.
Alessandro Volta postulated that the real source of stimulation was the
contact of dissimilar metals connected by a moist conductor (a frog’s
leg). Volta persistently studied this phenomenon in order to explain his
“contact” theory of electricity, and in 1800 he announced his invention
of the first electrical battery, the voltaic pile. Years later, Humphry Davy
established that the voltaic pile produces electricity depending on the
event of chemical reactions, and not just on the contact of dissimilar
metals as Volta proposed. Davy’s successor, Michael Faraday, studied
the effects in electrochemical decomposition, which was discovered by
Paets van Troostwijk and Deiman by splitting water into hydrogen and
oxygen by electrolysis. Faraday concluded that the passage of electricity
through a conducting liquid medium causes the molecules to dissociate
and the amount of product decomposed was directly proportional to the
amount of electricity passing through the solution. These laws are still
fundamental to industrial electrolytic production of chemicals. This
story illustrates how even an immature, undeveloped or imperfect
scientific idea can assist in the development of a cultivated and world-
wide accepted scientific theory. Every minor stage in research triggers
the commence of an open discussion that with effort, time and lots of re-
thinking and understanding will result in a putative theory.

Chapter 1 | Introduction
11
1.2 Electrocatalysis
A catalyst is defined as a substance that intervenes in a chemical
reaction modifying the reaction rate without being consumed or
chemically changed. Electrocatalysts are specific forms of catalysts
where the rate of an electrochemical reaction occurring on an electrode
surface is enhanced. Electrocatalysts are classified in two categories:
homogeneous, in which catalyst and reactants have the same phase, and
heterogeneous, where the reaction takes place at the interface between
the catalyst (the electrode) and the reactant phase. In electrocatalysis,
the reactions involve electric charges flowing between the electrodes
and the ionic conductor, the electrolyte. Thus, electrochemistry handles
the interaction between electrical energy and chemical change.
Every electrochemical cell reaction consists of two half reactions, one
occurring at the anode where a certain substance will donate electrons
and become oxidized, and one occurring at the cathode where a certain
substance will accept electrons and become reduced. This thesis is
focused on reduction reactions of nitrate and carbon dioxide taking
place at a cathode made of a solid metal electrode, mainly copper.
The performance of the catalyst for a certain reaction depends on a vast
number of parameters, such as electrode material, oxidation state of the
material, electrode morphology, surface roughness, differences in
adsorption sites, pH and the nature of the species in solution, etc. A good
strategy to develop an active and efficient new catalyst is by first
determining how all these parameters affect the reaction and its
mechanism. In that vein, the scope of this thesis is to investigate the
mechanism of nitrate and CO2 reduction and how different parameters
have an impact on the catalytic performance of copper.

12
1.3 The potential of electrochemistry in industrial processes
The use of electrochemical techniques for the synthesis of valuable
products provides several advantages over chemical synthesis. An
important advantage that makes electrochemistry attractive for
industry is the ease of scalability, which allows large-scale chemical
production. A classic example of ton-scale production is the chloralkali
process2, where aqueous sodium chloride, normally brine obtained
directly from natural salt deposits, is electrolyzed to form chlorine gas
and sodium hydroxide. The chloralkali process is the largest of the
electrolytic industry. The preparation of chlorine electrochemically in
industrial scale was first achieved in 1892. In 1987 it was responsible
for about 10% of the total world production, and in 2000, 95 % of the
world’s chlorine production was obtained by the chloralakli process3.
Another example of large-scale synthesis is the Hall-Héroult process,
where Al2O3 is electrolyzed to produced elemental aluminium4. The
Hall-Héroult process is the largest in terms of energy usage in industrial
processes5. In addition, organic chemicals such as adiponitrile, an
intermediate to nylon, or ethylene glycol, used as antifreeze or in PET
bottles, are also produced electrochemically in large scale. 200 million
kg of Adiponitrile are produced per year by electrohydrodimerization of
acrylonitrile6, and about 10 billion kg of ethylene glycol are produced
per year by catalytic oxidation of ethylene oxide followed by hydrolysis5.
One of the most important contemporary benefits of electrochemistry in
industrial processes is an environmentally friendly and clean process by
employing renewable electricity. Electrochemical processes use electric
current as energy source, averting the use of stoichiometric amounts of
oxidants or reductants, dramatically lowering the amount of by-
products formed and thus the pollutant levels. A precise control of
oxidation or reduction levels can be achieved by the adjustment of the
electrode potential. The electrochemical synthesis of compounds offers
a precise control of the product yield through the applied current or

Chapter 1 | Introduction
13
potential, virtually leading to higher energy efficiencies compared to
thermal-based processes, and to more pure products than those
synthesized by chemical routes. The electrochemical synthesis of DZ-
2384, a diazoamide-based preclinical candidate for oncology, marked an
improvement in terms of selectivity and environmental footprint. This
substance is now prepared by an intramolecular electrochemical
oxidative coupling7, while previously it was synthesized with the use of
oxidants such as PhI(OAc)2. The reagent-based process led to significant
by-product formation which limited the yield of DZ-2384 and
complicated its purification7-9.
The use of less extreme process conditions such as lower temperature
and pressure potentially leads to less degradation of the starting
material or products, making electrochemical methods industrially
interesting. In addition, a lower number of steps might be involved in
the process, for instance, by combining in one reactor the
electrochemical synthesis and the product separation. In the chloralkali
process, the formation of chlorine gas occurs in the anodic compartment
of the reactor, whereas sodium hydroxide is formed in the cathodic
compartment; therefore, the separation process is direct.
However, the existence of physical restrictions such as mass transport
limitations and more importantly economically unprofitable processes,
makes electrochemical processes less beneficial. For large-scale
production, electrochemical processes are costly. The traditional
chemical preparation, even being less selective, is usually economically
more beneficial5.
Electrochemical routes are not always economically feasible if the
selectivity for the desired product is low or inadequate. In aqueous
systems where the competitive reaction is based upon oxygen or
hydrogen formation, the process becomes especially unfeasible in
economic terms, due to the ease of H2 or O2 production compared to the
formation of the desired product. In electrochemical processes, high-
energy consumption is usually required.

14
However, direct conversion with the use of renewable energies offers a
cheap source of energy which may partially help overcome this
problem. In addition, the use of abundant and thereby less expensive
starting materials such as CO2 and nitrate also helps in counteracting the
expenses and readjusting the balance to beneficial values.
Despite the advantages previously mentioned, it is important to remark
the existence of several drawbacks which limit the industrial application
of electrochemical processes. Important factors that make processes
economically unfeasible are the short lifetime and/or the high cost of
some electrode materials. Ideally, the electrode material should be
cheap and stable in the electrolysis medium. In addition, some
electrochemical reactions have low current efficiency under some
conditions and/or high activity towards side reactions limiting the
production yield of the desired product. It is important to mention the
vast amount of factors that affect electrochemical conversion and,
therefore, determine the electrolysis performance10 such as the
electrolyte nature, concentration, pH or conductivity and the nature and
structure of the catalyst, among many others. Other factors such as the
potential or current distribution, the mass-transport regime and the
electrochemical cell design are also of paramount importance11. The
geometry of the electrodes, the inter-electrode distance, the cell
dimensions and the operation mode of the reactor, among others, are
decisive parameters that affect the electrochemical performance of the
process10.
In the interest of eventually obtaining an efficient and economically
feasible process for the industry, a detailed mechanistic study of the
reaction must be addressed, to understand which factors play a role in
the efficient and selective formation of the desired product. An
attractive process would be the conversion of a cheap and abundant
substance to a more valuable product. In this thesis three different
reactions and their mechanisms are the object of study: the
electrocatalytic reduction of nitrates to hydroxylamine, and the
electrocatalytic reduction of carbon dioxide for two different purposes,

Chapter 1 | Introduction
15
namely the formation of hydrocarbons and the formation of cyclic
carbonates.
1.4 Electrocatalytic reduction of nitrate
The reduction of nitrate has attracted interest due to its environmental
significance12 in view of the contamination of groundwater,13-14 and
because it causes serious health problems15 such as liver disease, cancer
and blue baby syndrome. Nitrate contamination is a result of industrial
waste, nuclear industries and agricultural runoff such as livestock feces
and the use of fertilizers, which currently induce severe alterations in
the nitrogen cycle16. This biogeochemical cycle is a complex network of
biological and abiotic processes through which nitrogen circulates
through the organic and physical world. A very simplified scheme of the
nitrogen cycle is displayed in Fig.1.1. The atmosphere is the main
reserve of nitrogen, however, the majority of the living beings cannot
use atmospheric nitrogen to generate amino acids and other nitrogen-
based compounds. Therefore, atmospheric nitrogen must be converted
to ammonia which can be used by organisms through a process called
nitrogen fixation. The formed ammonia is oxidized by bacteria to first
form nitrites that will be further oxidized to nitrates (nitrification). The
absorption of nitrate by plants incorporates the nitrogen in proteins,
nucleic acids and chlorophyll, which will be further converted to
nitrogen-based animal compounds when assimilated by animals. The
nitrogen cycle is closed by the denitrification process, where bacteria
reduce nitrates to N2, which is freed back into the atmosphere.

16
The main cause of the destabilization of the nitrogen cycle is the usage
of fertilizers, which contain large amounts of nitrates, causing
environmental issues like the contamination of groundwater.
Governmental regulations limit the maximum concentration of nitrate in
drinking water to 10 mg/L 17. However, the overpass of this limit in
certain regions18 leads to a need for nitrate removal from water. As the
natural process of denitrification is unable to handle the excess of
nitrite-derived substances, several methods to remove NO3- ions from
contaminated water have been developed. Physicochemical methods
like electrodialysis19, ion exchange resins20 or reverse osmosis21 only
provide a separation method but do not convert nitrate. Biological
methods22 are slow and difficult to control and cannot be used for high
nitrate concentrations to avoid poisoning the bacteria. These methods
are hardly acceptable for large-scale applications due to the low
reaction rate, continuous monitoring and/or large amounts of by-
products. Electrochemical reduction of nitrate presents an alternative
and promising solution, because it is selective, environmentally friendly
and cost-effective23. Nitrate can be used as starting material to produce
useful chemicals such as ammonia, hydroxylamine, hydrazine or azide.
The intricacy of the electrochemical reduction of nitrogen-containing
compounds is related to the existence of numerous stable species with
Dinitrogen (N2)
Nitrate(NO3
-) Ammonia(NH
3)
Nitrification
Figure 1.1: Simplification of the nitrogen cycle. Adapted from ref. 1

Chapter 1 | Introduction
17
oxidations states from -3 to +5. The electrochemical reactions and their
equilibrium potentials for the formation of the different reduction
products are listed below24:
NO3- + 2H+ + 2e- NO2- + H2O E° = 0.835 V vs. NHE (1.1)
NO3- + 4H+ + 3e- NO(g) + 2H2O E° = 0.958 V vs. NHE (1.2)
2NO3- + 10H+ + 8e- N2O+ 5H2O E° = 1.116 V vs. NHE (1.3)
2NO3- + 12H+ + 10e- N2(g) + 6H2O E° = 1.246 V vs. NHE (1.4)
NO3- + 8H+ + 6e- NH3OH+ + 2H2O E° = 0.727 V vs. NHE (1.5)
NO3- + 10H+ + 8e- NH4
+ + 3H2O E° = 0.875 V vs. NHE (1.6)
The obtained product varies depending on the cathode material, the
electrolyte used and the potential applied25-29. Platinum has been the
most studied catalyst for nitrate reduction. The reaction is pH
dependent, being active in acidic media with the consequent formation
of ammonium, but inactive at higher pH26. In addition, nitrate reduction
on platinum in acidic media is surface structure dependent due to the
structure-sensitive adsorption of hydrogen and anions30-31. Other metals
such as rhodium show high activity for nitrate reduction over a wide pH
range32-33, forming ammonium in acidic medium and nitrite in alkaline
media34. Some coinage metals like Cu, Ag and Au have also been studied
in acidic media35: among these metals, copper showed the highest
activity for nitrate reduction, with ammonia as the main product29. The
high activity observed for nitrate reduction on copper in alkaline
media36-37 makes it an interesting system due to the less probable
formation of products like toxic nitrogen oxides compared to reduction
in acidic media38. In this thesis, we investigated the mechanism of
nitrate reduction on copper electrodes in acidic and alkaline media by
cyclic voltammetry, Fourier Transform Infrared Spectroscopy, Ionic
Chromatography and Rotating Disc Electrodes. Copper single crystals
were used to unravel the structure sensitivity of the reaction (Chapter
2).

18
1.5 Electrocatalytic reduction of CO 2
The accelerated increase of the population in the last century has
resulted in a massive growth of energy consumption. 85 % of the
world’s energy demand is supplied by fossil fuels, the consumption of
which creates an increase of greenhouse gases (GHG) in the
atmosphere39. An increase of atmospheric levels of GHG creates
environmental issues such as climate change. Although GHG such as
methane and chlorofluorocarbons have much higher greenhouse effect
per mass of gas, carbon dioxide is the largest contributor to global
warming due to the substantial amounts present in the atmosphere40.
Several strategies can be used to decrease the atmospheric CO2 levels.
First of all, one can reduce the world’s energy consumption by means of
more energy-efficient processes. Reduction in the carbon intensity of
energy usage can be achieved by switching to renewable energies such
as wind, solar or geothermal. Another option would be the capture and
sequestration of CO241. However, this is a rather expensive option, and
only provides a mid-term solution. A good strategy to make CO2 capture
more interesting would be to convert it to valuable chemicals and fuels
by electroreduction42. The use of CO2 as a C1 feedstock for the formation
of more valuable chemicals offers the use of an easy, available and
renewable carbon source, which is non-toxic and abundant. However,
CO2 is the most oxidized state of carbon, being thermodynamically and
kinetically stable, such that it requires a large energy input to convert it
into other molecules. The energy necessary for the electrochemical
conversion can be obtained by renewable energies, making the
combination of renewable energies with the electrochemical reduction
of CO2 a promising path towards a sustainable energy future with net
neutral CO2 emissions.
A significant amount of molecules can be formed from electroreduction
of CO2 especially on copper electrodes. In this thesis, we focus our
attention on the formation of hydrocarbons such as methane, ethylene
and ethanol and on the formation of bigger molecules such as cyclic

Chapter 1 | Introduction
19
carbonates. Ethylene is a widely used industrial building block, and
ethanol is a valuable fuel. Therefore, the reduction towards these
desired products is potentially interesting, due to their higher energy
density compared to single carbon products. The formation of cyclic
carbonates offers wide applications in the chemical industry, as these
are used as fuel additives, in plastics, as green solvents and as
electrolytes for Li ion batteries.
1.5.1 Electroreduction of CO 2 to hydrocarbons
The electrochemical reduction of carbon dioxide has gained
extraordinary interest in the past decades as a means of energy storage.
The simplest products obtained are those for which only 2 e- transfers
are involved in the reaction path, such as carbon monoxide and formic
acid. However, the formation of hydrocarbons would be the most
significant target of CO2 utilization due to their high energy density and
the benefit of direct use without changing the present infrastructures
based on fossil fuels.
The electrochemical reactions and their equilibrium potential for the
formation of different products of carbon dioxide reduction are listed
below:
CO2 + 2H+ + 2e- CO + H2O E° = -0.10 V vs. RHE (1.7)
CO2 + 2H+ + 2e- HCO2H E° = -0.20 V vs. RHE (1.8)
CO2 + 4H+ + 4e- H2CO + H2O E° = -0.07 V vs. RHE (1.9)
CO2 + 6H+ + 6e- CH3OH + H2O E° = 0.02V vs. RHE (1.10)
CO2 + 8H+ + 8e- CH4 + 2H2O E° = 0.17 V vs. RHE (1.10)
2CO2 + 12H+ + 12e- CH3CH2OH + 3H2O E° = 0.09 V vs. RHE (1.12)
2CO2 + 12H+ + 12e- C2H4 + 4H2O E° = 0.08 V vs. RHE (1.13)

20
The product distribution resulting from the electrochemical reduction of
CO2 depends on the metal used as electrode. A screening of several
transition metals used for carbon dioxide was performed and a
classification regarding the product formed was suggested43. The
product selectivity is mainly determined by how CO2 is reduced initially
at the electrode surface. In the first group belong metals such as In, Sn,
Hg and Pb that selectively form formic acid. These metals have high
hydrogen overvoltage and low CO adsorption strength, therefore the
intermediates are weakly adsorbed on the surface making those metals
unable to catalyze the breaking of the C-O bond in CO2 and thus
facilitating the formation of formic acid. The second group of metals,
where Ag and Au belong, produces mainly CO. CO is formed on these
metals, especially on Au, at less negative potentials than formic acid.
Hansen et al44 developed a model to describe trends in catalytic activity
for CO2 reduction in terms of the adsorption energies of the reaction
intermediates. Considering that CO is formed through the adsorbed
intermediates *COOH and *CO, Au is able to stabilize *COOH without
over-stabilizing CO. This explains the formation of CO on Au at lower
potentials than formic acid formation suggesting a different mechanism
for the formation of CO. The third group consists of metals such as Ni,
Fe, Pt and Ti, which evolve hydrogen at low potentials. On these metals
CO2 is reduced to CO, but it is strongly adsorbed on the surface,
poisoning the metal and blocking possible further reactions. Therefore,
the main product formed is hydrogen from the competitive hydrogen
evolution reaction. Metals with a moderate CO adsorption energy are
able to further reduce CO to hydrocarbons. Elements such Mo and Ru
have been reported to convert CO2 to methanol and methane but with
low efficiencies45-46. However, copper is a unique metal able to form
hydrocarbons, mainly methane and ethylene with high efficiencies47.
Formation of oxygenated species such as ethanol and propanol has also
been observed, although normally in smaller amounts48-49. Jaramillo et
al. recently observed the formation of 16 different products: besides the
main products such methane, ethylene, formate, CO, ethanol and
propanol, other minor products such as allyl alcohol, methanol,

Chapter 1 | Introduction
21
glycoaldehyde, acetaldehyde, ethylene glycol, propionaldehyde, acetone,
acetate and hydroxyacetone were also observed with lower efficiency50.
The extraordinary ability of copper to form hydrocarbons has motivated
a substantial effort to understand its special activity for the carbon
dioxide reduction reaction. Numerous experimental and theoretical
studies have proposed mechanisms for the reduction of CO2 on copper48,
50-56. However, a detailed mechanism for this reaction is still under
debate49, 51-52, 57-58. Ethylene and methane formation follow two different
pathways59 having carbon monoxide as the key intermediate in the
formation of both products60-62. The formation of methane has been
found to be pH dependent61, 63, which implies that the rate-determining
step must involve the transfer of a proton and an electron. Hori
suggested a path for the formation of methane via adsorbed COH61. In
contrast, the formation of ethylene is pH independent,61, 63 which implies
that the rate-determining step does not involve a proton transfer.
However, the formation of ethylene does depend on the potential, so
that an electron transfer must be involved. A C-C coupling of two
adsorbed CO molecules through a reductive dimerization step has been
proposed as a rate-determining step51, 57. In chapter 4 of this thesis the
formation of this CO dimer will be discussed in detail.
Several factors such as the electrode morphology47, 64, the pH of the
electrolyte63, the identity of the cations and anions56, 65, the size and
shape of nanoparticles66, the oxidation state of the copper electrode67 ,
among others, have been extensively studied to gain insight into the
extraordinary reactivity of copper to form hydrocarbons from carbon
dioxide.
In this thesis, we focus our attention on the study of several steps during
the reduction of CO2 such as the reduction of CO (chapters 4 and 5) and
the reduction of acetaldehyde (chapter 3) in order to gain insight into
the mechanism of the reaction. In addition we investigated how
different factors such as the structure of the electrode, the potential
applied or/and the effect of the cations influence the mechanism of
these reactions. The study was performed with a combination of

22
techniques such as cyclic voltammetry, High Performance Liquid
Chromatography, Online Electrochemical Mass Spectrometry, Fourier
Transform Infrared Spectroscopy and Density Functional Theory
calculations.
1.5.2 Electroreduction of CO 2 to cyclic carbonates
Cyclic carbonates are profitable synthetic targets starting from CO2 due
to the added value of these organic molecules compared to CO2. In
addition, the fixation of CO2 into organic molecules offers an
environmentally friendly alternative to storage solutions68. The
formation of cyclic carbonates has been an area of interest due to the
versatility of these compounds. Cyclic carbonates can be used as
electrolytes for Li ion batteries, fuel additives, as aprotic polar solvents,
as green reagents and as useful intermediates for manufacturing
polycarbonates69-70. Polycarbonates are the most widely used
engineering plastics, currently synthesized through the phosgene
process. The use of a highly toxic substance like phosgene, which is
regulated by the international treaty concerning chemical weapons 71,
makes the synthesis of polycarbonates environmentally unacceptable.
Substituting phosgene with CO2 will radically diminish environmental
issues due to not only the elimination of toxic by-products but also due
to the capture and conversion of CO2.
In view of the commercial importance of cyclic carbonates and their
broad applications in industry, the catalytic synthesis of these
compounds has been extensively studied. Several homogeneous
catalysts based on metal complexes72-74 have been proposed for the
conversion of CO2 and epoxides to cyclic carbonates. However, most of
the currently used catalysts for this process demand high operational
temperatures and/or high carbon dioxide pressures75-77. The use of
electrochemistry allows for the synthesis of cyclic carbonates under
mild conditions with high efficiencies78-79. Copper, among other metals
tested for this process such as Ni, Ag or graphite, has been found to be

Chapter 1 | Introduction
23
one of the most efficient metals for the conversion of carbon dioxide and
epoxides to cyclic carbonates79-81. Copper and copper nanoparticles
have been employed as cathode for the synthesis of cyclic carbonates,
achieving high conversion and selectivity 78, 80.
Despite all the studies concerning this process, the mechanism of the
reaction is still under debate. While numerous studies argue that the key
step for the synthesis of cyclic carbonates is the activation of the
epoxide via the ring opening72, 74, 82-83, other studies consider the
activation of carbon dioxide through the formation of the radical anion
CO2·- to be the key step for the synthesis of organic carbonates81, 84.
In this thesis, we employed Fourier Transform Infrared Spectroscopy
(FTIR) and High Performance Liquid Chromatography (HPLC) to gain
insight into the mechanism of cyclic carbonates synthesis and establish
that adequately activated CO2 is able to carboxylate organic molecules,
such as epoxides, to form cyclic carbonates.
1.6 Copper, an extraordinary catalyst
Copper has been used since 8000 BC due to the luxury of direct use in
metallic form without its extraction from an ore. Copper is abundant on
Earth, with 1014 tons existing in the first kilometer of the Earth’s crust.
The abundance of copper and its ease of mining make it a rather
inexpensive metal. The price of copper has been unstable during
history85, although in the last 10 years it has been more stable with
values around US$3/kg. The price of copper is more than 10000 times
lower than other metals like Pt or Au. The abundant and cheap nature of
copper, has generated interest into its use as a catalyst in
electrochemical processes. Metallic copper, copper-based and oxide-
derived copper catalysts are able to efficiently catalyze numerous
reactions29, 47, 57, 67-68, 86. In this thesis, we will focus our attention on the
reduction of nitrates, the reduction of carbon dioxide and the

24
conversion of carbon dioxide and propylene oxide to propylene
carbonate on metallic copper electrodes.
The morphology of the catalyst is crucial to understand the mechanism
of the reaction carried out on the copper surface. For that reason,
copper single crystals were employed.
Copper is a face-centered cubic (fcc) metal with copper atoms located at
each of the corners of the unit cell and at the center of all the cubic faces.
Bulk copper has a coordination number of 12 since 12 of their atoms are
shared with other unit cells. The fcc unit cell consists of a net total of
four atoms, eight eighths from corner atoms and six halves from the face
atoms. In order to identify the different planes and directions in a
crystal structure, Miller indices are used which consist of three values of
h, k and l as directional parameters. The most studied surfaces are those
for which the plane is perpendicular to the principal axis, called basal
planes. For an fcc structure the basal planes are (100), (111) and (110).
In addition, other surfaces with larger Miller indices, namely stepped
surfaces, can also be studied. Ideal stepped surfaces consist of terraces
Figure 1.2: Representation of different surface structures of an fcc crystal,
taken from surface explorer.(http://surfexp.fhi-berlin.mpg.de)
(100) (111) (110)
(533)

Chapter 1 | Introduction
25
with a low index atomic arrangement, separated by monoatomic steps.
A representation of such surfaces is displayed in Figure 1.2. The use of
single crystals in electrochemistry helps in understanding how different
adsorption sites influence the stability of intermediates in a certain
reaction, catalyzing more efficiently the conversion of different species.
1.7 Scope and outline of this thesis
The general focus of the research offered in this thesis is the electro-
conversion of environmentally harmful chemicals, such as nitrates and
carbon dioxide, into more valuable and less polluting compounds. In
particular, the study is focused in the understanding of the mechanistic
aspects of these reactions carried out on copper electrodes.
In chapter 2, we study the electrochemical reduction of nitrates on
copper single-crystal electrodes in acidic and basic media to evaluate
the reaction mechanism and the products obtained in the different
media and on the different surfaces employed. Using electrochemical
techniques coupled to analytical techniques we observe differences in
product distribution depending on the pH of the electrolyte. Whereas in
acidic media the reduction of nitrate leads to NO and ammonia, in basic
media the product observed is hydroxylamine. Furthermore, the
reaction is structure sensitive in basic media: Cu(100) is most active for
the formation of hydroxylamine. Conversely, in acidic media the
reaction is independent of the catalyst’s structure.
In chapter 3 we study the electroreduction of acetaldehyde to ethanol, a
reaction which is supposed to take place at a late stage in the reduction
of carbon dioxide. Combining experimental techniques with density
functional theory we outline the structure sensitivity of the reaction.
Experiments show that more open facets have lower overpotentials for
the formation of ethanol. DFT calculations predict that the formation of
ethanol proceeds via a weakly bounded CH3CH2O* intermediate which
binds more favourably on open surfaces, explaining the earlier

26
formation of ethanol on those facets. In addition, DFT calculations show
higher thermodynamic limitations for ethanol compared to ethylene.
Making use of the structure selectivity observed for ethanol formation,
the selectivity towards ethanol formation can be enhanced.
In chapter 4 we study the early stages of CO reduction by Fourier
Transform Infrared Spectroscopy and Density Functional Theory. We
show experimentally that Cu(100) electrodes in LiOH solutions host a C-
containing adsorbate at low overpotentials, which we propose to be a
hydrogenated CO dimer (OCCOH). The formation of the hydrogenated
dimer is a structure-sensitive process, which does not occur on Cu(111)
surfaces, confirming the theoretical hypothesis that the dimerization is
favoured on square-symmetry sites.
In chapter 5 we show how the combined effect of alkaline cations,
catalyst structure and applied potential can steer the selectivity of CO
reduction towards ethylene or methane. First, we find that the nature of
the cation affects the product selectivity, depending on the potential
applied. Whereas larger cations enhance the selectivity to ethylene at
potentials more positive than -0.45 V vs RHE, the selectivity towards
methane is enhanced by larger cations at more negative potentials. The
fact that ethylene formation declines at potentials for which methane
formation increases, suggests that the pathway towards ethylene is
blocked by the enhancement of the pathway that leads to methane.
Secondly, we observe that cation effects are structure dependent, as the
onset potential for ethylene formation depends on the electrode
structure and cation size, whereas the onset potential for methane
formation does not. The formation of the intermediate suggested in
chapter 4 (OCCOH) was found to be dependent on the nature of the
cation, so that the hydrogenated dimer can be detected with FTIR in
presence of Li+, Na+ and K+, but not in presence of Rb+ or Cs+. DFT
calculations explain that the potential necessary to form *OCCOH from
*CO in presence of Cs+ is more negative compared to Li+ or Na+. Lastly,
we point out the role of the cations as catalytic promoters by stabilizing
intermediates through favourable electrostatic interactions.

Chapter 1 | Introduction
27
In chapter 6 we investigate the conversion of CO2 to organic molecules,
specifically the reaction between CO2 and propylene oxide to form
propylene carbonate. Employing cyclic voltammetry, Fourier Transform
Infrared Spectroscopy and High Performance Liquid Chromatography
we study the mechanism of the reaction. We rule out different reduced
forms of CO2, such as CO and (bi)carbonate as possible carboxylation
agents. Moreover, we rule out the electrochemical activation of
propylene oxide via ring opening as the initial step for this reaction. We
propose an electrochemical reaction initiated by the activation of CO2 to
CO2-· which then attacks propylene oxide to form propylene carbonate.


Chapter 2
Electroreduction of nitrate on copper single crystals in acidic and
alkaline media
Nitrate reduction on Cu (100) and Cu (111) surfaces in alkaline and
acidic solutions was studied by electrochemical methods (cyclic
voltammetry, rotating disc electrode) coupled with online and in situ
characterization techniques (mass spectrometry, ion
chromatography and Fourier transformed infra-red spectroscopy) to
evaluate the reaction mechanism and products on the different
surfaces. Electrochemical results show that reduction of nitrate in
alkaline media on Cu is structure sensitive. The onset potential on Cu
(100) is +0.1 V vs. RHE, ca. 50 mV earlier than on Cu (111). The onset
potentials for nitrate reduction on Cu (100) and Cu (111) in acidic
media are rather similar. Analytical techniques show a diverse
product distribution for both surfaces and for both electrolytes.
Whereas in acidic media both Cu electrodes show the formation of
NO and ammonia, in alkaline media Cu reduces nitrate to nitrite and
further to hydroxylamine. In alkaline media, Cu (100) is a more
active surface for the formation of hydroxylamine than Cu (111).
This chapter has been published as: E Pérez-Gallent, MC Figueiredo, I Katsounaros, MTM Koper, Electrochimica Acta, 2017, 227, 77-84

30
2.1 Introduction
Human activities like the combustion of fossil fuels, the nuclear industry,
the production of nitrogen fertilizers and the cultivation of nitrogen-
fixing plants are inducing severe alterations in the global nitrogen cycle 16. The rate of many human-caused global changes has increased
severely in last decades, but none so rapidly as industrial production of
N fertilizers, which has grown exponentially since the 1940s. The
increase of the availability of N also increases biomass production and
accumulation significantly87 . Consequently, changes in nitrogen cycle
can also lead to changes in the global carbon cycle, generating an
increase of carbon dioxide in the atmosphere 88. The slow natural
process of denitrification is unable to deal with the surplus of nitrate-
derived compounds leading to a deteriorating effect on our ecological
system and human health.
Electrochemistry could play an important role in the development of
new denitrification technologies due to its environmental compatibility,
versatility, energy efficiency, selectivity and low associated costs, as well
as the non-requirement of reduction agent23, 35. However, there is a need
for an appropriate electrocatalyst that can provide an optimized process
with high selectivity to harmless products like N2 or valuable products
such as ammonia or hydroxylamine. The electrochemical reduction of
nitrate has been studied on several transition and coinage metal
electrodes in acidic media35. Copper has been shown to be the most
active coinage metal for this reaction having ammonia as main
product36-37. A high electrochemical activity for nitrate reduction has
also been observed on copper electrodes in alkaline solutions38. Nitrate
reduction in alkaline media is of interest due to the less probable
solution-phase formation of products like toxic nitrogen oxides89 , as
compared to reduction in acidic media, and because of the concern of
removing nitrate from alkaline nuclear waste. In this context, the use of
single-crystal copper surfaces offers the unique opportunity to evaluate

Chapter 2 | Electroreduction of nitrate on copper electrodes
31
the effect of the surface atomic structure on the reaction rate, the
preferred reaction paths and the resulting product distribution.90
In this chapter, we study the influence of the surface structure of Cu
electrodes on the nitrate reduction in alkaline and acidic media. We use
electrochemical techniques (cyclic voltammetry, rotating disc electrode)
coupled with online and in situ characterization techniques (mass
spectrometry, ion chromatography and Fourier transformed infra-red
spectroscopy) to evaluate the reaction mechanism and products on the
different surfaces and their dependence on the available atomic sites.
2.2 Experimental
Prior to each electrochemical experiment, the glassware used was
stored overnight in a solution of KMnO4 that was rinsed with a mixture
of ultra clean water (Millipore MilliQ, resistivity > 18.2 MΩ), 20 mL/L of
hydrogen peroxide and 1 mL/L of concentrated sulfuric acid. The
glassware was further cleaned by boiling 4 times in Millipore MilliQ
water. A coiled platinum wire was used as a counter electrode and a
reversible hydrogen electrode (RHE) in the same electrolyte was used
as the reference electrode. All potentials in this chapter are referred to
RHE.
The copper electrodes used were 99.99% copper disks with a diameter
of 6mm, purchased from Mateck and aligned to < 0.5° accuracy. Prior to
every experiment, the electrodes were electropolished in a 10:5:2
mixture of H3PO4:H2O:H2SO4 at +3 V vs. Cu for 30 s, followed by a
stabilization step at 0 V for 30 s. After thorough rinsing with ultrapure
water, the surface of the crystal was characterized by cyclic
voltammetry at a scan rate of 50 mV/s in NaOH 0.1 M solution91. Cyclic
voltammograms were recorded by an Ivium A06075 potentiostat.
Electrolytes were made from ultra-pure water (Millipore MilliQ,
resistivity > 18.2 MΩ) and high purity reagents (Sigma Aldrich

32
TraceSelect). Before every experiment, Argon (Linde, 6.0) was bubbled
through the electrolyte for 15 min in order to remove air from the
solution, and during the experiments the argon was kept flowing above
the solution.
In order to control mass transfer rates, Cyclic Voltammetry (CV) under
hydrodynamic conditions was performed with a home-made hanging-
meniscus rotating disc electrode (HMRDE) configuration, compatible
with single-crystal electrodes. The rotation was controlled with a
modulated speed rotator (PINE, MSR). Experiments were carried out at
a rotation rate of 400 rpm.
Online Electrochemical Mass Spectroscopy (OLEMS)92 was used to
detect the gaseous products formed during the reaction. The reaction
products at the electrode surface were collected by a hydrophobic
Teflon tip situated very close to the surface of the electrode (about 10
μm). The tip is a 0.5 mm diameter porous Teflon cylinder with an
average pore size of 10-14 μm in a Kel-F holder, connected to a mass
spectrometer by a PEEK capillary. Before every experiment, the tip was
submerged in a solution of 0.2 M K2Cr2O7 in 2 M H2SO4 and rinsed
extensively with MilliQ water. A Balzers Quadrupole mass spectrometer
with a secondary electron multiplier (SEM) voltage of 2400 V was used
for the detection of every mass. The different mass signals were
followed while changing the electrode potential from +0.25 V to -1 V vs.
RHE and back at a scan rate of 1 mV/s.
Online Ion Chromatography (IC) was utilized to detect ionic products
dissolved in the electrolyte93. The reaction products were collected with
an automatic sample collector (FRC-10A, Shimadzu) by an open tip
situated very close (about 10 μm) to the electrode. The potential of the
electrode was changed from 0.35 V to -0.6 V and back at a scan rate of 1
mV/s. Every sample contains 60 μL and they were collected with a rate
of 60 μL/min, meaning that every sample contains the average products
of a change in potential of 60 mV. After voltammetry, all the samples
collected were analyzed with IC (Shimadzu, Prominence) equipped with
a conductivity detector (CDD-10A vp, Shimadzu). For the detection of

Chapter 2 | Electroreduction of nitrate on copper electrodes
33
the anion (NO2-), sodium nitrite (Merck, 99.99%) was utilized to prepare
standard solutions, from which the retention time was determined and
the concentration was calibrated. An NI-424 (Shodex) anionic column
was used at a constant temperature of 40 °C with an eluent flow rate of
1 mL/min. The eluent consists of 2.8 mM BIS-TRIS (Fluka, BioXtra,
>99%), 2 mM phenylboronic acid (Fluka, purum, >97%), 8mM 4-
hydroxybenzoic acid (Sigma-Aldrich, 99%), and 0.005 mM trans-1,2-
diaminocyclohexane-N,N,N’,N’-tetra acetic acid (Sigma- Aldrich, ACS
reagent, >99%).
In all the above techniques, the electrode was in hanging meniscus
configuration, meaning that only the face of the crystal with the desired
structure was in contact with the electrolyte.
FTIR measurements were performed with a Bruker Vertex 80 V Infrared
spectrophotometer94. The electrochemical cell was assembled on top of
a 60° CaF2 prism, and the electrode was situated against this prism to
form a thin layer. The measurements were performed under external
reflection. FTIR spectra were obtained from an average of 100 scans
with a resolution of 8 cm-1 at the selected potentials. Every spectrum
was obtained by applying single potential steps compared to the
reference potential (+0.35 V vs. RHE). The spectra are shown as (R-
R0/R0) where R is the reflectance at the sample potential and R0 is the
reflectance at the reference potential. Thereby the ratio ΔR/R0 gives
positive bands for the formation of species at the sample potential, and
negatives bands correspond to the loss of species at the sample
potential. P-polarized light was used to probe species both near the
electrode surface and in solution.

34
2.3 Results and Discussion
2.3.1 Nitrate reduction in alkaline media
2.3.1.1 Cyclic voltammetry (CV) and hanging-meniscus rotating disc electrode (HMRDE) measurements.
Fig 2.1a shows the cyclic voltammograms for Cu (111) (blue curve) and
Cu (100) (green curve) in 0.1 M NaOH solution (dashed lines) and in
0.1M NaOH with 2 mM of NaNO3 (full lines). In the blank voltammetry,
for both surfaces we observe a featureless voltammogram between +0.3
V and -0.5 V vs. RHE. When more negative potentials are applied, both
surfaces evolve hydrogen, with Cu (111) being more active for HER with
an onset potential of -0.4 V compared to -0.5 V for Cu (100). With
nitrate in solution, reduction currents are observed for both surfaces at
much lower potentials than HER. Cu (111) shows two reduction peaks,
the first one starts at +0.15 V reaching a maximum current density of ca.
-0.4 mA/cm2 at +0.1 V. The second peak has an onset potential of -0.15 V
reaching a maximum current density of ca. -3 mA/cm2 at -0.5 V. On the
other hand, Cu (100) shows one peak starting at +0.1 V reaching a
maximum current density of ca. -4.3 mA/cm2 at -0.3 V. According to the
literature24, 32, 37, 95 the first reduction product of nitrate reduction is
nitrite. The small reduction peak starting at +0.15 V on the Cu (111)
electrode is probably associated with this first reduction step:
NO3- + H2O + 2e- NO2- + 2OH- (2.1)
as is evidenced by the absence of this peak when the reactant is NaNO2
(see Fig. 2.1b). The voltammogram obtained with Cu (100) only shows
one wave with an onset potential of +0.1 V, associated with the
formation of nitrite and further reduced products as suggested by the
CVs for nitrite reduction shown in Fig 2.1b. Cu (100) shows a diffusion-
limited plateau with a maximum current density of ca. -4.3 mA/cm2 at
around -0.3 V, this limiting current being dependent on rotation rate. A

Chapter 2 | Electroreduction of nitrate on copper electrodes
35
Levich plot of the rotation-rate dependence of the current plateau is not
perfectly linear; from the slope we estimate that the number of
electrons involved in the process is between 5 and 7 (with 6
corresponding to the formation of hydroxylamine). On the other hand,
the CV obtained for Cu (111) is only partially diffusion limited and does
not reach a plateau current. Although on Cu (111) the reduction of
nitrate has a lower onset potential, the reaction appears to become
blocked by intermediates of the hydrogen evolution reaction, which has
a more positive onset potential on Cu (111) than on Cu (100), and as a
result the nitrate reduction is not able to reach full diffusion limitation
on Cu (111).
Figure 2.1: Cyclic voltammetry recorded at Cu (111) and Cu (100) electrodes
in 0.1M NaOH in the absence (dashed lines) and presence (solid lines) of a) 2
mM NaNO3 and b) 10 mM NaNO2 Experimental conditions: scan rate 50 mV/s;
rotation rate 400rpm.

36
We note that in the presence of nitrate there is a strong poisoning effect
on Cu (111) as illustrated in figure 2.2, showing cyclic voltammograms
of the nitrate reduction reaction as a function of the cycle number for Cu
(100) (Fig.2.2a) and Cu (111) (Fig.2.2b) electrodes in a 0.1 M NaOH
solution containing 2 mM NaNO3. The reduction peak observed at +0.15
V in the first cycle of nitrate reduction on Cu (111) is absent in the
following cycles, suggesting that the reaction on Cu (111) is inhibited
already after the first cycle. Both electrodes show deactivation with
cycling in the potential window shown in Fig.2.2, but the deactivation of
the Cu (111) electrode is much more pronounced than for Cu (100). If
the negative vertex of the potential window is limited to -0.4 V (see
Fig.2.3a), Cu (100) does not show deactivation, suggesting that the
deactivation is associated with the formation of adsorbed hydrogen. On
the contrary, Cu (111) still shows deactivation also if the potential scan
is limited to -0.4V (see Fig.2.3b), in agreement with the lower onset
potential for hydrogen evolution and hydrogen adsorption on Cu (111).
This inhibition and deactivation by adsorbed hydrogen is also known for
nitrate reduction on Pt24, 96. Similarly to nitrate reduction on Pt the
negative differential resistance that is the result of the inhibition by
adsorbed hydrogen can give rise to spontaneous (current) oscillations97
during nitrate reduction, as illustrated in Fig.2.2a for Cu (100). These
oscillations are caused by the interplay between the negative
differential resistance and the ohmic resistance of the electrolyte
solution98. The possibility of poisoning of the electrode by intermediate
N-containing species was also considered. However, we consider it less
likely considering that self-poisoning typically does not lead to a
negative differential resistance, but rather to a lower overall current.
The observed negative differential resistance is characteristic for
poisoning by a parallel side reaction, in this case hydrogen adsorption.

Chapter 2 | Electroreduction of nitrate on copper electrodes
37
Figure 2.2: Cyclic voltammetry recorded at a) Cu (100) and b) Cu (111)
electrodes in 0.1 M NaOH in the presence of 2 mM NaNO3 as a function of the
cycle number. First cycle starts at 0.35 V vs. RHE. Experimental conditions:
scan rate 50 mV/s; rotation rate 400rpm
Figure 2.3: Cyclic voltammetry recorded at a) Cu (100) and b) Cu (111)
electrodes in 0.1 M NaOH in the presence of 2 mM NaNO 3 in the potential
window between +0.35 and -0.4 V vs. RHE as a function of the cycle number.
Experimental conditions: scan rate 50 mV/s; rotation rate 400rpm.
-5
-4
-3
-2
-1
0j /
mA
cm
-2
-0.6 -0.4 -0.2 0.0 0.2-0.6 -0.4 -0.2 0.0 0.2
E vs RHE / V
-5
-4
-3
-2
-1
Cu 100
cycle 1 cycle 5 cycle 10 cycle 15 cycle 20
Cu 111
cycle 1 cycle 5 cycle 10 cycle 15 cycle 20
a) b)
-2000
-1500
-1000
-500
0
I / uA
-0.4 -0.2 0.0 0.2 0.4
E vs RHE / V
-2000
-1500
-1000
-500
-0.4 -0.2 0.0 0.2 0.4
cycle 1 cycle 5 cycle 10 cycle 15 cycle 20
cycle 1 cycle 5 cycle 10 cycle 15 cycle 20
Cu (100) Cu (111)
a) b)

38
2.3.1.2 Ion Chromatography and OLEMS data
Fig.2.4 illustrates the formation of nitrite detected by Ion
Chromatography as a function of the cycle number for Cu (100) (Fig. 4a)
and Cu (111) (Fig. 4b) in a 0.1 M NaOH solution containing 2 mM NaNO3.
The onset potential for the formation of nitrite matches the onset
potential seen in voltammetry (see Fig.2.1), i.e. +0.15 V for Cu (111) and
+0.1 V for Cu (100). The profile of the formation of nitrite on Cu (100)
shows a maximum at -0.1 V, and decreases at more negative potentials,
indicating the further reduction of nitrite. On the other hand, the
formation of nitrite on Cu (111) shows a less accentuated profile, with a
plateau, suggesting that further reduction is slow. Moreover, consistent
with the deactivation of Cu (111) shown in Fig.2.2, Cu (111) does not
form any nitrite in the second cycle of the voltammetry, whereas Cu
(100) shows only a small decay in the amount of nitrite formed
compared with the amount formed in the first cycle. Note, however, that
the employed scan rate in Figure 2.4 is significantly lower than in
Figures 2.2 and 2.3.
Figure 2.4: Formation of NO2- detected with online ion chromatography from
a) Cu (100) electrode and b) Cu (111) electrode in a 0.1 M NaOH solution
containing 10 mM NaNO3. Scan rate = 1 mV/s
2.0
1.5
1.0
0.5
0.0
[NO
2
- ] / m
mol L
-1
-0.6 -0.4 -0.2 0.0 0.2
E vs RHE / V
1.5
1.0
0.5
-0.6 -0.4 -0.2 0.0 0.2
cycle 1 cycle 2
Cu 100 Cu 111
cycle 1 cycle 2
a) b)

Chapter 2 | Electroreduction of nitrate on copper electrodes
39
The possible formation of gaseous products such as N2O, NO or N2
during the reduction of nitrate, was followed by OLEMS. As Fig. 2.5
shows, neither Cu (111) nor Cu (100) form any gaseous products other
than hydrogen, which is associated with the reduction of water from the
electrolyte.
Figure 2.5: Mass fragments associated with various products measured with
OLEMS for the reduction of 10 mM NaNO 3 in 0.1 M NaOH solution in Cu (100)
(green curves) and Cu (111) (blue curves) electrodes. Scan rate = 1mV/s
12x10-9
10
8
6
-1.0 -0.8 -0.6 -0.4 -0.2 0.0 0.2
E vs RHE / V
2.4x10⁻⁹
2.0
1.6
1.2
400x10-12
300
200
100
0
cu
rre
nt
/ a
.u.
200x10-9
150
100
50
0
-0.8 -0.6 -0.4 -0.2 0.0 0.2
m/z = 2
m/z=28
m/z=30
m/z=44
N2
H2
NO
N2O

40
2.3.1.3 FTIR spectroscopy
Reaction intermediates or possible adsorbates on the electrodes were
followed by FTIR in order to obtain a better insight about the
intermediates and the mechanism of the reaction. Fig.2.6 displays the
potential dependent absorbance spectra with respect to the reference
potential (0.35 V). In agreement with the onset potentials for nitrate
reduction observed in the CVs (fig.2.1) and IC (fig.2.4), the absorbance
spectra also show that the onset potential for the reduction of nitrate is
0.15 V on Cu (111) and +0.1 V on Cu (100), as observed by a negative
band at 1370 cm-1 associated with the consumption of nitrate94.
Simultaneously to nitrate consumption the formation of nitrite can be
seen by the positive band at 1231 cm-1, which appears at similar
potentials to those observed by IC (Fig.2.4). Interestingly, the band
observed at 1191 cm-1 during the reduction of nitrate on Cu (100)
indicates the production of hydroxylamine (NH2OH)99 at potentials
more negative than 0 V (see Fig.2.6 left panel). By contrast, the spectra
recorded with Cu (111) do not show the band at 1191 cm-1. However,
cathodic currents are observed in the reduction of NaNO2 on Cu (111),
suggesting that nitrite can still be reduced. Fig. 2.1b shows similar
limiting currents for both surfaces, suggesting that the reduced product
has the same nature, but is formed with a slower rate on Cu (111).
Therefore, we suggest that, even though clear hydroxylamine bands are
not present in the FTIR spectra on Cu (111), the most likely product is
still NH2OH. The absence of the bands related to hydroxylamine in the
working potential range suggests that hydroxylamine is formed with a
too low concentration at potentials less negative than -0.35V. Also, it is
important to highlight the absence of adsorbed NO on both copper
surfaces, even when the FTIR spectra were recorded in NaOH solution
using D2O (See Appendix I Fig. AI.1.). The negative band observed at
1623 cm-1 is due to the O-H bending of water.

Chapter 2 | Electroreduction of nitrate on copper electrodes
41
Figure 2.6: Potential dependent absorbance spectra for the reduction of 10
mM NaNO3 on Cu (100) (left panel) and on Cu (111) (right panel) electrode in
0.1 M NaOH solution. Reference spectrum recorded at 0.35 V vs. RHE.
Potential step is 0.05V.
The reduction of nitrite (NO2-) was also studied by FTIR on both copper
surfaces (see Fig. 2.7). As the CVs in Fig.2.1b show, the reduction of
nitrite on Cu (100) starts ca. +0.1 V earlier than on Cu (111). Similar to
nitrate reduction, also for nitrite reduction the Cu (111) electrode
shows a more pronounced inhibition by hydrogen than Cu (100). FTIR
spectra were taken in 0.1 M NaOH solutions containing 10 mM of NaNO2
(see figure 2.7). Spectra obtained with Cu (100) show a negative band at
1235 cm-1 corresponding with the consumption of nitrite100 and a
positive band at 1191 cm-1 assigned to the formation of

42
hydroxylamine99. When Cu (111) is used, the spectra only show a clear
negative band at 1235 cm-1 corresponding to the consumption of nitrite
suggesting that nitrite is indeed reduced further. A small band can be
observed at 1190 cm-1 suggesting formation of hydroxylamine in
accordance with the cathodic currents observed in the reduction of
NaNO2 on Cu (111).
Detection of hydroxylamine with another analytical technique such as IC
was not technically feasible due to the chemically decomposition of
hydroxylamine in alkaline media in the presence of oxygen as described
by Hughes et al. 101.
Figure 2.7: Potential dependent absorbance spectra for the reduction of 10
mM NaNO2 on Cu (100) (left panel) and on Cu (111) (right panel) electrode in
0.1 M NaOH solution. Reference spectrum recorded at +0.35 V vs. RHE.
Potential step is 0.05V.

Chapter 2 | Electroreduction of nitrate on copper electrodes
43
2.3.2 Nitrate reduction in acidic media
In order to investigate the pH dependence of nitrate reduction, 32, 38,
90cyclic voltammetry, OLEMS and FTIR measurements were performed
in 0.1 M HClO4 solution on both Cu (111) and Cu (100).
2.3.2.1 CV and RDE data
Fig.2.8 displays the cyclic voltammograms recorded for Cu (111) and Cu
(100) in a 0.1 M HClO4 solution. There is a significant dependence of the
profile of the CV on the surface orientation of the copper electrode. In
the absence of nitrate, Cu (111) is the more active surface for HER, as in
alkaline media, starting at -0.4 V on Cu (111) and at -0.5 V on Cu (100).
In the presence of nitrate, the onset potential for nitrate reduction in
acidic media seems to be rather similar, around +0.2 V vs. RHE, for both
copper surfaces. On both electrodes the cathodic current reaches a
diffusion limited plateau at around -0.1 V. At Cu (111) the current drops
drastically to a value close to zero at -0.3 V to eventually increase again
at -0.4 V due to the hydrogen evolution reaction. The voltammogram for
Cu (100) appears to show two waves with an inflection feature at
around 0 V. The cathodic current reaches a plateau at around -0.2 V with
the same current density as the plateau obtained on Cu (111), ca. -4.5
mA/cm2. CVs recorded on Cu (100) show diffusion limited currents that
depend on the rotation rate, following the Levich equation. From the
slope of the Levich plot, the number of electrons involved in the process
was calculated to be close to 5. From the reduction of NO3-, a 5e- transfer
process would suggest formation of N2. However, OLEMS measurements
showed the absence of nitrogen formation, with the only volatile
product being NO, as shown in Fig.2.9. Cu (111) reaches the same
diffusion-limited current at -0.2 V, but becomes poisoned at ca. -0.3 V,
probably due to the blockage of the surface by adsorbed hydrogen.

44
Figure 2.8: Cyclic voltammetry recorded at Cu (111) (blue curve) and Cu
(100) electrodes (green curve) in 0.1M HClO 4 in the absence (dashed line) and
presence (solid line) of NaNO3. Experimental conditions: scan rate 50 mV/s;
rotation rate 400rpm; [NaNO3] = 2 mM
Cyclic voltammograms recorded on Cu (111) and on Cu (100) in a 0.1 M
HClO4 solution containing 2mM NaNO3, as a function of the cycle
number, are plotted in Fig. 2.10. The evolution of the CVs differs
between the two surfaces. On Cu (111) (right panel) the features a, b
and c give rise to a more negative currents with increasing number of
cycles, and the decay in current observed at -0.3 V in the first cycle is
shifted to more positive potentials in subsequent scans. On Cu (100),
there is no strong effect of repeated cycling and no deactivation. In line
with the greater extent of deactivation of Cu (111) in alkaline media, in
acidic media Cu (111) also shows a much stronger deactivation than Cu
(100) for the reduction of NO3-. However, the CV on Cu (111) shows no
deactivation if the negative potential limit is kept above -0.2 V (see
Fig.2.11), suggesting that the cause of the deactivation is adsorbed
hydrogen. As mentioned above, the deactivation of Pt electrode during
nitrate reduction has also been suggested to be related to the formation
of Hads.24

Chapter 2 | Electroreduction of nitrate on copper electrodes
45
Figure 2.9: Mass fragments associated with various products measured with
OLEMS for the reduction of 10 mM NaNO 3 in 0.1 M HClO4 solution on a Cu
(100) electrode. Scan rate = 1mV/s
Figure 2.10: Cyclic voltammetry recorded at a) Cu (100) and b) Cu (111)
electrodes in 0.1 M HClO4 in the presence of 2 mM NaNO3 as a function of the
number of cycles. Experimental conditions: scan rate 50 mV/s; rotation rate
400rpm.
-8
-6
-4
-2
0
j / m
A c
m-2
-0.6 -0.4 -0.2 0.0 0.2-0.6 -0.4 -0.2 0.0 0.2
E vs RHE / V
-6
-4
-2
0
ab
c
a) b)
Cu 100 Cu 111
cycle 1 cycle 5 cycle 10 cycle 15 cycle 20
cycle 1 cycle 5 cycle 10 cycle 15 cycle 20
70x10-12
60
50
40
30
Cu
rre
nt
/ a
.u.
-0.4 -0.2 0.0 0.2
E vs RHE / V
15x10-12
10
5
0
N2
NO
m/z=28
m/z=30

46
2.3.2.2 FTIR spectroscopy
With the aim to elucidate possible adsorbates or intermediates of the
reaction, FTIR measurements were carried out on both copper
electrodes in 0.1 M HClO4 solution. Fig.2.12 shows the potential
dependent absorbance spectra with respect to the reference potential of
+0.35 V. The FTIR spectra indicate that the onset potential for nitrate
reduction in acidic media is +0.15 V for Cu (100) and +0.1 V for Cu (111)
as shown by the negative bands at 1270 cm-1 associated with the
consumption of nitrate94. These values of the onset potential are in
agreement with the values observed with cyclic voltammetry (see
Fig.2.8). Interestingly, the band corresponding to nitrite is not present in
the spectra, probably because of the fast conversion of nitrite into NO in
acidic media, and subsequent reduction of NO to ammonium24, 89. N-O
stretching bands corresponding to adsorbed NO are present in the
-2000
-1500
-1000
-500
0
I / uA
0.30.20.10.0-0.1-0.2
E vs RHE / V
Scan 1 Scan 5 Scan 10 Scan 15 Scan 20
Cu (111)
Figure 2.11: Cyclic voltammetry recorded at a Cu (111) electrode in 0.1 M
HClO4 in the presence of 2 mM NaNO3 as a function of the number of cycles.
Experimental conditions: scan rate 50 mV/s; rotation rate 400rpm.

Chapter 2 | Electroreduction of nitrate on copper electrodes
47
spectra of both electrodes. On Cu (111), the band appears at 1627 cm-1
102 and on Cu (100) the band appears at 1617 cm-1 103. The onset
potential for the formation of NO is difficult to estimate, since the small
NO band is hidden in a fluctuation of the baseline of the spectra due to
changes in the thin layer. Both copper surfaces show a positive band at
1460 cm-1 corresponding to NH4+.94 Ammonium formation starts around
+0.1 V vs. RHE for both copper orientations. These observations are
consistent with the results by Bae et al.90, 95 , who reported the formation
of NO and ammonium for the reduction of nitrate on copper.
Figure 2.12: Potential dependent absorbance spectra for the reduction of 10
mM NaNO3 on Cu (100) (left panel) and on Cu (111) (right panel) electrode in
0.1 M HClO4 solution. Reference spectrum recorded at 0.35 V vs. RHE.

48
2.3 General discussion
From the above results, we conclude that there are both structural and
pH effects for nitrate reduction on copper single-crystal electrodes. We
summarize the relevant reaction steps and observed products and
intermediates in Fig.2.13.
In alkaline media, Cu (111) reduces NO3- to NO2
- at lower overpotentials
than on Cu (100). However, Cu (100) reduces NO2- further to NH2OH
with a considerably higher rate than Cu (111), reaching almost perfect
diffusion limitation. Nitrite is observed as an intermediate of the
reaction on both surfaces, but no other volatile or surface-adsorbed
intermediates have been identified. Both Cu (100) and Cu (111) suffer
from inhibition and deactivation by the concurrent hydrogen adsorption
reaction. We attribute the deactivation to adsorbed hydrogen since it is
not observed if the potential remains at values at which the HER does
not occur. Cu (111) is more sensitive to this inhibition/deactivation than
Cu (100) because the hydrogen evolution reaction is more active on Cu
(111) and Cu (100), both in acidic and alkaline media. The higher
activity of Cu (111) for HER as compared to Cu (100) is in agreement
with recent theoretical predictions by Santos et al104.
In acidic media, Cu (100) reduces NO3- to HNO2 at slightly lower
potential than Cu (111). In acid media HNO2 forms NO in solution89
leading to NOads on both Cu surfaces, which in turn is reduced to
ammonium at roughly the same potential. The reduction of nitrate on Cu
(100) is diffusion limited as in alkaline media, but the reduction does
not seem to correspond to a single product. Irreversible deactivation is
observed on Cu (111) in acidic media, due to the concomitant HER and
the related formation of adsorbed hydrogen.
These results demonstrate that the most suitable copper surface for
nitrate reduction is the Cu (100) surface, in terms of its activity, its
ability to reduce nitrate to an interesting product (hydroxylamine) in
alkaline media, and for its smaller tendency to deactivate due to its

Chapter 2 | Electroreduction of nitrate on copper electrodes
49
lower HER activity compared to Cu (111). Remarkably, the final product
of nitrate reduction appears to be pH sensitive: ammonia in acidic
media, hydroxylamine in alkaline media.
Figure 2.13: Proposed mechanism for nitrate reduction on copper single
crystals in a) acidic media and b) alkaline media.
2.4 Conclusions
Electrocatalytic reduction of nitrate on Cu single crystals has been
investigated by electrochemical methods coupled with in situ and online
analytical techniques, showing that the reduction of nitrate on copper
single crystals is sensitive to both surface structure and pH. In alkaline
media, Cu (111) reduces nitrate to nitrite at slightly lower potentials
than Cu (100), but Cu (100) performs much better in reducing nitrite
further to hydroxylamine. In acidic media, there are some differences in
the CV profiles, but both copper electrodes give the same intermediates
and products: NO, NOads and NH4+. In addition, deactivation of Cu (111)
during the reduction of nitrate or nitrite has a larger effect than on Cu
(100), in both alkaline and acidic electrolytes studied. The nature of the
deactivation is presumably due to the formation of Hads and the
difference between the extent of deactivation of the two surfaces can be

50
related to the higher hydrogen evolution activity of the Cu (111)
electrode. Therefore, nitrate reduction on copper is a pH dependent
reaction, forming NO and NH4+ when an acidic electrolyte is used, and
NO2- and NH2OH when the electrolyte is alkaline

Chapter 3
Structure-sensitive electroreduction of acetaldehyde to ethanol on
copper and its mechanistic implications for CO and CO2
reduction
Ethanol is a highly desirable product of the electrochemical
reduction of CO and/or CO2 on copper. Although ethanol and
ethylene share common intermediates at the early stages of CO/CO2
reduction to C2 species on copper, the pathways bifurcate and most
copper surfaces favor the formation of ethylene. We present here a
combined experimental-computational study of the electroreduction
of acetaldehyde to ethanol on Cu(111), Cu(100) and Cu(322). The
experiments show structure-sensitive onset potentials for
acetaldehyde reduction such that lower overpotentials are observed
for more open facets (η322 < η 100 < η 111). Our DFT calculations
show that the electrochemical reduction of acetaldehyde proceeds
via a CH3CH2O* intermediate on the three electrodes at high *H
coverage, and that the stability of this weakly bound intermediate
determines the onset potential. Our results suggest that during the
late stages of CO/CO2 reduction to C2 species on copper, ethanol
formation has higher energetic barriers than ethylene formation,
and hence the selectivity is inclined towards the latter. Importantly,
our results suggest that the barriers for ethanol formation can be
lowered by making use of its structure sensitivity.
This chapter has been published as: I Ledezma-Yanez, E Pérez-Gallent, MTM
Koper, F Calle-Vallejo, Catalysis Today, 2016, 262, 90-94

52
3.1 Introduction
It is well known that CO and CO2 can be reduced electrochemically to
useful products. The seminal works of Hori and co-workers pointed out
that copper is a unique catalyst for electrochemical CO2 reduction 105-106,
as it is able to produce methane, ethylene and ethanol in different
proportions depending on the electrode potential and morphology.
However, substantial overpotentials and low Faradaic efficiencies
prevent the widespread use of electrolyzers based on copper
electrocatalysts. Currently, the challenges are, first of all, to achieve a
thorough understanding of the intricate multielectron reaction
mechanism, and secondly, to design efficient and selective catalysts
based on such understanding.
The major C2 product on copper is ethylene, while there is a marginal
production of ethanol and traces of acetaldehyde 105-106. There are
several indications that these three products share the same reaction
pathway up to a given key intermediate, the ease of protonation of
which ultimately determines the selectivity 107-108. Given that in the
context of a solar-fuel-based economy ethanol is a highly desirable
product, it is important to understand the mechanistic features of its
formation, as the C2 selectivity is usually inclined towards ethylene
instead of ethanol. However, Kanan and co-workers have shown
recently that the selectivity of copper-based electrocatalysts for CO
reduction can be steered to favor ethanol over ethylene 48, although the
atomic-scale justification for such a change is still unclear.
According to previous work from our group 107-109, acetaldehyde
reduction corresponds to the late stages of the reaction pathway of
ethanol production from CO/CO2. Thus, the study of acetaldehyde
reduction reaction can shed light on the features of copper electrodes
that may favor ethanol production, as well as provide design principles
to devise new catalysts that are selective towards ethanol.

Chapter 3 | Electroreduction of acetaldehyde to ethanol
53
In this chapter, we present a combined experimental/theoretical study
of acetaldehyde reduction, taking into account pH effects and structure
sensitivity. Our findings provide new insights on the reaction
mechanism through which ethanol is produced on copper-based
catalysts and help explain why ethylene is the major C2 product of the
reduction of CO/CO2.
3.2 Experimental
Prior to the experiments, all the glassware was cleaned by boiling in a
sulfonitric solution, which is a mixture of concentrated sulfuric acid and
nitric acid in a 3:1 ratio. After the acid bath, the glassware was rinsed
and boiled five times with ultra-clean water (Milipore® MiliQ;
resistivity >18.2 MΩ).
The electrochemical measurements were carried out using an
METROHM µAUTOLABIII - Compact Design potentiostat connected to
the three-electrode cell. The working electrodes (WE) were bead-type
copper single crystals, with a polishing orientation < 0.5 degrees. These
electrodes were electropolished before each experiment, using 66%
H3PO4 (Suprapur Merck) at 2.3 V vs a Cu counter electrode for 2 s, and in
open circuit potential (OCP) for 30 s. After cleaning and rinsing with
water, the electrode surfaces were characterized by performing four
cycles between -0.25 and 0.35 VRHE, at 50 mV s-1 in 0.1 M NaOH (Sigma–
Aldrich TraceSelect), following the procedure described previously by
Schouten et al on Cu single-crystal characterization 110, see Appendix II,
Figure AII.1. The results show that the electrodes possessed their
distinctive features before the electroreduction experiments. However,
we do not discard H- or OH-induced surface reconstruction under
reaction conditions.
The counter electrode (CE) consisted of a gold wire, while the reference
electrode (RE) was a reversible hydrogen electrode (RHE). All potentials
in this work are reported against the RHE, unless otherwise stated.

54
The experiments were carried out in a solution containing 0.1 M HClO4
(Suprapur Merck) for pH1, and 0.001 M HClO4 + 0.099 M KClO4 (Sigma-
Aldrich TraceSelect) for pH 3. These values of pH are used to guarantee
the stability of acetaldehyde, which is prone to decomposition in
alkaline conditions. All solutions were prepared with ultra-clean water.
Argon (Linde, 6.0) was used as purge gas.
The detection of ethanol from the reduction of 0.1 M acetaldehyde
(puriss. p.a., anhydrous, ≥99.5% (GC) FLUKA) was monitored by means
of online High Performance Liquid Chromatography (HPLC) 111 in a
three-electrode cell containing solutions with pH 1 and 3, prepared as
previously described. The soluble reduction products were detected by
collecting from the solution in the cell using a Teflon tip (0.38 mm in
diameter) by means of a fraction collector (FRC-10A, Shimadzu) during
the voltammetric scan at a scan rate of 1 mV s−1. The tip was positioned
in parallel configuration, approximately 10 μm from the middle of the
electrode surface. The fractions collected were deposited in a 96-well
microtiter plate. The flow rate of sample collection was adjusted to 60
μL min−1 with a Shimadzu pump (LC-20AT). Each of the samples
collected were 60 μL. The well was placed in the autosampler, and 30 μL
of sample was injected in the high-performance liquid chromatography
(HPLC) column. The column used was an Aminex HPX 87-H, Biorad. The
temperature of the column was maintained at 85 °C in an oven (CTO-20
A).
3.3 Computational details
The DFT calculations and thermodynamic modeling in this study have
been performed using the same methodologies used in our previous
work 107. Here we provide a brief description of the methods used: all
adsorption energies were calculated by means of DFT calculations using
the VASP code 112 with the PBE exchange-correlation functional 113 and
the projector augmented wave (PAW) method 114. The (111), (100) and

Chapter 3 | Electroreduction of acetaldehyde to ethanol
55
(322) surfaces of copper were modeled with 4-layer-thick slabs.
Cu(111) and Cu(100) used 3×2 supercells, while Cu(322) is
5(111)×(100) with a 3-atom wide step edge. The vertical separation
between periodically repeated images was more than 16 Å and,
additionally, dipole corrections were applied. The structures were
optimized allowing the adsorbates and the two topmost layers to relax
in all directions, while fixing the 2 bottom layers at the optimized bulk
positions, where the lattice constant is 3.64 Å. The relaxations were
carried out with a plane-wave cut-off of 400 eV, using the conjugate-
gradient scheme until the maximum force on any atom was below 0.05
eV Å-1. The Brillouin zones of the (100) and (111) surfaces were
sampled with 6×8×1 Monkhorst-Pack meshes 115, while a 4×3×1 mesh
was used for the (322) surface. The Fermi level of the surfaces was
smeared using the Methfessel-Paxton method 116 with an electronic
temperature of 0.2 eV, and all energies were extrapolated to T = 0 K.
Acetaldehyde (CH3CHO) and ethanol (CH3CH2OH) were calculated in
boxes of 15 Å ×15 Å × 15 Å, with an electronic temperature of 0.001 eV,
the gamma point only, and Gaussian smearing. The free energies are
estimated from DFT-calculated energies in the following way:
G = EDFT + ZPE – TS (3.1)
The zero-point energies (ZPE) of the adsorbates (see Table 3.1) and
molecules (1.468 and 2.118 eV for CH3CHO and CH3CH2OH) were
calculated from vibrational frequency analysis using the harmonic
oscillator approximation. Vibrational contributions to the entropy were
considered only for adsorbed species and can be found in Table 3.1,
while total entropies for molecules were taken from standard
thermodynamic tables at 298.15 K and 1 bar 117, so that the gas-phase TS
corrections for ethanol and acetaldehyde are 0.870 and 0.815 eV,
respectively. However, ethanol and acetaldehyde are liquid at the
conditions of the experiments carried out here. Although it is normally
difficult to estimate the liquid-phase free energies of substances within
standard DFT, there is a simple thermodynamic workaround 107, 118-119.
Essentially, the substance is simulated in the gas phase and the

56
difference between the free energies of formation of its liquid and gas
phases is added to the gas-phase entropy. Such differences are 0.072 eV
for ethanol and -0.056 eV for acetaldehyde, so that the final TS
corrections are 0.942 and 0.759 eV, respectively. The high-coverage
(HC) situations on the (111), (100) and (322) surfaces contained 5, 5,
and 4 *H coadsorbates around CH3CH2O*/CH3*CHOH.
Table 3.1. ZPE and TSvib contributions at 298.15 K to the free energies of
adsorbates on the (111) and (100) facets of copper. NH: No coardsorbed
hydrogen. HC: High coverage of hydrogen.
Adsorbate ZPE111 ZPE100 ZPE322 TSvib,111 TSvib,100 TSvib,322
*CH3CH2O (NH) 1.837 1.822 1.833 0.304 0.310 0.302
*CH3CHOH (NH) 1.809 1.794 1.821 0.316 0.277 0.213
*CH3CH2O (HC) 2.860 2.487 2.463 0.295 0.394 0.261
*CH3CHOH (HC) 2.820 2.438 2.432 0.320 0.409 0.371
We have added a solvation correction of -0.38 eV to CH3*CHOH due to
the presence of the OH group, making use of the approximations
described elsewhere 107, 120. Finally, we have used the computational
hydrogen (CHE) approach to simulate concerted proton-electron
transfers121. In this approach, the energetics of H2(g) rather than that of
(H++e-) is used as electrochemical reference due to the following
relationship in equilibrium: 122
H e H .

Chapter 3 | Electroreduction of acetaldehyde to ethanol
57
3.4 Results and discussion
The linear sweep voltammetry (LSV) of the three copper single-crystals
shows reduction currents at negative potentials which are mainly due to
hydrogen evolution, see Appendix II, Figure AII.2. To probe the
reduction of acetaldehyde to ethanol, we need to use online HPLC, since
LSV does not show the separated features for acetaldehyde reduction.
Figure 3.1 shows the HPLC results for the electrochemical reduction of
results in more negative onset potentials, as the coordination number is
7 for the step edge on acetaldehyde on three different copper electrodes
and at different pH values. We observe that the onset potential for the
formation of ethanol follows the trend Cu(322) > Cu(100) > Cu(111) for
both values of pH (see also Figure 3.4). This means that increase in
surface coordination the (322) electrode (note that (322) electrodes are
also denoted 5(111)×(100), as they have 5-atom wide (111) terraces
separated by (100) steps), and the coordination numbers are 8 and 9 on
the (100) and (111) terraces, respectively. For instance, at pH 1, the
onsets are located at -0.30 ± 0.03 VRHE, -0.54 ± 0.03 VRHE and -0.78 ± 0.03
VRHE, for the three facets.
Note that the equilibrium potential for this reaction is located at 0.24
VRHE at pH 0, and also that it is generally observed that adsorbates bind
more strongly to undercoordinated facets 122-125. These two
observations suggest that the adsorbed intermediates of the reduction
of acetaldehyde are less stable than acetaldehyde itself under
equilibrium conditions. Thus, the applied potential is used to make their
adsorption thermodynamically and kinetically favorable. Therefore, the
onset of ethanol greatly depends on the stabilization of such
intermediates on the electrode surface. In order to gain further insight
into the reaction mechanism, we have performed DFT calculations on
Cu(111), Cu(100) and Cu(322) in the way described in the
Computational Details section. The two possible adsorbed intermediates
resulting from the transfer of a proton-electron pair to acetaldehyde are
CH3CH2O* and CH3*CHOH. The proposed reduction mechanism in Figure

58
3.2 includes the reactant and the product, namely acetaldehyde and
ethanol, and the most stable adsorbed intermediate, which is CH3CH2O*.
The adsorption energies in the pathway that goes through the other
possible intermediate, CH3*CHOH, are provided in Figure 3.3. As
CH3CH2O* is more stable than CH3CHOH on all facets regardless of the
presence or absence of co-adsorbed H*, in the following we focus only
on the results for CH3CH2O* in Figure 3.2.
Figure 3.1: Concentration of ethanol produced as a function of potential for
the electroreduction of 0.1 M acetaldehyde on three different copper surfaces:
a) Cu(111), b) Cu(100), c) Cu(322). The solutions used are: 0.1 M HClO 4 (pH
1), and 0.001 M HClO4 + 0. 099 M KClO4 (pH 3). Argon atmosphere. Lines
connecting the data points are given as a guide to the eye. An earlier onset of
the reaction is associated to surfaces with lower coordination numbers.
The calculations in Figure 3.2.a, which contain only adsorbed CH3CH2O*
on the slabs, indicate that already at 0 V and in the absence of *H the
reduction of acetaldehyde is thermodynamically favorable on the three
facets under study. However, this is not what we observe
experimentally. In experiments, acetaldehyde reduction takes place in a
high-coverage regime of *H, which is included in Figure 3.2.b. Therefore,
a high-coverage situation is a more realistic approximation to the
experimental environment in which the intermediates of acetaldehyde
-1.6 -1.4 -1.2 -1.0 -0.8 -0.6 -0.4 -0.2 0.0
1.5
2.0
2.5
3.0
-1.6 -1.4 -1.2 -1.0 -0.8 -0.6 -0.4 -0.2 0.0
1.5
3.0
4.5
6.0
pH 1
pH 3
-1.6 -1.4 -1.2 -1.0 -0.8 -0.6 -0.4 -0.2 0.0
1.5
2.0
2.5
3.0
-1.6 -1.4 -1.2 -1.0 -0.8 -0.6 -0.4 -0.2 0.0
1.5
3.0
4.5
6.0
pH 1
pH 3
E / VRHE
c) Cu(322), cn = 7b) Cu(100), cn = 8a) Cu(111), cn = 9
Eth
an
ol co
ncen
trati
on
/ m
M
-1.6 -1.4 -1.2 -1.0 -0.8 -0.6 -0.4 -0.2 0.0
1.5
2.0
2.5
3.0
-1.6 -1.4 -1.2 -1.0 -0.8 -0.6 -0.4 -0.2 0.0
1.5
3.0
4.5
6.0
pH 1
pH 3

Chapter 3 | Electroreduction of acetaldehyde to ethanol
59
reduction (CH3CH2O*) compete with those of hydrogen evolution (*H)
for active sites at copper surfaces.
Figure 3.2: Electrochemical reduction of acetaldehyde (CH3CHO) to ethanol
(C2H5OH) on various facets of copper at 0 V: Cu(111) (green, cn = 9), Cu(100)
(violet, cn = 8) and Cu(322) (red, cn =7). The pathways proceed via CH3CH2O*
(see the inset). a) With no *H coverage. b) With high *H coverage.
The observed effect of hydrogen coadsorption on all facets is a
weakening of the metal-adsorbate interactions, which ultimately results
in predicted onset potentials which are far from the equilibrium
potential: -0.28 V for Cu(322), -0.45 V for Cu(100) and -0.82 V for
Cu(111), in very reasonable agreement with experiment. Note in
passing that Peterson and co-workers have studied the opposite effect,
namely the effect of *CO coverage on hydrogen evolution and found that
it systematically weakens the adsorption energies of *H on various
metals 126. Therefore, the coadsorption of *H and *CO weakens the
adsorption energies of both species.

60
Figure 3.3: Electrochemical reduction of acetaldehyde (CH 3CHO) to ethanol
(C2H5OH) on various facets of copper at 0 V: Cu(111) (green, cn = 9), Cu(100)
(violet, cn = 8) and Cu(322) (red, cn =7). The pathways proceed via CH 3*CHOH
(see the inset). a) With no *H coverage. b) With high *H coverage.
According to Figure 3.2.b and in line with the experimental observations
in Figure 3.1, the adsorption energies of CH3CH2O* at 0 V are higher than
the energetic levels of acetaldehyde and ethanol on all facets. This
means that the first proton-electron transfer is uphill in energy, while
the second one is downhill. Thus, the predicted onset potentials on all
facets in Figure 3.2.b correspond to the energy difference between
acetaldehyde and the adsorbed intermediates.
As observed in the experiments in Figure 3.1, copper facets with lower
coordination numbers exhibit less negative onset potentials, which can
be intuitively understood as follows: in general, it is observed that
adsorbates are more strongly bound to undercoordinated sites 122-125,

Chapter 3 | Electroreduction of acetaldehyde to ethanol
61
which implies that the step edge on the (322) facet, where the
coordination number is 7, will display more negative adsorption
energies for CH3CH2O* compared to the (100) and (111) facets, where
the coordination numbers are 8 and 9, respectively. Since these
endothermic adsorption energies are more positive than the level of
acetaldehyde (see Figure 3.2), stronger adsorption energies imply
earlier onset potentials. In summary, our high-coverage DFT
calculations confirm the structure-sensitive reduction of acetaldehyde
to ethanol observed experimentally, and show that the mechanism
proceeds on the three facets via CH3CH2O*, which becomes more stable
as the coordination of the adsorption sites is decreased. The
calculations also show the importance of considering the co-adsorption
of H* in reaching good agreement with experiments. We have
summarized the experimental and theoretical trends in Figures 3.1, 3.2
and 3.3 in Figure 3.4. This figure contains the adsorption energies of
CH3CH2O* and CH3*CHOH with and without coadsorbed *H and the
additive inverse of the experimental onset potentials which, according
to the results in Figure 3.1, corresponds to experimental free energy of
adsorption of the adsorbed intermediate of acetaldehyde reduction.
3.5 Mechanistic implications
It is important to discuss the mechanistic implications of our
observations for the reduction of CO/CO2 to ethanol and other C2
products such as ethylene. We have previously proposed the mechanism
shown in Figure 3.5 for the reduction of CO to C2 species on Cu(100) on
the basis of DFT calculations 107. In that mechanism, ethanol,
acetaldehyde and ethylene share the same intermediates up to the fifth
proton-electron transfer, which is supported by the experiments of Hori
and coworkers, who observed that the nature of the metallic cations
from the electrolyte affects similarly the Faradaic efficiencies of
ethylene and ethanol production 65.

62
Figure 3.4: Experimental (● , ■) and theoretical (►, ◄, ▲, ▼) trends in
adsorption energies of the adsorbed intermediates of acetaldehyde reduction
as a function of the coordination number of the active sites on Cu(322) (step
edge, cn = 7), Cu(100) (cn = 8), and Cu(111) (cn = 9).
The product of the fifth proton-electron transfer is the “selectivity-
determining” intermediate (SDI in Figure 3.5). The sixth proton-electron
transfer favors the formation of ethylene (orange pathway in Figure 3.5)
over acetaldehyde (grey pathway in Figure 3.5) at the onset of ethylene
formation, that is at -0.4 VRHE 107. The results in Figures 3.1 and 3.2
indicate that the onset of acetaldehyde reduction to ethanol requires -
0.54 VRHE on Cu(100) (-0.45 V from DFT calculations). Such onset for the
formation of ethanol from acetaldehyde is in contrast to previous
experimental and theoretical results on the reduction of ethylene oxide
to ethylene on polycrystalline copper, the onset of which is less negative
than -0.4 VRHE (-0.35 V from the backward scan in experiments and -0.33
V from DFT calculations on Cu(100)) 107, 109. Unlike acetaldehyde
reduction, the potential-determining step for ethylene oxide reduction is
the second proton-electron transfer, which implies that desorption of
adsorbed intermediates limits the onset of the reaction. In the case of a

Chapter 3 | Electroreduction of acetaldehyde to ethanol
63
desorption-limited reaction, structure sensitivity affects the trends in
onset potentials differently: undercoordinated sites binding adsorbates
more strongly increase the onset potential.
The conjunction of the findings for ethylene oxide and acetaldehyde
reduction suggests that, although ethylene and ethanol share common
intermediates in the early stages of CO/CO2 reduction, the protonation
of the SDI favours ethylene formation compared to ethanol formation on
Cu(100). Importantly, we have shown here that undercoordinated sites
at stepped surfaces are able to lower those barriers by virtue of their
stronger adsorption energies. Step sites, on the other hand, affect
adversely the production of ethylene on Cu(100).
Figure 3.5: Mechanism of the electrochemical reduction of CO on copper to C 2
species on Cu(100), adapted from ref. 107. The pathways for the production of
acetaldehyde, ethanol and ethylene are identical up to the fifth proton -
electron transfer (blue arrows). The rate-determining step (RDS at -0.40 V) is
the first proton-electron transfer and CH2CHO* is the selectivity-determining
intermediate (SDI). Protonation of the SDI on the -C requires -0.45 V and
leads to acetaldehyde and ethanol (grey arrows). Protonation on the -C
requires -0.33 V and leads to ethylene and water (orange arrows). On Cu(100)
the protonation of the SDI is inclined towards the ethylene pathway (orange
arrows).

64
3.6 Conclusions
Elucidation of the reaction mechanism of CO/CO2 reduction to C2 species
is not trivial, as it involves the transfer of several proton-electron pairs
and numerous adsorbed intermediates. A possible way of simplifying
the problem is to analyze separate reactions involving fewer proton-
electron transfers. In that vein, we have considered here the structure-
sensitive reduction of acetaldehyde to ethanol on copper, which
corresponds to the late stages of CO/CO2 reduction to ethanol. Our
results suggest that ethanol formation is more favourable on open
copper surfaces, which is explained by the preference of CH3CH2O* for
undercoordinated sites. Therefore, a plausible way of inclining the
selectivity of copper electrodes towards the formation of ethanol from
CO/CO2 is the use of undercoordinated square sites: square ensembles
because they catalyze the formation of C-C bonds, and undercoordinated
sites because they incline the selectivity towards ethanol instead of
ethylene.

Chapter 4
Spectroscopic Observation of a Hydrogenated CO Dimer
Intermediate During CO Reduction on Cu(100) Electrodes
Carbon dioxide and carbon monoxide (CO) can be electrochemically
reduced to useful products such as ethylene and ethanol on copper
electrocatalysts. The process is yet to be optimized and the exact
mechanism and the corresponding reaction intermediates are under
debate or unknown. In particular, it has been hypothesized that the
C-C bond formation proceeds via CO dimerization and further
hydrogenation. Although computational support for this hypothesis
exists, direct experimental evidence has been elusive. In this work,
we detect a hydrogenated dimer intermediate (OCCOH) using
Fourier transform infrared spectroscopy at low overpotentials in
LiOH solutions. Density functional theory calculations support our
assignment of the observed vibrational bands. The formation of this
intermediate is structure sensitive, as it is observed only during CO
reduction on Cu(100) and not on Cu(111), in agreement with
previous experimental and computational observations.
This chapter has been published as: E Pérez‐Gallent, MC Figueiredo, F Calle‐
Vallejo, MTM Koper, Angewandte Chemie, 2017, 129 (13), 3675-3678

66
4.1 Introduction
A considerable number of experimental observations as well as density
functional theory (DFT) calculations have established that CO2 and CO
reduction on copper electrodes forms C1 and C2 products through
different reaction pathways.47, 49-50, 52, 57 The formation of C1 and C2
products has been shown to be highly sensitive to copper surface
structure and electrolyte pH.51, 59, 61, 63-64, 91, 127 Hori et al61 showed that
the CO to CH4 reduction follows a concerted proton-electron transfer
mechanism, in stark contrast with C2H4 production, the rate-limiting
step of which is not sensitive to pH and only involves an electron
transfer. As a result, on the pH corrected RHE reference scale, the
formation of ethylene from CO depends on pH while that of CH4 does
not.61, 63 Furthermore, Schouten et al. showed that C2H4 formation takes
place preferentially at Cu(100) electrodes without simultaneous CH4
formation, which indicates that the reaction paths towards CH4 and C2H4
must bifurcate in the early stages of CO reduction.61 Specifically, a C2
intermediate that requires only electron transfer to be formed, namely a
negatively charged CO dimer, has been proposed as the first C-C coupled
intermediate.49, 51, 53 Various recent computational works have studied
the structural sensitivity of this intermediate, and concluded that the
formation of the dimer is indeed favored both thermodynamically and
kinetically on Cu(100) sites compared to Cu(111).53-54, 58
However, there is still no direct experimental evidence that proves CO
dimerization in aqueous solution during CO reduction on copper
electrodes, and the existence of the dimer is mostly a logical deduction
from experimental and computational results. In this chapter, we
provide experimental evidence for the formation of a hydrogenated CO
dimer (OCCOH) at low overpotentials during CO reduction on Cu(100)
electrodes in LiOH solution, employing in situ Fourier transform
infrared spectroscopy (FTIR), and support our interpretation by
detailed DFT calculations.
Chapter 4 | Spectroscopic observations of a hydrogenated CO dimer
67
4.2 Experimental
Prior to each electrochemical experiment, the glassware used was
stored overnight in a solution of KMnO4 that was rinsed with a mixture
of ultra clean water (Millipore MilliQ, resistivity > 18.2 MΩ), 20 ml/l of
hydrogen peroxide and 1 ml/l of concentrated sulfuric acid. The
glassware was further cleaned by boiling 4 times in Millipore MilliQ
water. A coiled platinum wire was used as counter electrode and a
reversible hydrogen electrode (RHE) in the same electrolyte was used
as reference electrode.
The copper electrodes used were 99.99% copper disks with a diameter
of 6mm, purchased from Mateck and aligned to < 0.5° accuracy. Prior to
every experiment, the electrodes were electropolished and
characterized as described elsewhere.91
The electrolytes were made from ultra-pure water (Millipore MilliQ,
resistivity > 18.2 MΩ) and high purity reagents (Sigma Aldrich
TraceSelect). Before every experiment, Argon (Linde, 6.0) was bubbled
through the electrolyte for 15 minutes in order to remove air from the
solution, and during the experiments argon was kept flowing above the
solution.
FTIR measurements were performed with a Bruker Vertex 80 V Infrared
spectrophotometer.128 The electrochemical cell was assembled on top of
a 60° CaF2 prism, and the electrode was situated against this prism to
form a thin layer. The measurements were performed under external
reflection. FTIR spectra were obtained from an average of 100 scans
with a resolution of 8 cm-1 at the selected potentials. Every spectrum
was obtained by applying single potential steps compared to the
reference potential (+0.1 V). The spectra are shown as (R-R0)/R0 where
R is the reflectance at the sample potential and R0 is the reflectance at
the reference potential. Thereby the ratio ΔR/R0 gives positive bands for
the formation of species at the sample potential, while negative bands
correspond to the loss of species at the sample potential. P-polarized

68
light was used to probe species both near the electrode surface and in
solution.
The vibrational frequencies were calculated by means of DFT
calculations using the VASP code112 with the PBE exchange-correlation
functional113 and the projector augmented wave (PAW) method.114 The
Cu(100) surfaces were modelled with (3×2) 4-layer-thick slabs. The
vertical separation between periodically repeated images was more
than 16 Å and dipole corrections were applied. The structures were
optimized allowing the adsorbates and the two topmost layers to relax
in all directions, while fixing the 2 bottom layers at the optimized bulk
positions. The relaxations were carried out with a plane-wave cut-off of
450 eV, using the conjugate-gradient scheme until the maximum force
on any atom was below 0.05 eV Å-1. The Brillouin zones were sampled
with 6×8×1 Monkhorst-Pack meshes.115 The Fermi level of the surfaces
was smeared using the Methfessel-Paxton method116 with an kBT = 0.2
eV, and all energies were extrapolated to 0 K.
The vibrational frequency analysis was made using the harmonic
oscillator approximation with two displacements in each direction plus
the ground state.
4.3 Results and discussion
Figure 4.1 shows the potential-dependent absorbance spectra of
Cu(100) in 0.1 M LiOH solutions in Argon atmosphere (Fig.4.1a, left
panel) and in CO atmosphere (Fig.4.1b, right panel). The reference
spectrum is taken at +0.1 V and additional spectra are provided for
+0.05, 0.00, -0.05, -0.10, -0.15 and -0.2 V (all reported potentials are on
the RHE scale). First of all, in Argon atmosphere the absorption spectra
do not display any bands. After CO is bubbled through the solution,
three bands appear at 1677, 1600 and 1191 cm-1. The band at 1600 cm-1
corresponds to the O-H bending mode of H2O. This band causes
fluctuations in the baseline of the spectra making it difficult to identify

Chapter 4 | Spectroscopic observations of a hydrogenated CO dimer
69
other bands in this wavenumber range. The band at 1677 cm-1
corresponds to the C=O stretching129-131 of CO adsorbed on hollow sites
on Cu(100), in agreement with DFT calculations (see Figure 3 below).
The intensity of the band for CO at multi bonded sites increases with
more negative electrode potential. In alkaline media, the absolute
potential (on the SHE scale) is more negative compared to acidic
conditions and, consequently, the band for CO at multifold sites
dominates the spectra.132-135
Simultaneously with the CO-related band, a band at 1191 cm-1
associated with C-OH stretching136 grows in the spectra.
Ab
so
rba
nce
/ a
.u.
1400 1300 1200
wavenumber / cm-1
Cu (100) , 0.1 M LiOH , Ar atmosphere
0.0005 a.u.
+0.1 V
+0.05 V
0 V
-0.05 V
-0.1 V
-0.15 V
-0.2 V
a)
Ab
so
rba
nce
/ a
.u.
2000 1800 1600 1400 1200
wavenumber / cm-1
+0.1 V
+0.05 V
0 V
-0.05 V
-0.1 V
-0.15 V
-0.2 V
1677 cm-1
1600 cm-1
1191 cm-1
Cu (100) , 0.1 M LiOH , 12
CO atmosphere
0.0005 a.u.
b)
Figure 4.1: . Potential-dependent absorbance spectra for Cu(100) in the a)
absence and b) presence of CO in a 0.1 M LiOH solution. Reference spectrum
recorded at +0.1 V vs. RHE. Highlighted bands and their corresponding
frequencies are indicated with a vertical line at 1191 cm-1 for 12C-OH
stretching, 1145 cm-1 for 13C-OH stretching, 1677 cm -1 for C=O stretching
and 1600 cm-1 for O-H

70
Importantly, when CO reduction was performed under the exact same
conditions on a Cu(111) electrode (see Appendix III, Figure AIII.1), the
band at 1191 cm-1 and the band corresponding to C=O stretching at
1677 cm-1 were not observed. In order to ensure that the band at 1191
cm-1 comes from a C-containing species, both the blank spectrum and a
spectrum taken with isotopically labeled carbon 13CO were recorded.
Figure 4.1a shows the absorbance spectra on Cu(100) without CO. The
absence of the band at 1191 cm-1 strongly suggests that the signal
appearing in CO atmosphere comes from a C-containing species.
Moreover, when the absorbance spectra were obtained in 13CO
atmosphere (see Figure 4.2, left panel), the band shifts from 1191 cm-1
to 1145 cm-1. The shift of approximately 45 cm-1 matches the expected
shift for the absorption spectra of 13C compared to 12C,137 confirming
that the band at 1191 cm-1 comes from a C-containing species.
As mentioned before, water exhibits a wide O-H bending band in the
1650-1450 cm-1 range, which prevents the straightforward observation
of vibrations from other species in this wavenumber range. For this
reason, CO reduction on Cu(100) was performed in D2O; the
corresponding spectra are shown in Figure 4.2b (right panel). In D2O
electrolyte, the range of 1650-1450 cm-1 is free of water bands, allowing
for the identification of additional bands. Unfortunately, D2O has an O-D
bending band at 1209 cm-1 masking the C-OH stretching band.
Interestingly, Figure 4.2b shows that in D2O electrolyte at +0.05 V and
more negative potentials a band appears around 1584 cm-1, which
corresponds to a C=O stretch but is not adsorbed CO.

Chapter 4 | Spectroscopic observations of a hydrogenated CO dimer
71
From the combined results of the experiments in H2O and D2O, we
observe two vibrational bands coming from C-containing species that
are formed at low overpotentials on Cu(100) only. It is important to
note that at the low overpotentials considered in our experiments,
namely +0.1 to -0.15 V, no products are observed (for instance, the
earliest onset potential on Cu(100) is that of C2H4 at -0.4 V).59, 138 Thus,
the bands in question should, in principle, be assigned to vibrations of
adsorbed intermediates of CO reduction rather than to species in
solution. To verify this hypothesis, we have scrutinized the IR spectra of
Ab
so
rba
nce
/ a
.u.
1400 1300 1200
wavenumber / cm-1
Cu (100) , 0.1 M LiOH , 13
CO atmosphere
1145 cm-1 0.0005 a.u.
+0.1 V
+0.05 V
0 V
-0.05 V
-0.1 V
-0.15 V
a)
Ab
so
rba
nce
/ a
.u.
1800 1700 1600 1500 1400
wavenumber / cm-1
+0.1 V
+0.05 V
0 V
-0.05 V
-0.1 V
-0.15 V
-0.2 V
0.0005 a.u.
Cu (100) , 0.1 M LiOH in D2O , 12
CO atm.
1584 cm-1
b)
Figure 4.2: Potential dependent absorbance spectra for Cu (100) in the
presence of a) 13CO (left) and with b) D2O as electrolyte (r ight) in a 0.1 M
LiOH solution. Reference spectrum recorded at +0.1 V vs. RHE. Highlighted
bands and their corresponding frequencies are indicated with a vertical line
at 1191 cm-1 for 12C-OH stretching, 1145 cm-1 for 13C-OH stretching and
1584 cm-1 for 12C=O stretching.

72
various possible species in solution, including various C1 and C2 species.
Transmission spectra of species in solution such as formaldehyde,
formate and methanol (C1 molecules), and acetaldehyde and acetic acid
(C2 molecules) were recorded, shown in Appendix III, figure AIII.2. The
absence of the bands at 1191 and 1584 cm-1 in the transmission spectra
rules out the possibility that the bands observed during the reduction of
CO on Cu(100) correspond to these species in solution. Although
methanol has a C-OH vibration at 1195 cm-1 in 0.1 M LiOH, the vibration
at 1584 cm-1 is absent (see Appendix III, figure AIII.2c) and its
substantially negative onset potential (-0.95 V50) precludes the presence
of methanol at the low overpotentials at which this work was performed
(+0.1 to -0.15 V). The transmission spectra of acetaldehyde also displays
a band at 1195 cm-1, however, this band is associated with the C-OH
stretching from the methanol present in the acetaldehyde solution as a
stabilizer. In addition, acetaldehyde presents other two bands at 1712
and 1666 cm-1. The absence of these bands in the spectra obtained
during CO reduction rules out the possibility of acetaldehyde as a
product. Another compound that could have vibrational frequencies
close to those in Figures 1 and 2 is acetylenediol (HOC≡COH). Maier et
al collected the infrared spectra of this double alcohol139 and reported a
single C-OH stretching band at 1212 cm-1.
Having verified that the observed bands at 1191 and 1584 cm-1 do not
correspond to species in solution, we now resort to DFT calculations to
see whether a given adsorbed intermediate or a combination of them
exhibit such bands. Since both CH4 and C2H4 production from CO possess
relatively early rate-limiting steps57, 140-141, we have limited our analysis
to C1 and C2 species with no or a low content of hydrogen atoms (see
Figure 4.3). First, consider the C1 species CHO and COH (Figure 4.3b-c),
which are the two possible products of the first hydrogenation of CO.
They both have bands close to the band observed during the
adsorption/reduction of 12CO on Cu(100) at 1191 cm-1 (Figure 4.1b,
right panel), but none of them exhibit the additional vibrational band at
1584 cm-1 (Figure 4.2, right panel). The same is true for the CO dimer
(OCCO, Figure 4.3d), which presents a vibrational band at 1200 cm-1 but

Chapter 4 | Spectroscopic observations of a hydrogenated CO dimer
73
does not exhibit a band around 1584 cm-1. Besides, a lithiated dimer
(Figure 4.3e) features two C-O stretching frequencies that are not close
to either of the bands at 1191 and 1584 cm-1. Conversely, a CO dimer in
which one of the oxygen atoms has been hydrogenated (OCCOH, Figure
4.3f) exhibits bands close to both experimental bands. In addition, we
have calculated the vibrational signatures of a CO dimer of which one of
the carbon atoms has been hydrogenated (OCCHO, Figure 4.3g). This
adsorbate has vibrational bands around 1313, 1200,1071 cm-1 but no
band close to 1584 cm-1. Adsorbed acetylenediol, namely a doubly
hydrogenated CO dimer (HOCCOH, Figure 4.3h) was also considered in
our DFT calculations. The predicted vibrational frequencies for C-OH
stretching are 1397,1229 and 1150 cm-1. We also considered a
simultaneously hydrogenated and lithiated dimer (HOCCOLi) and its
vibrational frequencies were found at 1427 and 1246 cm-1. Finally, a
doubly lithiated dimer (LiOCCOLi) possesses C=O stretching
frequencies at 1329 and 1261 cm-1.

74
Therefore, we conclude that the bands at 1191 and 1584 cm-1 arise from
C-O-H and C-O stretching vibrations and correspond, in the simplest
case, to a hydrogenated dimer (OCCOH), or in general to this adsorbate
in combination with other C1 and C2 adsorbates. This is in line with
previous computational works showing that OCCOH is the most stable
intermediate formed after the first hydrogenation of CO on Cu(100).53.
In Chapter 5 we performed further experiments and calculations to
examine the influence of various alkaline cations on CO dimerization
and their impact on the CO reduction pathway.
Figure 4.3: Schematic structures of possible adsorbed intermediates on
Cu(100) and their calculated infrared-active vibrational frequencies in the
1100-1600 cm-1 wavenumber region. Cu, C, O, and H atoms are depicted as
orange, gray, red and white spheres

Chapter 4 | Spectroscopic observations of a hydrogenated CO dimer
75
4.4 Conclusion
In conclusion, we have shown experimentally that Cu(100) electrodes in
LiOH solutions host a C-containing adsorbate at low overpotentials with
vibrational bands at 1191 and 1584 cm-1. Based on DFT calculations of a
wide variety of C1 and C2 intermediates, we ascribe these bands to the C-
O-H and C=O stretching modes of a hydrogenated CO dimer (OCCOH).
These results provide for the first time direct confirmation of an
important hypothesis in the electrocatalysis of CO2 reduction on copper,
namely that the C-C coupling to C2 species on Cu(100) takes place
through a reductive dimerization step at the early stages of the reaction
mechanism. The fact that the vibrational features ascribed to the CO
dimer could not be observed on Cu(111) under identical conditions
confirms that CO dimerization is a structure-sensitive process favored
by sites with square symmetry, in agreement with previous
experimental64 and theoretical studies.54


Chapter 5 Structure and potential dependent
cation effects on CO reduction at copper single crystal electrodes
The complexity of the electrocatalytic reduction of CO to CH4 and C2H4 on
copper electrodes prevents a straightforward elucidation of the reaction
mechanism and the design of new and better catalysts. Although structural
and electrolyte effects have been separately studied, there are no reports on
structure-sensitive cation effects on the catalyst’s selectivity over a wide
potential range. Therefore, we investigated CO reduction on Cu(100),
Cu(111) and Cu(polycrystalline) electrodes in 0.1 M alkaline hydroxide
electrolytes (LiOH, NaOH, KOH, RbOH, CsOH) between 0 and -1.5 V vs RHE.
We used Online Electrochemical Mass Spectrometry (OLEMS) and High-
Performance Liquid Chromatography (HPLC) to determine the product
distribution as a function of electrode structure, cation size and applied
potential. First, cation effects are potential dependent, as larger cations
increase the selectivity of all electrodes towards ethylene at E > -0.45 V vs
RHE, but methane is favored at more negative potentials. Second, cation
effects are structure-sensitive, as the onset potential for C2H4 formation
depends on the electrode structure and cation size, whereas that for CH4
does not. Fourier Transform Infrared Spectroscopy (FTIR) and Density
Functional Theory (DFT) help to understand how cations favor ethylene
over methane at low overpotentials on Cu(100). The rate determining step
to methane and ethylene formation is CO hydrogenation, which is
considerably easier in presence of alkaline cations for a CO dimer compared
to a CO monomer. For Li+ and Na+, the stabilization is such that
hydrogenated dimers are observable with FTIR at low overpotentials. Thus,
potential-dependent, structure-sensitive cation effects help steer the
selectivity towards specific products.
This chapter has been published as: E Pérez‐Gallent, G Marcandalli, MC
Figueiredo, F Calle‐Vallejo, MTM Koper, 2017, , 139, 16412–16419

78
5.1 Introduction
Electrocatalytic reduction of CO2 is an attractive strategy for the
conversion of renewable energy into fuels, which helps in closing the
biogeochemical carbon cycle. Several metals and other types of
electrodes have been studied for the electrochemical reduction of
CO2142. However, copper remains the only metal to produce
hydrocarbons (primarily methane and ethylene) with reasonable
faradaic efficiencies42, 86. For instance, Jaramillo et al reported the
formation of 16 different species from CO2 reduction in aqueous
bicarbonate solution, where complex molecules including C2 (e.g.
acetaldehyde, acetate, ethylene glycol, glycolaldehyde) and C3 species
(e.g. n-propanol, propionaldehyde, allyl alcohol, acetone) were detected
with current efficiencies lower than 5 % 50. Several studies of Cu-based
catalysts48, 143 have shown higher selectivity for C2 products. However,
the mechanistic reasons for their selectivity remain elusive. Here we
examine the combined role of electrolyte cations, potential window and
catalyst structure on the selectivity towards C1 vs C2 products during CO
reduction on Cu.
Hori et al showed that CO2 reduction on Cu electrodes is structure
sensitive144: Cu(100) electrodes are most efficient for the conversion of
CO2 to C2H4, Cu(111) favors the formation of CH4 and HCOOH, and
Cu(110) gives the highest current efficiencies for secondary C2 products
(e.g. acetic acid, acetaldehyde and ethanol). Similar results were
obtained by Schouten et al. during the reduction of CO64. While Hori et al
concluded that the introduction of steps on (100) terraces enhances
C2H4 evolution and suppresses CH4 formation144, Schouten et al.
attributed the selective formation of C2H4 to pristine (100) terraces64.
Moreover, they showed that CO reduction to C2H4 takes place
preferentially at Cu(100) electrodes without simultaneous CH4
evolution, which indicates that the reaction paths towards CH4 and C2H4
bifurcate in the early stages of CO reduction59. On the other hand, it has
been shown that C2 species such as ethylene and ethanol are formed in a

Chapter 4 | Spectroscopic observations of a hydrogenated CO dimer
79
common pathway that bifurcates at the late stages of the reaction53, 65,
127. The favorable formation of C2H4 on Cu(100) is supported by density
functional theory (DFT) calculations, which demonstrate that C-C bond
formation proceeds via CO dimerization and has a lower activation
barrier on Cu(100) than on Cu(111).54, 58 In addition to structural effects,
there is an important role of the electrolyte, especially through the pH.
The onset potential on the NHE scale of CH4 evolution depends on pH,
while C2H4 evolution does not. Hori et al concluded that CO reduction to
CH4 proceeds as a series of concerted proton-electron transfers, in
contrast with C2H4 evolution for which the rate limiting step only
involves an early electron transfer, justifying its pH-independent
onset138-139. We showed previously with DFT calculations that the
electron transfer to form a negatively charged (CO)2 dimer is the
potential-limiting step of CO reduction to C2H4 on Cu(100),53 in contrast
with studies that assume only concerted proton-electron transfers57,
which cannot explain the pH independence of C2H4 formation.
In addition to pH, the activity and selectivity of Cu for CO2 reduction also
depends on the nature of the anions and/or cations in the electrolyte.
Strasser et al showed that the selectivity of the major products of CO2
reduction depends on the size and concentration of halides56: while Cl-
and Br- enhance the production of CO, I- lowers CO evolution and
increases the selectivity towards methane. The effects were attributed
to halide adsorption on copper, which alters the negative charge on the
surface and favors the protonation of CO towards CH4. Furthermore, Lee
et al showed that the presence of Cl- enhances the catalytic activity
toward multiple C2-C4 species on Cu-oxide derived catalysts, due to the
presumed advantageous affinity between reaction intermediates and
catalytic surface in presence of Cl-145. Hori et al reported that alkaline
cations affect the selectivity of CO2 and CO reduction on polycrystalline
copper65, so that larger cations favor the formation of C2 and C3 species
such as C2H4, C2H5OH and C3H7OH. Cation effects were explained by Hori
et al in terms of a variation in the potential in the outer Helmholtz plane
(OHP), which originates from a difference in the hydration number of
the different cations. Larger cations are less hydrated and expected to

80
adsorb more easily on the cathode surface, shifting the potential to more
positive values thereby steering the selectivity towards C2H4 instead of
CH4. Such experimental observations were confirmed by Kyriacou et
al.146. Bell and coworkers explained cation effects on CO2 reduction in
terms of the different pKa values for cation hydrolysis, which lower the
local pH at the surface from Li+ to Cs+ and lead to an increase in CO2
concentration near the electrode surface.147 However, this model cannot
explain the fact that similar cation effects are observed during CO
reduction65, the concentration of which is not affected by pH.
All previous studies concerning cation effects in the reduction of CO2
and CO on copper have used only polycrystalline electrodes and did not
cast light on their potential dependence. In this chapter we will argue
that such effects depend on the electrode structure, the applied
potential and the size of the cation. To this end, we used two single-
crystalline copper surfaces (Cu(100), Cu(111)) together with
polycrystalline Cu in LiOH, NaOH, KOH, RbOH and CsOH solutions.
Online Electrochemical Mass Spectrometry (OLEMS) and High-
Performance Liquid Chromatography (HPLC) were used to investigate
the product distribution over a wide potential range. In addition, in situ
Fourier Transform Infrared (FTIR) spectroscopy and Density Functional
Theory (DFT) calculations are used to identify early reaction
intermediates of CO reduction on Cu(100) and explain the cation-
mediated enhancement of ethylene formation over methane.
Understanding how the structural and potential-dependent cation
effects impact the catalytic performance provides insight for devising
efficient and selective catalysts for CO reduction.
5.2 Experimental
Prior to every experiment, the glassware was placed overnight in a
KMnO4 solution which was then rinsed with a mixture of MilliQ water
(resistivity > 18.2 MΩ), 1 mL/L of H2SO4 98% and 20 mL/L of H2O2. All
the glassware was boiled 4 times in MilliQ water for further cleaning. A

Chapter 4 | Spectroscopic observations of a hydrogenated CO dimer
81
platinum wire was used as counter electrode, and a reversible hydrogen
electrode (RHE) was used as reference electrode. The RHE electrode
was placed in a Luggin capillary that contains only supporting
electrolyte, and thus it is not affected by the presence of CO. All
potentials in this chapter are referred to the RHE scale. The potential
was controlled by an Ivium A06075 potentiostat. The copper electrodes
were 99.99% copper disks (5.8 mm diameter), purchased from Mateck
and aligned to < 0.5° accuracy. The electrodes were electropolished in a
10:5:2 solution of H3PO4:H2O:H2SO4 at +3 V vs. Cu for 10 s. The surface of
the electrode was characterized by cyclic voltammetry in a 0.1 M NaOH
solution as explained elsewhere91. Electrolytes were made of high purity
reagents (Sigma Aldrich TraceSelect) in ultra-pure water (MilliQ). The
purity of the hydroxides was >99.9 % for all hydroxides except for Rb.
The amount of impurities present in RbOH sometimes led to
questionable and non-reproducible results. Before every experiment,
argon (Linde, 6.0) was bubbled through the electrolyte for 20 minutes to
remove air from the solution, after which CO (Linde, 6.0) was bubbled
through the solution for another 20 minutes until saturation was
reached. During the experiment, CO was kept flowing through the
solution.
The gaseous products formed during the reaction were detected by
Online Electrochemical Mass Spectroscopy (OLEMS)92. The volatile
products formed on the surface of the electrode were collected by a
hydrophobic tip situated at 0.05 mm from the electrode. The distance
was kept constant for every experiment with the help of a holder with
micrometric precision. The Teflon tip with a diameter of 5.4 mm and an
average pore size of 10-14 μm is connected through a PEEK capillary to
the mass spectrometer. The bigger tip diameter compared to our
previous OLEMS setup92 allows for the detection of more products, thus
increasing the sensitivity of the apparatus. However, this new
configuration does not allow to perform experiments in the hanging
meniscus configuration, with the possibility that some products not
formed on the single-crystal surface might as well reach the tip. Prior to
each use, the tip was cleaned in a solution of 0.2 M K2Cr2O7 in 2 M H2SO4

82
and then boiled 4 times in MilliQ water. A Balzers Quadrupole mass
spectrometer with a secondary electron multiplier (SEM) voltage of
1500 V with an ionization potential of 70 V was used for the detection of
every mass. The different mass signals were followed while changing
the electrode potential from +0.1 V to -1.5 V vs. RHE at a scan rate of 1
mVs-1. The results obtained with OLEMS are qualitative. A direct
comparison between the concentrations of the different products
formed is challenging due to changing factors such as the collection
efficiency or the current intensity of the signal for different masses.
However, for a given product and different electrodes and/or
electrolytes, it is possible to compare the formation of such species
through their ratio (e.g. on Cu(100) the m/z=26 signal is larger for CsOH
than for LiOH, which attests to a larger production of ethylene in Cs-
containing electrolytes). On the other hand, the ratio of formation of two
different products (e.g. C2/C1) offers a fair qualitative comparison.
The liquid products formed during the reduction of CO were collected
and analyzed by High Performance Liquid Chromatography (HPLC) with
a RID detector (Shimadzu). A 0.005 M H2SO4 solution was used as an
eluent in an Aminex HPX-87H (Biorad) column with a flow rate of 0.6
mL/min. Samples were taken after 2 h of long-term electrolysis carried
out in a H-cell with a Nafion membrane that separates the cathode from
the anode compartment. CO was constantly bubbled through the
solution to ensure its constant concentration. Chronoamperometry
experiments were performed at -0.5, -0.7 and -0.9 V vs RHE on a
polycrystalline copper electrode of 16.85 mm diameter.
Fourier Transform Infrared Spectroscopy (FTIR) was used to detect
intermediates in the early stages of CO reduction. FTIR measurements
were performed with a Bruker Vertex 80 V Infrared
spectrophotometer128. The electrochemical cell was assembled on top of
a 60° CaF2 prism, and the electrode was situated against this prism to
form a thin layer. The measurements were performed under external
reflection. FTIR spectra were obtained from an average of 100 scans
with a resolution of 8 cm-1 at the selected potentials. Every spectrum

Chapter 4 | Spectroscopic observations of a hydrogenated CO dimer
83
was obtained by applying single potential steps compared to the
reference potential (+0.1 V). The spectra are shown as (R-R0)/R0 where
R is the reflectance at the sample potential and R0 is the reflectance at
the reference potential. Therefore, the ratio ΔR/R0 gives positive bands
for the formation of species at the sample potential, while negative
bands correspond to the loss of species at the sample potential. P-
polarized light was used to probe species both near the electrode
surface and in solution. The experiments were performed in a thin-layer
configuration, which implies some experimental limitations. Any
appreciable changes in the thin layer (such as the formation of gaseous
products, change in local pH by production or consumption of H or OH
species, etc.) result in spectral deformation. This is particularly
important at negative potentials for CO reduction because of
competitive hydrogen evolution, so that the potential range where
spectra can be obtained is in fact narrow and justifies our choice of
potentials ranging from -0.2 to +0.1 V. As the thin layer cannot be
rigorously controlled, the in situ FTIR is only a qualitative method and
definitely cannot be used for quantification. The intensity of the bands
cannot be directly compared between experiments as different thin
layers are involved

84
5.3 Results and discussion
5.3.1 OLEMS and HPLC
Cu(111), Cu(100) and Cu(poly) were characterized by voltammetry
before and after experiments to control the morphology of the surface91,
see Appendix IV Figure AIV.8. The activity and selectivity of the three
electrodes towards CO reduction were investigated with OLEMS by
varying the alkaline cation in the 0.1 M hydroxide supporting
electrolyte. A linear sweep voltammetry between 0 and -1.5 V vs RHE at
a scan rate of 1 mVs-1 was carried out while simultaneously the volatile
products were detected with OLEMS. Figure 5.1 displays the volatile
products formed during the reduction of CO on Cu(100), Cu(111) and
polycrystalline Cu for different alkaline hydroxide solutions of identical
concentration (0.1 M). Figure 5.1a-5.1c shows the results of CO
reduction for Cu(100). The middle panel (b) shows the mass fragment
m/z = 15 associated with CH4, and the top panel (a) shows the mass
fragment m/z = 26 associated with C2H4. It is important to note that the
reported amounts of products formed are in fact lower than the
amounts expected if a purification process of the electrolyte would have
been performed, according to the results obtained by Surendranath148.
The onset potential for CH4 at ca. -0.65 V is independent of the cation in
solution. For all cations, except Cs+, the formation of methane reaches a
plateau around -0.9 V vs RHE. The general trend is that larger cations
increase methane production. Figure 5.1b also shows that the formation
of C2H4 on Cu(100) starts at ca. -0.3 V regardless of the cation. The
amount of ethylene formed, as well as its formation rate, increase with
the size of the cation. Especially Cs+ shows a significant increase in
ethylene production.

Chapter 4 | Spectroscopic observations of a hydrogenated CO dimer
85
On Cu(111) (Fig 5.1d-f), the onset potential for CH4 is ca. -0.65 V
regardless of the cation, with trends in activity similar to Cu(100). (Rb+
deviates from this trend but, as mentioned in section 5.2 RbOH
frequently showed problems with purity and reproducibility). The
formation of C2H4 starts around -0.4 V regardless of the cation, which is
0.1 V more negative than on Cu(100). The amount of ethylene formed,
as well as its formation rate, is highest with Cs+ in the electrolyte. It is
important to point out the differences observed with the previous work
by Schouten et al,59 where the formation of ethylene and methane on
Cu(111) displayed a similar profile having both an onset potential of
2.0x10⁻⁹
1.5
1.0
0.5
0.0
(m
/z=
26) / (m
/z=
15)
-1.4 -1.2 -1.0 -0.8 -0.6 -0.4 -0.2E vs. RHE / V
8x10⁻¹⁰
6
4
2Cu
rre
nt /a.u
.
50
40
30
20
10
0
Cu
rre
nt / a
.u.
-1.4 -1.2 -1.0 -0.8 -0.6 -0.4 -0.2
Cu (100)
LiOH NaOH KOH RbOH CsOH
(m/z=26) / (m/z=15)
m/z=15
m/z=26
C2H4 / CH4
CH4
C2H4
a)
b)
c)
2.0x10⁻⁹
1.5
1.0
0.5
0.0
Cu
rre
nt / a
.u.
-1.4 -1.2 -1.0 -0.8 -0.6 -0.4 -0.2E vs. RHE / V
8x10⁻¹⁰
6
4
2
0
Cu
rre
nt / a
.u.
50
40
30
20
10
0
(m
/z=
26) / (m
/z=
15)
-1.4 -1.2 -1.0 -0.8 -0.6 -0.4 -0.2
Cu (111)
LiOH NaOH KOH RbOH CsOH
(m/z=26) / (m/z=15)
m/z=15
m/z=26
C2H4 / CH4
CH4
C2H4
d)
e)
f)
2.0x10⁻⁹
1.5
1.0
0.5
0.0
(m
/z=
26) / (m
/z=
15)
-1.4 -1.2 -1.0 -0.8 -0.6 -0.4 -0.2E vs. RHE / V
8x10⁻¹⁰
6
4
2
0 C
urrent / a.u.
50
40
30
20
10
0
Current / a.u.
-1.4 -1.2 -1.0 -0.8 -0.6 -0.4 -0.2
Cu (poly)
(m/z=26) / (m/z=15)
m/z=15
m/z=26
CH4
C2H4
LiOH NaOH KOH RbOH CsOH
C2H4 / CH4
g)
h)
i)
Figure 5.1: OLEMS mass fragments measured during CO reduction associated
with the formation C2H4 (top panel, a, d and g) and CH4 (middle panel, b, e, and
h) on a) Cu(100) , b) Cu(111) and c) polycrystalline Cu for different 0.1 M
alkaline hydroxide solutions. Bottom panel (c, f and i) shows the potential-
dependent ratio (m/z = 26) / (m/z = 15) of OLEMS mass fragments associated
with the formation of C2H4 and CH4 during CO reduction.

86
approximately -0.8 V. Similar results were obtained by Nilsson et al,143
who found onset potentials for methane and ethylene on Cu(111) close
to -0.9 V. However, in this work ethylene formation on Cu(111) starts at
lower overpotentials (-0.4 to -0.5 V), which we attribute to the higher
sensitivity achieved by using a larger OLEMS tip in combination with the
non-meniscus configuration. Although it is not possible to rule out the
contribution of other facets present on the electrode, the significantly
higher activity and lower onset potential of Cu(100) surface for ethylene
formation is also clearly observed in this work.
On polycrystalline Cu (Fig. 5.1g-i) the onset potential for CH4 production
is around -0.65 V regardless of the cation in solution. The plateau is less
pronounced than on the single crystals, and the trend with the size of
the cation is less evident. C2H4 formation is strongly dependent on the
cation, with the smallest cation (Li+) showing essentially no ethylene
formation and the largest cation Cs+ showing the strongest selectivity
towards ethylene. Though we remark again that it is currently
impossible to perform fully quantitative selectivity measurements using
OLEMS, the results in Figure 5.1 allow us to conclude that (i) larger
cations enhance CO reduction to ethylene at low overpotentials, and that
the effect is significantly stronger on Cu(100), (ii) larger cations enhance
methane production at high overpotentials.
To support these conclusions, we consider in Figure 5.1 bottom panels
(c, f and i) the potential dependence of the ratio of the mass signals
corresponding to ethylene (m/z = 26) and methane (m/z = 15) for the
three different Cu electrodes. The ratio was plotted as I(m/z =
26)/I(m/z = 15), so a high value expresses a larger production of
ethylene over methane. Since at potentials more positive than -0.65 V
there is no methane production and the value of the ratio C2/C1 is
infinite, the ratio was only calculated in the potential region where both
products coexist or the amount of C2H4 detected is null. At low
overpotentials, all copper surfaces show a higher selectivity towards
ethylene with increasing cation radius, with the highest selectivity
achieved for Cu(100), especially with Rb+ and Cs+ in solution. In

Chapter 4 | Spectroscopic observations of a hydrogenated CO dimer
87
particular, for a fixed potential of -0.75 V, the ethylene/methane ratio
for Cu(100) are 1.59 for Li+, 3.93 for Na+, 4.32 for K+, 7.54 for Rb+ and
14.8 for Cs+ (see Appendix IV Figure AIV.2a). These values show a clear
cation effect towards ethylene formation that monotonically follows the
cation sizes. In addition, the selectivity for ethylene is enhanced in a
larger potential range when larger cations are in solution. Figure AIV.2b
in appendix IV shows that larger cations maintain the same selectivity
for ethylene at more negative potentials compared to smaller cations:
the potentials for which a fixed value of 5 for the ethylene/methane
ratio are -0.70, -0.72, -0.72, -0.74 and -0.79 V for Li+, Na+, K+, Rb+, and
Cs+. Similar tendencies are observed for Cu(111) and polycrystalline Cu
but with significantly lower ratios. The ratio C2/C1 on Cu(111) and
polycrystalline Cu in LiOH solution is almost zero over the whole
potential range in which both species coexist, indicating low selectivity
for ethylene formation over methane in this electrolyte.
Figure AIV.1 in appendix IV shows the mass fragment m/z = 2
associated with the formation of H2 from the competitive hydrogen
evolution reaction (HER). For all copper surfaces, hydrogen evolution
starts at ca. -0.4 V for all different cations except Cs+, for which it starts
at slightly less negative potentials. The amount of hydrogen produced as
well as its formation rate increases with the size of the cation in the
electrolyte for all copper electrodes.
The minor liquid products obtained during CO reduction on
polycrystalline copper and their dependence on the nature of the cation
were collected and analyzed with HPLC. Due to the low amount of
products formed, chronoamperometry experiments for 2 h were carried
out using a large copper disk (16.85 mm diameter). Given the long
duration of this set of experiments, we did not perform these
experiments with single-crystal electrodes, since the stability of the
surface structure may be compromised. Chronoamperometry
experiments were carried out at three different potentials: -0.5, -0.7 and
-0.9 V vs RHE, with different alkaline hydroxides. The concentrations of
the obtained products and their cation dependence are summarized in

88
Figure AIV.3 in appendix IV. The only liquid product detected for CO
reduction at -0.5 V was formic acid. At more negative potentials (-0.7 v
and -0.9 V) the products obtained were: formic acid as C1 product;
acetic acid, glycolic acid, ethylene glycol and ethanol as C2 products; and
propionaldehyde, 1-propanol and allyl alcohol as C3 products. Such C2
and C3 products obtained during CO reduction have been reported
previously50, 61. In general, larger cations such as Cs+ promote CO
reduction to C2+ compounds compared to small cations (Li+ and Na+), in
agreement with the results of Hori et al 65. A detailed description of the
concentration of the products depending on the cation in solution can be
found in appendix IV, section IV.2.
Further analysis by 1H-NMR was carried out for the samples obtained
after 2 h of chronoamperometry at -0.9 V with Na-, K- and Cs-containing
electrolytes (Appendix IV, Figure AIV.4). The 1H-NMR spectra confirmed
the products detected with HPLC and their higher concentration with K+
and Cs+ compared to Na+. In addition, methanol was also detected as a
reduction product of CO for those three cations. Identification of
methanol was not possible with HPLC due to an overlap with the intense
peaks of the eluent.
Note that we were unable to consistently detect aldehydes as products,
while acetaldehyde and propionaldehyde have been reported to be
products of CO2 reduction on copper50. This is probably due to the fact
that our experiments were carried out at pH 13, and it is known that
aldehydes are unstable at such high pH and disproportionate following a
Cannizzaro reaction, giving the corresponding carboxylic acid and
alcohol149.

Chapter 4 | Spectroscopic observations of a hydrogenated CO dimer
89
5.3.2 FTIR
FTIR spectra were recorded during the early stages of CO reduction on
Cu(100) and Cu(111) in different alkaline hydroxide solutions, to gain
insight into the dependence of the reaction mechanism on to the surface
structure of the electrode as well as the cation in the electrolyte. FTIR
experiments carried out in Li-containing electrolytes (see Chapter 4)
indicated a structure-sensitive process in the early stages of CO
reduction150, which together with DFT calculations led us to hypothesize
the formation of a hydrogenated CO dimer intermediate in the pathway
leading to ethylene, in agreement with previous experimental64 and
theoretical54 studies. Figure 5.2a-f shows the potential-dependent
absorbance spectra of Cu(100) and Cu(111) under CO atmosphere for
different 0.1 M alkaline hydroxide solutions. The spectra recorded on
Cu(100) in LiOH solution were previously reported by our group150.

90
The reference spectrum was taken at +0.1 V vs RHE and additional
spectra are provided for +0.05, 0.00, -0.05, -0.10, -0.15 and -0.2 V vs.
RHE. Due to experimental limitations, it was not possible to record
spectra at more negative potentials where the hydrogen evolution
reaction starts, as this destabilizes the thin layer formed between the
electrode and the prism of the spectrometer resulting in unstable
spectra. These limitations are explained in section 5.2. CO reduction in
Absorb
ance / a
.u.
2000 1800 1600 1400 1200
wavenumber / cm-1
+0.1 V
+0.05 V
0 V
-0.05 V
-0.1 V
-0.15 V
-0.2 V
1677 cm-1
1600 cm-1
1191 cm-1
Cu (100) , 0.1 M LiOH , CO atmosphere
0.0005 a.u.
Ab
so
rba
nce
/ a
.u.
2000 1800 1600 1400 1200
wavenumber / cm-1
Cu (100) , 0.1 M KOH , CO atmosphere
0.0005 a.u.
+0.1 V
+0.05 V
0 V
-0.05 V
-0.1 V
-0.15 V
1630 cm-1
1701 cm-1
1191 cm-1
Ab
so
rba
nce
/ a
.u.
2000 1800 1600 1400 1200
wavenumber / cm-1
1191 cm-1
1627 cm-1
1708 cm-1
0.0005 a.u.
+0.1 V
+0.05 V
0 V
-0.05 V
-0.1 V
-0.15 V
-0.2 V
Cu (100) , 0.1 M NaOH , CO atmosphere
Ab
so
rba
nce
/ a
.u.
2000 1800 1600 1400 1200
wavenumber / cm-1
Cu (100) , 0.1 M RbOH , CO atmosphere
0.0005a.u.
+0.1 V
+0.05 V
0 V
-0.05 V
-0.1 V
-0.15 V
-0.2 V
1407 cm-1
1635 cm-1
Ab
so
rba
nce
/ a
.u.
2000 1800 1600 1400 1200
wavenumber / cm-1
Cu (100) , 0.1 M CsOH , CO atmosphere
-0.2 V
-0.15 V
-0.1 V
-0.05 V
0 V
+0.05 V
+0.1 V
0.0005 a.u.
1728 cm-1
1615 cm-1
1407 cm-1
Absorb
ance / a
.u.
2000 1800 1600 1400 1200
wavenumber / cm-1
Cu (111) , 0.1 M LiOH , CO atmosphere
-0.2 V
-0.15 V
-0.1 V
-0.05 V
0 V
+0.05 V
+0.1 V
0.0005 a.u.
a) b) c)
d) e) f)
Figure 5.2: Potential-dependent absorbance spectra of Cu(100) in CO
atmosphere in 0.1 M solution of a) LiOH, b) NaOH, c) KOH, d) RbOH, e)
CsOH. f) LiOH on Cu(111), provided for comparison. Reference spectrum
recorded at +0.1 V vs. RHE.

Chapter 4 | Spectroscopic observations of a hydrogenated CO dimer
91
different alkaline hydroxide solutions was also studied on Cu(111) (a
representative spectrum is shown in Fig. 5.2f). The FTIR spectra for CO
interacting with Cu(100) exhibit two common bands for all alkaline
electrolytes. The first band, in the range of 1635-1600 cm-1, corresponds
to the O-H bending mode of H2O. This band causes fluctuations in the
baseline of the spectra making it difficult to identify other bands in this
wavenumber range. The second band, in the range of 1730-1670 cm-1,
corresponds to the C-O stretching129-131 of CO adsorbed on hollow sites
on Cu(100) 132-135 . Apart from these two bands, two other bands arise
depending on the electrolyte used. For Li, Na and K hydroxides, a band
at 1191 cm-1 attributed to the C-O stretching of a hydrogenated dimer
(OCCOH)150 is observed. Note that the assignment of this band to the
hydrogenated dimer and the exclusion of other species were discussed
extensively in Chapter 4.150 Besides, in appendix IV section IV.7 we also
provide arguments to discard the presence of oxalates. In contrast, the
band at 1191 cm-1 is not observed when Rb+ and Cs+ are in solution, a
feature that will be explained in the next section with DFT calculations.
The intensity of the band assigned to C-O stretching of the hydrogenated
dimer diminishes from Li to K (Figs. 5.2a-c). For Rb and Cs (Figs. 5.2d-e),
a band at 1407 cm-1 is observed, which according to the transmission
spectra obtained for various species in solution might correspond to
formaldehyde. Formaldehyde has been suggested to be an intermediate
of the reduction of CO to CH4 on Cu(211)151-152. The spectra obtained
during the reduction of CO on Cu(111) (Fig. 5.2f) also shows the band at
1407 cm-1. However, on Cu(111) this band is more intense for smaller
cations than for larger cations.

92
5.3.3 DFT calculations
To rationalize some of the observed cation effects, we resort now to DFT
calculations. We will focus on Cu(100), as ethylene is formed at low
overpotentials and the FTIR results in Figure 5.2 suggest the presence of
a hydrogenated dimer intermediate. Since CO hydrogenation is critical
for both methane57 and ethylene production,53, 62, in the following we
will focus only on this step. Figure 5.3 shows the energetics of the first
electrochemical steps in the reduction of one CO molecule to C1 species
and two CO molecules to C2 species in vacuum and in presence of Li, Na
and Cs (the energies shown are the averages of the separate values
found for the three cations, for details see appendix IV Figures AIV.11
and AIV.12). The first proton-electron transfer for a single CO molecule
proceeds as:
* ( ) *CO g H e CHO (5.1)
This step consists of CO adsorption and hydrogenation. On the other
hand, the first proton-electron transfer for two CO molecules proceeds
as:
* 2 ( ) *CO g H e OCCOH (5.2)
This step comprises successive CO adsorption (denoted *CO and 2*CO in
Figure 5.3), dimerization (*OCCO), and hydrogenation (*OCCOH). The
adsorption configurations of C1 and C2 species are provided in appendix
IV Figures AIV.9 and AIV.10.

Chapter 4 | Spectroscopic observations of a hydrogenated CO dimer
93
From Figure 5.3 it is clear that all intermediates, namely *CO, 2*CO,
*OCCO, *CHO and *OCCOH, are significantly stabilized by the presence of
the alkaline cations, but the strength of the effect depends both on the
particular adsorbate. Essentially, the overall cation effect is due to the
larger stabilization of adsorbates containing C-C bonds (*OCCO and
*OCCOH) with respect to the C1 adsorbates (*CO, 2*CO, *CHO).
Importantly, the presence of the cations changes the binding mode of
the CO dimer, as shown in appendix IV, Figure AIV.9, and the adsorption
sites of the adsorbates (appendix IV, Figures AIV.9 and AIV.10).
Figure 5.3: Energetics of the first electrochemical steps of CO reduction for
the C1 and C2 pathways on Cu(100) at 0 V vs RHE. a) In vacuum, and b) with
cations, averaging the energies for Li, Na and Cs in appendix IV Figures
AIV.11 and AIV.12. While in vacuum both pathways are highly endothermic,
the C2 pathway is remarkably promoted by alkaline cations.

94
Note that both steps described by Equations (5.1) and (5.2) are highly
endothermic in the absence of cations, so that the reaction energies for
*CO hydrogenation are 0.73 and 0.87 eV for the C1 and C2 pathways (see
appendix IV, Tables AIV.2 and AIV.3). In presence of the cations, the
energetics of *CO hydrogenation are lowered from 0.73 to 0.54 eV. This
change is dwarfed by the dramatic lowering in the C2 pathway from
0.87 to 0.18 eV. This attests to a substantial enhancing effect of the
alkaline cations by decreasing the energy barriers for *CO reductive
coupling. The enhancement of *OCCO with respect to 2*CO clearly
illustrates cation effects: the adsorption energy of *OCCO is made more
negative by the cations by ~1.2 eV, whereas the adsorption energy of
2*CO is stabilized by ~0.4 eV. In sum, Figure 5.3b explains well the
experimentally observed preference of Cu(100) for ethylene formation
over methane.
There is also another manifestation of the cation effect, related to the
stability of *OCCOH. Similar to the dimer, the hydrogenated counterpart
is significantly stabilized (1.16 eV in average) by the presence of alkaline
cations. Following the model of Nørskov et al57 in which the onset
potential is linked to the largest uphill reaction energy in a given
pathway, the potential to go from 2*CO to *OCCOH is -0.10 V for Li+, -
0.16 for Na+, and -0.28 eV for Cs+ (see appendix IV, Figure AIV.12).
Therefore, the hydrogenated dimer should only be observable with FTIR
at low potentials (> -0.2 V) in presence of Li+ and Na+, but not in the case
of Cs+, in agreement with the experimental results in Figure 5.2. This
shows that cation effects can be averaged to observe overall trends, but
important subtleties pertaining to each cation can only be captured by
separate analyses. In addition to the quantitative considerations on the
cation effect provided in Figure 5.3, in appendix IV, section IV.6 we also
discuss some qualitative features of Li+, Na+ and Cs+ co-adsorption with
C1 and C2 species.

Chapter 4 | Spectroscopic observations of a hydrogenated CO dimer
95
5.3.4 Mechanistic implications
The OLEMS results in Figure 5.1 suggest a relation between m/z = 15
and m/z = 26 (associated with methane and ethylene formation,
respectively). Figure 5.4 illustrates the relation between these two
masses for the specific case of CO reduction on Cu(100), although the
trend is also observable for Cu(111) and polycrystalline Cu (see
appendix IV, Figure AIV.5). Importantly, the mass fragment associated
with the formation of ethylene drops when the signal associated with
the formation of methane starts to rise. Moreover, the m/z = 15 signal
increases faster in the electrolytes for which the m/z = 26 signal
decreases faster, leading to a delay in the potential where the maximum
current for methane is observed, depending on the size of the cation. For
example, while the decay in ethylene formation in LiOH is acute and the
rise of the mass fragment associated with methane is steep, in CsOH
solutions the decay of ethylene and the formation of methane are both
more gradual. In this order of ideas, larger cations enhance the
selectivity towards C2H4 over a wider potential range.
This behavior could be understood if, for instance, methane formation
would be the result of C2H4 reduction. However, we discarded this
hypothesis because ethylene reduction experiments did not lead to the
formation of methane (see appendix IV, Figure AIV.6). It is also
important to note that ethane was not detected as a reduction product
of ethylene in these experiments.

96
Therefore, we believe that a cation-, potential-, and facet-dependent
picture such as the one in Figure 5.5 is needed to portray the
mechanistic effects of alkaline cations on CO reduction. The figure shows
a schematic representation of the structure- and potential-dependency
of the cation effects for CO reduction towards the two main products,
methane and ethylene. The onset potential for ethylene formation
depends on the facet, being lower for copper single crystals than for
polycrystalline copper. In addition, the onset potential for ethylene is
not affected by the cation nature when CO reduction is performed on
Figure 5.4: OLEMS mass fragments associated with the reduction products
formed during CO reduction on Cu (100) electrode in different 0.1 M alkaline
hydroxide solutions. Dashed lines correspond with m/z=26 associated with
the formation of ethylene, plotted against the right axis and full lines
correspond with m/z=15 associated with the formation of methane, plotted
against the left axis. Vertical lines highlight the potential at which the m/z=26
signal associated with ethylene starts to decay .

Chapter 4 | Spectroscopic observations of a hydrogenated CO dimer
97
copper single crystals (see appendix IV, Figure AIV.7), whereas on
polycrystalline copper the onset potential varies alongside the cation
size, being -0.6 V for Li+ and Na+, -0.4 V for K+ and -0.35 V for Rb+ and
Cs+. On the other hand, the onset potential for methane formation is
independent of both cation size and surface structure. In the range from
-0.3 V to -0.65 V, larger cations enhance the formation of ethylene,
whereas at potentials more negative than -0.65 V the formation of
methane is favored. Figure 5.4 suggests that this phenomenon is due to
a shutting down of the C2 pathway at large overpotentials in which the
C1 pathway becomes favorable.
Hori et al explained the differences in product distribution on the nature
of the cation based on the potential distribution at the electrode surface
in terms of changes in the outer Helmholtz plane (OHP) potential65. The
OHP potential varies with the cations according to their particular
adsorption features. Specific adsorption of cations supposedly shifts the
OHP potential to more positive values, the OHP potential being higher
for Cs+ than for Li+ in view of their dissimilar hydration shells. In this
Cu (100)
Cu (111)
Cu (poly)
E°CH4E°C2H4
ECH4EC2H4
-0,30 V
-0,40 V
-0,45 V
-0,65 V
-0,65 V
-0,65 V
0,11 V
0,11 V
0,11 V
0,20 V
0,20 V
0,20 V
Larger cations
enhance C2H4
formation
Larger cations
enhance CH4
formation
onset onset
Figure 5.5: Schematics of the structure- and potential-dependent cation effects
for CO reduction towards methane and ethylene in alkaline hydroxide
electrolytes (pH=13). Potentials vs RHE. E0 are standard equilibrium potentials

98
model, a more negative OHP potential translates into a higher H+
concentration, such that the pH at the electrode will decrease as the size
of the cation decreases. At higher pH values the formation of ethylene vs
methane is enhanced.
On the other hand, in the model proposed by Bell et al147 for the cation
enhancement of CO2 reduction, the pH near the electrode is lower when
larger cations are in solution, leading to a higher local CO2 concentration
that results into a higher cathodic activity. They attribute the decrease
of pH when larger cations are present to a decrease of the pKa for the
cations hydrolysis. When the pKa is sufficiently low, hydrated cations
serve as buffering agents, decreasing the pH near the electrode and
thereby increasing the local concentration of CO2. Note that this model is
in agreement with experimental data for potentials lower than -1.1 V vs
RHE. However, this model cannot explain the fact that similar cation
effects are observed during CO reduction65, the concentration of which
is not affected by (local) pH. In their model, Bell et al explained that the
hydrolysis of hydrated cations is only effective in mildly basic or acidic
electrolytes. However, our experimental results showed a cation
enhancement for the production of ethylene during CO reduction in
strongly alkaline media (pH=13).
Our explanation of cation effects is based on Figures 5.3, AIV.11, and
AIV.12. We believe that cations are essentially catalytic promoters, their
presence altering substantially the free-energy landscape of CO
reduction. They especially stabilize C2 species by means of strong O-
cation interactions, justified by the strong tendency of those species (e.g.
*OCCO and *OCCOH) to be negatively charged, unlike isolated *CO
monomers. Our perspective on cation effects is in line with that of Janik
and coworkers153, who explicitly included cation, anion and solvation
effects in their calculations and reported similar effects for CO2
reduction in presence of K+. The averaging in Figure 5.3 is close to that
of Nørskov and coworkers154-155 who have shown that cations at the
double layer induce local field effects that alter the adsorption energies.
Although overall cation effects can be averaged, we stress that subtle yet

Chapter 4 | Spectroscopic observations of a hydrogenated CO dimer
99
important details such as differences in adsorption sites, adsorption
configurations (appendix IV, Figures AIV.9 and AIV.10) and onset
potentials as a function of cation size ( appendix IV, Figures AIV.11 and
AIV.12) are only captured when modelling the cations explicitly.
Finally, it is important to note that the present work is devoted only to
“fully metallic” Cu electrodes, while “oxide-derived” Cu electrodes also
exist and, due to their high activity for CO reduction, are the subject of
extensive research 55, 143, 156-157. “Fully metallic” Cu(100) and oxide-
derived Cu electrodes produce both large amounts of C2 products,
although the former is inclined towards ethylene, while the latter favors
ethanol. Previous works provided a plausible explanation for such
dissimilar behavior: there is a selectivity-determining intermediate in
the CO reduction pathway to C2 products, namely *CH2CHO53. If
hydrogenation leads to *CH3CHO (i.e. adsorbed acetaldehyde), ethanol is
the major final product 127. Conversely, if hydrogenation leads to
*CH2CH2O, then ethylene is favored 53. Whereas acetaldehyde is reduced
to ethanol at larger rates at steps and grain boundaries127, 158 compared
to terraces, pristine (100) terraces are known to favor ethylene
production 59, 64.
5.4 Conclusions
In this chapter, we have shown that the combined effect of alkaline
cations and catalyst morphology can steer the selectivity of CO
reduction towards ethylene or methane, depending on the potential.
Specifically, our results suggest the following conclusions:
1) In general, larger cations enhance CO reduction to ethylene at low
overpotentials, especially on Cu(100). With smaller cations in solution,
CO reduction on Cu(111) and Cu(polycrystalline) shows low selectivity
for ethylene formation over methane over the whole potential range in
which both species coexist. The formation of other minor C2 and C3

100
products (such as acetic acid, glycolic acid, ethanol and propanol) is also
enhanced by the presence of larger cations.
2) A correlation between the decline of ethylene formation and the
onset potential for methane formation was observed. Furthermore,
methane formation reaches its plateau when ethylene formation drops
to zero. This suggests that the C2 pathway is blocked by the
enhancement of the C1 pathway. This correlation depends on the cation
size, so that larger cations enhance the selectivity towards ethylene over
a wider potential range.
3) For the two major products, methane and ethylene, differences in the
onset potential were found as a function of the cation size and the
surface structure. While the onset potential of ethylene formation
depends on these two factors, the onset potential of methane does not.
4) FTIR and DFT calculations were used to gain insight into the origin of
cation effects on Cu(100). As described in chapter 4150, FTIR suggests
the presence of a hydrogenated dimer intermediate (OCCOH) at low
overpotentials. The formation of this intermediate depends on the size
of the cation, so that the hydrogenated dimer can be detected with FTIR
in presence of Li+, Na+ and K+, but not in presence of Rb+ or Cs+. DFT
calculations explain that the potential necessary to form *OCCOH from
*CO in presence of Cs+ is more negative compared to Li+ or Na+. Besides,
the adsorption energies of species containing C-C bonds are
dramatically stabilized by cations with respect to C1 species, justifying
the selectivity towards ethylene at low overpotentials.
5) The role of cations in CO reduction is that of a catalytic promoter,
changing the free energy landscape of CO reduction and specifically
stabilizing certain intermediates, especially those with a favorable
(electrostatic) interaction with the cation. Larger cations such as Cs
promote pathways with these intermediates more effectively than
smaller cations such as Li.
Chapter 6
Mechanistic study of the electrosynthesis of propylene
carbonate from propylene oxide and CO2 on copper electrodes
Efficient and selective electrosynthesis of propylene carbonate can
be performed by the reaction of carbon dioxide with propylene oxide
at copper electrodes. In this paper, we investigate this
electrochemical reaction by Cyclic Voltammetry (CV), Fourier
Transform Infrared Spectroscopy (FTIR) and High Performance
Liquid Chromatography (HPLC) in order to unravel the catalytic
mechanism of the reaction. The combination of the results obtained
by these different techniques, allows the exclusion of different
reduced forms of CO2, such as CO and (bi)carbonates, as possible
carboxylation agents. Moreover, the results also indicate that
electrochemical activation of the propylene oxide by the ring
opening is not the initial step for this reaction since no product was
detected if a current was not applied in presence of “activated
propylene oxide” and CO2.. We propose an electrochemical reaction
initiated by the activation of CO2 to CO2- which then attacks the
epoxide to form the cyclic carbonate. This work also gives evidence
for the non-electrocatalytic nature of the cyclic carbonate synthesis
since the formation of propylene carbonate also occurs on other
metals such as gold and platinum in the same range of applied
currents. These results clearly indicate the potential of in situ
electrochemical techniques in the mechanistic investigation of
electrosynthesis reactions.
This chapter has been submitted as : E Pérez‐Gallent, MC Figueiredo, MTM
Koper

102
6.1 Introduction
The accelerated increase of CO2 atmospheric levels in the last decades
due to the consumption of fossil fuels is causing an acute environmental
problem39. Compared to CO2 storage solutions, the fixation of CO2 into
organic molecules offers an attractive alternative 159. Carbon dioxide can
be used as a C1 feedstock in organic synthesis due to its abundant,
cheap, renewable and non-toxic nature70. Among the different valuable
products obtained from carbon dioxide, cyclic carbonates offer wide
applications in the chemical industry. Cyclic carbonates can be utilized
as fuel additives, as electrolytes for Li ion batteries, as plastics, as green
reagents160 and as raw material for the production of dimethyl
carbonate69, which is considered as a replacement for more toxic
solvents in paints and coatings since it is exempt from the restrictions
placed on most volatile organic products. Many catalyst systems have
been developed for the conversion of CO2 to cyclic carbonates72-74, 161.
High temperature and high pressure are frequently required due to the
relatively low reactivity of CO2 at low energy input. Electrochemistry
would provide an alternative manner to activate carbon dioxide at
atmospheric pressure and low temperature. Electrosynthesis of cyclic
carbonates has been performed under mild conditions with the
achievement of an efficient and selective process80, 84, 162. Several metals
such as copper80, stainless steel79, graphite79, silver81 and nickel81, have
been tested for the conversion of propylene oxide and CO2 to propylene
carbonate, obtaining the highest conversion (99%) on copper79.
Although substantial efforts have been invested towards the
achievement of a highly efficient process, the mechanism of this reaction
is still under debate. Several studies attribute the opening of the
propylene oxide ring as the rate-determining step, meaning that the
catalyst activates the epoxide before the attack of CO272, 74, 83, 161, 163,
whereas other studies support the need of the activation of CO2 as a key
step to complete the reaction80-81, 84. In this work, we study the
conversion of propylene oxide and CO2 to propylene carbonate on
copper electrodes in tetraethyl ammonium perchlorate (TEAClO4) in

Chapter 6 | Electrosynthesis of propylene carbonate
103
acetonitrile solutions by in situ Fourier Transform Infrared (FTIR)
spectroscopy, in order to investigate the mechanism of the reaction. We
will show that the activation of propylene oxide can be ruled out as the
rate determining step for propylene carbonate synthesis, and that the
electro-activation of CO2 to a CO2 radical anion is the likely key step for
this process. We also show that undesired by-products may be formed
from the reduction of the propylene oxide and the acetonitrile solvent.
6.2 Experimental
Prior to every experiment, the glassware was boiled in MilliQ water to
remove possible salts, and subsequently rinsed with acetone. Next, the
glassware was then dried in the oven at 100°C for 20 minutes.
Electrolytes were made of tetraethyl ammonium perchlorate (Alfa
Aesar, 98%) dissolved in acetonitrile (Sigma Aldrich, 99.8%). The
electrolyte solutions still contain ca. 50-100 ppm water164-165.
A flamed annealed platinum wire was used as a counter electrode, and
an Ag/AgClO4 in acetonitrile was used as a reference electrode165.
Copper disc electrodes were used as working electrode (99.99%, from
Mateck). The electrodes were electropolished in a 10:5:2 solution of
H3PO4:H2O:H2SO4 at +3 V vs. Cu for 10 s. The applied current was
controlled by an Ivium A06075 potentiostat. Before every experiment,
argon (Linde, 6.0) was bubbled through the electrolyte for 25 minutes to
de-aerate the solution, after which CO2 (Linde, 6.0) was bubbled through
the solution for another 25 minutes until saturation was reached.
Fourier Transform Infrared Spectroscopy (FTIR) was used to detect
intermediates, adsorbed species and species in solution during the
reaction. The measurements were performed with a Bruker Vertex 80 V
Infrared spectrophotometer128. The electrochemical cell was assembled
on top of a 60° CaF2 prism, and the electrode was situated against this
prism to form a thin layer. The measurements were performed under
external reflection. FTIR spectra were obtained from an average of 100
104
scans with a resolution of 8 cm-1 at selected currents every 4 minutes.
The spectra are shown as (R-R0)/R0 where R is the reflectance at the
sample and R0 is the reflectance at the reference at zero current.
Therefore, the ratio ΔR/R0 gives positive bands for the formation of
species near the electrode, while negative bands correspond to the loss
of species. P-polarized light was used to probe species both near the
electrode surface and in solution. The experiments in the thin layer
configuration have some experimental limitations. As the thin layer
cannot be rigorously controlled, spectra cannot be used for
quantification. The intensity of the bands cannot be directly compared
between experiments since different thin layers are involved. However,
within a single experiment, trends in intensity are reliable semi-
quantitative indicators of changes in concentration. The electrode
potential was controlled with a Potentiostat 466 System (Model ER466)
from E-DAQ. All the experiments were performed at room temperature.
The transmission spectra of the solution species were collected using a
SeZn window with an incident angle of 60° and obtained by averaging
100 scans with a resolution of 8 cm−1.
The liquid products formed during the electrosynthesis of propylene
carbonate were collected and analyzed by High Performance Liquid
Chromatography (HPLC) with a RID detector (Shimadzu). A 0.005 M
H2SO4 solution was used as an eluent in an Aminex HPX-87H (Biorad)
column with a flow rate of 0.6 mL/min. Samples were taken at different
times of electrolysis carried out in a H-cell with separate cathode and
anode compartments.

Chapter 6 | Electrosynthesis of propylene carbonate
105
6.3 Results and discussion
6.3.1 Cyclic voltammetry
Fig. 6.1 shows the cyclic voltammetry of polycrystalline copper in a 0.1
M TEAClO4 solution in acetonitrile under various conditions. The
voltammograms were recorded in the absence of carbon dioxide and
propylene oxide PO (black curve), in the presence of propylene oxide
(blue curve), in the presence of carbon dioxide (red curve) and in the
presence of both propylene oxide and carbon dioxide (green curve).
The comparison between the black and blue curves in Fig.6.1 indicates
that propylene oxide does not undergo significant reduction under these
conditions (though FTIR measurements to be discussed below show
some formation of a PO reduction product). On the other hand, when
-2.5x10⁻⁴
-2.0
-1.5
-1.0
-0.5
0.0
j / A
/cm
2
-2.8 -2.4 -2.0 -1.6 -1.2E vs Ag/AgClO4 / V
-1.2x10⁻⁵
-0.8
-0.4
0.0
-2.0 -1.6
Blank CO2
PO PO + CO2
Figure 6.1: Cyclic voltammograms of polycrystalline copper in 0.1 M TEAClO 4
in acetonitrile solution in the absence of CO2 and propylene oxide (black) and
in the presence of CO2 (red), 0.1 M propylene oxide (blue) and a combination
of propylene oxide (0.1 M) and CO2 (green), with Ag/AgClO 4 as reference
electrode. Scan rate = 50 mV/s. Inset displays a zoom-in between -1.5 V and -
2.5 V vs Ag/AgClO4.

106
CO2 is present in the solution (red curve), a reduction current is
observed with an onset potential ca. -1.8 V vs. Ag/AgClO4164. When both
propylene oxide and carbon dioxide are present in the solution (green
curve), a similar onset potential to CO2 reduction is observed (red
curve), but with a higher current between -1.8 and -2.2 V. This
observation suggests that a reaction other than mere CO2 reduction is
occurring, with a faster reaction rate in the early stages of the reaction
at potentials lower than -2.2 V. At more negative potentials than -2.2 V,
the reaction is favored when only CO2 is present. The lower reduction
current observed when both substances are present in comparison with
only CO2 in solution suggests that the presence of propylene oxide
hinders the reduction of CO2, possibly because it reacts with it to form a
new compound different from the reduction product of CO2.
6.3.2 FTIR and HPLC characterization of intermediates and products
The reaction of propylene oxide with carbon dioxide on copper
electrodes in TEAClO4 prepared in acetonitrile solutions was analyzed
by FTIR and HPLC. Fig.6.2 shows the transmission spectra for the
reactant (PO) and for the expected product propylene carbonate (PC).
The results show that PO does not have any vibrational mode active in
IR, while PC clearly shows features that can lead to its identification
with vibrational bands at 1800, 1392, 1184, 1118 and 1053 cm-1. The
absorbance spectrum of propylene carbonate in Fig. 6.2 shows that PC is
best identified by the characteristic C=O stretching band at 1800 cm-1.
Fig. 6.3 shows the time dependent absorbance spectra of the copper
electrode in the presence of 0.1 M propylene oxide and saturated CO2
atmosphere with an applied reduction current of – 5 mA cm-2. The
assignment of the different bands was done with the help of the
transmission spectra and previous reports on CO2 electrochemical
reduction in acetonitrile164 and is summarized in table 6.1. In addition,

Chapter 6 | Electrosynthesis of propylene carbonate
107
vibrational bands for possible decomposition products for PO where
also investigated by performing FTIR spectra of a copper electrode with
a TEAClO4 solution containing only propylene oxide under reductive
conditions (data not shown). The assignment of the decomposition
products is also included in Table 6.1.
Figure 6.2: Absorbance spectra of a 0.1 M TEAClO 4 solution prepared in
acetonitrile with propylene oxide (black) and with propylene carbonate (red).
Band at 1800 cm-1 indicates the C=O stretching band of propylene carbonate.
Fig. 6.3 displays the absorbance spectra taken at different times during
the electrosynthesis of propylene carbonate from propylene oxide and
carbon dioxide at an applied current of -5 mA/cm2. After one minute,
CO2 (2333cm-1) starts to be consumed and several bands corresponding
with the formation of products start to rise at 1647, 1481, 1361 and
1334 cm-1. These latter bands can be attributed to (bi)carbonate species,
CO32-, HCO2
-, CO32- and CO3
2- respectively, as described by Figueiredo et
al.164. Previous studies suggested that the existence of different vibrational
bands for C=O and C-O bonds on bicarbonates and carbonates is due to the
presence of different ion pairs of the anions with TEA+ cations or solvation
shells with residual water166. At longer times (5, 9, 13 and 17 minutes)
during the electroreduction of propylene oxide and carbon dioxide, the
Ab
so
rba
nce
/ a
.u.
4000 3500 3000 2500 2000 1500 1000
wavenumber / cm-1
Propylene oxide Propylene carbonate
0.1 M TEAClO4 / AcN
1800 cm-1

108
spectra show a band at 1800 cm-1 growing with time. Fig. 3b shows a zoom-
in of the spectral region where this band is observed. The band at 1800 cm-1
is attributed to the C=O stretching mode of propylene carbonate, according
to the absorbance spectra of propylene carbonate displayed in Fig. 6.2.
Importantly, simultaneously with the band 1800 cm-1, a band at 1731
cm-1 is observed. In order to evaluate if this band is due to byproducts,
the absorbance spectra of several species such as benzeneacetaldehyde,
ethylene glycol, 1-methoxy 2- propanol and 2-propanol were recorded
(data not shown). The absence of a band around 1731 cm-1 rules out
that the band comes from one of this species. Moreover, the band at
1731 cm-1 does not come from a species originating from further
reduction of propylene carbonate, since reduction of propylene
carbonate does not lead to a band at 1731 cm-1 (data not shown). We
suggest that the band at 1731 cm-1 might be due to the reductive
decomposition of propylene oxide. The attribution is done based on the
Absorb
ance / a
.u.
2400 2200 2000 1800 1600 1400 1200 1000 800
wavenumber / cm-1
Applied current: -5 mA/cm2 1 min
5 min 9 min 13 min 17 min
0.1 M PO + CO2 in 0.1M TEAClO4 / AcN
2333
1800
1731
1647
1481
1361 1334
1110
a)
2000 1750
wavenumber / cm-1
1800
b)
Figure 6.3: a) Time dependent absorbance spectra of a copper electrode in
the presence of 0.1 M propylene oxide and saturated carbon dioxide
atmosphere in 0.1M TEAClO4 in acetonitrile solution at -5 mA/cm2 after 1
minute (black), 5 minutes (red), 9 minutes (orange), 13 minutes (green) and
17 minutes (blue). b) zoom-in of spectra shown in a) between 2000-1720 cm-
1.

Chapter 6 | Electrosynthesis of propylene carbonate
109
observation that this band appears during the reduction of propylene
oxide in the absence of carbon dioxide. However, further studies must
be carried out to identify the nature of this species.
The electroreduction of propylene oxide and carbon dioxide on copper
was also carried out at different current densities (-2,-3,-4,-5 and -6
mA/cm2). Fig.6.4 displays the integrated areas of the band at 1800 cm-1
(attributed to propylene carbonate) as a function of the applied current
and time. The formation of propylene carbonate is observed after only 5
minutes of electrolysis giving increasing product formation with time
for all the different applied current densities. Moreover, applying higher
current densities leads to more product formation.
Table 6.1. Assignment of the FTIR bands
ν(cm-1
) assignment compound
2333 s C=O CO2
2295 s C-N acetonitrile
2252 s C-N acetonitrile
1800 s C=O propylene carbonate
1731 s C=O Possible propylene oxide decomposition product
1647 s C=O CO32-
1674 s C=O acetamide (acetonitrile decomposition product)
1628 b O-H Water
1585 s N-H acetamide (acetonitrile decomposition product)
1481 s C-O HCO3-
1361 s C-O CO32-
1334 s C-O CO32-
1178 s N-H acetamide (acetonitrile decomposition product)
1107 s Cl-O ClO4-

110
Fig. 6.5 shows the time dependent HPLC chromatograms obtained
during the reduction of 0.1 M propylene oxide and CO2 on a copper
electrode in a 0.1 M TEAClO4 in acetonitrile solution at -5 mA/cm2. Due
to large differences in peak intensities, the spectra are displayed in three
different panels for a better interpretation. Fig 6.5a shows the peak
corresponding to propylene oxide at 16.8 min. The intensity of the peak
decreases over time, indicating that propylene oxide is being consumed.
Fig 6.5b shows several peaks at 11.2, 13.1, 13.7, 14.9 and 15.4 minutes.
We attribute these peaks to the decomposition of propylene oxide
and/or decomposition of acetonitrile. This peak attribution is based on
comparison of the spectra obtained under the same conditions but in
the absence of CO2 and in the absence of CO2 and propylene oxide.
2.5x10⁻²
2.0
1.5
1.0
0.5
0.0
Are
a u
nder
peak a
t 1800 c
m-1
181614121086420time / min
-2 mA/cm2
-4 mA/cm2
-5 mA/cm2
-6 mA/cm2
Applied current
0.1 M PO + CO2 in 0.1M TEAClO4 / AcN
Figure 6.4: Area measured under the band at 1800 cm -1 (corresponding to
propylene carbonate) observed during the reduction of PO and CO 2 on copper
in 0.1 M TEAClO4 in acetonitrile solution at different current densities and
different times.

Chapter 6 | Electrosynthesis of propylene carbonate
111
In the absence of CO2, the peaks at 11.2, 13.1 and 13.7 minutes were
present, suggesting that this species results from decomposition of
propylene oxide. When the spectra were recorded in the absence of CO2
and propylene oxide, the peaks at 14.9 and 15.4 were present,
suggesting that the species comes from the decomposition of the
electrolyte. It is known that acetonitrile under reductive conditions in
the presence of residual amounts of water decomposes in acetamide, as
suggested by previous studies164, 167. However, the species have not been
characterized with certainty and further studies would be necessary to
identify them.
Finally, Fig.6.5c shows the peak attributed to the formation of propylene
carbonate at 25.5 min. The double-peak nature of the peak can be
tentatively attributed to different solvations of propylene carbonate. As
explained before, experiments were performed in acetonitrile solutions
but for the HPLC analysis, an eluent of aqueous base is used. This might
cause the presence of propylene carbonate solvated by water and also
solvated by acetonitrile, that will have slightly different retention times
causing the split of the peak in two contributions. Nevertheless, the
results show that the production of propylene carbonate during
electrolysis at -5 mA/cm2 increases with time. Different current
densities were applied (-2 and -4 mA/cm2) to evaluate the effect of the
applied current to the formation of propylene carbonate. The integrated
area under the peak at 25.5 min and the applied current are displayed in
Fig.6.6 as a function of time. As expected, the amount of product formed
increases with time and with the applied current density.

112
The combination of the FTIR and HPLC experiments confirm the
formation of propylene carbonate from propylene oxide and carbon
dioxide on copper electrodes. However, as the used organic solvents
were not dry and contain residual water, reduction of water can also
take place at these applied currents and potentials, leading to the
generation of OH-. In order to ensure that this is an electrochemical
process and not a chemical synthesis catalyzed by the presence of OH-,
5x10⁴
4
3
2
1
0
Inte
nsity
18.017.517.016.516.0Retention time / min
0.1 M PO + CO2 // TEACLO4 in AcNApplied current = -5 mA/cm2
16.8
a)
1 min 5 min 10 min 20 min 30 min
150
100
50
0
Inte
nsity
201816141210Retention time / min
0.1 M PO + CO2 // TEACLO4 in AcNApplied current = -5 mA/cm2
13.7
14.911.2
13.1
15.4
b)
150
100
50
0
-50
Inte
nsity
3028262422Retention time / min
0.1 M PO + CO2 // TEACLO4 in AcNApplied current = -5 mA/cm2
25.5
c)
Figure 6.5: Time dependent chromatograms obtained by HPLC during the
reduction of 0.1 M propylene oxide and CO 2 on copper in a 0.1 M TEAClO4 in
acetonitrile solution at -5 mA/cm2. a) Displays the region between 16 and 18
minutes. b) Displays the region between 10 and 20 minutes. c) Displays the
region between 22 and 30 minutes.

Chapter 6 | Electrosynthesis of propylene carbonate
113
the spectra of propylene oxide and CO2 in the presence of a strong base
(TEAOH) were recorded (see appendix V, Figure AV.1). The spectra
show an intense band at 2341 cm-1 corresponding to C=O stretching
from CO2 in solution. Less intense bands at 1670 cm-1 corresponding to
decomposition products from the acetonitrile were also observed.
However, the absence of a band at 1800 cm-1 that would correspond to
propylene carbonate, supports the electrochemical nature of the
synthesis of propylene carbonate instead of a chemical reaction
catalyzed by the electrogenerated OH-, in accordance with the results
observed by Yang et al.78
1.0x10⁴
0.8
0.6
0.4
0.2
0.0
Inte
nsity
201612840time / min
-2 mA/cm2
-4 mA/cm2
-5 mA/cm2
Applied current
0.1 M PO + CO2 // TEACLO4 in AcN
Figure 6.6: Area measured under the peak at 25.5 minutes (corresponding to
propylene carbonate) observed during the reduction of PO and CO 2 on copper
in 0.1 M TEAClO4 in acetonitrile solution at different current densities and
different times.

114
6.3.3 Proposed mechanism
In the interest of understanding the mechanism of electrochemical
formation of propylene carbonate from propylene oxide and CO2 on
copper, CO and carbonates (two known products from CO2
electroreduction) were tested as the possible electroactive species for
the synthesis of propylene carbonate.
Fig. 6.7 shows the time dependent absorbance spectra of copper in the
presence of 0.1 M propylene oxide and saturated carbon monoxide
atmosphere in 0.1 M TEAClO4 in acetonitrile solution at -5 mA/cm2.
Carbon monoxide is known to be an intermediate of CO2 reduction on
copper electrodes in aqueous electrolytes60, 168-169. However, the absence
of the band at 1800 cm-1 (corresponding with propylene carbonate)
when CO2 is exchanged for CO, discards CO as the electroactive species
in the mechanism of propylene carbonate formation.
Previous studies of CO2 reduction in non-aqueous solvents showed that
the main products formed at high overpotentials are bi(carbonates)164.
In our work, (bi)carbonates were indeed formed during the
electrochemical reaction of propylene oxide and CO2, identifiable by the
bands observed at 1647, 1481, 1361 and 1334 cm-1 in Fig.6.3. The bands
attributed to (bi)carbonate formation during the electroreduction of
propylene oxide and CO2 decrease with time (see Fig.6.3) while the
formation of propylene carbonate (band at 1800 cm-1) increases with
time. A possible explanation of these observations would be that
(bi)carbonates are being first formed by reduction of CO2 and then
consumed by reacting with propylene oxide to form propylene
carbonate.
However, when FTIR spectra were recorded using TEAHCO3 in solution
instead of bubbling CO2, formation of propylene carbonate was not
observed (Figure 6.8). Therefore, we rule out (bi)carbonates as the
electroactive species for the formation of propylene carbonate on
copper. The intensity decrease of the (bi)carbonates bands observed in

Chapter 6 | Electrosynthesis of propylene carbonate
115
Fig.6.3 at longer electrolysis times appears to be mirrored by the
increase of the intensity of the band at 2333 cm-1 corresponding to the
C=O stretching mode of CO2, which is no longer being reduced to
(bi)carbonates.
Due to the low solubility of TEAHCO3 in acetonitrile, (bi)carbonates
were also generated in situ by reduction of CO2 on copper. After 30
minutes of electrolysis at saturated carbon dioxide atmosphere at -2.5 V
vs Ag/AgClO4 with the subsequent generation of (bi)carbonates,
Absorb
ance / a
.u.
2400 2200 2000 1800 1600 1400 1200 1000 800
wavenumber / cm-1
Absorb
ance / a
.u.
1850 1800 1750
Wavelenght / cm-1
Applied current = -5 mA/cm2
0.1 M PO + CO // TEAClO4 in AcN
1 min 9 min 13 min 17 min 30 min
Figure 6.7: Time dependent absorbance spectra of copper in the presence of
0.1 M propylene oxide and saturated carbon monoxide atmosphere in 0.1M
TEAClO4 in acetonitrile solution at -5 mA/cm2 after 1 minute (black), 9
minutes (red), 13 minutes (yellow), 17 minutes (green) and 30 minut es
(blue). Insert displays zoom-in of the region of the spectra between 1850-
1750 cm-1.

116
propylene oxide was added to the electrochemical cell, and a current
density of -5 mA/cm2 was applied, recording the spectra every 4
minutes (data not shown). In situ generated (bi)carbonates also do not
generate the vibrational band characteristic for propylene carbonate at
1800 cm-1. Therefore, we exclude (bi)carbonates as the electroactive
species for the formation of propylene carbonate on copper electrodes.
Homogeneous catalysis studies concerning the synthesis of propylene
carbonate have proposed the activation of propylene oxide74, 170 as the
rate determining step, in which the catalyst induces a nucleophilic
attack on the non-substituted carbon of the epoxide causing the opening
Absorb
ance / a
.u.
2400 2200 2000 1800 1600 1400 1200 1000 800
wavenumber / cm-1
Absorb
ance / a
.u.
1850 1800 1750
Wavelenght / cm-1
0.1 M PO + 1 mM TEAHCO3 // TEAClO4 in AcNApplied current = -5 mA/cm2
1 min 5 min 9 min 13 min 30 min
Figure 6.8: Time dependent absorbance spectra of copper in the presence of
0.1 M propylene oxide and 0.01 M TEAHCO3 in 0.1M TEAClO4 in acetonitrile
solution at -5 mA/cm2 after 1 minute (black), 9 minutes (red), 13 minutes
(yellow), 17 minutes (green) and 30 minutes (blue). Insert displays zoom-in
of the region of the spectra between 1850-1750 cm-1.

Chapter 6 | Electrosynthesis of propylene carbonate
117
of the ring. Foltran et al. proposed three possible reaction pathways74:
(1) Catalyst and CO2 acts simultaneously on the epoxide, (2) Catalyst
activates the epoxide before addition of CO2 and (3) Activation of CO2 by
the catalyst occurs before the activation of the epoxide. Reaction path 1
and 2 were structurally and energetically investigated by Foltran and
co-workers using density functional theory (DFT) 74, from which they
selected path 2, in which the catalyst activates the epoxide by ring
opening before the addition of CO2 as the most preferable pathway. Path
3, in which the activation of CO2 by the catalyst occurs before the
addition of the epoxide was not investigated due to the high energy
needed to activate CO2.
The activation of propylene oxide as a required step for the synthesis of
propylene carbonate on copper electrodes was evaluated in the
experiment illustrated in Fig 6.9, which shows time-dependent
absorbance spectra at different conditions. First, absorbance spectra
were recorded after propylene oxide was reduced at -5 mA/cm2 for 30
minutes (black line). This first conditioning step was expected to
activate the epoxide and thus lead to opening of the ring. The next step
was to introduce CO2 in the electrochemical cell (at a current density of -
1 mA/cm2 at which no propylene carbonate was observed in previous
experiments) and spectra was recorded every 4 minutes for 45 minutes
(red and yellow lines). If the activated propylene oxide would indeed be
the active species, propylene carbonate should form after the addition of
CO2. However, the absence of the band at 1800 cm-1 when a mild
reduction current was applied with CO2 present in solution, suggests
that CO2 needs to be activated. Indeed, when in the presence of CO2 and
propylene oxide a higher current is applied (-5mA/cm2) it results in the
formation of propylene carbonate (green line). These experimental
results suggest that under electrochemical conditions the reaction
pathway starts with the activation of CO2 by the electrode before the
activation of the epoxide, in agreement with the conclusion of Wang et
al.81. In addition, no evidence of any substance coming from an opening
of the epoxide ring prior to the formation of PC has been observed by
FTIR (the band at 1731 cm-1 does not appear to correspond to a ring-

118
opening product). Therefore, we suggest the electroreduction of CO2 to
CO2·- as a key step for the formation of propylene carbonate, in
accordance with the work of Xiao et al. and Wang et al.81, 84. However,
the observation of the CO2 radical anion as an intermediate of the
reaction is not easily confirmed by FTIR due to its short lifetime.
Absorb
ance / a
.u.
2400 2200 2000 1800 1600 1400 1200 1000 800
wavenumber / cm-1
Absorb
ance / a
.u.
1800 1775
Wavelenght / cm-1
PO at -5 mA/cm2 after 30 min
PO + CO2 at -1 mA/cm2 after 5min
PO + CO2 at -1 mA/cm2 after 45min
PO + CO2 at -5 mA/cm2 after 10 min
Figure 6.9: Time- and current-dependent absorbance spectra of a copper
electrode in the presence of propylene oxide at -5 mA/cm2 after 30 minutes
(black), in the presence of propylene oxide and carbon dioxide at -1 mA/cm2
after 5 minutes (red) and after 45 minutes (yellow) and in the presence of
propylene oxide and carbon monoxide at -5 mA/cm2 after 10 minutes (green).
The inset displays the zoom-in of the region between 1900 - 1750 cm-1.

Chapter 6 | Electrosynthesis of propylene carbonate
119
6.3.3 Electrosynthesis of propylene carbonate on other metals
In the interest of understanding whether the process of propylene
carbonate formation is an electrocatalytic reaction or simply a
electrochemical process with no strong effect of the electrode material
used, Au and Pt were tested as cathodes for the electrochemical
conversion of propylene oxide and CO2 to propylene carbonate.
Fig.6.10 shows the time-dependent absorbance spectra for gold
(Fig.6.10a) and for platinum (Fig.6.10b) in 0.1M TEAClO4, in the
presence of 0.1 M PO and CO2 atmosphere, in acetonitrile solution at an
applied current of -5mA/cm2. The attribution of the bands observed are
Absorb
ance / a
.u.
2400 2200 2000 1800 1600 1400 1200 1000
Wavelenght / cm-1
1850 1800 1750
Wavelenght / cm-1
Applied current = -5mA/cm2
blanc 2 min 6 min 10 min 17 min
0.1 M PO + CO2 in 0.1 M TEAClO4 / AcN
Polycrystalline Pt
b)
Absorb
ance / a
.u.
2400 2200 2000 1800 1600 1400 1200 1000
Wavelenght / cm-1
1850 1800 1750
Wavelenght / cm-1
Applied current = -5mA/cm2
blanc 2 min 6 min 10 min 17 min
0.1 M PO + CO2 in 0.1 M TEAClO4 / AcN
Polycrystalline Au
a)
Figure 6.10: Time-dependent absorbance spectra for a) Au and b) Pt in the
presence of 0.1 M propylene oxide and saturated carbon dioxide atmosphere
in 0.1M TEAClO4 in acetonitrile solution at -5 mA/cm2 . Inserts display the
zoom-in of the region of the spectra between 1900 and 1700 cm-1.

120
summarized in Table 6.1. On both electrode materials, a band at
1800cm-1 corresponding to the C=O stretching mode of propylene
carbonate is observed. The results suggest that the reaction is
electrochemical but it is not sensitive to the cathode material. Previous
studies have reported the synthesis of propylene carbonate on other
materials such as stainless steel84 and nickel81, in agreement with the
non-electrocatalytic character of this reaction.
6.4 Conclusion
The electrosynthesis of propylene carbonate from propylene oxide and
carbon dioxide on copper electrodes in TEAClO4 in acetonitrile solutions
has been investigated by cyclic voltammetry, FTIR and HPLC. The cyclic
voltammogram of copper in the presence of propylene oxide and carbon
dioxide shows a reduction current attributed to the formation of
propylene carbonate. The formation of propylene carbonate was
confirmed by FTIR spectroscopy and HPLC, showing the expected
increased product formation at longer times and higher currents. The
reaction between propylene oxide and carbon dioxide is an
electrochemical reaction, initiated by the activation of CO2 to CO2-. Both
CO and carbonates were ruled out as intermediates for propylene
carbonate synthesis on copper due to the absence of the formation of
the cyclic carbonate. Base catalysis was also ruled as a possible
mechanism. Moreover, the need of propylene oxide activation via ring
opening before the further attack of CO2 was ruled out since no product
was detected if a current was not applied in presence of “activated
propylene oxide” and CO2. Therefore, we suggest that the key step in the
synthesis of propylene carbonate is the activation of CO2 by forming the
radical anion CO2·-, which will attack the epoxide to form propylene
carbonate. The formation of propylene carbonate also occurs on other
metals such as gold and platinum, giving evidence for the non-
electrocatalytic nature of the reaction.

121
Summary
Heterogeneous catalysis is of paramount importance in industrial
processes such as the formation of ammonia, the formation of syngas,
the catalytic cracking of oil, the formation of sulfuric acid and the
formation of nitric acid, among many others. However, these processes
require high temperature and pressure to achieve an efficient
conversion. In addition, some of these processes lead to undesirable side
products which can be environmentally damaging or can affect the
catalyst, deteriorating it and thus leading to rapid efficiency loss.
A reasonable alternative for high-temperature industrial processes
would be the use of electrocatalysis, which presents several advantages
over conventional catalysis. First of all, electrons as reducing/oxidant
agents contribute to cleaner processes. Secondly, the use of mild process
conditions such as lower temperatures and pressures potentially leads
to a higher stability of the starting material or products. Moreover, since
the product distribution depends on the applied potential, controlling
the potential would in principle allow for the selective formation of the
aimed products avoiding harmful and/or undesired by-products.
However, the electrochemical synthesis of chemicals is not widespread
in industry. The reasons for this limited use of electrochemical
techniques can be attributed to a lack of electrochemistry education, a
lack of resources for the construction of electrochemical cells and
especially to the high costs of electricity and electrochemical cells. The
high energy input can be overcome by the use of cheap and abundant
catalysts and electricity from renewable sources. Nevertheless, an
efficient process must be developed before it has an industrial
application. For this purpose, an exhaustive study of the electrochemical
reaction must be performed first, in order to understand and control all
the different parameters that affect the reaction, its product
distribution, selectivity and efficiency.

122
In this thesis, we have discussed several parameters that affect the
electrochemical conversion of environmentally harmful molecules such
as nitrates and carbon dioxide to more valuable and less deleterious
compounds, in order to cast light onto the mechanism of the reaction to
achieve an efficient and selective system.
This thesis is divided in two main parts, the reduction of nitrates
(chapter 2) and the mechanistic study of CO2 conversion to different
products such as ethanol (chapter 3), ethylene (chapter 4 and 5) and
propylene carbonate (chapter 6).
Numerous previous works have studied the difference in product
distribution during the reduction of nitrate on several metals and at
several pH’s. In chapter 2 of this thesis, we studied the electrocatalytic
reduction of nitrate on copper electrodes. The influence of the electrode
surface morphology was studied by employing two different copper
single crystals, namely Cu(100) and Cu(111). In addition, the
experiments were performed in acidic and in alkaline media, providing
then a study of the influence of the pH in this reaction. The experiments
have shown that the product distribution varies depending on the pH of
the electrolyte. While in acidic media the products formed are NO and
ammonia, in alkaline media the main product is hydroxylamine. In
addition, the reduction of nitrate is structure sensitive only in basic
media, with the formation of hydroxylamine favoured on Cu(100).
On the other hand, the electrochemical reduction of carbon dioxide has
received considerable attention in the last decades due to the capability
of copper to convert CO2 into fuels such as methane, ethylene and
ethanol. Although this process was discovered in the 1980’s, the
mechanism of the reaction is still under debate.
The reduction of carbon dioxide on copper has ethylene as its main C2
product. Nevertheless, trace amounts of ethanol and acetaldehyde have
been also observed. Since acetaldehyde has been confirmed as an
intermediary for ethanol formation during the reduction of carbon
monoxide, in chapter 3 we discuss the mechanistic implications of

123
acetaldehyde reduction to ethanol during CO2 reduction. It is believed
that these three compounds share a common intermediate at the early
stages of CO2 reduction. However, the pathway for ethylene and ethanol
formation must bifurcate at later stages of the reaction. Our results have
shown that the selectivity-determining intermediate is the product of
the fifth protonation (CH2CHO*). The protonation of this intermediate
favours ethanol formation on undercordinated sites. In contrast, square
symmetry sites favour the formation of ethylene. Despite the higher
energetic barriers found for ethanol compared to ethylene, the
selectivity for ethanol can be increased by making use of the structure
selectivity of the reaction.
Another interesting step in the mechanism of CO2 reduction is related to
the formation of ethylene. The only intermediate experimentally
confirmed during the reduction of CO2 to ethylene has been CO.
Computational studies have hypothesized that the C-C bond formation
in the ethylene pathway occurs via a reductive dimerization step and
further hydrogenation. In chapter 4 we provided spectroscopic evidence
for the formation of a CO hydrogenated intermediate (OCCOH) in the
ethylene pathway. The formation of this intermediate has been
confirmed to be structure sensitive, being favourable mostly on square
symmetry sites.
Several factors such as the pH of the electrolyte, the chemical nature of
cations or anions and the morphology of the electrode surface have been
previously studied for the reduction of CO2. All these parameters lead to
significant changes in product distribution, selectivity and conversion
rate. In chapter 5 we analyse the combined effect of electrode
morphology, alkaline cation size and applied potential during CO
reduction. In general, larger cations enhance the formation of ethylene
at potentials more positive than -0.45V, whereas larger cations enhance
the formation of methane at more negative potentials. We suggested
that the ethylene pathway shuts down by the enhancement of the
methane pathway, this correlation also being dependent on the cation
size. Larger cations enhance the ethylene selectivity over a wider
124
potential range. We suggested that the cations act as catalytic promoters
stabilizing intermediates with a favourable electrostatic interaction with
the cation. In addition, the formation of the CO hydrogenated dimer
explained in chapter 4 (OCCOH) has been found to be dependent on the
cation size. Whereas the hydrogenated dimer is observable in FTIR
when Li+, Na+ and K+ are present, it is not observable in the presence of
Rb+ or Cs+. DFT calculations describe the formation of *OCCOH as less
favourable in presence of larger cations compared to smaller cations.
Finally, we studied in chapter 6 the conversion of carbon dioxide into
larger organic molecules, specifically into cyclic carbonates. We
analyzed the mechanism of the formation of propylene carbonate from
carbon dioxide and propylene oxide on copper electrodes. We excluded
carbon monoxide and (bi)carbonate as possible carboxylation agents.
Moreover, we discarded the activation of propylene oxide via ring
opening as the key step for this reaction. Our experiments suggest that
the electrochemical reaction is initiated by the activation of CO2 to CO2-·,
which attacks propylene oxide to ultimately form propylene carbonate.
In general terms, this thesis has stressed the importance of exhaustive
mechanistic studies in order to gain knowledge of all the steps involved
in an electrochemical reaction. The understanding of how different
factors affect the selectivity and conversion towards a certain product
can help in achieving more efficient processes, which can be steered to
the formation of desired products by adjusting different parameters
involved in the reaction.

125
References
1. Zumft, W. G., Cell biology and molecular basis of denitrification. Microbiology and molecular biology reviews 1997, 61 (4), 533-616. 2. O'Brien, T. F.; Bommaraju, T. V.; Hine, F., Handbook of Chlor-Alkali Technology: Volume I: Fundamentals, Volume II: Brine Treatment and Cell Operation, Volume III: Facility Design and Product Handling, Volume IV: Operations, Volume V: Corrosion, Environmental Issues, and Future Developments. Springer Science & Business Media: 2007; Vol. 1. 3. Gluszcz, P.; Fürch, K.; Ledakowicz, S., Mercury in the chlor-alkali electrolysis industry. In Bioremediation of Mercury: Current Research and Industrial Applications, Caister Academic Press Norfolk, UK: 2013; pp 97-118. 4. Grjotheim, K.; Krohn, C.; Malinovsky, M.; Matiasovsky, K.; Thonstad, J., Aluminium electrolysis. Fundamentals of hall-Heroult process. 2-nd edition. J. Thonstad. Düsseldorf: Aluminium-Verlag 1982. 5. Sequeira, C.; Santos, D., Electrochemical routes for industrial synthesis. Journal of the Brazilian Chemical Society 2009, 20 (3), 387-406. 6. Beck, F., Electrosynthesis of adiponitrile in undivided cells. J. Appl. Electrochem. 1972, 2 (1), 59-69. 7. Ding, H.; DeRoy, P. L.; Perreault, C.; Larivée, A.; Siddiqui, A.; Caldwell, C. G.; Harran, S.; Harran, P. G., Electrolytic Macrocyclizations: Scalable Synthesis of a Diazonamide-Based Drug Development Candidate. Angew. Chem. Int. Ed. 2015, 54 (16), 4818-4822. 8. Burgett, A. W.; Li, Q.; Wei, Q.; Harran, P. G., A Concise and Flexible
Total Synthesis of (−)‐Diazonamide A. Angew. Chem. 2003, 115 (40), 5111-5116. 9. Kita, Y.; Tohma, H.; Kikuchi, K.; Inagaki, M.; Yakura, T., Hypervalent iodine oxidation of N-acyltyramines: synthesis of quinol ethers, spirohexadienones, and hexahydroindol-6-ones. The Journal of Organic Chemistry 1991, 56 (1), 435-438. 10. Martínez-Huitle, C. A.; Rodrigo, M. A.; Sirés, I.; Scialdone, O., Single and Coupled Electrochemical Processes and Reactors for the Abatement of Organic Water Pollutants: A Critical Review. Chem. Rev. 2015, 115 (24), 13362-13407. 11. Ghernaout, D.; Naceur, M. W.; Aouabed, A., On the dependence of chlorine by-products generated species formation of the electrode material

126
and applied charge during electrochemical water treatment. Desalination 2011, 270 (1), 9-22. 12. Moorcroft, M. J.; Davis, J.; Compton, R. G., Detection and determination of nitrate and nitrite: a review. Talanta 2001, 54 (5), 785-803. 13. Reyter, D.; Chamoulaud, G.; Bélanger, D.; Roué, L., Electrocatalytic reduction of nitrate on copper electrodes prepared by high-energy ball milling. J. Electroanal. Chem. 2006, 596 (1), 13-24. 14. Carpenter, S. R.; Caraco, N. F.; Correll, D. L.; Howarth, R. W.; Sharpley, A. N.; Smith, V. H., Nonpoint pollution of surface waters with phosphorus and nitrogen. Ecological applications 1998, 8 (3), 559-568. 15. Lee, Y. W.; Dahab, M. F.; Bogardi, I., Nitrate risk management under uncertainty. Journal of Water Resources Planning and Management 1992, 118 (2), 151-165. 16. Galloway, J. N.; Schlesinger, W. H.; Levy, H.; Michaels, A.; Schnoor, J. L., Nitrogen fixation: Anthropogenic enhancement-environmental response. Global Biogeochemical Cycles 1995, 9 (2), 235-252. 17. Adam, J., Health aspects of nitrate in drinking-water and possible means of denitrification (literature review). Water SA 1980, 6 (2), 79-89. 18. Wakida, F. T.; Lerner, D. N., Non-agricultural sources of groundwater nitrate: a review and case study. Water research 2005, 39 (1), 3-16. 19. Mani, K., Electrodialysis water splitting technology. Journal of membrane science 1991, 58 (2), 117-138. 20. Panyor, L.; Fabiani, C., Anion rejection in a nitrate highly rejecting reverse osmosis thin-film composite membrane. Desalination 1996, 104 (3), 165-174. 21. Schoeman, J.; Steyn, A., Nitrate removal with reverse osmosis in a rural area in South Africa. Desalination 2003, 155 (1), 15-26. 22. Matějů, V.; Čižinská, S.; Krejčí, J.; Janoch, T., Biological water denitrification—a review. Enzyme and Microbial Technology 1992, 14 (3), 170-183. 23. Duca, M.; Koper, M. T., Powering denitrification: the perspectives of electrocatalytic nitrate reduction. Energy Environ. Sci. 2012, 5 (12), 9726-9742. 24. Rosca, V.; Duca, M.; de Groot, M. T.; Koper, M. T., Nitrogen cycle electrocatalysis. Chem. Rev. 2009, 109 (6), 2209-2244. 25. Da Cunha, M.; De Souza, J.; Nart, F., Reaction Pathways for Reduction of Nitrate Ions on Platinum, Rhodium, and Platinum− Rhodium Alloy Electrodes. Langmuir 2000, 16 (2), 771-777.

127
26. De Groot, M.; Koper, M., The influence of nitrate concentration and acidity on the electrocatalytic reduction of nitrate on platinum. J. Electroanal. Chem. 2004, 562 (1), 81-94. 27. Tucker, P. M.; Waite, M. J.; Hayden, B. E., Electrocatalytic reduction of nitrate on activated rhodium electrode surfaces. J. Appl. Electrochem. 2004, 34 (8), 781-796. 28. Li, M.; Feng, C.; Zhang, Z.; Sugiura, N., Efficient electrochemical reduction of nitrate to nitrogen using Ti/IrO 2–Pt anode and different cathodes. Electrochim. Acta 2009, 54 (20), 4600-4606. 29. Pletcher, D.; Poorabedi, Z., The reduction of nitrate at a copper cathode in aqueous acid. Electrochim. Acta 1979, 24 (12), 1253-1256. 30. Dima, G.; Beltramo, G.; Koper, M., Nitrate reduction on single-crystal platinum electrodes. Electrochim. Acta 2005, 50 (21), 4318-4326. 31. Taguchi, S.; Feliu, J. M., Electrochemical reduction of nitrate on Pt (S)[n (111)×(111)] electrodes in perchloric acid solution. Electrochim. Acta 2007, 52 (19), 6023-6033. 32. Dima, G.; De Vooys, A.; Koper, M., Electrocatalytic reduction of nitrate at low concentration on coinage and transition-metal electrodes in acid solutions. J. Electroanal. Chem. 2003, 554, 15-23. 33. Yang, J.; Sebastian, P.; Duca, M.; Hoogenboom, T.; Koper, M. T., pH dependence of the electroreduction of nitrate on Rh and Pt polycrystalline electrodes. Chemical Communications 2014, 50 (17), 2148-2151. 34. Brylev, O.; Sarrazin, M.; Bélanger, D.; Roué, L., Rhodium deposits on pyrolytic graphite substrate: Physico-chemical properties and electrocatalytic activity towards nitrate reduction in neutral medium. Appl. Catal. B 2006, 64 (3), 243-253. 35. Duca, M.; van der Klugt, B.; Koper, M., Electrocatalytic reduction of nitrite on transition and coinage metals. Electrochim. Acta 2012, 68, 32-43. 36. Badea, G. E., Electrocatalytic reduction of nitrate on copper electrode in alkaline solution. Electrochim. Acta 2009, 54 (3), 996-1001. 37. Reyter, D.; Bélanger, D.; Roué, L., Study of the electroreduction of nitrate on copper in alkaline solution. Electrochim. Acta 2008, 53 (20), 5977-5984. 38. Bouzek, K.; Paidar, M.; Sadilkova, A.; Bergmann, H., Electrochemical reduction of nitrate in weakly alkaline solutions. J. Appl. Electrochem. 2001, 31 (11), 1185-1193. 39. Yang, H.; Xu, Z.; Fan, M.; Gupta, R.; Slimane, R. B.; Bland, A. E.; Wright, I., Progress in carbon dioxide separation and capture: A review. Journal of environmental sciences 2008, 20 (1), 14-27.

128
40. Yamasaki, A., An overview of CO2 mitigation options for global warming—emphasizing CO2 sequestration options. Journal of Chemical Engineering of Japan 2003, 36 (4), 361-375. 41. Huijgen, W. J. J.; Comans, R. N. J. Carbon dioxide sequestration by mineral carbonation. Literature Review; Energy research Centre of the Netherlands ECN: 2003. 42. Hori, Y.; Kikuchi, K.; Suzuki, S., Production of CO and CH4 in electrochemical reduction of CO2 at metal electrodes in aqueous hydrogencarbonate solution. Chem. Lett. 1985, 14 (11), 1695-1698. 43. Noda, H.; Ikeda, S.; Oda, Y.; Imai, K.; Maeda, M.; Ito, K., Electrochemical reduction of carbon dioxide at various metal electrodes in aqueous potassium hydrogen carbonate solution. Bull. Chem. Soc. Jpn. 1990, 63 (9), 2459-2462. 44. Hansen, H.; Varley, J.; Peterson, A.; Norskov, J.; Nørskov, J., Understanding Trends in the Electrocatalytic Activity of Metals and Enzymes for CO2Reduction to CO. J. Phys. Chem. Lett. 2013, 4 (3), 388-392. 45. Sullivan, B. P.; Krist, K.; Guard, H., Electrochemical and electrocatalytic reactions of carbon dioxide. Elsevier: 2012. 46. Summers, D. P.; Leach, S.; Frese, K. W., The electrochemical reduction of aqueous carbon dioxide to methanol at molybdenum electrodes with low overpotentials. J. Electroanal. Chem. Interfacial Electrochem. 1986, 205 (1-2), 219-232. 47. Hori, Y.; Takahashi, I.; Koga, O.; Hoshi, N., Selective formation of C2 compounds from electrochemical reduction of CO2 at a series of copper single crystal electrodes. J. Phys. Chem. B 2002, 106 (1), 15-17. 48. Li, C. W.; Ciston, J.; Kanan, M. W., Electroreduction of carbon monoxide to liquid fuel on oxide-derived nanocrystalline copper. Nature 2014, 508 (7497), 504-507. 49. Gattrell, M.; Gupta, N.; Co, A., A review of the aqueous electrochemical reduction of CO 2 to hydrocarbons at copper. J. Electroanal. Chem. 2006, 594 (1), 1-19. 50. Kuhl, K. P.; Cave, E. R.; Abram, D. N.; Jaramillo, T. F., New insights into the electrochemical reduction of carbon dioxide on metallic copper surfaces. Energy Environ. Sci. 2012, 5 (5), 7050-7059. 51. Schouten, K.; Kwon, Y.; Van der Ham, C.; Qin, Z.; Koper, M., A new mechanism for the selectivity to C 1 and C 2 species in the electrochemical reduction of carbon dioxide on copper electrodes. Chem. Sci. 2011, 2 (10), 1902-1909.

129
52. Kortlever, R.; Shen, J.; Schouten, K. J. P.; Calle-Vallejo, F.; Koper, M. T., Catalysts and reaction pathways for the electrochemical reduction of carbon dioxide. J. Phys. Chem. Lett. 2015, 6 (20), 4073-4082.
53. Calle‐Vallejo, F.; Koper, M., Theoretical considerations on the electroreduction of CO to C2 species on Cu (100) electrodes. Angew. Chem. Int. Ed. 2013, 52 (28), 7282-7285. 54. Li, H.; Li, Y.; Koper, M. T.; Calle-Vallejo, F., Bond-making and breaking between carbon, nitrogen, and oxygen in electrocatalysis. J. Am. Chem. Soc. 2014, 136 (44), 15694-15701. 55. Verdaguer-Casadevall, A.; Li, C. W.; Johansson, T. P.; Scott, S. B.; McKeown, J. T.; Kumar, M.; Stephens, I. E.; Kanan, M. W.; Chorkendorff, I., Probing the active surface sites for CO reduction on oxide-derived copper electrocatalysts. J. Am. Chem. Soc. 2015, 137 (31), 9808-9811. 56. Varela, A. S.; Ju, W.; Reier, T.; Strasser, P., Tuning the Catalytic Activity and Selectivity of Cu for CO2 Electroreduction in the Presence of Halides. ACS Catal. 2016, 6 (4), 2136-2144. 57. Peterson, A. A.; Abild-Pedersen, F.; Studt, F.; Rossmeisl, J.; Nørskov, J. K., How copper catalyzes the electroreduction of carbon dioxide into hydrocarbon fuels. Energy Environ. Sci. 2010, 3 (9), 1311-1315. 58. Montoya, J. H.; Shi, C.; Chan, K.; Nørskov, J. K., Theoretical Insights into a CO Dimerization Mechanism in CO2 Electroreduction. J. Phys. Chem. Lett. 2015, 6 (11), 2032-2037. 59. Schouten, K. J. P.; Qin, Z.; Gallent, E. P.; Koper, M. T. M., Two Pathways for the Formation of Ethylene in CO Reduction on Single-Crystal Copper Electrodes. J. Am. Chem. Soc. 2012, 134 (24), 9864-9867. 60. Hori, Y.; Wakebe, H.; Tsukamoto, T.; Koga, O., Electrocatalytic process of CO selectivity in electrochemical reduction of CO2 at metal electrodes in aqueous media. Electrochim. Acta 1994, 39 (11–12), 1833-1839. 61. Hori, Y.; Takahashi, R.; Yoshinami, Y.; Murata, A., Electrochemical reduction of CO at a copper electrode. J. Phys. Chem. B 1997, 101 (36), 7075-7081. 62. Hori, Y.; Murata, A.; Takahashi, R.; Suzuki, S., Electroreduction of CO to CH/sub 4/and C/sub 2/H/sub 4/at a copper electrode in aqueous solutions at ambient temperature and pressure. J. Am. Chem. Soc.;(United States) 1987, 109 (16). 63. Schouten, K. J. P.; Gallent, E. P.; Koper, M. T., The influence of pH on the reduction of CO and CO2 to hydrocarbons on copper electrodes. J. Electroanal. Chem. 2014, 716, 53-57.

130
64. Schouten, K. J. P.; Perez Gallent, E.; Koper, M. T., Structure sensitivity of the electrochemical reduction of carbon monoxide on copper single crystals. ACS Catal. 2013, 3 (6), 1292-1295. 65. Murata, A.; Hori, Y., Product selectivity affected by cationic species in electrochemical reduction of CO2 and CO at a Cu electrode. Bull. Chem. Soc. Jpn. 1991, 64 (1), 123-127. 66. Kas, R.; Kortlever, R.; Milbrat, A.; Koper, M. T.; Mul, G.; Baltrusaitis, J., Electrochemical CO 2 reduction on Cu 2 O-derived copper nanoparticles: controlling the catalytic selectivity of hydrocarbons. Phys. Chem. Chem. Phys. 2014, 16 (24), 12194-12201. 67. Christophe, J.; Doneux, T.; Buess Herman, C., Electroreduction of Carbon Dioxide on Copper-Based Electrodes: Activity of Copper Single Crystals and Copper–Gold Alloys. Electrocatalysis 2012, 3 (2), 139-146. 68. Angamuthu, R.; Byers, P.; Lutz, M.; Spek, A. L.; Bouwman, E., Electrocatalytic CO2 conversion to oxalate by a copper complex. Science 2010, 327 (5963), 313-315. 69. Tundo, P.; Selva, M., The chemistry of dimethyl carbonate. Acc. Chem. Res. 2002, 35 (9), 706-716. 70. Sakakura, T.; Choi, J.-C.; Yasuda, H., Transformation of carbon dioxide. Chem. Rev 2007, 107 (6), 2365-2387. 71. Evison, D.; Hinsley, D.; Rice, P., Chemical weapons. BMJ : British Medical Journal 2002, 324 (7333), 332-335. 72. North, M.; Pasquale, R., Mechanism of cyclic carbonate synthesis from epoxides and CO2. Angew. Chem. 2009, 121 (16), 2990-2992. 73. Korosteleva, I.; Markova, N.; Kolesnichenko, N.; Ezhova, N.; Khadzhiev, S.; Trukhmanova, N., Catalytic synthesis of propylene carbonate from propylene oxide and carbon dioxide in the presence of rhodium complexes modified with organophosphorus ligands and chitosan. Petroleum Chemistry 2013, 53 (6), 412-417. 74. Foltran, S.; Mereau, R.; Tassaing, T., Theoretical study on the chemical fixation of carbon dioxide with propylene oxide catalyzed by ammonium and guanidinium salts. Catal. Sci. Technol. 2014, 4 (6), 1585-1597. 75. Baiker, A., Utilization of carbon dioxide in heterogeneous catalytic synthesis². 2000. 76. Darensbourg, D. J.; Holtcamp, M. W., Catalysts for the reactions of epoxides and carbon dioxide. Coordination Chemistry Reviews 1996, 153, 155-174. 77. Shaikh, A.-A. G.; Sivaram, S., Organic carbonates. Chem. Rev. 1996, 96 (3), 951-976.

131
78. Yang, H.; Gu, Y.; Deng, Y.; Shi, F., Electrochemical activation of carbon dioxide in ionic liquid: synthesis of cyclic carbonates at mild reaction conditions. Chemical Communications 2002, (3), 274-275. 79. Buckley, B. R.; Patel, A. P.; Wijayantha, K. U., Electrosynthesis of cyclic carbonates from epoxides and atmospheric pressure carbon dioxide. Chemical Communications 2011, 47 (43), 11888-11890. 80. Wu, L.; Yang, H.; Wang, H.; Lu, J., Electrosynthesis of cyclic carbonates from CO 2 and epoxides on a reusable copper nanoparticle cathode. RSC Adv. 2015, 5 (30), 23189-23192. 81. Wang, H.; Wu, L.-X.; Lan, Y.-C.; Zhao, J.-Q.; Lu, J.-X., Electrosynthesis of cyclic carbonates from CO2 and diols in ionic liquids under mild conditions. Int. J. Electrochem. Sci 2011, 6, 4218-4227. 82. Kihara, N.; Nakawaki, Y.; Endo, T., Preparation of 1, 3-oxathiolane-2-thiones by the reaction of oxirane and carbon disulfide. The Journal of Organic Chemistry 1995, 60 (2), 473-475. 83. Calo, V.; Nacci, A.; Monopoli, A.; Fanizzi, A., Cyclic carbonate formation from carbon dioxide and oxiranes in tetrabutylammonium halides as solvents and catalysts. Organic letters 2002, 4 (15), 2561-2563. 84. Xiao, Y.; Chen, B.-L.; Yang, H.-P.; Wang, H.; Lu, J.-X., Electrosynthesis of enantiomerically pure cyclic carbonates from CO 2 and chiral epoxides. Electrochem. Commun. 2014, 43, 71-74. 85. Schmitz, C., The Rise of Big Business in the World Copper Industry 1870-1930. The Economic History Review 1986, 39 (3), 392-410. 86. Hori, Y.; Kikuchi, K.; Murata, A.; Suzuki, S., Production of methane and ethylene in electrochemical reduction of carbon dioxide at copper electrode in aqueous hydrogencarbonate solution. Chem. Lett. 1986, 15 (6), 897-898. 87. Vitousek, P. M.; Howarth, R. W., Nitrogen Limitation on Land and in the Sea: How Can It Occur? Biogeochemistry 1991, 13 (2), 87-115. 88. Galloway, J. N.; Townsend, A. R.; Erisman, J. W.; Bekunda, M.; Cai, Z.; Freney, J. R.; Martinelli, L. A.; Seitzinger, S. P.; Sutton, M. A., Transformation of the Nitrogen Cycle: Recent Trends, Questions, and Potential Solutions. Science 2008, 320 (5878), 889-892. 89. Duca, M.; Kavvadia, V.; Rodriguez, P.; Lai, S. C. S.; Hoogenboom, T.; Koper, M. T. M., New insights into the mechanism of nitrite reduction on a platinum electrode. J. Electroanal. Chem. 2010, 649 (1–2), 59-68. 90. Bae, S.-E.; Gewirth, A. A., Differential reactivity of Cu (111) and Cu (100) during nitrate reduction in acid electrolyte. Faraday Discuss. 2009, 140, 113-123.

132
91. Schouten, K. J. P.; Gallent, E. P.; Koper, M. T., The electrochemical characterization of copper single-crystal electrodes in alkaline media. J. Electroanal. Chem. 2013, 699, 6-9. 92. Wonders, A. H.; Housmans, T. H. M.; Rosca, V.; Koper, M. T. M., On-line mass spectrometry system for measurements at single-crystal electrodes in hanging meniscus configuration. J. Appl. Electrochem. 2006, 36 (11), 1215-1221. 93. Yang, J.; Kwon, Y.; Duca, M.; Koper, M. T., Combining Voltammetry and Ion Chromatography: Application to the Selective Reduction of Nitrate on Pt and PtSn Electrodes. Analytical chemistry 2013, 85 (16), 7645-7649. 94. Figueiredo, M. C.; Souza-Garcia, J.; Climent, V.; Feliu, J. M., Nitrate reduction on Pt (111) surfaces modified by Bi adatoms. Electrochem. Commun. 2009, 11 (9), 1760-1763. 95. Bae, S.-E.; Stewart, K. L.; Gewirth, A. A., Nitrate adsorption and reduction on Cu (100) in acidic solution. J. Am. Chem. Soc. 2007, 129 (33), 10171-10180. 96. Petrii, O. A.; Safonova, T. Y., Electroreduction of nitrate and nitrite anions on platinum metals: a model process for elucidating the nature of the passivation by hydrogen adsorption. J. Electroanal. Chem. 1992, 331 (1), 897-912. 97. Horanyi, G.; Rizmayer, E., Role of adsorption phenomena in the electrocatalytic reduction of nitric acid at a platinized platinum electrode. J. Electroanal. Chem. Interfacial Electrochem. 1982, 140 (2), 347-366. 98. Koper, M. T., Non-linear phenomena in electrochemical systems. Journal of the Chemical Society, Faraday Transactions 1998, 94 (10), 1369-1378. 99. Rosca, V.; Beltramo, G. L.; Koper, M. T. M., Hydroxylamine electrochemistry at polycrystalline platinum in acidic media: a voltammetric, DEMS and FTIR study. J. Electroanal. Chem. 2004, 566 (1), 53-62. 100. Rodes, A.; Gomez, R.; Orts, J.; Feliu, J.; Perez, J.; Aldaz, A., In situ FTIR spectroscopy characterization of the NO adlayers formed at platinum single crystal electrodes in contact with acidic solutions of nitrite. Langmuir 1995, 11 (9), 3549-3553. 101. Hughes, M.; Nicklin, H.; Shrimanker, K., Autoxidation of hydroxylamine in alkaline solutions. Part II. Kinetics. The acid dissociation constant of hydroxylamine. Journal of the Chemical Society A: Inorganic, Physical, Theoretical 1971, 3485-3487.

133
102. Dumas, P.; Suhren, M.; Chabal, Y.; Hirschmugl, C.; Williams, G., Adsorption and reactivity of NO on Cu (111): a synchrotron infrared reflection absorption spectroscopic study. Surf. Sci. 1997, 371 (2), 200-212. 103. Kim, C.; Yi, C.-W.; Goodman, D., Adsorption and reaction of NO on Cu (100): an infrared reflection absorption spectroscopic study at 25 K. J. Phys. Chem. B 2002, 106 (28), 7065-7068. 104. Santos, E.; Pötting, K.; Lundin, A.; Quaino, P.; Schmickler, W.,
Hydrogen Evolution on Single‐Crystal Copper and Silver: A Theoretical Study. ChemPhysChem 2010, 11 (7), 1491-1495. 105. Gattrell, M.; Gupta, N.; Co, A., A review of the aqueous electrochemical reduction of CO2 to hydrocarbons at copper. Journal of Electroanalytical Chemistry 2006, 594 (1), 1-19. 106. Hori, Y.; Murata, A.; Takahashi, R., Formation of hydrocarbons in the electrochemical reduction of carbon dioxide at a copper electrode in aqueous solution. Journal of the Chemical Society, Faraday Transactions 1: Physical Chemistry in Condensed Phases 1989, 85 (8), 2309-2326. 107. Calle-Vallejo, F.; Koper, M. T. M., Theoretical Considerations on the Electroreduction of CO to C2 Species on Cu(100) Electrodes. Angewandte Chemie International Edition 2013, 52 (28), 7282-7285. 108. Schouten, K. J. P.; Calle-Vallejo, F.; Koper, M. T. M., A Step Closer to the Electrochemical Production of Liquid Fuels. Angewandte Chemie International Edition 2014, 53 (41), 10858-10860. 109. Schouten, K. J. P.; Kwon, Y.; van der Ham, C. J. M.; Qin, Z.; Koper, M. T. M., A new mechanism for the selectivity to C1 and C2 species in the electrochemical reduction of carbon dioxide on copper electrodes. Chemical Science 2011, 2 (10), 1902. 110. P. Schouten, K. J.; Gallent, E. P.; Koper, M. T. M., The electrochemical characterization of copper single-crystal electrodes in alkaline media. Journal of Electroanalytical Chemistry 2013, 699 (0), 6-9. 111. Kwon, Y.; Koper, M. T. M., Combining Voltammetry with HPLC: Application to Electro-Oxidation of Glycerol. Analytical Chemistry 2010, 82 (13), 5420-5424. 112. Kresse, G.; Furthmüller, J., Efficient iterative schemes for ab initio total-energy calculations using a plane-wave basis set. Physical Review B 1996, 54 (16), 11169-11186. 113. Perdew, J. P.; Burke, K.; Ernzerhof, M., Generalized Gradient Approximation Made Simple. Physical Review Letters 1996, 77 (18), 3865-3868.

134
114. Kresse, G.; Joubert, D., From ultrasoft pseudopotentials to the projector augmented-wave method. Physical Review B 1999, 59 (3), 1758-1775. 115. Monkhorst, H. J.; Pack, J. D., Special points for Brillouin-zone integrations. Physical Review B 1976, 13 (12), 5188-5192. 116. Methfessel, M.; Paxton, A. T., High-precision sampling for Brillouin-zone integration in metals. Physical Review B 1989, 40 (6), 3616-3621. 117. Lide, D. R., CRC Handbook of Chemistry and Physics. ed. CD-ROM version. 90th ed.; CRC Press/Taylor and Francis: Boca Raton, FL, 2010. 118. Calle-Vallejo, F.; Koper, M. T. M., First-principles computational electrochemistry: Achievements and challenges. Electrochimica Acta 2012, 84, 3-11. 119. Norskov, J. K.; Rossmeisl, J.; Logadottir, A.; Lindqvist, L.; Kitchin, J. R.; Bligaard, T.; Jonsson, H., Origin of the overpotential for oxygen reduction at a fuel-cell cathode. Journal of Physical Chemistry B 2004, 108 (46), 17886-17892. 120. Peterson, A. A.; Abild-Pedersen, F.; Studt, F.; Rossmeisl, J.; Norskov, J. K., How copper catalyzes the electroreduction of carbon dioxide into hydrocarbon fuels. Energy & Environmental Science 2010, 3 (9), 1311-1315. 121. Nørskov, J. K.; Rossmeisl, J.; Logadottir, A.; Lindqvist, L.; Kitchin, J. R.; Bligaard, T.; Jónsson, H., Origin of the Overpotential for Oxygen Reduction at a Fuel-Cell Cathode. J. Phys. Chem. B 2004, 108 (46), 17886-17892. 122. Li, H.; Li, Y.; Koper, M. T. M.; Calle-Vallejo, F., Bond-Making and Breaking between Carbon, Nitrogen, and Oxygen in Electrocatalysis. Journal of the American Chemical Society 2014, 136 (44), 15694-15701. 123. Calle-Vallejo, F.; Martínez, J. I.; García-Lastra, J. M.; Sautet, P.; Loffreda, D., Fast Prediction of Adsorption Properties for Platinum Nanocatalysts with Generalized Coordination Numbers. Angewandte Chemie International Edition 2014, 53 (32), 8316-8319. 124. Calle-Vallejo, F.; Loffreda, D.; KoperMarc, T. M.; Sautet, P., Introducing structural sensitivity into adsorption–energy scaling relations by means of coordination numbers. Nat Chem 2015, 7 (5), 403-410. 125. Calle-Vallejo, F.; Huang, M.; Henry, J. B.; Koper, M. T. M.; Bandarenka, A. S., Theoretical design and experimental implementation of Ag/Au electrodes for the electrochemical reduction of nitrate. Physical Chemistry Chemical Physics 2013, 15 (9), 3196-3202. 126. Zhang, Y.-J.; Sethuraman, V.; Michalsky, R.; Peterson, A. A., Competition between CO2 Reduction and H2 Evolution on Transition-Metal Electrocatalysts. ACS Catalysis 2014, 4 (10), 3742-3748.

135
127. Ledezma-Yanez, I.; Gallent, E. P.; Koper, M. T.; Calle-Vallejo, F., Structure-sensitive electroreduction of acetaldehyde to ethanol on copper and its mechanistic implications for CO and CO 2 reduction. Catal. Today 2016, 262, 90-94. 128. Garcia, G.; Rodriguez, P.; Rosca, V.; Koper, M., Fourier transform infrared spectroscopy study of CO electro-oxidation on Pt (111) in alkaline media. Langmuir 2009, 25 (23), 13661-13666. 129. Hori, Y.; Koga, O.; Watanabe, Y.; Matsuo, T., FTIR measurements of charge displacement adsorption of CO on poly-and single crystal (100) of Cu electrodes. Electrochim. Acta 1998, 44 (8), 1389-1395. 130. Ryberg, R., Carbon monoxide adsorbed on Cu(100) Studied by infrared spectroscopy. Surf. Sci. 1982, 114 (2), 627-641. 131. Gajdoš, M.; Hafner, J., CO adsorption on Cu(1 1 1) and Cu(0 0 1) surfaces: Improving site preference in DFT calculations. Surf. Sci. 2005, 590 (2–3), 117-126. 132. Chang, S. C.; Weaver, M. J., In situ infrared spectroscopy of carbon monoxide adsorbed at ordered platinum (100)-aqueous interfaces: double-layer effects upon the adsorbate binding geometry. J. Phys. Chem. 1990, 94 (12), 5095-5102. 133. Arán-Ais, R. M.; Figueiredo, M. C.; Vidal-Iglesias, F. J.; Climent, V.; Herrero, E.; Feliu, J. M., On the behavior of the Pt (100) and vicinal surfaces in alkaline media. Electrochim. Acta 2011, 58, 184-192. 134. Shaw, S. K.; Berná, A.; Feliu, J. M.; Nichols, R. J.; Jacob, T.; Schiffrin, D. J., Role of axially coordinated surface sites for electrochemically controlled carbon monoxide adsorption on single crystal copper electrodes. Phys. Chem. Chem. Phys. 2011, 13 (12), 5242-5251. 135. Koper, M. T.; van Santen, R. A., Electric field effects on CO and NO adsorption at the Pt (111) surface. J. Electroanal. Chem. 1999, 476 (1), 64-70. 136. Socrates, G., Infrared and Raman characteristic group frequencies: tables and charts. John Wiley & Sons: 2004. 137. Severson, M. W.; Stuhlmann, C.; Villegas, I.; Weaver, M. J., Dipole–dipole coupling effects upon infrared spectroscopy of compressed electrochemical adlayers: Application to the Pt (111)/CO system. J. Chem. Phys. 1995, 103 (22), 9832-9843. 138. Calle-Vallejo, F.; Ignacio Martinez, J.; Rossmeisl, J., Density functional studies of functionalized graphitic materials with late transition metals for oxygen reduction reactions. Phys. Chem. Chem. Phys. 2011, 13 (34), 15639-15643.

136
139. Maier, G.; Rohr, C., Ethynediol: Photochemical Generation and
Matrix‐spectroscopic Identification. Liebigs Ann. 1996, 1996 (3), 307-309. 140. Calle-Vallejo, F.; Martínez, J. I.; García-Lastra, J. M.; Abad, E.; Koper, M. T. M., Oxygen reduction and evolution at single-metal active sites: Comparison between functionalized graphitic materials and protoporphyrins. Surf. Sci. 2013, 607, 47-53. 141. Nie, X.; Esopi, M. R.; Janik, M. J.; Asthagiri, A., Selectivity of CO2 reduction on copper electrodes: the role of the kinetics of elementary steps. Angew. Chem. Int. Ed. 2013, 52 (9), 2459-2462. 142. Hori, Y., Electrochemical CO2 reduction on metal electrodes. In Modern aspects of electrochemistry, Springer: 2008; pp 89-189. 143. Roberts, F. S.; Kuhl, K. P.; Nilsson, A., High selectivity for ethylene from carbon dioxide reduction over copper nanocube electrocatalysts. Angew. Chem. Int. Ed. 2015, 54 (17), 5179-5182. 144. Hori, Y.; Takahashi, I.; Koga, O.; Hoshi, N., Electrochemical reduction of carbon dioxide at various series of copper single crystal electrodes. J. Mol. Catal. A: Chem. 2003, 199 (1), 39-47.
145. Lee, S.; Kim, D.; Lee, J., Electrocatalytic Production of C3‐C4
Compounds by Conversion of CO2 on a Chloride‐Induced Bi‐Phasic
Cu2O‐Cu Catalyst. Angew. Chem. 2015, 127 (49), 14914-14918. 146. Kyriacou, G.; Anagnostopoulos, A., Influence CO 2 partial pressure and the supporting electrolyte cation on the product distribution in CO 2 electroreduction. J. Appl. Electrochem. 1993, 23 (5), 483-486. 147. Singh, M. R.; Kwon, Y.; Lum, Y.; Ager III, J. W.; Bell, A. T., Hydrolysis of Electrolyte Cations Enhances the Electrochemical Reduction of CO2 over Ag and Cu. J. Am. Chem. Soc. 2016, 138 (39), 13006-13012. 148. Wuttig, A.; Surendranath, Y., Impurity ion complexation enhances carbon dioxide reduction catalysis. ACS Catal. 2015, 5 (7), 4479-4484. 149. Birdja, Y. Y.; Koper, M. T. M., The Importance of Cannizzaro-Type Reactions during Electrocatalytic Reduction of Carbon Dioxide. J. Am. Chem. Soc. 2017, 139 (5), 2030-2034.
150. Pérez‐Gallent, E.; Figueiredo, M. C.; Calle‐Vallejo, F.; Koper, M., Spectroscopic Observation of a Hydrogenated CO Dimer Intermediate During CO Reduction on Cu (100) Electrodes. Angew. Chem. 2017, 129 (13), 3675-3678. 151. Cook, R. L.; MacDuff, R. C.; Sammells, A. F., Evidence for formaldehyde, formic acid, and acetaldehyde as possible intermediates during electrochemical carbon dioxide reduction at copper. J. Electrochem. Soc. 1989, 136 (7), 1982-1984.

137
152. DeWulf, D. W.; Jin, T.; Bard, A. J., Electrochemical and surface studies of carbon dioxide reduction to methane and ethylene at copper electrodes in aqueous solutions. J. Electrochem. Soc. 1989, 136 (6), 1686-1691. 153. Akhade, S. A.; McCrum, I. T.; Janik, M. J., The impact of specifically adsorbed ions on the copper-Catalyzed electroreduction of CO2. J. Electrochem. Soc. 2016, 163 (6), F477-F484. 154. Sandberg, R. B.; Montoya, J. H.; Chan, K.; Nørskov, J. K., CO-CO coupling on Cu facets: Coverage, strain and field effects. Surf. Sci. 2016, 654, 56-62. 155. Chen, L. D.; Urushihara, M.; Chan, K.; Nørskov, J. K., Electric Field Effects in Electrochemical CO2 Reduction. ACS Catal. 2016, 6 (10), 7133-7139. 156. Kim, Y.-G.; Javier, A.; Baricuatro, J. H.; Soriaga, M. P., Regulating the product distribution of CO reduction by the atomic-level structural modification of the Cu electrode surface. Electrocatalysis 2016, 7 (5), 391-399. 157. Gao, D.; Zegkinoglou, I.; Divins, N. J.; Scholten, F.; Sinev, I.; Grosse, P.; Roldan Cuenya, B., Plasma-Activated Copper Nanocube Catalysts for Efficient Carbon Dioxide Electroreduction to Hydrocarbons and Alcohols. ACS nano 2017, 11 (5), 4825-4831.
158. Bertheussen, E.; Verdaguer‐Casadevall, A.; Ravasio, D.; Montoya, J. H.; Trimarco, D. B.; Roy, C.; Meier, S.; Wendland, J.; Nørskov, J. K.; Stephens, I. E., Acetaldehyde as an Intermediate in the Electroreduction of
Carbon Monoxide to Ethanol on Oxide‐Derived Copper. Angew. Chem. Int. Ed. 2016, 55 (4), 1450-1454. 159. Rochelle, C.; Czernichowski-Lauriol, I.; Milodowski, A., The impact of chemical reactions on CO2 storage in geological formations: a brief review. Geological Society, London, Special Publications 2004, 233 (1), 87-106. 160. Jasinski, R., Bibliography on the uses of propylene carbonate in high energy, density batteries. J. Electroanal. Chem. Interfacial Electrochem. 1967, 15, 89-91. 161. Bhanage, B. M.; Fujita, S.-i.; Ikushima, Y.; Arai, M., Synthesis of dimethyl carbonate and glycols from carbon dioxide, epoxides, and methanol using heterogeneous basic metal oxide catalysts with high activity and selectivity. Applied Catalysis A: General 2001, 219 (1), 259-266. 162. Zhang, L.; Niu, D.; Zhang, K.; Zhang, G.; Luo, Y.; Lu, J., Electrochemical activation of CO 2 in ionic liquid (BMIMBF 4): synthesis of

138
organic carbonates under mild conditions. Green Chemistry 2008, 10 (2), 202-206. 163. Lu, X.-B.; Wang, H.; He, R., Aluminum phthalocyanine complex covalently bonded to MCM-41 silica as heterogeneous catalyst for the synthesis of cyclic carbonates. J. Mol. Catal. A: Chem. 2002, 186 (1), 33-42. 164. Figueiredo, M. C.; Ledezma-Yanez, I.; Koper, M. T., In situ spectroscopic study of CO2 electroreduction at copper electrodes in acetonitrile. ACS Catal. 2016, 6 (4), 2382-2392. 165. Ledezma-Yanez, I.; Koper, M. T. M., Influence of water on the hydrogen evolution reaction on a gold electrode in acetonitrile solution. J. Electroanal. Chem. 2017, 793 (Supplement C), 18-24. 166. Christensen, P.; Hamnett, A.; Muir, A.; Freeman, N., CO2 reduction at platinum, gold and glassy carbon electrodes in acetonitrile: An in-situ FTIR study. J. Electroanal. Chem. Interfacial Electrochem. 1990, 288 (1-2), 197-215. 167. Foley, J. K.; Korzeniewski, C.; Pons, S., Anodic and cathodic reactions in acetonitrile/tetra-n-butylammonium tetrafluoroborate: an electrochemical and infrared spectroelectrochemical study. Canadian journal of chemistry 1988, 66 (1), 201-206. 168. Hori, Y.; Murata, A.; Yoshinami, Y., Adsorption of CO, intermediately formed in electrochemical reduction of CO2, at a copper electrode. Journal of the Chemical Society, Faraday Transactions 1991, 87 (1), 125-128. 169. Wuttig, A.; Liu, C.; Peng, Q.; Yaguchi, M.; Hendon, C. H.; Motobayashi, K.; Ye, S.; Osawa, M.; Surendranath, Y., Tracking a common surface-bound intermediate during CO2-to-fuels catalysis. ACS central science 2016, 2 (8), 522-528. 170. Wang, W.; Li, C.; Yan, L.; Wang, Y.; Jiang, M.; Ding, Y., Ionic liquid/Zn-PPh3 integrated porous organic polymers featuring multifunctional sites: Highly active heterogeneous catalyst for cooperative conversion of CO2 to cyclic carbonates. ACS Catal. 2016, 6 (9), 6091-6100. 171. Niu, K.; Xu, Y.; Wang, H.; Ye, R.; Xin, H. L.; Lin, F.; Tian, C.; Lum, Y.; Bustillo, K. C.; Doeff, M. M., A spongy nickel-organic CO2 reduction photocatalyst for nearly 100% selective CO production. Science Advances 2017, 3 (7), e1700921. 172. Mills, J.; McCrum, I.; Janik, M., Alkali cation specific adsorption onto fcc (111) transition metal electrodes. Phys. Chem. Chem. Phys. 2014, 16 (27), 13699-13707. 173. Jović, V. D.; Jović, B. M., EIS and differential capacitance measurements onto single crystal faces in different solutions: Part II: Cu(111) and Cu(100) in 0.1 M NaOH. J. Electroanal. Chem. 2003, 541, 13-21.

139
174. Marcus, Y., Thermodynamics of solvation of ions. Part 5.—Gibbs free energy of hydration at 298.15 K. Journal of the Chemical Society, Faraday Transactions 1991, 87 (18), 2995-2999. 175. Ramki, C.; Vizhi, R. E., Growth, optical, electrical and mechanical properties of sodium hydrogen oxalate hydrate (NaHC 2 O 4· H 2 O) single crystal for NLO applications. Mater. Chem. Phys. 2017, 197, 70-78.

140

141
Appendix I
Supporting information to chapter 2
I.1 Results
The reduction of nitrate (NO3-) in a 0.1 M NaOH solution prepared in
D2O was also studied by FTIR on both copper surfaces in order to
confirm the absence of the bands corresponding to NO. Figure AI.1
shows potential dependent absorbance spectra of Cu(100) (left panel)
and Cu(111) (right panel) in 0.1 M NaOH solution in the presence of 10
mM NaNO3. The reference spectrum is taken at +0.35 V and additional
spectra are provided for +0.30, +0.25, +0.20, +0.15, +0.10, +0.05, +0.00, -
0.05, -0.10, -0.15, -0.20, -0.25, -0.30, -0.35 V (all reported potentials are
in the RHE scale). In agreement with the onset potentials for nitrate
reduction observed in the CVs (fig. 2.1) ,IC (fig. 2.4) and FTIR (fig. 2.6),
the absorbance spectra show that the onset potential for the reduction
of nitrate is +0.15 V on Cu (111) and +0.1 V on Cu (100), as observed by
a negative band at 1370 cm-1 associated with the consumption of nitrate.
However, the simultaneous formation of nitrite that was observed by
the positive band at 1231 cm-1 when the experiments were carried out
in H2O (fig. 2.6) is not observable in the experiment carried out in D2O
because the band corresponding with nitrite (NO2-) is masked by the D-
O stretching band. There is no band at 1690 cm-1 that would correspond
to NO, confirming the absence of formation of NO, in agreement with the
results obtained with Online Mass Spectrometry (fig. 2.5).

142
0.1 M NaOH in D2O , 10 mM NaNO3
Absorb
ance / a
.u.
1800 1600 1400 1200
wavenumber / cm-1
0.005 a.u. 1370 cm-1
-0.35 V
+0.35 V
-0.0
5 V
Cu (111)
Ab
so
rba
nce
/ a
.u.
1800 1600 1400 1200
wavenumber / cm-1
1370 cm-10.005 a.u.
+0.35 V
-0.35 V
-0.0
5 V
Cu (100)
Figure AI.1: Potential dependent absorbance spectra for the reduction of 10
mM NaNO3 on Cu (100) (left panel) and on Cu (111) (right panel) electrode in
0.1 M NaOH solution in D2O. Reference spectrum recorded at 0.35 V vs. RHE.
Potential step is 0.05V.

Appendix II | Supporting information to chapter 3
143
Appendix II
Supporting information to chapter 3
II.1 Voltammetric characterization of copper single -crystals electrodes
Figure AII.1 shows the characteristic features of the copper single-
crystal surfaces, between -0.25 and 0.35 VRHE, in agreement with those
previously reported by Schouten et al 91.
-0.3 -0.2 -0.1 0.0 0.1 0.2 0.3 0.4
-0.3 -0.2 -0.1 0.0 0.1 0.2 0.3 0.4
Cu(111)
10 A.cm-2
10 A.cm-2
Cu(100)
10 A.cm-2
E / VRHE
Cu(322)
Figure AII.1: Cyclic voltammetries for Cu(111), Cu(100) and Cu(322) electrodes
in 0.1 M NaOH; scan rate: 50 mV s -1, Ar-atmosphere.

144
Figure AII.2 shows the linear sweep voltammetries for acetaldehyde
reduction on three copper single-crystal surfaces, between 0.0 and -1.5
VRHE, at pH 1 and 3.
-1.6 -1.4 -1.2 -1.0 -0.8 -0.6 -0.4 -0.2 0.0
-1.6 -1.4 -1.2 -1.0 -0.8 -0.6 -0.4 -0.2 0.0
pH 1 Cu(111)
pH 3 Cu(111)
0.01 A.cm-2
0.05 A.cm-2
pH 1 Cu(100)
pH 3 Cu(100)
0.03 A.cm-2
pH 1 Cu(322)
pH 3 Cu(322)
E / VRHE
Figure AII.2: Linear sweep voltammetries for acetaldehyde reduction on
Cu(111), Cu(100) and Cu(322) electrodes. The solutions used were: 0.1 M
HClO4 + 0.1 M acetaldehyde (pH 1), and 0.001 M HClO 4 + 0.099 M KClO4 + 0.1
M acetaldehyde (pH 3). Scan rate: 1 mV s -1, Ar-atmosphere.

Appendix II | Supporting information to chapter 3
145
II.2 DFT simulat ions in a high H-coverage regime
Figures AII.3 and AII.4 contain the most stable adsorption
configurations of CH3CH2O* and CH3*CHOH in the presence of
coadsorbed hydrogen on the three crystals under study.
Figure AII.3: Coadsorption of *H and CH3CH2O* on a) Cu(111), b) Cu(100), c)
Cu(322). Left: top views, right: side views.

146
Figure AII.4: Coadsorption of *H and CH3*CHOH on a) Cu(111), b) Cu(100), c)
Cu(322). Left: top views, right: side views.

Appendix III | Supporting information to chapter 4
147
Appendix III
Supporting information to chapter 4
III.1 Results and discussion
Figure AIII.1 shows the potential-dependent absorbance spectra of
Cu(111) in 0.1 M LiOH solutions in CO atmosphere. The reference
spectrum is taken at +0.1 V and additional spectra are provided for
+0.05, 0.00, -0.05, -0.10, -0.15 and -0.2 V (all reported potentials are on
the RHE scale). The spectra show two bands at 1632 and 1407 cm-1 . The
band at 1632 cm-1 corresponds to the OH bending mode of H2O. This
band causes fluctuations in the baseline of the spectra. The band at 1407
cm-1 is assigned to formaldehyde according to the transmission spectra
obtained for this species in solution (See Figure AIII.2 e). Formaldehyde
has been suggested to be an intermediate of the reduction of CO to CH4
on Cu(211) 57. During the reduction of CO on Cu(111), there is no band
around 1680 cm-1 that would correspond to adsorbed CO 131. The band
at 1191 cm-1 that is assigned to the C-OH stretching on Cu(100) for the
hydrogenated dimer is absent in the spectra obtained on Cu(111),
confirming the favorability of square sites for the formation of the
hydrogenated dimer as an early intermediate of CO reduction. The
transmission spectra of other C1 and C2 species such as acetate,
formate, acetaldehyde, formaldehyde and methanol were also recorded
(Figure AIII.2). The lack of a match of the bands obtained during CO
reduction with the bands observed in the transmission spectra of this C1
and C2 species, rules out the possibility of having these species as
intermediates in CO reduction on Cu(100) electrodes.

148
Absorb
ance / a
.u.
2000 1800 1600 1400 1200
wavenumber / cm-1
-0.2 V
-0.15 V
-0.1 V
-0.05 V
0 V
0.05 V
0.1 V
Cu (111) , 0.1 M LiOH , 12
CO atmosphere
1407 cm-1
1632 cm-1
0.0005 a.u.
Figure AIII.1: Potential-dependent absorbance spectra for Cu(111) in the
presence of CO in a 0.1 M LiOH solution. Reference spectrum recorded at +0.1
V vs. RHE. Highlighted bands and their correspondent frequency are indicated
with a vertical line at 1407 cm-1 for 12C-OH stretching and 1632 cm -1 for O-H
bending.

Appendix III | Supporting information to chapter 4
149
Absorb
ance / a
.u.
1800 1600 1400 1200
wavenumber / cm-1
a)
b)
c)
d)
e)
0.01 M Formaldehyde in 0.1 M NaOH
0.01 M X in 0.1M NaOH
Formaldehyde
Acetaldehyde
Formate
Methanol
Acetate
Figure AIII.2: Transmission spectra of 0.01 M of: a) acetate, b) formate,
c) methanol, d) acetaldehyde, and e) formaldehyde in 0.1 M NaOH
solution.

150

Appendix IV | Supporting information to chapter 5
151
Appendix IV
Supporting information to chapter 5
IV.1 OLEMS measurements
IV.1.1 Hydrogen evolution reaction
Figure AIV.1 show the mass fragment m/z = 2 associated with the
formation of H2 from the competitive hydrogen evolution reaction
(HER) during CO reduction on Cu(100), Cu(111) and polycrystalline Cu.
On all copper surfaces, hydrogen evolution starts at ca. -0.4 V for all
different cations except Cs+, for which it starts at slightly less negative
potentials. The amount of hydrogen produced as well as its formation
rate increases with the size of the cation in the electrolyte for every
copper surface

152
c)
6x10⁻⁷
4
2
0
Cu
rre
nt
/ a
.u.
-1.2 -0.8 -0.4 0.0E vs. RHE / V
Cu (100)
LiOH NaOH KOH RbOH CsOH
m/z=2
H2
6x10⁻⁷
4
2
0
Cu
rre
nt
/ a
.u.
-1.2 -0.8 -0.4 0.0E vs. RHE / V
Cu (111)
LiOH NaOH KOH RbOH CsOH
m/z=2
H2
6x10⁻⁷
4
2
0
Cu
rre
nt
/ a
.u.
-1.2 -0.8 -0.4 0.0E vs. RHE / V
Cu (poly)
m/z=2
H2
LiOH NaOH KOH RbOH CsOH
Figure AIV.1: OLEMS mass fragment m/z= associated with the formation of
H2 during CO reduction on a) Cu(100) , b) Cu(111) and c) polycrystalline
Cu for different 0.1 M alkaline hydroxide solutions.
b)
a)

Appendix IV | Supporting information to chapter 5
153
IV.1.1 Cation effect for ethylene selectivity
Figure AIV.2 illustrates the cation effect on the selectivity of ethylene
versus methane on Cu(100) electrodes during CO reduction. The values
in Figure AIV.2 have been extracted from Figure 5.1 for a clearer
representation of the cation effect for ethylene selectivity.
Figure AIV.2a shows the ratio C2/C1 at a representative potential of -0.75
V vs RHE for different alkaline cations. Figure AIV.2b shows the
potential for which a fixed value of 5 for the ratio ethylene/methane is
obtained for the different alkaline cations. The values of the
16
12
8
4
0
I(m
/z 2
6)
/ I(
m/z
15)
-0.80
-0.78
-0.76
-0.74
-0.72
-0.70
-0.68
E v
s R
HE
/ V
C2/C1 at E=-0.75 V
E at C2/C1=5
Li Na K Rb Cs
Li Na K Rb Cs
a)
b)
Figure AIV.2: a) ratio ethylene/methane at a representative potential of -
0.75 V vs RHE for different alkali cations. b) potential for which a fixed
value of 5 for the ratio ethylene/methane is obtained for different alkali
cations.
16
12
8
4
0
I(m
/z 2
6)
/ I(
m/z
15)
-0.80
-0.78
-0.76
-0.74
-0.72
-0.70
-0.68
E v
s R
HE
/ V
C2/C1 at E=-0.75 V
E at C2/C1=5
Li Na K Rb Cs
Li Na K Rb Cs
a)
b)

154
ethylene/methane ratio at -0.75 V show a clear effect of the cation
towards ethylene formation that monotonically follows the cation sizes.
In addition, the potentials for wich a fixed value of 5 for the ratio
ethylene/methane show that larger cations can maintain the same
selectivity for ethylene at more negative potentials compared to smaller
cations, suggesting that the selectivity for ethylene is enhanced in a
larger potential range when larger cations are used.
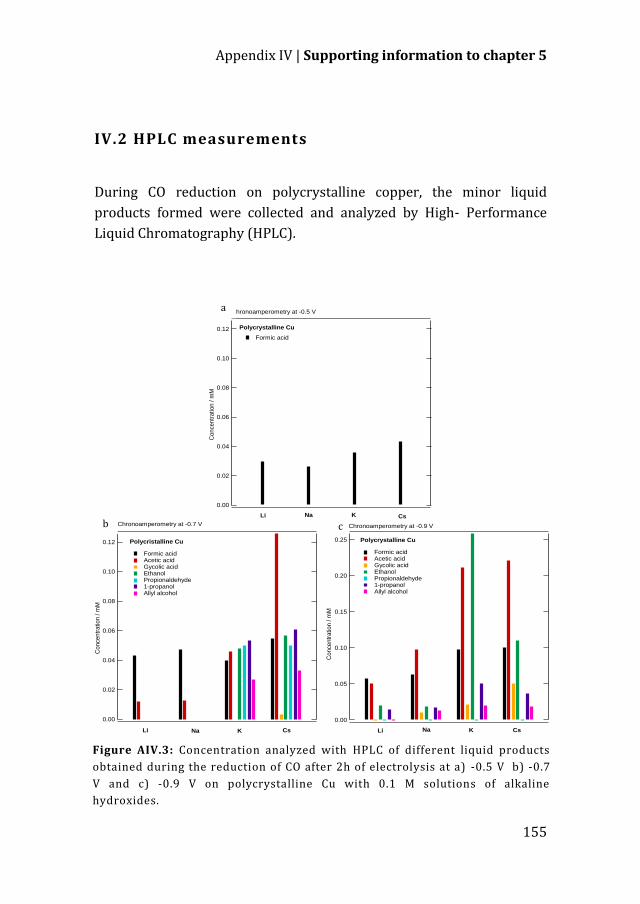
Appendix IV | Supporting information to chapter 5
155
IV.2 HPLC measurements
During CO reduction on polycrystalline copper, the minor liquid
products formed were collected and analyzed by High- Performance
Liquid Chromatography (HPLC).
0.12
0.10
0.08
0.06
0.04
0.02
0.00
Conce
ntr
atio
n / m
M
Li Na K Cs
Polycrystalline Cu
Chronoamperometry at -0.5 V
Formic acid
0.12
0.10
0.08
0.06
0.04
0.02
0.00
Co
nce
ntr
atio
n /
mM
Chronoamperometry at -0.7 V
Polycristalline Cu
Formic acid Acetic acid Gycolic acid Ethanol Propionaldehyde 1-propanol Allyl alcohol
Li KNa Cs
0.25
0.20
0.15
0.10
0.05
0.00
Co
nce
ntr
atio
n /
mM
Chronoamperometry at -0.9 V
Polycrystalline Cu
Formic acid Acetic acid Gycolic acid Ethanol Propionaldehyde 1-propanol Allyl alcohol
Li Na K Cs
Figure AIV.3: Concentration analyzed with HPLC of different liquid products
obtained during the reduction of CO after 2h of electrolysis at a) -0.5 V b) -0.7
V and c) -0.9 V on polycrystalline Cu with 0.1 M solutions of alkaline
hydroxides.
a
)
b
) c
)

156
Chronoamperometry experiments were carried out at three different
potentials: -0.5, -0.7 and -0.9 V, with different alkaline hydroxides as
electrolytes. The results are summarize in Figure AIV.2. Experiments
with RbOH showed an anomalously low amount of product formation,
which we ascribe to the combination of low purity and long
experimentation time. Therefore, data obtained with Rb cations are not
included in the results described below.
When chronoamperometry experiments were performed at -0.5 V vs
RHE for 2 h (See Figure AIV.3a), the only product observed was formic
acid. The concentration of this acid does not greatly change along with
the cation in solution, being the concentration in the range 0.025 – 0.043
mM. Note that the formation of formic acid has been never reported as a
CO reduction product. We attribute its formation here to the Cannizzaro
reaction, a base-catalyzed aldehyde disproportionation resulting in the
formation of the corresponding acid and alcohol. In this specific case,
the formaldehyde formed during CO reduction disproportionates into
methanol and formic acid. We recently pointed out the importance of
this reaction149, as it explains the concomitant formation of acids and
alcohols observed during CO2 reduction as a result of a local pH increase
due to OH- generation from the simultaneous hydrogen evolution
reaction. Formate might as well be produced after *CO is hydrogenated
to *CHO, and *CHO combines with OH- according to Zheng et al. 171
At more negative potentials (-0.7 V and -0.9 V), we observed more
significant differences in terms of product distribution and
concentration. The products obtained were: formic acid as C1 product;
acetic acid, glycolic acid, ethylene glycol and ethanol as C2 products;
propionaldehyde, 1-propanol and allyl alcohol as C3 products. The C2
and C3 products obtained during CO reduction have been reported
previously50, 61.
At -0.7 V, formic acid is formed on all electrolytes with slight differences
in concentration. However, the concentration of acetic acid, increases

Appendix IV | Supporting information to chapter 5
157
with the cation size. Ethanol, propionaldehyde, 1-propanol and allyl
alcohol were only observed when K+ and Cs+ were present in the
electrolyte, with slightly higher concentrations observed for the latter.
In addition, with Cs+ a small amount of glycolic acid was produced.
Ethylene glycol was also detected in KOH and CsOH, although an
accurate quantification was not possible due to an overlap with the
intense peak of acetic acid.
During CO reduction at more negative potentials (-0.9 V), higher
concentrations of products were generally obtained. Formic acid and
acetic acid were formed for all cations, with their concentrations
increasing with the cation size. Ethanol and 1-propanol were also
detected for every cation with the highest concentration corresponding
to K+. Small amounts of allyl alcohol were detected for Na+, K+ and Cs+,
without significant differences in concentration. Glycolic acid was also
observed for Na+, K+ and Cs+, with a clearer trend regarding the size of
the cation. Ethylene glycol was detected with K+ and Cs+, but a clear
quantification was not possible. In general, larger cations (Cs+) promote
CO reduction to C2 species compared to small cations (Li+ and Na+), in
agreement with the results by Hori et al65.
IV.3 1H-NMR
The samples collected after 2h of CO reduction by chronoamperometry
at -0.9 V vs. RHE in 0.1 M NaOH, KOH and CsOH solutions were analyzed
by 1H-NMR. The 1H-NMR spectra are shown in Figure AIV.4.
Solvent supression was employed to reduce the size of the peak
corresponding to water in order to magnify the peaks corresponding to
CO reduction products. The product distribution obtained is similar,
regardless of the cation size, although differences in the intensity of the
peaks were observed.
The products observed were formic acid, acetic acid, ethylene glycol,
glycolic acid, ethanol and 1-propanol, in agreement with the products

158
observed with HPLC. In addition, methanol was also observed as a CO
reduction product for all three electrolytes analyzed. The detection of
methanol by HPLC analysis was not possible due to the overlap of the
corresponding peak with the peaks of the eluent. The amount of these
reduction products was higher for CsOH and KOH, compared to NaOH,
although an accurate quantification was not made.
Table AIV.1 shows an overview of the products detected by 1H-NMR for
the electrolysis experiments performed at -0.9 V vs. RHE in NaOH, KOH
and CsOH 0.1 M solutions.
Compound Proton Nb H Mult. Delta / ppm (Na+)
Delta / ppm (K+)
Delta / ppm (Cs+)
Formic acid -H 1 s 8.376 8.367 8.359 Acetic acid -CH3 3 s 2.206 2.196 2.184
Ethylene glycol -CH2- 4 t 3.484 3.470 3.462
Glycolic acid -CH2- 2 s 3.869 3.858 3.845
Methanol -CH3 3 s 3.278 3.267 3.255
Ethanol -CH2- -CH3
2 3
q t
3.587 1.105
3.566 1.104
3.558 1.090
1-propanol -CH3 -CH2- -CH2-
3 2 2
t qt t
0.816 1.105 3.587
0.806 1.098 3.56
0.807 1.095 3.473
Table AIV.1: 1H-NMR chemical shift for the products detected after
reduction of CO at -0.9 V vs. RHE in 0.1 M NaOH, KOH and CsOH solutions.

Appendix IV | Supporting information to chapter 5
159
Figure AIV.4: 1H-NMR spectra of the samples obtained during CO
reduction on polycrystalline copper after 2h of chronoamperometry at -0.9
V vs RHE in a) NaOH, b) KOH and c) CsOH 0.1 M solutions.
b) KOH
a) NaOH
c) CsOH

160
IV. 4 Mechanistic implications
During the electroreduction of CO, a relation between the formation of
ethylene and methane was noted: an increase in m/z = 15
(corresponding to methane) occurs when m/z = 26 (corresponding to
ethylene) starts to decay. Figure AIV.5 shows the relation between these
two mass fragments for Cu(111) and Cu(polycrystalline) in different
alkaline hydroxide solutions, which complement Figure 5.4 in chapter 5.
The possibility that methane formation be the result of ethylene
reduction has been tested. Figure AIV.6 shows the reduction of ethylene
on Cu(100) in 0.1 M CsOH solution. When ethylene is reduced, only the
formation of hydrogen from the competitive hydrogen evolution
reaction (HER) was observed. The absence of methane formation rules
out the possibility that the relation observed between methane and
ethylene is due to methane production as a following step in the C2
pathway. It is important to mention that ethane was not detected during
the reduction of ethylene, either.
The decay in m/z = 26 during CO reduction due to the reduction of
ethylene has also been considered. The experiments show that ethylene
reduction starts at ca. -0.4 V achieving its maximum reduction current at
ca. -0.6 V vs RHE, and the decay of m/z = 26 during the reduction of CO
occurs at ca. -0.7 V. Thus, the possibility of the decay of the ethylene
signal due to its reduction has also been ruled out. Hence, we propose
that the C2 pathway gets blocked by the enhancement of the C1 pathway
and discard the hypothesis that C2 products are transformed to produce
C1 species.

Appendix IV | Supporting information to chapter 5
161
Figure AIV.5: OLEMS mass fragments associated with the reduction products
formed during CO reduction on Cu(111) (left panel) in different 0.1 M
alkaline hydroxide solutions. Dashed lines correspond to m/z = 26 associated
with the formation of ethylene, plotted against the right axis. Full lines
correspond to m/z = 15 associated with the formation of methane, plotted
against the left axis.

162
The onset potential for the formation of methane and ethylene during
the reduction of CO is displayed in figure AIV.7. The onset potential for
ethylene formation depends on the facet, being lower for copper single
crystals than for polycrystalline copper. In addition, the onset potential
for ethylene is not affected by the cation size when CO reduction is
performed on copper single crystals, whereas on polycrystalline copper
the onset potential depends on the cation, being -0.6 V for Li+ and Na+, -
0.4 V for K+ and -0.35 V for Rb+ and Cs+. On the other hand, the onset
potential for methane formation is independent of both cation nature
and surface structure.
7x10⁻⁹
6
5
4
3
2
Curr
ent / a
.u
-1.2 -0.8 -0.4 0.0E vs. RHE / V
4x10-11
2
0
-2
100x10-12
80
60
40
20
m/z=2
m/z=15
m/z=26
H2
C2H4
CH4
Cu (100) / 0.1 M CsOH
Figure AIV.6: OLEMS mass fragments associated with the reduction of
ethylene on Cu(100) in 0.1 M CsOH solution. The bottom panel displays
m/z = 2 associated with the formation of H2, the middle panel displays
m/z = 26 associated with the reduction of C2H4 and the top panel
displays m/z = 15 associated with CH4.

Appendix IV | Supporting information to chapter 5
163
IV.5 Electrode surface characterization
The structure of copper electrodes is a key factor in tuning the
selectivity of CO electroreduction.64, 144 Therefore, cyclic voltammetry
before and after the reduction of CO (Figure AIV.8) has been carried out
in order to determine the initial state of the electrode surface and to
assess its change after CO reduction.
Prior to CO reduction, the voltammograms exhibit the characteristic
peaks according to the specific copper surface, in agreement with the
study of Schouten et al.91 However, the state of the electrode surface
-1.0
-0.8
-0.6
-0.4
-0.2
0.0
E v
s.
RH
E /
V
-1.0
-0.8
-0.6
-0.4
-0.2
0.0
Onset potential CH4
Onset potential C2H4
Li Na K Rb Cs
Cu (100) Cu (111) Cu (poly)
Cu 1(00) Cu (111) Cu (poly)
Li Na K Rb Cs
Figure AIV.7: Onset potential for the formation of methane (top panel) and
ethylene (bottom panel) dependent on the cation nature and surface
structure.

164
at the end of the experiments displays some differences with
respect to the initial state. . While the surfaces of Cu(100) and
Cu(poly) electrodes remain relatively unchanged, Cu(111)
underwent major modifications. Thus, the variation in product
distribution is merely due to the nature of the cation in solution
and structural factors must not be considered. On Cu(100) OH-
adsorption/desorption peaks at -0.15 V are present before and
after the experiment. However, the OH- adsorption/desorption
peaks on Cu(111) decrease in current intensity after the
experiment. In addition, a new irreversible anodic peak appears at
+0.35 V, suggesting that the well-defined (111) arrangement has
been partially lost at the end of the OLEMS experiments. This new
anodic peak might be due to specific cation adsorption or to OH-
adsorption on a reconstructed surface.
Figure AIV.8: Cyclic voltammetry characterization of a) Cu(100), b) Cu(111)
and c) Cu(poly) in different 0.1 M alkaline hydroxide solutions before OLEMS
experiments (full lines) and after OLEMS experiments (dashed lines).

Appendix IV | Supporting information to chapter 5
165
First, according to DFT calculations in which solvation effects are
considered, the specific adsorption of alkaline cations on fcc (111)
transition metals occurs in the same potential range of HER172. Secondly,
Jović et al. reported the slow Cu(111) surface reconstruction induced by
adsorption/desorption of OH-, when the potential is scanned between -
0.25 V and +0.45 V vs. RHE173. Both processes might give a possible
explanation for the modification of the Cu(111) surface.
IV.6 Computational details
Cu(100) was modeled with (3×2) slabs that contained four atomic
layers. For such slabs, we sampled the Brillouin zones with 6×8×1
Monkhorst-Pack grids.115. The geometry optimizations were carried out
using a plane-wave cut-off of 450 eV, employing the conjugate-gradient
scheme until the maximum force on any atom was below 0.05 eV Å-1,
and allowing the two topmost layers and the adsorbates to relax in all
directions, while the 2 bottommost layers were frozen at the optimized
bulk distances. The separation between periodical images was more
than 16 Å in the z direction and dipole corrections were also applied.
The Fermi level in the calculations was smeared using the Methfessel-
Paxton method116 with an electronic temperature of 0.2 eV, and all
energies were extrapolated to T = 0 K.
The chemical potential of protons and electrons was calculated from
that of H2(g) using the computational hydrogen electrode121. The free
energies of the species were calculated as: DFT solvationG E ZPE TS E ,
where EDFT is the total energy calculated in the manner described before,
ZPE is the zero-point energy calculated through the harmonic oscillator
approximation, and TS (with T = 298.15 K) is the total entropy
correction for H2(g) and H2O(l), whereas it corresponds to the
vibrational entropy part for the adsorbed species. We applied the
solvation corrections (Esolvation) reported before for *CO (-0.1 eV/CO)57,
*OCCO (-0.3 eV/*OCCO) and *OCCOH (-0.48 eV/*OCCOH)53 and included
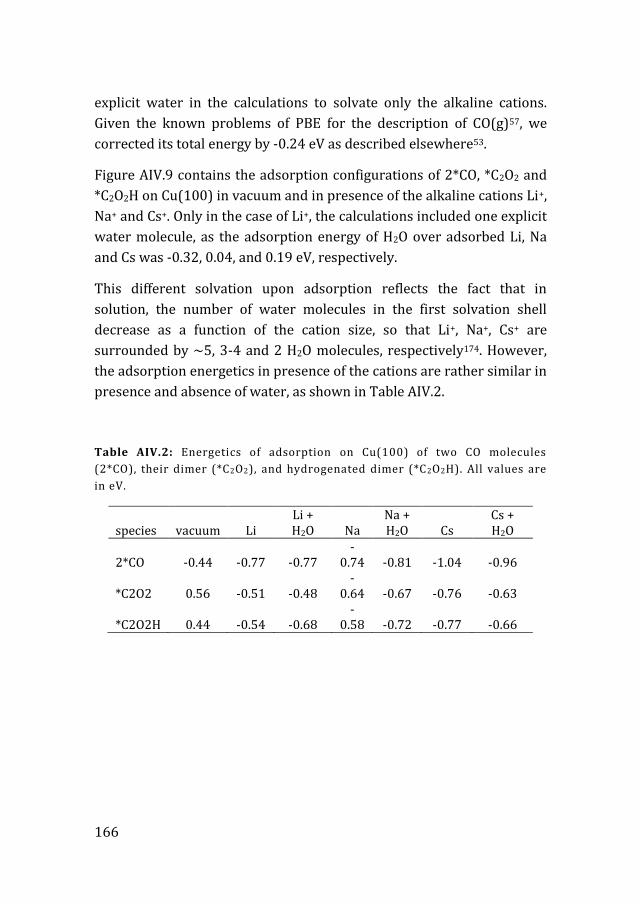
166
explicit water in the calculations to solvate only the alkaline cations.
Given the known problems of PBE for the description of CO(g)57, we
corrected its total energy by -0.24 eV as described elsewhere53.
Figure AIV.9 contains the adsorption configurations of 2*CO, *C2O2 and
*C2O2H on Cu(100) in vacuum and in presence of the alkaline cations Li+,
Na+ and Cs+. Only in the case of Li+, the calculations included one explicit
water molecule, as the adsorption energy of H2O over adsorbed Li, Na
and Cs was -0.32, 0.04, and 0.19 eV, respectively.
This different solvation upon adsorption reflects the fact that in
solution, the number of water molecules in the first solvation shell
decrease as a function of the cation size, so that Li+, Na+, Cs+ are
surrounded by ~5, 3-4 and 2 H2O molecules, respectively174. However,
the adsorption energetics in presence of the cations are rather similar in
presence and absence of water, as shown in Table AIV.2.
Table AIV.2: Energetics of adsorption on Cu(100) of two CO molecules
(2*CO), their dimer (*C2O2), and hydrogenated dimer (*C2O2H). All values are
in eV.
species vacuum Li Li + H2O Na
Na + H2O Cs
Cs + H2O
2*CO -0.44 -0.77 -0.77 -
0.74 -0.81 -1.04 -0.96
*C2O2 0.56 -0.51 -0.48 -
0.64 -0.67 -0.76 -0.63
*C2O2H 0.44 -0.54 -0.68 -
0.58 -0.72 -0.77 -0.66

Appendix IV | Supporting information to chapter 5
167
Figure AIV.9: Adsorption on Cu(100) of 2*CO (left), *C 2O2 (center) and
*C2O2H (right) in a) vacuum, and with b) Li, c) Na, and d) Cs. Color code: C:
black, Cs: blue, Cu: orange, H: white, Li: yellow, Na: green, oxygen: red.
Essentially, the commonality between the three analyzed cations is that
their effects are only present when they are relatively close to the
adsorbates. The distances to the closest O atoms in the dimer vary
considerably with cation: 1.88, 2.37, and 3.08 Å for Li+, Na+ and Cs+,
respectively.
Regarding the C1 pathway, Figure AIV.10 contains the adsorption
configurations of *CO and *CHO on Cu(100) in vacuum and in presence
of the alkaline cations Li+, Na+ and Cs+. Based on the adsorption energies

168
of water on the cations provided above, only in the case of Li+ the
calculations included one explicit water molecule. In any case, the
adsorption energetics are rather similar in presence and absence of
water, as shown below in Table AIV.3 for Li.
Table AIV.3: Energetics of adsorption on Cu(100) of *CO and *CHO. All values
are in eV.
species vacuum Li Li + H2O Na Cs
*CO -0.23 -0.60 -0.58 -0.60 -0.64
*CHO 0.51 -0.10 -0.09 -0.01 -0.10
Figure AIV.10: Adsorption configurations on Cu(100) of *CO (left) and *CHO
(right) in: a) vacuum, and with b) Li, c) Na, and d) Cs. Color code: C: black, Cs:
blue, Cu: orange, H: white, Li: yellow, Na: green, oxygen: red

Appendix IV | Supporting information to chapter 5
169
Finally, in Figures AIV.11 (C1 pathway) and AIV.12 (C2 pathway) we use
the results in Tables AIV.2 and AIV.3 to calculate the energetics of CO
adsorption, dimerization and protonation in vacuum and in presence of
the cations. Note that the average values of Figures AIV.10 and AIV.11
were used to build Figure 5.3 in chapter 5.
Figure AIV.11: Energetics of the first electrochemical step of CO reduction for
the C1 pathway on Cu(100) at 0 V vs RHE. a) In vacuum, and with b) Li, c) Na
and d) Cs.

170
Figure AIV.12: Energetics of the first electrochemical step of CO reduction for
the C2 pathway on Cu(100) at 0 V vs RHE. a) In vacuum, and with b) Li, c) Na
and d) Cs.
IV.7 Exclusion of the formation of oxalates
We have collected the solubility of some alkaline oxalates in Table AIV.4.
Lithium oxalate has a solubility in water at 20 ºC of 80 g/l. On the other
hand, the concentration of our hydroxides was 0.1 M. If all of the Li ions
reacted to form Li2C2O4, then 5.1 g/l would be formed. This means that
all lithium oxalate that might be formed would be readily dissolved in
water. Therefore, we do not expect any salt deposition during our
experiments, which is corroborated by the identical cyclic
voltammograms before and after electrolysis experiments.

Appendix IV | Supporting information to chapter 5
171
Furthermore, we had a look at the spectra of hydrogen oxalate
compounds175 and noticed that it present a band at 1195 cm-1. However,
these compounds also present a prominent band at 1440 cm-1
corresponding to C-O stretching and a band at 1737 cm-1 that
corresponds to C=O stretching175. The absence of the latter two bands in
the spectra recorded during CO reduction makes it possible to rule out
the formation of lithium salts of hydrogen oxalate.
We would also like to annotate that (i) we did not detect any carbonate
(CO32-) in our experiments, and (ii) oxalate (C2O4
2-) is a negatively
charged dimer of CO2. Taking into account that all our experiments
focused on CO reduction and that carbonate was not observed, any CO-
associated dimer should only have 1 or maximum 2 oxygen atoms in its
structure. Therefore, if oxalate were detected from CO reduction
experiments, it would counterintuitively imply that CO is first oxidized
and then subsequently reduced to ethylene. Note as well that if oxalate
formed from dimerization of hydrolyzed *CO, its formation rate would
be slow171 and would not account for the significant amounts of ethylene
observed.
For all those reasons, we believe that oxalate is not responsible for the
two bands that we attribute to the hydrogenated dimer.
Table AIV.4: Solubility in g/100 ml of several alkali oxalates
Alkali oxalate Solubility in g/100 ml
Li 8
Na 3.7
K 36.4
Cs 313


Electroreduction of nitrate and carbon dioxide on copper electrodes
173
Appendix V
Supporting information to chapter 6
V.1 Results
1.6x10⁻²
1.4
1.2
1.0
0.8
0.6
0.4
0.2
Ab
so
rba
nce
/ a
.u.
3000 2500 2000 1500 1000
wavenumber / cm-1
-5x10⁻⁴
-4
-3
-2
-1
0
1
2A
bso
rba
nce
/ a
.u.
1900 1800
wavenumber / cm-1
2341 CO2
PO + CO2 + TEAOH
blanc after 10 min after 20 min after 40 min
Figure AV.1: Time dependent absorbance spectra of a solution
containing 0.1 M of propylene oxide, saturated carbon dioxide
atmosphere in a 0.1M TEAClO4 in acetonitrile solution in the
absence of TEAOH (black) and in the presence of 1M TEAOH after
10 minutes (red), 20 minutes (yellow) and 40 minutes (green).
The insert displays the zoom-in of the region between 1900 - 1750
cm-1

174
Figure AV.1 shows the time dependent absorbance spectra of propylene
oxide and CO2 in the presence of a strong base (TEAOH) in a 0.1 M
TEAClO4 in acetonitrile solution. The spectra were recorded in order to
ensure that the formation of propylene carbonate from propylene oxide
and CO2 is an electrochemical process and not a chemical synthesis
catalyzed by the presence of OH- which can be formed during water
reduction. The spectra show an intense band at 2341 cm-1
corresponding to C=O stretching from CO2 in solution. Less intense
bands at 1670 cm-1 corresponding to decomposition products from the
acetonitrile are also observed. However, the absence of a band at 1800
cm-1 that would correspond to propylene carbonate, supports the
electrochemical nature of the synthesis of propylene carbonate instead
of a chemical reaction catalyzed by OH-, in accordance with the results
observed by Yang et al.78

175
Samenvatting
Heterogene katalyse is van groots belang in industriële processen zoals
de productie van ammonia, de formatie van syngas, de formatie van
zwavelzuur en salpeterzuur, het katalytisch kraken van olie en in vele
andere processen. Deze processen vereisen veelal hoge temperaturen
en hoge druk om een effectieve conversie te bereiken. Daarnaast leiden
sommige van deze processen tot ongewenste bijproducten die
schadelijk kunnen zijn voor het milieu of de katalysator zelf kunnen
aantasten en dus snel kunnen leiden tot een verlies in reactiviteit.
Een alternatief voor industriële processen die gebruik maken van hoge
temperaturen zou het gebruik van elektrokatalyse zijn, dat een aantal
voordelen herbergt ten opzichte van conventionele katalyse. Ten eerste
dragen elektronen als reductie- /oxidatiemiddel bij aan schonere
processen. Ten tweede leidt het gebruik van milde omstandigheden in
het katalytische proces, zoals lagere temperaturen en drukken, mogelijk
tot een hogere stabiliteit van het oorspronkelijke materiaal of het te
vormen product. De opbrengst van de verschillende producten hangt af
van de toegepaste potentiaal, en door deze te controleren kan er, in
principe, selectief gericht worden op het gewenste product en kan de
productie van schadelijke en/of ongewenste bijproducten vermeden
worden. Ondanks deze voordelen, is elektrochemische synthese geen
gemeengoed in de chemische industrie. Het achtergebleven gebruik van
elektrochemische technieken kan toegeschreven worden aan een
gebrek aan onderwijs in elektrochemie en katalyse, de gelimiteerde
beschikbaarheid van componenten voor het bouwen van een
elektrochemische cel en met name door de hoge kosten van elektriciteit
en elektrochemische cellen. Het nadeel van de grote benodigde
hoeveelheid energie kan verholpen worden door het gebruik van
katalysatoren die gemaakt zijn van goedkope en veel voorkomende
materialen en door het gebruik van elektriciteit uit duurzame bronnen.
Voordat elektrochemische processen wijds toegepast kunnen worden in

176
de industrie, zal er echter eerst op kleinere schaal een efficiënt proces
ontwikkeld moeten worden. Met dit doel voor ogen is er eerst een
grondige studie van de elektrochemische katalyse nodig, zodat we het
effect verschillende parameters op de product distributie en de
selectiviteit en efficiëntie van de katalytische reactie kunnen begrijpen
én beheersen.
In deze thesis hebben we gekeken naar aantal parameters die de
elektrochemische conversie van milieuschadelijke moleculen, zoals
nitraten en koolstofdioxide naar bruikbare en minder schadelijke
verbindingen beïnvloeden. Hiermee proberen we de
reactiemechanismes van deze processen op te helderen, met als doel om
een efficiënt en selectief proces te ontwikkelen.
Deze thesis is verdeeld in twee delen; de reductie van nitraten
(hoofdstuk 2) en de mechanistische studie van CO2 conversie naar
verschillende producten, zoals ethanol (hoofdstuk 3), ethyleen
(hoofdstuk 4 en 5) en propyleencarbonaat (hoofdstuk 6).
Vele auteurs hebben de invloed van het materiaal van de elektrode en
de zuurgraad van het elektrolyt op de verdeling van producten van de
reductie van nitraten bestudeerd. In hoofdstuk 2 van deze thesis hebben
we de elektrokatalytische reductie van nitraat op koperen electroden
bestudeerd. De invloed van de oppervlaktestructuur van de electrode
hebben we bestudeerd door middel van het gebruik van twee
verschillende eenkristallijne koperelectroden, namelijk Cu(100) en
Cu(111). De experimenten zijn uitgevoerd in zure en alkalische media,
zodat ook de invloed van de zuurgraad in de reactie bestudeerd kon
worden. De experimenten wezen uit dat de gevormde hoeveelheid van
de verschillende producten afhankelijk is van de zuurgraad van het
elektrolyt. In zure media wordt NO en ammonia gevormd, in alkalische
media is het hoofdproduct hydroxylamine. De reductie van nitraat is
alleen afhankelijk van de oppervlaktestructuur van de electrode in
alkalische media, waarbij de vorming van hydroxylamine het gunstigst
is op Cu(100).

177
Elektrochemische reductie van koolstofdioxide heeft in de laatste
decennia aanzienlijke aandacht gekregen, vanwege de capaciteit van
koper om CO2 te converteren in brandstoffen zoals methaan, ethyleen en
ethanol. Ondanks dat dit proces al in de jaren ’80 ontdekt is, is het
mechanisme van de reactie nog steeds voer voor discussie.
Bij de reductie van koolstofdioxide op koper worden producten met 2
koolstofatomen per productmolecuul (C2 producten) gevormd. Het
belangrijkste C2 product is ethyleen, maar er zijn ook sporen van
ethanol en aceetaldehyde aangetroffen. Aceetaldehyde is waargenomen
als tussenproduct voor de formatie van ethanol tijdens de reductie van
koolstofmonoxide. In hoofdstuk 3 bespreken we de invloed van de
reductie van aceetaldehyde naar ethanol tijdens de reductie van CO2 op
de totale reactie. Men gelooft dat deze drie verbindingen gevormd
worden via een gezamenlijk tussenproduct in de vroege stadia van de
reductie van CO2. Dit betekent dat de splitsing richting ethyleen of
ethanol in een later stadium van de reactie plaats moet vinden. Onze
resultaten hebben aangetoond dat het tussenproduct dat de selectiviteit
richting ethyleen of ethanol bepaalt, het product is van de vijfde
protonatie (CH2CHO*). De protonatie van dit tussenproduct is gunstig
voor de vorming van ethanol op ondergecoördineerde adsorptieplekken
(atomaire stapranden) op de koperelektrode. Daartegenover staat dat
adsorptieplekken met een vierkante symmetrie (Cu(100)) gunstiger zijn
voor de formatie van ethyleen. Ondanks de in verhouding hogere
energetische barrière voor de vorming ethanol ten opzichte van
ethyleen, kan de selectiviteit richting ethanol verhoogd worden door
gebruik te maken van de afhankelijkheid van de oppervlaktestructuur
van de reactie.
Een andere interessante stap in het mechanisme van de reductie van
CO2 is gerelateerd aan de vorming van ethyleen. De enige tussenvorm
die empirisch bevestigd is tijdens de reductie van CO2 naar ethyleen is
CO. Theoretische studies hebben gesteld dat de C-C binding tijdens de
reductie van CO2 naar ethyleen vormt via reductieve dimerisatie,
gevolgd door verdere hydrogenering. In hoofdstuk 4 laten we

178
spectroscopisch bewijs zien voor de formatie van een CO
gehydrogeneerd tussenproduct (OCCOH) tijdens de reductie van CO2
naar ethyleen. De formatie van dit tussenproduct blijkt gevoelig te zijn
voor de oppervlaktestructuur, waarbij de adsorptieplekken met een
vierkante symmetrie het gunstigst zijn.
Een aantal factoren, zoals de zuurgraad van het elektrolyt, de chemische
eigenschappen van kationen of anionen en de oppervlaktestructuur van
de electrode, zijn voorafgaand bestudeerd voor hun effecten op de
reductie van CO2. Al deze parameters leiden tot significante
veranderingen in de verdeling van producten, selectiviteit en het
conversiepercentage. In hoofdstuk 5 analyseren wij het samengestelde
effect van de morfologie van de electrode, de grootte van de alkalische
kation en de toegepaste potentiaal tijdens de reductie van CO. Over het
algemeen kan gesteld worden dat grotere kationen de vorming van
ethyleen verhogen bij potentialen positiever dan -0.45V. Bij potentialen
negatiever dan -0.45V kan er echter gesteld worden dat grotere
kationen de vorming van methaan verhogen. Wij suggereerden dat de
competitie tussen deze twee reacties ervoor zorgt dat de reductie van
CO2 naar ethyleen afneemt op het moment dat de vorming van methaan
toeneemt. Deze correlatie is ook afhankelijk van de grootte van een
kation. We stelden dat de kationen, door een gunstige elektrostatische
interactie, de tussenproducten stabiliseren en zo de katalytische reactie
bevorderen. Daarnaast is ook de vorming van de gehydrogeneerde CO-
dimeer die we bespraken in hoofdstuk vier (OCCOH), afhankelijk van de
grootte van een kation. De gehydrogeneerde dimeer kan waargenomen
worden met behulp van infrarood spectroscopie (FTIR) wanneer Li+,
Na+ en K+ aanwezig zijn, maar is niet zichtbaar in de aanwezigheid van
Rb+ of Cs+. Berekeningen aan de hand van dichtheidsfunctionaaltheorie
(DFT) beschrijven de vorming van *OCCOH dan ook als minder gunstig
in de aanwezigheid van grotere kationen ten opzichte van kleinere
kationen.
Tot slot bestudeerden we in hoofdstuk 6 de conversie van
koolstofdioxide in grotere organische moleculen, specifiek in cyclische

179
carbonaten. We analyseerden het mechanisme van de vorming van
propyleencarbonaat uit koolstofdioxide en propyleenoxide op koperen
electroden. Zo konden we koolstofmonoxide en koolstof(bi)carbonaat
uitsluiten als reagens tijdens de carboxylering. Ook de activatie van
propyleenoxide middels ‘ring opening’ bleek geen rol te spelen in deze
reactie. Onze experimenten suggereerden dat de elektrochemische
reactie gestart wordt door de activatie van CO2 naar CO2-, wat
vervolgens reageert met propyleenoxide tot propyleencarbonaat.
Deze thesis heeft het belang van grondig mechanistisch onderzoek
aangetoond in de zoektocht naar kennis over alle stappen die aan bod
komen in een elektrochemische reactie. Het begrip van hoe
verschillende factoren de selectiviteit en conversie richting een bepaald
product beïnvloeden, kan helpen in het ontwerpen van een efficiënter
proces. Met deze kennis kan een elektrochemische reactie, door het
aanpassen van verschillende parameters in de reactie, gestuurd worden
om de vorming van het gewenste product te optimaliseren.

180
181
Resumen
La catálisis heterogénea es de suma importancia en procesos
industriales tales como la formación de amoníaco, la formación de gas
de síntesis, el fraccionamiento o “cracking” del petróleo, la formación de
ácido sulfúrico, o la formación de ácido nítrico entre muchos otros. Sin
embargo, estos procesos tienen como requisito altas temperaturas y
presiones, con el fin de conseguir conversiones eficientes. Además,
algunos de estos procesos producen subproductos indeseados los cuales
pueden ser nocivos para el medio ambiente o pueden afectar al
catalizador deteriorándolo, lo cual genera una rápida pérdida de
actividad.
Una alternativa razonable a procesos industriales que emplean altas
temperaturas y presiones podría ser el uso de electrocatálisis, la cual
presenta varias ventajas sobre la catálisis convencional. Ante todo, el
uso de electrones como agentes reductores u oxidantes contribuye a un
proceso más limpio. Además, el uso de condiciones moderadas tales
como temperaturas y presiones bajas, puede potencialmente conducir a
una mayor estabilidad de los reactivos de partida o de los productos
formados. Por otra parte, ya que la distribución de los productos
depende del potencial aplicado, el control de dicho potencial permitiría,
en principio, formar de una manera selectiva el producto deseado,
evitando así la formación de subproductos dañinos y/o indeseados. Sin
embargo, la síntesis electroquímica no está mundialmente extendida en
la industria. Las razones del uso limitado de técnicas electroquímicas ha
sido tradicionalmente atribuida a la falta de educación en
electroquímica, a la falta de medios para la construcción de células
electroquímicas y, especialmente, a los altos costes de la electricidad y
de las células electroquímicas. La necesidad de un alto aporte energético
puede ser superado con el uso de catalizadores algunos de los cuales son
abundantes y baratos, y especialmente con el uso de energías
renovables. No obstante, un proceso eficiente debe de ser desarrollado
en el laboratorio antes de que tenga una aplicación industrial. Para este

182
propósito, debe ser llevado a cabo primero, un estudio exhaustivo de la
reacción electroquímica, para entender y controlar todos los diferentes
parámetros que afectan a la reacción, a la distribución de los productos,
a la selectividad y a la eficiencia de la misma.
En esta tesis, se discuten varios parámetros que afectan a la conversión
electroquímica de sustancias nocivas para el medio ambiente tales como
nitratos y dióxido de carbono a compuestos más valiosos, para elucidar
el mecanismo de la reacción con el fin de obtener un sistema eficiente y
selectivo.
Esta tesis está dividida en dos partes; Primero, la reducción de nitrato
(capítulo 2) y segundo en un estudio del mecanismo de reacción de la
conversión de dióxido de carbono a diferentes productos tales como
etanol (capítulo 3), etileno (capítulos 4 y 5) y carbonato de propileno
(capítulo 6).
Un gran número de trabajos previos, ha estudiado las diferencias en
distribución de productos durante la reducción de nitrato utilizando
varios metales y en diferentes pH. En el capítulo 2 de esta tesis se
estudia la reducción electrocatalítica de nitrato en electrodos de cobre.
La influencia de la morfología de la superficie del electrodo fue evaluada
con el uso de dos monocristales de cobre diferentes, Cu(100) y Cu(111).
Además, los experimentos fueron llevados a cabo en medio ácido y en
medio alcalino, proporcionando así un estudio sobre la influencia del pH
en esta reacción. Los experimentos han mostrado que la distribución de
los productos varía dependiendo del pH del electrolito. Así, mientras
que en medio acido los productos formados son NO y amoniaco, en
medio alcalino el producto principal es la hidroxilamina. Además, la
reducción de nitrato es sensible a la estructura del electrodo sólo en
medio básico, con la formación de hidroxilamina favorecida en Cu(100).
La reducción electroquímica de dióxido de carbono ha recibido mucho
interés en las últimas décadas debido a la capacidad del cobre de
convertir CO2 en combustibles tales como metano, etileno y etanol. Este

183
proceso fue descubierto en 1980, sin embargo, el mecanismo de la
reacción aún está en debate.
La reducción de dióxido de carbono en electrodos de cobre forma
etileno como el principal producto C2. No obstante, también han sido
detectadas trazas de etanol y acetaldehído. Debido a que acetaldehído
ha sido confirmado como intermediario en la formación de etanol
durante la reducción de monóxido de carbono, en el capítulo 3
discutimos las implicaciones mecanísticas de la reducción de
acetaldehído a etanol durante la reducción de CO2. Se cree que estos tres
compuestos comparten un intermediario común en las primeras etapas
de la reducción de CO2, sin embargo, la ruta química para la formación
de etanol y de etileno debe bifurcarse en etapas posteriores de la
reacción. Nuestros resultados muestran que el intermediario que
determina la selectividad es el producto de la quinta protonación
(CH2CHO*). La protonación de este intermediario favorece la formación
de etanol en sitios de baja coordinación. Por otra parte, los sitios de
simetría cuadrada favorecen la formación de etileno. A pesar de las altas
barreras energéticas encontradas en la formación de etanol en
comparación con etileno, la selectividad para etanol puede
incrementarse haciendo uso de la sensibilidad estructural de la
reacción.
Otros pasos interesantes en el mecanismo de la reducción de CO2 están
relacionados con la formación de etileno. El único intermediario
confirmado experimentalmente durante la reducción de CO2 ha sido CO.
Estudios computacionales han hipotetizado que la formación de enlaces
C-C en la ruta del etileno ocurre a través de una dimerización reductiva
con posterior hidrogenación. En el capítulo 4 de esta tesis
proporcionamos evidencias espectroscópicas de la formación de un
intermediario hidrogenado de CO (OCCOH) en la ruta del etileno. La
sensibilidad estructural de la formación de este intermediario ha sido
confirmada, siendo la formación del intermediario favorable en sitios
con simetría cuadrada.

184
Varios factores tales como el pH del electrolito, la naturaleza química de
los cationes o aniones y la morfología de la superficie del electrodo han
sido previamente estudiados durante la reducción de CO2. Todos estos
parámetros producen cambios significantes en los productos formados,
en la selectividad y en la velocidad de conversión. En el capítulo 5
analizamos el efecto de la morfología de la superficie del electrodo en
combinación con el tamaño del catión y el potencial aplicado durante la
reducción de CO. En general, cationes grandes favorecen la formación de
etileno a potenciales más positivos que -0.45 V, mientras que a
potenciales más negativos, los cationes grandes favorecen la formación
de metano. Sugerimos que la ruta de reacción hacia etileno se cierra
debido a la mejora de la ruta de reacción que genera metano. Esta
correlación también depende del tamaño del catión. Cationes grades
favorecen la selectividad del etileno en un mayor rango de potencial.
Sugerimos que los cationes actúan como promotores catalíticos los
cuales estabilizan los intermediarios de reacción que tienen una
interacción electrostática favorable con el catión. Además, la formación
del dímero de CO hidrogenado explicado en el capítulo 4 (OCCOH)
también depende del tamaño del catión. Mientras que el dímero
hidrogenado se puede observar con IR-TF cuando Li+, Na+ y K+ están
presentes en solución, el dímero no es observable en presencia de Rb+ o
Cs+. Los cálculos basados en la teoría del funcional de la densidad
describen la formación de *OCCOH en presencia de cationes grandes
menos favorable que en presencia de cationes pequeños.
Finalmente, en el capítulo 6 estudiamos la conversión de dióxido de
carbono en moléculas orgánicas más grandes, específicamente en
carbonatos cíclicos. Hemos estudiado el mecanismo de formación de
carbonato de propileno en electrodos de cobre partiendo de dióxido de
carbono y oxido de propileno. Hemos excluido monóxido de carbono,
carbonatos y bicarbonatos como posibles agentes de carboxilación.
También se ha excluido la activación del óxido de propileno vía apertura
del anillo como el paso clave en esta reacción. Nuestros experimentos
sugieren que el inicio de la reacción electroquímica es la activación del

185
CO2 a CO2-·, el cual ataca al oxido de propileno para finalmente formar
carbonato de propileno.
En términos generales, esta tesis enfatiza la importancia de estudios
mecanísticos exhaustivos para entender todos los pasos involucrados en
una reacción electroquímica. La comprensión de cómo diferentes
factores afectan la selectividad y la conversión hacia un determinado
producto puede ayudar a lograr procesos más eficientes mediante el
ajuste de estos parámetros.

186

187
List of publications
This thesis is based on the following publications
Chapter 2 E Pérez-Gallent, MC Figueiredo, I Katsounaros, MTM Koper Electrocatalytic reduction of Nitrate on Copper single crystals in acidic and
alkaline solutions.
Electrochimica Acta, 2017, 227, 77-84
Chapter 3
I Ledezma-Yanez, E Pérez-Gallent, MTM Koper, F Calle-Vallejo
Structure-sensitive electroreduction of acetaldehyde to ethanol on copper and
its mechanistic implications for CO and CO2 reduction
Catalysis Today, 2016, 262, 90-94
Chapter 4
E Pérez‐Gallent, MC Figueiredo, F Calle‐Vallejo, MTM Koper
Spectroscopic Observation of a Hydrogenated CO Dimer Intermediate During
CO Reduction on Cu (100) Electrodes
Angewandte Chemie, 2017, 129, 3675-3678
Chapter 5
E Pérez‐Gallent, G Marcandalli, MC Figueiredo, F Calle‐Vallejo, MTM Koper
Structure and potential dependent cation effects on CO reduction at copper
single-crystal electrodes
Journal of the American Chemical Society, 2017, 139, 16412–16419
Chapter 6
E Pérez‐Gallent, MC Figueiredo, MTM Koper
Mechanistic study of the electrosynthesis of propylene carbonate from
propylene oxide and CO2 on copper electrodes. Submitted

188

189
Curriculum vitae
Elena Pérez Gallent was born in Valenica (Spain) on 26th August 1988. In
2006, she graduated from the Pureza de Maria high school. In that year,
she started her BSc studies in Chemistry at the Universitat de València.
During her studies, she visited Leiden University within the Erasmus
Exchange Program for her Master thesis, which was performed under
the supervision of Prof. Dr. Marc T. M Koper with the title
“Electrocatalytic carbon dioxide reduction on copper single crystal
electrodes”. In 2013, she received the Licenciatura degree (equivalent to
Master of Science) in Chemistry at Universitat de València.
After a short experience in the industry (Catexel B.V.), she started her
PhD studies under the supervision of Prof. Dr. Marc T. M. Koper in the
research group ‘Catalysis and surface chemistry’ (CASC) of the Leiden
Institute of Chemistry, leiden University. During her PhD she supervised
one HBO student, nine BSc students, two MSc students and the organic
chemistry practical course for first-year student three times.
Furthemore, she took several post-graduate courses including
“Reactivity of nanoparticles for more efficient and sustainable energy
conversion”; “CO2 conversion: From fundamentals towards
applications”; “Catalysis, an integrated approach” and “Characterization
in Catalysis Research”. Parts of the results reported in this thesis were
presented at several (inter)national conferences.
Copyright © 2022 FDOKUMEN