ECB Responsibilities Sulfur Dioxide Standard Operating ...
20
Section No. 2.8.1 Revision 10 November 1, 2016 Page 1 of 20 Section I: ECB Responsibilities Sulfur Dioxide Standard Operating Procedure Revision 10 November 1, 2016
-
Upload
khangminh22 -
Category
Documents
-
view
0 -
download
0
Transcript of ECB Responsibilities Sulfur Dioxide Standard Operating ...
Section No. 2.8.1 Revision 10
November 1, 2016 Page 1 of 20
Section I: ECB Responsibilities
Sulfur Dioxide Standard Operating Procedure Revision 10
November 1, 2016

Approval Sign Off-Sheet
Section No. 2.8.1 Revision 10
November 1, 2016 Page 2 of 20
I certify that I have read and approve of the contents of the 502 ECB Standard Operating Procedure with an effective date of November 1, 2016.
ECB Lead Johnny Doctor, Environmental Technician
Signature: ,()17 �
Acting Electr�=d c:
d
ibratio s Branch Supervisor Patrick Butler
Signature: 9� Central Office Lead Jyoti Bapat, Environmental Chemist
Signature:'.}, � 1 Projects and Procedures Branch Supervisor
:�::::r::
ge�� �
Acting Ambient Monitoring Section Chief Lori Cherry
Signature:��
EPA Region 4 Superfund and Air Section Chief Laura Ackerman
Date: /0 ·-UJ -/&
Date: IU -G, - l(q
Date: 10{ Io( 'Ullfo
Date:
Date: -----'-"-I0-+-'
{1"-+-
} _! �--
Signature: _____________________ Date: ______ _
Section No. 2.8.1 Revision 10
November 1, 2016 Page 3 of 20
Table of Contents 2.8.1 Sulfur Dioxide Standard Operating Procedure: ECB Responsibilities
2.8.1.1 Equipment Selection and Procurement 2.8.1.2 Description of the Thermo Model 43i/43i-TLE Sulfur Dioxide Analyzer 2.8.1.3 Description and Operation of Thermo Model 146i Calibrator, Teledyne T700U
Calibrator, and Teledyne Model 701 Zero Air Generator Thermo Model 146i and Teledyne T700U Calibrator Teledyne Model 701 Zero Air Generator Gas Cylinders
2.8.1.4 Initial Laboratory Startup of the Model Thermo 43i or 43i-TLE SO2 Analyzer Inspection Assembly, Modification and Initial Verification Initial Laboratory Checkout Standard and Service Modes Range Setting Flow Measurement on Monitor Verify the Lamp Voltage Leak Check and Calibration Conduct a multi-point calibration
2.8.1.5 On-site Installation Install Check/Set Time and Date – Computer and Data Logger Leak Check the System Running an Installation Zero-Precision-Span Communication Verification
2.8.1.6 Routine Maintenance Thermo 43i or 43i-TLE Analyzer Thermo 146i Calibrator 701 Zero Air Generator Checks
2.8.1.7 Accuracy Audits 2.8.1.8 Revision History

Section No. 2.8.1 Revision 10
November 1, 2016 Page 4 of 20
2.8.1 Sulfur Dioxide Standard Operating Procedure (SOP): ECB Responsibilities 2.8.1.1 Equipment Selection and Procurement
The State of North Carolina Division of Air Quality (NC DAQ) operates sulfur dioxide monitors across the state for the purpose of monitoring the potential exposure of the general population to ambient levels of sulfur dioxide (SO2). The Electronics and Calibration Branch (ECB) shall procure air monitoring equipment and supplies for the Division of Air Quality. The Environmental Protection Agency’s (EPA) Reference or Equivalent methods list should be reviewed to determine the makes and models acceptable for monitoring sulfur dioxide at the levels dictated by National Ambient Air Quality Standards (NAAQS). Each monitor used must be a reference or equivalent method (40 CFR 53 and 40 CFR 58, Appendix C). All sulfur dioxide monitors used for non-trace level applications must have an acceptable output for the data logging system deployed with the instrument (digital output or analog output of 0 to 10-volt DC). All monitors and calibrators must operate on 115-volt AC 60Hz line current. All analog data acquisition systems must be calibrated to accept a 0 to 10-volt DC output, and must meet other specifications as necessary. All digital data acquisition systems must be at least 10-bit and have RS232 and/or Ethernet connections.
2.8.1.2 Description of the Thermo Model 43i and 43i-TLE Sulfur Dioxide Analyzer
The Model 43i and 43i-TLE SO2 analyzers are based on the principle that SO2 molecules absorb ultraviolet (UV) light and become excited at one wavelength, then decay to a lower energy state emitting UV light at a different wavelength. Specifically,
𝑆𝑂2 + ℎ𝑣1 → 𝑆𝑂2∗ → 𝑆𝑂2 + ℎ𝑣2
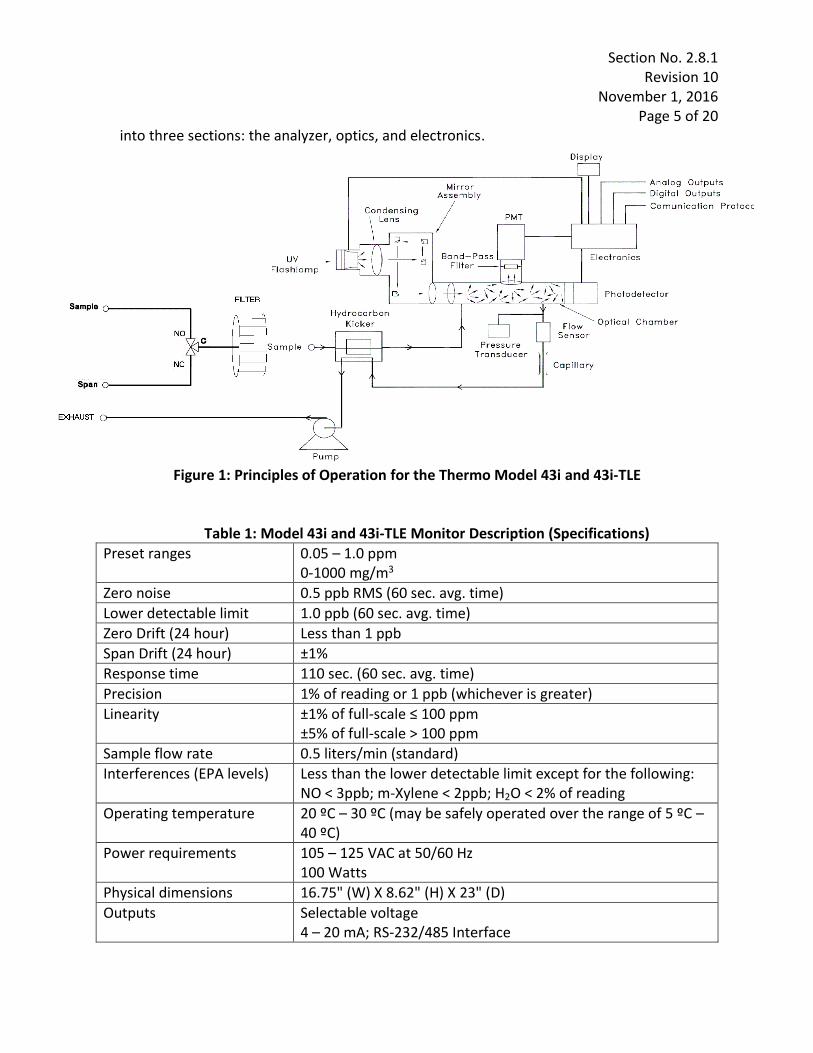
The sample is drawn into the analyzer through the SAMPLE bulkhead, as shown in Figure 1: Principles of Operation. The sample flows through a hydrocarbon “kicker”, which removes hydrocarbons from the sample by forcing the hydrocarbon molecules to permeate through the tube wall. The SO2 molecules pass through the hydrocarbon kicker unaffected. The sample flows into the fluorescence chamber, where pulsating UV light excites the SO2 molecules. The condensing lens focuses the pulsating UV light into the mirror assembly. The mirror assembly contains four selective mirrors that reflect only the wavelengths that excite SO2 molecules. As the excited SO2 molecules decay to lower energy states, they emit UV light that is proportional to the SO2 concentration. The bandpass filter allows only the wavelengths emitted by the excited SO2 molecules to reach the photo multiplier tube (PMT). The PMT detects the UV light emission from the decaying SO2 molecules. The photo detector, located at the back of the fluorescence chamber, continuously monitors the pulsating UV light source and is connected to a circuit that compensates for fluctuations in the UV light. The sample then flows through a flow sensor, a capillary, and the shell side of the hydrocarbon “kicker”. The analyzer outputs the SO2 concentration to the front panel display and the analog outputs. The instrument is best described in detail, by separating it
Section No. 2.8.1 Revision 10
November 1, 2016 Page 5 of 20
into three sections: the analyzer, optics, and electronics.
Figure 1: Principles of Operation for the Thermo Model 43i and 43i-TLE
Table 1: Model 43i and 43i-TLE Monitor Description (Specifications) Preset ranges 0.05 – 1.0 ppm
0-1000 mg/m3
Zero noise 0.5 ppb RMS (60 sec. avg. time)
Lower detectable limit 1.0 ppb (60 sec. avg. time)
Zero Drift (24 hour) Less than 1 ppb
Span Drift (24 hour) ±1%
Response time 110 sec. (60 sec. avg. time)
Precision 1% of reading or 1 ppb (whichever is greater)
Linearity ±1% of full-scale ≤ 100 ppm ±5% of full-scale > 100 ppm
Sample flow rate 0.5 liters/min (standard)
Interferences (EPA levels) Less than the lower detectable limit except for the following: NO < 3ppb; m-Xylene < 2ppb; H2O < 2% of reading
Operating temperature 20 ºC – 30 ºC (may be safely operated over the range of 5 ºC – 40 ºC)
Power requirements 105 – 125 VAC at 50/60 Hz 100 Watts
Physical dimensions 16.75" (W) X 8.62" (H) X 23" (D)
Outputs Selectable voltage 4 – 20 mA; RS-232/485 Interface

Section No. 2.8.1 Revision 10
November 1, 2016 Page 6 of 20
2.8.1.3 Description and Operation of Thermo Model 146i, Teledyne T700U Calibrator, and Teledyne Model 701 Zero Air Generator
A) Thermo Model 146i or Teledyne 700U Calibrator The calibrator supplies the required levels of SO2 to perform zero, precision, span checks and multipoint calibrations. The calibrator is operated remotely from the data logger to perform zero, precision, and span checks. This is an accurate mass flow controlled gas dilution system. SO2 gas from a NIST traceable Protocol certified cylinder (connected to Port C) is blended with "zero-air" to provide a desired concentration. From the known calibration of the two mass flow controllers, the exact concentration can be calculated. A typical dilution ratio of about 100:1 to 1000:1 is used to generate the appropriate concentration. Note: Teledyne 700U calibrator is only used at sites with both SO2 and NO2.
B) Teledyne Model 701 Zero Air Generator
The purpose of the Model Teledyne Model 701 Zero Air Generator is to supply pollutant-free air ("zero air") for proper instrument zeroing and to provide clean diluent air for use with the calibrator. Ambient Air is drawn into the system which removes water vapor, SO2, NO, NO2, O3, CO and hydrocarbons.
C) Zero Air Generator Certification
Please reference Section 2.3.5: Zero Air Pack Certification and Auditing for instructions on the certification of the Zero Air Generators.
D) Gas Cylinders All gas cylinders must be traceable to a National Institute of Standards and Testing – Standard Reference Material (NIST-SRM) and must be used prior to the expiration date (i.e., 2 years). These are termed “Protocol” gas. The major components of a typical SO2 monitoring system include: 1. Thermo 43i or 43i-TLE SO2 Analyzer 2. Thermo 146i Dynamic Gas Calibrator 3. Zero Air Generator and Certified Protocol SO2 Cylinder 4. ESC/AGILAIRE Model 8816 or 8832 Data Logger 5. A dedicated site PC and modem
2.8.1.4 Initial Laboratory Startup of the Model 43i and 43i-TLE
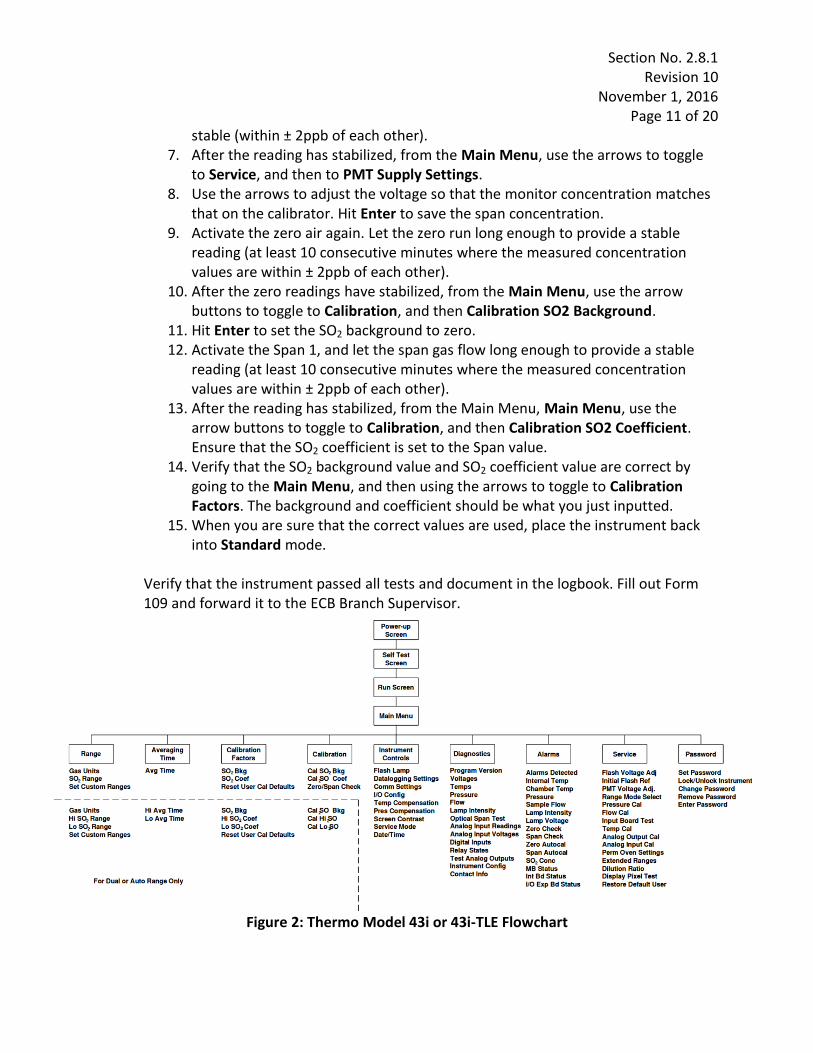
The ECB shall conduct and document, initial operational tests before deploying an instrument. Refer to Figure 2: Thermo Model 43i/43i-TLE Flowchart for a description of the instrument menu. Items to be completed include:
Inspection
Assembly (Modification, Range Setting, Flow Verification, and Lamp Verification)
Leak Check and Calibration

Section No. 2.8.1 Revision 10
November 1, 2016 Page 7 of 20
A) Inspection Visually inspect the exterior of all items for damage. Remove the cover and inspect the electronics assembly and circuit boards for loose wires, cables, broken components, or other damage. Reconnect any loose components and if necessary, contact the manufacturer.
B) Assembly, Modification and Initial Verification
Prior to deployment in the field, all instruments will undergo basic operational tests in the ECB lab, with results recorded in the instrument’s logbook which is filed in the ECB lab. The instrument should be set up in the lab with accompanying, calibrator, zero air system, cylinder, and data logging system. The Thermo Model 43i and 43i-TLE require the addition of a 24 VDC solenoid valve to provide automatic zero and span capabilities. As shown on page 9-1 of the manual, and as approved by the EPA, this is an equivalent method (EQSA-0486-060). The solenoid addition requires the rear panel bulkheads to be reconfigured by moving the sample inlet, adding a span inlet and labeling the inlets "SPAN" and "SAMPLE". The exhaust is located in the original position and labeled accordingly. The rear panel has a separate port for span, sample and exhaust. Additionally, the sample and span inlets are directed through the solenoid and hydrocarbon kicker. All sample and span gasses pass through the hydrocarbon kicker before entering the optics. Install a Teflon particulate inlet filter holder on the rear of the instrument. Connect the sample line to the particulate filter holder inlet. Connect the rear panel bulkhead labeled "exhaust" to a suitable vent outside of monitoring room (do not vent to room air). Plug in power cord and turn on power to instrument. The cooling fan, pump, mode lights and fluorescent source should now be powered. Check to see that the zero, span and sample modes are working by listening for solenoid clicks between modes. Before the initial laboratory calibration is conducted on the 43i or 43i-TLE, zero and span must be equilibrated until no adjustments are necessary between the two settings. When the zero and span require no adjustments, the other calibration points can be run. Ensure that the Digital Volt Meter (DVM) and Data Logger are connected to output #1.
C) Initial Laboratory Setup
Attach a Teflon tube (FEP Teflon type only) from the fitting labeled "output" on the rear panel of the calibrator to the "span" input of the monitor. Connect a source of zero-air to the inlet port labeled zero-air. Connect the standard SO2 gas cylinder to the port labeled C. Refer to Figure 2: Thermo Model 43i/43i-TLE Flowchart for a description of the instrument menu.
Section No. 2.8.1 Revision 10
November 1, 2016 Page 8 of 20
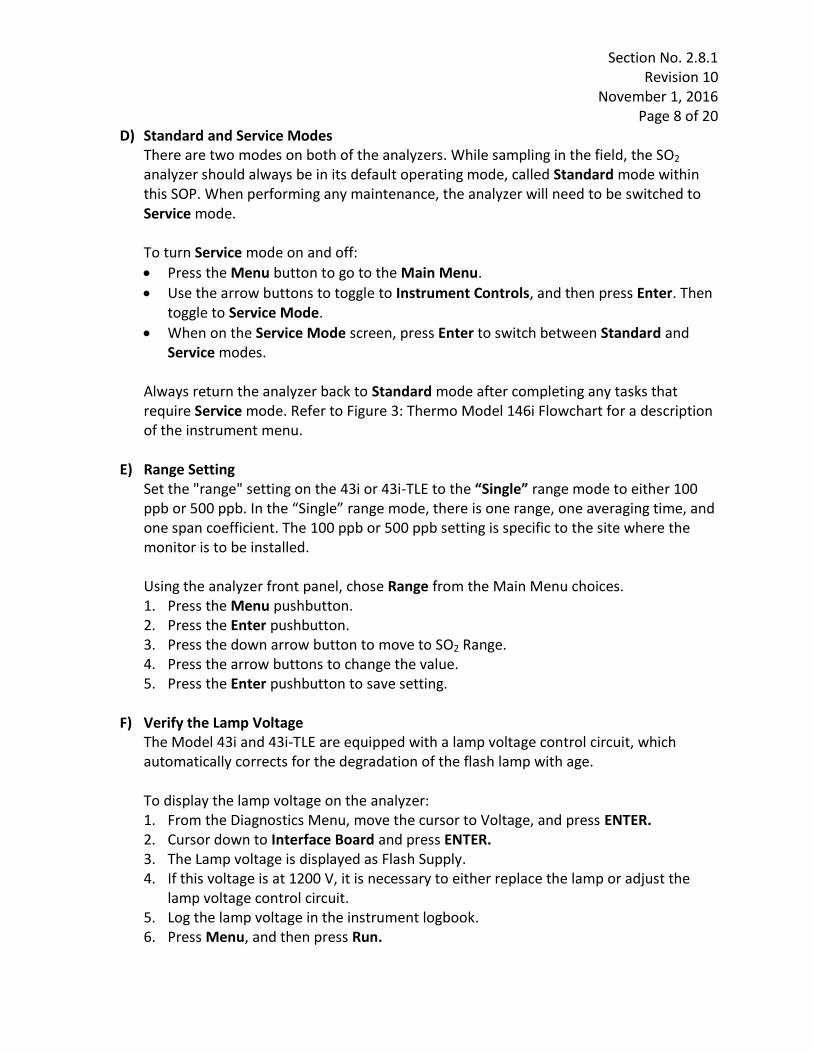
D) Standard and Service Modes There are two modes on both of the analyzers. While sampling in the field, the SO2 analyzer should always be in its default operating mode, called Standard mode within this SOP. When performing any maintenance, the analyzer will need to be switched to Service mode. To turn Service mode on and off:
Press the Menu button to go to the Main Menu.
Use the arrow buttons to toggle to Instrument Controls, and then press Enter. Then toggle to Service Mode.
When on the Service Mode screen, press Enter to switch between Standard and Service modes.
Always return the analyzer back to Standard mode after completing any tasks that require Service mode. Refer to Figure 3: Thermo Model 146i Flowchart for a description of the instrument menu.
E) Range Setting Set the "range" setting on the 43i or 43i-TLE to the “Single” range mode to either 100 ppb or 500 ppb. In the “Single” range mode, there is one range, one averaging time, and one span coefficient. The 100 ppb or 500 ppb setting is specific to the site where the monitor is to be installed. Using the analyzer front panel, chose Range from the Main Menu choices. 1. Press the Menu pushbutton. 2. Press the Enter pushbutton. 3. Press the down arrow button to move to SO2 Range. 4. Press the arrow buttons to change the value. 5. Press the Enter pushbutton to save setting.
F) Verify the Lamp Voltage
The Model 43i and 43i-TLE are equipped with a lamp voltage control circuit, which automatically corrects for the degradation of the flash lamp with age. To display the lamp voltage on the analyzer: 1. From the Diagnostics Menu, move the cursor to Voltage, and press ENTER. 2. Cursor down to Interface Board and press ENTER. 3. The Lamp voltage is displayed as Flash Supply. 4. If this voltage is at 1200 V, it is necessary to either replace the lamp or adjust the
lamp voltage control circuit. 5. Log the lamp voltage in the instrument logbook. 6. Press Menu, and then press Run.

Section No. 2.8.1 Revision 10
November 1, 2016 Page 9 of 20
G) Flow Measurement on Monitor Choose Diagnostics from the Main Menu. Choose Flow from the Diagnostics Menu, verify the current sample flow rate and record in logbook. The flow is measured by an internal flow sensor. A flow rate of about 0.5 LPM should be observed, if a flow rate of less than 0.35 LPM is observed a leak may be present.
H) Concentration Units Set the instrument to read in parts per billion (ppb).
I) Averaging Time The longer the averaging time, the smoother the data will be. Initially North Carolina will use 60 seconds as the averaging time.
J) Calibration Factors
Leave SO2 background at zero and coefficients at 1 initially. They will automatically be corrected after zero/span points. Discussion of these factors is covered in later sections (Operator, calibration).
K) Diagnostic Checks and Settings The following are diagnostic menu set points for the SO2 analyzer:
Parameter Minimum Set Point Maximum Set Point Internal Temperature 25 °C 33 °C
Pressure 715 mmHg 740 mmHg
Sample Flow 0.450 L/min 0.480 L/min
Lamp Intensity 80% 90%
+3.3 V Supply ±1 Volt
+5.0 V Supply ±1 Volt
+15.0 V Supply ±1 Volt
+24.0 V Supply ±1 Volt
-15.0 V Supply ±1 Volt
-3.3 V Supply ±1 Volt
L) Alarm Settings
The following Alarm Limits are used in the SO2 analyzer:
Parameter Minimum Alarm Maximum Alarm
Internal Temperature 15.0 °C 45.0 °C
Chamber Temperature 43.0 °C 47.0 °C
Pressure 400 mmHg 1000 mmHg
Sample Flow 0.350 L/min 0.750 L/min
Lamp Intensity 40% 100%
Lamp Voltage 750 V 1200 V

Section No. 2.8.1 Revision 10
November 1, 2016 Page 10 of 20
M) Leak Check and Calibration Two leak tests are performed (SAMPLE and SPAN). Leak test the Monitor SAMPLE port. A leak test should be performed before deployment to the field, and also whenever the flow is observed to be less than 0.35 LPM: 1. Disconnect the sample line from the analyzer above the filter and block the opening
with a leak-tight cap. 2. Press Menu and use the arrow buttons to move the cursor to Diagnostics. Select
Pressure and press Enter. The pressure reading should be dropping. Wait until pressure drops below 180 mm Hg (flow should also go to zero). NOTE: If the pressure has not dropped below 180 mm Hg within three minutes, immediately remove the cap. Check that all fittings are tight and input lines are not cracked or broken. Do not cap off the line for more than three minutes or the system may pressurize.
3. Remove the cap and leak test the monitor SPAN port. Document in the logbook. Leak test the Monitor SPAN port. Begin a “zero” event using the AV-Trend data logging system. Perform the following steps: 1. Disconnect the calibrator line from the analyzer and block the opening with the leak-
tight cap. 2. Press Menu and use the arrow buttons to move to Diagnostic. Select Pressure, and
press Enter. The pressure reading should be dropping. Wait until pressure drops below 180 mm Hg (flow should also be at zero). NOTE: If the pressure has not dropped below 180 mm Hg within three minutes, immediately remove the cap. Check that all fittings are tight and input lines are not cracked or broken and retest. Do not cap off the line for more than three minutes or the system may pressurize.
3. If leak check passes, remove the cap, reconnect the calibrator line to the span port and the sample line to the sample inlet. Clear the zero mode by aborting the zero cal. Document in the logbook. If leak check fails, troubleshoot the instrument and conduct any necessary repairs and repeat the leak check. Proceed to “multipoint calibration”.
N) Conduct a multi-point calibration
To perform a multi-point calibration: 1. Place the analyzer into Service mode. 2. Activate the zero. Run the zero until the reading has stabilized. A good baseline
for a stable reading is ten consecutive minutes where the concentration values are within ± 2ppb of each other.
3. From the Main Menu, use the arrows to toggle to Service, and then to Flash Voltage Adjustment.
4. Adjust the voltage until it is 800V. 5. Go back to the Main Menu. Again, use the buttons to move to Service, and then
to Initial Flash Reference. The voltage should be between 2.8V – 4.5V. 6. Activate Span 1. Run Span 1 until there are ten consecutive readings that are
Section No. 2.8.1 Revision 10
November 1, 2016 Page 11 of 20
stable (within ± 2ppb of each other). 7. After the reading has stabilized, from the Main Menu, use the arrows to toggle
to Service, and then to PMT Supply Settings. 8. Use the arrows to adjust the voltage so that the monitor concentration matches
that on the calibrator. Hit Enter to save the span concentration. 9. Activate the zero air again. Let the zero run long enough to provide a stable
reading (at least 10 consecutive minutes where the measured concentration values are within ± 2ppb of each other).
10. After the zero readings have stabilized, from the Main Menu, use the arrow buttons to toggle to Calibration, and then Calibration SO2 Background.
11. Hit Enter to set the SO2 background to zero. 12. Activate the Span 1, and let the span gas flow long enough to provide a stable
reading (at least 10 consecutive minutes where the measured concentration values are within ± 2ppb of each other).
13. After the reading has stabilized, from the Main Menu, Main Menu, use the arrow buttons to toggle to Calibration, and then Calibration SO2 Coefficient. Ensure that the SO2 coefficient is set to the Span value.
14. Verify that the SO2 background value and SO2 coefficient value are correct by going to the Main Menu, and then using the arrows to toggle to Calibration Factors. The background and coefficient should be what you just inputted.
15. When you are sure that the correct values are used, place the instrument back into Standard mode.
Verify that the instrument passed all tests and document in the logbook. Fill out Form 109 and forward it to the ECB Branch Supervisor.
Figure 2: Thermo Model 43i or 43i-TLE Flowchart

Section No. 2.8.1 Revision 10
November 1, 2016 Page 12 of 20
Figure 3: Thermo 146i Flowchart
2.8.1.5 On-site Installation The ECB will install the monitor and its support equipment. Acquiring access to a site, and approval of the site is the responsibility of the DAQ regional office and the Projects and Procedures Branch. Internet/wireless service and electrical power should be secured along with any needed permits, new wiring, etc., prior to installation of the monitor equipment. The site location must meet the applicable site requirements and be approved by the Projects and Procedures Branch Supervisor and EPA. Refer to Figure 4: Plumbing and Wiring Diagram for Monitoring Setup and for general schematic of the set-up. A) Install
1. Verify that the building/shelter is sound and that the heating/cooling system is working and can control the temperature at a preset level within the range of 20-30 °C. The sampling probe and lines must be FEP Teflon, or of an equivalent material. Lines must be clean, and have a sample residence time of less than 20 seconds. The inlet line should be wrapped with removable polyurethane foam in order to prevent condensation. In extreme cases, heat tape may be used. For continuous, year-round sites, the probe and funnel will be changed at least every two years during the audit (even calendar years).
2. Install one end of a short piece of vent line (any type of ¼" tubing) to the monitor
exhaust fitting and place the other end through an opening to the outside of the shelter to vent the instrument (do not obstruct).
WARNING: Do not plug in the monitor, calibrator, modem, data logger, and interface box until all cables are connected. ELECTRICAL SHOCK AND/OR EQUIPMENT DAMAGE MAY OCCUR OTHERWISE.
3. Connect the monitor, modem, data logger, and computer as shown in Figure 4:
Plumbing and Wiring Diagram for Monitoring Setup. Observe polarity markings.
Section No. 2.8.1 Revision 10
November 1, 2016 Page 13 of 20
Connect all instruments and support equipment power cords to a grounded surge suppressor, connected to a 115v AC, 60 Hz grounded receptacle.
4. Configure the data logger and PC software, including the scheduler, to run auto
poll/cal. The data logger can be ESC Model 8816’s or 8832’s. The ECB verifies that the system can be accessed remotely by computer from the ECB lab. (It is the responsibility of the region to program the AV-Trend for the polling of information that is specific to the needs of the region.)
5. Verify that all operational events, such as solenoid on/off are working. Bleed the
calibration cylinder regulators and lines to purge/minimize room air in the calibration system. Check the analog outputs on the instrument after performing the operational checks.
B) Check and Set Computer Time and Date
The times for the data logger, AV-Trend, and computer must be Eastern Standard Time. They must have the same time and be synched to the NIST time provider in Colorado (+ 1 minute). A task can be set up in AV-Trend to ensure that the times are synchronized.
1. Click on the date and time in the lower right corner of the computer screen. 2. Select Change Date and Time settings. 3. Select the Internet Time tab, and then press the Change Settings button. 4. Check the box that states Synchronize with an Internet Server. From the server
drop down menu, select time.nist.gov. 5. Press Update Now. 6. Select OK to exit. The created task scheduler named “Clock Sync” in AV-Trend
will sync the data logger and computer times. If the data logger time is not within 1 minute of NIST time but it matches the computer time, then there is a problem with the computer time. Either the computer is not synchronizing properly with the NIST time or the clock is drifting too much and needs to be synchronized more often or the computer needs to be replaced. Call the ECB and they will help identify the issue and tell you what to do to correct it. If the data logger time is not within 1 minute of NIST time and it does not match the computer time and the computer matches NIST time, then there is a problem with the synchronization of the data logger time with the computer. Call the ECB and they will give you instructions on how to synchronize the data logger to the computer. Sources for getting the correct time:
1. Call the ECB and ask for the NIST time 2. Call the NIST Colorado time at (303) 499-7111 3. Correct time loaded into cell phone 4. Correct time website, http://nist.time.gov

Section No. 2.8.1 Revision 10
November 1, 2016 Page 14 of 20
C) Leak Check the System Before running an installation zero or span, leak check the SO2 sampling system. For the Monitor SAMPLE port: 1. Disconnect the sample line from the analyzer and block the opening with a leak-tight
cap. 2. Press “Menu” and use the arrow buttons to go to Diagnostics. Select “Pressure” and
press “Enter”. The pressure reading should be dropping. Wait until pressure drops below 180 mm Hg. The flow should also be at zero.
NOTE: If the pressure has not dropped below 180 mm Hg within three minutes, immediately remove the cap. Check to see that all fittings are tight and input lines are not cracked or broken. Do not cap off the line for more than three minutes or the system may pressurize.
For the Monitor SPAN port: 1. Disconnect the calibrator line from the analyzer above the filter and block the
opening with a leak-tight cap. 2. Press Menu and use the arrow buttons to go to Pressure and press “Enter”. The
pressure reading should be dropping (flow should also go to zero). Wait until pressure drops below 180 mm Hg.
NOTE: If the pressure has not dropped below 180 mm Hg within three minutes, the leak check has failed. Immediately remove the cap. Check to see that all fittings (leak-tight cap, filter housing, and filter inlet/outlet fittings) are tight and input lines are not cracked or broken and re-test. Do not cap off the line for more than three minutes or the system may pressurize. If the leak check passes, remove the cap, reconnect the calibrator line to the span port and the sample line to the sample inlet. Clear the zero mode by aborting the zero cal.
D) Running an Installation Zero-Span-Precision (Calibration Check)
In order to ensure the monitoring equipment was not damaged in transit or during installation, run a three-point check of the instrument to include; the zero point, the span point relative to the instrument’s expected operating range and precision point. This procedure IS NOT a substitute for the initial calibration to be performed by the region. The installation calibration check is intended as a field check to verify the instrument (and its associated components) have not suffered a catastrophic mishap from lab bench to field shelter. The sampling system should introduce, and the instrument should successfully recognize, SO2 concentrations at expected ambient levels. If a problem is found with any component of the sampling system, the installers will contact the region and the ECB office with the details to initiate a resolution. The Zero point will include checking the analog output (Z1) to the data logger. The Span point check will include checking the analog output (SP1) to the data logger. Whenever possible the data logger (Z1/SP1) should be adjusted as close to correct as possible

Section No. 2.8.1 Revision 10
November 1, 2016 Page 15 of 20
(within +/- 0.005ppm). In addition to new site installation, the installation calibration check will be performed any time a component potentially affecting calibration is replaced, modified, or repaired including: 1. Monitor replacement/repair 2. Calibrator replacement/repair 3. Zero air system replacement/repair 4. Cylinder swap-out 5. Lamp replacement
The installation calibration after any of these events does not replace the region’s responsibility to perform a full calibration (and hence “take ownership” of the monitor), but is intended to boost the overall confidence in the equipment at the transition point between the ECB and the Operator(s).
E) Communication Confirmation Whenever possible, it is recommended that the ECB office be contacted at the conclusion of an installation, and asked to poll the site to insure that it is ‘reachable’. Before leaving the site, sign out and reset the scheduler for normal operation.
Figure 4: Plumbing and Wiring Diagram for Monitoring Setup

Section No. 2.8.1 Revision 10
November 1, 2016 Page 16 of 20
2.8.1.6 Routine Maintenance A) Thermo Model 43i or 43i-TLE Analyzer
Periodic maintenance procedures should be performed when necessary to ensure proper operation of the analyzer. Maintenance includes preventive, routine, and corrective tasks. The ECB is expected to be entirely responsible for the corrective maintenance issues and to assist with preventative and routine maintenance that may fall outside the regions’ comfort levels or capabilities. All maintenance activities must be documented by ECB personnel in the monitor’s maintenance logbook. Step-by-step procedures for all maintenance activities should be followed as presented by the manufacturer in the instrument’s operation manual (Chapter 5, “Preventive Maintenance” and Chapter 7, “Servicing”, 5/16/2015 version). Always down/disable the data logger data channel. Items requiring maintenance by ECB are: 1. Replacing the UV lamp (performed when lamp voltage approaches 1200 volts) 2. Replacing the printed circuit boards (performed when operational problem is traced
to a particular component) 3. Leak Checks (performed after filter changes or when sample flow drops below 0.35
LPM as determined during monthly checks) 4. Replacing the pump diaphragm (performed when sample flow of 0.35 – 0.65 LPM
cannot be achieved as determined during monthly checks) 5. Clean Optical Bench as needed 6. Replace PMT as needed 7. Clean/replace capillary (if sample flow falls below 0.35 LPM)
B) Thermo Model 146i Calibrator, or Teledyne T700U Calibrator
Periodic maintenance and/or adjustment for the calibrator is required to ensure proper operation. Except for mass flow controller re-certification, which occurs every 12 months, the following maintenance activities are performed only when the calibrator malfunctions as determined by the site operator. Items requiring ECB maintenance are: 1. Leak Checking 2. Solenoid Replacement 3. Circuit Board Replacement 4. Mass Flow Controller Replacement 5. Replacement of DVM 6. Internal Adjustments 7. Certification of Mass Flow Controllers (reference the Calibrator SOP Section 2.3.4)
C) Model 701 Zero Air Generator and Compressor Checks
Periodic maintenance and/or adjustment for the Zero Air Pack is required to ensure proper operation. The ECB shall re-certify the zero air system once per year by:
1. Verifying that the pressure gauge on the Zero Air Supply is reading 30 psi 2 psi.

Section No. 2.8.1 Revision 10
November 1, 2016 Page 17 of 20
2. Replacing chemicals that have been depleted. Please reference SOP 2.3.5 for more details.
After conducting any maintenance up the data logger channel (enable/mark channel online), document the work done in the site logbook (and instrument logbook if appropriate), and flag the data.
2.8.1.7 Accuracy Auditing
Each analyzer must be audited by the ECB at least once per calendar year. The audit must be performed using a calibrator and gas cylinder standard that is different from the standard and calibrator used for routine calibration and 1-pt QC checks. The ECB accomplishes this task by performing a through-the-probe audit. Several routine items that shall be included in the audit are:
Security of the Building
Site/Building Temperature (document NIST temperature and data logger temperature on the audit form)
Condition of the Sample Line, Probe, and Funnel (replace as required) checked once per year during audit
A) The audit calibrator must be certified against the primary standard every 9 months.
The auditor must not be the operator who conducts the routine monitoring, calibrations, and analysis. Conduct the audit before making adjustments. The monitor must operate in its normal sampling mode, and the audit gas must pass through the existing particulate filter. The difference between the actual concentration of the audit test gas and the concentration indicated by the analyzer is used to assess the accuracy of the monitoring data.
B) Allow audit calibrator to equilibrate at least one-half to one hour before challenging the
monitor. Check and review the site temperature and the ambient SO2 concentration for the day (never conduct an audit during an ambient SO2 exceedance or a potential ambient SO2 exceedance).
C) Down (disable) the SO2 channel.
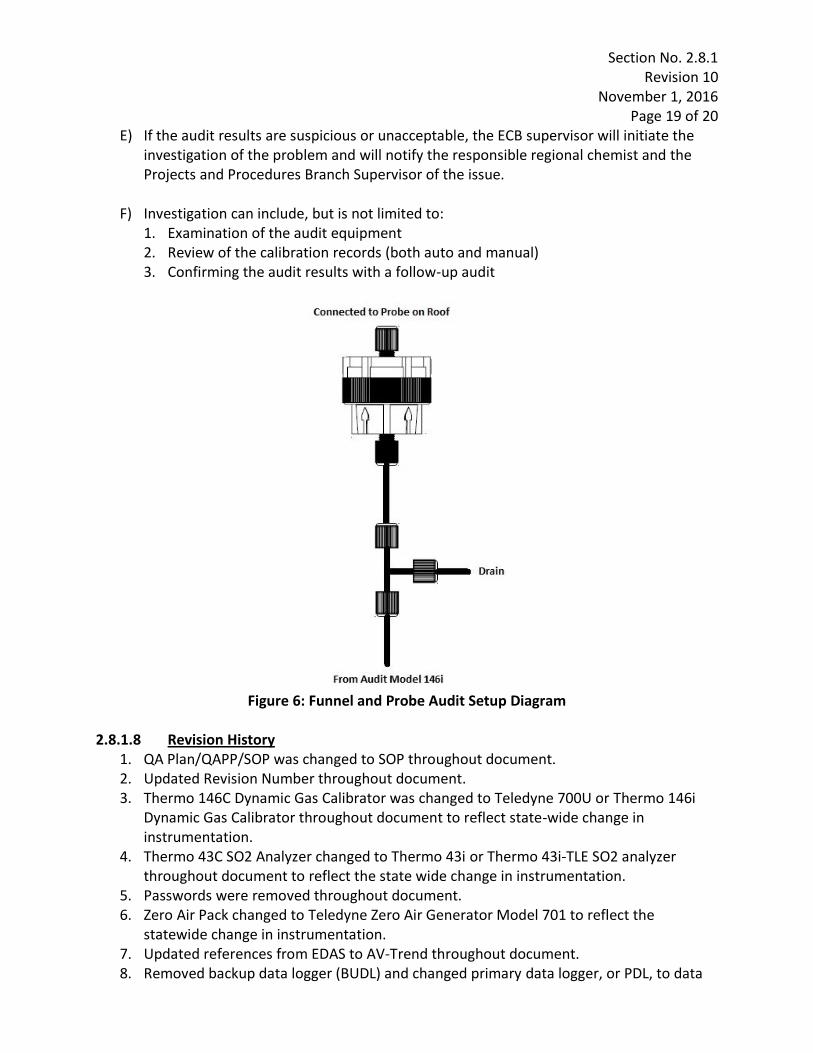
D) Connect the audit calibrator, cylinder, and zero air system as shown in Figure 5: Audit Plumbing Diagram for Monitoring Setup. Connect output of audit calibrator to probe funnel on roof as shown in Figure 5. The probe funnel setup should be connected as shown in Figure 6: Funnel and Probe Audit Setup Diagram. Perform the following audit calibrator checks: 1. Verify the audit calibrator certification is current. 2. Power ON - Verify calibrator has power by observing the LED screen. 3. Perform Audit - At least four concentrations (zero plus three up-scale
concentrations) must be introduced to an analyzer. Approximate concentration ranges for instruments operating at the 0 to 500 ppb range are given below:

Section No. 2.8.1 Revision 10
November 1, 2016 Page 18 of 20
Analyzer Span Gas Flow (sccm) Zero Flow (sccm)
Zero (0 ppb) 0 2,000
Level 1 (70 ppb) 27.85 4,000
Level 2 (18 ppb) 12.53 7,000
Level 3 (2.9 ppb) 3.78 13,000
To achieve the zero point, along with three up-scale concentrations, a 10.0 ±3 ppm cylinder must be used. A 50 sccm and 20 slpm audit calibrator is also required. For the Zero level, Level 1, and Level 2, input the Analyzer Span (conc) and Zero Flow (tflow) into the audit calibrator. For Level 3, input Gas Flow and Zero Flow under the manual settings in the audit calibrator.
Figure 5: Audit Plumbing Diagram for Monitoring Setup
4. Review and record on an audit form (AQ-121) the current site temperature taken
during audit from both the NIST thermometer and the data logger. 5. For each audit setting, record on the audit form; the instrument concentration and
five corresponding stable one-minute data logger averages. 6. If the audit results are greater than +/- 10% of expected, contact the ECB supervisor
and print out the last available auto calibration routine. 7. Disconnect the audit calibrator line from the outside probe, up the data logger
channel, and log out.
Section No. 2.8.1 Revision 10
November 1, 2016 Page 19 of 20
E) If the audit results are suspicious or unacceptable, the ECB supervisor will initiate the investigation of the problem and will notify the responsible regional chemist and the Projects and Procedures Branch Supervisor of the issue.
F) Investigation can include, but is not limited to: 1. Examination of the audit equipment 2. Review of the calibration records (both auto and manual) 3. Confirming the audit results with a follow-up audit
Figure 6: Funnel and Probe Audit Setup Diagram 2.8.1.8 Revision History
1. QA Plan/QAPP/SOP was changed to SOP throughout document. 2. Updated Revision Number throughout document. 3. Thermo 146C Dynamic Gas Calibrator was changed to Teledyne 700U or Thermo 146i
Dynamic Gas Calibrator throughout document to reflect state-wide change in instrumentation.
4. Thermo 43C SO2 Analyzer changed to Thermo 43i or Thermo 43i-TLE SO2 analyzer throughout document to reflect the state wide change in instrumentation.
5. Passwords were removed throughout document. 6. Zero Air Pack changed to Teledyne Zero Air Generator Model 701 to reflect the
statewide change in instrumentation. 7. Updated references from EDAS to AV-Trend throughout document. 8. Removed backup data logger (BUDL) and changed primary data logger, or PDL, to data

Section No. 2.8.1 Revision 10
November 1, 2016 Page 20 of 20
logger throughout document. 9. Updated Section 2.8.1.1 with additional information to reflect current regulations. 10. Added a reference within Section 2.8.1.3.C to Section 2.3.5 for instructions on the
certification and calibration of the Teledyne Model 701 Zero Air Generator. 11. Added a list of the major components of an SO2 monitoring system to Section 2.8.1.3.D. 12. Added Section 2.8.1.4.D with instruction on toggling Service mode on and off on the
analyzer. 13. Added instruction to Section 2.8.1.4.E for setting the monitor range on the analyzer. 14. Added instruction to Section 2.8.1.4.F for verifying the monitor lamp voltage on the
analyzer. 15. Added Sections 2.8.1.4.H (Concentration Units), 2.8.1.4.I (Averaging Time), and 2.8.1.4.J
(Calibration Factors). 16. Added Section 2.8.1.4.K - Diagnostic Checks and Settings, along with a table of the set
points required for the Thermo 43i/43i-TLE analyzer. 17. Added Section 2.8.1.4.L - Alarm Settings, along with a table of the alarm limits used for
the Thermo 43i/43i-TLE analyzer. 18. Added instructions to Section 2.8.1.4.M - Leak Check and Calibration. 19. Added detailed instructions on performing a multi-point calibration to Section 2.8.1.4.N. 20. Added Figure 2: Thermo Model 43i/43i-TLE Flowchart. 21. Added Figure 3: Thermo 146i Flowchart. 22. Clarified installation roles and responsibilities in Section 2.8.1.5. 23. Added Figure 4: Plumbing and Wiring Diagram for Monitoring Setup. 24. Updated Section 2.8.1.5.B with setting up automatic clock sync within the computer,
AV-Trend, and the data logger. Removed the instruction on setting the site computer and data logger times automatically.
25. Removed the requirement in Section 2.8.1.5.B for the site computer to be set 5 minutes behind the data logger, as this is no longer a necessary to collect backup data.
26. Added clarification to the Leak Check instructions in Section 2.8.1.5.C. 27. Added additional routine maintenance tasks to Section 2.8.1.6.A for the Thermo 43i/43i-
TLE Analyzer maintenance. 28. Updated Section 2.8.1.6.C with instructions for routine maintenance for the Teledyne
Model 701 Zero Air Generator. 29. Added clarity on the frequency and tasks of sample line checks and replacement in
Section 2.8.1.7. 30. Removed the requirement for 25% of the state’s monitors to be audited per quarter,
per the Revision to Appendix A from 40 CFR Part 58. 31. In Section 2.8.1.7, updated the frequency that the audit calibrator must be certified
against a primary standard from quarterly to every 9 months. 32. Updated the table in Section 2.8.1.7.D for audit concentrations. 33. Added Figure 5: Audit Plumbing Diagram. 34. Added Figure 6: Funnel and Probe Audit Setup Diagram. 35. Added requirement to Section 2.8.1.7.D to record the temperature from the probe and
the NIST thermometer onto the audit form. 36. Added Section 2.8.1.8 - Revision History.