Alloys of Pt and Rare Earths for the Oxygen Electroreduction ...
224
General rights Copyright and moral rights for the publications made accessible in the public portal are retained by the authors and/or other copyright owners and it is a condition of accessing publications that users recognise and abide by the legal requirements associated with these rights. • Users may download and print one copy of any publication from the public portal for the purpose of private study or research. • You may not further distribute the material or use it for any profit-making activity or commercial gain • You may freely distribute the URL identifying the publication in the public portal If you believe that this document breaches copyright please contact us providing details, and we will remove access to the work immediately and investigate your claim. Downloaded from orbit.dtu.dk on: Dec 20, 2017 Alloys of Pt and Rare Earths for the Oxygen Electroreduction Reaction Malacrida, Paolo; Horch, Sebastian; Chorkendorff, Ib Publication date: 2014 Document Version Peer reviewed version Link back to DTU Orbit Citation (APA): Malacrida, P., Horch, S., & Chorkendorff, I. (2014). Alloys of Pt and Rare Earths for the Oxygen Electroreduction Reaction. Department of Physics, Technical University of Denmark.
-
Upload
khangminh22 -
Category
Documents
-
view
4 -
download
0
Transcript of Alloys of Pt and Rare Earths for the Oxygen Electroreduction ...

General rights Copyright and moral rights for the publications made accessible in the public portal are retained by the authors and/or other copyright owners and it is a condition of accessing publications that users recognise and abide by the legal requirements associated with these rights.
• Users may download and print one copy of any publication from the public portal for the purpose of private study or research. • You may not further distribute the material or use it for any profit-making activity or commercial gain • You may freely distribute the URL identifying the publication in the public portal
If you believe that this document breaches copyright please contact us providing details, and we will remove access to the work immediately and investigate your claim.
Downloaded from orbit.dtu.dk on: Dec 20, 2017
Alloys of Pt and Rare Earths for the Oxygen Electroreduction Reaction
Malacrida, Paolo; Horch, Sebastian; Chorkendorff, Ib
Publication date:2014
Document VersionPeer reviewed version
Link back to DTU Orbit
Citation (APA):Malacrida, P., Horch, S., & Chorkendorff, I. (2014). Alloys of Pt and Rare Earths for the Oxygen ElectroreductionReaction. Department of Physics, Technical University of Denmark.

Alloys of Pt and Rare Earths for the Oxygen Electroreduc7on Reac7on
Center for Individual Nanopar7cle Func7onality Department of Physics
A Ph.D. thesis by
Paolo Malacrida


Alloys of Pt and Rare Earths for theOxygen Electroreduction Reaction
A Ph.D. thesis by
Paolo Malacrida
April 2014
Center for Individual Nanoparticle FunctionalityTechnical University of Denmark


Contents
Preface V
Abstract VII
Resume IX
List of included papers XI
List of abbreviations XV
List of symbols XVII
1 Introduction 1
1.1 Low temperature fuel cells . . . . . . . . . . . . . . . . . . . . . . . . . . 1
1.2 Oxygen reduction reaction . . . . . . . . . . . . . . . . . . . . . . . . . . 4
1.3 Pt alloys for oxygen reduction . . . . . . . . . . . . . . . . . . . . . . . . 7
1.4 Large surface area catalysts . . . . . . . . . . . . . . . . . . . . . . . . . . 11
1.5 Alloys of Pt and early transition metals . . . . . . . . . . . . . . . . . . . 13
1.6 Thesis outline . . . . . . . . . . . . . . . . . . . . . . . . . . . . . . . . . . 15
2 Experimental setups and methods 17
2.1 The Theta-Probe system . . . . . . . . . . . . . . . . . . . . . . . . . . . . 17
2.1.1 Pumping system and gas lines . . . . . . . . . . . . . . . . . . . . 19
2.1.2 Sample types and mounting . . . . . . . . . . . . . . . . . . . . . 19
2.1.3 X-ray gun and monochromator . . . . . . . . . . . . . . . . . . . 20

II CONTENTS
2.1.4 Ion gun . . . . . . . . . . . . . . . . . . . . . . . . . . . . . . . . . . 20
2.1.5 Hemispherical analyzer . . . . . . . . . . . . . . . . . . . . . . . . 20
2.2 X-ray photoelectron spectroscopy . . . . . . . . . . . . . . . . . . . . . . 21
2.2.1 Quantification of XPS . . . . . . . . . . . . . . . . . . . . . . . . . 22
2.2.2 Sensitivity factors and quantification approaches . . . . . . . . 24
2.2.3 Application to Pt alloys . . . . . . . . . . . . . . . . . . . . . . . . 26
2.2.4 Inelastic electron mean free path . . . . . . . . . . . . . . . . . . 27
2.2.5 Angle resolved XPS depth profiles . . . . . . . . . . . . . . . . . 28
2.3 Sputter-cleaning procedure . . . . . . . . . . . . . . . . . . . . . . . . . . 29
2.4 Ion scattering spectroscopy . . . . . . . . . . . . . . . . . . . . . . . . . . 29
2.5 Other setups and methods . . . . . . . . . . . . . . . . . . . . . . . . . . . 31
2.5.1 Electrochemical experiments . . . . . . . . . . . . . . . . . . . . 32
2.5.2 Deposition of Pt-Y nanoparticles . . . . . . . . . . . . . . . . . . 34
3 Pt-La and Pt-Ce alloys: the active chemical phase 37
3.1 Introduction . . . . . . . . . . . . . . . . . . . . . . . . . . . . . . . . . . . 37
3.1.1 Initial characterization and sample preparation . . . . . . . . . 39
3.2 Electrochemical characterization . . . . . . . . . . . . . . . . . . . . . . . 40
3.2.1 Stability test . . . . . . . . . . . . . . . . . . . . . . . . . . . . . . . 41
3.2.2 Electrochemically active surface area . . . . . . . . . . . . . . . 42
3.3 X-ray photoelectron spectroscopy . . . . . . . . . . . . . . . . . . . . . . 43
3.3.1 Angle-resolved experiments . . . . . . . . . . . . . . . . . . . . . 46
3.4 Ion scattering spectroscopy . . . . . . . . . . . . . . . . . . . . . . . . . . 48
3.5 The case of Pt3La . . . . . . . . . . . . . . . . . . . . . . . . . . . . . . . . 50
3.6 Discussion on the active chemical phase and surface stability . . . . . 53
4 Trends in activity and stability 57
4.1 Introduction . . . . . . . . . . . . . . . . . . . . . . . . . . . . . . . . . . . 57
4.2 Bulk structure and Pt-Pt distance . . . . . . . . . . . . . . . . . . . . . . 59
4.2.1 Alloys of Pt and alkaline earths . . . . . . . . . . . . . . . . . . . 61
4.3 Trends in activity . . . . . . . . . . . . . . . . . . . . . . . . . . . . . . . . 61
4.4 Trends in stability . . . . . . . . . . . . . . . . . . . . . . . . . . . . . . . . 65
4.5 Model for the Pt overlayer thickness . . . . . . . . . . . . . . . . . . . . 67
4.5.1 Single overlayer . . . . . . . . . . . . . . . . . . . . . . . . . . . . 67
4.5.2 Polycrystalline alloys . . . . . . . . . . . . . . . . . . . . . . . . . 69
4.5.3 Test on Pt5Gd . . . . . . . . . . . . . . . . . . . . . . . . . . . . . . 74

III
4.6 Thickness of the Pt overlayers . . . . . . . . . . . . . . . . . . . . . . . . 83
5 Pt-Y nanoparticles 87
5.1 Introduction . . . . . . . . . . . . . . . . . . . . . . . . . . . . . . . . . . . 87
5.1.1 Size distribution and morphology . . . . . . . . . . . . . . . . . 88
5.2 Electrochemical characterization . . . . . . . . . . . . . . . . . . . . . . . 89
5.3 Physical characterization . . . . . . . . . . . . . . . . . . . . . . . . . . . 91
5.3.1 X-ray photoelectron spectroscopy . . . . . . . . . . . . . . . . . . 91
5.3.2 Ion scattering spectroscopy . . . . . . . . . . . . . . . . . . . . . 94
5.3.3 Scanning transmission electron microscopy energy dispersiveX-ray spectroscopy . . . . . . . . . . . . . . . . . . . . . . . . . . . 95
5.3.4 Extended X-ray absorption fine structure . . . . . . . . . . . . . 96
5.4 Discussion on the activity enhancement . . . . . . . . . . . . . . . . . . 97
6 Towards in-situ XPS measurements 101
6.1 Introduction . . . . . . . . . . . . . . . . . . . . . . . . . . . . . . . . . . . 101
6.2 Setup and sample preparation . . . . . . . . . . . . . . . . . . . . . . . . 103
6.2.1 Ambient pressure XPS setup . . . . . . . . . . . . . . . . . . . . . 103
6.2.2 Fuel cell for ambient pressure XPS . . . . . . . . . . . . . . . . . 104
6.3 In-situ Y oxidation and dealloying . . . . . . . . . . . . . . . . . . . . . . 105
6.4 Acid leaching . . . . . . . . . . . . . . . . . . . . . . . . . . . . . . . . . . . 109
6.5 In-situ observation of oxygenated surface species . . . . . . . . . . . . . 110
6.6 Combined Thetaprobe and EC-cell . . . . . . . . . . . . . . . . . . . . . . 114
6.6.1 Design of the EC-XPS setup . . . . . . . . . . . . . . . . . . . . . 115
7 Conclusions and perspectives 119
A Components of La 3d and Ce 3d XPS spectra 123
Bibliography 141
Included papers 143

IV

Preface
This work was accomplished at the Center for Individual Nanoparticle Function-ality (CINF) under the Department of Physics of the Technical University of Den-mark (DTU). CINF is funded by the Danish National Research Foundation whichis greatly acknowledged for its support. This Ph.D. project was also funded by theDanish Ministry of Science through the UNIK initiative CAtalysis for SustainableEnergy (CASE). The experimental activities were carried out in the period betweenApril 2011 and April 2014 under the supervision of Professor Ib Chorkendorff andof Professor Søren Dahl and with Professor Sebastian Horch as co-supervisor. Iwould like to thank all of them for the excellent supervision and in particular IbChorkendorff for his ideas and the always motivating discussions. Special thanksare also directed to Assistant Professor Ifan E. L. Stephens for assisting me everydayas if he also was one of my supervisors.
Among my colleagues I am most grateful to Maria Escudero-Escribano whoperformed good part of the electrochemical measurements presented in this the-sis. I express her my sincere thanks for the fruitful collaboration and the inspiringconversations. Particular thanks also to all the other colleagues I have been collabo-rating with, especially Arnau Verdaguer-Casadevall, Patricia Hernandez-Fernandez,Ana Sofia Varela and Anders B. Laursen who also performed electrochemical mea-surements, Christian Schlaup, Lone Bech, Robert Jensen and Kenneth Nielsen whohelped me in the development of the EC-XPS setup, Tobias Johansson and ElisabethTherese Ulrikkeholm for their work on single crystals, Federico Masini and David N.McCarthy for the preparation of nanoparticles, Ulrik Grønbjerg and Vladimir Trip-kovic for the theoretical modeling and Hernan Sanchez-Casalongue with whom Iperformed the Ambient-Pressure X-ray Photoelectron Spectroscopy measurements(AP-XPS) of this thesis.
In general I thank all the staff of CINF and of all my friends at the Departmentof Physics. Their agreeable company, the pleasant conversations and our afternoon

VI
teas contributed to the creation of an informal enjoyable working environment.Finally I thank all my friends who supported me in this period of time and mostimportantly, my parents who have always been with me even though living faraway.
Kgs. Lyngby, 14th April 2014Paolo Malacrida

Abstract
This thesis presents the development and characterization of a new class of Ptalloys for catalyzing the Oxygen Reduction Reaction (ORR), in perspective of afuture substitution of traditional Pt-based catalysts at the cathode of Polymer Elec-trolyte Membrane Fuel Cells (PEMFCs). Focused on spectroscopic techniques suchas Angle-Resolved X-Ray Photoelectron Spectroscopy (AR-XPS), Ambient PressureX-Ray Photoelectron Spectroscopy (AP-XPS) and Ion Scattering Spectroscopy (ISS),it takes part in a broader context of studies pursuing the combination of these phys-ical techniques with electrocatalysis. A number of bimetallic alloys based on Pt anda rare earth, like the Pt-Y system or more recently proposed Pt-lanthanide phases,have been tested and characterized.
Polycrystalline Pt5La and Pt5Ce exhibited more than a factor of 3 enhancementin specific activity relative to state-of-the-art polycrystalline Pt. They maintain atleast 90% of this activity after accelerated stability tests (10 000 cycles between0.6 and 1.0 V vs. the Reversible Hydrogen Electrode (RHE) in 0.1 M HClO4 elec-trolyte). A combination of AR-XPS and ISS measurements allowed to elucidate theactive surface phase and structure of these materials, consisting of a ≈1 nm thickpure Pt overlayer on top of the bulk alloy, the stable overlayer providing kineticstability against further dissolution of the lanthanides. We hypothesize that thishigh stability is related to the very negative heat of formation of their intermetallicphases, that would prevent La and Ce diffusion to the surface. For this structureonly strain effects can explain the activity enhancement.
Other alloys of the same class (e.g. Pt5Gd and Pt5Tb) exhibit even higher spe-cific activities, up to 6 times the one of polycrystalline Pt in the case of Pt5Tb, arecord activity among polycrystalline alloys. On the basis of their similar crystalstructures, the ORR activity of this class of alloys is correlated to the lattice param-eter of the bulk, which is expected to define the Pt-Pt distance in the overlayer.The compression of this Pt-Pt distance in the overlayer originates a volcano-shape

VIII
trend in activity. However, the most active alloys experience higher activity lossesduring stability tests, suggesting that high levels of compression might not favourthe long-term stability of the Pt overlayers. This hypothesis is supported by DensityFunctional Theory (DFT) calculations and by AR-XPS. A model for the quantita-tive estimate of the Pt overlayer thickness from AR-XPS measurements indicates acorrelation between the thickening of the Pt overlayers and the activity losses, sup-porting the concept that more compressed overlayers have lower physical stability.
The application of these materials in a fuel cell requires the fabrication innanoparticulate form. Through the combination of a gas aggregation technique anda time-of-flight mass spectrometer size-selected Pt-Y nanoparticles are produced.With a mass activity of 3.05 A mg−1
Pt at 0.9 V vs. RHE, 9 nm Pt-Y nanoparticles areamong the most active ORR catalysts ever reported, although they lose 37 % of thisactivity after stability test. Similar to the case of polycrystals, after immersion inthe acidic electrolyte and testing the active phase consists of a Pt shell surroundingan alloyed core. Also in this case the compressed Pt-Pt distance explains the ORRactivity enhancement of these catalysts.
The deposition of these 9 nm Pt-Y nanoparticles on the cathode side of a Mem-brane Electrode Assembly (MEA), part of a specifically prepared fuel cell, allowsAP-XPS measurements under operation conditions. As a consequence of potentialcycling, Y oxidizes due to the dealloying process which is observed in-situ. The ad-sorbed species can be also probed and correlated to the electrochemical potential.Near the open circuit potential (OCP) conditions the oxygenated species consist, toa good extent, of non-hydrated OH, similar to the case of pure Pt nanoparticles.

Resume
Denne afhandling omhandler udvikling og karakterisering af en ny klasse af Pt-legeringer, der kan benyttes som katalysatorer for Oxygen Reduktion Reaktionen(ORR). Det langsigtede mål er at erstatte de traditionelle Pt-katalysatorer ved ka-toden i Polymer Elektrolyt Membran brændselsceller (PEMFCs). Med fokus på spek-troskopiske teknikker såsom vinkelopløst røntgen fotoelektronspektroskopi (AR-XPS), atmosfærisk tryk røntgen fotoelektronspektroskopi (AP-XPS) og ionspred-ningsspektroskopi (ISS), er denne afhandling en del af en større række af undersø-gelser udført med henblik på at kombinere fysiske teknikker med elektrokatalyse.
Polykrystallinske legeringer bestående af Pt og et lanthanidemetal (Pt5La ogPt5Ce) demonstrerede mere end en faktor 3 forøgelse i specifik aktivitet i forholdtil state-of-the-art polykrystallinsk Pt. De fastholder mindst 90% af denne aktivi-tet efter accelererede stabilitetsforsøg (10 000 cykler mellem 0,6 og 1,0 V ift. denReversible Hydrogen Elektrode (RHE) i 0,1 M HClO4 elektrolyt). En kombinationaf AR-XPS og ISS målinger muliggjorde at den aktive overflade fase og struktur afdisse materialer kunne bestemmes. Målingerne viser at de består af et ca. 1 nm tyktrent platinoverlag oven på legeringen. Det stabile platinoverlag leverer kinetisk sta-bilitet mod yderligere opløsning af lanthanider. Vi antager, at denne høje stabiliteter relateret til den meget negative dannelsesvarme for deres intermetalliske faser,der forhindre La og Ce i at diffunderer til overfladen. For denne struktur kan kunkomprimeringseffekter forklarer den forøgede aktivitet.
Andre legeringer af samme klasse (f.eks. Pt5Gd og Pt5Tb) udviser endnu høje-re specifikke aktiviteter. I tilfælde af Pt5Tb op til 6 gange den af polykrystallinsk Pt,en rekordhøj aktivitet blandt polykrystallinske legeringer. På basis af deres tilsva-rende krystalstrukturer er ORR aktiviteten af denne klasse af legeringer korrelerettil gitterparameteren af den bulk legering, som forventes at definere Pt-Pt afstan-den i Pt overlaget. Komprimeringen af Pt-Pt afstanden i overlaget giver anledningtil en ”vulkanformig” tendens i aktiviteten. Men de mest aktive legeringer oplever

X
størst aktivitetstab under stabilitetstest, hvilket tyder på at en høj grad af kompres-sion kompromitterer den langsigtede stabilitet af Pt overlagene. Denne hypoteseunderstøttes af tæthedsfunktionalteori (DFT) beregninger og AR-XPS. En model tilkvantitativ vurdering af tykkelsen af Pt overlaget fra AR-XPS målinger indikerer ensammenhæng mellem størrelsen af Pt overlagene og tab i aktivitet. Dette støtter hy-potesen om at mere komprimerede overlag har lavere fysisk stabilitet. Anvendelsenaf disse materialer i en brændselscelle kræver at de fremstilles som nanopartikler.
Gennem en kombination af en gas aggregeringsteknik og et ”time-of-flight”massespektrometer produceres størrelsesudvalgte Pt-Y nanopartikler. Med en mas-seaktivitet på 3,05 A per mg Pt ved 0,9 V ift. RHE, er 9 nm Pt-Y nanopartikler blandtde mest aktive ORR katalysatorer nogensinde målt. De mister dog 37% af denneaktivitet efter stabilitetstest. Efter nedsænkning i den sure elektrolyt og udførsel afelektrokemiske test består den aktive fase af en ren Pt-skal ovenpå en legeret kerne,svarende til strukturen af de polykrystallinske prøver. Også i dette tilfælde kan denforøgede ORR aktivitet forklares af den komprimerede Pt-Pt afstand.
Deponeringen af disse 9 nm Pt-Y nanopartikler på katodesiden af en MembranElektrode Assembly (MEA) , en del af en specialforberedt brændselscelle, muliggørAP-XPS målinger under driftsbetingelser. Som følge af spændingscykling, oxiderer Ypå grund af aflegeringsprocessen, der observeres in-situ. De adsorberede molekylerkan også probes og korreleres med det elektrokemiske potentiale. Tæt på det åbnekredsløb potentiale (OCP) består de iltholdige molekyler hovedsageligt af ikke-hydreret OH , svarende til tilfældet for rene Pt nanopartikler.

List of publications
Included publications
Paper 1:
Pt5Gd as a Highly Active and Stable Catalyst for Oxygen Electroreduction.María Escudero-Escribano, Arnau Verdaguer-Casadevall, Paolo Malacrida, UlrikGrønbjerg, Brian P. Knudsen, Anders K. Jepsen, Jan Rossmeisl, Ifan E. L. Stephens,and Ib Chorkendorff. Journal of the American Chemical Society, 134(40): 16476 –16479, October 2012.
Paper 2:
Pt Skin Versus Pt Skeleton Structures of Pt3Sc as Electrocatalysts for OxygenReduction.Tobias Peter Johansson, Elisabeth Therese Ulrikkeholm, Patricia Hernandez-Fernandez, Paolo Malacrida, Heine A. Hansen, Aliaksandr S. Bandarenka, Jens K.Nørskov, Jan Rossmeisl, Ifan E. L. Stephens, and Ib Chorkendorff. Topics in Cataly-sis, 57(1-4): 245 – 254, February 2014.
Paper 3:
Enhanced activity and stability of Pt–La and Pt–Ce alloys for oxygen electrore-duction: the elucidation of the active surface phase.Paolo Malacrida, María Escudero-Escribano, Arnau Verdaguer-Casadevall, Ifan E.L. Stephens, and Ib Chorkendorff. Journal of Materials Chemistry A, 2(12): 4234 -4243, February 2014.

XII
Paper 4:
Towards the elucidation of the high oxygen electroreduction activity of PtxY:surface science and electrochemical studies of Y/Pt(111).Tobias Peter Johansson, Elisabeth Therese Ulrikkeholm, Patricia Hernandez-Fernandez, María Escudero-Escribano, Paolo Malacrida, Ifan E. L. Stephens, andIb Chorkendorff. Physical Chemistry Chemical Physics, DOI: 10.1039/C4CP00319E,April 2014.
Paper 5:
Mass-selected nanoalloys as model catalysts: PtxY nanoparticles for oxygenelectroreduction.Patricia Hernandez-Fernandez, Federico Masini, David N. McCarthy, Christian E.Strebel, Daniel Friebel, Davide Deiana, Paolo Malacrida, Anders Nierhoff, AndersBodin, Anna M. Wise, Jane H. Nielsen, Thomas W. Hansen, Anders Nilsson, Ifan E.L. Stephens, Ib Chorkendorff. Submitted, manuscript included.
Paper 6:
Understanding the trends in activity and stability of Pt-based cathode electro-catalysts for low-temperature fuel cells.María Escudero-Escribano, Paolo Malacrida, Ulrik Grønbjerg, Vladimir Tripkovic,Jan Rossmeisl, Ifan E. L. Stephens, Ib Chorkendorff. in preparation, abstract in-cluded.
Other publications of this Ph.D. project
Paper 7:
Enabling direct H2O2 production through rational electrocatalyst design.Samira Siahrostami, Arnau Verdaguer-Casadevall, Mohammadreza Karamad, Da-vide Deiana, Paolo Malacrida, Björn Wickman, María Escudero-Escribano, Elisa A.Paoli, Rasmus Frydendal, Thomas W. Hansen, Ib Chorkendorff, Ifan E. L. Stephens,and Jan Rossmeisl. Nature Materials, 12: 1137 – 1143, November 2013.
Paper 8:
Trends in the Electrochemical Synthesis of H2O2: enhancing Activity and Se-lectivity by Electrocatalytic Site Engineering.

XIII
Arnau Verdaguer-Casadevall, Davide Deiana, Mohammadreza Karamad,Samira Siahrostami, Paolo Malacrida, Thomas W. Hansen, Jan Rossmeisl, Ib Chork-endorff, and Ifan E. L. Stephens. Nano Letters, 14(3): 1603 – 1608, February 2014.
Paper 9:
CO2 Electroreduction on Well-Defined Bimetallic Surfaces: Cu Overlayers onPt(111) and Pt(211).Ana Sofia Varela, Christian Schlaup, Zarko P. Jovanov, Paolo Malacrida, SebastianHorch, Ifan E. L. Stephens, and Ib Chorkendorff. Journal of Physical Chemistry C,117(40): 20500 – 20508, September 2013.
Paper 10:
MoS2—an integrated protective and active layer on n+p−Si for solar H2 evolu-tion.Anders B. Laursen, Thomas Pedersen, Paolo Malacrida, Brian Seger, Ole Hansen,Peter C. K. Vesborg, and Ib Chorkendorff. Physical Chemistry Chemical Physics, 15:20000 - 20004, October 2013.
Paper 11:
Highly dispersed supported ruthenium oxide as an aerobic catalyst for acetic
acid synthesis.
Anders B. Laursen, Yury Y. Gorbanev, Filippo Cavalca, Paolo Malacrida, Alan Kleiman-
Schwarsctein, Søren Kegnæs, Anders Riisager, Ib Chorkendorff, Søren Dahl. Applied
Catalysis A: General, 433 - 434, 243 – 250, August 2012.

XIV

List of abbreviations
AES Auger Electron Spectroscopy
AP-XPS Ambient-Pressure X-Ray Photoelectron Spectroscopy
AR-XPS Angle-Resolved X-Ray Photoelectron Spectroscopy
CV Cyclic Voltammetry
C-O-H Carbon-Oxygen-Hydrogen Contamination Layer
DFT Density Functional Theory
EC-STM Electrochemical Scanning Tunneling Microscopy
EC-XPS Electrochemical X-Ray Photoelectron Spectroscopy
ECSA Electrochemically Active Surface Area
EDS Energy Dispersive X-Ray Spectroscopy
EPU Elliptically Polarized Undulator
EXAFS Extended X-ray absorption fine structure
FCC Face Centered Cubic
FEAL Fast Entry Air Lock
FWHM Full Width at Half Maximum
FTIR Fourier Transform Infrared Spectroscopy
HAADF High Angle Annular Dark Field
ICP-MS Inductively Coupled Plasma Mass Spectroscopy
ISS Ion Scattering Spectroscopy
LEED Low Energy Electron Diffraction
LEIS Low Energy Ion Spectroscopy
Ln Generic Lanthanide metal

XVI
M Generic metal
MEA Memabrane Electrode Assembly
OCP Open Circuit Potential
ORR Oxygen Reduction Reaction
PEMFC Polymer Electrolyte Membrane Fuel Cell
QCM Quartz Crystal Microbalacane
RDE Rotating Disk Electrode
RHE Reversible Hydrogen Electrode
RRDE Rotating Ring Disk Electrode
SHE Standard Hydrogen Electrode
SIMS Secondary Ion Mass Spectroscopy
SEM Scanning Electron Microscopy
SLA Straight Line Approximation
SSRL Stanford Synchrotron Radiation Lightsource
STEM Scanning Transmission Electron Microscopy
STM Scanning Tunneling Microscopy
SXS Surface X-Ray Scattering
TEM Transmission Electron Microscopy
TPD Temperature Programmed Desorption
TPP-2M Tanuma-Powell-Penn Formula
TSP Titanium Sublimation Pump
UHV Ultra High Vacuum
UPD Underpotential deposition
UPS Ultraviolet Photoelectron Spectroscopy
XAS X-Ray Absorption Spectroscopy
XPS X-Ray Photoelectron Spectroscopy
XRD X-Ray Diffraction

List of symbols
U Electrochemical potential
U0 Equilibrium potential
Ek Photoelectron kinetic energy
Eb Electron binding energy
h Planck’s constant
ν Photon’s frequency
φs Material work function
φa Analyzer work function
λ Inelastic electron mean free path
λe f f Effective inelastic electron mean free path
θ XPS photoemission angle calculated from the surface normal
x , y Coordinates parallel to the sample surface
z Coordinate normal to the sample surface
T Detection efficiency (transmission function) of photoelectrons
Φ XPS Photon flux
IA XPS intensity from a photoelectron transition of element A
EA Kinetic energy from a photoelectron transition of element A
σA Cross section for a photoelectron transition of element A
NA Atomic concentration of element A
NA (%) Relative atomic concentration in percent of element A
SA XPS sensitivity factor for a photoelectron transition of element A

XVIII
IA Normalized XPS intensity from a transition of element A
N0A Atomic concentration of element A in a reference material
λ0 Inelastic electron mean free path in a reference material
T 0 Analyzer transmission function of Wagner’s sensitivity factors
dsput. Thickness of the sputtered region
Ii Sputtering ion current
Y Sputter yield
M Molar mass
e Electron charge
A Sputtered surface area
ρ Mass density
Na Avogadro’s number
ts Total sputtering time
Mi ISS ion mass
Ms ISS mass of the probed atom
~v0 ISS initial velocity of the ion
~v1 ISS final velocity of the ion
~vs ISS final velocity of the probed atom
ϕ ISS scattering angle
jk Kinetic current density
j Total measured current density
jd Diffusion limited current density
λA Inelastic electron mean free path through element A
I∞A XPS intensity from an infinitely thick layer of element A
d Thickness of the Pt overlayer
t Thickness of the contamination (C-O-H) layer
NP t,allo y Atomic concentration of Pt in the PtnMm alloy
NM ,allo y Atomic concentration of M in the PtnMm alloy
I∞P t,allo y Pt XPS intensity from an infinitely thick PtnMm alloy
I∞M ,allo y M XPS intensity from an infinitely thick PtnMm alloy

Alloys of Pt and Rare Earths
for the Oxygen Electroreduction Reaction


CHAPTER 1
Introduction
1.1 Low temperature fuel cells
Proton Exchange Membrane Fuel Cells (PEMFCs) represent one of the most promis-ing alternatives to traditional power sources. The requirements of new technolo-gies for storing energy into fuels, for instance through electrolysis of water, alsoinvolve the development of efficient ways for the re-conversion of fuels into elec-trical energy. In a PEMFC hydrogen is used as a fuel and combined with oxygen toproduce water and electricity. Comprehensive reviews about fuel cells can be foundin [1, 2]. Since the conversion of chemical energy to electrical energy can be per-formed in a clean and potentially very efficient way, PEMFCs might represent oneof the fundamental progresses towards a future sustainable society [3, 4]. Theywould play a particularly important role for transportation applications, where theneed of high energy density has so far limited the use of batteries. At the same timeother kinds of fuel cells requiring high temperatures (e.g. Solid Oxide Fuel Cells)would not be practical due to their long start-up times.
Figure 1.1 shows a schematic drawing of a PEMFC. H2 is introduced from theanode side where it is converted to protons and electrons through the HydrogenOxidation Reaction (HOR). The central part of the fuel cell consists of a protonconductive membrane, typically made of nafion; it allows the transfer of protonsto the cathode side, but not the transfer of electrons which are collected into anexternal circuit producing electricity. Once the protons reach the cathode side theyreact with oxygen and electrons to produce water in the so called Oxygen Reduction

2 Introduction
Figure 1.1: Schematic drawing of a PEMFC. Orange spheres represent hydrogen atoms(or protons), yellow spheres represent oxygen atoms and small black spheres represent elec-trons.
Reaction (ORR). The overall reaction is:
2H2 +O2 −→ 2H2O. (1.1)
Although PEMFCs have been known and intensively studied for about fifty years,their high production costs and their relatively low performances have so far in-hibited their widespread commercialization. The reason for this can be primarilyascribed to the requirement of proper materials to catalyze both the HOR at theanode and the ORR at the cathode. In the current state-of-the-art PEMFCs boththese catalysts are based on Pt, which strongly raises the costs of fabrication. Atthe same time it introduces problems related to the scarce availability of this ma-terial [5], indeed the current loadings are not really suited for a global utilization[3, 6]. To give an idea Stephens et al. estimated that a 100 kW vehicle would cur-rently require about 50 g of Pt state-of-the-art catalysts: to be economically viableand scalable this quantity should probably be reduced to a level similar to that usedin catalytic converters for internal combustion engines: ≈ 3.4 g per vehicle as anaverage [6].
With this objective modern research has primarily focused on the improvementof ORR catalysts at the cathode. A direct explanation for this can be easily visual-ized in Figure 1.2, where the overall efficiency of a PEMFC is shown. Although the

1.1 Low temperature fuel cells 3
Figure 1.2: Potential (U) vs. current density ( j) relationship of a state-of-the-art PEMFCwith a typical ORR catalyst consisting of carbon supported Pt nanoparticles (red line). Thereversible potential U0 is shown for comparison (green dotted line). The kinetics of the ORRis responsible for most of the potential losses (blue line). Figure adapted from [3].
reversible thermodynamic cell potential for the reaction of equation 1.1 is 1.169 Vat 80 C (a typical operation temperature for PEMFCs), major losses occur. At atypical current density of 0.7 A cm−2 45% of this chemical energy is lost as heat.According to Gasteiger et al. about 75 % of this efficiency loss can be assignedto the slow kinetics of the ORR at the cathode [3]. The rest is accounted by thelosses due to the kinetics of the HOR, to the omhic resistance and to mass transportlimitations.
Even the best state-of-the-art catalysts, all based on precious metals such asPt or Pd, are still far from optimal and they exhibit considerable overpotentials forthe ORR, which ultimately raises the loading of precious metals in PEMFCs [6, 7].This means that the catalytic ORR mass activity, defined as the current densityat a given potential per mass of precious metal, must be improved. This projectenters in a broad research for the development of new Pt-based catalysts for theORR whose main achievements will be introduced in the following sections of thischapter. An alternative approach focuses on non-precious metals cathode catalysts.The challenge here is to find materials that can be stable at the highly oxidizingacidic conditions (pH ≈ 0) of the cathode. Among the metals, only Ir, Pt and Auare thermodynamically stable at potentials higher than 0.9 V vs. the ReversibleHydrogen Electrode (RHE) [8] and even Pt corrodes at potentials close to 1 V vs.

4 Introduction
RHE [9–11]. Although a number of important advances have been made, particu-larly promising those on pyrolyzed transition metal nitrogen-containing complexessupported on carbon materials (e.g. Fe– and Co–N/C), these catalysts still sufferinsufficient activity and/or low stability in acidic conditions [12, 13].
1.2 Oxygen reduction reaction
Before introducing the most promising state-of-the-art Pt-based catalysts for theORR, it is worth describing this reaction in more detail. As already anticipated theoverall oxygen reduction reaction is:
O2 + 4H+ + 4e− −→ 2H2O, (1.2)
with the total transfer of four electrons and four protons. According to the Sabatierprinciple [14], finding the catalyst with the highest activity for this reaction willcorrespond to identify a catalyst with the right compromise of reactivity [15];meaning that the optimal catalyst should be sufficiently reactive to activate theO2 gas molecule and at the same time sufficiently noble to release oxygen and thereaction products in the form of H2O [16, 17]. In this view the trends in activityof pure metal surfaces can be well explained [18]. Pt is the pure metallic elementwith the highest ORR activity. More reactive metals as for instance Pd, Cu or Ir bindoxygen or some of the reaction intermediates too strongly while more noble metalsas Ag or Au bind oxygen too weakly. This results in a typical volcano plot illustratedin Figure 1.3 where the experimental activities of different metal surfaces is plottedvs. the theoretical O adsorption energy.
The reasons why the O adsorption energy is such a good descriptor of thecatalytic activity can be to a good extent clarified once the reaction mechanism isstudied in more detail. Although this has been the focus of numerous studies forseveral decades and it is still quite controversial [19–21]: also due to the difficultiesof performing experiments allowing a direct and possibly in-situ observation of thereaction intermediates [22–24]. A theoretical treatment of the ORR mechanism isalso highly complex, in particular the modeling of the electrochemical environe-ment, including the effects of the solvent on the adsorbed species, the electric fieldin the double layer region and the free energies of electrons in the solid and ofthe reactants, as a function of the electrochemical potential [25–28]. The generaltrends can be addressed through a somewhat easier approach, by referring to het-erogeneous catalysis. Density Functional Theory (DFT) calculations can provideaccurate values of the chemical potentials and adsorption energies of the reactionintermediates at the gas-solid interface [19, 29, 30]. By calculating the adsorptionenergies of all the possible intermediates (i.e. HOO∗, HO∗ and O∗), the overall freeenergy pathway of the ORR can be derived as a function of potential.
In the rest of this section the following reaction mechanism will be considered:

1.2 Oxygen reduction reaction 5
Figure 1.3: Volcano-shape trend of the ORR experimental activity plotted as a function ofthe calculated oxygen binding energy ∆EO. Figure adapted from [19].
O2
g
+H+ + e− + ∗ −→ HOO∗ (1.3a)
HOO∗ +H+ + e− + ∗ −→ O∗ +H2O (l) (1.3b)
O∗ +H+ + e− + ∗ −→ HO∗ (1.3c)
HO∗ +H+ + e− + ∗ −→ ∗+H2O (l) , (1.3d)
where ∗ indicates the active site on a catalytic surface and the adsorbed intermedi-ates in the case of HOO∗, HO∗ and O∗, all bound through an oxygen atom. The firststep is particularly controversial as the dissociative mechanism, involving the directdissociation of the oxygen molecule (O2
g
−→ 2O∗), could also occur [19, 31].However, in the relevant range of potentials this was shown to play a minor role onPt surfaces, which are the main interest of this work [18, 32].
The presence of three different intermediates explains the higher level of com-plexity with respect for instance to the HOR (with the single intermediate H∗) andtherefore the difficulties of finding good catalysts. Indeed an efficient ORR cata-lyst should bind each of these intermediates optimally, neither too strongly nor tooweakly [17]. Figure 1.4 illustrates the calculated free energy pathway on a Pt(111)surface at a potential of 0.9 V vs. RHE. The four reaction steps of equations 1.3a-1.3d can be distinguished. Two of them, namely the formation of OOH∗ (equation1.3a) and the protonation of HO∗ with desorption of a H2O molecule (equation1.3d) are uphill in free energy; these are the possible candidates for the potentialdetermining step.

6 Introduction
- 0 . 2 5
0 . 0 0
0 . 2 5
0 . 5 0
0 . 7 5
1 . 0 0
1 . 2 5
1 . 5 0
2H2O
(l)
O* +
H 2O(l)
+ 2H+ +
2e-
OH* +
H 2O(l)
+ H+ +
e-
OOH*
+ 3H+ +
3e-
O 2(g) +
4H+ +
4e-
∆ G 1
∆G / e
V
R e a c t i o n c o o r d i n a t e
∆ G 1
Figure 1.4: Free energy diagram corresponding to the ORR steps of equations 1.3a-1.3don a Pt(111) surface at an applied potential of 0.9 V vs. RHE. Figure adapted from [17].
The ORR activity can be related to this kind of free energy diagrams under twomain assumptions. The maximum activity per active site at very high overpotentialsis assumed to be the same for all kinds of site and materials and the actual activityis only dependent on the free energy difference of the potential determining step.This last assumption implicates that this will also coincide with the rate determiningstep: its validity was confirmed by more detailed theoretical models for the ORRincluding the effects of reaction barriers [32, 33].
Figure 1.4 also shows that the Pt(111) surface is still far from the optimal cat-alytic surface for the ORR. A better catalyst would bind HOO∗ more strongly andOH∗ more weakly so that all the free energy steps would be downhill. In partic-ular an ideal catalyst would exhibit a flat free energy diagram at the equilibriumpotential: 1.23 V at standard conditions. This would result in considerable ORRcurrents at slightly more negative potentials and negligible kinetic losses wouldoccur. Unfortunately, it turns out that it is in general not possible to tune the bind-ing energy of the three ORR intermediates independently of each other [34]. It isquite intuitive, for instance, that a surface binding strongly to HO∗ will also bindstrongly to HOO∗, due to the similarity of these species and to the fact that theyboth bind through an O atom. DFT calculations suggest that the binding energiesof the ORR intermediates all scale linearly with each other [19, 34]. Therefore,each of these binding energies can be employed as a single descriptor of the ORRactivity, explaining the volcano relationship of Figure 1.3 where the binding energy

1.3 Pt alloys for oxygen reduction 7
of O was used. In this view, the only possible way of enhancing the activity of aPt(111) surface is to find a catalyst for which, the two uphill steps in Figure 1.4,are equal: this would correspond to a surface binding HO∗ about 0.1 eV weakerthan Pt(111).
1.3 Pt alloys for oxygen reduction
In the previous section it was theorized that on a metal surface the optimal ORRcatalyst would bind the ORR intermediates slightly weaker than pure Pt. The tra-ditional approach for tuning the binding energy of Pt and enhance its activity in-volves the alloying of Pt with other metals. In the last couple of decades, extendedbimetallic surfaces of Pt and late transition metals such as Fe, Co, Ni and Cu havebeen studied extensively [35–41]. Various of these surfaces exhibited an increasedORR activity with respect to pure Pt. It should be noted that in all these cases theless noble solute metal is not thermodynamically stable under the acidic conditionsof a PEMFC at the typical cathode potentials [8]. Therefore these metals tend todissolve into the electrolyte via a process known as dealloying [41–43]. The result-ing surface of these catalysts is Pt enriched and it typically consists of a Pt overlayerprotecting the bulk alloy from the dissolution of the solute metal. A precise char-acterization of these structures is challenging as the level of Pt enrichment and thethickness of the Pt overlayers varies for different alloys, preparation techniques andelectrochemical treatments.
Figure 1.5: Schematic representation of a Pt-skin (a) and of a Pt-skeleton (b) surfacestructure.
In general two kinds of surface structures can be distinguished: denoted byStamenkovic et al. as Pt-skeleton and Pt-skin structures [37, 44]: their schematicrepresentation is illustrated in Figure 1.5. In the first case their polycrystalline al-loys are prepared in vacuum by sputter-cleaning and later immersed into an acidic

8 Introduction
electrolyte. The skeleton structure is the result of the dissolution of the soluteatoms; these leached surfaces typically exhibit a 1-2 nm thick Pt overlayers contain-ing negligible amounts of other metals [6, 35, 37]. Although in principle these Ptoverlayers could exhibit some level of roughness and be to some extent disordered,there is in-situ experimental evidence of the formation of ordered (111) facets un-der electrolyte exposure [45]. In the second case the sputter-cleaned alloys areannealed in vacuum inducing Pt segregation, the reason for this being the lowersurface energy of Pt with respect to the solute metals. This Pt-skin structures arehighly ordered and typically composed of a single Pt monolayer on top of the bulkalloy. According to some reports the concentration profile would exhibit a oscilla-tory behaviour in the surface layers, with a certain enrichment of the solute metalin the second layer [37, 46]. Some of these Pt-skin alloys have shown the highestactivities ever reported on extended surfaces. In particular, the annealed surface ofPt3Ni(111) holds the record in activity [39]. Figure 1.6 shows the measured ORRactivities of various alloys of Pt and late transition metals with a Pt-skin structure,including Pt3Ni(111): they are plotted as a function of the oxygen binding energyand compared to the theoretical volcano trend.
Figure 1.6: Experimental ORR activity (expressed as kinetic current density) of variousPt alloys exhibiting a Pt-skin structure, as a function of the calculated oxygen binding en-ergy ∆EO. All data are shown relative to Pt. Experimental point refer to: Pt monolayers onsingle crystal metal substrates (circles) [47], Ultra High Vacuum (UHV) annealed polycrys-talline alloys (diamonds) [38] and Pt3Ni(111) single crystal alloy (cross) [39]. Dashed linesrepresent the theoretical predictions from [17, 19]. Figure adapted from [16].
It should be noted that all these kind of surfaces are thermodynamically un-stable. The Pt overlayer provides kinetic stability against rapid dissolution of the

1.3 Pt alloys for oxygen reduction 9
solute metal from the bulk. However, the process of dealloying will ultimatelydefine the lifetime of these surfaces and it is considered as the main reason oflong-term deactivation. Since stability, together with ORR activity, is one of themain requirements for cathode catalysts of PEMFCs, this translates in the need ofsurfaces that will be sufficiently stable over the particular time and conditions ofpractical use of a certain application. The annealing treatments originating thesePt-skin structures stabilize the surface layers allowing to obtain stable CVs and acomplete electrochemical characterization in acidic conditions over these surfaces.This is the case of Pt3Ni(111) whose structure was probed in-situ by Surface X-RayScattering (SXS) demonstrating its complete stability in the potential range of 0.05-1.00 V vs. RHE in 0.1 M HClO4 electrolyte [39]. However also these surfaces willultimately evolve towards structures that resemble a Pt-skeleton. As an example,Todoroki et al. recently studied the stability of Pt-enriched (Pt-skin) Ni/Pt(111)catalysts [48]. Although their initial ORR activity was 8 times higher than that ofpure Pt(111), after only 1000 potential cycles between 0.6 and 1.0 V vs. RHE, 75%of this activity was lost as a consequence of Ni dissolution. It should be also an-ticipated that the stabilization of these Pt-skin structures on the large surface areacatalysts required for the application in PEMFCs, either in the nanoparticulate or inthe nanostructured thin film form, will be challenging. Some of the most promisingresults in this perspective will be presented in the next section.
Various studies on alloys of Pt and late transition metals have aimed at eluci-dating the mechanisms of activity enhancement with respect to Pt. The presenceof two different metals could tempt into explaining the high activity in terms ofbifunctional effects [49–51]. Indeed, if the solute metal was effectively present onthe surface different catalytic sites could catalyze different steps of the ORR, forinstance with the less noble metal facilitating the O2 dissociation or the removal ofOH radicals from the more noble Pt sites. In this view the scaling relations amongthe ORR intermediates could be bypassed, potentially providing very high activities.However, as explained above, the thermodynamic instability of the solute metal inthe typical range of pH and potentials of a PEMFC does not allow their stabiliza-tion on the surface of the alloy which is in all cases constituted by Pt overlayers.Therefore, the observed activity enhancement must be related to a modification ofthe electronic structure of these Pt overlayers, which finally results in a weaken-ing of its binding to the ORR intermediates (HOO∗, HO∗ and O∗): this is typicallyachieved through either ligand or strain effects. Ligand effects are caused by thedirect electronic interactions of the surface Pt atoms with a different solute metal.They are usually obtained by subsurface alloying as this kind of interactions exhibita very short spatial range and they would vanish if the solute atoms are not presentin the second atomic layer [52]. Strain effects occur when the Pt overlayer is eithercompressed or expanded laterally: a lateral compression in particular would resultin downshift of the d-band center of Pt and a weaker binding to the ORR intermedi-ates [53–55]. This compression is typically achieved by imposing the Pt overlayerover a substrate with different lattice parameter. Figure 1.7 shows a schematic rep-

10 Introduction
resentation of two alloyed surface structures subjected to pure ligand effects andpure strain effects.
Figure 1.7: Schematic representation of a Cu/Pt(111) near surface alloy [56]where ligandeffects prevail (a) and of a three layers thick Pt overlayer deposited on a Cu(111) (b) [31]:in this case the smaller lattice parameter of the Cu atoms induce lateral compressive strainon the Pt overlayer. Grey and orange spheres represent Pt and Cu atoms respectively.
On a real surface the two effects often coexist and it is difficult to separatethem. For instance, the enhanced activity of Pt3Co and Pt3Ni could be explainedby strain effects as these alloys present the same closed packed bulk structure ofPt, but with a compressed lattice parameter, induced by the smaller covalent radiusof Co and Ni [57]. However, the higher ORR activity reported on their annealedPt-skin structures with high solute metal concentrations in the second atomic layer[37], and in particular the extremely high activity of Pt3Ni(111) [39] suggest thatligand effects also play an important role. Two recent studies on Pt-Cu alloys havebeen able to separate ligand and strain effects. In the study of our group, a Pt(111)surface was modified by subsurface alloying: a so called near surface alloy, with asimilar structure as in Figure 1.7 a, was prepared through a combination of Cu un-derpotential deposition and annealing [56]. Since the bulk of the alloy still consistsof pure Pt and Cu is only present in the second atomic layer strain effects should benegligible. Increasing amounts of Cu in the second layer originated a shift towardslower OH∗ binding energies, mainly ascribed to ligand effects: the ORR activitywas found to vary accordingly and a volcano relationship in good agreement withthe one in Figure 1.6 appeared. In the work of Strasser et al. Pt-Cu nanoparticlesas well as Pt overlayers on a Cu(111) single crystal were studied [31]. Since thenanoparticles exhibited a rather thick (≈ 1 nm) Pt overlayer, for which ligand ef-fects should already be vanished at the surface, their high activity was associatedto pure strain effects. In order to elucidate these effects they deposited controlledamounts of Pt on a Cu(111) substrate, whose lattice parameter induces compres-

1.4 Large surface area catalysts 11
sive strain on the surface Pt. Despite some strain relaxation effects, after depositionof 5 Pt monolayers a certain level of compressive strain was still observed at thesurface; this was correlated to the experimentally observed downshift of the d-band center and, in agreement with the d-band theory [53–55], to a weaker OH∗
binding, explaining the enhanced activity of the Pt-Cu nanoparticles.
1.4 Large surface area catalysts
The vast majority of the ORR catalysts described so far consisted of extended sur-faces, typically single crystals or polycrystalline alloys. These kind of samples couldnever be employed in a fuel cell where the need of high power densities and suffi-ciently low costs imposes the use of high surface area catalysts. These are typicallyPt, or Pt based, nanoparticles supported on a large surface area carbon support(Pt/C), although an alternative could be represented by thin films of a catalyticmaterial (typically Pt or Pt alloys) deposited on nanostructured substrates [58–62]. In all these cases the relevant quantity for the design of a better catalyst is themass activity, that is the amount of ORR current at a given potential per amount ofprecious metal. Higher mass activities can be achieved either by raising the level ofcatalyst dispersion (i.e. number of active sites per mass of catalyst) or by raising thethe intrinsic activity per active site (specific activity). Unfortunately, in most casesthese two quantities cannot be tuned indipendently. In the case of pure Pt nanopar-ticles, for instance, a higher dispersion can be reached by decreasing the particlesize. However, while the catalyst dispersion increases for smaller sizes, so does thenumber of under-coordinated active sites on the surface of the nanoparticles. Onthese sites (e.g. steps, edges and kinks) the ORR intermediates (for instance HO∗)bind more strongly, causing higher overpotentials and lower specific activities. Thecombination of these two opposite trends generates a maximum of mass activity ata particle size of about 3 nm [3, 63, 64], which is not optimal in terms of catalyststability [9, 65].
Given this optimal particle size, the only possible way of further enhancingthe performance of ORR catalysts is to tune their specific activity. Although theremight be some way of raising these specific activities without involving differentmaterials, for instance by engineering the morphology of the particles [66–69]or by tuning the intra-particle distance at high coverages as recently proposed byNesselberger et al. [70], the traditional approach consists of alloying Pt with othertransition metals.
The promising results of their correspondent extended surfaces motivated theinterest towards testing carbon supported nanoparticles based on alloys of Pt andlate transition metals such as Fe, Co, Ni and Cu. Some of these systems havebeen studied for at least two decades [3, 43, 71–74] typically exhibiting 2-3 timeshigher specific activities than that of Pt/C state-of-the-art catalysts [75]. However,the same tendency towards dealloying of the solute metal observed on extended

12 Introduction
surfaces is also observed on these nanoparticles, generally limiting their stabilityin acidic conditions [10, 76, 77]. The same process leading to the formation of aPt-skeleton typically produced an acid-leached core-shell structure consisting of Ptenriched shell and an alloyed core [31, 43]. It should be noted that in comparisonwith extended surfaces, the issue of stability for supported nanoparticles is muchmore complex and even Pt/C catalysts typically degrade considerably over time [6,9, 78]. However, in the case of Pt bimetallic nanoparticles the dealloying process isconsidered as the main reason of degradation [10, 76].
Since the presence of dissolved metal cations can easily affect the activity ofthese catalysts, particularly in PEMFCs due to poisoning of the membrane[77], theparticles are often pre-leached in a liquid electrolyte [3]. Complex procedures com-bining acid leaching and annealing have been optimized in order to stabilize thePt overlayers on top of these particles and ensure more ordered structures [79–82]. The idea is to reproduce the superior properties of Pt-skin extended surfaces;this strategy lead to improvements both in terms of stability and activity, in somecases approaching 4-fold activity enhancements relative to state-of-the-art Pt/C cat-alysts [82]. An alternative approach for the formation of ordered Pt-skin structuresconsisted of exposing the surface to controlled atmospheres, for instance by elec-trochemical cycling in a CO-saturated electrolyte [83].
Another interesting approach was proposed by Adzic and co-workers; theyformed Pt overlayers onto a core containing significant amounts of another noblemetal such as Ir, Au or Pd [84, 85]. These materials are also very expensive andscarce, with no relevant long term advantage in terms of cost with respect to Pt[5]. The obtained mass activities once normalized for the total amount of preciousmetals are also lower than for other alloys. However the nanoparticles preparedwith this method exhibited highly enhanced stability. As a very recent example theyreported only 8 % of loss in mass activity after 100 000 potential cycles between0.6 and 1.0 V vs. RHE in a PEMFC [86].
Probably the most promising perspective is the one inspired by studies onsingle-crystalline samples: by controlling the nanoparticle shape and morphology itis possible to model their surface and to selectively expose particular crystal facets[87–90]. Various attempts have been performed in order to synthesize octahe-dral alloy nanoparticles dominated by (111) facets, especially with the aim of re-producing the record specific activity of Pt3Ni(111). The highest mass activitiesever reported have been achieved with this method [91, 92], although the sta-bility of these octahedra still appear to be a critical issue. However, Stamenkovicand co-workers have just reported a record breaking activity on so called Pt3Ninanoframes. The fabrication starts from PtNi3 polyhedra: these are transformedthrough a process of internal erosion that preserves the edges of the nanoparticlesforming a peculiar shape with three-dimensional molecular accessibility [93]. Themass activity of these nanoframes showed an extraordinary factor of 10 enhance-ment with respect to state-of-the-art Pt/C. Their stability test consisting of 10 000potential cycles between 0.6 and 1.0 V vs. RHE indicated that these structures are

1.5 Alloys of Pt and early transition metals 13
also highly stable.
1.5 Alloys of Pt and early transition metals
In the previous sections it was shown how alloys of Pt and late transition metalswith their promising ORR activities, solve some of the problems involved in thedevelopment of efficient PEMFCs. However, the stabilization of the Pt overlayersagainst dealloying that would ensure the necessary long-term stability of the cath-ode is still a big challenge. These observations motivated our group to carry outa theoretical DFT screening study in search of new Pt alloys for the ORR [16]. Inorder to account for both ORR activity and stability, the candidate alloys, all in theform of Pt3M or Pd3M (with M indicating a generic transition metal), had to fulfilltwo requirements. First, they had to form Pt (or Pd) overlayers (Pt-skin structure)with binding energy to OH∗ about 0.1 eV weaker than the one of pure Pt. Secondly,the heat of alloy formation, defined as the amount of energy gained during the bulkalloy formation by its constituents, had to be as negative as possible. This quantitywas taken as a measure of the alloy stability.
As a result of the DFT screening two promising candidates were chosen: Pt3Yand Pt3Sc. This new class of catalysts, constituted by Pt and an early transitionmetal, is characterized by extremely negative heats of alloying formation; this isa consequence of the filling degree of their d-bands: only one electron for Sc andY and nine electrons in the case of Pt. In the so formed alloys the d-band is halffilled, meaning that all the bonding states are full, and anti-bonding states areempty [94, 95]. Similar to the well studied Pt-skin structures of Pt3Co and Pt3Ni,the OH∗ binding energy of Pt3Y and Pt3Sc is rather close to the theoretical optimalvalue. Interestingly, the heat of alloy formation of Pt3Co and Pt3Ni, as for mostof the alloys of Pt and late transition metals, is basically negligible. This couldexplain their tendency towards dealloying. Although all these alloys, includingPt3Y and Pt3Sc, are thermodynamically unstable, the more negative heats of alloyformation are expected to raise higher kinetic barriers against the diffusion of thesolute metals to the surface, ultimately improving the surface stability.
The electrochemical testing of sputter-cleaned polycrystalline Pt3Y and Pt3Sclead in both cases to enhanced activities with respect to Pt [16]. In particular, theORR activity of Pt3Y measured in O2-saturated 0.1 M HClO4 electrolyte at 0.9 Vvs. RHE was about 5 times higher than for polycrystalline Pt. At that time, thispromoted Pt3Y as the most active polycrystalline surface ever tested, although con-sisting of a Pt-skeleton. More recently, Kim and co-workers have also tested Pt-Ycatalysts in the form of sputter-deposited thin films [96, 97]. Their results showeven higher specific activities. Interestingly, they also performed accelerated stabil-ity tests consisting of 3 000 cycles between 0.6 and 1.1 V vs. RHE.: no significantactivity losses were measured. This was a first indication of the stability of Pt-Yalloys in electrochemical environment, further motivating the interest towards the

14 Introduction
investigation of these new class of catalysts. However, we anticipate that a propertest of stability should be conducted on nanoparticles and in a fuel cell if possible.Furthermore there is so far no direct comparison between the stability of Pt alloysbased on early transition metals and late transition metals. A proper test shouldbe strictly performed under the same conditions and with similar preparation tech-niques.
Figure 1.8: Experimental ORR activity (expressed as kinetic current density at 0.9 V vs.RHE normalized per geometric surface area) of various polycrystalline alloys of Pt and earlytransition metals. ORR polarization curves were acquired at 20 mV s−1, while they wereacquired at 50 mV s−1 for the other activities reported in the following chapters of thisthesis. Figure adapted from [6].
On the basis of the encouraging results on Pt3Y and Pt3Sc surfaces, other poly-crystalline alloys of Pt and early transition metals have been tested with the samemethodology [6, 98]. Figure 1.8 summarizes the ORR activities of all the alloysof Pt and early transition metals tested in our group prior to the work of this the-sis: following the rank of activities, Pt3Y, Pt5Y, Pt5La, Pt3Sc, Pt3Hf, Pt3Zr, Pt2Y, PtY.Among these, the Pt-Y phases with very high Y content (Pt2Y, PtY) were found tocorrode in acid; Pt3Hf, Pt3Zr exhibited the formation of Hf oxide and Zr oxide onthe surface of Pt, explaining the low activity enhancement compared to Pt. Pt3Scalso showed a rather small increase. On the other hand, both Pt5Y and Pt5La wereat least 3 times more active than polycrystalline Pt and considerably more activethan alloys such as Pt3Co and Pt3Ni prepared in similar conditions [37]. Pt5La inparticular was the first alloy of Pt and a lanthanide metal tested as an ORR catalyst.Together with the results of Kim and co-workers on Pt-La thin films [99] that alsoexhibited high activity and stability, it motivated the study of a large number ofother Pt5Ln alloys (with Ln indicating a generic lanthanide metal) in the presentwork.

1.6 Thesis outline 15
Given the high activity and stability measured on these alloys, all exhibitinga Pt-skeleton structure, the physical and electrochemical characterization of theircorrespondent Pt-skin surfaces would be highly interesting. Possibly, the stabiliza-tion by annealing of a single Pt monolayer on top of these alloys could lead toactivities that are close or even higher than those of Pt3Ni(111) [39]. Very recentlywe reported the formation of Pt-skin structures on polycrystalline Pt3Sc [100] andon Y modified Pt(111) single crystal [101] (Paper 2 and 4 in the end of this the-sis). CO Temperature Programmed Desorption (TPD) experiments demonstratedthat these surfaces bind CO considerably weaker than pure Pt: on a Pt surface thiscan be associated to a decrease of the OH∗ binding energy [100]. In both cases, de-spite the formation of a Pt-skin structure, some level of solute metal oxidation wasobserved after air-exposure, indicating that the Pt overlayer was not completelystable. Accordingly, their ORR activities resembled those of sputter-cleaned Pt3Scand sputter-cleaned Pt3Y in the Pt-skeleton form. Furthermore a clear increase ofthe Pt to solute metal ratios after ORR testing indicated a thicker Pt overlayer andthe evolution of these ordered annealed surfaces towards Pt-skeleton structures.The stabilization of Pt-skin structures on alloys of Pt and early transitions metalstherefore remains a challenge.
Finally it should be remarked that the biggest challenge regarding these al-loys of Pt and early transition metals is the synthesis of large surface area cata-lysts, for instance in the form of supported nanoparticles. The application intofuel cells would indeed require a fabrication method that is suitable for large scaleproduction. The sputter-deposition technique employed by Kim and co-workers[96, 97, 99] might be promising if applied onto large surface area nanostructuredsubstrates. A chemical method for the production of nanoparticles would proba-bly be more economically feasible. However, all these early transition metals, aswell as all the lanthanides, are highly reactive and oxophilic. Therefore, reducingthem into the form of an alloy is very difficult. Although some groups have recentlyattempted the fabrication of Pt-Y nanoparticles by using chemical-electrochemicalmethods [102, 103], there is so far no solid evidence that a metallic Pt-Y phasecould be produced and that it would exhibit superior catalytic performance. Inthis thesis a physical method based on the gas aggregation technique will be usedfor the fabrication of size-selected Pt-Y nanoparticles. This will be the first reportof the ORR activity on a similar kind of large surface area catalysts, although thisfabrication method is certainly not suited for a large scale production.
1.6 Thesis outline
In the next chapter of this thesis (Chapter 2) the employed experimental setups andcorrespondent experimental methods of this work will be introduced. A particularattention will be given to the X-ray Photoelectron Spectroscopy (XPS) and Ion Scat-tering Spectroscopy (ISS) techniques, as they constituted the central part of this

16 Introduction
Ph.D. project. Later on, these techniques will be applied to various polycrystallinePt alloys: their electrochemical behaviour will be also presented both in terms ofORR activity and stability. In Chapter 3 the application of XPS and ISS to Pt-La andPt-Ce alloys will elucidate their active surface phase and surface structure: generalconsiderations will allow to extend these properties to the other alloys of Pt andrare earths. In Chapter 4 the electrochemical results from this class of materials aswell as from a new class of Pt and alkaline earths alloys, will be collected showingclear trends in activity and stability. A model for the quantitative interpretation ofAngle-Resolved X-ray Photoelectron Spectroscopy (AR-XPS) results will correlatetheir electrochemical stability to their physical (structural) stability. Chapter 5 willfocus on the study of Pt-Y nanoparticles. Their ORR activity and stability will bepresented. XPS and ISS, together with other experimental techniques such as Trans-mission Electron Microscopy (TEM) and Extended X-ray Absorption Fine Structure(EXAFS), will show that the mechanisms of activity enhancement are similar tothose of polycrystalline surfaces. In Chapter 6 Ambient-Pressure X-ray Photoelec-tron Spectroscopy (AP-XPS) will be used for the in-situ characterization of thesePt-Y nanoparticles in a specifically prepared fuel cell. The design and constructionof a new experimental setup for combining XPS measurements and electrochem-istry will be also described. General conclusions and perspectives of this work willbe given in Chapter 7. Published papers and manuscripts related to this work or tothis Ph.D. project may be found in the end of this thesis after the bibliography.

CHAPTER 2
Experimental setups andmethods
This chapter describes the experimental setups as well as the experimental methodsthat were used during this project. The first sections will be focused on the Theta-Probe, since this is the setup which was mainly employed and developed duringthis Ph.D. project and where most of the presented analyses were made. Startingfrom an overview of the system some of the single components will be treated inmore detail. The correspondent experimental techniques will then be described indetail. The last section of the chapter introduces some of the other experimentalsetups connected to this project.
2.1 The Theta-Probe system
The Theta-Probe setup is a Ultra High Vacuum (UHV) system provided by ThermoScientific and specifically intended for state-of-the-art surface analysis and in par-ticular X-Ray Photoelectron Spectroscopy (XPS) analysis. Figure 2.1 a represents aside view of the Theta-Probe, the corresponding schematic drawing (Figure 2.1 b)illustrates the main components. The system consists of two main chambers sepa-rated by a gate valve: a main analysis chamber and a Fast Entry Air Lock (FEAL)for the quick loading and unloading of samples. The analysis chamber is equippedwith an X-ray gun with correspondent monochromator, an UV Helium lamp anda hemispherical analyzer for X-Ray Photoelectron Spectrocopy (XPS) and Ultravi-olet Photoelectron Spectroscopy (UPS) measurements; Figure 2.1 also shows the

18 Experimental setups and methods
ion gun for sample cleaning and Ion Scattering Spectroscopy (ISS). A flood gunfor charge neutralization of the non-conductive samples is available. A camera ismounted on top of the analysis chamber: in combination with a three axis mo-torized stage in the middle of this chamber it allows a precise alignment of thesamples. The most relevant of these components will be described in more detailin the following paragraphs.
Figure 2.1: Side view of the Theta-probe setup which was used for most of the spec-troscopic measurements of this work (a) and correspondent schematic representation withindications of the main components (b).

2.1 The Theta-Probe system 19
2.1.1 Pumping system and gas lines
The pumping system consisted originally of three turbopumps: two 270 l s−1
turbopumps dedicated to the FEAL and the analysis chamber respectively and asmaller 80 l s−1 turbopump for the differential pumping of the ion gun and of theflood gun. Two extra 80 l s−1 turbopumps have been mounted during this projectin order to provide differential pumping of the UV helium lamp and to improve thecleanliness of the gas lines. The analysis chamber is also provided with a TitaniumSublimation Pump (TSP) that allows to reach a base pressure of 5×10⁻¹⁰mbar andimproves the pumping rate of reactive gases. This pressure was allowed to increaseup to about 5×10⁻⁹mbar during some of the measurements, due to degassing fromthe samples. The gas system comprehends five separated lines containing N60 pu-rity He, Ne, Ar, CO, H2 respectively, each separated from the analysis chamberthrough manually controlled leak valves.
2.1.2 Sample types and mounting
Figure 2.2: Most used sample carrier of the Theta-Probe setup. Two clamps keep in placetwo of the typical sample holders: they respectively carry size-selected Pt-Y nanoparticlesdeposited on glassy carbon (left) and polycrystalline Pt5Tb (right).
Three different sample carriers can be loaded in the FEAL and transferred ontothe three axis sample stage in the analysis chamber. The samples are typically holdthrough metallic clamps as shown for the most commonly used carrier in Figure2.2. The measurements reported in this thesis have been typically carried out ontwo different kinds of samples. A number of polycrystalline Pt alloys representthe first typology: the nominal compositions were Pt3Sc, Pt3Y, Pt5Y, Pt3La, Pt5Ce,Pt5Sm, Pt5Gd, Pt5Tb, Pt5Dy, Pt5Tm, Pt5Sr and Pt5Ca. All these polycrystalline alloys(5 mm in diameter disks) were provided by Mateck GmbH, Germany. Their bulkstructure was investigated by X-Ray Diffraction (XRD), their surface composition

20 Experimental setups and methods
was also regularly checked after sputter-cleaning by XPS. The second kind of sam-ple consisted of size selected Pt-Y nanoparticles fabricated by a cluster source (seeSection 2.5.2) and deposited onto a glassy carbon substrate. Examples of these twokinds of samples are also visible in Figure 2.2.
2.1.3 X-ray gun and monochromator
The X-ray gun apparatus (see Figure 2.1) is one of the main instruments equippedon the Theta-Probe chamber which is primarily dedicated to X-Ray PhotoelectronSpectroscopy (XPS) measurements. The main component of the X-ray gun is aMXR1 electrostatic electron gun from Thermo Scientific. This is constituted of aresistively heated LaB6 cathode combined with an extractor electrode to controlthe electron emission; an asymmetric electrostatic lens focuses the electron beamtowards a water cooled Al anode. The AlKα (1486.7 eV) X-ray radiation producedby electron bombardment of the anode is monochromatized by a bent quartz crystalX-ray monochromator of Johan geometry bonded to a toroidal surface that providespoint to point imaging of the X-rays onto the sample. Depending on the operationmode and supplied power, the X-ray beam spot size can be varied between 20 µmand 400 µm.
2.1.4 Ion gun
The Theta-Probe UHV chamber is equipped with a EX05 differentially pumped iongun from Thermo Scientific (see Figure 2.1). It is suitable for use as an etchingsource in X-Ray Photoelectron Spectroscopy (XPS) or Auger Electron Spectroscopy(AES) depth profiles. It also allows Secondary Ion Mass Spectroscopy (SIMS) andIon Scattering Spectroscopy (ISS) measurements. It can be operated in a numberof different modes with typical ion energies between 0.5 keV and 4 keV and ioncurrents between few nA and few µA. The beam spot dimensions can be tuned byrastering over areas of different sizes (i.e. between 1 mm × 1 mm and 10 mm × 10mm) depending on the application. For the ionization of high-purity noble gasesthree separated gas lines were installed during this project, respectively reservedto N60 purity He, Ne and Ar. In this work the ion gun was mainly used for twopurposes: sputter-cleaning of polycrystalline Pt-based alloys and ISS measurementson different samples.
2.1.5 Hemispherical analyzer
The energy analysis of the Theta-Probe system is provided by a Theta hemisphericalanalyzer from Thermo Scientific equipped with a two-dimensional channelplatedetector. It is a multi-channel detector with 112 energy channels and 96 anglechannels allowing to acquire XPS spectra in a reduced amount of time and with

2.2 X-ray photoelectron spectroscopy 21
angular resolution. The total acceptance angle of the analyzer is 60, between20 and 80 from the normal to the surface of the sample. By distinguishing theXPS signals at various angles in this range Angle-Resolved X-Ray PhotoelectronSpectroscopy (AR-XPS) measurements are possible. The energy resolution of theanalyzer during XPS measurements is a function of the employed pass energy butalso of the X-ray beam spot size and it will be discussed in the XPS Section 2.2.
2.2 X-ray photoelectron spectroscopy
X-ray photoelectron spectroscopy is one of the most popular and powerful spec-troscopy techniques used in this thesis and in general in surface science. Indeed,by providing information on the elemental composition of a material as well as onthe chemical state of the elements and on the surface structure it is one of the mostcomplete surface sensitive techniques.
Figure 2.3: Illustrative representation of the photoelectric effect. An X-ray of energy hνexcite an electron with binding energy Eb. This is emitted with a kinetik energy Ek.
It relies on the Photoelectric effect that is the emission of an electron from anatom due to absorption of a photon. If the absorbed energy of the photon hν issufficient for the electron to overcome its binding energy Eb (i.e. its energy relativeto the Fermi level of the material) and the work function of the materialφs, electronemission can occur (see Figure 2.3). The kinetic energy Ek of the emitted electronis related to its initial binding energy which is characteristic of a certain elementand of a certain chemical state. In XPS, the distribution of kinetic energies of theemitted electrons is measured, typically by a hemispherical analyzer; their bindingenergies are calculated from the equation:
Ek = hν − Eb −φa, (2.1)
where φa is the work function of the analyzer. From the binding energies it ispossible to differentiate different elements and their chemical state. The surface

22 Experimental setups and methods
sensitivity of XPS is ensured by the strong interactions of the emitted electrons withthe material itself, meaning that typical electron mean free paths λ are in the rangeof 5-20Å and only electrons emitted from atoms very close to the surface can bedetected. In Angle-Resolved X-Ray Photoelectron Spectroscopy (AR-XPS) measure-ments, the energy distribution of the emitted electrons is measured as a functionof the emission angle θ (calculated from the surface normal). Since the effectiveelectron mean free path is a function of this emission angle, λe f f = λ cos (θ), theXPS signals collected at different angles will have different surface sensitivities:information on the surface structure and depth profiles can be extrapolated.
In the Theta-Probe XPS setup the photon source is monochromatized AlKα(1486.7 eV) X-ray radiation. The energy resolution was estimated from the FullWidth at Half Maximum (FWHM) of the Ag 3d5/2 peak on a sputter-cleaned Agfoil. A maximum energy resolution below 0.5 eV was achieved using an X-raybeam spot size of 50 µm and a pass energy of the analyzer of 25 eV. However,unless differently specified the spectra of this thesis were acquired with beam spotsize of 400 µm at a pass energy of 100 eV: this gave an energy resolution slightlybetter than 1 eV. By separating the intensity of the emitted electrons at differentemission angles, the analyzer allows AR-XPS measurements. These were taken inparallel, without tilting the sample, from 16 different channels covering all theacceptance angles of the analyzer (i.e. from 20 to 80 from the surface normal).
2.2.1 Quantification of XPS
Since the analysis and quantification of XPS measurements represent a substantialpart of this thesis, this section provides further details about the employed meth-ods. While most of the commonly used softwares for the analysis of XPS data canprovide an almost immediate quantification of the elemental species of a sample,such an immediate quantification will often lead to wrong interpretations. There-fore, any kind of XPS quantification requires a good knowledge of the principles ofthis technique and of the involved physical assumptions; this will also allow, de-pending on the different cases and samples, to choose the best method and achievethe most meaningful quantification.
In the typical Straight-Line Approximation (SLA) [15, 104, 105], the pho-toelectrons travel along straight trajectories until they are either emitted from asample, or scattered. The total number of photoelectrons detected per second froma chosen orbital of an element A is given by the equation :
IA = σA (hν) T
EA
Φ
∫
z
NA (z) e
−z
λ
EA
cos (θ) dz, (2.2)
where σA is the photoelectric cross section for this particular transition at the ex-citation energy hν , T is the efficiency of detection of the emitted photoelectrons

2.2 X-ray photoelectron spectroscopy 23
(transmission function) at a characteristic kinetic energy EA, Φ is flux of photonsimpinging on the sample and NA is the atomic concentration of the element A inthe probed material, as a function of the depth z from the surface (under the as-sumption that this is not dependent on the in-plane coordinates x and y). Theexponential accounts for the probability that an electron at depth z will be emitted.It should be noticed that equation 2.2 is based on the assumption that the X-raybeam spot on the surface is small enough to neglect the dependence on x and yand that the angular asymmetry of photoemission is also negligible. The problemcan be further simplified by assuming that the sample is homogeneous:
IA = σA (hν) T
EA
ΦNAλ
EA
cos (θ) . (2.3)
However, this is rarely the case as the surface composition will typically vary fromthe one of the bulk. In Chapter 4 a more general model for homogeneously thicklayers will be introduced and applied to a real system. The idea of quantifying theatomic composition by XPS comes from the inversion of equation 2.3, allowing thedetermination of NA:
NA =IA
σA (hν) T
EA
Φλ
EA
cos (θ). (2.4)
The first challenge here is to perform a proper measurement of the XPS intensityIA, which requires a proper integration of the XPS signals corresponding to the cho-sen orbital of the element A. The crucial part of this procedure is the backgroundsubtraction, which is often somewhat arbitrary. Various background expressions ofdifferent levels of complexity have been reported in literature but no general agree-ment is found; for all the measurements of this thesis a Shirley-type backgroundwas chosen. The application of such background to the proper energy range isalso crucial; in this work the same energy range was always consistently chosen forpeaks corresponding to the same orbital.
Concerning the other factors of equation 2.4, only Φ and cos (θ) are elementindependent. This means that, as long as the interest is to evaluate the relativeatomic concentrations, these terms disappear; namely, the idea is to determine theatomic concentrations in percent with the formula:
NA (%) =NA∑
i Ni=
IA/SA∑
i Ii/Si, (2.5)
where i is an index accounting for all the present elements. SA is the so called sen-sitivity factor: a parameter that should summarize the element dependent terms inthe bottom of equation 2.4 and that could easily be tabulated. In equation 2.5 thiswas defined with the most obvious definition: SA = σA (hν) T
EA
λ
EA
. How-ever this choice is usually not practical because T also contains information aboutthe particular setup and EA depends on the particular excitation energy hν . De-

24 Experimental setups and methods
pending on the particular definition of S three different approaches to XPS quan-tification are described in the following paragraphs. It should be noticed that inequation 2.4, the cross section σA is the most important normalization factor as itvaries strongly for different elements and orbitals. T and λ exhibit in general alower variability, most of all if it is possible to compare XPS peaks with a similarkinetic energy EA.
2.2.2 Sensitivity factors and quantification approaches
Before describing the three approaches, in equation 2.5 it is convenient to definea normalized intensity IA = IA/SA, so that the problem of XPS quantification nowcoincide with the determination of all the Ii for all the elements of a probed sample:
NA (%) =IA∑
i Ii. (2.6)
Method 1. Scofield sensitivity factors
In this first approach the sensitivity factor includes the minimum amount of infor-mation, namely it is equal to the simple cross section:
Si = σi (hν) . (2.7)
Theoretical values for these cross sections for the different elemental orbitals anddifferent excitation energies are easily accessible in literature, the most popular be-ing those calculated by Scofield in the single-potential Hartree-Slater atomic model[106]. The normalized intensities will be:
Ii =Ii
Si T
Ei
λ
Ei , (2.8)
The other terms of equation 2.8 need to be determined individually; the transmis-sion function T can usually be precisely measured on each particular XPS setup.The mean free path λ, instead, has to be estimated through semi-empirical formu-las. In the last paragraph of this section (see Section 2.2.4) some examples of theseformulas are discussed.
Once a proper choice of the mean free path is made, this first approach pro-vides a quite simple quantification. The main limit consists in the accuracy of thetheoretical cross sections since large discrepancies with experimental data havebeen reported in literature [107]. These differences are probably mainly ascribedto the experimental difficulties of choosing energy ranges and backgrounds effec-tively corresponding to the calculated cross sections. The need of overcoming theselimits leads to the other two approaches discussed in the following paragraphs.

2.2 X-ray photoelectron spectroscopy 25
Method 2. Measured sensitivity factors
This second approach is diametrically opposed to the first one, meaning that thesensitivity factors are determined experimentally (typically on each individual XPSsetup) and they include the maximum possible information. Namely, they are de-termined by acquiring an XPS spectrum of a clean reference material, for instancea clean foil of a single element, and by determining the intensity Ii of a certainorbital. Referring to equation 2.3, Si will therefore be equal to:
Si = I0i = σi (hν) T
Ei
ΦN0i λ
0 Ei
cos (θ) . (2.9)
It should be noticed that the superscript 0 specifies that a reference material isprobed: N0
i now identifies the well known atomic density for the pure element iand λ0 is the electron mean free path in such pure element. With this definitionthe normalized intensities can be calculated as:
Ii =Ii
Si
N0i
λ0 Ei
λ
Ei
. (2.10)
The factor in parenthesis is basically a correction of the sensitivity factors. Thereason why it appears is related to the fact that according to the definition of equa-tion 2.9, the sensitivity factors contain information that is proper of the referencematerial. The atomic concentration N0
i has nothing to do with the probed materialof unknown composition. The mean free path λ0 Ei
is also in principle differ-ent, because of the different properties of the material the electrons need to travelthrough. As an example, relevant for this thesis, it is quite intuitive that the meanfree path of the electrons from the Y 3d XPS peak will be different if the electronsare traveling through an Y foil or a much more dense Pt-Y alloy. In the end of thissection (see Section 2.2.4), some of the empirical expressions for the estimate ofthe mean free path will take into account these differences allowing to evaluate theterms in parenthesis of equation 2.10.
Although, if properly applied, this second method leads to the most preciseXPS quantification [105, 108] it should be noticed that there are also various draw-backs. First, it requires careful measurements of the sensitivity factors that in somecases might be experimentally complicated. For instance, it might be difficult toperfectly clean the reference materials. It is also important that different sensitivityfactors are measured in the same conditions, for instance with the same photon fluxΦ, since this might typically vary after a certain amount of time. The remarkableadvantage of this method is that both the cross section σi and the transmissionfunction T are directly taken into account. Even more importantly, the huge diffi-culties of selecting the proper energy range and background are usually canceled byapplying consistent choices for both the reference material and the probed sample.

26 Experimental setups and methods
Method 3. Wagner sensitivity factors
In this third approach the definition of sensitivity factor is somewhat intermediatewith respect to the two previous choices. Namely it is defined as:
Si = σi (hν) T0 Ei
λ0 Ei
(2.11)
and these values have been tabulated by Wagner [109] by measuring on an ex-tended group of reference materials. T 0 is now the transmission function of theXPS setup that was used during the collection of these XPS data. Compared to thereference materials mentioned in the previous method, these measurements weretaken on powders, typically fluorides or carbonates. With this choice of sensitivityfactors the normalized intensities become:
Ii =Ii
Si
T 0 Ei
λ0 Ei
T
Ei
λ
Ei
. (2.12)
Also in this case the term in parenthesis is a correction of the sensitivity factor. It isdue to the different mean free path λ0 Ei
of the electrons in the reference materi-als and to the different transmission function T 0. The semi-empirical formulas forthe estimate of the mean free path (see Section 2.2.4) could in principle provide thefirst correction. However, the values provided by Wagner are an average obtainedon different materials and the estimate of λ0 would be difficult. In practice this firstcorrection is usually neglected. The reason is that most of the reference materialsin this case are powders with rather similar mass densities, so that the relative val-ues of the sensitivity factors Si should still hold. Focusing now on the transmissionfunction correction, this is usually performed by assuming that T 0 ∝ E−1 which isa good approximation for the XPS system used by Wagner [109].
This method basically combines some of the advantages of the previous twoapproaches; the sensitivity factors are easily found in literature [109] with no needto obtain clean reference samples and to measure on them. At the same timethe experimental nature of these values allow to directly take into account theexperimental cross sections σi . Also a proper definition of energy ranges and back-grounds should be easier, even though a direct comparison with Wagner’s spectrawould be desirable. Main drawbacks are related to the presence of the mentionedcorrecting factors and to the fact that values for some elements are not available.
2.2.3 Application to Pt alloys
In this particular study XPS was generally used for quantifying the surface compo-sition of Pt alloys, either in the polycrystalline form or as supported nanoparticles.This means that for each sample the most relevant XPS signals were the one of Pt(Pt 4f peak) and of the secondary component of the alloy, typically a rare earth. C

2.2 X-ray photoelectron spectroscopy 27
(C 1s peak) and O (O 1s peak) signals were usually present either as surface con-taminations or as part of the support in the case of nanoparticles. To gain a generalidea of the composition method 1, based on the tabulated Scofield cross sectionswas used, due to its simple and fast applicability.
However, the quantification of Pt to rare earth ratios in the alloys is partic-ularly important for the characterization of these materials and other approacheshave been in general preferred. Method 2 probably leads to the most precise quan-tification and it was used, in particular, for all Pt-Y alloys (Chapters 5 and 6). Ref-erence signals were measured on sputter-cleaned foils of Pt and Y. This methodwas not considered practical in the case of lanthanides, due to the large amount ofmaterials tested and the difficulties in achieving perfectly clean foils of such reac-tive materials. Scofield cross sections often produced some discrepancies betweenthe composition of sputter-cleaned polycrystals and their nominal composition. Asdiscussed in more detail in Chapter 4 this is probably due to the difficulties of aproper background subtraction and of a proper choice of energy ranges. Indeed,the quite complex XPS structure of the lanthanide core levels and the appearanceof numerous shake-up satellites complicate these operations. In general method 3,with the choice of experimental sensitivity factors, provided quite good agreementand it will be preferred in Chapter 3 for the quantification of the Pt to La and Pt toCe ratios.
In Chapter 4 the composition of these polycrystalline alloys and their surfacestructure will be studied in particular detail. A model will be introduced in order toderive quantitative information about these structures from the XPS intensities. Thecomparison between these quantification methods will be addressed in more detailwith a direct test of their applicability. Different interpretations to the observeddiscrepancies in composition with respect to the nominal stoichiometric ratios ofthe alloys will be presented and discussed.
2.2.4 Inelastic electron mean free path
All three quantification methods described in the previous section involved at leastan estimate of the inelastic electron mean free path λ for each present element.Hence the importance of determining as precise values as possible: as in the caseof sensitivity factors, the relative values are more important than the absolute onesas they will finally determine the relative concentrations. It is well known thatλ is a function of the electron kinetic energy which is typical of each XPS peak,once the photon energy is fixed. However, it is quite intuitive that electrons at thesame kinetic energy traveling through different materials might also be differentlyscattered. In particular, these so-called matrix effects can be very significant if thematerials have very different mass densities. Unfortunately, this means that thebest estimate of λ, and therefore the best XPS quantification, can be only achievedwhen some of the properties of the probed material are known in advance, which

28 Experimental setups and methods
is often not the case.
A first possibility for the quantification of λ would be to directly choose exper-imentally measured values from literature. This approach has two main problems.The former is the scarce availability of large databases reporting the values fordifferent elements measured under the same conditions. The latter is related tothe low flexibility of this method: for instance, it does not allow to estimate themean free path of the electrons from a certain XPS peak traveling through differentmaterials. The difficulties of including such matrix effects strongly limits the ap-plicability to the quantification methods described previously: most of all becausethe values reported in literature are typically measured on samples whose massdensities can be very different.
Another option is to define semi-empirical formulas based on different databasesof experimental values, that can easily generalize the estimate to arbitrary energiesand matrices. The simplest of these, defines λ as: λ ∝ Eα where α is a numericalvalue typically chosen between 0.5 and 1.0 [110]. Although it does not provide nu-merical values of the mean free path, this expression might give sufficiently goodestimates of the relative values for different XPS signals. It should be noticed thatthis formula makes sense in the case of a homogeneous sample; in this case themass density will be the same for all photoemitted electrons and λ can be quite wellconsidered as a pure function of the kinetic energy. More quantitative estimates areprovided by the so called Tanuma-Powell-Penn (TPP-2M) formula [111] or by theone proposed by Cumpson and Seah [112]. These expressions also take into con-siderations some of the properties of the matrix and the mass density in particular.The TPP-2M and the Cumpson-Seah formulas will assume particular importance inChapter 4, where the case of inhomogeneous samples will be considered. In therest of this thesis, for general quantification purposes, the relative concentrationshave been achieved by simply assuming λ∝ E0.6 (0.6 is the standard value used inThermo Avantage and Eclipse data systems).
2.2.5 Angle resolved XPS depth profiles
The quantification of the AR-XPS measurements was carried out by applying thesame principles described in the previous sections for each individual emission an-gle. In brief, detailed XPS spectra of all relevant elements were acquired at 16different emission angles between 20 to 80 from the surface normal; Shirley typebackgrounds were subtracted in order to quantify their intensities. These were nor-malized according to one of the three methods described in 2.2.2. Once the relativeconcentration of each element was determined as function of the emission angle,the depth profiles were calculated using the simulation tool ARProcess (ThermoAvantage software), which uses a maximum entropy method combined with a ge-netic algorithm. Relative concentrations at emission angles higher than 65 wereomitted in order to reduce the influence of diffraction effects and elastic scattering.

2.3 Sputter-cleaning procedure 29
The electron mean free path was approximated by the TPP-2M formula.
It should be noticed that the fitting procedure requires some assumptionsabout the substrate composition and the density and conductance of the overlayers.The composition of the substrate in particular was assumed to be equal to the nom-inal bulk composition of the alloy, which in general was in quite good agreementwith the composition measured by XPS on the sputter-cleaned alloys. Because ofthese assumptions the depth-profiles should be mainly considered as qualitative.A more quantitative approach to the definition of the surface structure from theAR-XPS measurement will be discussed in Chapter 4.
2.3 Sputter-cleaning procedure
Prior to any electrochemical measurement the surface of the polycrystalline sam-ples was cleaned by sputtering; mild sputtering conditions were preferred in ordernot to excessively roughen the surface. The ion energy was set to 0.5 keV with acurrent of 1µA Ar+ ions; a rastering area of 7 mm × 7 mm was typically chosenin order to homogeneously clean the samples. In order to better understand theresults on these polycrystalline samples a rough estimate of the sputtered thicknessat the mentioned conditions is given by:
dsput. =IiY M
eAρNats, (2.13)
where Ii is the ion current, Y is the sputter yield, M is the molar mass, e is theelectron charge, A is the area of the beam spot, ρ is the mass density, Na is theAvogadro number and ts is the total sputtering time. For pure Pt, a sputter yield ofY = 1.8 [113] and a typical sputtering time of 20 min, the thickness of the sput-tered region is of the order of dsput. = 3.2nm. This treatment was usually sufficientto clean the surface from C and O adventitious contamination without inducing aroughening of the surface that could affect the electrochemical measurements (seeSection 3.2.2).
2.4 Ion scattering spectroscopy
Ion Scattering Spectroscopy (ISS), also known as Low Energy Ion Spectroscopy(LEIS), is a physical high vacuum technique relying on the elastic scattering of ionsover the surface of a sample. An ion gun is typically used to ionize a gas andaccelerate the ions; after collision with the atoms of the probed material the kineticenergy of the scattered ions is measured, for instance by a hemispherical analyzer,allowing the identification of the surface atoms. The main advantage of this methodcompared to other surface science techniques is the extreme surface sensitivity,

30 Experimental setups and methods
which even allows to probe a single atomic layer of the surface. This is due to thevery strong interactions of the ions with the surface atoms (scattering cross section≈ 1Å
2); the neutralization probability is also close to unity, meaning that the few
ions penetrating into the material or undergoing multiple scattering events usuallywon’t survive the collision as ions and therefore they won’t be detected.
Figure 2.4: Illustrative representation of the ISS principle. An ion (e.g. He+) of initialvelocity ~v0 is scattered on the surface and loses kinetic energy depending on the mass of theprobed atom, finally leaving with a final velocity ~v1.
Figure 2.4 illustrates the principle of ISS. The elastic scattering events betweenthe probing ions and the probed atoms can be described by the equations of mo-mentum and energy conservation [105]:
Mi~v0 = Mi~v1 +Ms~vs (2.14)1
2Mi v
20 =
1
2Mi v
21 +
1
2Ms v
2s , (2.15)
where Mi is the mass of the ion and Ms is the mass of the surface atom. ~v0, ~v1 and~vs are respectively the initial velocity of the ion, the final velocity of the ion andthe final velocity of the surface atom. By combining these equations it is possibleto derive the following relationship:
E1
E0=
p
M2s −M2
i sin2 ϕ
+Mi cos
ϕ
Ms +Mi
2
, (2.16)
where ϕ is the scattering angle defined as the angle between the incoming ion (ionbeam from the ion gun) and the scattered ion (energy analyzer). Given an ionwith a known mass Mi and initial energy E0, equation 2.16 allows to derive theunknown mass of the surface ion Ms from the measured energy of the scattered ion

2.5 Other setups and methods 31
E1.
The choice of the gas and of the accelerating potential is essential for a propercharacterization. Generally, noble gases (e.g. He, Ne, Ar) are chosen in order toavoid reactions with the probed atoms. Ion energies of a few hundreds eV up to afew keV, are typically used. The choice of heavier ions and higher kinetic energieshelps to increase the resolution of the measurement and distinguish masses thatare closer to each other. However, these choices also result in a faster damaging ofthe surface due to sputtering. If this removal of surface atoms is sufficiently fast,the probed masses will also originate from the sub-surface layers and the surfacesensitivity of the measurement might be lowered. Therefore, depending on theapplication, a precise compromise of these parameters might be necessary.
For the experiments of this study, unless differently stated, ISS spectra wereacquired with He+ ions at 1 keV energy. The beam was generally rastered over asample area of approximately 2 mm × 2 mm. Ne+ or Ar+ ions at the same energywere occasionally used to distinguish the ISS peaks of Pt and some of the rareearths (ex. Ce). In these cases a particular optimization of the setup was necessaryin order to minimize the destructive effects induced by ion sputtering: in particularthe ion beam was rastered over a larger sample area, 4 mm× 4 mm. Further detailswill be given in the correspondent sections. Typical residual pressures of the noblegases were between 3 × 10⁻⁹mbar and 1 × 10⁻⁸mbar, resulting in ion currentsbetween 10nA and 60nA. The scattering angle was 125 and the incidence angleof the ion beam was 45.
2.5 Other setups and methods
The Theta-Probe setup has been primarily employed in the physical characteriza-tion by XPS and ISS of the materials presented in this thesis. This was the primaryfocus of this project, together with the development of a new experimental setupthat will be introduced in Chapter 6. The preparation of the alloyed nanoparticles,the electrochemical measurements and the application of some other techniquessuch as X-Ray Diffraction (XRD), Transmission Electron Microscopy (TEM) andExtended X-ray Absorption Fine Structure (EXAFS) were not a direct part of thisPh.D. project and, in general, they have been performed by other researchers ofour group. Their role in these measurements will be specified in the correspond-ing figures of this thesis. Due to their importance, the experimental setups andmethods for the electrochemical measurements and for the deposition of the Pt-Ynanoparticles will be briefly described in this section. Concerning the other tech-niques, further details are available in the publications attached in the end of thisthesis as it will be indicated in the correspondent sections.

32 Experimental setups and methods
2.5.1 Electrochemical experiments
The electrochemical measurements were taken in the electrochemical cell of Fig-ure 2.5, or analogous one. A standard two-compartment glass cell with the typicalthree electrode configuration was used. The cell was furnished with a water jacketattached to a hot water bath to control the temperature: all reported electrochem-ical measurements were preformed at 23 C. The experiments were carried outwith a VMP2 potentiostat (Bio-Logic Instruments), controlled by a computer. Allglassware was cleaned for 24 h in a "piranha" solution consisting of a 3 to 1 mixtureof 96% H2SO4 and 30% H2O2, followed by multiple cycles of heating and rinsingwith ultrapure water (Millipore Milli-Q, 18.2 MΩ cm−1) to remove residual sul-phates. For all measurements the electrolyte consisted of a 0.1 M HClO4 (MerckSuprapur) electrolyte also prepared with ultrapure water. The working electrodewas mounted on a rotating ring-disk electrode (RRDE) assembly provided by PineInstruments Corporation. A Pt wire was used as counter electrode while the refer-ence electrode was a Hg/Hg2SO4 electrode, separated from the working electrodecompartment using ceramic frits. All potentials of this thesis are referred to thereversible hydrogen electrode (RHE) and are corrected for ohmic losses. After eachexperiment, the potential of the reference electrode was calibrated with respectto 0 V vs. RHE, by carrying out the hydrogen oxidation and hydrogen evolutionreactions on Pt.
Figure 2.5: Photograph of the RRDE setup employed for most of the electrochemical mea-surements of this thesis (a) and correspondent schematic representation with indications ofthe main components (b).
All the tested electrodes, once mounted into the arbor of a RRDE, were im-mersed into the electrochemical cell under potential control of 0.1 V vs. RHE intoa N2 (N5, Air Products) saturated electrolyte. The electrodes were cycled between0.05 V and 1.00 V at 1600 rpm and a sweep rate of 50 mV s−1 until stable cyclicvoltammograms (CVs) were obtained: typically within 100-200 cycles. After acqui-

2.5 Other setups and methods 33
sition of these stable CVs, the Oxygen Reduction Reaction (ORR) activity measure-ments were conducted by taking CVs in an electrolyte saturated with O2 (N55, AirProducts). The kinetic current densities jk (i.e. the current densities in absence ofany mass-transfer effects) were determined from the equation:
1
j=
1
jd+
1
jk, (2.17)
where j is the total measured current density and jd is the diffusion limited currentdensity. In order to give a general definition of ORR activity and facilitate the com-parison between different catalysts, the kinetic current density at 0.9 V vs. RHE,measured under the mentioned conditions, was chosen. It should be noticed that aproper comparison requires that these currents are normalized by the Electrochem-ically Active Surface Area (ECSA). Once this normalization is performed the termspecific activity will be generally used. In the case of nanoparticles (see Chapter5) the kinetic currents will be alternatively normalized by the total Pt mass in thecatalyst, providing a more valuable comparison between different catalysts: theterm mass activity will be used in this case. As a graphic comparison of the catalyticactivities, the logarithm of the kinetic current will be sometimes plotted against theRHE potential in the so called Tafel plot.
Stability tests
In order to test the long-term electrochemical stability of the catalysts of this thesis,an accelerated stability test based on potential cycling was chosen. This typicallyconsisted of potential cycles between 0.6 and 1.0 V vs. RHE in an O2-saturated0.1 M HClO4 electrolyte at 100 mV s−1 and 23 C. This choice was based on theprotocols of the U.S. Department of Energy [114] and of the Fuel Cell Commercial-ization Conference of Japan [115]. 10 000 cycles have been chosen for testing ofthe polycrystalline alloys while 9 000 cycles were chosen in the case of nanoparti-cles: corresponding to about 24 hours of experiment. Before and after these cyclesCVs were taken at 50 mV s−1 in order to measure and compare the ORR activities.
Electrochemically active surface area
A proper comparison of the ORR activities can only be performed with a proper de-termination of the specific activities (i.e. a proper estimate of the electrochemicallyactive surface area). Various methods have been described in literature for achiev-ing a good estimate of the electrochemically active surface area on surfaces of Ptand Pt alloys. Hereby we mention three of them: the Hydrogen underpotentialdeposition method, the CO-stripping method and the Cu underpotential depositionmethod. These methods are of course essential when comparing the activity of highsurface area electrocatalysts, whose areas are originally unknown, as in the case of

34 Experimental setups and methods
nanoparticles in Chapter 5. It should be noticed that all these methods rely onapproximations; therefore they don’t necessarily give equivalent results and theyare not necessarily the best choice in the case of extended surfaces. Hence a fewcomments are advisable.
The three methods rely on the adsorption of different species on the activesites of an electrode and on the total desorption of these species from the surfacewhile raising the applied potential [75, 116]. In the case of hydrogen the numberof active sites is calculated by integrating the adsorption-desorption charge of anadsorbed layer in the so-called hydrogen underpotential deposition (Hupd) region.The CO-stripping involves the adsorption of a monolayer of CO and the measure-ment of its potentiodynamic (or chronoamperometric) oxidation charge. The thirdmethod relies on the under-potential deposition of a layer of Cu (Cuupd) and itsoxidation to Cu2+. In all cases the measured adsorption-desorption charges are ex-pected to be proportional to the number of active sites and therefore to the ECSA.All these methods can give satisfactory results for establishing the active surfacearea of Pt catalysts. The Hupd is probably the most common choice as it can bedirectly derived from the stable CVs. When the CO oxidation reaction is studied,CO-stripping is also often performed as a further estimate of the ECSA. However,it is well known that the saturation coverages of H and CO might vary dependingon the chemical properties of a surface; for instance they are highly dependent onthe exposed Pt facets. For the same reason the saturation coverages might stronglydiffer in the case of Pt alloys whose surface chemistry is different from pure Pt[73, 117–119].
2.5.2 Deposition of Pt-Y nanoparticles
Although a good part of this thesis presents fundamental studies on new materialsfor the ORR, mainly performed on extended surfaces, Chapters 5 and 6 will focuson Pt-Y alloys in the more technologically relevant form of nanoparticles. Thesewere fabricated in a cluster source under UHV conditions as described in this sec-tion. The preparation relies on a magnetron sputter gas aggregation source (Birm-ingham Instruments Inc.), combined with time-of-flight mass filtering. The gas ag-gregation method consists in the Ar+ sputtering of an Pt-Y alloy target to producean atomic vapor that is subsequently condensed into nanoparticles through collis-sions with a liquid nitrogen cooled Ar and He gas. For the particles of this work thealloy target was purchased from Kurt J. Lesker Inc. with nominal composition ofPt9Y. Compared to chemical or electrochemical methods this technique has the ad-vantage of forming the particles under UHV conditions where the oxygen pressureis negligible. Indeed, the high reactivity and oxophilicity of Y (or any other rareearth) and the very negative standard reduction potentials are the main challengesfor a chemical-electrochemical synthesis. At the same time the particles producedthrough this gas aggregation technique are generally ionized, allowing the massselection through a time-of-flight filter selecting the desired mass to charge ratio.

2.5 Other setups and methods 35
Narrow size distributions can be achieved, typically within a 20% of relative uncer-tainty for average particle diameters between 1 nm and 10 nm. Once the particleshave been formed and mass-selected, they are directed towards a planar glassycarbon support in a separate UHV chamber (Omicron, Multiscan Lab) with a basepressure of 1×10⁻¹⁰ mbar. The acceleration of the nanoparticles occurs through asystem of Einzel lenses that allows to control the position and width of the particlebeam and therefore the density of nanoparticles on the support. In combinationwith the mass filter a measurement of the nanoparticle beam current provides anestimate of the amount of catalyst deposited onto the glassy carbon: a quantityneeded for defining the mass activity. At the same time a Maxtek Inc. quartzcrystal monitor is used in parallel for estimating the deposition rate. These twoindipendent measurements typically agreed within 10 %. This Omicron chamberis also equipped with various UHV techniques as XPS, ISS and Scanning ElectronMicroscopy (SEM) for a first characterization of the as-deposited nanoparticles.

36 Experimental setups and methods

CHAPTER 3
Pt-La and Pt-Ce alloys:the active chemical phase
3.1 Introduction
On the wake of the results achieved for the Pt-Y and Pt-Sc systems, alloys of Ptand lanthanide metals were also considered as potentially promising ORR cata-lysts. Some of their intermetallic compounds, such as Pt5La, Pt5Ce and Pt5Gd, alsoexhibit very negative heats of alloy formation, as shown in Figure 3.1. The experi-mental values found in literature approach the exceptionally negative value of Pt3Y(∆H ≈ -4 eV). They could potentially be more stable than alloys of Pt and latetransition metals whose alloying energies, also reported for comparison, are muchless negative (∆H ≈ -0.5 eV). We note that despite their denomination as “rareearths”, good part of these elements, and in particular La and Ce, are much moreinexpensive and much more abundant than Pt [5]. This chapter focuses on Pt-Laand Pt-Ce alloys: indeed, Pt5La was the first material of this kind to be tested andcharacterized [6]. In general, Pt-La and Pt-Ce alloys exhibit very similar propertiesand for the peculiar structure of their 3d core level XPS spectra, they represent avery good case study in order to identify the active chemical state of these cata-lysts. This turned out to be a controversial issue after the recent work of Kim andco-workers who also focused on alloys of Pt and early transition metals [96, 97]and more recently on alloys of Pt and lanthanides [99].
The ORR activity of their Pt3La catalyst is similar to the one we measuredon Pt5La [6]. However some of their experimental evidences and particularly the

38 Pt-La and Pt-Ce alloys: the active chemical phase
- 5 - 4 - 3 - 2 - 1 0
P t 3 C u
P t 3 F e
∆H f ( a l l o y ) / e V
P t 3 YP t 5 L aP t 5 C eP t 5 G d
P t 3 N i
P t 3 C o
Figure 3.1: Experimental enthalpies of alloy formation specified per formula unit. Thevalues for the different alloys are respectively taken from: Pt3Ni [120], Pt3Cu [121], Pt3Co[122], Pt3Fe [122], Pt5Gd [123], Pt5Ce [123, 124], Pt5La [123, 124] and Pt3Y [123].
interpretation of this high activity are quite different. By performing AR-XPS mea-surements, they claim that the surface structure and composition of Pt3La is un-altered before and after electrochemical measurements. On the basis of their DFTcalculations, they also suggest that, in vacuum, La atoms would spontaneously tendto segregate to the surface of the compound. In their view, the very negative al-loying energy would be sufficient to make them thermodynamically stable duringreaction, without any La oxidation or dissolution. As these conclusions differedconsiderably from our own, we decided to revisit the issues of the active chemicalstate and surface structure of Pt-La alloys. This discussion takes part in a broaderdebate about the possible stabilization of the more reactive metals on the surfaceof Pt and Pd alloys, including some more widely studied systems as the Pt-Ni andPt-Co alloys [37, 51, 118, 125]. If possible, this notion would be of fundamentalinterest, as the higher activity of these materials could be also explained by bifunc-tional effects; meaning that both metals would provide active sites during ORR,with the more reactive atoms facilitating the O2 dissociation or the removal of OHradicals from the more noble Pt sites [49, 50].
Due to the similar chemical properties of the lanthanides, most of the con-siderations of this chapter will then be extended to Chapter 4 where other alloysof Pt and lanthanides will be introduced; the observed trends in activity and sta-bility will help us to answer other fundamental questions about the origin of theactivity enhancement and the mechanism of long-term deactivation. The contentof this chapter is based on the results of Paper 3 in the end of this thesis [126]. The

3.1 Introduction 39
electrochemical experiments have been performed by María Escudero-Escribano asindicated in the corresponding figures.
3.1.1 Initial characterization and sample preparation
All the reported measurements have been carried out on three polycrystalline sam-ples with nominal stoichiometry: Pt5La, Pt5Ce and Pt3La. Their bulk structure wasinvestigated by XRD: details of the measurements and of the experimental appa-ratus can be found in [126] (Paper 3 in the end of this thesis). For Pt5La andPt5Ce no closed-packed structure exist as it will be further discussed in Chapter4. They exhibit a hexagonal structure of the Cu5Ca-type, with the space groupP6/mmm. Their lattice parameters were found to be: a = b = (0.5378 ± 0.0005)nm, c = (0.4187 ± 0.0008) nm for Pt5Ce, and a = b = (0.5393 ± 0.0003) nm,c = (0.4381 ± 0.0004) nm for Pt5La, in good agreement with the literature values[127]. Concerning the sample with nominal composition of Pt3La, two differentcrystal structures were identified: Pt2La and Pt5La. This is consistent with the pre-viously reported phase diagrams of Pt-La alloys, where no stable Pt3La phase exists[128, 129].
The surface composition of the polycrystals was regularly checked by XPS. Inparticular, XPS measurements were taken before all electrochemical measurementsto ensure that the Pt to La and Pt to Ce ratios were reproducible and no changein the overall surface composition occurred. In order to do that the polycrystallinesamples were sputter-cleaned under UHV conditions as described in the Section2.3. In brief, an ion beam consisting of Ar ions at 0.5 keV was rastered over anarea of 7 × 7 mm2. Typically, 20 minutes of such cleaning procedure allowed toreduce the total amount of C and O contaminations below 5%. After this cleaningprocedure the Pt to lanthanide ratios were estimated from the Pt 4f, La 3d and Ce3d XPS peaks: 4.9 ± 0.4 for Pt5La, 4.8 ± 0.1 for Pt5Ce and 3.2 ± 0.2 for Pt3La.The presence of these residual contaminations is mainly due to the extremely highreactivity of La, Ce and of the other rare earths in general. This means that thesticking coefficient of molecules like O2 or CO will likely be close to unity [130],and even at such low pressures, relevant C and O signals might arise during thetime needed for XPS characterization (typically about one hour). The small varia-tions of the Pt to lanthanide ratios for different experiments might also be relatedto this partial oxidation of the lanthanides, as it could induce a rearrangement ofthe surface atoms (e.g. surface segregation). In order to avoid this uncertainty theratios reported in the rest of this chapter for sputter-cleaned samples were mea-sured while continuing the sputter cleaning. This allowed to maintain the C and Ocontaminations below 1%.

40 Pt-La and Pt-Ce alloys: the active chemical phase
3.2 Electrochemical characterization
After the cleaning procedure, the polycrystals were readily transferred to the RRDEapparatus. (details of the transfer procedure and about the electrochemical mea-surements can be found in Section 2.5.1 and [126] (Paper 3 in the end of thisthesis). After mounting the polycrystalline alloys were immersed into a N2 satu-rated 0.1 M HClO4 electrolyte and cycled between 0.05 V and 1.00 V until stableCVs were obtained, typically 100-150 cycles. This procedure is required in orderto clean the surface from the impurities accumulated during the transfer. At thesame time, chemical and structural modifications of the surface might occur (e.g.dealloying), until a stable phase is reached.
0 . 0 0 . 2 0 . 4 0 . 6 0 . 8 1 . 0- 6
- 5
- 4
- 3
- 2
- 1
0
P t 3 Y
j / mA
cm-2
U / V v s . R H E
P t 5 C eP t 5 L a
P t
0 . 8 6 0 . 8 8 0 . 9 0 0 . 9 2 0 . 9 4 0 . 9 60 . 1
1
1 0
1 0 0
P t 5 L aP t 5 C e
P t
P t 3 Y
j k / mA c
m-2
U / V v s . R H E
Figure 3.2: RRDE polarization curves at 1 600 rpm and 50 mV s−1 for the ORR on Pt5La,Pt5Ce and Pt polycrystalline electrodes in O2-saturated 0.1 M HClO4: in the inset, Tafel plotwith the corresponding kinetic currents. Polarization curve and Tafel plot of Pt3Y are alsoshown for comparison [16]. Measurements performed by María Escudero-Escribano.
Once stable CVs had been obtained the catalytic activity of the electrodes wastested in O2-saturated 0.1 M HClO4. Figure 3.2 shows the polarization curves ofPt5La and Pt5Ce in comparison with polycrystalline Pt and, in the inset, their Tafelplots. Data for Pt3Y are also shown for comparison as this was the polycrystallinealloy with the highest ORR activity reported prior to this work. Pt5La and Pt5Ceexhibit a lower overpotential for the oxygen reduction than pure Pt. Their spe-cific activities, defined as the kinetic current densities at 0.90 V vs. RHE, are (6.8± 0.3) mA cm−2 and (7.4 ± 0.4) mA cm−2, respectively: meaning that the ORR

3.2 Electrochemical characterization 41
activity enhancements for Pt5La and Pt5Ce are 3.4 and 3.7. Alloys of Pt and latetransition metals prepared under similar conditions (Pt3Fe, Pt3Co and Pt3Ni) ex-hibited a considerably lower activity, with about a factor of 2 enhancement relativeto polycrystalline Pt [37, 73]. It is important to specify that the measured activityof polycrystalline Pt is in agreement with the values recently proposed by reputablegroups under the same conditions [44, 75, 116].
3.2.1 Stability test
Once stable CVs were obtained and the ORR activity was measured, acceleratedstability tests were conducted in order to test the long-term durability of the sam-ples. 10 000 consecutive cycles between 0.6 and 1.0 V vs. RHE in an O2-saturated0.1 M HClO4 electrolyte at 100 mVs−1 were chosen as a standard stability test(see Section 2.5.1 for further details). Kinetic currents of Pt5La and Pt5Ce weremeasured before and after cycling; in both cases they experienced remarkably lowlosses: around 8% for Pt5La and 10% for Pt5Ce. This is a good evidence of thelong-term electrochemical stability of these alloys. Figure 3.3 shows the ORR ac-tivity of Pt5La and Pt5Ce: the activity of pure polycrystalline Pt and of Pt3Y is alsoplotted for comparison. Both activities before and after stability test are reported.Interestingly, after 10 000 cycles both alloys maintain a specific activity which ismore than 3 times higher than for pure Pt.
Although a complete stability test should be carried out on large surface areacatalysts and possibly in a fuel cell, the results on polycrystalline Pt5La and Pt5Ceare a good indication of the resistance to de-alloying, which is considered as themain cause of degradation for alloys of Pt and late transition metals [76]. Recently,Todoroki et al. studied the stability of Pt-enriched Ni/Pt(111) catalysts whose ini-tial activity is 8 times higher than for pure Pt(111). After a stability test of only1 000 cycles between 0.6 and 1.0 V vs. RHE in analogous conditions, they mea-sured activity losses close to 75% [48]. State-of-the-art Pt-Co ORR catalysts alsoexhibited a substantial degradation under fuel-cell operating conditions, primarilydue to de-alloying [76, 77]. The high electrochemical stability of Pt5La and Pt5Cesuggests them as promising materials for the cathode catalysts of PEMFCs. Thismotivates the interest towards the fabrication of large surface area catalysts basedon these alloys and towards more extended stability tests under the technologi-cally relevant conditions of a fuel cell. However, it should be anticipated that thechemical (or electrochemical) synthesis of Pt-La or Pt-Ce alloyed nanoparticles willbe particularly challenging due to the high reactivity of the lanthanides and to thedifficulties of reducing them to a metallic state.

42 Pt-La and Pt-Ce alloys: the active chemical phase
0
2
4
6
8
1 0
1 2
j k / mA c
m-2
P tP t 5 L aP t 5 C e
P t 3 Y
Figure 3.3: ORR activity expressed in terms of kinetic current density at 0.9 V vs. RHEfor polycrystalline Pt5La, Pt5Ce and Pt. The activities are reported both before and afterstability test consisting of 10 000 cycles between 0.6 and 1.0 V vs. RHE in an O2-saturated0.1 M HClO4 electrolyte at 100 mV s−1. The dotted line represents the ORR activity ofpolycrystalline Pt3Y for comparison. Measurements performed by María Escudero-Escribano.
3.2.2 Electrochemically active surface area
It is important to mention that all the currents presented so far are normalized bythe geometric surface area (0.196 cm2) under the assumption that the surface ofthe polycrystals is smooth, with a roughness factor ≈ 1 cm2 / cm2. This mightseem a rough approximation since the definition of specific activity often requiresa measurement of the electrochemically active surface area (ECSA), particularlywhen a study aims at comparing specific activities of different materials. How-ever, our choice of using the geometrical surface area is supported by a number ofexperimental evidences.
For both Pt5La and Pt5Ce, as well as for the other alloys of this work unlessdifferently stated, the voltammetric currents and charges did not increase duringsuccessive measurements on the same surface; the CVs and in particular the dou-ble layer capacitance were also reproducible for successive experiments, suggest-ing that the sputter-cleaning procedure did not induce a continuous roughening ofthe surface. CO-stripping experiments were also performed. The integrated CO-stripping charges were ≈ 310 µC cm−2 on Pt5La and ≈ 300 µC cm−2 on Pt5Ce.These values are similar to those measured on other Pt-alloys [118, 119] andlower than that measured on polycrystalline Pt ≈ 360 µC cm−2, in good agreementwith literature values [119]. The lower CO-stripping charge could be explainedby a weaker binding of CO to the Pt surface of the alloys; a reduced CO bind-

3.3 X-ray photoelectron spectroscopy 43
ing energy was already shown for other Pt-alloys with a Pt overlayer [100, 119],and in particular for the Cu/Pt(111) near surface alloys, both prepared in electro-chemical [118] and in UHV environment [131]. On the basis of these lower CO-stripping charges we considered the geometric surface area to be a more reliableand more conservative estimate of the microscopic surface area; a normalizationto the CO-stripping charge could introduce further uncertainty in the comparisonof the specific activities and would not be consistent with our recent publications[6, 16, 98, 100, 126, 132].
It should be also noted that, in general, the Hupd method did not providereliable measurements of the ECSA on these polycrystalline alloys. This was dueto the observation of H absorption in the bulk of some alloys (e.g. Pt5Ce). Furtherdetails about the CO stripping experiments and about the evidences of H absorptionon Pt5Ce can be found in [126] (Paper 3 in the end of this thesis).
3.3 X-ray photoelectron spectroscopy
The catalytic surfaces of Pt5La, Pt5Ce and Pt3La were systematically studied by AR-XPS in order to follow all the modifications of chemical state and surface structure.Such measurements were carefully repeated during the sputter-cleaning procedure,in order to characterize the samples as-prepared. Subsequently the same measure-ments were repeated after air-exposure in order to verify their stability in presenceof oxygen, after ORR activity test to verify the stability in electrochemical envi-ronment and after stability test to verify their long-term stability during potentialcycling.
The XPS features of the core level spectra of the lanthanide metals are in gen-eral quite complex. In the case of La and Ce atoms some of these characteristicfeatures are similar, allowing a common description. Due to the presence of local-ized electrons in the 5d or 4f shells, distinctive shake-up satellites arise in the 3dregion of their spectra. Since their relative intensity and energy position is highlydependent on the chemical state, these satellites provide useful information on theoxidation state and can be used as a diagnostic tool [133]. The origin of the satel-lites and the explanation of their behaviour has been discussed in various studies:among these the Schönhammer-Gunnarsson treatment provides a general good de-scription of the system [134]. The initial state of La and Ce atoms and their finalstate, excited by photoelectron emission, cannot be described with a single elec-tron approximation and a many-body description is needed. Each state is givenby the linear combination of different fn states, where n represents the electronoccupancy of the 4f shell. Since the level of occupancy n of these valence orbitalswill drastically change the level of screening of the core-hole and, consequently,the measured energy position of the 3d peaks, different n values will correspondto different fn satellites. A higher number of electrons in the 4f shell (higher n)better screens the photo-emitted electron from the core hole, resulting in a higher

44 Pt-La and Pt-Ce alloys: the active chemical phase
kinetic energy. Concerning the different chemical states, these will be characterizedby different coefficients in the linear combination and, therefore, different relativeintensities of the fn satellites.
All the La 3d and Ce 3d spectra of this chapter (Figure 3.4 and 3.10) werefitted according to the same assignment of the fn satellites reported before [135–137]. A complete summary of the peaks energy positions and relative intensitiescan be found in Appendix A. If we consider a La atom in its elemental state (valenceelectron configuration 5d16s2) the 4f shell is empty, meaning that the predominantfn component of the ground state will be the one with n = 0. For Ce (valenceelectron configuration 4f15d16s2) it will be the one with n = 1. From here on thecorresponding peaks ( f0 for La and f1 for Ce) will be defined as main peaks anddenoted as fN . Notably, these turn out to be the most intense components of themetallic state and of intermetallic compounds: smaller satellites correspond to thef1 state in the case of La to the f0 and f2 states in the case of Ce [135]. The chargetransfer occurring during oxidation shifts the position of all these states to higherbinding energies, in the same way as for most metals. At the same time it results ina strong intensification of the f1 satellite for La, and of the f0 and f2 satellites forCe providing a clear diagnostic tool [130, 133, 137].
Figure 3.4 a,b shows the XPS signals of the La 3d and Ce 3d core level regionsacquired during sputtering of Pt5La and Pt5Ce respectively (i.e. as-prepared sam-ples). When compared to the spectra found in literature the shape of the 3d peaksis metallic. The main fN peaks are the most intense as expected, although ratherintense fN+1 satellites are clearly distinguished at lower binding energies. It is wellknown that these fN+1 components are strengthened in intermetallic compoundscompared to La or Ce in their pure phases; indeed the spectra of Figure 3.4 a,bare very similar to those reported for similar compounds as Pd3La, Ni5La, Pd5Ce,Pd5Ce and Ni5Ce [135, 138–140].
The spectra of Figure 3.4 c,d were acquired after air-exposure of the samplesfor one hour. Compared to Figure 3.4 a,b the La 3d and Ce 3d peaks have un-dergone serious modifications. These spectra demonstrate that, at least after thesputter-cleaning procedure, the chemical state of La and Ce cannot be maintainedin presence of O2. This is understood in terms of the high reactivity and oxophilicityof lanthanide metals. The fit of figures 3.4 c,d provides further information; a newset of fn peaks overlaps to the metallic phases observed during sputter-cleaningwhich are still present. These new peaks are all shifted towards higher bindingenergies as expected from an oxidized phase; the relative intensity of the fn com-ponents varies in favor of the fN+1 and fN−1 satellites that might even becomemore intense than the main peaks. All these evidences are typical of La and Ceoxides with close resemblance to literature spectra [137, 141]. Since analogousbut less pronounced effects were also observed after exposure to air for shortertimes, and even in UHV after sufficiently long waiting times, we should expect thatthe surfaces of these catalysts are always partially oxidized before electrochemicalmeasurements; even if protected by a drop of Milli-Q water. It should be noted that

3.3 X-ray photoelectron spectroscopy 45
9 2 0 9 1 0 9 0 0 8 9 0 8 8 0
8 6 0 8 5 5 8 5 0 8 4 5 8 4 0 8 3 5 8 3 0
E x p e r i m e n t a l p o i n t s M a i n m e t a l l i c p e a k s ( f N ) M e t a l l i c s a t e l l i t e s ( f N + 1 ) M e t a l l i c s a t e l l i t e s ( f N - 1 )
B i n d i n g e n e r g y / e VB i n d i n g e n e r g y / e V
P t 5 C e ( N = 1 )P t 5 L a ( N = 0 )( a ) A s - p r e p a r e d
( c ) A i r - e x p o s e d
( e ) A f t e r O R R ( x 3 ) ( f ) A f t e r O R R ( x 3 )
( d ) A i r - e x p o s e d
( b ) A s - p r e p a r e d
F i t e n v e l o p e M a i n o x i d e p e a k s ( f N ) O x i d e s a t e l l i t e s ( f N + 1 ) O x i d e s a t e l l i t e s ( f N - 1 )
Inten
sity (a
rbitra
ry un
its)
Inten
sity (a
rbitra
ry un
its)
Figure 3.4: La 3d (left) and Ce 3d (right) XPS spectra of Pt5La and Pt5Ce respectivelyafter background subtraction, at an average emission angle of 45. The spectra were ac-quired in three different sample conditions: as-prepared (i.e. during sputter-cleaning) (a,b),air-exposed (c,d) and after ORR testing (e,f). The measurements after electrochemical mea-surements were magnified three times due to the lower signal intensity. The fitted spectraof the metallic peaks (grey) and of the oxidized peaks (blue) appear under the experimentalpoints. Detailed information about the peak positions and relative intensities are found inTable A.1.
while La has only one stable oxide phase (i.e. La2O3), the fit of the Ce oxide phase iscomplicated by the possible coexistence of trivalent Ce from Ce2O3 and tetravalentCe from CeO2 overlapping to the metallic peaks. However, the strong intensifica-tion of the f0 components, which are absent for trivalent Ce [137, 142], suggestsCeO2 as the main oxide phase. For simplicity, only the CeO2 phase was consideredin the fit of Figure 3.4 d; this allowed to achieve a set of fn peaks whose positionand intensity resembles the one of other reported fits for CeO2 [136, 137]. A com-prehensive description and quantification of the oxide components is hampered bythe possible presence of sub-oxides and beyond the interest of this study.

46 Pt-La and Pt-Ce alloys: the active chemical phase
The XPS spectra acquired after ORR activity tests are shown in Figure 3.4 e,f.On the basis of the previous considerations, it can easily be concluded that theyrepresent La and Ce in a completely metallic state: the spectra are very similarto those measured during sputtering. The absence of any oxide phase indicatesthat La and Ce oxides are all unstable under ORR conditions and that they dissolvein the acidic electrolyte. It is worth noting that, according to the measurementsafter air-exposure, this metallic phases could not be conserved if the lanthanideswere directly exposed to oxygen during the transfer from the electrochemical cellto the XPS setup. Some kind of protective layer must prevent the lanthanides fromoxidation. The Pt enriched surface originated from the dissolution of the oxides isexpected to provide such protection. This hypothesis is consistent with the muchlower intensity of the La 3d and Ce 3d XPS signals after ORR testing: the AR-XPSprofiles in the end of this section will further support this idea. A closer look atthe fitted spectra shows minor differences between the spectra after ORR testingand during sputter-cleaning. After electrochemistry a slight intensification of thefN+1 satellites of La and of the fN−1 satellites for Ce can be observed (see AppendixA.1). As such intensification is typical of La and Ce alloys [135, 139], it couldbe explained by the removal of surface La (or Ce) atoms that would be under-coordinated to Pt atoms. It is worth noting that the spectra of Figure 3.4 e,f actuallyrepresent the chemical state of La and Ce in the active catalyst, as no chemicalmodifications are expected during the transfer to the XPS setup. This also meansthat no La or Ce should be expected on the active surface of these catalysts. Instead,no conclusive information about the chemical state of the catalyst could be obtainedfrom the spectra of Figure 3.4 a-d; this emphasizes the importance of a propercatalysts characterization, that should be performed after testing and possibly in-situ, unless, as in this case, there are clear indications about the conservation ofthe active catalytic phase. Although in-situ XPS measurements are in general quiterare and only applicable to few experiments, mainly due to the difficulties relatedto the short mean free path of photoelectrons in any realistic reaction environment,important advances have been made and will be discussed in Chapter 6.
3.3.1 Angle-resolved experiments
While the spectra of Figure 3.4 have been obtained as an average over all theacceptance angles of the analyzer, by distinguishing the XPS signal at differentangles a depth profile can be constructed; in this way the active surface structureof the catalyst was also studied. Figure 3.5 a,b shows how the relative compositionof Pt and lanthanides varies for Pt5La and Pt5Ce as a function of the acceptanceangle. The Pt to La and Pt to Ce ratios are close to the nominal composition of thealloys during sputtering. However, a clear increase of these ratios is observed afterORR testing. This increase is particularly pronounced at higher angles (i.e. furtherfrom the surface normal), where the measurements are more surface sensitive.Figure 3.5 c,d shows the calculated depth profiles of Pt5La and Pt5Ce after ORR

3.3 X-ray photoelectron spectroscopy 47
' ' ' ' ' ' '
% " # ! % $ $ " $ " $ " # $ $ & $ # $
$$
"$
# #
$
"
$
! $ (
P t
C e
$
"
$
! $ (
P t
L a
( d )( c ) ' ' ' ' ' ' '
% " # ! % $ $ " $ " $ " # $ $ & $ # $
$$
"$
# #
( b )( a )
Figure 3.5: Pt to lanthanide atomic ratios in Pt5La (a) and Pt5Ce (b) as determined fromAR-XPS in three different conditions: as-prepared, after ORR activity test and after stabilitytest. All ratios were calculated as the average of at least two independent measurements,giving a standard deviation lower than 3 for all angles lower than 60. Corresponding AR-XPS depth profiles of Pt5La (c) and Pt5Ce (d), after ORR activity test (solid line) and afterstability test (dashed line).
testing. On both surfaces a thick Pt overlayer was formed as a consequence of theexposure to the electrolyte and electrochemical cycling. Similar structures havealready been reported for other de-alloyed surfaces as Pt3Co, Pt3Ni, Pt3Y, Pt5Y andPt5Gd [37, 38, 98, 132, 143].
After stability test new AR-XPS measurements were taken. The idea was to in-vestigate the compositional or structural changes occurred during potential cycling.The La 3d and Ce 3d spectra (not shown) completely resembled those of Figure 3.4e,f indicating no modifications of the active chemical state of the lanthanides. Thisalso suggests that a Pt overlayer is still present and prevents them from oxidation.The comparison of the Pt to La and Pt to Ce ratios in Figure 3.5 a,b provides moreinteresting information. A further increase of these ratios is observed, meaning thatPt enrichment proceeded further. In agreement with this higher values, the AR-XPSdepth profiles of Pt5La and Pt5Ce in Figure 3.5 c,d exhibit a slight thickening of the

48 Pt-La and Pt-Ce alloys: the active chemical phase
Pt overlayer. For both alloys, and in particular for Pt5La, these changes are verymodest, demonstrating that these surfaces are highly stable under these cyclingconditions and no bulk de-alloying occurs.
3.4 Ion scattering spectroscopy
5 0 0 5 5 0 6 0 0 6 5 0 7 0 0 7 5 0
S p u t t e r c l e a n e d 1 8 m i n s p u t t . 5 1 m i n s p u t t . 8 4 m i n s p u t t .
Inten
sity (a
rbitra
ry un
its)
E K / e V
P t
C e
Figure 3.6: ISS spectra on polycrystalline Pt5Ce after ORR testing for different sputteringtimes. The ISS spectrum acquired on a sputter-cleaned (as-prepared) sample is also reportedfor comparison.
The AR-XPS depth profiles of Figure 3.4 seem to indicate that, after ORR test-ing, the surfaces of Pt5La and Pt5Ce consist of pure Pt. As it will be better discussedin Chapter 4, their significance is mostly qualitative: the XPS measurements repre-sent an average over a 400 µm wide region of the surface and over a depth of a fewelectron mean free paths (λ≈ 10 Å [111]). This means that they don’t necessarilygive a comprehensive description of the surface structure that could in principlebe inhomogeneous due to the polycrystalline nature of the samples. Therefore,ion scattering spectroscopy (ISS) was employed as an even more surface sensitivetool to further investigate the surface structure of these catalysts. By only probingthe composition of the topmost layer, it allows to exclude the presence of residualLa and Ce atoms on the surface after ORR testing: in this case the possibility of

3.4 Ion scattering spectroscopy 49
bifunctional effects would also be ruled out.
Since the atomic masses of Ce and Pt are quite similar, it was not possible todistinguish their peaks by using He+ ions. A beam of Ne+ ions at 1 keV was usedinstead. Since Ne atoms are heavier a careful optimization was required in order toachieve a sufficiently good signal, without causing too fast sputtering damages tothe surface. The ion beam was rastered over a large 4 mm× 4 mm sample area, thecurrents were decreased to values between 10 and 16 nA at a residual Ne pressurein the UHV chamber of 5 × 10⁻⁹ mbar and the analyzer lenses were optimized formaximum sensitivity. Figure 3.6 shows the ISS spectra acquired on Pt5Ce after ORRtesting for different measuring times: each scan took approximately 2 minutes. Thespectrum of the sputter-cleaned surface is also reported for comparison, showingthat the peaks of Pt and Ce could be clearly separated at EK ≈ 680 eV and EK ≈580 eV respectively. Around 10-15 minutes of ISS sputtering were required in orderto clean the surface from the surface contaminations occurred during the electro-chemical measurements and the transfer. These very first scans (not shown) aredominated by the background originating from adventitious O and C. At around 18minutes a very clear Pt peak appears while no Ce signal can be seen. At increasingtimes and further sputtering a weak peak from Ce appears and the Pt to Ce signalsprogressively approach those measured on sputter-cleaned Pt5Ce.
In order to further quantify the Pt to Ce ratio from these ISS measurements,a Shirley-type background was subtracted and the peaks were fitted. Despitethe slight intrinsic asymmetry of the ISS peaks, the product of a Gaussian and aLorentzian curve provided a rather good fit of the experimental data. In figure 3.7the areas of the Pt and Ce peaks are shown as a function of the total sputteringtime; the Pt to Ce ratio is also plotted. For the first 10 minutes of measurement,the areas were not calculated due to the predominance of the background relatedto surface contaminations. After this period of time, the Pt peak appears and itsarea increases rapidly while the Ce peak is absent or barely visible, proving theclear Pt enrichment at the surface. At around 20 minutes of total sputtering alsothe Ce peak appears. As expected, the Pt to Ce ratio progressively diminishes untilit starts stabilizing at about 80-100 minutes of total sputtering time. At these timesthe Pt to Ce ratio slowly approaches the one of the bulk, as measured from the ISSspectrum of a sputter-cleaned sample. These data seem to indicate that the Pt toCe ratio diverges for sputtering times between 15 and 20 minutes: higher than 10000 at 18 minutes of sputtering. When the estimated level of noise in the mea-surement is also considered the maximum significative ratio for this measurementis still around 800. This evidence together with the AR-XPS depth profiles and thefact that Ce (or La) appears in a completely metallic state, contribute to the con-clusion that no Ce (or La) atoms are present on the surface of these catalysts andno bifunctional effects can occur.

50 Pt-La and Pt-Ce alloys: the active chemical phase
0 1 0 2 0 3 0 4 0 5 0 6 0 7 0 8 0 9 0 1 0 0 1 1 00
5 0 0 0 01 0 0 0 0 01 5 0 0 0 02 0 0 0 0 02 5 0 0 0 03 0 0 0 0 03 5 0 0 0 04 0 0 0 0 0
Are
a / Co
unts
s-1
T i m e / m i n
51 01 52 02 53 01 0 6 0 01 0 6 1 01 0 6 2 01 0 6 3 01 0 6 4 01 0 6 5 0
Pt to
Ce ra
tioFigure 3.7: Fitted areas of Ce (red) and Pt (grey) peaks from ISS spectra as a function ofthe total sputtering time on Pt5Ce after ORR. The Pt to Ce ratio of the areas (blue) is alsoplotted.
3.5 The case of Pt3La
Since the electrochemical behaviour of polycrystalline Pt3La was largely differentfrom the one of Pt5La and Pt5Ce a dedicated section is hereby introduced. Thesample was prepared by sputter-cleaning in totally similar conditions as for theother alloys (see Section 3.1.1); the conditions of electrochemical characterizationwere also identical (see Section 3.2). However, Figure 3.8 shows various CVs inN2 saturated 0.1 M HClO4 electrolyte. Starting from cycle 1, the voltammetriccurrents increased continuously as can be observed after 30 and 60 cycles; nostable CVs could be obtained. This is an indication of continuous roughening fromthe initially polished surface and of a progressive increase of the active surfacearea. After 60 cycles ORR activity measurements were performed in the sameconditions as for Pt5La and Pt5Ce. After ORR testing, new CVs were acquiredin N2 saturated solution. As apparent from Figure 3.8 the voltammetric currentsincreased even further reaching very high values. The double layer capacitancewas also much higher. All these evidences can be ascribed to the corrosion of thissample, consisting in the dissolution of metallic La to La3+ and the formation ofH2.
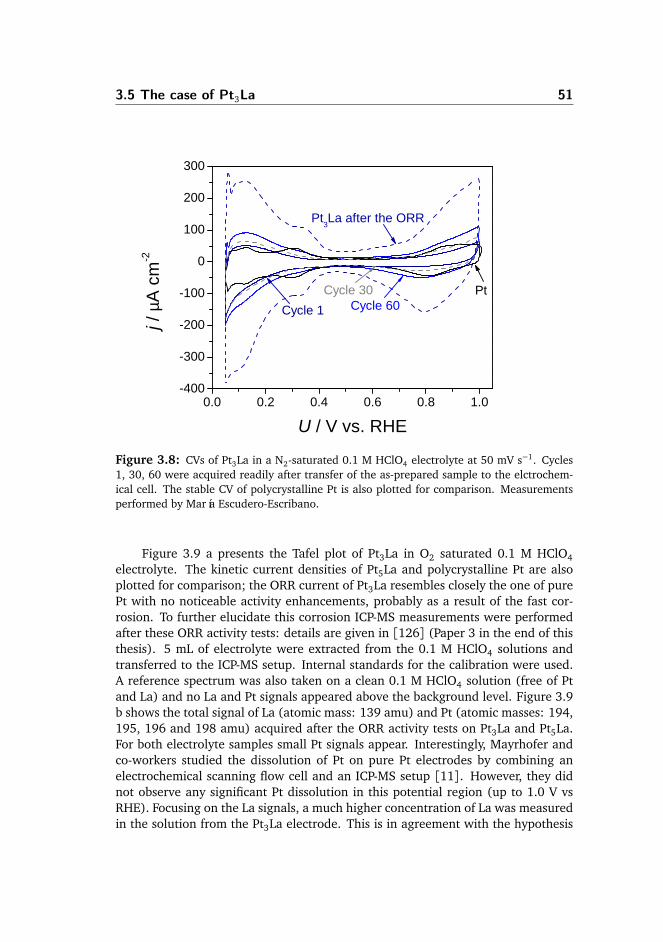
3.5 The case of Pt3La 51
0 . 0 0 . 2 0 . 4 0 . 6 0 . 8 1 . 0- 4 0 0- 3 0 0- 2 0 0- 1 0 0
01 0 02 0 03 0 0
C y c l e 3 0C y c l e 1
P t 3 L a a f t e r t h e O R R
j / µA
cm-2
U / V v s . R H E
P tC y c l e 6 0
Figure 3.8: CVs of Pt3La in a N2-saturated 0.1 M HClO4 electrolyte at 50 mV s−1. Cycles1, 30, 60 were acquired readily after transfer of the as-prepared sample to the elctrochem-ical cell. The stable CV of polycrystalline Pt is also plotted for comparison. Measurementsperformed by María Escudero-Escribano.
Figure 3.9 a presents the Tafel plot of Pt3La in O2 saturated 0.1 M HClO4electrolyte. The kinetic current densities of Pt5La and polycrystalline Pt are alsoplotted for comparison; the ORR current of Pt3La resembles closely the one of purePt with no noticeable activity enhancements, probably as a result of the fast cor-rosion. To further elucidate this corrosion ICP-MS measurements were performedafter these ORR activity tests: details are given in [126] (Paper 3 in the end of thisthesis). 5 mL of electrolyte were extracted from the 0.1 M HClO4 solutions andtransferred to the ICP-MS setup. Internal standards for the calibration were used.A reference spectrum was also taken on a clean 0.1 M HClO4 solution (free of Ptand La) and no La and Pt signals appeared above the background level. Figure 3.9b shows the total signal of La (atomic mass: 139 amu) and Pt (atomic masses: 194,195, 196 and 198 amu) acquired after the ORR activity tests on Pt3La and Pt5La.For both electrolyte samples small Pt signals appear. Interestingly, Mayrhofer andco-workers studied the dissolution of Pt on pure Pt electrodes by combining anelectrochemical scanning flow cell and an ICP-MS setup [11]. However, they didnot observe any significant Pt dissolution in this potential region (up to 1.0 V vsRHE). Focusing on the La signals, a much higher concentration of La was measuredin the solution from the Pt3La electrode. This is in agreement with the hypothesis

52 Pt-La and Pt-Ce alloys: the active chemical phase
of strong corrosion of this alloy.
02 0 0 0 04 0 0 0 06 0 0 0 08 0 0 0 0
1 0 0 0 0 01 2 0 0 0 01 4 0 0 0 0
L a
L aP t
P t
P t 5 L aCo
unts
P t 3 L a
( b )
0 . 8 6 0 . 8 8 0 . 9 0 0 . 9 2 0 . 9 4 0 . 9 60 . 1
1
1 0
1 0 0
P t 3 L a
P t 5 L a
P t
j k / mA c
m-2
U / V v s . R H E
( a )
Figure 3.9: Tafel plot (a) representing the kinetic current densities of Pt3La, Pt5La andpolycrystalline Pt as a function of potential. Corresponding ICP-MS analysis (b) of theamount of dissolved La and Pt from Pt3La and Pt5La electrodes in 0.1 M HClO4 electrolytes.The same measurement was performed on a clean 0.1 M HClO4 electrolyte and producedmuch lower signals of La and Ce (negligible on the chosen scale). Measurements performedby María Escudero-Escribano and Arnau Verdaguer-Casadevall.
Contrary to these results, Kim and co-workers [99] observed a considerableenhancement of specific activity relative to pure Pt on their Pt3La thin films: as wellas high stability during potential cycling. Possible reasons for the corrosion of ourPt3La polycrystal and a comparison with Pt5La, together with a broader discussionabout the stability of these surfaces, will be assessed in the following section.
As for the other alloys, analogous XPS characterization was performed onPt3La. For the close similarity of the spectra with those of Pt5La (see Figure 3.4)the results are described briefly. The fitted spectra of Pt3La as-prepared (i.e. duringsputter-cleaning), air-exposed and after ORR testing are presented in Figure 3.10.Similar to Pt5La the La 3d XPS peaks of the sputtered sample are completely metal-lic and very different from those measured by Kim and co-workers for thin filmsof the same stoichiometry (i.e. Pt3La) [99]. After air-exposure the level of oxi-dation was also similar to the one of Pt5La, demonstrating the same tendency ofLa atoms towards oxidation. After ORR testing small La 3d signals could still bemeasured and appeared to be completely metallic, indicating that La2O3 dissolvedin the electrolyte. For all spectra the energy position and relative intensity of thefn components was similar to Pt5La (see table of Appendix A). Due to the fast cor-rosion no long-term stability tests were conducted on Pt3La. At the same time, noAR-XPS depth profiles will be presented for Pt3La due to the increased roughnessthat could easily affect such measurements.

3.6 Discussion on the active chemical phase and surface stability 53
8 6 0 8 5 5 8 5 0 8 4 5 8 4 0 8 3 5 8 3 0
P t 3 L a ( N = 0 )
E x p e r i m e n t a l p o i n t s M a i n m e t a l l i c p e a k s ( f N ) M e t a l l i c s a t e l l i t e s ( f N + 1 )
( a ) A s - p r e p a r e d
( b ) A i r - e x p o s e d
( c ) A f t e r O R R ( x 3 )
Inten
sity (a
rbitra
ry un
its)
B i n d i n g E n e r g y / e V
F i t e n v e l o p e M a i n o x i d e p e a k s ( f N ) O x i d e s a t e l l i t e s ( f N + 1 )
Figure 3.10: La 3d XPS spectra of Pt3La after background subtraction, at an averageemission angle of 45. The spectra were acquired in three different sample conditions: as-prepared (i.e. during sputter-cleaning) (a), air-exposed (b) and after ORR testing (c). Themeasurements after electrochemical measurements were magnified three times due to thelower signal intensity. The fitted spectra of the metallic peaks (grey) and of the oxidizedpeaks (blue) appear under the experimental points. Detailed information about the peakpositions and relative intensities are found in Table A.1.
3.6 Discussion on the active chemical phase and sur-face stability
Evidently, the XPS results of Sections 3.3 and 3.5 have highlighted a strong ten-dency towards the La and Ce oxidation. The surface of these Pt-La and Pt-Ce alloysis intrinsically unstable under air-exposure. The very negative alloying energies(see Figure 3.1) which are typical of these alloys are insufficient to prevent suchoxidation. It should be noted, however, that these alloying energies might still playa role against oxidation. The spectra of Figures 3.4 and 3.10 and the correspondentdata of Appendix A show that the metallic components of the La 3d and Ce 3d spec-tra still account for most of the XPS signal. This indicates that the alloys still createkinetic barriers against deep oxidation, while pure La or Ce would immediately

54 Pt-La and Pt-Ce alloys: the active chemical phase
form a thick oxide layer [144, 145].
Our experimental evidences are in clear discrepancy with the results and in-terpretation of Kim and co-workers for Pt3La [99]. On the basis of their DFT cal-culations on a closely packed structure of Pt3La they claim that La atoms would bepresent on the surface without forming any Pt overlayer. The alloying energy wouldstabilize this structure not only in vacuum but also under reaction conditions: nooxidation or dissolution of La would occur. They support this interpretation withAR-XPS measurements, showing that La atoms are present on the surface and thattheir chemical phase does not vary before and after electrochemical measurements.However, the peak shape and position of their La 3d XPS peaks does not appear asmetallic: it is instead similar to those we observed for La oxide in Figure 3.4 c,d.In general, these spectra are typical of compounds where La is in an oxidized state,with very intense fN+1 components, almost as intense as the main La 3d peaks[130, 141, 146]. This observation together with the fact that no explicit detailsabout the purity of their fabricated alloys or any surface cleaning procedures aredescribed in their work [99] suggest the formation of a rather thick La oxide layer.
It should be noted that the XRD measurements reported by Kim and co-workersexhibit the same crystal structure of pure Pt with the presence of some lattice strain.This indicates that their Pt3La phase should consist of a solid solution [147, 148],meaning that the overall bulk composition might still be constant and close to thestochiometry of Pt3La, but with a random substitution of Pt and La atoms at anygiven atomic coordinate. Solid solutions are typical of metal compounds with weakinteractions between its constituents, as in the case of Pt3Co, in particular whenthe annealing temperatures are not sufficiently high [147]. In the case of Pt and Lathese interactions should be strong, providing a significant driving force towardsthe formation of an ordered intermetallic compound. In this case, the energeticallyunfavorable La-La bonds would be minimized resulting in a compound with thehighest possible number of Pt-La nearest neighbours. Interestingly, the phase dia-grams found in literature for the Pt-La intermetallic compounds do not report theexistence of any stable Pt3La phase [128, 129]. The XRD measurements on ourpolycrystalline sample with nominal composition of Pt3La are in agreement withthese diagrams; they allowed to identify two coexisting phases: Pt2La and Pt5Lathat are both reported as stable intermetallic compounds. In our view, Kim and co-workers obtained a meta-stable solid solution due to their particular preparationconditions: they fabricated thin films of Pt3La by magnetron sputtering at roomtemperature, without any heat treatment that could facilitate the formation of anordered intermetallic compound. For such a meta-stable phase the low stability oftheir Pt3La sample to oxidation in air is unsurprising.
Focusing now on Pt5La and Pt5Ce, and in particular on the AR-XPS results af-ter ORR testing (see Figures 3.4 e,f and 3.5 c,d), it is clear that both the La andCe oxides, as well as their metallic phases to some extent, are dissolved from thenear-surface region in acid. This tendency can be understood in terms of simplethermodynamic considerations. First considering the Pt5La case, La2O3 is not ther-

3.6 Discussion on the active chemical phase and surface stability 55
modynamically stable at pH 0 and it will clearly dissolve to La3+ [8]. Metallic La isalso unstable for similar reasons: the standard dissolution potential of a La atom toLa3+ is -2.38 V vs. the standard hydrogen electrode (SHE) [149]. Since the reactioninvolves three electrons the correspondent Gibbs free energy of dissolution is≈ -7.1eV at 0 V SHE. The presence of the alloy will partially stabilize each La atom for anamount of energy given by the standard Gibbs free energy of formation (∆GPt5La =-3.8 eV [124]). This results in a residual standard Gibbs free energy of dissolution≈ -3.3 eV, or in terms of standard reduction potential ≈ -1.1 V vs. SHE. Due to thevery similar chemical properties of Pt5Ce analogous considerations apply, giving astandard reduction potential of Ce3+ to Ce ≈ -1.1 V vs. SHE, approximately thesame as for Pt5La. At the cathode of a fuel cell typical potentials of around 1 V canbe reached during shut down, these values are 2.1 V higher than those needed forstabilizing metallic La or Ce. In other words, these simple calculations predict ahuge driving force of about 6.3 eV for the dissolution of each La or Ce atom: thisis despite the very negative alloying energy. Such analysis supports the concept thethat no La or Ce atoms can be expected on the surface of these catalysts. Althoughthe preparation technique employed by Kim and co-workers is different from theone of our sample, and the structures are also different, it is very unlikely thatany kind of metallic Pt-La phase could resist to this huge driving force towards thedissolution of La atoms at the surface, especially without any annealing treatment.This tendency towards dissolution is probably independent on the bulk structure ofthe alloys.
Figure 3.11: Illustrative three-dimensional view of the Pt5Ce structure after sputter-cleaning (left) and after ORR activity test with the formation of a Pt overlayer on top ofthe Pt5Ce bulk alloy (right). Grey and magenta spheres represent Pt and Ce atoms respec-tively.
Despite the instability of the lanthanides on the surface of the alloys the AR-XPS depth profiles of Figure 3.5 c,d show that La and Ce are still present undera few monolayers thick Pt overlayer. With a mean free path of photoelectrons of

56 Pt-La and Pt-Ce alloys: the active chemical phase
the order of λ ≈ 10 Å [111] their presence is certain within few nanometers fromthe surface: an illustrative view showing the effect of acid leaching on Pt5Ce andthe formation of such overlayer is found in Figure 3.11. The Pt overlayer pro-vides kinetic stability against the dissolution of the lanthanides from the bulk. Thevery negative alloying energies are still expected to play a role: the very strongPt-La and Pt-Ce interactions are expected to obstruct and slow down the diffu-sion of La and Ce through the overlayer. A different case is the one of Pt3La thatcontinuously corrodes as described in Section 3.5. We ascribe the origin of suchinstability to the presence of multiple phases in its XRD trace. The importanceof stoichiometry for the stability of the PtxY alloys was already investigated in aprevious publication [98]: different intermetallic compounds exhibited completelydifferent behaviours. The Y-rich phases (PtY and Pt2Y), in particular, heavily cor-roded while both Pt3Y and Pt5Y were stable under ORR conditions. We anticipatethat La-rich phase (Pt2La) might be the one corroding on the Pt3La polycrystallinesample. Other groups have reported similar evidences for alloys of Pt and late tran-sition metals [58, 150]: it is particularly difficult to stabilize the Pt alloys whenthe less noble metal overcomes a certain percentage of the total composition. Forpercentages higher than 60% the dissolution directly occurs from the bulk of thealloy. The very high activity and good stability of Pt5La and Pt5Ce, compared tothe poor results of Pt3La, underlines how essential the identification of the rightphase is for this kind of compounds, and for this purpose how important physicaltechniques as XPS, XRD and LEIS might be.

CHAPTER 4
Trends in activity andstability
4.1 Introduction
In the previous chapter some of the first alloys of Pt and a lanthanide metal (La,Ce) have been introduced. In particular, detailed AR-XPS and ISS analyses wereperformed on Pt5La and Pt5Ce. These model polycrystalline alloys allowed to elu-cidate the active chemical phase of this kind of samples when exposed to acidicelectrolytes and subjected to ORR conditions. The presence of a thick Pt overlayerproviding kinetic protection against deep dealloying was demonstrated. With asimilar structure it was theorized that neither bifunctional effects or ligand effectscould explain the enhanced ORR activity relative to pure Pt, and that only straineffects could be the explanation. This chapter will focus on this particular point,with the purpose of explaining the origin of the strain and how this strain is relatedto the ORR activity of these catalysts and their durability. A number of polycrys-talline alloys all exhibiting the nominal stoichiometry of Pt5Ln (with Ln indicatinga generic lanthanide metal) were tested. Similar to the Pt5La and Pt5Ce intermetal-lic phases, the heat of alloy formation of these new materials is also very negative[123], indicating the high thermodynamic stability of the alloys. Their chemicalstates and surface structures also present the same characteristic features allowinga direct comparison of the catalytic performances of all these materials. Indeed,their electrochemical characterization will be presented showing clear trends bothin terms of ORR activity and stability. A new class of alloys for catalyzing the ORR

58 Trends in activity and stability
will also be introduced: alloys of Pt and some alkaline earths exhibit promisingactivities.
The XRD characterization shows that all these materials have similar bulkstructures and it will allow to give an interpretation of these trends on the basis ofthe nearest neighbour Pt-Pt distance in the bulk, although strain relaxation effectsare expected to occur in the Pt overlayer. Investigating the nanoscale properties ofthese Pt overlayers, (e.g. their crystal structure, orientation and level of ordering)is a fundamental step towards a full understanding of their catalytic properties.The thickness of the overlayer in particular is an important parameter defining thelevel of strain relaxation and providing details about the dealloying mechanism. Amodel for estimating these thicknesses on the basis of the AR-XPS measurementswill be introduced.
This work enters in the context of various other studies that in the last twodecades tried to establish experimental trends in the ORR activity of Pt alloys.Mukerjee et al. studied the activity of carbon supported alloyed nanoparticles(PtM/C with M = Cr, Mn, Fe, Co, Ni): they related it to the nearest neighbourPt-Pt distance and to the level of Pt d-band vacancy [72]. Instead, Stamenkovic etal. reported trends in activity of various polycrystalline extended surfaces (namelyPt3Ti, Pt3V, Pt3Fe, Pt3Co and Pt3Ni) more similar to those studied here; they chosethe experimental (or theoretical) d-band center position as a descriptor of the ac-tivity [38, 44]. More recently, Hwang and coworkers also correlated the positionof the d-band center with the activities of various sputter-deposited thin films, in-cluding some alloys of Pt and early transition metals as Pt3Y and Pt3Zr [151]. Weanticipate that, in agreement with the d-band model [53–55] and with the d-bandshift observed by Strasser et al. on strained Pt overlayers [31], an analogous trendcould be also observed for the alloys tested in this chapter. However, it will be ex-perimentally challenging to perform accurate measurements of the d-band on thesealloys. Indeed, these should be carried out after ORR testing, when the Pt-skeletonstructures are formed as a consequence of surface dealloying. The presence of Cand O contaminations and of the 4f states of the lanthanides overlapping to thed-band would highly complicate the analysis of the XPS-UPS spectra. A number oftrends based on the DFT calculated binding energies to one of the ORR intermedi-ates (HOO∗, HO∗ and O∗) have also been reported [16, 38, 47, 56, 152].
On the basis of the results of this chapter a manuscript about the trends inactivity and stability of these alloys is currently in preparation: the abstract can befound in the end of this thesis (included Paper 6). All electrochemical measure-ments have been performed by María Escudero-Escribano. DFT calculations wereperformed by Vladimir Tripkovic.

4.2 Bulk structure and Pt-Pt distance 59
4.2 Bulk structure and Pt-Pt distance
All the Pt5Ln polycrystalline alloys have been investigated by XRD in order to iden-tify their bulk structure and confirm the presence of the right phases. For mostof these alloys the XRD patterns with correspondent lattice constants have alreadybeen reported in literature. Nevertheless for a good part of them there is only asingle reference article [127]. It should be noted that in all cases these combi-nations of Pt and lanthanides lead to the formation of intermetallic compoundswhose structure is considerably different from the typical closed packed structure(face centered cubic) of pure Pt. In this sense these structures are all very differentfrom those of more widely studied alloys of Pt and and late transition metals suchas Pt3Co, Pt3Ni [36, 147], and also from the structure of Pt3Y or Pt3Sc which allexhibit closed packed structures similar to Pt [16, 98].
For the first lanthanide metals of the periodic table (La, Ce, Pr, Nd) the re-ported structure is hexagonal with the well characterized prototype of the Cu5Caphase and space group P6/mmm [127, 153]. While moving towards the right ofthe periodic table the covalent radius of the lanthanides decreases [57] and as aconsequence the unit cell of this phase contracts as indicated, in particular, by thelower a lattice constants. For alloys with most of the other lanthanides (Sm, Gd,Tb, Dy, Ho, Er, Tm,) this contraction exceeds a critical value causing the appear-ance of a different orthorhombic structure [127]. The lattice parameter a is stillthe same and it continues its contraction while moving towards lanthanides withhigher atomic number, but the b and c lattice constants are considerably differentdue to the different re-organization of the atoms. Despite the availability of theselattice constants measured by XRD, the stack of the atoms and the space group ofthis structure has not been fully characterized. However, the two structures areexpected to closely resemble each other [127].
The XRD patterns of the alloys tested in this work were found to be in agree-ment with the structures reported in [127]. In the case of Pt5Gd the two men-tioned structures (i.e. hexagonal and orthorhombic) were found to coexist [132]suggesting that this material could somehow define the boundary between thesetwo phases. The hexagonal Cu5Ca type structure for Pt5Gd was also reported pre-viously [155]. The numerical values of lattice constants also agree quite well withliterature.
In the previous chapter the enhanced ORR activity of the Pt5Ln alloys withrespect to Pt was ascribed to strain effects. In this view the catalytic propertiesare related to the level of strain in the Pt overlayer and in particular to the levelof strain of the most superficial surface atoms. This strain must be induced by theproperties of the bulk and be correlated to some of its lattice parameters. It wasrecently proposed that the Pt overlayer would predominantly consist of a closelypacked Pt layer, resembling pure Pt, with a lattice parameter imposed by the nearestneighbour Pt-Pt distance in the alloy. This idea was suggested by the DFT calcu-

60 Trends in activity and stability
Figure 4.1: Illustrative structure of a closely packed Pt monolayer on top of Pt5Ce withthe typical hexagonal (Cu5Ca prototype) unit cell (a). In (b) the Pt overlayer has beenremoved revealing the structure of Pt5Ce: this is terminated by a Pt Kagomé layer [154]resembling the structure of closed packed Pt but with vacancies corresponding to the Ceatoms underneath. In (c) the Kagomé layer has also been removed revealing a Pt and Cemixed layer. The continuous alternation of these two layers originates the bulk structure ofPt5Ce.
lations conducted on a Pt slab superimposed to the structure of Pt5La [6]. Figure4.1 helps to intuitively understand this concept by showing how different atomiclayers parallel to the (001) plane overlap with each other on this hexagonal Cu5Castructure. The alloy is basically constituted of alternating layers of pure Pt andPt and La. The pure Pt layers have vacancies at the positions where La atoms liebelow, forming a so called Kagomé layer [154]. DFT calculations suggested thata closed-packed Pt overlayer would form on this Kagomé layer by occupying itsvacancies with Pt atoms. The formation of a closely packed Pt layer on top of thesealloys is also supported by experimental evidences. It was proven on a Y modifiedPt(111) single crystal: after deposition of Y, upon annealing in vacuum, it formsa Pt-Y alloyed phase (exhibiting the structure of Pt5Y) covered by a compressedPt-skin [101, 156] (Paper 4 in the end of this thesis). In-situ STM studies of Pt-Fealloys have also exhibited the formation of a closely packed Pt overlayer, similar toPt (111), in acidic electrolyte [45].
As already anticipated, with this structure of the overlayer the Pt-Pt at thesurface of the catalyst would be defined by the nearest neighbour Pt-Pt distance inthe bulk. In the case of the Cu5Ca hexagonal structure this turns out to be half ofthe a parameter: dP t−P t = a/2. In the rest of this chapter it will be assumed thatfor the orthorhombic structure the same relationship applies. Although this cannot

4.3 Trends in activity 61
be verified due to the unknown space group, the similarity of the two structures,exhibiting the same a lattice parameter, supports this assumption. Since the aparameter decreases monotonically while moving towards lanthanides with higheratomic number, also the Pt-Pt distance in the overlayer is expected to follow thesame trend.
4.2.1 Alloys of Pt and alkaline earths
On the basis of theoretical DFT calculations [157] a new class of Pt alloys for cat-alyzing the ORR was also studied as part of this project. Alloys of Pt and alkalineearth metals such as Pt5Ca and Pt5Sr also form stable intermetallic compounds.Although their heat of alloy formation is not as negative as for the Pt5Ln alloys[158], the very low costs and vast availability of alkaline earth metals promotesthe interest towards the characterization of these materials. At the same time thereason why it is worth introducing them in this chapter comes from the fact thatthey also exhibit the same structure of Pt5La and Pt5Ce, with the typical hexagonalphase (Cu5Ca prototype) [159, 160]. The high reactivity of the alkaline earth met-als and their very negative standard reduction potentials [149] suggests that theywould also tend to dissolve from the surface of the alloy in acidic electrolytes. Thestructure of the Pt overlayer is also expected to be the same, with the Pt-Pt distancedictated by the nearest neighbour Pt-Pt distance of the bulk, as for the other alloysof this chapter dP t−P t = a/2. Under these assumptions it will be possible to directlycompare these alloys with those of the other Pt5Ln polycrystalline samples.
4.3 Trends in activity
For all the polycrystalline alloys the preparation procedure was the same as de-scribed in the experimental section of this work (see Section 2.3) and as applied tothe Pt-La and Pt-Ce alloys. Sputter-cleaning was performed in UHV conditions untilno C and O contaminations were observed. Following the cleaning procedure, thesamples were transferred first to a fast-entry air lock, vented in dry nitrogen, pro-tected by a drop of H2 saturated Millipore water and then transferred to the RRDEsetup. The electrochemical characterization was also carried out under nominallythe same conditions (see Section 2.5.1). They were cycled between 0.05 V and 1V at a sweep rate of 50 mV s−1 until stable CVs were obtained, typically 100-150cycles. Once stable CVs were obtained the catalytic activity of the electrodes wastested in O2-saturated 0.1 M HClO4. The ranking of the resulting ORR activities isplotted in Figure 4.2.
Proceeding in the order of lanthanide atomic number the following alloys weretested: Pt5La, Pt5Ce, Pt5Sm, Pt5Gd, Pt5Tb, Pt5Dy and Pt5Tm. Among these mate-rials polycrystalline Pt5Tb exhibited the highest ORR activity, exceeding the one of

62 Trends in activity and stability
0
2
4
6
8
1 0
1 2 P t 5 T b
P t 5 S r
P t 5 C a P t 5 S m
P t 5 T m
P t 5 D y
P t
P t 5 L aP t 5 C e
P t 5 G dP t 3 Y
j k at 0
.9 V /
mA c
m-2
Figure 4.2: Rank of the experimental ORR activities (kinetic current densities per geomet-ric surface area at 0.9 V vs. RHE) of various Pt5Ln alloys vs. the lattice parameter a of thealloys as determined from XRD measurements. The ORR activities of Pt5Ca and Pt5Sr andfor comparison, of polycrystalline Pt and Pt3Y, are also plotted. On the basis of the con-siderations about the ECSA of Section 3.2.2 all the specific activities have been calculatedby normalization to the geometrical surface area. Measurements and figure made by MaríaEscudero-Escribano.
Pt3Y and therefore, being the polycrystalline alloy with the highest ever reportedactivity. Its kinetic current density at 0.90 V vs. RHE is 11.2 mA cm−2 about 6 timeshigher than that of pure Pt; even more interestingly, all the reported Pt5Ln alloysshow more than a 3-fold enhancement in activity with respect to Pt. The ORR activ-ities of Pt5Ca and Pt5Sr are also very high, with a factor of 5 enhancement relativeto Pt in the case of Pt5Ca. In comparison, similarly prepared alloys of Pt and latetransition metals (Pt3Fe, Pt3Co and Pt3Ni) exhibited lower activities with about afactor of 2 enhancement [37, 73].
For most of these alloys the qualitative surface structure of the active phasesafter ORR was studied by AR-XPS. In all cases the AR-XPS depth profiles confirmedsimilar structures as the ones shown for Pt5La and Pt5Ce in Section 3.3 and inparticular in Figure 3.5 and similar to the surface structure already reported forPt5Gd [132]. The presence of a thick Pt overlayer suggests that in all cases theORR activity should be related to strain effects and, in some way, to the latticeparameters a measured in Section 4.2. In Figure 4.3 the activities of the tested

4.3 Trends in activity 63
Pt5Ln alloys are plotted as a function of the lattice parameter a, and on the topaxis, as a function of the nearest neighbour Pt-Pt distance (i.e. a/2) in the bulkof the alloys. The activity of polycrystalline Pt is also plotted for comparison byconsidering on the top axis the typical Pt-Pt distance in pure Pt. Interestingly,a volcano shape relationship appears. The activities of Pt5Ca and Pt5Sr are alsoinserted in the plot since they both exhibit the Cu5Ca type structure. Notably, theirposition fits very well into the same trend.
5 . 2 5 . 3 5 . 4 5 . 5 5 . 60
2
4
6
8
1 0
1 2
j k / m
A cm-2
Figure 4.3: Experimental ORR activity from Figure 4.2 of various Pt5Ln and Pt-alkalineearths alloys vs. the lattice parameter a of the alloys as determined from XRD measure-ments. On the top axis the nearest neighbour Pt-Pt distance in the bulk, which is assumedto define the Pt-Pt distance in the Pt overlayer, is also indicated: dP t−P t = a/2. The activityof polycrystalline Pt, referred to its typical Pt-Pt lattice distance (top axis), is also reported.Measurements and figure made by María Escudero-Escribano.
The appearance of a clear volcano trend is explained in terms of strain ef-fects. Both DFT calculations [54] and experimental results [31, 126, 132] agreeon the concept that compressive strain should weaken the binding energy of Ptto oxygenated species such as O, OH or OOH. This weakening should result in ahigher ORR activity [16, 17, 19]. In agreement with this concept, the reduction ofthe lattice parameter a in Figure 4.3, or alternatively of the derived Pt-Pt nearestneighbour distance, results in a higher ORR activity. This would explain the rightside of the volcano with activities that increase constantly until Pt5Tb. A similar re-

64 Trends in activity and stability
lationship was found by Strasser and coworkers on core-shell Pt-Cu nanoparticles[31]. Also in their case, higher levels of compressive strain in the bulk correspondto higher ORR activites: according to their considerations the presence of strainrelaxations in the Pt shell of the particles did not allow them to reach the left sideof the volcano.
It should be noted that according to DFT calculations the optimal ORR cat-alyst should bind OH ≈ 0.1 eV weaker than pure Pt [16]. This optimal bindingenergy should correspond to a compressive strain of about 2 % relative to pure Pt[31]. However, in the case of Pt5Tb the contraction of the Pt-Pt distance wouldbe approximately 6 %: this much higher level of strain supports the concept that,also in this case, strain relaxations occur in the Pt overlayer, of which only thesurface atoms are actually defining the ORR activity. It is here anticipated that ahigher level of compressive strain in the bulk of the alloy will result in a lower Pt-Ptdistance also on the surface of the overlayer, despite the presence of strain relax-ations. Under this assumption the trends in activity of Figure 4.3 would still beexplained. This view is also supported by the experimental evidences of Strasser etal. [31]: they deposited controlled amounts of Pt on a Cu(111) surface and mea-sured (by low energy electron diffraction (LEED)) substantial strain relaxations ofthe Pt overlayer for thicknesses higher than one monolayer. Clearly, establishing adirect relationship between the level of strain in the bulk and the one on the sur-face would be highly desirable. However, this would require a direct measurementof the structure of the overlayer and in particular of the Pt-Pt distance: the verylimited thickness of the overlayer suggested by the AR-XPS measurements highlycomplicates such measurement. The polycrystalline nature of these samples makesit even more challenging since no diffraction techniques as XRD or LEED can beeffectively employed. Ongoing synchrotron measurements are trying to elucidatethese aspects on a Y modified Pt(111) single crystal [101]. The last part of thischapter, trying to quantify the thickness of the Pt overlayer for different alloys,might also contribute to elucidate this complex relationship. At the same time cur-rent theoretical models and DFT calculations are trying to answer some of theseimportant questions.
The reason why the activity of Pt5Dy and Pt5Tm does not follow the sametrend is also uncertain. One possible explanation is related to an excessively lowPt-Pt distance in the overlayer, exceeding the compressive strain of the optimalPt catalyst. In this sense, these catalysts would effectively lie on the left side ofthe volcano. However, another possible theory could hold; it is anticipated thatbeyond a certain level of strain the closely packed structure of the Pt overlayercould intrinsically be unstable. This might lead to a further reorganization of thesurface atoms and to a Pt-Pt distance that would collapse towards a lower level ofstrain.

4.4 Trends in stability 65
4.4 Trends in stability
0
2
4
6
8
1 0
1 2
P t 5 T mP t 5 C e
j k / m
A cm-2
P t
P t 5 L a
P t 5 G dP t 5 T b
C o m p r e s s i v e s t r a i n
Figure 4.4: ORR activity expressed in terms of kinetic current density at 0.9 V vs. RHEfor some Pt5Ln polycrystalline alloys and polycrystalline Pt. The activities are reported bothbefore and after stability test consisting of 10 000 cycles between 0.6 and 1.0 V vs. RHE in anO2-saturated 0.1 M HClO4 electrolyte at 100 mV s−1. The arrow indicates increasing levelof compression in the Pt overlayers. Measurements and figure made by María Escudero-Escribano.
After measuring the ORR activities, accelerated stability tests were conductedon the alloys by applying the same standard protocol as for Pt5La and Pt5Ce (seeSection 2.5.1). The electrodes were subjected to 10 000 consecutive cycles between0.6 and 1.0 V vs. RHE in an O2-saturated 0.1 M HClO4 electrolyte at 100 mVs−1.Figure 4.4 reports the measured ORR activities before and after stability test. Thevarious alloys have been placed in the same order as in Figure 4.3, hence the alattice parameter is smaller for the alloys on the left and their Pt overlayers areexpected to be more contracted. While the activity losses of Pt5La and Pt5Ce arevery low (within 10 %) as already shown in Chapter 3, Pt5Gd loses in average14% of its initial activity. Even higher losses occur in the case of Pt5Tb and Pt5Tm,although these data are preliminary and only obtained from a single measurement.In general it looks like Pt5Ln alloys with a higher level of contraction and highercompressive strain in the Pt overlayer are less stable. Intuitively, this trend couldbe explained by the fact that more compressed Pt overlayers might be intrinsically

66 Trends in activity and stability
less stable.
In order to better understand this trend in stability DFT calculations wereperformed. The stability of the Pt overlayer is quantified in terms of dissolutionpotentials vs. RHE: these are plotted in Figure 4.5 for various Pt5Ln alloys. Thesurface of the Pt5Ln alloys is modeled as strained Pt slab (Pt overlayer), with a levelof strain induced by the experimental lattice constants of the bulk (see Figure 4.3).This strained Pt overlayer is represented by periodically repeated slabs separatedby at least 12 Å of vacuum. The unit cell size of Pt was 2 × 2 atoms large and 4 to5 layers thick. Two bottom layers were kept fixed, while the remaining atoms canrelax, allowing to assume their minimum energy positions. When the total energiesof the two slabs (with 4 and 5 layers respectively) are subtracted from each other,the resulting energy corresponds to a single layer of Pt atoms in the bulk. For non-strained Pt this energy corresponds to a dissolution potential at standard conditionsof 1.23 V, taken as a benchmark value. The differences in energy in the case ofstrained Pt slabs are referred to this benchmark value. It should be noted that thepurpose of this comparison is to illustrate a stability trend and these values shouldnot be directly interpreted as the experimental dissolution potentials.
Figure 4.5: Stability of the Pt overlayers as a function of lattice strain in Pt5Ln alloys(percentage compressive strain in the overlayer relative to pure Pt), as predicted by DFTcalculations. The stability is indicated in terms of dissolution potentials vs. RHE. The Ptoverlayers are modeled as a strained Pt slab using experimental values for the lattice param-eters. Calculations and figure made by Vladimir Tripkovic.
Figure 4.5 clearly shows that the stability of these overlayers decreases whenhigher levels of compression are applied. The more strained the Pt overlayer is, the

4.5 Model for the Pt overlayer thickness 67
faster the relaxation of its structure and the formation of defects. If this trend wasconfirmed by further measurements this would be quite unfortunate; it would meanthat it is not possible to enhance both the activity and stability by tuning the Pt-Ptdistance. An independent optimization of these properties would be impossible,since the trends in activity and stability go in opposite directions a compromiseshould be found. Taking into account both the activity and stability behaviour ofthese candidates, Pt5Gd exhibits the best compromise, being more than 4 timesmore active than pure Pt after stability test.
4.5 Model for the Pt overlayer thickness
The previous section enlightened how important a precise knowledge of the physi-cal properties of the Pt overlayer is. A direct measurement of the crystal structureand in particular of the nearest neighbour Pt-Pt distance in the overlayer would behighly desirable. By quantifying the level of strain relaxation relative to the bulk ofthese alloys, it would probably allow to directly relate the strain to the enhancedactivity and to enable a comparison with theoretical DFT calculations: more preciseexplanations to the appearance of the volcano shape of Figure 4.3 could be found.
As apparent from the previous section, the thickness of the Pt overlayer alsocarries important information. As suggested by the experiments on Pt overlayersover a Cu(111) single crystal [31], it is expected to define the level of strain re-laxation of the overlayer and as a consequence the activity of these polycrystallinealloys. The observed thickening of the Pt overlayer after stability tests (see Figure3.5) might also explain, to a good extent, the ORR activity loss during potentialcycling. Most importantly, the thickness of the Pt overlayer is the result of the deal-loying process: differences in the Pt overlayer thickness for different alloys mightprovide notions about its mechanisms and help to establish principles for confiningthis process and improve the long term stability of these samples. Although thefitting algorithm used for the AR-XPS depth profiles (see Section 2.2.5) provides aqualitative image of the surface structure, a proper quantification of the overlayerthickness requires precise explicit approximations. Herein, a simple model basedon the basic equation for XPS quantification (equation 2.2) is introduced, with theparticular aim of estimating the Pt overlayer thickness for different alloys. In thisway the simple approximations and involved assumptions can be varied in order todemonstrate the consistency of the method and to ensure more quantitative results.
4.5.1 Single overlayer
The method for the estimate of the thickness of a single layer over a substrate ofa different material from AR-XPS measurements is well established in literature[112]. Starting from the basic equation for the intensity of the XPS signal from a

68 Trends in activity and stability
Figure 4.6: Sketch of a single overlayer (element A) of thickness d on top of an infinitelythick substrate (element B). The emitted photoelectrons are emitted along straight lines withan angle θ with respect to the surface normal.
certain orbital of element A (see equation 2.2):
IA = σA (hν) T
EA
Φ
∫
z
NA (z) e
−z
λ
EA
cos (θ) dz, (4.1)
the integral over the depth z easily allows to take into consideration the presenceof a layered structure. It is convenient to define the XPS intensity generated by ahomogeneous infinitely thick layer as:
I∞A = σA (hν) T
EA
ΦNAλA
EA
cos (θ) , (4.2)
where it should be noticed that a subscript has been added to the mean free pathλA
EA
: since the materials will not in general be homogeneuos, this expressionwill indicate the mean free path of the photoelectrons from element A travelingthrough element A. Considering now the presence of a single overlayer (elementA) of thickness d over an infinitely thick substrate (element B) as in Figure 4.6 andassuming the layers to be uniform and flat, their XPS intensities become:
IA = I∞A
1− e
−d
λA
EA
cos (θ)
(4.3a)
IB = I∞B
e
−d
λA
EB
cos (θ)
. (4.3b)
These equations can be seen as if the terms in parentheses modified (reduced)the intensity of some infinitely thick layers I∞A and I∞B respectively. In the first

4.5 Model for the Pt overlayer thickness 69
case (equation 4.3a), this reducing factor takes into account the finite thicknessd of the A layer. In the second case (equation 4.3b), the factor represents theattenuation that a signal from an infinite layer B experiences due to the scatteringevents occurring through the layer A. It should be noticed that, if the values of I∞Aand I∞B are known, and the mean free paths are estimated through one of the semi-empirical formulas mentioned in Section 2.2.4, each of equations 4.3a and 4.3bcan provide an estimate of d. In practice it is usually more convenient to measurethe ratio of the intensities:
IA
IB=
I∞AI∞B
1− e
−d
λA
EA
cos (θ)
e
−d
λA
EB
cos (θ)
. (4.4)
By doing so, all the material independent terms of the equation like the photonflux Φ will cancel out. Furthermore the final value of d will now depend on therelative values of I∞A and I∞B instead of their absolute values whose uncertainty ismuch higher. More importantly, the absolute values of I∞A and I∞B can be measuredon reference samples as already described in method 2 of Section 2.2.2, but thesemeasurements are not always practical. Alternatively, the ratio I∞A /I
∞B can be easily
calculated from Scofield cross sections or Wagner sensitivity factors as in method 1and method 3.
If the orbitals of element A and B can be properly chosen, so that the kineticenergies EA ≈ EB and λA
EA
≈ λA
EB
equation 4.4 can be simplified. Thus thethickness d can be written in the explicit form:
d = λA
EA
cos (θ) ln
1−IA/I
∞A
IB/I∞B
. (4.5)
It is sometimes convenient to write this equation in the form:
ln
1−IA/I
∞A
IB/I∞B
=d
λA
EA
cos (θ), (4.6)
so that the quantity on the left can be plotted in a graph as a function of 1/(λA
EA
cos (θ))for measurements taken at different angles θ : the slope of the graph will representthe estimate of d.
4.5.2 Polycrystalline alloys
In the case of polycrystalline alloys the structure is more complicated, but the de-scribing equations are based on the same principles as in the previous section. After

70 Trends in activity and stability
electrochemical measurements a pure Pt overlayer of thickness d is imposed overa bulk alloy indicated in general as PtnMm: where M will typically stand for one ofthe lanthanide metals of this chapter. Organic contaminations mainly consisting ofC, O and H are taken into account as a further overlayer of thickness t. All threelayers are assumed to be uniform and flat as illustrated in Figure 4.7.
Figure 4.7: Sketch of typical layered structure of a PtnMm alloy after ORR activity test. Alayer of C, O and H contaminations (C-O-H layer) of thickness t lies on top of all samples.This is followed by a pure Pt overlayer of thickness d over an infinitely thick bulk alloy withstoichiometry PtnMm. The emitted photoelectrons are emitted along straight lines with anangle θ with respect to the surface normal.
The information about the thickness of the Pt overlayer d will be provided bythe signals of Pt and M. These will be expressed as:
IP t =
I∞P t,allo y
e
−d
λP t(EP t) cos (θ)
+ I∞P t
1− e
−d
λP t
EP t
cos (θ)
A (4.7a)
IM =
I∞M ,allo y
e
−d
λP t
EM
cos (θ)
B, (4.7b)
where the terms I∞P t,allo y and I∞M ,allo y represent the XPS intensities of Pt and Mrespectively from an infinitely thick PtnMm alloy; both these terms are attenuatedin parentheses by the presence of the Pt overlayer. The second term in the sumof 4.7a represents the contribution to the Pt signal from the Pt overlayer. Theconstants A and B take into account the attenuation of the two signals in the C-O-H

4.5 Model for the Pt overlayer thickness 71
contamination layer, and are respectively equal to:
A= e
−t
λCOH
EP t
cos (θ) (4.8a)
B = e
−t
λCOH
EM
cos (θ) , (4.8b)
with λCOH representing the mean free path of the electrons in the C-O-H layer. Ingeneral the parameters A and B are expected not to affect dramatically the values ofd. Indeed, A and B only differ for the values of the mean free paths that will also besimilar as long as we can choose EM ≈ EP t ; meaning that they will to a good extentcancel out when considering the intensity ratio IP t/IM . It should be noticed that thecontaminations are mainly due to water and adsorbed organic species whose massdensity is very low in comparison with the one of Pt. This means that the mean freepaths of the electrons traveling through this layer will be rather high and that theattenuation factors A and B will not usually be much lower than 1: most of all whenthe samples are treated carefully and readily transferred between the XPS systemand the EC cell. In these cases the amount of contamination does not vary abruptly,typically corresponding to a thickness of 4-12 Å. The estimate of these values andthe influence of t on the determination of the Pt overlayer thickness d when theapproximation EM ≈ EP t is not verified will be discussed later for a particular case(see Section 4.5.3).
In order to solve equations 4.7a and 4.7b and determine d the crucial pointis the choice of the three quantities: I∞P t , I∞P t,allo y and I∞M ,allo y . These are explicitlydefined as:
I∞P t = σP t (hν) T
EP t
ΦNP tλP t
EP t
cos (θ) (4.9a)
I∞P t,allo y
= σP t (hν) T
EP t
ΦN P t,allo y
λallo y
EP t
cos (θ) , (4.9b)
I∞M ,allo y
= σM (hν) T
EM
ΦN M ,allo y
λallo y
EM
cos (θ) . (4.9c)
Since I∞P t and I∞P t,allo y are related by the simple relation:
I∞P t =
NP tλP t
EP t
N P t,allo y
λallo y
EP t
I∞P t,allo y
= C I∞P t,allo y
, (4.10)
with the definition of this coefficient C , whose terms are known or easily estimated,two quantities are sufficient for calculating d: for instance I∞P t,allo y and I∞M ,allo y . Asin the case of a single overlayer (see Section 4.5.1) employing the ratio IP t/IM

72 Trends in activity and stability
allows to simplify the calculation and cancel the material independent terms:
IP t/I∞P t,
allo y
IM/I∞
M ,allo y
=
e
−d
λP t(EP t) cos (θ)
+ C
1− e
−d
λP t
EP t
cos (θ)
e
−d
λP t
EM
cos (θ)
A
B, (4.11)
which is the relevant formula for the numerical determination of d. Also in thiscase, if the energies of the Pt and M XPS peaks can be chosen so that EM ≈ EP t ,then A≈ B and the other exponentials in equation 4.11 are all similar: substitutingthem by the term x , equation 4.11 can be written in a more compact form.
R? =
IP t/I∞P t,
allo y
IM/I∞
M ,allo y
=x + C (1− x)
x, (4.12)
with the definition of this ratio of normalized intensities R? including all the neces-sary XPS data. This expression leads to:
ln
1+1
C
1− R?
=d
λP t
EP t
cos (θ). (4.13)
Equation 4.13 allows to explicitly write the expression of d and to plot the leftterm as a function of 1/(λP t
EP t
cos (θ)): the slope of this graph represents thethickness d, similar to the single overlayer case 4.5.1.
As already mentioned, the last requirement for the calculation of d is the ac-tual determination of the terms I∞P t , I∞P t,allo y and I∞M ,allo y (equations 4.9a-4.9c). Byemploying the three quantification methods described in 2.2.2 to determine thesequantities, three different approaches can be distinguished. Since the approxima-tions and assumptions involved in the methods are substantially different, two ofthese possibilities will be introduced in the following paragraphs.
Method 1. Scofield sensitivity factors
With this choice the theoretical Scofield cross sections σ can be easily found inliterature and substituted in the expressions 4.9a-4.9c. Of the remaining terms,Φ and cos (θ) are element independent and they cancel out when calculating theratio IP t/IM . The transmission function T is known, the atomic densities N can beeasily calculated from the known structures of Pt and of the polycrystalline alloys

4.5 Model for the Pt overlayer thickness 73
and the mean free paths λ can be estimated by the TPP-2M or the Cumpson-Seahsemi-empirical formulas of Section 2.2.4.
The main limit of this theoretical approach is the uncertainty on the crosssections σ, both due to the intrinsic limits of the theoretical models and, mostimportantly, to the experimental difficulties of choosing backgrounds and energyranges correctly. In the case of lanthanide metals this issue is even more importantas a number of satellites might arise from the interactions with the f orbitals (seeSection 3.3) and the choice of backgrounds and energy ranges is to some extentarbitrary. The importance of this point is highlighted when the XPS measurementstaken on sputter-cleaned polycrystalline alloys are considered. The measured Ptto M ratios quite often differ from the expected nominal ratios of the alloys. Theappearance of the correct XRD patterns suggests that in the bulk of the alloys thecomposition is quite close to the nominal one. Apart from the mentioned uncer-tainty on the cross sections and on the definition of the proper XPS intensities, thesediscrepancies could also be related to a surface effect: in particular, they might beproduced by preferential sputtering of the elements Pt and M during the cleaningprocedure. It should be noticed that AR-XPS experiments usually did not showany clear angular dependency of the Pt to M ratios after sputter-cleaning (see forinstance Figure 3.5 a,b), suggesting that the surface composition is uniform aftercleaning.
For the purpose of this section (i.e. determining the thickness of the Pt over-layer) it is important to keep in mind two possibilities. If these discrepancies onsputter-cleaned samples are related to a real surface enrichment (e.g. due to prefer-ential sputtering) this method will still successfully describe the alloy after electro-chemical measurements. Indeed the estimate of d will not incorporate any infor-mation from the XPS measurements acquired during sputtering. On the contrary,if these discrepancies are due to errors in the cross sections or in the backgroundsubtraction, they will result in an underestimate (or overestimate) of d: dependingon the fact that the measured ratios on sputter-cleaned samples are respectivelylower (or higher) than the nominal ratio.
Method 2. Measured sensitivity factors
The idea of this second approach is to avoid using tabulated data of sensitivity fac-tors and substitute them with experimental values. The choice of the sensitivityfactors, however, is original of this work and it comes from the observation that thevalues I∞P t,allo y and I∞M ,allo y are exactly the XPS intensities of Pt and M measured ona sputter-cleaned alloy. This is true under the assumption that the sputter-cleanedsamples are effectively representing a homogeneous alloy with the correct nomi-nal stoichiometry: basically the opposite assumption of method 1. In this sense,the two methods complement each other because in this case, a real surface en-richment of one element would lead to an incorrect estimate of d but no errors in

74 Trends in activity and stability
the estimate of the cross sections or in the definition of the backgrounds can eas-ily occur. Furthermore, the measurement of the sensitivity factors is considerablyeasier then on clean foils, due to the difficulties of cleaning foils of lanthanides forinstance, due to their high reactivity and oxophilicity. Furthermore, the Pt and Msignals are measured under exactly the same conditions (e.g. same photon flux andexact same geometry of the XPS setup) that would be harder to reproduce whenmeasuring on different reference samples.
The third necessary parameter is I∞P t that could also be measured on a cleanPt reference sample. However, in order to maintain the simplicity of this methodand avoid the introduction of further experimental errors a different approach waschosen. Namely, I∞P t was directly derived from the value of I∞P t,allo y according toequation 4.10. Consistent to the previous choice, the assumption here is that theatomic concentration in the alloy NP t,allo y is the one expected from a PtnMm stoi-chiometric compound.
4.5.3 Test on Pt5Gd
In this section the model will be applied to the particular case of Pt5Gd in order toelucidate the fitting procedure and to verify some of the involved assumptions: inparticular, the two quantification methods will be tested in order to find the mostreliable. The choice of this polycrystalline alloy is related to the fact that in termsof activity and stability it is probably the most promising material reported in thiswork and a particularly extensive characterization was performed. Furthermore,from an XPS point of view it represents a good model case as it allows to chooseat least two XPS peaks for quantification: Gd 4d at a binding energy ≈ 141 eV andGd 3d5/2 at ≈ 1187 eV. This will not be always the case for the other lanthanidesdue to the low intensity of some core level peaks and their overlap with the Ptpeaks. The kinetic energies E of the photoelectrons from the Gd 4d and Gd 3d5/2core levels are also very different: ≈ 1341 eV and ≈ 295 eV respectively. In thecase of Pt, the Pt 4f peak was always chosen: binding energy ≈ 71 eV and kineticenergy ≈ 1411 eV. The distance in energy of the Gd 4d and Gd 3d5/2 is importantfor verifying the validity of the model at different energies. Indeed, it will alwaysbe easier and the model will in general work better, when quantifying the Pt to Gdratios using the Gd 4d peak, since the condition EP t ≈ EGd is verified and some ofthe energy dependent terms of equation 4.11 (e.g. the coefficients A and B) willtend to cancel. Furthermore the effect of errors in the estimate of the mean freepath from the TPP-2M or the Cumpson-Seah formulas will be minimized. It shouldbe noted that the Gd 3d5/2 peak, with such low kinetic energies, represents anextreme case and it will only be employed in this section for the purpose of testingthe range of applicability of the model.
Starting from the initial preparation, the Pt5Gd sample was cleaned in UHVfollowing the same sputter-cleaning procedure described in 2.3 and normally ap-

4.5 Model for the Pt overlayer thickness 75
2 9 0 2 8 8 2 8 6 2 8 4 2 8 2 2 8 03 4 0
3 6 0
3 8 0
4 0 0
4 2 0
Coun
ts/s
1 2 0 0 1 0 0 0 8 0 0 6 0 0 4 0 0 2 0 0 0
Int
ensity
(a.u.
)
B i n d i n g e n e r g y / e V
8 2 8 0 7 8 7 6 7 4 7 2 7 0 6 8 6 60
1 0 0 0
2 0 0 0
3 0 0 0
4 0 0 0
Coun
ts/s
1 5 6 1 5 2 1 4 8 1 4 4 1 4 0 1 3 6 1 3 24 0 0
4 4 04 8 05 2 05 6 06 0 0
Coun
ts/s
1 2 0 0 1 1 9 4 1 1 8 8 1 1 8 2 1 1 7 61 0 0 0
1 2 0 01 4 0 01 6 0 01 8 0 02 0 0 02 2 0 0
Coun
ts/s
G d 3 d 5 / 2 G d 4 d P t 4 f
5 4 0 5 3 8 5 3 6 5 3 4 5 3 2 5 3 0 5 2 8 5 2 67 4 07 6 07 8 08 0 08 2 08 4 0
Coun
ts/s
O 1 s
Gd 4p
3/2
Pt 4p
1/2
Pt 4p
3/2
Pt 4s
O 1sGd
3d3/2
Gd 3d
5/2
Pt 4d C 1
s
Gd 4d
Pt 4f
C 1 s
Figure 4.8: Overview XPS spectrum of the Pt5Gd polycrystal after sputter-cleaning (as-prepared), with assignment of the main peaks. In the insets, the detailed spectra usedfor general quantification purposes are shown, with the typical choice of backgrounds andenergy ranges.
plied before EC measurements. An overview XPS spectrum was acquired togetherwith detailed AR-XPS spectra of the peaks Pt 4f, Gd 4d, Gd 3d5/2, O 1s and C 1s.Figure 4.8 shows the overview spectrum with details of the relevant peaks andthe typical choices of energy ranges and backgrounds. Small signals from O andC raised during the time needed for the measurements, probably due to the highreactivity of the exposed Gd atoms: overall these signals still accounted for lessthan 2 %. The XPS intensities of the Pt 4f, Gd 4d (or Gd 3d5/2) will determine thequantities I∞P t,allo y and I∞Gd,allo y when applying method 2 to the solution of equation4.11, as described in 4.5.2.
Following these measurements the sample was transferred to the electrochem-ical setup and normal ORR activity tests were carried out as described in Section2.5.1. Soon after electrochemistry new detailed AR-XPS measurements were takenin the same energy regions: energy ranges and backgrounds were chosen con-sistently in order to determine the IP t/IGd ratio in equation 4.11. The overviewspectrum did not show other contaminations apart from increased amounts of Cand O.
The Pt to Gd atomic ratios were determined for the sample as-prepared and

76 Trends in activity and stability
# # # # # # # # # #
"
""
" ! !
G d 3 d 5 / 2
G d 4 d
# # # # # # # # # #
!
G d 3 d 5 / 2 " " " $
""
"
! !
G d 4 d " " " $
( a ) ( b )
Figure 4.9: Pt to Gd XPS ratios obtained by application of method 1 (i.e. Scofield crosssections) as a function of the electron emission angle. The ratios were measured choosingeither the Gd 4d peak (black squares) or the Gd 3d5/2 peak (red circles). Data for the sputter-cleaned as-prepared Pt5Gd alloy are shown on the left (a): on the right (b) ratios after ORRactivity test.
after ORR activity test as a function of the emission angle by choosing Scofieldcross sections (method 1 in Section 2.2.2): the values are plotted in Figure 4.9 a.Both choosing the Gd 4d peak and the much more surface sensitive Gd 3d5/2 noclear angular dependence can be observed on the clean sample, suggesting that nopreferential sputtering occurred. The homogeneity of the sample is also supportedby the fact that Gd 4d and Gd 3d5/2 peaks predict a very similar composition despitetheir different surface sensitivity. It should be also noticed that the measured ratiosare slightly higher than the nominal ratio of 5 expected for Pt5Gd: about 6.1 inthe case of Gd 4d and 5.7 in the case of Gd 3d5/2. As already mentioned similar oreven bigger discrepancies were often noticed when applying Scofield cross sections.After electrochemistry in Figure 4.9 b the atomic ratios increased considerably as aconsequence of the Pt overlayer formation. The particularly high ratios measuredin the case of Gd 3d5/2 are also in agreement with the higher surface sensitivity atthese low kinetic energies.
Definition of the C-O-H contamination layer
The solution of equation 4.11 still requires a choice of the parameter t represent-ing the thickness of the contamination layer. In order to have the most preciseestimate of the amount of C and O contaminations and determine t to be insertedin the attenuation coefficients A and B (equations 4.8a and 4.8b), two alternativeapproaches were used.
A very mild sputtering of the surface was performed by using He ions at low

4.5 Model for the Pt overlayer thickness 77
energy of 300 eV at a total ion current of 400 nA rastered over a large area of 6 mm× 6 mm. The choice of light ions and low energies allows to preferentially lowerthe sputter yield of Pt with respect to those of lighter atoms as O and C [113], fa-cilitating the removal of contaminations without drastically affecting the structureof the alloy. After 30 minutes of treatment the amount of surface contaminationswas substantially reduced from about 43 % to 4%, while the Pt to Gd ratio didnot exhibit significant changes indicating a negligible removal of Pt atoms from theoverlayer. By considering the ratio of Pt 4f XPS intensities (or Gd 4d intensities)before and after this cleaning procedure, the level of attenuation of the Pt signal(or Gd signal) due to the C-O-H layer is measured for all the angles: equation 4.8aand 4.8b allow to estimate the thickness t independently for the attenuation of Ptand Gd. Since the C-O-H layer is mainly composed of adsorbed water and organiccontaminations an average mass density of 1 mg cm−3 was chosen for the estimateof the electron mean free paths; with this assumption the TPP-2M formula gaveλCOH
EP t
= 35.6 Å for the Pt 4f electrons and λCOH
EGd
= 34.1 Å for the Gd4d electrons. The estimated thickness were t = 6.7 ± 0.5 Å from the Pt 4f signaland t = 6.2 ± 3.0 Å from the Gd 4d signal. As in the rest of this section the errorswere estimated from the standard deviation of measurements at different angles,the higher uncertainty in the case of Gd is due to the much lower intensity of theGd 4d signal. These values are consistent with a contamination layer consisting ofa few adsorbed monolayers of water and organic impurities.
Although maybe more reliable the method described so far is not practicalfor a general estimate of the amount of contaminations and of the thickness t ofthe C-O-H layer which should be directly derived from the AR-XPS measurementswithout the addition of such particular cleaning procedure. The quantity t willin general be derived from the XPS intensities of C, O and Pt with the following

78 Trends in activity and stability
equations:
IP t
IC=
I∞P t
e
−t
λCOH
EP t
cos (θ)
I∞C
1− e
−tC
λCOH
EC
cos (θ)
(4.14a)
IP t
IO=
I∞P t
e
−t
λCOH
EP t
cos (θ)
I∞O
1− e
−tO
λCOH
EO
cos (θ)
, (4.14b)
where IC and IO are the XPS intensities from the C 1s and the O 1s XPS peaks. Withthe same considerations of Section 4.5.2 the exponential on top defines the atten-uation of the Pt signal through the C-O-H layer while the one in the bottom is theC or O signal produced by a layer of C and O respectively: tC and tO are defined asthe thicknesses of C and O under the simplifying assumption that they are spatiallyseparated, hence t = tC + tO. Also in this case the mass density is taken as 1 mgcm−3 for both the C and the O parts, which means that in terms of attenuation ofthe Pt signal the two layers will have the same effect. The constants I∞P t,allo y , I∞Oand I∞C are calculated from their definition (see equation 4.2) by using the Scofieldcross sections of Pt, C and O. Once these parameters are known, equations 4.14aand 4.14a can be combined in order to determine tC and tO and consequently, t.For the particular case under study, this model predicted tC = 4.5 Å and tO = 3.4 Åso that t = 7.9 Å: a value which is reasonably close to the value of 6.7 Å measuredwith the previous approach. To summarize, equations 4.14a and 4.14b will be gen-erally used to calculate the value of t, however in this particular case the value oft = 6.7 Å will be chosen for the following considerations.
Test of method 1.
Now that all the parameters have been determined, equation 4.11 allows to esti-mate the thickness of the Pt overlayer. Starting from method 1 and the choice ofScofield cross sections for quantification, Figure 4.10 reports the calculated thick-nesses d of the Pt overlayer for Pt5Gd after ORR. All electron mean free paths wereestimated from the TPP-2M formula. In order to check the influence of differentlevels of contaminations, different values of t have been chosen and are shown on

4.5 Model for the Pt overlayer thickness 79
0 1 2 3 4 5 6 7 8 96
7
8
9
1 0
1 1
1 2
G d 3 d 5 / 2
G d 4 d
Figure 4.10: Thickness d of the Pt overlayer as calculated by method 1 for different valuesof t (thickness of the C-O-H contamiantion layer). The calculation was made both choosingthe Gd 4d (black squares) and the Gd 3d5/2 (red circles) XPS intensities. Error bars are takenas the standard deviation of the values calculated at 12 different emission angles between21 and 65.
the x axis: the estimated value of t = 6.7 Å in particular was also chosen. As in therest of these calculations the error bars have been taken as the standard deviationof the thickness calculated at 12 different emission angles between 21 and 65
from the surface normal. All calculated thicknesses are between 8 and 11 Å whichis in the same range as those predicted by the angle-resolved profiles reported be-fore for Pt5Gd [132]. As expected, different values of t have almost no influenceon the Pt overlayer thickness when the Gd 4d peak is chosen for quantification: thisis because EP t ≈ EGd . However, in the case of Gd 3d5/2 an approximately lineardependence is observed and the values of d vary considerably, complicating a pre-cise quantification. For this reason, XPS peaks with lower binding energies will beusually preferred. More importantly, when focusing on the relevant values of t ≈6.7 Å, the choice of the two Gd peaks leads to quite different estimates: d ≈ 11.0 Åfor Gd 4d and d ≈ 8.7 Å for Gd 3d5/2. This discrepancy could in principle be due toinaccuracies in the estimate of the electron mean free path at such different kineticenergies. In the present work a different interpretation is suggested.
As mentioned in Section 4.5.2 this first method assumes that the theoreticalScofield cross sections are correct and consistent with the experimental choice ofXPS intensities. In other words, this would mean that in Figure 4.9 a the measuredratios (6.1 in the case of Gd 4d and 5.7 in the case of Gd 3d5/2) differ from the sto-ichiometric ratio of 5 due to a real Pt enrichment at the surface. Figure 4.11 shows

80 Trends in activity and stability
how the thickness d varies from the original values under a different assumption:the Scofield cross sections are now considered as inaccurate and they have beencorrected in order to produce the stoichiometric ratio of 5 on the as-prepared sam-ple.
0 1 2 3 4 5 6 7 8 96
7
8
9
1 0
1 1
1 2
G d 3 d 5 / 2
G d 4 d
Figure 4.11: Thickness d of the Pt overlayer for different values of t (thickness of the C-O-H contamination layer). The originally calculated values (dotted lines) have been correctedby assuming that Scofield cross sections are inaccurate (full lines): Scofield cross sectionshave been modified in order to provide a Pt to Gd ratio of 5 in the measurements on asputter-cleaned sample (see Figure 4.9 a).
With this correction, the two lines corresponding to the Gd 4d and the Gd3d5/2 peaks move down and predict smaller thicknesses, particularly in the case ofthe Gd 4d peak which is less sensitive to the presence of contaminations but moresensitive to errors in the quantification of the Pt to Gd ratios. The two lines nowcross each other at a value of t ≈ 4.5 Å, reasonably close to the estimated value6.7 Å. Most importantly at t = 6.7 Å the choice of the two peaks lead to a similarestimate of the Pt thickness, within the experimental uncertainty: d ≈ 9.1 Å andd ≈ 8.2 Å respectively. This is a further evidence of the fact that the measureddiscrepancies from the measured ratios on sputter-cleaned samples are mainly dueto inaccuracies in the Scofield cross sections or in their association to the measuredintensities. This also suggests that method 1 does not provide the best estimate ofthe Pt overlayer thickness and that method 2 should be preferred.

4.5 Model for the Pt overlayer thickness 81
0 1 2 3 4 5 6 7 8 96
7
8
9
1 0
1 1
1 2
G d 3 d 5 / 2
G d 4 d
Figure 4.12: Thickness d of the Pt overlayer as calculated by method 2 for different valuesof t (thickness of the C-O-H contamiantion layer). The calculation was made both choosingthe Gd 4d (black squares) and the Gd 3d5/2 (red circles) XPS intensities. Error bars are takenas the standard deviation of the values calculated at 12 different emission angles between21 and 65.
Test of method 2.
The results of the application of method 2 to equation 4.11 are shown in Figure4.12. The assumption here is to have homogeneous stoichiometric alloys after thesputter-cleaning procedure so that the terms I∞P t,allo y and I∞M ,allo y can be directlymeasured. In this sense the correction applied to method 1 is already included;therefore it is not surprising that the calculated thicknesses are similar to thoseof Figure 4.11. At the value of t = 6.7 Å the thickness of the Pt overlayer issimilar for the choice of Gd 4d and Gd 3d5/2 peaks: d ≈ 9.0 Å and d ≈ 8.7 Årespectively. This indicates that the method can be applied over a wide range ofkinetic energies: a property that will be particularly important when comparingthe thicknesses of the Pt overlayer for different alloys with lanthanide XPS peaksin different energy positions. The estimated thickness of the C-O-H layer seemsto be reasonable and the energy dependence of the TPP-2M electron mean freepaths seem to provide consistent results. Compared to method 1, the error bars areslightly broader, probably due to the fact that experimental values are also used forthe quantities I∞P t,allo y and I∞M ,allo y , adding further experimental uncertainty to theestimate.
Since this method seem to give the best estimates of d, it will be also employedto verify two more conditions. In Figure 4.13 the TPP-2M formula, employed so

82 Trends in activity and stability
far, is compared to the Cumpson-Seah formula for the estimate of the electronmean free paths. A decrease in the estimated thicknesses can be easily observedin all cases. This is just a consequence of the fact that the Cumpson-Seah formulapredicts in general lower electron mean free paths [112]. However the decreaseis very similar in all cases, always leading to ≈ 15% lower values of d, indicatingthat the energy dependence of the formula is very similar for both TPP-2M andCumpson-Seah expressions. Since the main interest of this work is to compare thethickness of the Pt overlayers for different alloys, the choice of the two formulas willbasically be equivalent and only the TPP-2M formula will be used in the following.
0 1 2 3 4 5 6 7 8 96
7
8
9
1 0
1 1
1 2
G d 3 d 5 / 2
G d 4 d
λ
Figure 4.13: Thickness d of the Pt overlayer as calculated by method 2 for different valuesof t (thickness of the C-O-H contamiantion layer). Results from the use of the TPP-2Mformula (dotted lines) and of the Cumpson-Seah formula (full lines) are compared.
A final test of this method concerns the quality of the fit; in Section 4.5.2it was shown how equation 4.11 can be simplified to equation 4.13 under theassumption of EP t ≈ EGd . In Figure 4.14 the left side of equation 4.13 is plotted vs.1/
λP t
EP t
cos (θ)
, which should give a linear relationship with a slope equalto thickness d of the Pt overlayer. Clearly, with the choice of the Gd 3d5/2 peakthe assumption is not verified and a simple line does not fit well the experimentalpoints. In particular, the intercept of the line lies far above the origin of the graphand the estimated value of d = 14.9 Å is far from the values presented above.Contrarily, the approximation works quite well in the case of the Gd 4d peak. Themeasured points lie on a line approximately crossing the origin of the axis and theestimated thickness of the Pt overlayer is d = 9.8 Å, which only slightly higher thanthe values of Figure 4.12. Figure 4.14 also shows that at very high emission anglesthe model fails. This is probably due to the presence of elastic scattering effects[112] and to the difficulties in achieving an accurate quantification of the XPS

4.6 Thickness of the Pt overlayers 83
intensities that become very low in these conditions, particularly for the stronglyattenuated Gd peaks. This is also the reason why the angles over 65 have beenomitted in the linear fit and for all the quantification purposes of this work.
0 . 0 0 . 1 0 . 2 0 . 3 0 . 40
1
2
3
4
5
ln [1+
(1-R∗ )/C
]
1/(λ θ)
G d 3 d 5 / 2
G d 4 d
Figure 4.14: Plot of the results from method 2: if the approximation EP t ≈ EGd is verified alinear relationship should hold between the left term of equation 4.13 on the y axis and thequantity 1/
λP t
EP t
cos (θ)
on the x axis. The experimental points for the Gd 4d (blacksquares) and for the Gd 3d5/2 (red circles) peaks are plotted with their linear fit representedby the blue lines. Grey and pink points represent electron emission angles higher than 65
which were not considered in the linear fit. The slope of the lines represents the estimatedthickness of the Pt overlayer d.
4.6 Thickness of the Pt overlayers
In the previous section the application of method 2 seemed to give the most reli-able estimate of the Pt overlayer thickness for a particular AR-XPS measurementon Pt5Gd after ORR, providing similar values for both the Gd 4d and Gd 3d5/2peaks, despite their considerable distance in terms of energies. The fact that nostrong preferential sputtering seem to occur on these alloys and that the intensityratios obtained from Scofield cross sections do not seem accurate is also suggest-ing method 2 as the most appropriate. Herein this method was applied to some

84 Trends in activity and stability
of the other alloys tested in this work in order to investigate possible trends inthe thickness of these overlayers. The application to different alloys is not alwaysstraightforward due to the necessity of finding proper XPS peaks. These should besufficiently intense and they should not overlap with other peaks from Pt, or O,C contaminations; preferably they should lie at sufficiently low binding energies(high kinetic energies) in order to minimize the influence of contaminations in thecalculation. Proceeding in the order of atomic number the following XPS peakswere chosen for the correspondent alloys: La 3d, Ce 3d, Gd 4d, Tb 4d and Dy4d. The La 4d and Ce 4d peaks unfortunately overlap with some of the Pt peaks.Indeed, the La 3d (binding energy ≈ 834 eV) and Ce 3d peaks (binding energy≈ 884 eV) have rather low photoelectron kinetic energies, but still considerablyhigher than for the case of Gd 3d5/2 so that the applicability of the model shouldstill hold.
5 . 2 0 5 . 2 5 5 . 3 0 5 . 3 5 5 . 4 06
8
1 0
1 2
1 4
1 6
"
" " ! " $
" "
"
"
" #
"
"
"
" " " $
" ! " " # " ! "
Figure 4.15: Estimated thicknesses (d) of the Pt overlayer for some Pt5Ln alloys after ORRand after stability test. Values are plotted as a function of the lattice parameter (a) of thebulk (as measured by XRD) and on the top axis, of the Pt-Pt nearest neighbour distance in thebulk (dP t−P t = a/2), which is expected to define the Pt-Pt distance in the overlayer. Errorbars are taken as the standard deviation of the values calculated at 12 different emissionangles between 21 and 65, when possible, including results from more indipendent AR-XPS measurements.
Figure 4.15 shows the estimated thicknesses for some AR-XPS measurements

4.6 Thickness of the Pt overlayers 85
on these alloys after ORR activity testing and after stability tests. The thicknesseshave been plotted as a function of the lattice parameter of the alloys, or alterna-tively, on the top axis, the correspondent nearest neighbour Pt-Pt distance in theirbulk which is expected to define the strain in the Pt overlayer. Focusing on themeasurements after ORR the measured thicknesses are similar for all alloys, pos-sibly with a slight trend towards thicker overlayers in the samples with a higherlevel of compression. After stability tests this trend becomes very clear. For allsamples the model predicts a thickening of the Pt overlayer which is a good indica-tion of the reliability of the measurements and of the model. However, in the caseof Pt5La and Pt5Ce the increase is very limited (lower than 1 Å) while for Pt5Gdand Pt5Tb it is in the order of 2 and 5 Å respectively. This trend is in agreementwith the trends in stability measured for these alloys and an indication of the factthat the activity losses are primarily due to a slightly further level of dealloying inthese materials. This corresponds to a thicker overlayer and probably to a higherlevel of strain relaxation. In other words, these measurements confirm the ideathat a higher level of strain in the Pt overlayer with respect to pure Pt results in alower intrinsic stability of the overlayer. Unfortunately this would also mean thatfor these kind of alloys the trend in activity and the trend in stability go in oppositedirections. In the perspective of an application into a fuel cell, assuming that thesecatalytic performances could be reproduced in the more technologically relevantform of nanoparticles, it would probably be important to find the best compromisein terms of activity and stability, also depending on the particular requirements ofthe final product.
It should be noted that the results of Figure 4.15 are still preliminary: themeasurements for the Pt5Tb after ORR and for Pt5Dy after stability test are missingand some of the points are taken from a single AR-XPS measurement. Furthermore,it would be highly interesting to include some of the other alloys of this chapter (e.g.Pt5Tm, Pt5Ca) in order to confirm the observed trends.

86 Trends in activity and stability

CHAPTER 5
Pt-Y nanoparticles
5.1 Introduction
So far, most of this thesis has focused on the search for new materials catalysingthe ORR; for this kind of fundamental research most of the studies were performedon extended surfaces, typically on polycrystalline samples (see Chapter 3 and 4).However, any kind of application in PEMFCs requires a high catalyst dispersion,particularly for Pt based catalysts where it is essential to minimize the use of pre-cious metals and the mass activity (defined as the ORR activity per mg of Pt) is theimportant parameter. In the case of Pt and alloys of Pt with late transition metals,such high dispersion is typically achieved through the synthesis of nanoparticlesover a large surface area carbon support. Although various techniques for thechemical-electrochemical synthesis of Pt and Pt alloys nanoparticles are well estab-lished, in the case of alloys of Pt and rare earths new synthesis techniques have tobe exploited. The reasons for this are once more related to the very high reactivityof rare earths and in particular to their high affinity to oxygen, which makes it verydifficult to reduce these materials and to form an alloy. In this chapter a physicalmethod relying on the gas aggregation technique (see Section 2.5.2) is used to fab-ricate size-selected Pt-Y nanoparticles. Once deposited onto a planar glassy carbonsupport physical and electrochemical characterizations were performed. This chap-ter presents the very high ORR activity of these particles together with their physicalcharacterization and a discussion about the origins of the enhanced activity. Thesesamples represent good model catalysts to shed light on the fundamental relation-ship between activity, particle size, shape and morphology, without the complica-

88 Pt-Y nanoparticles
tions and artifacts that might be introduced by wet chemical syntheses. Althoughthis preparation method is not suitable for a large scale production, this is a first ev-idence that alloys of Pt and early transition metals in the nanoparticulate form canexhibit such high activities and potentially be employed in low temperature fuelcells. This chapter is based on Paper 5 in the end of this thesis. Patricia Hernandez-Fernandez performed the electrochemical measurements. Federico Masini, DavidN. McCarthy, Christian E. Strebel and Anders Nierhoff have been in charge of thenanoparticle fabrication and part of the UHV characterization. Davide Deiana per-formed the microscopy studies. Daniel Friebel, Anders Bodin and Anna M. Wisehave been in charge of the X-ray Absorption Spectroscopy (XAS) analysis.
5.1.1 Size distribution and morphology
2 4 6 8 1 0 1 2 1 40
1 0 0
2 0 0
3 0 0
Partic
le co
unts
M e a s u r e d p a r t i c l e s i z e / n m2 4 6 8 1 0 1 2 1 40
5 0
1 0 0
1 5 0
Partic
le co
unts
M e a s u r e d p a r t i c l e s i z e / n m
2 4 6 8 1 0 1 2 1 40
5 0
1 0 0
1 5 0
Partic
le co
unts
M e a s u r e d p a r t i c l e s i z e / n m2 4 6 8 1 0 1 2 1 40
5 0
1 0 0
1 5 0
2 0 0
Partic
le co
unts
M e a s u r e d p a r t i c l e s i z e / n m
5 n m4 n m
7 n m 9 n m
5 n m
5 n m
5 n m
5 n m
Figure 5.1: Particle size distributions of the as-prepared Pt-Y nanoparticles and corre-spondent typical TEM images for the four nominal sizes: 4 nm , 5 nm, 7 nm and 9 nm.Measurements performed by Davide Deiana.

5.2 Electrochemical characterization 89
In order to investigate the effective size selection, the nanoparticles were de-posited under the same conditions (see Section 2.5.2) onto gold grids for Trans-mission Electron Microscopy (TEM) applications. The TEM measurements wereperformed in a separate setup: further details can be found in Paper 5 in the endof this thesis. Figure 5.1 shows the particle size distributions with correspondentselected TEM images for the four different sizes selected during this study. For nom-inal purposes the samples will be referred to with their originally intended sizes: 4nm, 5 nm, 7 nm and 9 nm respectively. However, in the plots where the particlesize appears as a numerical quantity on one of the axis the measured average sizewas used. As apparent from Figure 5.1 the measured average sizes turned out toresemble closely the intended sizes, with discrepancies considerably lower than 1nm. A closer look at the histograms shows sharp narrow peaks around these meanvalues, demonstrating the high quality of the mass selection. Small satellite peakscan be noticed at higher sizes, particularly for the bigger particles. They are due tothe presence of doubly charged nanoparticles during the mass selection, resultingin particles of double mass. Although the synthesis conditions were optimized toreduce these artifacts, the higher probability of having double charge in the largestparticles could be reduced but not canceled. The TEM images show that the parti-cles are spherical for all sizes. A close inspection of these images suggests that theyare mainly polycrystalline nanoparticles as different crystalline orientations can beclearly observed.
5.2 Electrochemical characterization
After deposition onto the glassy carbon substrates and after an initial characteri-zation by XPS, the alloy catalyst-loaded electrodes were transferred to the RRDEsetup for the electrochemical characterization. This was preformed under similarconditions as for the other extended surfaces of this study (see Section 2.5.1). Thesamples were inserted into the electrochemical cell under potential control of 0.05V vs. RHE in N2 saturated 0.1 M HClO4 electrolyte and cycled between 0.05 Vand 1 V at a sweep rate of 50 mV/s until stable CVs were obtained. Later on theORR activity tests were carried out in O2 saturated 0.1 M HClO4 electrolyte. Figure5.2 summarizes the results for the four nominal particle sizes: the ORR activity ispresented in terms of kinetic current density at 0.9 V vs. RHE, both in terms ofspecific and mass activity. For the determination of the specific activity the ECSA ofthe nanoparticles was measured by CO stripping as described in 2.5.1. Concerningthe mass activity, the total amount of catalyst was determined from the particlebeam current during deposition (see Section 2.5.2): the fraction of Pt mass wasthen deduced from the Pt to Y atomic ratios as measured by XPS just after deposi-tion. The activity of size selected pure Pt nanoparticles was measured in a previousstudy and also reported for comparison in Figure 5.2 [64]. The specific activity ofpolycrystalline Pt and Pt3Y extended surfaces is also plotted for the same purpose

90 Pt-Y nanoparticles
[16].
2 4 6 8 1 0 9 6 9 8 1 0 00 . 00 . 51 . 01 . 52 . 02 . 53 . 03 . 5
P t - Y a f t e r 9 , 0 0 0 p o t e n t i a l c y c l e s
P t
P t - Y
Mass
activi
tyj m / A
mgPt-1 (a
t 0.9V
)
P a r t i c l e s i z e / n m
2 4 6 8 1 0 9 6 9 8 1 0 002468
1 01 21 4
P t
P t - p c
P t - Y a f t e r 9 , 0 0 0 p o t e n t i a l c y c l e s
Surfa
ce sp
ecific
activi
tyj K / m
Acm Pt-2 (a
t 0.9V
)
P a r t i c l e s i z e / n m
P t 3 Y - p c
P t - Y
Figure 5.2: ORR specific activities and mass activities of the size-selected Pt-Y nanoparti-cles. Kinetic currents were recorded at 50 mVs−1, 1600 rpm and 23± 1C in O2-saturated0.1 M HClO4 electrolyte. The previously published activities of pure Pt nanoparticles arealso plotted for comparison [64]. Each data point represents an average of at least threeindependent measurements. The ORR activities were extracted from the anodic polariza-tion scan and corrected for mass transport limitations. The activity of polycrystalline Pt3Ywas measured on a sputter-cleaned extended surface tested under the same conditions [16].Measurements performed by Patricia Hernandez-Fernandez.
Apart from the smallest 4 nm nanoparticles, all the other Pt-Y samples exhibita remarkable activity enhancement in specific activity. Similar to pure Pt, this activ-ity increases while increasing the particle size and for the largest particles of 9 nmit resembles the value obtained for the extended surface of polycrystalline Pt3Y. Fo-cusing on the mass activity, the Pt-Y nanoparticles are also considerably more activethan in the case of Pt. Interestingly, this mass activity increases monotonically withparticle size, while for Pt nanoparticles it reaches a maximum at a size of approx-imately 3 nm: a particle size that is not optimal in terms of stability. The highestmass activity was measured on 9 nm Pt-Y nanoparticles, with a kinetic current of3.05 A mg−1
Pt at 0.9 V vs. RHE. This value corresponds to one of the highest mass

5.3 Physical characterization 91
activities ever reported in literature, with more than a 5-fold enhancement withrespect to state-of-the-art commercial Pt catalysts (0.55 A mg−1
Pt [75]) and a 3-foldenhancement with respect to Pt nanoparticles prepared under the same conditions[64]. Higher mass activities were only measured on octahedral Pt-Ni nanoparticles,giving a similar value of 3.3 A mg−1
Pt [92], and very recently on Pt3Ni nanoframeswith their record breaking activity of 5.7 A mg−1
Pt [93].
In order to test the long-term stability of the nanoparticles, the catalysts weresubjected to a total of 9 000 potential cycles between 0.6 V and 1 V vs. RHE. Theconditions were the same as for the other stability tests of this thesis: details aregiven in 2.5.1. The results of the stability tests are also plotted in figure 5.2. Quiteimportant activity losses can be observed for all particle sizes. These losses arequite similar in terms of specific activity and in terms of mass activity suggestingthat the catalyst dispersion does not vary abruptly during cycling. In general thelosses range between a 25 % and 50 %. Focusing for instance on the most activenanoparticles (nominal size of 9 nm), there is a 37 % loss of both specific andmass activity. Interestingly, the final mass activity of these 9 nm Pt-Y nanoparticlesis still twice as high as the most active Pt nanoparticles of Figure 5.2 and morethan three times more active than state-of-the-art commercial Pt catalysts (0.55 Amg−1
Pt [75]). CO stripping experiments did not indicate a significant decrease ofECSA during cycling, suggesting the the main reason of deactivation is a decreasein specific activity: an example of CO stripping is found in Paper 5 in the end ofthis thesis, where Identical Location Transmission Electron Microscopy (IL-TEM)measurements confirm the same conclusion. It should be noticed that most of theactivity losses occurred in the first 600 cycles; after this time a metastable condi-tion is probably reached so that kinetic barriers hinder the further degradation ofthe catalyst. Under similar cycling conditions (5000 cycles between 0.65 V and 1.0V vs. RHE) the similarly active Pt-Ni octahedral nanoparticles reported by Choi etal. [92]) exhibited 40 % activity losses, very similar to these Pt-Y nanoparticles. Arigorous quantitative stability comparison would however require identical condi-tions and it should be ideally performed in a fuel cell. It should be also mentionedthat, while ORR catalysts based on alloys of Pt and late transition metals have beenstudied for a couple of decades, this is the first reported attempt of fabricating Pt-Ynanoparticles for ORR; an extensive optimization might be required in order to findthe best conditions for a high stability.
5.3 Physical characterization
5.3.1 X-ray photoelectron spectroscopy
Soon after deposition of the Pt-Y nanoparticles, XPS measurements were taken in-situ on the as-prepared samples with a setup similar to the one described in 2.2.In particular, the Pt to Y atomic ratios were measured in order to ensure a sim-

92 Pt-Y nanoparticles
3 4 5 6 7 8 92468
1 01 21 41 61 8
A f t e r O R R
A s - d e p o s i t e d
Pt to
Y atom
ic rati
o
N o m i n a l p a r t i c l e s i z e / n m
A f t e r s t a b i l i t y
1 6 4 1 6 2 1 6 0 1 5 8 1 5 6 1 5 4
Inten
sity (a
.u.)
B i n d i n g e n e r g y / e V
9 n m a s - p r e p a r e dY 3 d
8 0 7 8 7 6 7 4 7 2 7 0 6 8
Inten
sity (a
.u.)
B i n d i n g e n e r g y / e V
P t 4 f9 n m a s - p r e p a r e d
Figure 5.3: Pt to Y atomic ratios determined by XPS as a function of the nominal particlediameter. A clear increase of these ratios is observed after ORR and even more after stabilitytests for the 9 nm Pt-Y nanoparticles. In the inset, Pt 4f and Y 3d signals from the as-prepared9 nm Pt-Y nanoparticles show the typical Shirley background subtraction and the areas usedfor quantification.
ilar composition for nanoparticles of different sizes. The results are reported inFigure 5.3 together with the Pt to Y ratios measured on a 9 nm Pt-Y sample afterORR and after stability test. In the inset, typical spectra of the Pt 4f and Y 3d corelevel regions can be also seen, with the typical choice of Shirley background andenergy range. It can be noticed that the Pt to Y ratios of the as-prepared sampleswere quite similar for all sizes, although a certain variability between 3.1 and 4.3was still observed. These ratios were obtained despite the nominal composition ofthe sputtered target (i.e. Pt9Y) and were quite reproducible for the different sizesas can be deduced by the limited error bars of the measurements. Unfortunatelythe preparation technique does not allow a precise tuning of the final alloy com-position. Similar to the extended surfaces a clear increase of the Pt to Y ratioswas measured after ORR and after stability test, providing a first indication of theprobable surface dealloying and leaching of surface Y.
More detailed information about the chemical state of these catalysts comesfrom the analysis of the Y 3d core level region. Figure 5.4 shows the Y 3d fit-ted spectra for 7 nm Pt-Y nanoparticles on glassy carbon, respectively as-deposited,air-exposed and after ORR testing. The 7 nm size is here selected as an indicativeexample: analogous measurements for the other sizes lead to totally similar ev-

5.3 Physical characterization 93
1 . 4 e V
Y m e t a l l i c
Y - C
Y m e t a l l i cY 2 O 3
Norm
alized
inten
sity (a
.u.) 2 . 1 e V
1 6 4 1 6 2 1 6 0 1 5 8 1 5 6 1 5 4B i n d i n g E n e r g y / e V
Y m e t a l l i c
A s - d e p o s i t e d
A i r - e x p o s e d
A f t e r O R R
Figure 5.4: XPS spectra of the Y 3d core level region for Pt-Y 7 nm nanoparticles as-prepared (top), after air-exposure (middle) and after ORR testing (bottom). The low bindingenergy doublets (grey) represent the metallic components of Y (Y 3d5/2 peak at ≈ 156.0±0.2eV ). A secondary Y phase (blue) is present in the as-prepared sample and it is ascribedto the reaction of Y with the carbon support. After air-exposure the Y oxide phase (red)appears at even higher binding energies and becomes predominant. The energy shifts ofthese components are also indicated. Similar experimental evidences were observed for theother particle sizes.
idences. Focusing on the spectrum of the as-deposited sample, quite surprisingly,this could not be fitted by a single doublet, indicating that Y is present in more thana single chemical state. The most intense low binding energy species (Y 3d5/2 peakat ≈ 156.0± 0.2eV ) is consistent with metallic Y as expected; the higher bindingenergy species is somewhat harder to identify. When compared to the Y peaks afterair-exposure, clear differences can be observed; a clear Y oxidation occurred withthe Y oxide peaks representing the majority of the XPS signal. These oxide peaksare shifted to very positive binding energies (Y 3d5/2 peak at ≈ 158.1 ± 0.2eV ),

94 Pt-Y nanoparticles
considerably more positive than the secondary Y phase of the as-deposited sample.This different position lead us ascribe this phase at intermediate binding energiesto the reaction of the as-deposited Y with the C substrate; considering the highreactivity of metallic Y this would not be surprising. Another possibility could berelated to the presence of some Y hydride [161] or hydroxide formed by the re-action with some residual water on the glassy carbon. It should be noticed thatin literature no complete agreement on the position of the Y oxide peaks could befound [162, 163], but measurements acquired on an oxidized Y foil also registeredvery high binding energies (158.4eV for the Y 3d5/2 peak).
Remarkably, after ORR measurements only a single Y phase is observed at thetypical binding energies of metallic Y. This indicates that the surface Y oxide isdissolved in the electrolyte, in a similar way as already demonstrated on extendedsurfaces of Pt3Y and Pt5Y [98]. Together with the increased Pt to Y ratios these XPSmeasurements suggest the formation of a core-shell structure, through a process ofsurface dealloying that resembles the one already described on extended surfacesfor most of the probed alloys of Pt and rare earths. Although AR-XPS measurementscannot provide reliable depth profiles in this case due to the three dimentionalmorphology of the surface covered by nanoparticles, a Pt enriched shell should beexpected.
5.3.2 Ion scattering spectroscopy
ISS measurements were performed after ORR in order to provide further informa-tion about the presence of a Pt shell. The ISS depth profile for a sample of 7 nmPt-Y nanoparticles is depicted in Figure 5.5. Compared to the case of Pt and lan-thanide metals, in this case He ions were able to distinguish the Pt and Y peaks.A ion energy of 1 keV was chosen so that the Pt peak appeared at kinetic energiesEK ≈ 890 eV while the Y appeared at EK ≈ 810 eV, as can be observed from thefitted peaks of Figure 5.5 for some selected scans. The residual He pressure inthe chamber was set to 1× 10⁻⁷mbar resulting in a ion current of about 300 nA.This value is considerably higher than those reported in Chapter 3 for ISS with Neions on a Pt5Ce polycrystalline sample; however, the lighter He ions induce a muchslower sputtering of the surface layers and higher currents could be used. Underthese conditions the Pt ISS peak was already clearly visible from the very first scan,despite the presence of the typical background at lower kinetic energies originatingfrom the C and O contaminations accumulated during the transfer of the sampleand electrochemical measurements.
The ratio between the Pt and the Y ISS signals is very high (≈ 130) for thisfirst scan since no Y peak can be seen and the small measured signal is on the levelof the noise. In the following scans this ratio decreases quickly and it tends tostabilize after about 10-15 scans at a value ≈ 6. In Figure 5.5 the XPS ratios arealso shown for comparison: these were calculated from the Pt 4f and Y 3d peaks

5.3 Physical characterization 95
0 5 1 0 1 5 2 0 6 0 6 5 7 00
1 02 03 04 05 06 07 08 09 0
1 0 01 1 01 2 01 3 01 4 0
Pt
to Y a
tomic r
atio
I S S S c a n
I S S
X P S
7 6 0 8 0 0 8 4 0 8 8 0 9 2 0
Inten
sity (a
.u.)
K i n e t i c e n e r g y / e V
7 6 0 8 0 0 8 4 0 8 8 0 9 2 0
Inten
sity (a
.u.)
K i n e t i c e n e r g y / e V7 6 0 8 0 0 8 4 0 8 8 0 9 2 0
Inten
sity (a
.u.)
K i n e t i c e n e r g y / e V
7 6 0 8 0 0 8 4 0 8 8 0 9 2 0
Inten
sity (a
.u.)
K i n e t i c e n e r g y / e VS c a n 7 0
S c a n 5
S c a n 1 0
S c a n 1
Figure 5.5: Pt to Y ratio derived from the fit of consecutive ISS scans on Pt-Y 7 nm nanopar-ticles after ORR. The XPS intensity ratios before ISS and after 20 and 70 cycles are alsoplotted for comparison. The inset shows a selection of ISS spectra corresponding to scans 1,5, 10 and 70 with fitted Y (grey) and Pt (blue) peaks. Similar experimental evidences wereobserved for the other particle sizes.
acquired before ISS and after 10 and 70 ISS scans. Also in the case of XPS the Pt toY ratios diminishes with time and further ISS sputtering, although the differencesare much less pronounced, probably due to the lower surface sensitivity. This ISSmeasurement and in particular the first ISS scan of Figure 5.5 is in good agreementwith the expected presence of a Pt shell surrounding an alloyed particle core.
5.3.3 Scanning transmission electron microscopy energy dis-persive X-ray spectroscopy
To further investigate the structure and composition of the nanoparticles ScanningTransmission Electron Microscopy Energy Dispersive X-ray Spectroscopy (STEM-EDS) was performed on the most active catalysts (i.e. 9 nm Pt-Y nanoparticles)allowing to map the distribution of Pt and Y in the particles. Details of the em-ployed experimental setup are found in Paper 5 in the end of this thesis. Figure5.6 shows the acquired STEM images for the sample as-prepared and after ORR;the corresponding EDS elemental distributions are also plotted. In the case of the

96 Pt-Y nanoparticles
Figure 5.6: High Angle Annular Dark Field Scanning Transmission Electron Microscopy(HAADF-STEM) images and corresponding X-ray EDS elemental maps for Y, Pt and combinedPt+Y. Measurements were taken on Pt-Y 9 nm nanoparticles as-prepared (left) and after ORR(right). Linear profiles of the Pt and Y EDS intensity along the indicated purple lines are alsoplotted. The thickness of the Pt shell was estimated from ten line profiles, obtaining a valueof 1.0 ± 0.3 nm. Measurements and figure made by Davide Deiana.
nanoparticles before electrochemical treatment, the concentration of Pt and Y ishomogeneous over the entire particle as can be noticed for both the linear distri-bution along the indicated line and the overall particle distributions. Interestingly,the situation changes after ORR activity tests: as a consequence of Y dissolution, aPt enriched shell can be clearly observed. The linear profile allows to estimate thethickness of such Pt overlayer, approximately 1 nm. This value is good agreementwith those measured by AR-XPS on polycrystalline Pt5Y in [98] and similar to thosediscussed in Chapter 4 for alloys of Pt and lanthanide metals.
5.3.4 Extended X-ray absorption fine structure
The presence of a thick Pt shell suggests that strain effects are the most probablemechanism enhancing the ORR activity over the one of pure Pt. In order to in-vestigate the presence of strain in the Pt-Y catalysts and quantify it, synchrotronX-ray Absorption Spectroscopy (XAS) experiments were performed. In particularExtended X-ray Absorption Fine Structure measurements (EXAFS) allow to deter-mine the average Pt-Pt distance in the nanoparticles, before and after electrochem-ical treatment. The results of such experiments are summarized in Figure 5.7,where the average nearest neighbour Pt-Pt distance is plotted for different sizesof Pt-Y nanoparticles: for comparison, similar measurements were also taken onpure Pt nanoparticles and on a reference Pt foil. Details of the fitting procedureand parameters can be found in Paper 5 in the end of this thesis. In the case of all

5.4 Discussion on the activity enhancement 97
2 3 4 5 6 7 8 9 1 02 . 6 72 . 6 82 . 6 92 . 7 02 . 7 12 . 7 22 . 7 32 . 7 42 . 7 52 . 7 62 . 7 7
P t P ta f t e r O R R
P t f o i l
P t - Ya s - p r e p a r e d
M e a s u r e d p a r t i c l e s i z e / n m
P t - Y a f t e r O R R
- 3 %
- 2 %
- 1 %
0 %
Figure 5.7: Average nearest neighbor Pt-Pt distance derived from the EXAFS analysis forPt-Y nanoparticles of different sizes: as-prepared (black) and after ORR (red). The red linehelps to guide the eye. For comparison, analogous measurements were taken on pure Ptnanoparticles: as-prepared (blue) and after ORR (orange). The measured nearest neighborPt-Pt distance in a Pt foil (grey) is also shown as reference. Measurements taken with DanielFriebel, Anders Bodin and Anna M. Wise who also analyzed the data and prepared the figure.
Pt samples, the Pt-Pt average distance is approximately the same, both before andafter ORR activity tests. On the other hand, the as-prepared Pt-Y nanoparticles (7nm and 9 nm) exhibit a pronounced compressive strain (≈ 3 %). After ORR cleardifferences can be noticed: the average Pt-Pt distance relaxes towards the one ofpure Pt. However, some strain is still retained, with a clear dependence on theparticle size. The residual compressive strain varies from 1.0 % for the smallest 4nm nanoparticles, up to 2.1 % for the largest 9 nm nanoparticles.
5.4 Discussion on the activity enhancement
The similarities between the XPS-ISS results on these nanoparticles and those ob-tained on extended surfaces indicate that the surfaces of these catalysts are sub-jected to similar modifications during both air-exposure and electrochemical mea-surements. Namely, Y oxidizes under air-exposure and leaches out from the firstatomic layers of the particles during potential cycling in 0.1 M HClO4 electrolyte.The active chemical state and surface structure after ORR testing is also similar inboth cases, suggesting that similar mechanisms might explain the enhanced ORR

98 Pt-Y nanoparticles
activities. Since the surface consists of pure Pt either ligand or strain effects shouldexplain the enhanced specific activities with respect to Pt nanoparticles. The re-markable increase of the XPS Pt to Y ratios and in particular the STEM-EDS elemen-tal maps indicate the presence of a rather thick Pt overlayer, around 1 nm, over analloyed Pt-Y core. These evidences are in rather good agreement with the AR-XPSmeasurements taken on polycrystalline samples. For such a structure ligand effectsshould vanish at the surface and strain effects would be the only explanation [52].
Although EXAFS measurements represent an average over the whole particle,they demonstrate the overall compression of the Pt-Pt distance in these catalysts,compared to pure Pt. The removal of surface Y during ORR testing causes a re-laxation of such strain towards the Pt-Pt lattice parameter of pure Pt. However,low energy electron diffraction (LEED) studies on Pt/Cu(111) indicate that therewould still be some residual compressive strain on the topmost layer, despite theserelaxation effects [31]. Similar conclusions are suggested by X-ray surface scatter-ing (XRS) experiments on the Pt overlayer of dealloyed Cu3Pt(111) [41]. Figure5.8 shows the specific activity of the Pt-Y catalysts at various sizes as a functionof the average Pt-Pt distance measured by EXAFS. A clear correlation can be ob-served. The specific activity increases monotonically with higher levels of compres-sive strain; a similar tendency was observed by Strasser et al. for dealloyed Pt-Cunanoparticles [31].
- 2 . 5 % - 2 . 0 % - 1 . 5 % - 1 . 0 % - 0 . 5 %02468
1 01 21 4
Spec
ific ac
tivity
j k / mA c
m-2 Pt (at
0.9 V)
S t r a i n ( r e l a t i v e t o P t f o i l )
Figure 5.8: Specific activity of Pt-Y nanoparticles of different sizes, plotted as a functionof the compressive strain relative to pure Pt, as determined from the EXAFS analysis (seeFigure 5.7). The continuous line helps to guide the eye.
By assuming that the Pt-Y nanoparticles consist of ≈ 1 nm thick Pt shell over aPt5Y core, as estimated from the STEM-EDS measurements, the compression of the

5.4 Discussion on the activity enhancement 99
Pt overlayers can be calculated. These would be slightly less compressed with val-ues between 1.0 % and 1.8 %: these values are substantially relaxed with respectto the nearest neighbour Pt-Pt distance in bulk Pt5Y, which is ≈ 4 % [98, 164].In Chapter 4 the bulk structure of alloys of Pt and lanthanide metals (e.g. Pt5La,Pt5Ce, Pt5Gd, ...), with analogous structure as Pt5Y [164], was already related tothe structure of the Pt overlayer. However, a direct measurement of the surfacestructure of the overlayer is challenging and it could not be performed yet due tothe limited thickness of the overlayer and the polycrystalline nature of those sam-ples: ongoing synchrotron measurements on alloyed Y/Pt(111) aim at resolvingthis surface structure.

100 Pt-Y nanoparticles

CHAPTER 6
Towards in-situ XPSmeasurements
6.1 Introduction
In recent years there has been a general trend towards the development of in-situtechniques for the analyses of catalytic surfaces. Indeed, during reaction the cat-alyst conditions might vary considerably from its initial as-prepared status as wellas from its final status after reaction and transfer to any ex-situ experimental setup[165]; surface composition, chemical states, morphology and surface structure ofthe catalysts can all be very sensitive to changes in the environmental conditions(e.g. exposure to air, to other reactive gases or to acidic/basic electrolytes). Theelectrochemical potential can also heavily affect these properties. A number of tech-niques have been developed in order to follow these changes under reaction con-ditions and possibly in a PEMFC: in-situ measurements based on X-ray diffraction(XRD), X-ray absorption (XAS), Fourier Transform Infrared Spectroscopy (FTIR),Transmission Electron Microscopy (TEM), electrochemical scanning tunneling mi-croscopy (EC-STM) are well established. In-situ X-ray Photoelectron Spectroscopy(XPS) measurements would also be highly desirable as this technique can pro-vide at the same time information about composition, chemical states and surfacestructure. The main challenge in the case of XPS is the very low electron meanfree path of the photoemitted electrons in the range of pressures required for fol-lowing a reaction. However, sophisticated multiple stages systems of differentialpumping have been recently developed, allowing to acquire Ambient-Pressure X-

102 Towards in-situ XPS measurements
Ray Photoelectron Spectroscopy (AP-XPS) measurements up to pressures ≈ 100mbar [166, 167].
For the interest of this study, AP-XPS measurements on ORR catalysts and inparticular on Pt-alloys would be highly valuable. An in-situ study of the XPS sig-nals of the alloyed rare earths, as for the alloys of the previous chapters of this work(Chapters 3 and 4), could provide, for instance, further information about the deal-loying mechanism. Variations in the shape and position of the Pt 4f peak and of thed-band could be correlated to the level of strain in the Pt overlayer, enlighteninghow this evolves during the initial dealloying, or upon extended electrochemicalcycling and how this strain is related to the enhanced ORR activity. Even moreinterestingly, AP-XPS could be employed to directly probe and distinguish the oxy-genated species during ORR, which could extend our understanding of the catalyticsteps of this reaction. In the introduction of this thesis (Chapter 1) it was shownhow the binding energies of these oxygenated species (i.e. O∗, HO∗, HOO∗) areexpected to influence the ORR activity according to DFT calculations. In particular,once the scaling relations have been taken into account, the O∗ binding energy wasused as a single descriptor of the ORR activity.
However, the direct observation of these species in-situ is particularly chal-lenging. XAS measurements, for instance, allow to identify the Pt oxidation statebut they cannot distinguish between OH and other oxygenated species adsorbedon the surface [168]. On the other hand FTIR measurements are hindered by thehigh level of absorbance of the electrolyte solution and of the electrolyte membranemaking the detection of adsorbed HO∗ virtually impossible [169]. Electrochemicalstudies have detected the presence of the HO∗ intermediate on pure Pt surfaces un-der ORR conditions [22, 170]. XPS has already been employed in vacuum to studythe presence of oxygenated intermediates on extended Pt single crystal surfaces[23, 171]. However, these ex-situ measurements always need to deal with the chal-lenge of avoiding contaminations and of preserving the oxygenated species duringthe transfer: surface water species typically desorb above 200 K [172]. A goodknowledge about the coverage of these species under reaction conditions wouldbe fundamentally important. It could also help to explain the unusual ORR activi-ties observed in presence of different ions [173, 174], in dehydrated environment[175] or on stepped surfaces [176] and at the same time facilitate the design ofbetter catalysts.
Very recently Sanchez-Casalongue et al. have demonstrated the possibility ofapplying their AP-XPS experimental setup [166, 167] to the study of Pt nanoparti-cles in a specifically prepared fuel cell [24]. From the O 1s XPS peak they were ableto directly identify the oxygenated species during ORR and to follow their relativeconcentrations for different cell voltages. In particular, they identified two differenttypes of OH species: hydrated OH and non-hydrated OH. The second one being themain surface species covering the Pt surface under ORR conditions at high partialpressures of O2. They also employed DFT calculations to show that the reductionof non-hydrated OH should occur at lower overpotentials, suggesting that tuning of

6.2 Setup and sample preparation 103
the OH hydration through a proper catalyst design could highly enhance the ORRactivity.
In this chapter the same experimental setup of Sanchez-Casalongue et al. [24]is used on a specifically prepared Pt-Y nanoparticle cathode. Despite the remark-able differences from the typical operation conditions of PEMFC, this is the firstattempt of employing nanoparticle catalysts based on alloys of Pt and rare earthsin a fuel cell. The analysis of the Y 3d XPS region allows to follow the dealloy-ing mechanism in-situ for the first time. Preliminary results on the evolution ofthe oxygenated species on these catalysts under ORR conditions are shown. Thesemeasurements were performed in collaboration with Hernan Sanchez-Casalongueand Ifan E. L. Stephens. In the end of the chapter the design and construction ofa new experimental setup for combining the Theta-Probe analysis chamber withelectrochemical measurements is also introduced. Such system will also contributeto bring us closer to in-situ XPS experiments.
6.2 Setup and sample preparation
6.2.1 Ambient pressure XPS setup
The experiments of this chapter have been carried out at the Stanford SynchrotronRadiation Lightsource (SSRL) and in particular at beamline 13-2. This is equippedwith an Elliptically Polarized Undulator (EPU) beamline covering the photon en-ergy regime between 150 and 1300 eV with resolving power of E/∆E > 5 000.The Kirkpatrick–Baez (KB) refocusing optics tightly focuses the X-ray beam ontothe center of a high-pressure cell where the fuel cell apparatus is mounted; this ispart of a larger UHV system where sample cleaning and preparation can be per-formed. The full width at half maximum (FWHM) of the focal spot of the X-raybeam is smaller than 10 µm (vertical) × 50 µm (horizontal). The fuel cell appara-tus can be precisely positioned in the middle of the high-pressure cell by a numberof piezoelectric positioners that allow to align the surface of the cathode with theX-ray beam and at the same time with the entrance aperture to the differentiallypumped lens elements of the electron-energy analyzer. A total of five differentiallypumped sections allow the electron spectrometer (VG Scienta, SES 100) to obtainXPS spectra at pressures up to ≈ 100 mbar. For all the spectra presented in thischapter a photon energy of ≈ 700 eV was chosen. The binding energies were ref-erenced to the Fermi level by regularly acquiring XPS spectra of the valence bandunder the corresponding experimental conditions. The absence of beam damageeffects was checked by acquiring consecutive spectra in the same position over thesample at different pressure conditions.
Figure 6.1 shows a schematic of the high-pressure cell with details about thegeometry of the system. The choice of the X-ray incident angle and of the ac-

104 Towards in-situ XPS measurements
Figure 6.1: Schematic drawing of the high-pressure cell for AP-XPS measurements. Thefirst three differential pumping sections (DP1, DP2, and DP3) are also visible. The firstpumping section (DP1) is the UHV chamber hosting the high-pressure cell. A small apertureseparates the high-pressure cell from the second pumping section (DP2). The first lenselements start focusing the photoelectrons between DP2 and DP3. The beam pipe on the leftof the drawing (purple), separated from the high-pressure cell by a Si3N4 window, indicatesthe direction of the incoming X-ray beam. On the right, piezoelectric positioners allow toprecisely align the sample with the beam. Figure adapted from [167].
ceptance angle of the emitted electrons is crucial. The sample is hit at grazingincidence in order to minimize the XPS signal originating from the gas moleculesrelative to that of the cathode and of its surface species. Furthermore the distancebetween the sample surface and the aperture to the stages of differential pump-ing and to the analyzer must be minimized being sure to maintain a good verticalalignment between the beam spot on the sample and the aperture itself. Furtherdetails about the AP-XPS experimental setup can be found in [24, 166, 167].
6.2.2 Fuel cell for ambient pressure XPS
Figure 6.2 shows a schematic drawing of the PEM fuel cell that was specificallydesigned for the high-pressure cell of this AP-XPS system. The two sides of theMembrane Electrode Assembly (MEA) are separated by an O-ring which is pressingon the anode side of the membrane itself. In this way the anode side (backside)can be filled through small tubes with humidified forming gas (95% N2/ 5% H2saturated H2O) providing both the fuel and the necessary humidification of themembrane. The cathode side (frontside) is directly exposed to the gases (typicallyO2) of the high-pressure cell for the AP-XPS measurements.

6.3 In-situ Y oxidation and dealloying 105
Figure 6.2: Schematic drawing of a PEMFC setup designed for APXPS investigations:the electrochemical cell has a Nafion membrane coated on the anode side with carbon-supported Pt nanoparticles and on the cathode side with 9 nm Pt-Y nanoparticles depositedon a Nafion/carbon-black mixture. The cathode side of the assembly is exposed to the AP-XPS gas cell, typically filled with O2. The anode chamber is sealed to the backside of themembrane through an O-ring and is filled with humidified forming gas (95% N2/5% H2,saturated H2O). A voltmeter and a galvanometer allow measurements of the cell potentialor current while acquiring XPS measurements.
Concerning the MEA, the backside was prepared by coating a commercialNafion 115 membrane with a mixture of Nafion and carbon-supported Pt nanopar-ticles (particle size 10-20 nm) with catalyst loading of 4 mg cm−2 (from the FuelCell Store, Inc (Boulder, CO)). On the frontside a Nafion/carbon-black mixturewas first deposited onto the Nafion membrane. The membranes were then trans-ferred to the cluster source (see Section 2.5.2) and degassed in vacuum for about12 hours; subsequently, size-selected 9 nm Pt-Y nanoparticles, the most active pre-sented in Chapter 5, were deposited onto the Nafion/carbon mixture using thesame deposition procedure.
6.3 In-situ Y oxidation and dealloying
Once the MEA was assembled in the fuel cell apparatus and mounted in the high-pressure cell for AP-XPS preliminary measurements were acquired in vacuum. Fig-ure 6.3 shows a typical overview spectrum with clear Pt and Y signals from thePt-Y nanoparticles; signals from C, O and F can also be seen. F is expected from

106 Towards in-situ XPS measurements
6 0 0 5 0 0 4 0 0 3 0 0 2 0 0 1 0 0 0
F 2s
Pt 4d
3/2
F KL1
- Pt 5
p 3/2
Pt 4d
5/2
Pt 4f
Y 3d
Pt 5s
C 1s
Norm
alized
inten
sity (a
. u.)
B i n d i n g e n e r g y / e V
O 1s C K
L1
O KL
1
f r o n t s i d e : v a c u u mb a c k s i d e : v a c u u m
Figure 6.3: Initial XPS overview spectrum of Pt-Y nanoparticles acquired in vacuum on thecathode side of the MEA. The main XPS and Auger peaks have been assigned showing thepresence of Pt and Y from the nanoparticles, C, O and F from the Nafion/carbon mixture.
the nafion and appears as an Auger KL1 peak at a binding energy of ≈ 48 eV. No Sfrom the nafion could be observed suggesting that also the O 1s signal should notbe affected by sulphur-containing oxygenated species. Similar measurements weretaken on different spots over the sample area in order to investigate the homogene-ity of the sample. The amount of Pt relative to the C signal from the support andto the F peak from the nafion was found to be quite variable. This variability isascribed to the deposition of the high surface area carbon/nafion mixture, whichmight not be uniform over the all surface. However, the Pt to Y ratio was constantfor different positions as expected. In the following measurements positions wherethe highest counts from the Pt 4f peak were generally chosen.
After these preliminary measurements the evolution of the main peaks (i.e. Y3d, Pt 4f, C 1s, O 1s) was followed during pressurization of the anode/cathodeside of the membrane and after applying potential cycles in order to induce thedealloying process. For this purpose the Y 3d peak provides the most interestinginformation. Figure 6.4 presents the comparison between the Y 3d peak measuredin vacuum and the same peak after introduction of 5 Torr of H2O vapor from thefrontside and 40 potential cycles between -0.3 V and 1.4 V. The high quality of theX-ray beam provides a very good resolution and allows to easily distinguish twoY phases, a metallic phase (Y 3d5/2 peak at ≈ 156.0 eV in agreement with themeasurements of Chapter 5) and a more intense oxidized phase (Y 3d5/2 peak at

6.3 In-situ Y oxidation and dealloying 107
1 6 4 1 6 2 1 6 0 1 5 8 1 5 6 1 5 4
S i o x i d i z e d
b a c k s i d e : h u m i d i f i e d
b a c k s i d e : h u m i d i f i e d
f r o n t s i d e : 5 t o r r H 2 O
f r o n t s i d e : v a c u u m
A f t e r E Ci n 5 t o r r H 2 O
Norm
alized
inten
sity (a
. u.)
B i n d i n g e n e r g y / e V
B e f o r e E CY o x i d i z e d Y m e t a l l i c ( 3 4 % )
Y m e t a l l i c ( 2 3 % )
Figure 6.4: Comparison of the Y 3d XPS region between the initial as-prepared conditionin vacuum (top) and the one after electrochemical cycling in 5 Torr H2O pressure (bottom).A relative increase of the oxidized component is observed. The percentages of metallic Ywith respect to the total Y, and the pressure conditions of anode and cathode side duringacquisition of the XPS signals are indicated.
≈ 158.6 eV probably corresponding to Y oxide or solvated Y ions [162]). Suchhigh level of oxidation is expected from the long time air exposure that occurredbetween the deposition and the synchrotron measurements (i.e. about two weeks)and from the highly acidic conditions induced by the presence of Nafion. Figure6.4 clearly shows an increase of the oxidized component compared to the metallicone after electrochemistry. This is the first in-situ XPS evidence of the dealloyingprocess occurring on Pt alloy nanoparticles. It should be noted that the two spectrawere acquired at the same position over the sample surface, as some variability inthe percentage of metallic to oxidized Y was noticed at different spots: this mightalso be an effect of the inhomogeneous carbon/nafion film. Compared to the otherXPS measurements reported in this thesis after electrochemistry, the absence of a

108 Towards in-situ XPS measurements
liquid electrolyte flow complicates the removal of the Y oxide or solvated Y ionsfrom the surface. The presence of these oxidized species was already found toreduce the ORR performance of alloys of Pt and late transition metals [77, 177].This suggests that, as in the case of Pt3Co [3, 82], a proper acid leaching procedureshould be optimized and performed prior to use of these particles in a fuel cell.This would prevent the accumulation of oxidized Y that could possibly poison thecatalytic active sites or the membrane. Figure 6.4 also shows the presence of asmall Si contamination; this was occasionally observed on some particular spotsand found to increase during electrochemical measurements. This is expected tobe a contamination from either the carbon substrate or the carbon/nafion mixture.
1 6 4 1 6 2 1 6 0 1 5 8 1 5 6 1 5 4
Norm
alized
inten
sity (a
. u.)
B i n d i n g e n e r g y / e V
b a c k s i d e : h u m i d i f i e df r o n t s i d e : v a c u u mA f t e r E C
f r o n t s i d e : 1 t o r r O 2b a c k s i d e : h u m i d i f i e dA f t e r E Ci n 1 0 t o r r O 2
Y o x i d i z e d Y m e t a l l i c ( 2 7 % )
Y m e t a l l i c ( 2 0 % )
Figure 6.5: Comparison of the Y 3d XPS region after electrochemical cycling in ≈ 5 TorrH2O pressure (top) and after electrochemical cycling reaching higher potentials in ≈ 10 TorrH2O pressure (bottom). A further increase of the oxidized component is observed. Thepercentages of metallic Y with respect to the total Y, and the pressure conditions of anodeand cathode side during acquisition of the XPS signals are indicated.
Figure 6.5 provides a further evidence of dealloying over a second spot of the

6.4 Acid leaching 109
sample as a consequence of further electrochemical cycling in ≈ 10 Torr of O2. Thistime the cathode was subjected to a total of 115 potential cycles between -0.4 Vand 1.4 V. After this treatment the percentage of metallic Y decreased further from27 % to only 20 %.
6.4 Acid leaching
After various combinations of electrochemical cycles under different H2O and O2pressures, the membrane was extracted from the high-pressure cell. The cathodesurface was exposed to a drop of 0.1 M H2SO4 electrolyte for 10 minutes followedby various drops of water for rinsing. This procedure was repeated two timesin order to ensure a good acid leaching and the removal of the oxidized Y. Thenew measurements acquired in vacuum exhibited in average much lower levels ofoxidized Y as apparent from Figure 6.6, where the metallic component represents54 % of the total Y signal. It was still impossible to achieve a complete oxideremoval with this procedure.
1 6 4 1 6 2 1 6 0 1 5 8 1 5 6 1 5 4
Y o x i d i z e d
Norm
alized
inten
sity (a
. u.)
B i n d i n g e n e r g y / e V
b a c k s i d e : h u m i d i f i e df r o n t s i d e : v a c u u mA f t e r a c i d l e a c h i n g
Y m e t a l l i c ( 5 4 % )
Figure 6.6: Typical Y 3d XPS spectrum after ex-situ acid leaching in 0.1 M H2SO4 elec-trolyte. The metallic component of Y increased to 54 % of the total Y area.
Figure 6.7 a shows a broad XPS spectrum including both the Pt 4f and Y 3dpeaks and how their areas were calculated for estimating the Pt to Y ratios. Theevolution of the Pt to Y XPS ratios is plotted in Figure 6.7 b for an average of at leastthree independent measurements in different spots for the membrane as-prepared,after EC mesurements and after ex-situ acid leaching. The ratios are expressed bothin terms of Pt to total Y signal and in terms of Pt to metallic Y. In both cases theratios are quite reproducible before electrochemical measurements confirming the

110 Towards in-situ XPS measurements
good compositional homogeneity of the particles over the surface. While the totalquantity of Y after EC does not vary significantly, the Pt to metallic Y ratios in-crease as a consequence of dealloying. Some variability is due to the different levelof dealloying for different cycling conditions (different H2O or O2 pressures andapplied potentials). As anticipated from Figure 6.6, the acid leaching procedureraised all the ratios to higher values as a consequence of further dealloying andremoval of the oxidized phase. The higher error bars are a sign of some spatialvariability for different positions, particularly for the acid leached sample wheredifferent spots clearly exhibited different levels of oxide removal.
1 6 0 1 4 0 1 2 0 1 0 0 8 0
P t 4 f
Inten
sity (a
. u.)
B i n d i n g e n e r g y / e V
Y 3 d
A f t e r E Cf r o n t s i d e : 1 t o r r O 2b a c k s i d e : f u l l y h u m i d i f i e d
05
1 01 52 02 53 03 5
A c i d l e a c h e dA f t e r E CA s - p r e p a r e d
P t t oY t o t a l
P t t o Y m e t a l l i c
Pt to
Y atom
ic rati
o
C a t h o d e c o n d i t i o n s
( b )
1 6 4 1 6 2 1 6 0 1 5 8 1 5 6 1 5 4
Y m e t a l l i c
Inten
sity (a
. u.)
B i n d i n g e n e r g y / e V
Y o x i d i z e d
( a )
Figure 6.7: On the left (a) a typical broad spectrum including the Pt 4f and Y 3d regionsillustrates the employed areas for quantifying the Pt to Y ratios. The inset is a zoom of thefitted Y 3d peaks. On the right (b) the Pt to total amount of Y (black) and Pt to metallicY (red) ratios are plotted. Measurements were performed on the as-prepared membranein vacuum, after EC cycling under different H2O and O2 frontside pressures and in vacuumafter ex-situ acid leaching. Each point is calculated as an average of at least three independentmeasurements at different positions.
6.5 In-situ observation of oxygenated surface species
In the previous section AP-XPS measurements provided in-situ evidences of thedealloying process. Although that was the main focus of these measurements thedirect observation and separation of the oxygenated species participating in theORR process would be highly interesting. In particular, a comparison betweenthe adsorbed species on these Pt-Y nanoparticles and those recently reported bySanchez-Casalongue et al. on pure Pt nanoparticles [24], would be of great impor-tance towards a better understanding of the ORR mechanisms and of the enhancedcatalytic performance of this kind of alloys.

6.5 In-situ observation of oxygenated surface species 111
Preliminary results can be extrapolated from the spectra of Figure 6.8, wheredifferent O 1s spectra were acquired after introduction of 2.6 Torr of O2 underopen-circuit conditions and constant anodic hydrogen pressure (≈ 600 Torr of hu-midified forming gas). The spectra were acquired on the Pt-Y nanoparticles beforethe acid leaching procedure of Section 6.4. Unfortunately, in the limited amount oftime at the synchrotron it was not possible to reproduce the same measurementson the acid leached nanoparticles where the lower amount of oxidized Y wouldensure a lower level of uncertainty on the deconvolution of the O 1s spectra. Ide-ally the fuel cell behaviour of these catalysts should be studied after an optimizedprocedure of acid leaching, removing the majority of the oxidized Y and leavingentirely metallic core-shell Pt-Y nanoparticles, with a Pt shell protecting the core Yfrom further oxidation and dissolution.
The XPS peak of gaseous oxygen, with the typical splitting due to the para-magnetic nature of O2 molecules [166, 180], appears at high binding energies ≈536-540 eV. While the system evolves towards the equilibrium, a clear shift of thesepeaks towards lower binding energies is noticed. Previous works demonstratedthat this shift of the gas phase relative to the probed Fermi level in proximity of thesurface is the result of a variation of the work function [181, 182]. The same be-haviour was observed on pure Pt nanoparticles [24] and it was correlated to a shiftin the measured electrochemical potential at the cathode. Interestingly, the shiftsof these two quantities, both describing how strongly the surface binds electrons,closely agreed. This also indicates that changes in the electrochemical potential canbe deduced from XPS. In Figure 6.8 the measured shift of 0.9 eV corresponds toa 900 mV increase of the surface potential while the system approaches the equi-librium. This is approximately the maximum electrochemical potential expectedat the cathode of this fuel cell: differences from the Nernst equilibirum potential(U0 = 1.195 V) are ascribed to kinetic losses.
Focusing now on the low binding energy region of the O 1s spectra (≈ 529-536 eV), clear modifications in the shape and position of the spectrum indicate avariation of the surface species at the cathode. Figure 6.8 also reports the positionsof the main oxygenated species based on previously assigned XPS spectra of vari-ous oxygenated adsorbates on Pt(111) single crystals [178, 179]. Due to the largenumber of species involved and the complications due to the presence of oxygenfrom the oxidized component of Y, it was preferred to avoid a direct fit of thesespectra. However, a clear qualitative trend can be observed. At low potentials wa-ter is the main component, both present as multilayer H2O (purple peak at 533.1eV) and adsorbed water H2O(ad)(orange peak at 532.2 eV). At higher potentialsthese signals are progressively substituted by those of hydroxide based species atlower binding energies: adsorbed water hydrogen bonded to hydroxide H2O-OH(red peak at 531.6 eV), non-hydrated hydroxide OH-O (cyan peak at 531.0 eV) anda convolution of hydrated hydroxide H2O-OH and atomic oxygen Oad (blue peak at530.1 eV). It should be noted that the O 1s components from oxidized Y are not ex-pected to shift while the potential increases and they should not interfere with the

112 Towards in-situ XPS measurements
5 4 0 5 3 8 5 3 6 5 3 4 5 3 2 5 3 0
OH-O
H 2O-OH
/ Oad
H 2O-OH
H 2O (ad)
multila
yer
H 2O
+ 0 . 9 V
+ 0 . 3 V
Norm
alized
inten
sity (a
.u.)
B i n d i n g e n e r g y / e V
b a c k s i d e : h u m i d i f i e df r o n t s i d e : 2 . 6 T o r r O 2
+ 0 . 1 V
Figure 6.8: Open circuit potential evolution of O 1s XPS spectra under introduction of 2.6Torr of O2 gas in the cathode and constant hydrogen pressure in the anode. The shift ofthe double peak feature at high binding energies, corresponding to oxygen gas (red dottedline), is due to a change in the work function of the surface and can be used to determine thechange in surface potential. At lower binding energies the positions of the main oxygenatedspecies is shown [178, 179]: multilayer H2O (purple); H2O(ad) (orange); H2O-OH (red); OH-O (cyan); H2O-OH/Oad (blue). For clarity the spectra have been normalized to the heightof the low binding energy features. Analysis of the XPS spectra performed in collaborationwith Hernan Sanchez-Casalongue.
observed trend. As in the case of pure Pt nanoparticles [24], the increase of non-hydrated OH can be identified as the most evident spectral change: from an almostnegligible signal up to being one of the main components. A direct comparison with

6.5 In-situ observation of oxygenated surface species 113
5 4 0 5 3 8 5 3 6 5 3 4 5 3 2 5 3 0
- 0 . 8 VNorm
alized
inten
sity (a
.u.)
B i n d i n g e n e r g y / e V
f r o n t s i d e : 2 . 6 T o r r O 2b a c k s i d e : h u m i d i f i e d
b a c k s i d e : h u m i d i f i e df r o n t s i d e : 0 . 6 T o r r O 2
H 2O-OH
/ OadOH
-OH 2O-OH
H 2O (ad)
multila
yer
H 2O
Figure 6.9: Closed circuit evolution of the O 1s XPS spectra under two different O2 pres-sures at the cathode and constant anodic hydrogen pressure. The low oxygen condition(bottom) produced an electrochemical current of 5 µA, while the high oxygen condition(top) produced a current of 12 µA. The lower pressure of O2 reduced the potential of 0.8 V.At lower binding energies the positions of the main oxygenated species is shown [178, 179]:multilayer H2O (purple); H2O(ad) (orange); H2O-OH (red); OH-O (cyan); H2O-OH/Oad
(blue). For clarity the spectra have been normalized to the height of the low binding en-ergy features. Analysis of the XPS spectra performed in collaboration with Hernan Sanchez-Casalongue.
their results is complicated by the possible presence of oxygen from oxidized Y andthe difficulties of precisely compare the potential values [24]. Future experimentsaim at investigating differences in the population of non-hydrated hyrdroxides onthese Pt-Y nanoparticles with respect to pure Pt nanoparticles at different poten-tials. A higher level of non-hydrated hyrdroxides would support the theory that thestabilization of non-hydrated hydroxide can lead to higher catalytic performance.
Once the position of the peak from gaseous oxygen was stable indicating nomore changes of the open circuit potential, the electrical circuit was closed simu-lating the operation of a fuel cell. Figure 6.9 shows two O 1s spectra of this closedcircuit system at two different oxygen pressures while the pressure at the anodewas maintained constant. At high pressures a current of 12 µA is measured and

114 Towards in-situ XPS measurements
the population of non-hydrated species is considerably high. Similar to pure Ptnanoparticles [24], at lower pressures (0.6 Torr) the current decreases to 5 µAis measured, the surface potential decreases of 0.8 V and the oxygen species aremainly constituted by water. These are the first experimental evidences of a suc-cessful application of Pt-Y nanoparticle catalysts in a fuel cell.
6.6 Combined Thetaprobe and EC-cell
The initial sections of this chapter have enlightened some of the potentialities ofAP-XPS. The possibility of directly observing in-situ the dealloying mechanism andthe evolution of the oxygenated species under reaction conditions are only someexamples of a large number of experiments that could be extremely relevant, partic-ularly in catalysis. Unfortunately not many facilities in the world allow to performsuch kind of experiments. Synchrotron facilities are required and they are usuallyavailable for very limited amounts of time. Quite often it is not possible to pre-pare samples in the same laboratory and these need to be stored for a long timeand transferred before carrying out the actual characterization. It would be highlydesirable to perform these kind of experiments in the same laboratory where thesamples (e.g. Pt-Y nanoparticles) are fabricated and where all the other charac-terization techniques shown in this work are also available. Herein, the designand preparation of an experimental setup combining spectroscopic techniques (e.g.XPS, UPS, ISS) with an electrochemical cell are introduced. The construction ofthe system took good part of this Ph.D. project, in particular the Theta-Probe cham-ber has been extended with three UHV-compatible extra chambers: respectively apreparation chamber allowing sputter-cleaning, annealing and thin film deposition,an EC-compartment for electrochemical measurements under controlled clean at-mosphere and a buffer chamber for the clean transfer of samples from atmosphericpressure down to UHV conditions.
For this new combined EC-XPS system the idea is not to perform in-situ mea-surements but to facilitate the fastest and cleanest transfer between the experimen-tal stages of preparation, characterization and testing, ideally avoiding all kind ofcontaminations. This would already represent a great improvement, for instanceallowing to avoid the complications due to C and O in the model for the estimateof the Pt overlayer thickness of Chapter 4. The influence of different dealloyingconditions, for instance of different electrochemical potentials, on the Pt overlayerscould be easily studied. The fabrication of single crystal alloys would also allowto study the ORR activity of different facets as well as their differences in electro-chemical and physical stability. Valuable information could be extrapolated fromthe analysis of the d-band of these alloys probed by UPS. The characterization ofthe active phases was so far hindered by the high sensitivity of this technique tocontaminations.
Similar setups have been already developed in other laboratories. In particular,

6.6 Combined Thetaprobe and EC-cell 115
Wakisaka et al. combined an UHV system with an electrochemical cell and wereable to study the population of oxygenated species as function of potential on thesurface of Pt single crystals [23, 171].
6.6.1 Design of the EC-XPS setup
In Figure 6.10 the extended Theta-Probe setup with the new chambers and aschematic of the main parts is shown. All chambers are separated by gate valvesthat are normally only opened when the transfer arms are extended in order tomove the samples. Proceeding in order of positions the main analysis chamberof the Theta-Probe is connected to the preparation chamber. This is pumped bya 300 l/s turbopump providing a base pressure of 1 × 10⁻¹⁰ mbar. It has beenequipped with an ion gun for sputter-cleaning, an evaporator for the depositionof thin films and a Quartz Crystal Microbalance (QCM) for quantification of thedeposited amounts of material. The new gas system, also visible in Figure 6.10has been connected to this chamber through a number of leak valves, so far en-suring the dosing of clean H2, CO, Ar. An ion gauge monitors the pressure whilea quadrupole mass spectrometer will be primarily intended for Temperature Pro-grammed Desorption (TPD) experiments. A manipulator for the correct positioningof the sample is also visible in Figure 6.10. The central part of the chamber hostsa sample holder mounted on this manipulator. Its particular design allows to holddifferent kind of samples as can be seen in Figure 6.11 together with a schematicdrawing showing the main components. The samples are insulated from the rest ofthe chamber so that electrical currents to ground can be measured. Heating is con-trolled by tuning the current of a filament which can be biased down to -1 250 Vwith respect to ground, it provides heating both through irradiation and electronbeam to the backside of the sample. As a matter of fact, the Thetaprobe chamberhas not been equipped with any heating system before. This new possibility mightbe particularly relevant in the perspective of studying Pt-skin structures on the poly-crystalline alloys of this work or alternatively, on single crystal alloys. Two K-typethermocouples placed in different positions of the sample holder can measure thetemperature independently. The metallic frame of the sample holder was made inmolybdenum and all the other materials were selected so that temperatures around1 200 C can be reached. These might be required for the synthesis of some of thealloy phases described in this work [101, 156].
A second gate valve separates the preparation chamber from the buffer cham-ber, with the main function of ensuring a fast and clean transfer of samples betweenthe EC-compartment and the preparation chamber. It can be pumped separately bya diaphragm pump for removal of the initial electrolyte residues and by an 80 l/sturbopump. Another manipulator on top of this chamber combined to a simplerversion of the sample holder in Figure 6.11 allows to rotate the sample and alignit with the transfer arms. A combined Pirani and cold cathode pressure gaugemonitors the pressure in the wide range from 5 × 10⁻⁹ mbar up to atmospheric

116 Towards in-situ XPS measurements
Figure 6.10: Top view of the Theta-Probe setup on the left and its extension chambers onthe right (a). In the bottom the correspondent schematic representation with indications ofthe main components can be seen (b). In particular preparation chamber, buffer chamberand EC-compartment can be distinguished.
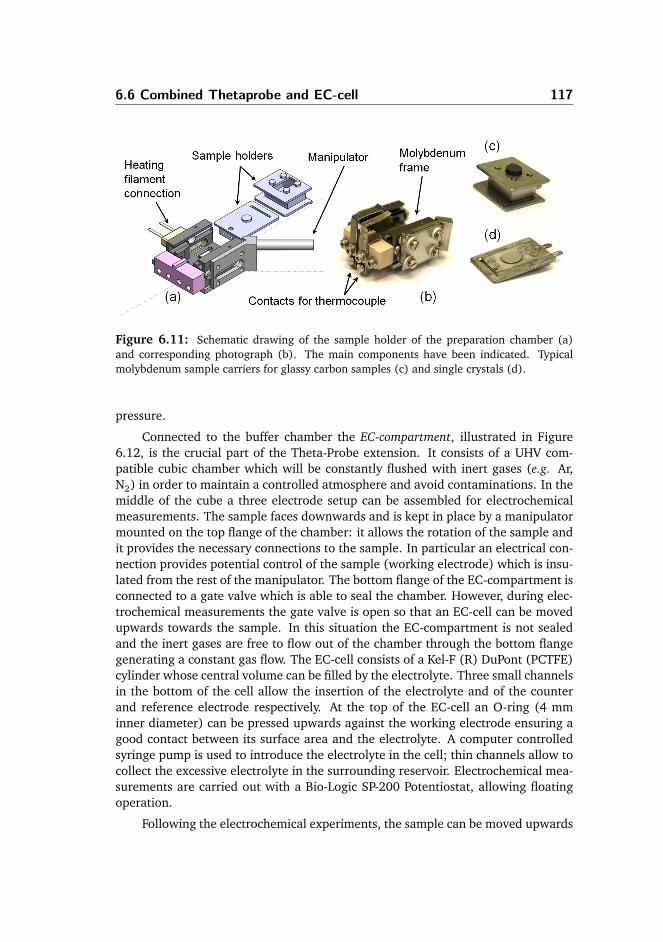
6.6 Combined Thetaprobe and EC-cell 117
Figure 6.11: Schematic drawing of the sample holder of the preparation chamber (a)and corresponding photograph (b). The main components have been indicated. Typicalmolybdenum sample carriers for glassy carbon samples (c) and single crystals (d).
pressure.
Connected to the buffer chamber the EC-compartment, illustrated in Figure6.12, is the crucial part of the Theta-Probe extension. It consists of a UHV com-patible cubic chamber which will be constantly flushed with inert gases (e.g. Ar,N2) in order to maintain a controlled atmosphere and avoid contaminations. In themiddle of the cube a three electrode setup can be assembled for electrochemicalmeasurements. The sample faces downwards and is kept in place by a manipulatormounted on the top flange of the chamber: it allows the rotation of the sample andit provides the necessary connections to the sample. In particular an electrical con-nection provides potential control of the sample (working electrode) which is insu-lated from the rest of the manipulator. The bottom flange of the EC-compartment isconnected to a gate valve which is able to seal the chamber. However, during elec-trochemical measurements the gate valve is open so that an EC-cell can be movedupwards towards the sample. In this situation the EC-compartment is not sealedand the inert gases are free to flow out of the chamber through the bottom flangegenerating a constant gas flow. The EC-cell consists of a Kel-F (R) DuPont (PCTFE)cylinder whose central volume can be filled by the electrolyte. Three small channelsin the bottom of the cell allow the insertion of the electrolyte and of the counterand reference electrode respectively. At the top of the EC-cell an O-ring (4 mminner diameter) can be pressed upwards against the working electrode ensuring agood contact between its surface area and the electrolyte. A computer controlledsyringe pump is used to introduce the electrolyte in the cell; thin channels allow tocollect the excessive electrolyte in the surrounding reservoir. Electrochemical mea-surements are carried out with a Bio-Logic SP-200 Potentiostat, allowing floatingoperation.
Following the electrochemical experiments, the sample can be moved upwards

118 Towards in-situ XPS measurements
Figure 6.12: Schematic drawing of the EC-compartment hosting the EC-cell. The maincomponents are indicated.
and extracted from the electrolyte under potential control in the inert atmosphereof the EC-cell. It is then readily moved to the buffer chamber while keeping it in Aror N2. Once the buffer chamber is sealed from the EC-cell, it is first pumped downby the membrane pump to remove possible electrolyte residues and just afterwardsby the turbopump. As soon as good vacuum conditions are reached the sample canbe moved to the preparation chamber, where for instance, it can be mildly annealedin order to remove residual adsorbed water from the surface, or transferred directlyto the Theta-Probe setup for characterization.

CHAPTER 7
Conclusions andperspectives
The experimental studies of this thesis have given some examples of how spectro-scopic techniques, in particular XPS with its more advanced versions of AR-XPSand AP-XPS, can be successfully applied to the study of electrocatalysts for PEM-FCs. These techniques played an essential role in the development of a new classof bimetallic catalysts for the ORR. From the pioneering study on alloys of Pt andearly transition metals such as Pt3Y and Pt3Sc [16] considerable advances towardsthe understanding of these catalysts were made [6, 98, 100, 101, 126, 132](Papers1-6 in the end of this thesis). These allowed to extend the number of possible can-didates for a future application at the cathode of PEMFCs: "alloys of Pt and rareearths" is now a more general classification, with solute metals consisting either ofearly transition metals or lanthanide metals. Some alloys of Pt and alkaline earthswere also found to be promising ORR catalysts.
Polycrystalline alloys
The first part of this work focused on the physical and electrochemical characteriza-tion of various Pt-lanthanide polycrystalline alloys. Remarkably, they all consist ofintermetallic compounds, not to confuse them with disordered solid solutions. Thismeans that their structures are highly ordered, often radically different from theclosed-packed structure of Pt; each phase has a peculiar heat of formation whichturns out to be very negative for all the tested Pt5Ln alloys and similar to that of

120 Conclusions and perspectives
Pt3Y and Pt3Sc, indicating the high thermodynamic stability of these compounds.The example of Pt3La, which was found to corrode in acid, stresses the importanceof identifying and selecting the right intermetallic phase, as both ORR activity andstability of these catalysts might vary substantially from one to another.
XPS and ISS were applied extensively in order to clarify the active surfacephase and surface structure of Pt-La and Pt-Ce alloys and, more generally, of allthese Pt and rare earths alloys: as a matter of fact, from this point of view, theyall behave similarly. Despite the stabilizing effect of the alloy, the high level of re-activity of the rare earths makes these elements highly susceptible to oxidation inair when they are present on the surface of these materials. As a result they areleached away from the first few superficial layers in acid, leaving a Pt-overlayer(Pt-skeleton) which is approximately 1 nm thick. This Pt overlayer provides kineticstability against further dealloying of these intermetallic phases, which in somecases were found to be very stable upon potential cycling. Pt5La and Pt5Ce forinstance, exhibiting an initial ORR activity 3-4 times higher than that of polycrys-talline Pt, retained at least 90 % of this initial activity after 10 000 cycles between0.6 and 1.0 V vs. RHE in 0.1 M HClO4 electrolyte.
The presence of a thick Pt overlayer excluded bifunctional effects and ligandeffects from the possible mechanisms of activity enhancement. These must be re-lated to strain effects. On the basis of the similar bulk structures characterizing allthe Pt5Ln alloys, it was possible to establish a correlation between the bulk latticeparameter a of these materials and their ORR activities. In particular the latticeconstant a is expected to define the Pt-Pt distance in the overlayer. When thisassumption is taken into consideration a volcano trend appears. Initially, a com-pression of the Pt-Pt distance (relative to pure Pt) corresponds to an increase ofORR activity, as expected from theory since it should weaken the binding energy tothe ORR intermediates. At higher levels of compression this trend is reversed andthe ORR activity goes down. The maximum activity was reached by Pt5Tb, witha specific activity of 11.2 mA cm−2. This value is almost 6 times higher than thatof state-of-the-art polycrystalline Pt. To the best of our knowledge this is the mostactive polycrystalline surface ever reported. It should be noted that strain relax-ations are expected to occur in the Pt overlayer, this would result in effective Pt-Ptdistances at the surface active sites which are closer to the one of pure Pt.
In terms of stability trends, the most active polycrystalline alloys were notfound to be the most stable. On the contrary, there are some evidences that a higherlevel compression of the Pt-Pt distance in the overlayer corresponds to higher lossesin activity during potential cycling. This would be in agreement with DFT calcu-lations on the stability of the Pt overlayers. In order to further investigate this, amodel for the analysis of the AR-XPS results was introduced with the purpose ofquantitatively estimating the thickness of the Pt overlayers. While most of the al-loys exhibit similar thicknesses after ORR, after stability tests the situation changes.Higher losses in activity relate well with the level of thickening of the overlayer indi-cating a direct relationship between chemical and physical stability. The dealloying

121
mechanism seems the main reason of deactivation, probably because a thicker Ptoverlayer intensifies the effect of strain relaxations. The model also seems to con-firm that more compressed overlayers have a lower resistance against dealloying.
It should be noted that, even after stability tests, most of the presented Pt5Lnalloys are still 3 times more active than polycrystalline Pt: more than 4 times inthe case of Pt5Gd which seems to represent the best compromise of activity andstability. Similarly prepared alloys of Pt and late transition metals only exhibited afactor of activity enhancement around 2, before an analogous stability test. Alloysof Pt and rare earths can therefore be considered as promising catalysts for theapplication in PEMFCs, even though there is still no direct proof that their morenegative heat of alloy formation would result in a higher long-term stability.
Pt-Y nanoparticles
The application of these materials in a fuel cell would require the fabrication oflarge surface area catalysts. The second part of this work focused on Pt-Y nanopar-ticles produced through a physical method. The combination of a gas aggregationtechnique and a time-of-flight mass spectrometer allowed the deposition of size-selected Pt-Y nanoparticles onto glassy carbon supports. The mass activity of the 9nm Pt-Y nanoparticles (3.05 A mg−1
Pt ) is one of the highest ever reported, more than5 times higher than the one of state-of-the-art Pt/C. Interestingly, the specific activ-ity of these bimetallic nanoparticles increases monotonically with particle size (inthe tested range of sizes), while pure Pt nanoparticles exhibit a maximum for a sizeof about 3 nm. This difference is probably due to the process of surface dealloyingwhich originates a typical core-shell structure. Similar to the case of polycrystallinesamples, a 1 nm thick Pt shell surrounds an alloyed core. Similarly, the activityenhancement is ascribed to strain effects. The presence of a bigger core in thelarge particles produces a higher level of compression of the nearest neighbour Pt-Pt distance leading to a higher specific activity. The activity losses after stabilitytests were 37 % in the case of the most active 9 nm Pt-Y nanoparticles. Similar orhigher losses have been reported for most of the nanoparticles based on alloys ofPt and late transition metals, despite the high level of optimization achieved aftertwo decades of studies.
The 9 nm Pt-Y nanoparticles were deposited on the cathode side of a Mem-brane Electrode Assembly (MEA), part of a specifically prepared fuel cell that al-lows AP-XPS measurements under operation conditions. By applying potential cy-cles under different pressures of H2O or O2 the oxidation of Y, due to the processof dealloying, was observed in situ. By focusing on the O 1s XPS signal the evo-lution of the adsorbed oxygenated species can be followed as a function of theelectrochemical potential. At high potentials, close to the OCP as well as underoperating conditions with high partial pressures of O2, a shift of the O 1s XPS to-wards lower binding energies is measured. It corresponds to a higher population of

122 Conclusions and perspectives
non-hydrated species, in particular non-hydrated OH, similar to what was reportedfor pure Pt nanoparticles.
Perspectives
The observed trends in activity and stability will need to be confirmed by a fewmore experiments on polycrystalline alloys. In all cases they already indicate vari-ous promising materials for application at the cathode of PEMFCs. The studies onpolycrystalline alloys did not really allow to investigate the effect of composition onthe catalytic performance of these alloys. However, we anticipate that it will prob-ably be hard to overcome the stability of some ordered intermetallic phases andthese will put strict requirements in terms of alloy stoichiometry. The comparisonwith polycrystalline alloys of Pt and late transition metals might elucidate the roleof more negative heats of alloy formation on stability, since this was the originalreason motivating our search of new materials for catalyzing the ORR. However,definitive conclusions will probably require a stability comparison between simi-larly prepared nanoparticles.
At the current level of knowledge, a better understanding of the catalytic prop-erties of these new materials will most probably require the study of single crystals.Studies that were already initiated in the case of the Pt-Y system [101] (Paper 4in the end of this thesis). Single crystals of these intermetallic compounds wouldallow, not only to achieve a more precise characterization, but most importantly toselect single ordered facets and distinguish their behaviour in terms of activity andstability. Some of them might exhibit outstanding activities, similar or higher thanthat of Pt3Ni(111) [39]. In this perspective the realization of Pt-skin structures andtheir stabilization in acidic electrolytes will probably be the main challenge. Thecompletion of the EC-XPS setup will help to characterize these single crystal alloysand to investigate their electronic structures by XPS and UPS.
Similar challenges will also concern the Pt-Y (or Pt-rare earth) nanoparticles.Also in this case the improvement of their catalytic activity and stability will proba-bly require an enhanced level of ordering. On the basis of the progresses achievedon large surface area catalysts of Pt and late transition metals, the optimizationof acid leaching and annealing procedures is expected to stabilize more orderedstructures, with advantages both in terms of activity and stability. Tuning the mor-phology of the particles in order to select particular facets and active sites of theseordered structures might bring further advances.
Finally, the biggest challenge will probably be the development of an eco-nomically viable and scalable process for the production of nanoparticles based onthese new alloys. Various synthesis methods are currently under investigation. Theproduction of thin films in perspective of an application onto nanostructured sub-strates might represent another promising alternative towards the fabrication oflarge surface area catalysts.

APPENDIX A
Components of La 3d andCe 3d XPS spectra

124 Components of La 3d and Ce 3d XPS spectra
!
Pt5La Binding Energy La3d 5/2 (eV) Binding Energy La3d 3/2 (eV) Relative intensity (%)
La La3+ La La3+ La La3+ f0 f1 f0 f1 f0 f1 f0 f1 f0 f1 f0 f1
As-prepared 836.3 832.7 - - 853.0 849.4 - - 71 29 - - After air-exposure 836.3 832.7 838.4 835.0 853.0 849.3 855.2 851.7 49 14 18 19 After ORR 836.1 832.5 - - 852.8 849.2 - - 66 34 - - After stability 836.1 832.5 - - 852.8 849.2 - - 66 34 - -
Pt5Ce Binding Energy La3d 5/2 (eV) Binding Energy La3d 3/2 (eV) Relative intensity (%)
Ce Ce4+ Ce Ce4+ Ce Ce4+ f0 f1 f2 f0 f1 f2 f0 f1 f2 f0 f1 f2 f0 f1 f2 f0 f1 f2
As-prepared 896.6 884.4 880.1 - - - 914.9 903.1 898.7 - - - 5 66 28 - - - After air-exposure 896.5 884.4 880.1 897.9 887.0 881.8 914.9 903.1 898.7 916.2 906.0 900.4 3 35 15 15 16 16 After ORR 896.8 884.2 879.8 - - - 914.9 902.6 898.3 - - - 10 75 15 - - - After stability 896.8 884.4 879.8 - - - 914.9 903.0 898.6 - - - 9 73 18 - - -
Pt3La Binding Energy La3d 5/2 (eV) Binding Energy La3d 3/2 (eV) Relative intensity (%)
La La3+ La La3+ La La3+ f0 f1 f0 f1 f0 f1 f0 f1 f0 f1 f0 f1
As-prepared 836.4 832.8 - - 853.1 849.5 - - 69 31 - - After air-exposure 836.4 832.8 838.2 834.6 853.0 849.4 855.0 851.3 42 19 18 21 After ORR 836.1 832.5 - - 852.8 849.2 - - 66 34 - - After stability - - - - - - - - - - - -
Table A.1: Binding energies and relative intensities of the XPS peaks for Pt5La, Pt5Ce andPt3La [126]. The fn components of the La 3d and Ce 3d spectra have been divided intometallic species (La and Ce) and oxidized species (La3+ and Ce4+).

Bibliography
[1] W. Reitz. ‘Handbook of fuel cells: fundamentals, technology, and applica-tions, (volume 2) W. Vielstich, A. Lamm, and Hubert A. Gasteiger (editors).’Materials and Manufacturing Processes 22(6):789–789 (2007).
[2] H. A. Gasteiger & J. Garche. ‘Fuel cells.’ In Handbook of HeterogeneousCatalysis. Wiley-VCH Verlag GmbH & Co. KGaA (2008).
[3] H. A. Gasteiger, S. S. Kocha, B. Sompalli, & F. T. Wagner. ‘Activity benchmarksand requirements for Pt, Pt-alloy, and non-Pt oxygen reduction catalysts forPEMFCs.’ Applied Catalysis B: Environmental 56(1–2):9–35 (2005).
[4] U. Eberle, B. Müller, & R. v. Helmolt. ‘Fuel cell electric vehicles and hydrogeninfrastructure: status 2012.’ Energy & Environmental Science 5(10):8780–8798 (2012).
[5] P. C. K. Vesborg & T. F. Jaramillo. ‘Addressing the terawatt challenge: scalabil-ity in the supply of chemical elements for renewable energy.’ RSC Advances2(21):7933–7947 (2012).
[6] I. E. L. Stephens, A. S. Bondarenko, U. Grønbjerg, J. Rossmeisl, & I. Chork-endorff. ‘Understanding the electrocatalysis of oxygen reduction on plat-inum and its alloys.’ Energy & Environmental Science 5(5):6744–6762(2012).
[7] M. K. Debe. ‘Electrocatalyst approaches and challenges for automotive fuelcells.’ Nature 486(7401):43–51 (2012).
[8] M. Pourbaix. Atlas of electrochemical equilibria in aqueous solutions. NationalAssociation Of Corrosion (1974).

126 BIBLIOGRAPHY
[9] Y. Shao-Horn, W. C. Sheng, S. Chen, P. J. Ferreira, E. F. Holby, & D. Mor-gan. ‘Instability of supported platinum nanoparticles in low-temperaturefuel cells.’ Topics in Catalysis 46(3-4):285–305 (2007).
[10] K. J. J. Mayrhofer, K. Hartl, V. Juhart, & M. Arenz. ‘Degradation of carbon-supported Pt bimetallic nanoparticles by surface segregation.’ Journal of theAmerican Chemical Society 131(45):16348–16349 (2009).
[11] A. A. Topalov, I. Katsounaros, M. Auinger, S. Cherevko, J. C. Meier, S. O.Klemm, & K. J. J. Mayrhofer. ‘Dissolution of platinum: Limits for the de-ployment of electrochemical energy conversion?’ Angewandte Chemie Inter-national Edition 51(50):12613–12615 (2012).
[12] C. W. B. Bezerra, L. Zhang, K. Lee, H. Liu, A. L. B. Marques, E. P. Marques,H. Wang, & J. Zhang. ‘A review of Fe–N/C and Co–N/C catalysts for theoxygen reduction reaction.’ Electrochimica Acta 53(15):4937–4951 (2008).
[13] Z. Chen, D. Higgins, A. Yu, L. Zhang, & J. Zhang. ‘A review on non-preciousmetal electrocatalysts for PEM fuel cells.’ Energy & Environmental Science4(9):3167–3192 (2011).
[14] P. Sabatier. ‘Hydrogénations et déshydrogénations par catalyse.’ Berichte derdeutschen chemischen Gesellschaft 44(3):1984–2001 (1911).
[15] I. Chorkendorff & J. W. Niemantsverdriet. Concepts of modern catalysis andkinetics. Wiley-VCH, Weinheim (2007).
[16] J. Greeley, I. E. L. Stephens, A. S. Bondarenko, T. P. Johansson, H. A. Hansen,T. F. Jaramillo, J. Rossmeisl, I. Chorkendorff, & J. K. Nørskov. ‘Alloys ofplatinum and early transition metals as oxygen reduction electrocatalysts.’Nature Chemistry 1(7):552–556 (2009).
[17] J. Rossmeisl, G. S. Karlberg, T. Jaramillo, & J. K. Nørskov. ‘Steady state oxy-gen reduction and cyclic voltammetry.’ Faraday Discussions 140:337 (2009).
[18] G. S. Karlberg, J. Rossmeisl, & J. K. Nørskov. ‘Estimations of electric fieldeffects on the oxygen reduction reaction based on the density functionaltheory.’ Physical Chemistry Chemical Physics 9(37):5158–5161 (2007).
[19] J. K. Nørskov, J. Rossmeisl, A. Logadottir, L. Lindqvist, J. R. Kitchin, T. Bli-gaard, & H. Jónsson. ‘Origin of the overpotential for oxygen reduction ata fuel-cell cathode.’ The Journal of Physical Chemistry B 108(46):17886–17892 (2004).
[20] A. Damjanovic & V. Brusic. ‘Electrode kinetics of oxygen reduction on oxide-free platinum electrodes.’ Electrochimica Acta 12(6):615–628 (1967).

BIBLIOGRAPHY 127
[21] A. A. Gewirth & M. S. Thorum. ‘Electroreduction of dioxygen for fuel-cellapplications: materials and challenges.’ Inorganic Chemistry 49(8):3557–3566 (2010).
[22] A. S. Bondarenko, I. E. L. Stephens, H. A. Hansen, F. J. Pérez-Alonso, V. Trip-kovic, T. P. Johansson, J. Rossmeisl, J. K. Nørskov, & I. Chorkendorff. ‘ThePt(111)/electrolyte interface under oxygen reduction reaction conditions:an electrochemical impedance spectroscopy study.’ Langmuir 27(5):2058–2066 (2011).
[23] M. Wakisaka, H. Suzuki, S. Mitsui, H. Uchida, & M. Watanabe. ‘Identifica-tion and quantification of oxygen species adsorbed on Pt(111) single-crystaland polycrystalline Pt electrodes by photoelectron spectroscopy.’ Langmuir25(4):1897–1900 (2009).
[24] H. S. Casalongue, S. Kaya, V. Viswanathan, D. J. Miller, D. Friebel, H. A.Hansen, J. K. Nørskov, A. Nilsson, & H. Ogasawara. ‘Direct observationof the oxygenated species during oxygen reduction on a platinum fuel cellcathode.’ Nature Communications 4 (2013).
[25] A. B. Anderson & T. V. Albu. ‘Ab initio determination of reversible poten-tials and activation energies for outer-sphere oxygen reduction to water andthe reverse oxidation reaction.’ Journal of the American Chemical Society121(50):11855–11863 (1999).
[26] C. D. Taylor, S. A. Wasileski, J.-S. Filhol, & M. Neurock. ‘First principlesreaction modeling of the electrochemical interface: consideration and cal-culation of a tunable surface potential from atomic and electronic structure.’Physical Review B 73(16):165402 (2006).
[27] J. Rossmeisl, E. Skúlason, M. E. Björketun, V. Tripkovic, & J. K. Nørskov.‘Modeling the electrified solid-liquid interface.’ Chemical Physics Letters466(1-3):68–71 (2008).
[28] E. Skúlason, V. Tripkovic, M. E. Björketun, S. Gudmundsdóttir, G. Karl-berg, J. Rossmeisl, T. Bligaard, H. Jónsson, & J. K. Nørskov. ‘Modeling theelectrochemical hydrogen oxidation and evolution reactions on the basisof density functional theory calculations.’ Journal of Physical Chemistry C114(42):18182–18197 (2010).
[29] J. K. Nørskov, T. Bligaard, A. Logadottir, S. Bahn, L. B. Hansen, M. Bollinger,H. Bengaard, B. Hammer, Z. Sljivancanin, M. Mavrikakis, Y. Xu, S. Dahl,& C. J. H. Jacobsen. ‘Universality in heterogeneous catalysis.’ Journal ofCatalysis 209(2):275–278 (2002).
[30] P. Nieto, E. Pijper, D. Barredo, G. Laurent, R. A. Olsen, E.-J. Baerends, G.-J.Kroes, & D. Farías. ‘Reactive and nonreactive scattering of H2 from a metalsurface is electronically adiabatic.’ Science 312(5770):86–89 (2006).

128 BIBLIOGRAPHY
[31] P. Strasser, S. Koh, T. Anniyev, J. Greeley, K. More, C. Yu, Z. Liu, S. Kaya,D. Nordlund, H. Ogasawara, M. F. Toney, & A. Nilsson. ‘Lattice-strain controlof the activity in dealloyed core-shell fuel cell catalysts.’ Nature Chemistry2(6):454–460 (2010).
[32] V. Tripkovic, E. Skúlason, S. Siahrostami, J. K. Nørskov, & J. Rossmeisl. ‘Theoxygen reduction reaction mechanism on Pt(111) from density functionaltheory calculations.’ Electrochimica Acta 55(27):7975–7981 (2010).
[33] M. J. Janik, C. D. Taylor, & M. Neurock. ‘First-principles analysis of the initialelectroreduction steps of oxygen over Pt(111).’ Journal of the Electrochemi-cal Society 156(1):B126–B135 (2009).
[34] J. Rossmeisl, A. Logadottir, & J. K. Nørskov. ‘Electrolysis of water on (oxi-dized) metal surfaces.’ Chemical Physics 319(1–3):178–184 (2005).
[35] T. Toda, H. Igarashi, H. Uchida, & M. Watanabe. ‘Enhancement of the elec-troreduction of oxygen on Pt alloys with Fe, Ni, and Co.’ Journal of theElectrochemical Society 146(10):3750–3756 (1999).
[36] V. Stamenkovic, T. J. Schmidt, P. N. Ross, & N. M. Markovic. ‘Surface com-position effects in electrocatalysis: Kinetics of oxygen reduction on well-defined Pt3Ni and Pt3Co alloy surfaces.’ The Journal of Physical Chemistry B106(46):11970–11979 (2002).
[37] V. R. Stamenkovic, B. S. Mun, K. J. J. Mayrhofer, P. N. Ross, & N. M. Markovic.‘Effect of surface composition on electronic structure, stability, and electro-catalytic properties of Pt-transition metal alloys: Pt-skin versus Pt-skeletonsurfaces.’ Journal of the American Chemical Society 128(27):8813–8819(2006).
[38] V. Stamenkovic, B. S. Mun, K. J. J. Mayrhofer, P. N. Ross, N. M. Markovic,J. Rossmeisl, J. Greeley, & J. K. Nørskov. ‘Changing the activity of electro-catalysts for oxygen reduction by tuning the surface electronic structure.’Angewandte Chemie 118(18):2963–2967 (2006).
[39] V. R. Stamenkovic, B. Fowler, B. S. Mun, G. Wang, P. N. Ross, C. A. Lucas,& N. M. Markovic. ‘Improved oxygen reduction activity on Pt3Ni(111) viaincreased surface site availability.’ Science 315(5811):493–497 (2007).
[40] R. Yang, J. Leisch, P. Strasser, & M. F. Toney. ‘Structure of dealloyed PtCu3thin films and catalytic activity for oxygen reduction.’ Chemistry of Materials22(16):4712–4720 (2010).
[41] R. Yang, P. Strasser, & M. F. Toney. ‘Dealloying of Cu3Pt(111) studied bysurface X-ray scattering.’ The Journal of Physical Chemistry C 115(18):9074–9080 (2011).

BIBLIOGRAPHY 129
[42] N. Wakabayashi, M. Takeichi, H. Uchida, & M. Watanabe. ‘Temperaturedependence of oxygen reduction activity at Pt-Fe, Pt-Co, and Pt-Ni alloyelectrodes.’ Journal of Physical Chemistry B 109(12):5836–5841 (2005).
[43] S. Koh & P. Strasser. ‘Electrocatalysis on bimetallic surfaces: modifying cat-alytic reactivity for oxygen reduction by voltammetric surface dealloying.’Journal of the American Chemical Society 129(42):12624–12625 (2007).
[44] V. R. Stamenkovic, B. S. Mun, M. Arenz, K. J. J. Mayrhofer, C. A. Lu-cas, G. Wang, P. N. Ross, & N. M. Markovic. ‘Trends in electrocatalysison extended and nanoscale Pt-bimetallic alloy surfaces.’ Nature Materials6(3):241–247 (2007).
[45] L.-J. Wan, T. Moriyama, M. Ito, H. Uchida, & M. Watanabe. ‘In situ STMimaging of surface dissolution and rearrangement of a Pt–Fe alloy electrocat-alyst in electrolyte solution.’ Chemical Communications 1(1):58–59 (2002).
[46] Y. Gauthier, Y. Joly, R. Baudoing, & J. Rundgren. ‘Surface-sandwich segre-gation on nondilute bimetallic alloys: Pt50Ni50 and Pt78Ni22 probed by low-energy electron diffraction.’ Physical Review B 31(10):6216–6218 (1985).
[47] J. Zhang, M. B. Vukmirovic, Y. Xu, M. Mavrikakis, & R. R. Adzic. ‘Controllingthe catalytic activity of platinum-monolayer electrocatalysts for oxygen re-duction with different substrates.’ Angewandte Chemie International Edition44(14):2132–2135 (2005).
[48] N. Todoroki, Y. Iijima, R. Takahashi, Y. Asakimori, & T. Wadayama. ‘Struc-ture and electrochemical stability of Pt-enriched Ni/Pt(111) topmost surfaceprepared by molecular beam epitaxy.’ Journal of The Electrochemical Society160(6):F591–F596 (2013).
[49] P. B. Balbuena, D. Altomare, N. Vadlamani, S. Bingi, L. A. Agapito, & J. M.Seminario. ‘Adsorption of O, OH, and H2O on Pt-based bimetallic clus-ters alloyed with Co, Cr, and Ni.’ The Journal of Physical Chemistry A108(30):6378–6384 (2004).
[50] Y. Xu, A. V. Ruban, & M. Mavrikakis. ‘Adsorption and dissociation ofO2 on Pt-Co and Pt-Fe alloys.’ Journal of the American Chemical Society126(14):4717–4725 (2004).
[51] M. Teliska, V. S. Murthi, S. Mukerjee, & D. E. Ramaker. ‘Correlation of wateractivation, surface properties, and oxygen reduction reactivity of supportedPt–M/C bimetallic electrocatalysts using XAS.’ Journal of The ElectrochemicalSociety 152(11):A2159–A2169 (2005).
[52] J. R. Kitchin, J. K. Nørskov, M. A. Barteau, & J. G. Chen. ‘Modification ofthe surface electronic and chemical properties of Pt(111) by subsurface 3d

130 BIBLIOGRAPHY
transition metals.’ The Journal of Chemical Physics 120(21):10240–10246(2004).
[53] B. Hammer & J. K. Nørskov. ‘Theoretical surface science and catalysis-calculations and concepts.’ In H. K. Bruce C. Gates, ed., Advances in Catal-ysis, vol. Volume 45 of Impact of Surface Science on Catalysis, pp. 71–129.Academic Press (2000).
[54] M. Mavrikakis, B. Hammer, & J. K. Nørskov. ‘Effect of strain on the reactivityof metal surfaces.’ Physical Review Letters 81(13):2819–2822 (1998).
[55] J. R. Kitchin, J. K. Nørskov, M. A. Barteau, & J. G. Chen. ‘Role of strain andligand effects in the modification of the electronic and chemical propertiesof bimetallic surfaces.’ Physical Review Letters 93(15):156801 (2004).
[56] I. E. L. Stephens, A. S. Bondarenko, F. J. Perez-Alonso, F. Calle-Vallejo,L. Bech, T. P. Johansson, A. K. Jepsen, R. Frydendal, B. P. Knudsen, J. Ross-meisl, & I. Chorkendorff. ‘Tuning the activity of Pt(111) for oxygen elec-troreduction by subsurface alloying.’ Journal of the American Chemical Soci-ety 133(14):5485–5491 (2011).
[57] B. Cordero, V. Gómez, A. E. Platero-Prats, M. Revés, J. Echeverría, E. Cre-mades, F. Barragán, & S. Alvarez. ‘Covalent radii revisited.’ Dalton Transac-tions 1(21):2832–2838 (2008).
[58] A. Bonakdarpour, J. Wenzel, D. A. Stevens, S. Sheng, T. L. Monchesky, R. Lö-bel, R. T. Atanasoski, A. K. Schmoeckel, G. D. Vernstrom, M. K. Debe, & J. R.Dahn. ‘Studies of transition metal dissolution from combinatorially sput-tered, nanostructured Pt1−x M x (M = Fe, Ni; 0 < x < 1 ) electrocatalystsfor PEM fuel cells.’ Journal of The Electrochemical Society 152(1):A61–A72(2005).
[59] M. K. Debe, A. K. Schmoeckel, G. D. Vernstrom, & R. Atanasoski. ‘Highvoltage stability of nanostructured thin film catalysts for PEM fuel cells.’Journal of Power Sources 161(2):1002–1011 (2006).
[60] D. van der Vliet, C. Wang, M. Debe, R. Atanasoski, N. M. Markovic, & V. R.Stamenkovic. ‘Platinum-alloy nanostructured thin film catalysts for the oxy-gen reduction reaction.’ Electrochimica Acta 56(24):8695–8699 (2011).
[61] D. F. v. d. Vliet, C. Wang, D. Tripkovic, D. Strmcnik, X. F. Zhang, M. K. Debe,R. T. Atanasoski, N. M. Markovic, & V. R. Stamenkovic. ‘Mesostructured thinfilms as electrocatalysts with tunable composition and surface morphology.’Nature Materials 11(12):1051–1058 (2012).
[62] J. Kibsgaard, Y. Gorlin, Z. Chen, & T. F. Jaramillo. ‘Meso-structured platinumthin films: Active and stable electrocatalysts for the oxygen reduction reac-tion.’ Journal of the American Chemical Society 134(18):7758–7765 (2012).

BIBLIOGRAPHY 131
[63] G. A. Tritsaris, J. Greeley, J. Rossmeisl, & J. K. Nørskov. ‘Atomic-scale model-ing of particle size effects for the oxygen reduction reaction on Pt.’ CatalysisLetters 141(7):909–913 (2011).
[64] F. J. Perez-Alonso, D. N. McCarthy, A. Nierhoff, P. Hernandez-Fernandez,C. Strebel, I. E. L. Stephens, J. H. Nielsen, & I. Chorkendorff. ‘The effectof size on the oxygen electroreduction activity of mass-selected platinumnanoparticles.’ Angewandte Chemie International Edition 51(19):4641–4643(2012).
[65] F. Maillard, S. Pronkin, & E. R. Savinova. ‘Influence of size on the elec-trocatalytic activities of supported metal nanoparticles in fuel cells relatedreactions.’ In Handbook of Fuel Cells. John Wiley & Sons, Ltd (2010).
[66] C. Wang, H. Daimon, T. Onodera, T. Koda, & S. Sun. ‘A general approachto the size- and shape-controlled synthesis of platinum nanoparticles andtheir catalytic reduction of oxygen.’ Angewandte Chemie International Edi-tion 47(19):3588–3591 (2008).
[67] V. Komanicky, H. Iddir, K.-C. Chang, A. Menzel, G. Karapetrov, D. Hennessy,P. Zapol, & H. You. ‘Shape-dependent activity of platinum array catalyst.’Journal of the American Chemical Society 131(16):5732–5733 (2009).
[68] S. Mostafa, F. Behafarid, J. R. Croy, L. K. Ono, L. Li, J. C. Yang, A. I. Frenkel,& B. R. Cuenya. ‘Shape-dependent catalytic properties of Pt nanoparticles.’Journal of the American Chemical Society 132(44):15714–15719 (2010).
[69] B. Roldan Cuenya. ‘Metal nanoparticle catalysts beginning to shape-up.’Accounts of Chemical Research 46(8):1682–1691 (2013).
[70] M. Nesselberger, M. Roefzaad, R. Fayçal Hamou, P. Ulrich Biedermann, F. F.Schweinberger, S. Kunz, K. Schloegl, G. K. H. Wiberg, S. Ashton, U. Heiz,K. J. J. Mayrhofer, & M. Arenz. ‘The effect of particle proximity on theoxygen reduction rate of size-selected platinum clusters.’ Nature Materials12(10):919–924 (2013).
[71] S. Mukerjee & S. Srinivasan. ‘Enhanced electrocatalysis of oxygen reductionon platinum alloys in proton exchange membrane fuel cells.’ Journal ofElectroanalytical Chemistry 357(1–2):201–224 (1993).
[72] S. Mukerjee, S. Srinivasan, M. P. Soriaga, & J. McBreen. ‘Role of structuraland electronic properties of Pt and Pt alloys on electrocatalysis of oxygenreduction an in situ XANES and EXAFS investigation.’ Journal of The Elec-trochemical Society 142(5):1409–1422 (1995).
[73] U. Paulus, A. Wokaun, G. Scherer, T. Schmidt, V. Stamenkovic, N. Markovic,& P. Ross. ‘Oxygen reduction on high surface area Pt-based alloy catalysts

132 BIBLIOGRAPHY
in comparison to well defined smooth bulk alloy electrodes.’ ElectrochimicaActa 47(22–23):3787–3798 (2002).
[74] P. Yu, M. Pemberton, & P. Plasse. ‘PtCo/C cathode catalyst for improveddurability in PEMFCs.’ Journal of Power Sources 144(1):11–20 (2005).
[75] M. Nesselberger, S. Ashton, J. C. Meier, I. Katsounaros, K. J. J. Mayrhofer, &M. Arenz. ‘The particle size effect on the oxygen reduction reaction activityof Pt catalysts: Influence of electrolyte and relation to single crystal models.’Journal of the American Chemical Society 133(43):17428–17433 (2011).
[76] S. Chen, H. A. Gasteiger, K. Hayakawa, T. Tada, & Y. Shao-Horn. ‘Platinum-alloy cathode catalyst degradation in proton exchange membrane fuel cells:nanometer-scale compositional and morphological changes.’ Journal of TheElectrochemical Society 157(1):A82–A97 (2010).
[77] F. Maillard, L. Dubau, J. Durst, M. Chatenet, J. André, & E. Rossinot. ‘Dura-bility of Pt3Co/C nanoparticles in a proton-exchange membrane fuel cell:direct evidence of bulk Co segregation to the surface.’ Electrochemistry Com-munications 12(9):1161–1164 (2010).
[78] A. Zana, J. Speder, M. Roefzaad, L. Altmann, M. Bäumer, & M. Arenz.‘Probing degradation by IL-TEM: the influence of stress test conditionson the degradation mechanism.’ Journal of The Electrochemical Society160(6):F608–F615 (2013).
[79] K. C. Neyerlin, R. Srivastava, C. Yu, & P. Strasser. ‘Electrochemical activityand stability of dealloyed Pt–Cu and Pt–Cu–Co electrocatalysts for the oxy-gen reduction reaction (ORR).’ Journal of Power Sources 186(2):261–267(2009).
[80] C. Wang, M. Chi, D. Li, D. Strmcnik, D. van der Vliet, G. Wang, V. Koman-icky, K.-C. Chang, A. P. Paulikas, D. Tripkovic, J. Pearson, K. L. More, N. M.Markovic, & V. R. Stamenkovic. ‘Design and synthesis of bimetallic electro-catalyst with multilayered Pt-skin surfaces.’ Journal of the American Chemi-cal Society 133(36):14396–14403 (2011).
[81] L. Gan, M. Heggen, R. O’Malley, B. Theobald, & P. Strasser. ‘Understand-ing and controlling nanoporosity formation for improving the stability ofbimetallic fuel cell catalysts.’ Nano Letters 13(3):1131–1138 (2013).
[82] D. Wang, H. L. Xin, R. Hovden, H. Wang, Y. Yu, D. A. Muller, F. J. DiSalvo, &H. D. Abruña. ‘Structurally ordered intermetallic platinum–cobalt core–shellnanoparticles with enhanced activity and stability as oxygen reduction elec-trocatalysts.’ Nature Materials 12(1):81–87 (2013).

BIBLIOGRAPHY 133
[83] K. Mayrhofer, V. Juhart, K. Hartl, M. Hanzlik, & M. Arenz. ‘Adsorbate-induced surface segregation for core-shell nanocatalysts.’ AngewandteChemie International Edition 48(19):3529–3531 (2009).
[84] M.-H. Shao, K. Sasaki, & R. R. Adzic. ‘Pd-Fe nanoparticles as electro-catalysts for oxygen reduction.’ Journal of the American Chemical Society128(11):3526–3527 (2006).
[85] K. A. Kuttiyiel, K. Sasaki, Y. Choi, D. Su, P. Liu, & R. R. Adzic. ‘BimetallicIrNi core platinum monolayer shell electrocatalysts for the oxygen reductionreaction.’ Energy & Environmental Science 5(1):5297–5304 (2012).
[86] K. Sasaki, H. Naohara, Y. Choi, Y. Cai, W.-F. Chen, P. Liu, & R. R. Adzic.‘Highly stable Pt monolayer on PdAu nanoparticle electrocatalysts for theoxygen reduction reaction.’ Nature Communications 3:1115 (2012).
[87] J. Wu, J. Zhang, Z. Peng, S. Yang, F. T. Wagner, & H. Yang. ‘Truncatedoctahedral Pt3Ni oxygen reduction reaction electrocatalysts.’ Journal of theAmerican Chemical Society 132(14):4984–4985 (2010).
[88] J. Zhang, H. Yang, J. Fang, & S. Zou. ‘Synthesis and oxygen reduction activ-ity of shape-controlled Pt3Ni nanopolyhedra.’ Nano Letters 10(2):638–644(2010).
[89] M. Ahmadi, F. Behafarid, C. Cui, P. Strasser, & B. R. Cuenya. ‘Long-rangesegregation phenomena in shape-selected bimetallic nanoparticles: chemi-cal state effects.’ ACS Nano 7(10):9195–9204 (2013).
[90] C. Cui, M. Ahmadi, F. Behafarid, L. Gan, M. Neumann, M. Heggen, B. R.Cuenya, & P. Strasser. ‘Shape-selected bimetallic nanoparticle electrocata-lysts: evolution of their atomic-scale structure, chemical composition, andelectrochemical reactivity under various chemical environments.’ FaradayDiscussions 162:91 (2013).
[91] C. Cui, L. Gan, M. Heggen, S. Rudi, & P. Strasser. ‘Compositional segrega-tion in shaped Pt alloy nanoparticles and their structural behaviour duringelectrocatalysis.’ Nature Materials 12(8):765–771 (2013).
[92] S.-I. Choi, S. Xie, M. Shao, J. H. Odell, N. Lu, H.-C. Peng, L. Protsailo,S. Guerrero, J. Park, X. Xia, J. Wang, M. J. Kim, & Y. Xia. ‘Synthesis andcharacterization of 9 nm Pt–Ni octahedra with a record high activity of 3.3A/mgPt for the oxygen reduction reaction.’ Nano Letters 13(7):3420–3425(2013).
[93] C. Chen, Y. Kang, Z. Huo, Z. Zhu, W. Huang, H. L. Xin, J. D. Snyder, D. Li,J. A. Herron, M. Mavrikakis, M. Chi, K. L. More, Y. Li, N. M. Markovic,

134 BIBLIOGRAPHY
G. A. Somorjai, P. Yang, & V. R. Stamenkovic. ‘Highly crystalline multi-metallic nanoframes with three-dimensional electrocatalytic surfaces.’ Sci-ence 343(6177):1339–1343 (2014).
[94] G. H. Jóhannesson, T. Bligaard, A. V. Ruban, H. L. Skriver, K. W. Jacobsen,& J. K. Nørskov. ‘Combined electronic structure and evolutionary search ap-proach to materials design.’ Physical Review Letters 88(25):255506 (2002).
[95] T. Bligaard, G. H. Jóhannesson, A. V. Ruban, H. L. Skriver, K. W. Jacobsen, &J. K. Nørskov. ‘Pareto-optimal alloys.’ Applied Physics Letters 83(22):4527–4529 (2003).
[96] S. J. Yoo, S.-K. Kim, T.-Y. Jeon, S. J. Hwang, J.-G. Lee, S.-C. Lee, K.-S. Lee, Y.-H. Cho, Y.-E. Sung, & T.-H. Lim. ‘Enhanced stability and activity of Pt–Y alloycatalysts for electrocatalytic oxygen reduction.’ Chemical Communications47(41):11414–11416 (2011).
[97] S. J. Yoo, K.-S. Lee, S. J. Hwang, Y.-H. Cho, S.-K. Kim, J. W. Yun, Y.-E. Sung,& T.-H. Lim. ‘Pt3Y electrocatalyst for oxygen reduction reaction in protonexchange membrane fuel cells.’ International Journal of Hydrogen Energy37(12):9758–9765 (2012).
[98] I. E. L. Stephens, A. S. Bondarenko, L. Bech, & I. Chorkendorff. ‘Oxygenelectroreduction activity and X-ray photoelectron spectroscopy of platinumand early transition metal alloys.’ ChemCatChem 4(3):341–349 (2012).
[99] S. J. Yoo, S. J. Hwang, J.-G. Lee, S.-C. Lee, T.-H. Lim, Y.-E. Sung, A. Wieck-owski, & S.-K. Kim. ‘Promoting effects of la for improved oxygen reductionactivity and high stability of Pt on Pt–La alloy electrodes.’ Energy & Environ-mental Science 5(6):7521–7525 (2012).
[100] T. P. Johansson, E. T. Ulrikkeholm, P. Hernandez-Fernandez, P. Malacrida,H. Hansen, A. S. Bandarenka, J. K. Nørskov, J. Rossmeisl, I. E. L. Stephens, &I. Chorkendorff. ‘Pt skin vs. Pt skeleton structures of Pt3Sc as electrocatalystsfor oxygen reduction.’ Topics in Catalysis 57(1-4):245–254 (2014).
[101] T. P. Johansson, E. T. Ulrikkeholm, P. Hernandez-Fernandez, M. Escudero-Escribano, P. Malacrida, I. E. L. Stephens, & I. Chorkendorff. ‘Towards theelucidation of the high oxygen electroreduction activity of PtxY: surface sci-ence and electrochemical studies of Y/Pt(111).’ Physical Chemistry ChemicalPhysics (2014).
[102] K. G. Nishanth, P. Sridhar, & S. Pitchumani. ‘Enhanced oxygen reductionreaction activity through spillover effect by Pt–Y(OH)3/C catalyst in directmethanol fuel cells.’ Electrochemistry Communications 13(12):1465–1468(2011).

BIBLIOGRAPHY 135
[103] M. K. Jeon & P. J. McGinn. ‘Carbon supported Pt–Y electrocatalysts for theoxygen reduction reaction.’ Journal of Power Sources 196(3):1127–1131(2011).
[104] M. P. Seah. ‘The quantitative analysis of surfaces by XPS: a review.’ Surfaceand Interface Analysis 2(6):222–239 (1980).
[105] D. Briggs & M. P. Seah, eds. Practical Surface Analysis, Auger and X-rayPhotoelectron Spectroscopy. John Wiley & Sons (1996).
[106] J. Scofield. ‘Hartree-Slater subshell photoionization cross-sections at 1254and 1487 eV.’ Journal of Electron Spectroscopy and Related Phenomena8(2):129–137 (1976).
[107] M. P. Seah. ‘Data compilations: their use to improve measurement cer-tainty in surface analysis by AES and XPS.’ Surface and Interface Analysis9(2):85–98 (1986).
[108] M. Seah, I. Gilmore, & S. Spencer. ‘Quantitative XPS: I. Analysis of X-ray photoelectron intensities from elemental data in a digital photoelec-tron database.’ Journal of Electron Spectroscopy and Related Phenomena120(1–3):93–111 (2001).
[109] C. D. Wagner, L. E. Davis, M. V. Zeller, J. A. Taylor, R. H. Raymond, &L. H. Gale. ‘Empirical atomic sensitivity factors for quantitative analysis byelectron spectroscopy for chemical analysis.’ Surface and Interface Analysis3(5):211–225 (1981).
[110] M. P. Seah & W. A. Dench. ‘Quantitative electron spectroscopy of surfaces: astandard data base for electron inelastic mean free paths in solids.’ Surfaceand Interface Analysis 1(1):2–11 (1979).
[111] S. Tanuma, C. J. Powell, & D. R. Penn. ‘Calculations of electorn inelasticmean free paths. II. Data for 27 elements over the 50–2000 eV range.’ Sur-face and Interface Analysis 17(13):911–926 (1991).
[112] P. J. Cumpson & M. P. Seah. ‘Elastic scattering corrections in AES andXPS. II. Estimating attenuation lengths and conditions required for theirvalid use in overlayer/substrate experiments.’ Surface and Interface Analysis25(6):430–446 (1997).
[113] M. P. Seah, C. A. Clifford, F. M. Green, & I. S. Gilmore. ‘An accurate semi-empirical equation for sputtering yields I: for argon ions.’ Surface and Inter-face Analysis 37(5):444–458 (2005).
[114] Energy Efficiency and Renewable Energy http://www.eere.energy.gov/ hydro-genandfuelcells/mypp/pdfs/fuel_cells.pdf and the US DRIVE Fuel Cell Techni-cal Team Technology Roadmap www.uscar.org/guest/teams/17/Fuel-Cell-Tech-Team. U. S. Department of Energy (DOE) (2013).

136 BIBLIOGRAPHY
[115] A. Ohma, K. Shinohara, A. Iiyama, T. Yoshida, & A. Daimaru. ‘Membrane andcatalyst performance targets for automotive fuel cells by FCCJ membrane,catalyst, MEA WG.’ ECS Transactions 41(1):775–784 (2011).
[116] K. Mayrhofer, D. Strmcnik, B. Blizanac, V. Stamenkovic, M. Arenz, &N. Markovic. ‘Measurement of oxygen reduction activities via the rotatingdisc electrode method: from Pt model surfaces to carbon-supported highsurface area catalysts.’ Electrochimica Acta 53(7):3181–3188 (2008).
[117] M. Watanabe, Y. Zhu, & H. Uchida. ‘Oxidation of CO on a Pt-Fe alloyelectrode studied by surface enhanced infrared reflection-absorption spec-troscopy.’ The Journal of Physical Chemistry B 104(8):1762–1768 (2000).
[118] A. S. Bandarenka, A. S. Varela, M. Karamad, F. Calle-Vallejo, L. Bech, F. J.Perez-Alonso, J. Rossmeisl, I. E. L. Stephens, & I. Chorkendorff. ‘Design ofan active site towards optimal electrocatalysis: Overlayers, surface alloysand near-surface alloys of Cu/Pt(111).’ Angewandte Chemie InternationalEdition 51(47):11845–11848 (2012).
[119] D. F. van der Vliet, C. Wang, D. Li, A. P. Paulikas, J. Greeley, R. B. Rankin,D. Strmcnik, D. Tripkovic, N. M. Markovic, & V. R. Stamenkovic. ‘Uniqueelectrochemical adsorption properties of Pt-skin surfaces.’ AngewandteChemie 124(13):3193–3196 (2012).
[120] R. Walker & J. Darby Jr. ‘Thermodynamic properties of solid nickel-platinumalloys.’ Acta Metallurgica 18(12):1261–1266 (1970).
[121] R. Pretorius, T. Marais, & C. Theron. ‘Thin film compound phase formationsequence: an effective heat of formation model.’ Materials Science Reports10(1–2):1–83 (1993).
[122] R. Hultgren, P. D. Desai, D. T. Hawkins, M. Gleiser, & K. K. Kelley. SelectedValues of the Thermodynamic Properties of Binary Alloys. Metals Park, Ohio :American Society for Metals (1973).
[123] H. Kleykamp. ‘Thermodynamics of the systems of the platinum metalswith other transition metals: I. Integral data.’ Journal of Nuclear Materi-als 201:193–217 (1993).
[124] K. T. Jacob & Y. Waseda. ‘Thermodynamic properties of Pt5La, Pt5Ce, Pt5Pr,Pt5Tb and Pt5Tm intermetallics.’ Bulletin of Materials Science 13(4):235–244(1990).
[125] H. L. Xin, J. A. Mundy, Z. Liu, R. Cabezas, R. Hovden, L. F. Kourkoutis,J. Zhang, N. P. Subramanian, R. Makharia, F. T. Wagner, & D. A. Muller.‘Atomic-resolution spectroscopic imaging of ensembles of nanocatalyst par-ticles across the life of a fuel cell.’ Nano Letters 12(1):490–497 (2012).

BIBLIOGRAPHY 137
[126] P. Malacrida, M. Escudero-Escribano, A. Verdaguer-Casadevall, I. Stephens,& I. Chorkendorff. ‘Enhanced activity and stability of Pt-La and Pt-Ce alloysfor oxygen electroreduction: the elucidation of the active surface phase.’Journal of Materials Chemistry A (2014).
[127] W. Bronger. ‘Preparation and X-ray investigation of platinum alloys with therare-earth metals (Pt5Ln and Pt3Ln phases).’ Journal of the Less CommonMetals 12(1):63–68 (1967).
[128] T. B. Massalski, J. L. Murray, L. Bennett, & H. Baker. Binary alloy phasediagrams. American Society for Metals (1986).
[129] S. Reimann & H.-J. Schaller. ‘Constitution and thermodynamics of Pt-Laalloys.’ Journal of Alloys and Compounds 419(1–2):133–139 (2006).
[130] A. de Asha & R. Nix. ‘Oxidation of lanthanum overlayers on Cu(111).’ Sur-face Science 322(1–3):41–50 (1995).
[131] J. Knudsen, A. U. Nilekar, R. T. Vang, J. Schnadt, E. L. Kunkes, J. A. Dumesic,M. Mavrikakis, & F. Besenbacher. ‘A Cu-Pt near-surface alloy for water-gasshift catalysis.’ Journal of the American Chemical Society 129(20):6485–6490 (2007).
[132] M. Escudero-Escribano, A. Verdaguer-Casadevall, P. Malacrida, U. Grøn-bjerg, B. P. Knudsen, A. K. Jepsen, J. Rossmeisl, I. E. L. Stephens, & I. Chork-endorff. ‘Pt5Gd as a highly active and stable catalyst for oxygen electrore-duction.’ Journal of the American Chemical Society 134(40):16476–16479(2012).
[133] J. C. Fuggle, M. Campagna, Z. Zolnierek, R. Lässer, & A. Platau. ‘Observa-tion of a relationship between core-level line shapes in photoelectron spec-troscopy and the localization of screening orbitals.’ Physical Review Letters45(19):1597–1600 (1980).
[134] J. Allen, S. Oh, O. Gunnarsson, K. Schönhammer, M. Maple, M. Torikachvili,& I. Lindau. ‘Electronic structure of cerium and light rare-earth inter-metallics.’ Advances in Physics 35(3):275–316 (1986).
[135] J. Fuggle. ‘X-ray and photoelectron spectroscopy of light rare earths.’ Journalof the Less Common Metals 93(1):159–169 (1983).
[136] F. Zhang, P. Wang, J. Koberstein, S. Khalid, & S.-W. Chan. ‘Cerium oxidationstate in ceria nanoparticles studied with X-ray photoelectron spectroscopyand absorPtion near edge spectroscopy.’ Surface Science 563(1–3):74–82(2004).
[137] M. Juel, S. Martinsen, & S. Raaen. ‘Oxidation of thin Ce layers on Rh(110).’Thin Solid Films 517(2):805–810 (2008).

138 BIBLIOGRAPHY
[138] L. Schlapbach. ‘XPS/UPS study of the oxidation of La and LaNi5 and of theelectronic structure of LaNi5.’ Solid State Communications 38(2):117–123(1981).
[139] J. C. Fuggle, F. U. Hillebrecht, Z. Zołnierek, R. Lässer, C. Freiburg, O. Gun-narsson, & K. Schönhammer. ‘Electronic structure of Ce and its intermetalliccompounds.’ Physical Review B 27(12):7330–7341 (1983).
[140] F. U. Hillebrecht & J. C. Fuggle. ‘Invalidity of 4f count determination andpossibilities for determination of 4f hybridization in intermetallics of thelight rare earths by core-level spectroscopy.’ Physical Review B 25(6):3550–3556 (1982).
[141] W.-D. Schneider, B. Delley, E. Wuilloud, J.-M. Imer, & Y. Baer. ‘Electron-spectroscopic manifestations of the 4f states in light rare-earth solids.’ Phys-ical Review B 32(10):6819–6831 (1985).
[142] A. Pfau & K. Schierbaum. ‘The electronic structure of stoichiometric andreduced CeO2 surfaces: an XPS, UPS and HREELS study.’ Surface Science321(1–2):71–80 (1994).
[143] M. Watanabe, K. Tsurumi, T. Mizukami, T. Nakamura, & P. Stonehart. ‘Ac-tivity and stability of ordered and disordered Co-Pt alloys for phosphoricacid fuel cells.’ Journal of The Electrochemical Society 141(10):2659–2668(1994).
[144] G. Praline, B. Koel, R. Hance, H.-I. Lee, & J. White. ‘X-ray photoelectronstudy of the reaction of oxygen with cerium.’ Journal of Electron Spectroscopyand Related Phenomena 21(1):17–30 (1980).
[145] T. L. Barr. ‘An ESCA study of the termination of the passivation of elementalmetals.’ The Journal of Physical Chemistry 82(16):1801–1810 (1978).
[146] D. D. Sarma, M. S. Hegde, & C. N. R. Rao. ‘Study of surface oxidation of rare-earth metals by photoelectron spectroscopy.’ Journal of the Chemical Society,Faraday Transactions 2: Molecular and Chemical Physics 77(9):1509–1520(1981).
[147] B. C. Beard & P. N. Ross. ‘The structure and activity of Pt-Co alloys asoxygen reduction electrocatalysts.’ Journal of The Electrochemical Society137(11):3368–3374 (1990).
[148] H. Abe, F. Matsumoto, L. R. Alden, S. C. Warren, H. D. Abruña, & F. J. DiS-alvo. ‘Electrocatalytic performance of fuel oxidation by Pt3Ti nanoparticles.’Journal of the American Chemical Society 130(16):5452–5458 (2008).
[149] W. M. Haynes, ed. CRC Handbook of Chemistry and Physics, 93rd Edition.CRC Press (2012).

BIBLIOGRAPHY 139
[150] C. Wang, M. Chi, G. Wang, D. van der Vliet, D. Li, K. More, H.-H. Wang,J. A. Schlueter, N. M. Markovic, & V. R. Stamenkovic. ‘Correlation betweensurface chemistry and electrocatalytic properties of monodisperse PtxNi1−xnanoparticles.’ Advanced Functional Materials 21(1):147–152 (2011).
[151] S. J. Hwang, S.-K. Kim, J.-G. Lee, S.-C. Lee, J. H. Jang, P. Kim, T.-H. Lim, Y.-E.Sung, & S. J. Yoo. ‘Role of electronic perturbation in stability and activity ofPt-based alloy nanocatalysts for oxygen reduction.’ Journal of the AmericanChemical Society 134(48):19508–19511 (2012).
[152] T. H. Yu, T. Hofmann, Y. Sha, B. V. Merinov, D. J. Myers, C. Heske, & W. A.Goddard. ‘Finding correlations of the oxygen reduction reaction activity oftransition metal catalysts with parameters obtained from quantum mechan-ics.’ The Journal of Physical Chemistry C 117(50):26598–26607 (2013).
[153] H. Nowotny. ‘Die kristallstrukturen von Ni5Ce, Ni5La, Ni5Ca, Cu5La, Cu5Ca,Zn5La, Zn5Ca, Ni2Ce, MgCe, MgLa und MgSr.’ Zeitschrift für Metallkunde(1942).
[154] C. J. Baddeley, A. W. Stephenson, C. Hardacre, M. Tikhov, & R. M. Lambert.‘Structural and electronic properties of Ce overlayers and low-dimensionalPt-Ce alloys on Pt(111).’ Physical Review B 56(19):12589–12598 (1997).
[155] V. Ohm, S. Raetz, M. Sauer, M. Merkens, H. Schilder, & H. Lueken. ‘Forma-tion of lanthanide-platinum alloys by reaction of platinum with lanthanideiodides part II. Structural and magnetochemical investigations into the sys-tems with Ln = Nd, Gd, Tb, Dy, Tm.’ Journal of Alloys and Compounds238(1–2):95–101 (1996).
[156] T. P. Johansson. New Materials for Oxygen Reduction Electrodes. Ph.D. thesis,Technical University of Denmark (2012).
[157] U. Grønbjerg. Modelling of structure and reactivity of Platinum alloys as cata-lysts for the Oxygen Reduction Reaction. Ph.D. thesis, Technical University ofDenmark (2012).
[158] M. Notin, J. Mejbar, A. Bouhajib, J. Charles, & J. Hertz. ‘The thermody-namic properties of calcium intermetallic compounds.’ Journal of Alloys andCompounds 220(1–2):62–75 (1995).
[159] T. Heumann & M. Kniepmeyer. ‘A5B-Phasen vom typ Cu5Ca und lavesphasenin den systemen des strontiums mit palladium, platin, rhodium und irid-ium.’ Zeitschrift für anorganische und allgemeine Chemie 290(3-4):191–204(1957).
[160] W. Bronger & W. Klemm. ‘Darstellung von legierungen des platins mit un-edlen metallen.’ Zeitschrift für anorganische und allgemeine Chemie 319(1-2):58–81 (1962).

140 BIBLIOGRAPHY
[161] A. Fujimori & L. Schlapbach. ‘Electronic structure of yttrium hydride stud-ied by X-ray photoemission spectroscopy.’ Journal of Physics C: Solid StatePhysics 17(2):341 (1984).
[162] R. Reichl & K. H. Gaukler. ‘An investigation of air-grown yttrium oxide andexperimental determination of the sputtering yield and the inelastic meanfree path.’ Applied Surface Science 26(2):196–210 (1986).
[163] R. P. Vasquez, M. C. Foote, & B. D. Hunt. ‘Reaction of nonaqueous halogensolutions with YBa4Cu3O7-x.’ Journal of Applied Physics 66(10):4866–4877(1989).
[164] N. Krikorian. ‘The reaction of selected lanthanide carbides with platinumand iridium.’ Journal of the Less Common Metals 23(3):271–279 (1971).
[165] A. S. Varela, C. Schlaup, Z. P. Jovanov, P. Malacrida, S. Horch, I. E. L.Stephens, & I. Chorkendorff. ‘CO2 electroreduction on well-defined bimetal-lic surfaces: Cu overlayers on Pt(111) and Pt(211).’ The Journal of PhysicalChemistry C 117(40):20500–20508 (2013).
[166] M. Salmeron & R. Schlögl. ‘Ambient pressure photoelectron spectroscopy:a new tool for surface science and nanotechnology.’ Surface Science Reports63(4):169–199 (2008).
[167] S. Kaya, H. Ogasawara, L.-A. Naslund, J.-O. Forsell, H. S. Casalongue, D. J.Miller, & A. Nilsson. ‘Ambient-pressure photoelectron spectroscopy for het-erogeneous catalysis and electrochemistry.’ Catalysis Today 205(7):101–105(2013).
[168] A. E. Russell & A. Rose. ‘X-ray absorption spectroscopy of low temperaturefuel cell catalysts.’ Chemical reviews 104(10):4613–4635 (2004).
[169] Y. Ayato, K. Kunimatsu, M. Osawa, & T. Okada. ‘Study of Pt electrode/nafionionomer interface in HClO4 by in situ surface-enhanced FTIR spectroscopy.’Journal of The Electrochemical Society 153(2):A203–A209 (2006).
[170] N. M. Markovic & P. N. Ross Jr. ‘Surface science studies of model fuel cellelectrocatalysts.’ Surface Science Reports 45(4–6):117–229 (2002).
[171] M. Wakisaka, Y. Udagawa, H. Suzuki, H. Uchida, & M. Watanabe. ‘Structuraleffects on the surface oxidation processes at Pt single-crystal electrodes stud-ied by X-ray photoelectron spectroscopy.’ Energy & Environmental Science4(5):1662–1666 (2011).
[172] G. Zimbitas, M. E. Gallagher, G. R. Darling, & A. Hodgson. ‘Wetting of mixedOH-H2O layers on Pt(111).’ The Journal of Chemical Physics 128(7):074701(2008).

BIBLIOGRAPHY 141
[173] D. Strmcnik, K. Kodama, D. v. d. Vliet, J. Greeley, V. R. Stamenkovic, & N. M.Markovic. ‘The role of non-covalent interactions in electrocatalytic fuel-cellreactions on platinum.’ Nature Chemistry 1(6):466–472 (2009).
[174] D. Strmcnik, M. Escudero-Escribano, K. Kodama, V. R. Stamenkovic,A. Cuesta, & N. M. Markovic. ‘Enhanced electrocatalysis of the oxygen re-duction reaction based on patterning of platinum surfaces with cyanide.’Nature Chemistry 2(10):880–885 (2010).
[175] J. Snyder, T. Fujita, M. W. Chen, & J. Erlebacher. ‘Oxygen reduction innanoporous metal–ionic liquid composite electrocatalysts.’ Nature Materi-als 9(11):904–907 (2010).
[176] M. D. Maciá, J. M. Campiña, E. Herrero, & J. M. Feliu. ‘On the kinetics ofoxygen reduction on platinum stepped surfaces in acidic media.’ Journal ofElectroanalytical Chemistry 564:141–150 (2004).
[177] J. Durst, M. Chatenet, & F. Maillard. ‘Impact of metal cations on the elec-trocatalytic properties of Pt/C nanoparticles at multiple phase interfaces.’Physical Chemistry Chemical Physics: PCCP 14(37):13000–13009 (2012).
[178] T. Schiros, L. Näslund, K. Andersson, J. Gyllenpalm, G. S. Karlberg,M. Odelius, H. Ogasawara, L. G. M. Pettersson, & A. Nilsson. ‘Structureand bonding of the water-hydroxyl mixed phase on Pt(111).’ Journal ofPhysical Chemistry C 111(41):15003–15012 (2007).
[179] T. Schiros, O. Takahashi, K. J. Andersson, H. Öström, L. G. M. Pettersson,A. Nilsson, & H. Ogasawara. ‘The role of substrate electrons in the wettingof a metal surface.’ The Journal of Chemical Physics 132(9):094701 (2010).
[180] M. Larsson, P. Baltzer, S. Svensson, B. Wannberg, N. Martensson, A. N. d.Brito, N. Correia, M. P. Keane, M. Carlsson-Gothe, & L. Karlsson. ‘X-rayphotoelectron, auger electron and ion fragment spectra of O2 and potentialcurves of O2+
2 .’ Journal of Physics B: Atomic, Molecular and Optical Physics23(7):1175 (1990).
[181] H. Bluhm, M. Hävecker, A. Knop-Gericke, E. Kleimenov, R. Schlögl,D. Teschner, V. I. Bukhtiyarov, D. F. Ogletree, & M. Salmeron. ‘Methanoloxidation on a copper catalyst investigated using in situ X-ray photoelec-tron spectroscopy.’ Journal of Physical Chemistry B 108(38):14340–14347(2004).
[182] C. Zhang, M. E. Grass, A. H. McDaniel, S. C. DeCaluwe, F. E. Gabaly, Z. Liu,K. F. McCarty, R. L. Farrow, M. A. Linne, Z. Hussain, G. S. Jackson, H. Bluhm,& B. W. Eichhorn. ‘Measuring fundamental properties in operating solid ox-ide electrochemical cells by using in situ X-ray photoelectron spectroscopy.’Nature Materials 9(11):944–949 (2010).

142 BIBLIOGRAPHY

Included papers


Pt5Gd as a Highly Active and Stable Catalyst for OxygenElectroreductionMaría Escudero-Escribano,† Arnau Verdaguer-Casadevall,† Paolo Malacrida,† Ulrik Grønbjerg,†,‡
Brian P. Knudsen,† Anders K. Jepsen,† Jan Rossmeisl,‡ Ifan E. L. Stephens,† and Ib Chorkendorff*,†
†Center for Individual Nanoparticle Functionality, Department of Physics, Building 312, Technical University of Denmark (DTU),DK-2800 Lyngby, Denmark‡Center for Atomic-Scale Materials Design, Department of Physics, Building 307, Technical University of Denmark (DTU), DK-2800Lyngby, Denmark
*S Supporting Information
ABSTRACT: The activity and stability of Pt5Gd for theoxygen reduction reaction (ORR) have been studied, usinga combination of electrochemical measurements, angle-resolved X-ray photoelectron spectroscopy (AR-XPS), anddensity functional theory calculations. Sputter-cleaned,polycrystalline Pt5Gd shows a 5-fold increase in ORRactivity, relative to pure Pt at 0.9 V, approaching the mostactive in the literature for catalysts prepared in this way.AR-XPS profiles after electrochemical measurements in 0.1M HClO4 show the formation of a thick Pt overlayer onthe bulk Pt5Gd, and the enhanced ORR activity can beexplained by means of compressive strain effects.Furthermore, these novel bimetallic electrocatalysts arehighly stable, which, in combination with their enhancedactivity, makes them very promising for the developmentof new cathode catalysts for fuel cells.
Proton exchange membrane fuel cells (PEMFCs) are apotentially zero emission source of power, which are
expected to play a key role in a future society based onsustainable energy. The main obstacle to the development ofPEMFCs as a commercially competitive reality is the highoverpotential required for the oxygen reduction reaction(ORR) to proceed at an adequate rate. Due to this fact, theORR has been the most intensively studied fuel-cell reactionover the past decade.1−7 The most active electrocatalystsknown for the ORR are based upon Pt. However, high loadingsof Pt are necessary at the cathode in order to achieve acceptablepower densities.1 In order to reduce the Pt loading, there is aneed to develop novel catalysts with enhanced activity andlong-term stability under operating conditions.1,2
The activity of Pt toward the ORR can be improved byslightly weakening its binding to the O-containing reactionintermediates, O, OH, and OOH. The optimal catalyst shouldhave an OH binding energy ≈0.1 eV weaker than pure Pt.4a
The most widely used approach to achieve this goal is to alloyPt with other metals, such as Co, Ni, Fe, Cu, hence improvingits ORR activity.1,3−5,8 The more reactive solute metal, e.g. Co,Ni, Fe, Cu, will tend to dissolve in the acidic electrolyte of aPEMFC, leaving behind a Pt overlayer. Unless the catalyst hasbeen pre-annealed,3b,c,5b this overlayer is typically severalmonolayers thick.5a,8 On the acid leached catalysts, the
weakening of the binding to OH occurs as a result of thecompressive strain imposed onto the Pt-overlayer by the alloybulk.It is crucial to improve not only the fuel-cell cathode catalyst
activity but also its durability. Alloys of Pt and late transitionmetals generally degrade by dealloying.1b,4a,9 This involves thesegregation of the solute metal to the surface9a,c and itssubsequent dissolution. The susceptibility of Pt alloys with latetransition metals, such as Fe, Co, Ni and Cu toward dealloyingcan be understood on the basis of their negligible heat offormation.Recently, Pt3Y was identified on the basis of density
functional theory (DFT) calculations as being a catalyst thatshould be both active and stable for the ORR.4a Experimentsconfirmed that the catalyst exhibited the highest ORR activityever measured for a polycrystalline surface.1b,4 Alloys of Pt withearly transition metals or rare earths, such as Y, Gd, or La, haveexceptionally negative heats of formation;1b,10,11 this shouldprovide them with the kinetic stability to prevent dealloyingunder fuel cell reaction conditions, unlike alloys of Pt and latetransition metals. This is because the kinetic barrier for solutemetal diffusion through the alloy core and the thick Pt overlayershould be at least partially determined by the heat of formation.Moreover, despite their denomination, rare earths are moreabundant, produced on a larger scale, and less expensive thanPt.12 Very recent studies on PtxLa
1b,13 have demonstrated thatthese alloys present enhanced activity compared to pure Pt1b aswell as high stability.13 To the best of our knowledge, no otherstudies concerning the activity and/or the stability of Pt andrare earth metal alloys have been reported so far. Pt5Gd is avery stable alloy, with a formation energy of −3.9 eV/formulaunit,11 similar to that of Pt3Y
4a and Pt5La.1b
In this communication, we present, for the first time,experimental and theoretical studies concerning the activity andstability of Pt5Gd for the ORR. The bulk, polycrystallineelectrode was sputter cleaned in an ultrahigh-vacuum chamber,before being transferred to a rotating ring disk electrode(RRDE) assembly to conduct electrochemical measurements in0.1 M HClO4. Full experimental details can be found in theSupporting Information (SI).
Received: June 29, 2012Published: September 21, 2012
Communication
pubs.acs.org/JACS
© 2012 American Chemical Society 16476 dx.doi.org/10.1021/ja306348d | J. Am. Chem. Soc. 2012, 134, 16476−16479

The activity of the catalyst toward the ORR was evaluated inan O2-saturated 0.1 M HClO4 solution, using cyclicvoltammetry. Typical cyclic voltammograms (CVs) onsputter-cleaned Pt5Gd and Pt polycrystalline electrodes inoxygen-saturated perchloric acid solutions are shown in Figure1a. The ORR was measured once a stable CV was obtained in a
nitrogen-saturated electrolyte (typically after ca. 100 cycles).On both electrodes, the onset for the ORR starts at ≈1 V, andthe current increases exponentially with decreasing potential,characteristic of kinetic control. At more negative potentials,the current becomes increasingly controlled by mass transport,until it is completely transport limited, reaching the value of 5.7mA cm−2. We assume that the roughness factor was 1 cm2/cm2,as found for other Pt alloys tested for the ORR.4 In thepotential region of mixed kinetic transport, there is aconsiderable positive shift for Pt5Gd, relative to Pt. Thisrepresents a substantial decrease in the overpotential for thealloy surface. Moreover, Figure 1 also shows that the ORRactivity on Pt5Gd is essentially the same as that of polycrystal-line Pt3Y (see gray dotted curve).4 In the Tafel plot shown inFigure 1b, the kinetic current density, jk, i.e., the current densityin the absence of any mass-transfer effects, is represented as afunction of the potential, U. Pt5Gd exhibits a kinetic currentdensity, at 0.90 V, jk = (10.4 ± 0.2) mA cm−2, which means that
Pt5Gd exhibits a 5-fold improvement over Pt. A similarenhancement was obtained on polycrystalline Pt3Y (see graydotted curve in Figure 1b).4 Previous results on sputter-cleanedpolycrystalline Pt3M (M = Ni, Co, Fe) alloys by Stamenkovic etal.3 showed up to 2-fold improvements in activity over pure Pt.However, our results show that Pt5Gd and Pt3Y
1b,4 present thehighest activities for sputter-cleaned (Pt-skeleton)3b structuresreported in the literature so far. According to these results, theranking of ORR activity for the most active polycrystalline Ptalloys is in ascending order: Pt ≪ Pt5La ≈ Pt5Y < Pt3Y ≈Pt5Gd.
1b
In order to investigate the chemical composition of the activephase of the Pt5Gd electrocatalyst, angle-resolved XPS (AR-XPS) experiments were carried out before and after theelectrochemical measurements. After sputter cleaning thesample (before electrochemistry, see Figure 2a), the Pt to Gd
ratio was 5.0 ± 0.2, as estimated from three differentmeasurements at 21° emission angle from the normal to thesurface. At this angle, the surface sensitivity is lower, and theeffects of possible differential sputtering are minimized.However, these do not seem to play an important role onthe surface composition, as the Pt to Gd ratio does not changesignificantly with the emission angle (see Figure S8). Followingthe ORR experiments, the sample was transferred to the UHVchamber, and Pt to Gd ratio of 9.1 ± 0.9 was measured. Thissuggests that Gd is partially dissolved in the acidic electrolyte.Figure 2 shows the typical depth profiles of Pt5Gd before (a)and after (b) ORR. Evidently a Pt overlayer with a thickness of
Figure 1. (a) RRDE polarization curves at 1600 rpm and 50 mV s−1
for the ORR on Pt5Gd (red curve), Pt (black curve), and Pt3Y (dottedgray curve) polycrystalline electrodes in O2-saturated 0.1 M HClO4.(b) Tafel plots showing the kinetic current density (jk) of Pt5Gd, Pt,and Pt3Y as a function of the potential (U), based on data from (a).
Figure 2. Nondestructive AR-XPS profiles of polycrystalline, sputtercleaned, Pt5Gd before (a) and after (b) the ORR measurements. Theadventitious C and O traces have been omitted for clarity; these arepresumably accumulated during the transfer. The sputter cleanedsample exhibited a small submonolayer coverage of C and O,associated with the high sticking coefficient of any residual moleculeson Gd, which is very reactive. (c) Schematic three-dimensional view ofthe structure shown in (b), consisting of a Pt (gray balls) overlayer,covering a bulk Pt5Gd alloy (the large red balls are Gd atoms). In thiscase, the thickness of the Pt overlayer, at three monolayers, is arbitrary.
Journal of the American Chemical Society Communication
dx.doi.org/10.1021/ja306348d | J. Am. Chem. Soc. 2012, 134, 16476−1647916477

few Pt layers was formed. This is consistent with other acidleached Pt-skeleton alloys, including Pt5La, Pt5Y, and Pt3Y.
1,4,14
Further investigations are underway to quantify the exactthickness of the Pt overlayer. Accordingly, the effect of alloyingPt is to impose strain onto the Pt overlayer. In the absence ofGd in the first three atomic layers, there would be no “ligandeffect”.1b,15
It must be noted that under the acidic and oxidizingoperating conditions of a PEMFC, there would be a strongthermodynamic force toward the dissolution of Gd from Pt5Gd:the standard dissolution potential, U0, for Gd to Gd3+ is −2.40V vs the normal hydrogen electrode (NHE)16 (which meansthat the standard Gibbs free energy for the dissolution of Gd toGd3+ is −7.20 eV), and the alloying energy of Pt5Gd stabilizeseach Gd atom by 3.9 eV.11 Then, the standard Gibbs freeenergy for the dissolution of Gd to Gd3+ will be −3.30 eV, andthe corresponding standard reduction potential is −1.10 V vsNHE. Hence, despite the stabilization of Gd atoms in thePt5Gd alloy by 3.9 eV, at 1 V vs NHE we are 2.1 V above thestandard reduction potential, i.e., there is a driving force of −6.3eV for the dissolution of each Gd atom. A similar driving forceexists for the dissolution of other rare earths or early transitionmetals when alloyed with Pt, including Pt3Y and Pt5La,explaining why the solute metal will dissolve from thesesurfaces.1b However, this is inconsistent with reports thatmetallic La or Y could be present at the surface Pt3La or Pt3Yelectrodes under ORR conditions.13,17 Despite the thermody-namic driving force, the Pt overlayer provides kinetic stabilityagainst Gd dissolution from the alloy bulk.DFT calculations were performed in order to understand the
high ORR activity of Pt5Gd. The Pt5Gd structure was modeledfollowing the same procedure as for Pt5La,
1b as a strained close-packed pure Pt overlayer. The surface strain was estimated onthe basis that the Pt−Pt interatomic distance would be set bythe bulk lattice parameter of Pt5Gd, a = 0.522 nm (based onXRD measurements described in the SI). A schematicrepresentation of the structure is shown in Figure 2c. Thiswould lead to a Pt overlayer that is compressed by 6% relativeto Pt(111). Our DFT calculations suggest that this strain wouldresult in an excessive weakening of the OH binding energy,relative to Pt(111), of ≈0.3 eV. The compressive strain thatwould provide the optimal OH binding energy ≈0.1 eV weakerthan Pt(111) would be 2%.5a On the basis of the DFT model,we would expect the perfect, defect-free surface to have a loweractivity than pure Pt, in contradiction to our experiments.7,18
However, we expect that on the experimentally tested phase ofPt5Gd, the strain at the surface would be significantly lowerthan the 6% we estimate for a “perfect” overlayer on Pt5Gd, dueto relaxation effects.5a,19
In order to study the stability of polycrystalline Pt5Gdelectrodes in acidic solutions, we first performed an acceleratedstability test (test I) consisting of continuous cycles from 0.6 to1.0 V vs RHE in an oxygen-saturated 0.1 M HClO4 electrolyteat 100 mV s−1 and 23 °C. The CVs in an O2-saturated 0.1 MHClO4 solution before and after 10 000 cycles (after around 20h of experiments) between 0.6 and 1.0 V are shown in FigureS4. Figure 3a shows the Tafel plots for the ORR on Pt5Gdbefore (red curve) and after (orange dotted curve) 10 000cycles in the conditions described above. Interestingly, theseresults show that the percentage of activity loss after 10 000cycles is 14%, most of this loss occurring in the first 2000cycles. For comparison, when subject to the same treatment,polycrystalline Pt loses 5% of its initial activity after 10 000
cycles. Presumably, this loss in activity can be explained byresidual contamination from the electrolyte. The CV in N2-saturated 0.1 M HClO4 taken immediately before the ORRmeasurements was completely recovered after stability test I(not shown). This <15% deactivation seems to be related to aslight decrease in Gd from the near-surface region: the Pt:GdXPS ratio at 21° to the sample normal increased from 9.1 (afterORR) to 12.3 (after stability test I, see Figure S5).Following stability test I, we exposed it to a more aggressive
experiment, by cycling it between 0.05 and 1.6 V (i.e., verystrong corrosive conditions) at 50 mV s−1 in O2-saturatedsolutions (test II). After 10 cycles, we did not observe anyadditional loss in activity in the ORR. However, after 50 cyclesbetween 0.05 and 1.6 V the ORR polarization curve (afterstability test I) could not be recovered. As shown in Figure 3b,the sample retains 59% of its initial activity after 100 cycles and48% after 200 cycles (after ca. 30 h of experiments). Despitethese very promising results, the stability of the catalyst willultimately need to be tested in nanoparticulate form in aPEMFC.In summary, we present a novel highly active and stable
electrocatalyst for the ORR. The activity of Pt5Gd is similar tothat obtained on Pt3Y in previous studies, which was identifiedas the most active Pt-based polycrystalline alloy for the ORR.
Figure 3. Tafel plots showing the stability of Pt5Gd after: (a) 10 000cycles between 0.6 and 1.0 V vs RHE at 100 mV s−1 (test I) and (b)100 (purple curve) and 200 (magenta curve) cycles between 0.05 and1.6 V vs RHE at 50 mV s−1 in O2-saturated 0.1 M HClO4 (test II). Theinset shows the kinetic current density at 0.9 V of Pt5Gd: sputtercleaned (red), after test I (orange), and after 100 (purple) and 200(magenta) cycles of test II. For comparison, the kinetic current densityof Pt is represented in black.
Journal of the American Chemical Society Communication
dx.doi.org/10.1021/ja306348d | J. Am. Chem. Soc. 2012, 134, 16476−1647916478

Moreover, polycrystalline Pt5Gd electrodes are extremelystable, resistant to cycling to potentials as positive as 1.6 V.For all these reasons, we expect that alloying Pt with Gd andother rare earths will be a fruitful strategy toward thedevelopment of highly active and durable cathodes forPEMFCs.
ASSOCIATED CONTENT
*S Supporting InformationExperimental procedures, computational details, and additionalfigures. This material is available free of charge via the Internetat http://pubs.acs.org.
AUTHOR INFORMATION
Corresponding [email protected]
NotesThe authors declare no competing financial interests.
ACKNOWLEDGMENTSFinancial support is gratefully acknowledged from Energinet.dkthrough the R&D program ForskEL (CATBOOSTER project)and the Danish Ministry of Science through the UNIKprogram: Catalysis for Sustainable Energy (CASE). The Centerfor Individual Nanoparticle Functionality is supported by theDanish National Research Foundation. The Center for Atomic-scale Materials Design is supported by the LundbeckFoundation.
REFERENCES(1) (a) Gasteiger, H. A.; Kocha, S. S.; Sompalli, B.; Wagner, F. T.Appl. Catal., B 2005, 56, 9. (b) Stephens, I. E.L.; Bondarenko, A. S.;Grønbjerg, U.; Rossmeisl, J.; Chorkendorff, I. Energy Environ. Sci.2012, 5, 6744.(2) (a) Adzic, R. R.; Zhang, J.; Sasaki, K.; Vukmirovic, J. X.; Shao, M.;Wang, J. X.; Nikelar, A. U.; Mavrikakis, M.; Valerio, J. A.; Uribe, F.Top. Catal. 2007, 46, 249. (b) Bing, Y.; Liu, H.; Zhang, L.; Ghosh., D.;Zhang, J. Chem. Soc. Rev. 2010, 39, 2184. (c) Wang, C.; van der Vliet,D.; More, K. L.; Zaluzec, N. J.; Peng, S.; Sun, S.; Daimon, H.; Wang,G.; Greeley, J.; Pearson, J.; Paulikas, A. P.; Karapetrov, G.; Strmcnik,D.; Markovic, N. M.; Stamenkovic, V. R. Nano Lett. 2011, 11, 919.(d) Rabis, A; Rodriguez, P.; Schmidt, T. J. ACS Catal. 2012, 2, 864.(3) (a) Stamenkovic, V.; Mun, B. S.; Mayrhofer, K. J. J.; Ross, P. N.;Markovic, N. M.; Rossmeisl, J.; Greeley, J.; Nørskov, J. K. Angew.Chem., Int. Ed. 2006, 45, 2897. (b) Stamenkovic, V. R.; Mun, B. S.;Mayrhofer, K. J.J.; Ross, P. N.; Markovic, N. M. J. Am. Chem. Soc.2006, 128, 8813. (c) Stamenkovic, V. R.; Fowler, B.; Mun, B. S.;Wang, G. F.; Ross, P. N.; Lucas, C. A.; Markovic, N. M. Science 2007,315, 493. (d) Stamenkovic, V. R.; Mun, B. S.; Arenz, M.; Mayrhofer, K.J. J.; Lucas, C. A.; Wang, G. F.; Ross, P. N.; Markovic, N. M. Nat.Mater. 2007, 6, 241.(4) (a) Greeley, J.; Stephens, I. E.L.; Bondarenko, A. S.; Johansson,T. P.; Hansen, H. A.; Jaramillo, T. F.; Rossmeisl, J.; Chorkendorff, I.;Nørskov, J. K. Nat. Chem. 2009, 1, 552. (b) Stephens, I. E.L.;Bondarenko, A. S.; Bech, L.; Chorkendorff, I. ChemCatChem 2012, 4,341.(5) (a) Strasser, P.; Koh, S.; Anniyev, T.; Greeley, J.; More, K.; Yu,C.; Liu, Z.; Kaya, S.; Nordlund, D.; Ogasawara, H.; Toney, M. F.;Nilsson, A. Nat. Chem. 2010, 2, 454. (b) Stephens, I. E.L.;Bondarenko, A. S.; Perez-Alonso, F. J.; Calle-Vallejo, F.; Jepsen, A.K.; Frydendal, R.; Knudsen, B. P.; Rossmeisl, J.; Chorkendorff, I. J. Am.Chem. Soc. 2011, 133, 5485.(6) Strmcnik, D.; Escudero-Escribano, M.; Kodama, K.; Stamenkovic,V. R.; Cuesta, A.; Markovic, N. M. Nat. Chem. 2010, 2, 880.
(7) Nørskov, J. K.; Rossmeisl, J; Logadottir, A.; Lindqvist, L.; Kitchin,J. R.; Bligaard, T.; Jonsson, H. J. Phys. Chem. B 2004, 108, 17886.(8) Toda, T.; Igarashi, H.; Uchida, H.; Watanabe, M. J. Electrochem.Soc. 1999, 146, 3750.(9) (a) Mayrhofer, K. J. J.; Hartl, K.; Juhart, V.; Arenz, M. J. Am.Chem. Soc. 2009, 131, 16348. (b) Chen, S.; Gasteiger, H. A.;Hayakawa, K.; Tada, T.; Shao-Horn, Y. J. Electrochem. Soc. 2010, 157,A82. (c) Xin, H. L. L.; Mundy, J. A.; Liu, Z.; Cabezas, R.; Hovden, R.;Kourkoutis, L. F.; Zhang, J.; Subramanian, N. P.; Makharia, R.;Wagner, F. T.; Muller, D. A. Nano Lett. 2012, 12, 490.(10) (a) Johannesson, G. H.; Bligaard, T.; Ruban, A. V.; Skriver, H.L.; Jacobsen, W.; Nørskov, J. K. Phys. Rev. Lett. 2002, 88, 255506.(b) Bligaard, T.; Johannesson, G. H.; Ruban, A. V.; Skriver, H. L.;Jacobsen, W.; Nørskov, J. K. Appl. Phys. Lett. 2003, 83, 4527.(11) Jakob, K. T.; Waseda, Y. Mater. Trans., JIM 1990, 31, 135.(12) Vesborg, P. C.K.; Jaramillo, T. F. RSC Adv. 2012, 2, 7933.(13) Yoo, S. J.; Hwang, S. J.; Lee, J.-G.; Lee, S.-C.; Lim, T.-H.; Sung,Y.-E.; Wieckowski, A.; Kim, S.-K. Energy Environ. Sci. 2012, 5, 7521.(14) Johansson, T. P. Ph.D. Thesis, Technical University ofDenmark: Lyngby, Denmark, 2012.(15) Kitchin, J. R.; Nørskov, J. K.; Barteau, M. A.; Chen, J. G. J. Chem.Phys. 2004, 120, 10240.(16) Pourbaix, M. Atlas of Electrochemical Equilibria in AqueousSolutions; National Association of Corrosion Engineers: Houston, TX,1974.(17) Yoo, S. J.; Kim, S.-K.; Jeon, T.-Y.; Hwang, S. J.; Lee, J.-G.; Lee,K.-S.; Cho, Y.-H.; Sung, Y.-E.; Lim, T.-H. J Chem. Commun. 2011, 47,11414.(18) Rossmeisl, J.; Karlberg, G. S.; Jaramillo, T. F.; Nørskov, J. K.Faraday Discuss. 2008, 140, 337.(19) Yang, R.; Strasser, P.; Toney, M. F. J. Phys. Chem. C 2011, 115,9074.
Journal of the American Chemical Society Communication
dx.doi.org/10.1021/ja306348d | J. Am. Chem. Soc. 2012, 134, 16476−1647916479


ORIGINAL PAPER
Pt Skin Versus Pt Skeleton Structures of Pt3Sc as Electrocatalystsfor Oxygen Reduction
T. P. Johansson • E. T. Ulrikkeholm • P. Hernandez-Fernandez •
P. Malacrida • H. A. Hansen • A. S. Bandarenka • J. K. Nørskov •
J. Rossmeisl • I. E. L. Stephens • I. Chorkendorff
Springer Science+Business Media New York 2013
Abstract In order for low temperature polymer electro-
lyte membrane fuel cells to become economically viable Pt
catalyst loading must be significantly reduced. The cathode
of the polymer electrolyte membrane fuel cell, where
oxygen reduction takes place, is responsible for the main
activity loss. The development of new materials for this
reaction is essential in order to increase the overall effec-
iency of the fuel cell. Herein, we study the effect of ultra
high vacuum annealing on the structure and activity of
polycrystalline Pt3Sc. Upon annealing in ultra high vacuum
a Pt overlayer is formed on the polycrystalline Pt3Sc. The
reactivity of the overlayer is probed by temperature pro-
grammed desorption of CO. The onset of CO desorption is
around 130 K lower on UHV annealed Pt3Sc than on
Pt(111) and the temperature of the desorption peak maxi-
mum at saturation was *50 K lower on UHV annealed
Pt3Sc, relative to Pt(111), consistent with the CO
adsorption energies calculated using density functional
theory calculations. Exposing the annealed Pt3Sc sample to
200 mbar O2 at room temperature results in *14 % Sc
oxide as measured by X-ray photoelectron spectroscopy.
Electrochemical testing of the oxygen reduction reaction
shows the same activity as sputter cleaned Pt3Sc.
Keywords Carbon monoxide Temperature
programmed desorption Platinum Scandium Oxygen reduction reaction Ion scattering
spectroscopy Angle resolved X-ray photoelectron
spectroscopy
1 Introduction
The main loss in a low temperature polymer electrolyte
membrane fuel cell (PEMFC) is due to the slow kinetics of
the oxygen reduction reaction (ORR), even when Pt is used as
a catalyst [1]. The high overpotential (or potential losses)
required to drive this reaction can be understood on the basis
of the reaction mechanism. The reaction is complex: there are
four coupled electron and proton transfers as well as at least
two intermediates, HO* and HOO*, and possibly O*. It turns
out that the adsorption energies of these intermediates scale
linearly with each other [2–4]. Consequently, the binding of
one intermediate can describe the overall trends in activity for
the reaction. There is a volcano relationship between the
ORR activity and the binding energy of one intermediate, e.g.
HO*. On the left side of the volcano HO* is bound too strong
and on the right side of the volcano HO* is bound too weak.
Pt lies close to the tip of the volcano, however, it binds
oxygen slightly too strong. In order to reach the tip of the
volcano, a catalyst should be found which binds HO* around
0.1 eV weaker than the binding of HO* on pure Pt [5].
T. P. Johansson E. T. Ulrikkeholm P. Hernandez-Fernandez P. Malacrida I. E. L. Stephens I. Chorkendorff (&)
Department of Physics, Center for Individual Nanoparticle
Functionality, Building 312, Technical University of Denmark,
2800 Lyngby, Denmark
e-mail: [email protected]
H. A. Hansen J. K. Nørskov
Department of Chemical Engineering, SUNCAT Center for
Interface Science and Catalysis, Stanford University, Stanford,
CA, USA
A. S. Bandarenka
Center for Electrochemical Sciences, Ruhr-Universitat Bochum,
Universitatsstrasse 150 NC 4/73, 44780 Bochum, Germany
J. Rossmeisl
Department of Physics, Center for Atomic-scale Materials
Design, Building 311, Technical University of Denmark,
2800 Lyngby, Denmark
123
Top Catal
DOI 10.1007/s11244-013-0179-y

In recent years, most research activities on the devel-
opment of new ORR catalysts have been focused on
improving the activity of Pt by alloying with other transi-
tion metals [1, 6–9]. By having an overlayer of Pt on top of
a core of a different composition, it is possible to alter the
electronic structure of the Pt overlayer, making it more
active for the ORR. The core typically consists of Pt
alloyed with a transition metal or rare earth such as La, Ni,
Co, Fe, Cu or Gd [10–14]. All of these Pt alloys are ther-
modynamically unstable under the reaction conditions of a
cathode in a PEMFC and therefore improving the stability
during ORR is an important issue [15, 16].
For platinum overlayer structures the binding of
O*, HO* and HOO*, is influenced by two different effects,
namely the ligand effect and the strain effect [17–20]. The
strain effect occurs when the Pt overlayer is laterally
strained, e.g. by placing it on top of a core with a different
lattice parameter. Compressive lattice strain causes a
downshift in the d-band centre leading to a weakening in
the binding of adsorbed intermediates to the Pt surface
atoms. Tensile lattice strain will cause the opposite effect
[8, 18]. The ligand effect originates from subsurface
alloying: The electronic structure of Pt is altered by nearby
subsurface atoms with a different atomic number. If the
solute atoms are in the third atomic layer the ligand effect
is much less pronounced [10, 17, 19, 21, 22]. It is chal-
lenging to separate the ligand effect from the strain effect
in Pt overlayers on bulk Pt bimetallic alloys.
We recently discovered Pt3Y and Pt3Sc as very prom-
ising catalysts for the ORR [5]. The alloys were identified
by a theoretical screening study as being the most stable Pt-
based binary Pt3M alloys and were predicted to bind
oxygen species slightly weaker than pure Pt, making them
likely to show a high ORR activity. The high stability of
these alloys can be explained in terms of the filling degree
of the d-band. Y and Sc are both early transition metals and
have one d electron, whereas Pt is a late transition metal
and has nine d electrons. When combining the two the
metal–metal d-bonds are therefore approximately half fil-
led corresponding to the bonding states being filled and the
antibonding states being empty [23]. The ORR activity of
sputter cleaned polycrystalline Pt3Sc and Pt3Y was
measured to be enhanced relative to pure Pt by a factor
of 1.5–1.8 and 6–10, respectively, in the range 0.9–0.87
V [5].
Ultra high vacuum (UHV) studies of Pt alloys can help
to understand the increased ORR activity and by annealing
the alloys in vacuum new structures can be observed.
Markovic and coworkers [24–26] have comprehensively
studied bulk polycrystalline platinum bimetallic alloys,
Pt3M (M = Ni, Co, Fe, Ti, V) . They reported two different
ways of producing the active Pt overlayer on these alloys.
When the surface of the bulk polycrystalline platinum alloy
is prepared by sputter cleaning, followed by immersion into
acidic electrolyte, a so called ‘‘platinum skeleton’’ structure
is obtained. This structure was first observed by Watanabe
and coworkers [27, 28], but first denoted as Pt skeleton by
Markovic and coworkers.
The platinum skeleton surfaces are not very well
defined, but are reported to have 100 % platinum in the
first layer and a minimum of 75 % platinum from the
second layer and down [13]. In the case of UHV annealing,
the platinum overlayer is formed by Pt diffusion to the
surface. Markovic and coworkers [13, 29] reports that for
Pt alloyed with late transition metals, Pt3M (M = Ni, Co,
Fe) the platinum overlayer formation occurs by platinum
atoms from the second layer exchanging place with the
solute atoms in the surface layer leading to a structure with
100 % platinum in the first layer, 50 % platinum in the
second layer and (roughly) 75 % platinum in the following
layers. Experiments by Chen et al. [30] and modelling
studies from Duan et al. [31] on Pt3Ti(111) suggest that the
platinum overlayer on Pt3Ti(111) forms by the diffusion of
a slight Pt excess in the bulk, producing a structure con-
sisting of an overlayer of Pt on top of the bulk Pt3Ti alloy,
i.e. with 25 % Ti in the second atomic layer. Notably, for
alloys of Pt and late transition metals such as Ni, Co and
Cu, the Pt skin structure is stable, both under reaction
conditions, and upon exposure to air under ambient con-
ditions [10, 13, 25].
Ross and coworkers have studied the CO TPD spectra of
vacuum annealed Pt alloys [32]. The Pt3Co(111) single
crystal formed a Pt overlayer upon UHV annealing [33],
whereas Pt3Ti(111) [34] and Pt3Sn(111) [35] were found to
be bulk terminated. For all three crystals a downshift in the
CO desorption temperature on the order of 50 K compared
to Pt(111) was found.
The ORR activity of the recently discovered Pt3Sc and
Pt3Y alloys was measured after sputter cleaning, corre-
sponding to a Pt skeleton overlayer [5]. The high ORR
activity combined with the possible high stability of these
alloys strongly motivates further investigations on the
nature of the active site for the ORR. Moreover the much
higher increase in ORR activity for Pt3Y than for Pt3Sc is
thus far not well understood.
Nilsson and coworkers recently studied nanostructured
Pt monolayer electrocatalysts on Rh(111) and found that
the ORR activity is very sensitive to the exact structure of
the surface and near surface region [36]. In order to
understand the origin of the increased ORR activity for
Pt3Sc and Pt3Y knowledge of the structure of the surface
and near surface region is essential.
In this article we present results from UHV annealed
polycrystalline Pt3Sc and compare both the near surface
composition and the activity to that of sputter cleaned
Pt3Sc. In particular, we would like to determine whether it
Top Catal
123

is possible to form Pt skin structures of Pt3Sc and whether
they are stable and active under ORR conditions.
2 Methods
2.1 Experimental Details
The main instrument used during this study is an UHV
chamber with a base pressure of 1 9 10-10 torr, as
described earlier [37]. A high pressure cell (HPC) is
attached to the main chamber and can be isolated from it by
a lock which utilises a Cu gasket. In the main chamber ion
scattering spectroscopy (ISS) and X-ray photoelectron
spectroscopy (XPS) can be performed. A dual anode X-ray
gun is used for the XPS. All XPS spectra are acquired using
the Al Ka anode (1486.7 eV). The chamber is also
equipped with a quadropole mass spectrometer (QMS).
The Pt3Sc polycrystalline sample is 5-mm in diameter and
3-mm thick and was supplied by MaTecK, GmbH, Ger-
many. The sample is mounted by hanging it in a hairpin
shaped 0.38 mm diameter tungsten wire and the tempera-
ture of the sample is measured by a thermocouple (type K).
The sample is resistively heated by passing DC current
through the tungsten wire from which it hangs. Cooling of
the sample is achieved by pumping pressurised air or liquid
nitrogen into the hollow manipulator.
Angle resolved X-ray photoelectron spectroscopy (AR-
XPS) depth profiles are obtained from a Theta Probe UHV
chamber described elsewhere [12]. By acquiring XPS
spectra from electrons emitted from different angles and
fitting the spectra using the simulation tool ARProcess
software (Thermo Avantage), non destructive ARXPS
depth profiles are obtained. A restriction on the fit is that
from 12 A and deeper the Pt:Sc ratio is set to 3, corre-
sponding to Pt3Sc. Using ARXPS it is possible to obtain
the near surface region concentration profiles of different
elements. Due to uncertainty in the fit, the ARXPS depth
profile should mainly be considered qualitatively. It has,
however, for near surface alloys of Cu on Pt been shown to
be in excellent agreement with previous surface science
studies [10].
The XPS cross section for Sc reported in the literature is
not known accurately [38]. The XPS cross section for Sc
used in this article was found by comparing the measured
Sc 2p peak from a sputter cleaned Sc foil with that of the Pt
4f line from clean sputtered Pt(111) and following the
procedure from Seah et al. [39]. The obtained Sc 2p cross
section (referenced to C 1s) was 2.8, whereas the Scofield
cross section for Sc 2p is 6.4 [40].
The electrochemical experiments were performed with
Bio-Logic Instruments’ VMP2 potentiostat, controlled by a
computer. A standard three-compartment glass cell was
used for all the experiments, equipped with an external
jacket attached to a water bath with temperature control.
All glassware was cleaned in 96 % H2SO4 and 30 % H2O2
(3:1 v/v). The glassware was subsequently rinsed several
times in hot Millipore water (358 K; [ 18:2 MX cm1;
TOC \5 ppb). The electrolyte, 0.1 M HClO4 (Merck, Su-
prapur) was prepared using Millipore water. The counter
electrode was a platinum wire and the reference elec-
trode was a Hg/Hg2SO4 electrode separated from the
working electrode compartment using a ceramic frit. All
potentials in the manuscript are quoted with respect to the
reversible hydrogen electrode (RHE) and corrected for
Ohmic losses. The catalysts were inserted into the arbor of
a rotating ring disk electrode (RRDE) and were immersed
into the electrochemical cell under potential control at
0.05 V in N2 (N5, Air Products) saturated 0.1 M HClO4
electrolyte. All electrochemical measurements were per-
formed at 296 K using a scan rate of 20 mV/s and each
catalyst was measured at least 3 times.
The polycrystalline Pt3Sc sample is cleaned by per-
forming cycles of Ar? sputtering at room temperature and
annealing to 1273 K.
2.2 Computational Details
Density functional theory (DFT) calculations have been
performed on the (111) facets of Pt in the fcc structure and
Pt3Sc in the L12 crystal structure using the DACAPO and
ASE codes [41]. The ionic cores are described with Van-
derbilt ultrasoft pseudopotentials [42] and the one-electron
states are expanded in planewaves with kinetic energies
below 340 eV. The density is expanded in planewaves with
kinetic energies below 500 eV. The one-electron states are
populated according to a Fermi–Dirac distribution with
kBT = 0.1 eV and the total energy is extrapolated to
kBT = 0 eV. The effects of exchange and correlation are
approximated by the RPBE functional [43]. The surfaces
are modeled using 4 layer slabs with approximately 16 A
of vacuum separating the periodic images of the slab. The
energy and density have been corrected for the electrostatic
dipole interaction between vacuum separated slab [44]. A
2 9 2 surface unit cell has been employed in the present
calculations of adsorption energies and surface segregation
energies. The first Brilluin zone is sampled using an
8 9 8 9 1 Monkhorst-Pack grid of k-points [45]. Adsor-
bates and the two topmost layers of the slab are relaxed
until all force components are below 0.02 eV/A.
The free energy diagram (Fig. 7) for Pt and Pt3Sc with
50 and 25 % in the second layer are adapted from Ref. [5],
where a 2ffiffiffi
3p 2
ffiffiffi
3p
unit cell was used to obtain com-
mensurate structures for the 2 9 2 alloy lattice and theffiffiffi
3p
ffiffiffi
3p
H2O–OH lattice. For Pt3Sc with 0 % Sc in the
Top Catal
123

second layer, we have found that the binding energies of
the ORR intermediates considered vary by less than
0.02 eV depending on the adsorption site. In this case, the
free energy diagram has been constructed from the average
stabilisation of these ORR intermediates relative to Pt in a
2 9 2 unit cell.
3 Results
3.1 UHV Measurements
Figure 1 shows the ISS spectrum of polycrystalline Pt3Sc
sputter cleaned before and after annealing. Before anneal-
ing, two peaks are present in the ISS spectrum: one at
around 900 eV, which corresponds to Sc and one at around
1120 eV, which corresponds to Pt. No other peaks are seen,
indicating a clean surface containing only Pt and Sc. After
annealing, the Sc peak at around 900 eV disappears and
only the Pt peak remains. This suggests the formation of a
Pt overlayer upon annealing, in line with the results of
Markovic and coworkers [13] for polycrystalline Pt3M
(M = Ni, Co, Fe, Ti, V) samples. We have used ISS only
qualitatively, in order to determine which elements are
present at the surface. Calculating atomic percentages from
ISS is challenging due to ISS equipment not being stand-
ardised and therefore reference samples (measured in the
same setup) are needed [46, 47].
Table 1 shows the concentration of different elements
from XPS, before and after annealing. After annealing, the
carbon content on the surface increases slightly. Even when
the surface was subjected to a large number of sputtering-
annealing cycles, no change was observed in the intensity
of the C peak. The Pt:Sc ratio is close to 3. It is worth noting that even though carbon was not observed using
ISS, carbon could be present on the surface of the sample.
This is due to graphitic carbon not being detectable by ISS
unless a high beam voltage is used (above 3.5 keV,
whereas we use 1.2 keV) [48, 49].
The reactivity of the Pt overlayer was probed in vacuo,
by the temperature programmed desorption of CO (CO
TPD). CO was background dosed at a pressure of 2:0107 torr for 500 s during which the sample was cooled
from 550 to 88 K using liquid nitrogen. The blue curve in
Fig. 2 shows the CO TPD of the freshly annealed Pt3Sc.
The red curve is the second TPD, carried out following the
first TPD measurement. Both CO TPD’s look similar
except for the small peak around 740 K, indicating that the
surface does not irreversibly reconstruct during the course
of the experiment. The black curve in Fig. 2 is the CO TPD
for Pt(111). The onset of CO desorption is around 130 K
lower on UHV annealed Pt3Sc than on Pt(111) and the
main desorption peak is around 50 K lower on UHV
annealed Pt3Sc than on Pt(111). This clearly demonstrates
Fig. 1 ISS spectrum of polycrystalline Pt3Sc before (blue curve) and
after (red curve) annealing to T = 1273 K. A Pt overlayer appears
upon annealing in UHV
Table 1 Relative concentration (%) as obtained by XPS, of the dif-
ferent elements in the polycrystalline Pt3Sc sample before UHV
annealing, after UHV annealing and after UHV annealing and
exposure to 200 mbar O2
Pt Sc C O Pt:Sc
ratio
Pt3Sc sputter cleaned (no Pt overlayer) 70 27 1 2 2.6
Pt3Sc annealed (Pt overlayer) 70 25 4 1 2.8
Pt3Sc annealed and exposed to
200 mbar O2
56 23 7 14 2.4
Fig. 2 First (blue curve) and second (red curve) CO TPD of Pt3Sc
after annealing at T = 1273 K. The CO TPD of Pt(111) (black curve)
is shown for comparison. The ramp rate of each TPD was 2 K/s
Top Catal
123

that CO is bound weaker on Pt3Sc than on Pt(111). The
large shift in the onset of CO desorption could be due to
differences in the CO–CO adsorbate interactions on
Pt(111) and UHV annealed Pt3Sc [50, 51]. In a CO TPD
the area under the peak is proportional to the amount of CO
desorbed from the surface. The area under the Pt3Sc curve
is 56 % of the area under the Pt(111) curve. This difference
could be due to a lower saturation coverage of CO on Pt3Sc
compared to Pt(111). Bardi et al. [33] found a 60–70 %
lower saturation coverage by CO on Pt3Co(111) compared
to Pt(111), determined by CO TPD. Bandarenka et al. [52]
found that the coverage of CO on the Cu/Pt(111) near
surface alloy, determined voltammetrically was 1/3
monolayer (ML), whereas for Pt(111) it was around
2/3 ML. The difference in saturation coverage of CO on
Pt3Sc compared to Pt(111) could however also be due to
some of the sites on Pt3Sc being blocked by carbon (see
XPS data, Table 1).
In order to investigate the effect of exposure to oxygen
during the unavoidable transfer of the Pt3Sc sample from
the UHV system to the electrochemical testing, the surface
was exposed to 200 mbar oxygen in a HPC adhered to the
UHV system [37]. Figure 3 shows the XPS of the annealed
Pt3Sc after exposure to 200 mbar oxygen. By deconvolut-
ing the spectrum into two components, we estimated that
14 % of the Sc is in the oxidised state, indicating that the Pt
overlayer is not completely hindering the Sc from oxidising
when exposed to air.
Having established that UHV annealing of Pt3Sc to
1273 K gives a Pt overlayer structure the sample was
sputtered, annealed and taken out for electrochemical
testing. Before measuring the ORR activity of the sample,
an angle resolved XPS (ARXPS) analysis was carried out
in a second UHV chamber [10] in order to check the sta-
bility of the catalyst before and after electrochemical
testing. The ARXPS depth profile before electrochemistry
is depicted in Fig. 4a. The depth profile shows that air
exposure resulted in some Sc oxide, in agreement with the
200 mbar O2 exposure experiment shown in Fig. 3. The
Sc oxide layer covers a layer of pure Pt, followed by a
layer with increased Sc content, below which lies the bulk
Pt3Sc surface. As mentioned in Sect. 2, the ARXPS depth
profile should mainly be considered qualitatively and it is
therefore challenging to determine the exact thickness of
the Pt overlayer. It is also worth noting that uncertainty in
the determined sensitivity factor of Sc 2p might effect the
ARXPS profiles.
Figure 4b shows the ARXPS depth profile of UHV
annealed Pt3Sc after electrochemical testing. The Sc oxide
which was at the surface before electrochemistry has dis-
appeared and furthermore the subsurface Sc content is
lower. The removal of Sc oxide from the surface is
expected since Sc is soluble under acidic conditions [53].
ARXPS depth profiles of a sputter cleaned Pt3Sc sample
before and after electrochemical testing have also been
recorded (Fig. 4c, d). The depth profile before electro-
chemistry (Fig. 4c) was measured without exposing the
sample to air and corresponds to a bulk terminated Pt3Sc
sample and is clearly different from that of the UHV
annealed sample. After electrochemical testing the profile
of the sputter cleaned and UHV annealed samples are very
similar, indicating that the UHV annealing has a negligible
effect on the structure of the actual ORR catalyst (i.e. the
catalyst after exposure to 0.1 M HClO4).
3.2 Electrochemical Measurements
After measuring the ARXPS depth profile the sample was
mounted in a RRDE setup for electrochemical testing.
Figure 5 shows the measured oxygen reduction activity on
a Tafel plot. The UHV annealed Pt3Sc sample has an
increased activity compared to polycrystalline Pt. The
increase in activity is similar to that of sputter cleaned
Pt3Sc. The similar ORR activity of sputter cleaned and
UHV annealed Pt3Sc is in agreement with the similar
ARXPS depth profiles obtained after electrochemical test-
ing. The ORR activity of both sputter cleaned and UHV
annealed Pt3Sc is lower than that of sputter cleaned poly-
crystalline Pt3Y, which has the highest ORR activity ever
measured for a sputter cleaned, Pt-skeleton surface [5].
Summarising the experimental observations: When
annealing the polycrystalline Pt3Sc sample in vacuo a Pt
overlayer is formed. The onset of CO desorption is around
130 K lower on the UHV annealed Pt3Sc than on Pt(111)
and the main desorption peak is around 50 K lower on the
Fig. 3 Sc 2p core level region of annealed Pt3Sc after exposure to
200 mbar O2. Fitting the recorded data to metallic (red curve) and
oxidised (green curve) Sc gives 14 % of Sc oxide. Before exposure to
200 mbar O2 only metallic Sc was seen (data not shown)
Top Catal
123

UHV annealed Pt3Sc than on Pt(111). The alloy stability, is
insufficient to prevent Sc from segregating to the surface
upon 200 mbar O2 exposure. The ARXPS depth profiles
obtained after electrochemical measurements are similar
for UHV annealed and sputter cleaned Pt3Sc. The depth
profiles show that very little Sc is left in the second layer,
although some might be left in the third layer. The ORR
activity of UHV annealed Pt3Sc is similar to that of sputter
cleaned Pt3Sc.
4 DFT Calculations
In order to provide microscopic understanding of the
reaction, DFT calculations were performed. The first issue
Fig. 4 ARXPS depth profiles of both sputter cleaned and UHV
annealed Pt3Sc before and after measuring the oxygen reduction
activity. a, b and d are exposed to air before the ARXPS depth profile
is measured, whereas c is not. The C and O traces have been omitted
for clarity. The average Pt:Sc ratio for all angles is stated on each
figure
Fig. 5 Specific activity as a function of the electrode potential for the
vacuum annealed polycrystalline Pt3Sc sample compared with sputter
cleaned polycrystalline samples of Pt3Sc, Pt3Y and Pt. The data
corresponds to the anodic cycle. The temperature was kept at
296 ± 1 K and the scan rate was 20 mV/s. The kinetic current has
been corrected for mass transport limitations
Top Catal
123

considered was the formation of the Pt overlayer upon
annealing in vacuo.
Table 2 shows the calculated energy required to move
an X atom from the second layer to the surface layer of a
Pt3X alloy with a 1 ML thick Pt skin. The calculation is
made for initial X concentrations of 50 and 25 % in the
second layer. If the energy is negative the Pt overlayer is
not stable. For Pt3Ni the Pt overlayer is stable both for 50
and 25 % Ni in the second layer which is in agreement with
experiments made by Stamenkovic et al. [25]. The system
with 50 % concentration of the solute metal in the second
layer is not stable for either Pt3Ti, Pt3Sc or Pt3Y, but the
system with 25 % concentration of the solute metal in the
second layer is. This is consistent with experiments and
theoretical investigations on Pt3Ti(111), where the most
stable configuration is with 25 % Ti in the second atomic
layer [30, 31, 34]. The difference between Pt3Ni and the
other alloys in the table is related to the strength of the
interaction between the alloy components. In Pt3Ti, Pt3Y
and Pt3Sc there are very strong bonds between the Pt and
the solute metal. This provides a strong driving force
towards maximising the number of Pt nearest neighbours
surrounding the early transition metal atom. For Pt3Sc this
is in agreement with our ISS data, showing that a Pt
overlayer is formed upon annealing in UHV.
The surface reactivity of the different polycrystalline
alloys was tested in UHV by CO TPD. The main interest of
these alloys is, however, for the oxygen reduction reaction,
which has oxygenated species as intermediates (O*, HO*
and HOO*) [54]. A relevant question is therefore if it is
possible to relate the binding energy of OC* to that of the
oxygen species in the oxygen reduction reaction. When
considering different pure metals their OC* and HO*
binding energies do not scale [55]. For the Pt overlayers on
top of Pt3M alloys such a relation could, however, still be
possible. Figure 6 shows the calculated OC*, HO* and
HOO* binding energies on three different atop sites (‘‘0’’,
‘‘1’’ and ‘‘2’’) of Pt overlayer structures on Pt3Sc and Pt3Y
with subsurface solute metal concentrations of 25 and 50
%. Although not perfectly linear, a clear trend is observed.
A surface which binds OC* weaker will also bind HO* and
HOO* weaker. Two datapoints (‘‘Pt3Y 50 % 2’’ and ‘‘Pt3Sc
50 % 2’’) on the HO* versus OC* binding energy graph are
outliers and it is noted that they are also outliers when
comparing the HO* and HOO* binding energies which
should scale linearly. A linear fit is made to the data
(except the two outliers) giving the following relations:
DEbin;OH ¼ ð0:42 0:04Þ DEbin;CO ð1Þ
DEbin;OOH ¼ ð0:48 0:05Þ DEbin;CO ð2Þ
The ideal ORR catalyst should bind oxygen around 0.2 eV
weaker than Pt [5]. From the scaling relations between O*
and HO* this corresponds to binding HO* 0.1 eV weaker.
From Eq. 1 this is seen to correspond to a weaker binding
of OC* by 0:1 eV0:42¼ 0:24 eV: Ruff et al. [56] have plotted the
Table 2 Energy in eV required to move 1 X atom from the sub
surface layer to the surface layer of a Pt3X alloy with a 1 ML thick Pt
skin
Concentration
(%)
Pt3Y Pt3Sc Pt3Ni Pt3Ti
50 -2.27 -1.24 0.36 -0.74
25 0.41 0.90 0.75 1.16
Calculations are made for both 50 and 25 % initial X concentrations
in the second layer
Fig. 6 Calculated OC*, HO* and HOO* binding energies on various Pt overlayer structures. ‘‘Pt3Sc 50% X’’ refers to the on top site X on the
inset figure for a Pt3Sc sample with 50 % Sc in the second layer
Top Catal
123

calculated CO adsorption energies and activation energies
for desorption on different Pd nanostructures versus the
corresponding desorption temperatures. They found that
there is a linear relation between the two, which can be
expressed as:
DEbin;CO 0:0028eV
K DTdes;CO ð3Þ
From Eq. (3) we get that a weaker binding of OC* by
0.24 eV corresponds to a lowering in desorption tempera-
ture of CO by 0:24 eV0:0028 eV
K
¼ 85 K: There is clearly some
uncertainty on this value, but the important point is that a
Pt overlayer catalyst should bind CO weaker (on the order
of 85 K) in order for it to have an optimal bonding of the O
species relevant for the oxygen reduction reaction.
The ARXPS depth profiles shown in Fig. 4 indicate that
some subsurface scandium leaches out upon electrochem-
ical testing. In the following we consider the calculated
effect of different amounts of scandium in the second layer
on the binding of ORR intermediates.
Figure 7 shows the calculated free energy diagram for
the oxygen reduction reaction considering 1 ML Pt skins
on Pt3Sc with 50, 25 and 0 % Sc in the second layer. For 25
and 50 % Sc in the second layer oxygen intermediates are
bound weaker than for pure Pt and the free energy change
for the formation of HOO* is increased whereas the free
energy change for the removal of HO* is decreased. For 0
% Sc in the second layer (i.e. 2 layers of Pt on top of Pt3Sc)
the oxygen intermediates are bound stronger than for pure
Pt, resulting in an increase in the free energy change for the
removal of HO*. By comparing the free energy changes for
the different catalysts the theoretical volcano shown in
Fig. 8 is obtained.
The solid line marks the Sabatier volcano [4, 54] based
on the observed scaling relation between the free energies
of HO* and HOO : DGHOO DGHO þ 3:2 eV [11, 57].
For Pt3Sc with 25 % Sc in the second layer the free energy
of HOO* is higher than predicted from the free energy of
HO* resulting in a decrease of the rate predicted by the
Sabatier volcano. For 50 and 25 % Sc in the second layer
the calculated activity is increased compared to pure Pt (cf.
Greeley et al. [5]) whereas for 0 % Sc in the second layer
the calculated activity is decreased. We do not anticipate
the Pt3Sc structures with 0 and 50 % Sc in the second layer
to be stable structures. In the structure with two Pt layers,
we would expect the Pt–Pt interatomic distance to relax
towards that of unstrained pure Pt [58]. The structure with
50 % Sc in the second layer will likely reconstruct in order
to minimise Sc–Sc neighbours (cf. Table 2 and the
accompanying discussion).
5 Discussion
For vacuum annealed polycrystalline Pt3Sc, the onset of
CO desorption is around 130 K lower than on Pt(111) and
the main desorption peak is around 50 K lower than on
Pt(111). According to the above relation between the CO
desorption temperature and the HO* binding energy, the
vacuum annealed surface would be situated close to the tip
of the ORR volcano, if it were stable under reaction
conditions. However, despite the very negative enthalpy of
formation of Pt3Sc, at 200 mbar O2, the Sc segregated to
the surface to form scandium oxide. This shows that more
generally, Pt-skin structures do not seem to be stable for
alloys of Pt and early transition metals, unlike alloys such
as Pt3Ni, Pt3Co or Cu/Pt. It is worth perusing upon why
this is the case. The segregation of the solute metal from
the subsurface layer to the surface layer is possibly
Fig. 7 Calculated free energy diagram for the oxygen reduction
reaction at 0.9 V versus RHE under standard conditions for Pt(111)
(black curve) and for Pt overlayers on Pt3Sc (green, red and blue).
The Pt3Sc data are calculated for Pt overlayers with Pt3Sc in the bulk
and different Sc content in the second layer indicated on the figure
−0.05 0.00 0.05 0.10 0.15 0.20 0.25
ΔGHO∗ − ΔGPtHO∗ (eV)
0.70
0.75
0.80
0.85
0.90
UL
(V)
10−1
100
101
102
j k/jPt
k
Fig. 8 DFT calculated volcano plot for Pt overlayers on Pt3Sc:
calculated potential, UL, required for all reaction steps to be negative
in free energy as a function of hydroxyl binding energy, DGHO ;relative to pure Pt. Also shown is the calculated activity enhancement
relative to Pt at U = 0.9 V (RHE). The Pt3Sc data are calculated for
Pt overlayers with Pt3Sc in the bulk and different Sc content in the
second layer indicated on the figure. The lines are theoretical
predictions, based on a simple Sabatier analysis [4, 54]
Top Catal
123

initiated by direct interactions between oxygen containing
adsorbates and the solute metal in the subsurface layer.
For instance, monoatomic O tends to adsorb in the
threefold hollow site of Pt overlayers with the (111) ter-
mination [59]; in the case of Pt3Sc, adsorbed O would
have Sc as a nearest neighbour. Menning and Chen found
this to be the case for the Ni/Pt and Co/Pt systems at
temperatures above 630 K [60]. Moreover, Sc and O
would form a much stronger bond than Ni–O or Co–O
[53]. Consequently, the barrier for Sc segregation in the
presence of adsorbed oxygen would be low, allowing it to
take place at room temperature. Nonetheless, we anticipate
that the strong interaction between Sc (or Y, La or Gd for
that matter) would provide a large barrier for its diffusion
through a thicker Pt overlayer, in comparison to the small
barrier for the diffusion of a late transition metal in a Pt
matrix [5, 11, 14].
It is interesting to note that the thickness of the Pt
overlayer that is formed under reaction conditions on
polycrystalline Pt3Sc (cf. Fig. 4), at 1 or 2 monolayers, is
much lower than that on Pt3Y or Pt5Y, typically greater
than 3 monolayers [12]. The standard reduction potential
and affinity towards oxygen are similar for Sc and Y [53,
61]. Furthermore, the heat of formation per formula unit of
Pt3Sc, Pt3Y and Pt5Y are also roughly equal [5, 62].
Comparing Pt3Sc, Pt3Y and Pt5Y, the most striking dif-
ference is the difference in strain of a pure Pt overlayer on
top of the alloy (0.9 % tensile strain for Pt3Sc, 3.8 % tensile
strain for Pt3Y and 5% compressive strain for Pt5Y [5, 63]).
The difference in strain could therefore be the reason for
the difference observed in the Pt overlayer thickness
between Pt3Sc, Pt3Y and Pt5Y after electrochemical mea-
surements. Moreover, the significant compressive strain
imposed on Pt5Y by the bulk is presumably the reason why
it is significantly more active than Pt3Sc [63].
The relatively small amount of strain induced by Sc
means that the binding energy of oxygen containing spe-
cies will be affected little by the presence of Sc in the bulk.
Moreover a tensile strained Pt overlayer would bind oxy-
gen containing species stronger, moving further away from
the tip of the ORR volcano. On this basis, an increased
oxygen reduction activity would require some Sc in the
second layer. In summary, we cannot rule out a strain
effect; nonetheless, to the best of our current understanding
the increase in ORR activity should be due to the ligand
effect.
The ARXPS depth profile of vacuum annealed Pt3Sc
from Fig. 4a would suggest that the second atomic layer
would be enriched in Sc, similar to that observed previ-
ously for Pt3Ni [25]. Even so, this is inconsistent with our
understanding of this type of compound, based on experi-
ments on similar alloys, e.g. Pt3Ti and our DFT calcula-
tions. As discussed earlier, the negative enthalpy of
formation of Pt3Sc [5] would imply that forming Sc–Sc
neighbours (which would be the case for 50% Sc in the
second layer) is not likely. Consequently, the enrichment of
subsurface Sc is likely an artefact from the fitting proce-
dure used for the ARXPS depth profiles. Such artefacts are
related to the uncertainties in the absolute XPS sensitivity
factors. Even so, the relative differences in ARXPS depth
profile between Pt3Sc prepared in various ways is more
likely to be significant. After oxygen reduction measure-
ments the overall Pt:Sc ratio increases and correspondingly
the amount of Sc in the second layer clearly decreases due
to Sc dissolution. Therefore, we propose that the reason for
the slight increase in activity observed on sputter cleaned
and vacuum annealed Pt3Sc, relative to Pt, is due to some
residual amount of Sc in the subsurface layer.
According to the free energy diagram and the volcano in
Figs. 7 and 8, the oxygen reduction activity is extremely
sensitive to the subsurface concentration of Pt. For 50 and
25% Sc in the second layer, oxygen containing species are
bound weaker that on Pt and the calculated ORR activity is
higher than for Pt. However, for 0% Sc in the second layer
a stronger binding of oxygen containing species is observed
and the calculated ORR activity is lower than for Pt. The
origin of the increased ORR activity should then mainly be
due to a modification of the electronic structure of the Pt
surface atoms by Sc atoms in the underlying layers, cf. the
ligand effect [17].
6 Conclusions
We studied the effect of sputter cleaning and vacuum
annealing on the structure of Pt3Sc, (a) under vacuum
(b) following exposure to 200 mbar O2 and (c) following
exposure to oxygen reduction reaction conditions. It
turns out that the vacuum annealed structure is slightly
unstable in air and under reaction conditions. Although
we predict that the vacuum annealed structure would be
very active for oxygen reduction, the loss of Sc under
reaction conditions results in a surface with somewhat
lower activity.
We anticipate that the phenomena observed here are
more general: Pt alloys with rare earths and early transition
metals are unlikely to be stable as Pt-skin structures, with
significant subsurface concentrations of the solute metal.
Nonetheless, the negative enthalpy of formation of these
compounds could stabilise them against dealloying under
the harsh conditions of a fuel cell cathode as Pt skeleton
structures. Consequently, it seems that a promising strategy
towards obtaining highly active and stable catalyts for
oxygen reduction would be to find alloys of Pt and early
transition metals or lanthanides which impose compressive
strain on the Pt surface layer [11, 14].
Top Catal
123

Acknowledgements Funding by the Danish Council for Technology
and Innovations FTP program and by the Danish Strategic Research
Councils HyCycle program is gratefully acknowledged. P.H.F.
acknowledges funding from the Danish Council for Strategic Research
in Sustainable Energy and Environment-project ‘‘MEDLYS’’. I.E.L.S.
gratefully acknowledges financial support from Energinet.dk through
the R&D program ForskEL (CATBOOSTER project). The Center for
Atomic-scale Materials Design is supported by the Lundbeck Foun-
dation. The Center for Individual Nanoparticle Functionality is sup-
ported by the Danish National Research Foundation.
References
1. Gasteiger HA, Kocha SS, Sompalli B, Wagner FT (2005) Appl
Catal B 56:9
2. Rossmeisl J, Logadottir J, Nørskov JK (2005) Chem Phys
319:178
3. Abild-Pedersen F, Greeley J, Studt F, Rossmeisl J, Munter TR,
Moses PG, Skulason E, Bligaard T, Nørskov JK (2007) Phys Rev
Lett 99:016105
4. Nørskov JK, Rossmeisl J, Logadottir A, Lindqvist L, Kitchin JR,
Bligaard T, Jonsson H (2004) J Phys Chem B 108:17886
5. Greeley J, Stephens IEL, Bondarenko AS, Johansson TP, Hansen
HA, Jaramillo TF, Rossmeisl J, Chorkendorff I, Nørskov JK
(2009) Nat Chem 1:552
6. Gasteiger HA, Markovic NM (2009) Science 324:48
7. Adzic RR, Zhang J, Sasaki K, Vukmirovic MB, Shao M, Wang
JX, Nilekar AU, Mavrikakis M, Valerio JA, Uribe F (2007) Top
Catal 46:249
8. Strasser P, Koh S, Anniyev T, Greeley J, More K, Yu CF, Liu
ZC, Kaya S, Nordlund D, Ogasawara H, Toney MF, Nilsson A
(2010) Nat Chem 2:454
9. Mukerjee S, Srinivasan S, Soriaga MP, McBreen J (1995) J
Electrochem Soc 142:409
10. Stephens IEL, Bondarenko AS, Perez-Alonso FJ, Calle-Vallejo F,
Bech L, Johansson TP, Jepsen AK, Frydendal R, Knudsen BP,
Rossmeisl J, Chorkendorff I (2011) J Am Chem Soc 133:5485
11. Stephens IEL, Bondarenko AS, Grønbjerg U, Rossmeisl J,
Chorkendorff I (2012) Energy Environ Sci 5:6744
12. Stephens IEL, Bondarenko AS, Bech L, Chorkendorff I (2012)
ChemCatChem 4:341
13. Stamenkovic VR, Mun BS, Arenz M, Mayrhofer KJJ, Lucas CA,
Wang GF, Ross PN, Markovic NM (2007) Nat Mater 6:241
14. Escudero-Escribano M, Verdaguer-Casadevall A, Malacrida P,
Grønbjerg U, Knudsen BP, Jepsen AK, Rossmeisl J, Stephens
IEL, Chorkendorff I (2012) J Am Chem Soc 134:16476
15. Dubau L, Maillard F, Chatenet M, Andre J, Rossinot E (2010)
Electrochim Acta 56:776
16. Maillard F, Dubau L, Durst J, Chatenet M, Andre J, Rossinot E
(2010) Electrochem Commun 12:1161
17. Kitchin J, Nørskov JK, Barteau M, Chen J (2004) J Chem Phys
120:10240
18. Mavrikakis M, Hammer B, Nørskov JK (1998) Phys Rev Lett
81:2819
19. Lischka M, Mosch C, Gross A (2007) Electrochim Acta 52:2219
20. Hoster HE, Alves OB, Koper MTM (2010) ChemPhysChem
11:1518
21. Schlapka A, Lischka M, Gross A, Kasberger U, Jakob P (2003)
Phys Rev Lett 91:016101
22. Calle-Vallejo F, Martinez JI, Garcia-Lastra JM, Rossmeisl J,
Koper MTM (2012) Phys Rev Lett 108:116103
23. Ruban AV, Skriver HL, Nørskov JK (1998) Phys Rev Lett 80:1240
24. Stamenkovic V, Schmidt TJ, Ross PN, Markovic NM (2002) J
Phys Chem B 106:11970
25. Stamenkovic VR, Fowler B, Mun BS, Wang GF, Ross PN, Lucas
CA, Markovic NM (2007) Science 315:493
26. Stamenkovic V, Mun BS, Mayrhofer KJJ, Ross PN, Markovic
NM, Rossmeisl J, Greeley J, Nørskov JK (2006) Angew Chem Int
Ed Engl 45:2897
27. Watanabe M, Tsurumi K, Mizukami T, Nakamura T, Stonehart P
(1994) J Electrochem Soc 141:2659
28. Toda T, Igarashi H, Uchida H, Watanabe M (1999) J Electrochem
Soc 146:3750
29. Mun BS, Watanabe M, Rossi M, Stamenkovic V, Markovic NM,
Ross PN (2005) J Chem Phys 123:204717
30. Chen W, Paul JAK, Barbieri A, Van Hove MA, Cameron S,
Dwyer DJ (1993) J Phys Condens Matter 5:4585
31. Duan Z, Zhong J, Wang G (2010) J Chem Phys 133:114701
32. Ross PN (1992) J Vac Sci Technol A 10:2546
33. Bardi U, Beard BC, Ross PN (1990) J Catal 124:22
34. Bardi U, Dahlgren D, Ross PN (1986) J Catal 100:196
35. Haner AH, Ross PN, Bardi U, Atrei A (1992) J Vac Sci Technol
A 10:2718
36. Friebel D, Viswanathan V, Miller DJ, Anniyev T, Ogasawara H,
Larsen AH, O’Grady CP, Nørskov JK, Nilsson A (2012) J Am
Chem Soc 134:9664
37. Andersson KJ, Calle-Vallejo F, Rossmeisl J, Chorkendorff I
(2009) J Am Chem Soc 131:2404
38. Wagner CD, Davis LE, Zeller MV, Taylor JA, Raymond RH,
Gale LH (1981) Surf Interface Anal 3:211
39. Seah M, Gilmore I, Spencer S (2001) J Elec Spect Relat Phenom
120:93
40. Scofield J (1976) J Elec Spect Relat Phenom 8:129
41. ASE and DACAPO are open source codes available at http://
wiki.fysik.dtu.dk
42. Vanderbilt D (1990) Phys Rev B 41:7892
43. Hammer B, Hansen LB, Nørskov JK (1999) Phys Rev B 59:7413
44. Bengtsson L (1999) Phys Rev B 59:12301
45. Monkhorst HJ, Pack JD (1976) Phys Rev B 13:5188
46. Niehus H, Heiland W, Taglauer E (1993) Surf Sci Rep 17:213
47. Brongersmaa HH, Draxler M, de Ridder M, Bauer P (2007) Surf
Sci Rep 62:63
48. Fiordaliso EM, Dahl S, Chorkendorff I (2012) J Phys Chem C
116:5773
49. Mikhailov SN, van den Oetelaar LCA, Brongersma HH (1994)
Nucl Instrum Method Phys Res B 93:210
50. Petrova NV, Yakovkin IN (2002) Surf Sci 519:90
51. Nieskens DLS, van Bavel AP, Niemantsverdriet JW (2003) Surf
Sci 546:159
52. Bandarenka AS, Varela AS, Karamad MR, Calle-Vallejo F, Bech
L, Perez-Alonso FJ, Rossmeisl J, Stephens IEL, Chorkendorff I
(2012) Angew Chem Int Ed 51:11845
53. Pourbaix M (1974) Atlas of electrochemical equilibria in aqueous
solutions. National Association of Corrosion Engineers, Houston
54. Rossmeisl J, Karlberg GS, Jaramillo T, Nørskov JK (2008) Far-
aday Discuss 140:337
55. Ferrin P, Nilekar A, Greeley J, Mavrikakis M, Rossmeisl J (2008)
Surf Sci 602:3424
56. Ruff M, Takehiro N, Liu P, Nørskov JK, Behm RJ (2007) Chem
Phys Chem 8:2068
57. Koper MTM (2011) J Electroanal Chem 660:254
58. Yang RZ, Strasser P, Toney MF (2011) J Phys Chem C 115:9074
59. Viswanathan V, Hansen HA, Rossmeisl J, Jaramillo TF, Pitsch H,
Nørskov JK (2012) J Phys Chem C 116:4698
60. Menning CA, Chen JG (2010) J Power Source 195:3140
61. Haynes WM (Ed) (2012) CRC handbook of chemistry and
physics, Taylor and Francis, Boca Raton (Internet version)
62. Palenzona A, Cirafici S (1990) J Phase Equilib 11:493
63. Johansson TP (2012) New materials for oxygen reduction elec-
trodes. PhD thesis, Technical University of Denmark, Lyngby
Top Catal
123


Enhanced activity and stability of Pt–La and Pt–Cealloys for oxygen electroreduction: the elucidationof the active surface phase†
Paolo Malacrida, Marıa Escudero-Escribano, Arnau Verdaguer-Casadevall,Ifan E. L. Stephens and Ib Chorkendorff*
Three different Pt–lanthanide metal alloys (Pt5La, Pt5Ce and Pt3La) have been studied as oxygen reduction
reaction (ORR) electrocatalysts. Sputter-cleaned polycrystalline Pt5La and Pt5Ce exhibit more than a 3-fold
activity enhancement compared to polycrystalline Pt at 0.9 V, while Pt3La heavily corrodes in 0.1 M HClO4
electrolyte. Angle Resolved X-ray Photoelectron Spectroscopy (AR-XPS) and Low Energy Ion Scattering
(LEIS) have been extensively combined with electrochemical techniques to follow the chemical and
structural changes at the surface. The highly reactive lanthanide atoms are not stable in the presence of
oxygen and readily oxidize. The surface oxides are completely dissolved in the electrolyte. In Pt5La and
Pt5Ce the so formed Pt overlayer provides kinetic stability against the further oxidation and dissolution.
At the same time, it ensures a very high stability during ORR potential cycling, suggesting that these
alloys hold promise as cathode catalysts in Proton Exchange Membrane Fuel Cells (PEMFCs).
1. Introduction
Proton Exchange Membrane Fuel Cells (PEMFCs) represent oneof the most promising alternatives to traditional power sourcesin a future sustainable society, especially for transportationapplications. Using hydrogen as a fuel, they could provide anefficient and clean alternative to engines based on fossil fuels.1,2
However, the commercialisation of PEMFCs is still inhibited bytheir relatively low performances and high production costs.This is, to a large part, due to the slow kinetics of the oxygenreduction reaction (ORR) at the cathode and the copiousamounts of Pt used to catalyse this reaction.2,3 AlthoughPt-based materials are the most active ORR catalysts, they stillexhibit rather high overpotentials. For this reason, in order toensure high power densities, for instance in automotive vehi-cles, high Pt loadings are needed. Consequently, there has beenmuch interest during the past few decades in developing newORR catalysts. They should both be highly active and stableunder the acidic oxidising conditions of a PEMFC cathode.2–7
Since Pt is both expensive and scarce, it is necessary to decreasethe amount of Pt required to catalyse the ORR, in favour ofcheaper and more abundant materials. To date, the mostsuccessful catalysts which reach this aim are alloys of Pt andother transition metals.
Alloys of Pt and late transition metals such as Fe, Co, Ni, andCu have been studied extensively, leading to strongly enhancedORR activities.2,3,7–12 Nonetheless, these alloys are thermody-namically unstable under fuel-cell conditions; the transitionmetal tends to dissolve into the electrolyte via a process knownas dealloying.5,11,13 The resulting surface composition is Ptenriched. However, a precise description of the structure ischallenging, the level of enrichment and the thickness of thedealloyed region varying for different alloys, preparation tech-niques and electrochemical treatments. Generally the dissolu-tion proceeds until a several layer-thick Pt overlayer is formed,14
denoted by Stamenkovic et al. as a “Pt skeleton” structure.7,8,10
Although this Pt overlayer might provide temporary kineticstability against further dissolution, further dealloying isconsidered as the main cause of deactivation for thesecatalysts.15
A single Pt monolayer on the surface of the alloy can bestabilised by vacuum annealing. This structure was denoted byStamenkovic et al. as a “Pt-skin” structure.8,10 Such surfaceshave exhibited the highest ORR activities ever reported.9,16–18
However, it may be challenging to synthesise a supported Pt-skin catalyst in large amounts and stabilise it over the long timeperiods and many potential cycles required for a PEMFCcathode.19
The above considerations led to the search for new Pt-alloycatalysts. A theoretical screening based on Density FunctionalTheory (DFT) calculations was set out to identify alloys that wereboth active and stable.20 The activity of the catalyst was pre-dicted on the notion that the optimal metal catalyst for the ORRshould bind O (or OH) slightly more weakly than pure Pt.21,22
Center for Individual Nanoparticle Functionality, Department of Physics, Technical
University of Denmark (DTU), Building 312, 2800 Lyngby, Denmark. E-mail:
† Electronic supplementary information (ESI) available. See DOI:10.1039/c3ta14574c
Cite this: DOI: 10.1039/c3ta14574c
Received 7th November 2013Accepted 7th January 2014
DOI: 10.1039/c3ta14574c
www.rsc.org/MaterialsA
This journal is © The Royal Society of Chemistry 2014 J. Mater. Chem. A
Journal ofMaterials Chemistry A
PAPER
Publ
ishe
d on
07
Janu
ary
2014
. Dow
nloa
ded
by D
TU
Lib
rary
on
10/0
2/20
14 1
3:36
:03.
View Article OnlineView Journal

The key descriptor for stability was that the catalysts have asnegative an alloying energy, or heat of formation, as possible.The calculations predicted that Pt3Y and Pt3Sc fullled thesecriteria. Indeed experiments conrmed an activity enhance-ment relative to polycrystalline Pt for both Pt3Y and Pt3Sc:20,23
Pt3Y in particular exhibiting the highest activity ever reportedfor a Pt-skeleton structure.
A negative heat of formation may stabilise a Pt alloy catalystagainst degradation via dealloying. This is because the kineticbarrier for metal diffusion through the alloy should, to a largepart, be dictated by the alloying energy. The exceptionallynegative heat of formation of Pt3Y, DHf(alloy)4 eV, is charac-teristic of several other alloys of Pt with early transition metalsor lanthanides, such as Pt5Gd, Pt5La and Pt5Ce as shown inFig. 1.24–29 This is because the d-band of these alloys is half l-led, meaning that all the bonding states are full, and anti-bonding states are empty.3,20,30,31 On the other hand, Fig. 1 alsoshows that alloys of Pt and late transition metals, such as Pt3Coand Pt3Ni, have much less negative alloying energies. Veryrecently, we also discovered that alloys of Pt5La and Pt5Gd arevery promising catalysts for the ORR,3,32,33 with Pt5Gd, togetherwith Pt3Y, being the most active catalyst amongst polycrystallinePt-skeleton structures. In addition to its high activity, thepercentage of activity loss aer 10 000 cycles between 0.6 and 1V for Pt5Gd is less than 15%. We note that despite theirdenomination as “rare earths”, they are muchmore inexpensiveand much more abundant than Pt.34
In order to elucidate the active phase of Pt5Y, Pt3Y, Pt5Gd andPt5La, we employed angle resolved X-ray photoelectron spec-troscopy. Our measurements suggested that in each case, thesurface comprised of a thick Pt overlayer, to the order of 1 nm indepth. This is easily understood on the basis that there is astrong driving force for the dissolution of the metal from thesurface layer. Moreover, oxides of Y, La and Gd are all unstablein acid solution.35 In the absence of any solute metal in the near-surface region, we proposed that the activity of these catalystswas due to a compressive strain induced by the alloy bulk on thePt overlayer, weakening the binding of surface adsorbates suchas OH or O.
Recent studies by Kim and coworkers have also focused onalloys of Pt and early transition metals and lanthanides as ORRcatalysts.36–38 Their Pt3La sample exhibited a similar activity tothat of the Pt5La we reported,3,32 although their interpretation ofits activity was somewhat different. On the basis of their AR-XPSmeasurements, they report that the surface composition isessentially unchanged before and aer the reaction. Using DFTcalculations on a closely packed structure of Pt3La, they showthat La will have a tendency to segregate towards the surface, invacuum. They also suggest that the negative alloying energy issufficient to ensure that the alloy is thermodynamically stableagainst oxidation or dissolution. This discrepancy between theirinterpretation and our own led us to revisit the issue of thesurface composition of alloys of Pt and La. Moreover, there is abroader debate about the possible stabilisation of more reactivemetals at the surface of Pt and Pd alloys, even for more exten-sively studied alloys, such as Pt–Ni and Pt–Co.8,13,39,40 Thispossibility would be of fundamental relevance, since theirenhanced activity could be also explained in terms of bifunc-tional effects: with both metals providing active sites duringORR, the more reactive atoms facilitating the O2 dissociation orthe removal of OH radicals from the more noble Pt sites.41,42
This article, for the rst time, investigates the electro-chemical behaviour of Pt5Ce, demonstrating its very highactivity and stability towards the ORR. Ce, together with La, isthe most abundant, most largely produced and cheapestelement among the rare earths.34 Moreover, by comparing Pt5Cewith Pt5La and Pt3La, we can elucidate the origin of theenhancement of the activity and stability for these alloys, whichis still controversial. Furthermore, we use these catalysts toprovide evidence for the intrinsic instability of Ce and La on thesurface.
2. Experimental
Polycrystalline alloys (5 mm in diameter disks) of Pt5La, Pt3Laand Pt5Ce were supplied by Mateck GmbH, Germany. Thecrystal structures of the alloys were investigated by X-raydiffraction (XRD) and are in agreement with that reported in theliterature. XRD measurements and full experimental details aredescribed in the ESI.† The surface stoichiometry and theabsence of impurities were checked by X-ray photoelectronspectroscopy (XPS). Before all electrochemical measurementsthe samples were cleaned under Ultra High Vacuum (UHV)conditions by Ar sputtering, until no C contaminations wereobserved. The ion energy was set to 0.5 keV and a beam currentof 1 mA over a 7 7mm2 area was used to homogenously sputterthe active surface.
2.1 Electrochemical characterization
The electrochemical experiments were performed with a VMP2potentiostat (Bio-Logic Instruments), controlled by a computer.The rotating ring-disk electrode (RRDE) assemblies wereprovided by Pine Instruments Corporation. A standard two-compartment glass cell was used, which was equipped with awater jacket attached to a hot water bath to control the
Fig. 1 Experimental enthalpies of formation specified per formula unit.Values for the different Pt alloys are respectively taken from: Pt3Ni,24
Pt3Cu,25 Pt3Co,26 Pt3Fe,26 Pt5Gd,27 Pt5Ce,27,28 Pt5La27,28 and Pt3Y.27
J. Mater. Chem. A This journal is © The Royal Society of Chemistry 2014
Journal of Materials Chemistry A Paper
Publ
ishe
d on
07
Janu
ary
2014
. Dow
nloa
ded
by D
TU
Lib
rary
on
10/0
2/20
14 1
3:36
:03.
View Article Online

temperature. All the electrochemical experiments were carriedout at 23 C. The electrolyte, 0.1 MHClO4 (Merck Suprapur), wasprepared with Millipore (Milli-Q, 18.2 MU cm1) water. Thecounter electrode was a Pt wire and the reference was an Hg/Hg2SO4 electrode, separated from the working electrodecompartment using ceramic frits. All the potentials in the textare referred to the reversible hydrogen electrode (RHE), and arecorrected for ohmic losses. The polycrystalline alloys, insertedinto the arbor of a RRDE, were immersed into the electro-chemical cell under potential control of 0.1 V vs. RHE into a N2
(N5, Air Products) saturated electrolyte. The electrodes werecycled until stable cyclic voltammograms (CVs) were obtained.The ORR activity measurements were conducted in an electro-lyte saturated with O2 (N55, Air Products).
2.2 Physical characterization
Angle Resolved X-ray Photoelectron Spectroscopy (AR-XPS) wasused as a non-destructive technique to investigate the chemicalstate of the alloys and their surface morphology. Measurementswere performed on a Thermo Scientic Theta Probe instrumentwith a base pressure of 5 1010 mbar. The X-ray source ismonochromatised Al Ka (1486.7 eV), giving a resolution betterthan 1.0 eV at the employed pass energy of 100 eV. The analyserhas an acceptance angle of 60, between 20 and 80 to thesurface normal; for the angle resolved proles, 16 differentchannels were analysed in parallel corresponding to 3.75 wideangle intervals. Angle resolved data were processed using thesimulation tool, ARProcess (Thermo Avantage soware), whichuses a maximum entropy method combined with a geneticalgorithm to dene the depth proles: angles over 65 wereomitted to minimize the effects of elastic scattering. Furthertechnical details are provided in the ESI.†
AR-XPS was initially carried out during sputter-cleaningstarting 20 minutes aer the beginning of the cleaning proce-dure. Sputtering was not stopped during these measurementsin order to avoid sub-monolayer amounts of O to be adsorbedon the sample due to the expected high reactivity and highsticking coefficients of O on La and Ce (see ESI†).43,44 Thisprocedure did not induce any signicant changes in the Ce 3d,La 3d and Pt 4f peak shape but prevented the presence of C andO contaminations: lower than 1% in all cases. Subsequently,samples were transferred to a fast-entry air lock, vented in drynitrogen up to atmospheric pressure and readily protected by adrop of H2-saturated Milli-Q water for transfer to a rotating ringdisk electrode assembly. AR-XPS measurements were repeatedaer ORR testing and aer stability tests in order to evaluate theactive structure of the alloy and its stability. In order to inves-tigate the stability of the alloys in the presence of oxygen,identical measurements were also taken aer exposure of thesputtered-cleaned surfaces to air for 1 hour.
Low Energy Ion Scattering (LEIS) was used to probe thecomposition of the outmost layer of Pt5Ce aer electrochemicalmeasurements. LEIS spectra were acquired with Ne+ ions at1 keV energy. A residual Ne pressure of 5 109 mbar gavesample currents between 10 and 16 nA. The beam was rasteredover a large sample area, approximately 4 mm 4 mm, in order
to minimize the destructive effects induced by ion sputtering.The average scattering angle was 125, and the incidence anglewas 45. Initially, a few scans were repeated in order to clean thetested alloys from the organic impurities collected during thetransfer and the electrochemical measurements. Each scan tookapproximately 2 minutes. This cleaning phase took 10 to15 minutes, until the Pt signal started appearing. For compar-ison, LEIS spectra were also taken using the same parameterson the sputter-cleaned alloy.
3. Results3.1 Crystal structure
The structure of the alloys was investigated by XRD as reportedin the ESI.† No closed-packed structure is observed for eitherPt5La or Pt5Ce, they instead exhibited a hexagonal structurewith a lattice parameter of a ¼ 5.39 A and a ¼ 5.38 A respec-tively, in good agreement with the values reported previously.45
The polycrystalline sample with nominal composition of Pt3Lawas, as a matter of fact, composed of a mixture of two phases:Pt2La and Pt5La. This is consistent with the Pt–La phasediagrams in the literature, which do not show the existence of astable Pt3La phase.46–48
3.2 Electrochemical characterisation and ORR activity
Fig. S2† shows the stable CVs in N2-saturated 0.1 M HClO4
solutions on sputter-cleaned Pt5Ce and Pt5La, as compared tothe base CV on polycrystalline Pt. The ORR activities of theelectrocatalysts were evaluated in oxygen-saturated solutionsaer stable CVs in N2 were obtained (typically aer ca. 100cycles). Fig. S6† shows typical CVs on sputter-cleaned Pt5Ce,Pt5La and Pt polycrystalline electrodes in O2-saturatedperchloric acid solutions. We assume that the roughness factorwas 1 cm2/cm2, as we found to be the case for other Pt alloys,prepared in the same manner.20,49 We have also performed CO-stripping measurements on Pt5La and Pt5Ce (all the results areexplained and discussed in the ESI†). As the CO-strippingcharges were similar or slightly lower for Pt5La and Pt5Ce alloysthan for pure Pt, all currents were normalised by the geometricsurface area, consistent with our previous studies.3,20,23,33,49
Given that the electrodes consist of planar surfaces, with asurface composition of pure Pt, we consider the geometricsurface area to be a more reliable and more conservative esti-mate of the microscopic surface area (single crystal studies haveshown that the saturation coverages of CO and H on Pt over-layers can be highly sensitive to alloying).50 The kinetic currentdensity, jk, i.e. the current density in the absence of any mass-transfer effects, was calculated by the equation [( jd j)/( jd j)],where jd is the limited current density and j the measuredcurrent density. Fig. 2 shows the Tafel plot ( jk as a function ofthe potential, U) for sputter-cleaned Pt5Ce, Pt5La, Pt3La and Ptpolycrystalline electrodes in O2-saturated 0.1 M HClO4. It mustbe noted that the reported activity for the Pt polycrystallinesample agrees well, or is slightly higher, than recent experi-ments conducted by reputable groups under nominally thesame conditions.10,51,52 Pt5Gd (which is, together with P3Y, the
This journal is © The Royal Society of Chemistry 2014 J. Mater. Chem. A
Paper Journal of Materials Chemistry A
Publ
ishe
d on
07
Janu
ary
2014
. Dow
nloa
ded
by D
TU
Lib
rary
on
10/0
2/20
14 1
3:36
:03.
View Article Online

most active polycrystalline Pt-alloy reported in the literature sofar)20,33 is also represented for comparison. As can be observedin Fig. 2, the kinetic current densities for Pt5Ce and Pt5La, at0.90 V vs. RHE, are (7.4 0.4) mA cm2 and (6.8 0.3) mAcm2, respectively. This means that the ORR activity enhance-ments for Pt5Ce and Pt5La are 3.7 and 3.4, respectively. Thisenhancement in activity is considerably higher than thatexhibited by Pt3Fe, Pt3Co and Pt3Ni catalysts prepared undersimilar conditions, which revealed about a factor of 2enhancement compared to polycrystalline Pt.8,53 According toour previous results, Pt5Ce is the most active polycrystallinecatalyst for the ORR aer Pt3Y20 and Pt5Gd.33
In contrast, the ORR activity on Pt3La is very similar to thaton pure Pt. It must be noted that, as discussed in the ESI andshown in Fig. S5,† CVs in N2-saturated solutions presentremarkable changes during cycling, indicating that the poly-crystalline Pt3La sample is corroded. This was conrmed byInductively Coupled Plasma Mass Spectrometry (ICP-MS)measurements of equal volumes of electrolyte taken aermeasurements of the Pt5La and Pt3La ORR activity (Fig. S7†) andcompared to a clean as-prepared electrolyte. In the case ofPt3La, a substantial increase of the La signal was found indi-cating a strong La dissolution and a possible reason for suchlow activity, similar to Pt. In contrast, Yoo et al.37 reported anappreciable enhancement in activity for the Pt3La alloy over thatof pure Pt, as well as high stability. Pt3La results, together with acomparison between the behaviour of Pt3La and the Pt5Lasamples, and a discussion about the stability of these catalyticsurfaces will be assessed below.
3.3 Active chemical state and surface stability
In order to follow the chemical state of the catalytic surfaces,AR-XPS was performed before and aer all the preparation andtesting steps of this study. The shapes of the La 3d and Ce 3dpeaks in particular provide useful diagnostic information,despite the high level of complexity which is typical of thelanthanide metals. The presence of localized electrons in the 5dor 4f shells generates intense shake-up satellites in the 3dregion of the La and Ce spectrum; their relative intensity and
energy position are strongly dependent on the chemical state.54
The origin of such behaviour has been addressed by variousstudies and can be well described by the Schonhammer–Gun-narsson treatment.55 The La and Ce initial state as well as thenal state, excited by photoelectron emission, cannot bedescribed with a single electron approximation and a many-body description is required. Both systems are described as thelinear combination of different fn states, where n is the electronoccupancy of the 4f shell. These valence orbitals and in partic-ular the 4f orbitals affect the level of screening of the core-holeand, as a result, the observed energy position of the 3d lines. Ahigher number of electrons in this 4f shell better screens thephotoemitted electron from the core hole, resulting in a higherkinetic energy. In the spectra shown in Fig. 3 the La 3d and Ce3d signals were tted according to the assignment of fn statesreported in the literature.44,56,57 Dening fn as the predominantcomponent of each lanthanide in the ground state, elementalLa (valence electron conguration 5d16s2) is predominantlycomposed of the n ¼ 0 state, while for Ce (4f15d16s2) the oneelectron occupancy of the 4f shell gives n¼ 1. For the interest ofthis study, it should be noted that these main peaks are themost intense in the metallic state and in intermetalliccompounds; weaker satellites arise from the f1 state in the caseof La and from the f0 and f2 states in the case of Ce.57 The chargetransfer occurring during oxidation shis the position of thesestates and, remarkably, results in a strong intensication of thef0 satellite for La, and of the f1 and f2 satellites for Ce providinga clear diagnostic tool.43,44,54
Fig. 3a and b shows the La 3d and Ce 3d XPS peaks measuredduring sputtering of Pt5La and Pt5Ce respectively. Analogousresults were obtained for Pt3La and are presented in Fig. S11†together with the details of the tting parameters (see ESI†). Theshape of the 3d peaks is metallic; the fn peak accounts for mostof the intensity with distinctive visible fn+1 satellites at lowerbinding energies. The overall spectra resemble those measuredon similar compounds, such as Pd3La, Ni5La, Pd3Ce, Pd5Ce andNi5Ce.57–60 The well screened fn+1 satellites are strengthenedcompared to pure La or pure Ce as typical for such alloys.
It turns out that the chemical state of such reactive metalscannot be maintained while transferring the electrodes fromUHV to air and to the acidic electrolyte for the electrochemicalmeasurements. As shown in Fig. 3c and d, the La 3d and Ce 3dpeaks drastically vary as a consequence of one hour long airexposure. Despite the very negative heat of alloy formation,there is an even stronger driving force towards the surfaceoxidation.3 As described in the literature,44,61 all peaks shi tohigher binding energies and the satellite peaks grow in inten-sity: in some cases becoming even more intense than theprincipal ones. Similar effects were also measured aer fewseconds of air exposure, indicating that the surface is alwaysoxidized before introduction into the electrolyte, even if pro-tected by a drop of Milli-Q water.
Concerning Pt5Ce, the t of the Ce oxide phase is in generalcomplicated by the presence of trivalent Ce from Ce2O3 andtetravalent Ce from CeO2 overlapping to the metallic peaks. Theintense f0 components, which is absent for trivalent Ce,44,62
suggest CeO2 as the main oxidized phase. Therefore, for
Fig. 2 Tafel plots showing the kinetic current density ( jk) normalizedper geometric surface area of Pt5Ce, Pt5La, Pt3La, Pt and Pt5Gd33 as afunction of the potential (U).
J. Mater. Chem. A This journal is © The Royal Society of Chemistry 2014
Journal of Materials Chemistry A Paper
Publ
ishe
d on
07
Janu
ary
2014
. Dow
nloa
ded
by D
TU
Lib
rary
on
10/0
2/20
14 1
3:36
:03.
View Article Online

simplicity, in the t of Fig. 3d only the CeO2 phase wasconsidered. This gave an oxide spectrum similar to the one ofpreviously reported ts44,56 and a sufficiently good agreementwith the experimental data. A full quantication of the oxidecomponents is complicated by the possible presence of sub-oxides and is beyond the interest of this study. Table S2†summarizes the intensity ratios of the main peaks and satel-lites. Remarkably the amount of oxidized La relative to the totalLa signal is similar for both Pt3La and Pt5La, indicating asimilar level of surface oxidation.
AR-XPS spectra were taken aer electrochemical measure-ments. Due to the mentioned surface instability of the alloyedlanthanides, only the spectra of Fig. 3e and f can provide directinformation on the chemical state and structure of the activecatalysts. In this case the La 3d and Ce 3d spectra are completelymetallic, similar to those measured during sputtering. Thedisappearance of the oxide peaks suggests that any oxide phaseis unstable under ORR conditions and dissolves in the acidicelectrolyte. At the same time, the conservation of the metallicpeaks during the air-exposure between the EC cell and the XPSsetup indicates the presence of a protective layer, preventing thelanthanides from air contact and oxidation. The Pt enrichedsurface resulting from the dissolution of the oxides is expectedto provide this kind of protection. A careful comparison with theXPS on sputter cleaned samples provides further information;despite the overall similarities the intensity ratios between themain peaks and the satellites show a slight intensication of the
fn+1 satellites for La and of the fn1 satellites for Ce (see Fig. 3eand f and S11†); since this intensication is typical of La and Cealloys,57,59 it could be associated with the removal of surface La(or Ce) atoms which would be under-coordinated to Pt atoms.For all these considerations no metallic La or Ce should beexpected on the surface of these electrochemically tested alloys.
By discerning the XPS spectra at different emission angles,AR-XPS is a powerful technique for reconstructing the surfacestructure of these catalysts. Fig. 4a and b shows how the catalystcomposition changes as a function of the analyser acceptanceangle. The presence of a Pt overlayer explains the increase in thePt to La and Pt to Ce ratios, from the initial values measuredduring sputtering. This is particularly evident for higher anglesdue to the higher surface sensitivity. Fig. 4c and d represents thecorrespondent calculated depth proles of Pt5La and Pt5Ce aerelectrochemistry. Both catalysts exhibit the formation of a thickPt overlayer, which has been already described for other de-alloyed surfaces,7,8,14,33,49 including Pt3Co, Pt3Ni, Pt3Y, Pt5Y andPt5Gd. The formation of this structure from the initial sputter-cleaned surface is illustrated in Fig. 4e for Pt5Ce.
It should be noted that AR-XPS proles represent an averageover a 400 mm wide region of the crystals and over a depth of afew electron mean free paths (l z 10 A).63 Therefore the pres-ence of surface La or Ce atoms on some parts of the samples,which might be inhomogeneous due to their polycrystallinenature, cannot be excluded. In contrast LEIS only probes theoutmost layer composition, hence allowing us to rule out this
Fig. 3 XPS spectra of Pt5La (left) and Pt5Ce (right) at an average emission angle of 45. For each alloy the spectra were acquired underthree different conditions: during sputter-cleaning (a and b), after one hour long air exposure (c and d), and after electrochemical measurements(e and f). The measurements after electrochemical measurements were magnified three times due to the lower signal intensity. Fitted spectra ofthe metallic peaks (grey) and of the oxidized peaks (blue) appear under the experimental points. Details of the peak positions and relativeintensities are found in Table S2.†
This journal is © The Royal Society of Chemistry 2014 J. Mater. Chem. A
Paper Journal of Materials Chemistry A
Publ
ishe
d on
07
Janu
ary
2014
. Dow
nloa
ded
by D
TU
Lib
rary
on
10/0
2/20
14 1
3:36
:03.
View Article Online

possibility. Fig. 5 shows the LEIS spectra acquired on Pt5Ce aerelectrochemical ORR testing at different times. The spectrum ofthe sputter-cleaned surface is also reported for comparison,showing the typical energy positions of the ions backscatteredfrom Pt (EK z 680 eV) or from Ce (EK z 580 eV). The very rstscans (not shown) are dominated by the background originatingfrom adventitious O and C surface contamination accumulatedbetween the electrochemical measurements and the transfer toUHV. The progressive cleaning of the surface induced by the
Ne+ ions allows to clearly see the Pt peak aer 18 minutes. Atthis time no Ce peaks can be seen. At increasing times andhigher levels of ion sputtering on the surface, weak peaks fromCe start arising and the ratio of the peak areas progressivelyapproaches the one measured on sputter-cleaned sampleswhich is similar to the stoichiometric ratio. A plot of the esti-mated areas as a function of the sputtering time is shown inFig. S12.† These observations prove the existence of a completePt overlayer, for which bifunctional effects are unlikely.
3.4 Stability
The stability of the alloys under ORR conditions was tested byapplying 10 000 consecutive cycles from 0.6 to 1.0 V vs. RHE inan O2-saturated 0.1 M HClO4 electrolyte at 100 mV s1 and23 C. The choice of this standard accelerated stability test wasbased on the protocols of the U.S. Department Of Energy64 andof the Fuel Cell Commercialization Conference of Japan.19 CVsfrom 0.6 to 1.0 V vs. RHE in an O2-saturated 0.1 M HClO4
electrolyte at 50 mV s1 were taken before and aer thisprocedure in order to compare the ORR activity (not shown).Both for Pt5La and Pt5Ce the losses in kinetic activities areremarkably low: around 8% for Pt5La and 10% for Pt5Ce,respectively. This is a further proof of the long-term stability ofalloys of Pt with lanthanide metals, as shown recently forPt5Gd.33 Fig. 6 shows the total activity enhancement for Pt5Laand Pt5Ce, as compared to polycrystalline Pt and Pt5Gd,33 beforeand aer the stability test, measured under the same condi-tions. As can be seen, aer 10 000 potential cycles under theabove described conditions, for both catalysts the nal specicactivity is still more than 3 times higher than for pure Pt. Veryrecently, Todoroki et al. studied the stability of Pt-enriched Ni/Pt(111) catalysts. Interestingly, although their ORR activitywas 8 times higher than that of pure Pt(111), aer only
Fig. 4 Pt to lanthanide atomic ratios in Pt5La (a) and Pt5Ce (b) from AR-XPS under three different conditions: during sputter-cleaning (,), afterelectrochemical ORR testing (B) and after stability test (O). Corresponding AR-XPS depth profiles of Pt5La (c) and Pt5Ce (d), after theORR activitytest (solid line) and after the stability test (dashed line). An illustrative three-dimensional view of the Pt5Ce structure after sputter-cleaning (e) andafter ORR activity test with the formation of a Pt overlayer on top of the Pt5Ce bulk alloy (f). Grey and red spheres represent Pt and Ce atomsrespectively.
Fig. 5 LEIS spectra of Pt5Ce after ORR testing for different sputteringtimes and comparison with the sputter-cleaned reference surface.
J. Mater. Chem. A This journal is © The Royal Society of Chemistry 2014
Journal of Materials Chemistry A Paper
Publ
ishe
d on
07
Janu
ary
2014
. Dow
nloa
ded
by D
TU
Lib
rary
on
10/0
2/20
14 1
3:36
:03.
View Article Online

1000 potential cycles between 0.6 and 1.0 V they lost the 75% oftheir initial activity.65 Previous studies on state-of-the-art Pt3Cocathode catalysts for PEMFCs also show a substantial degra-dation of these catalysts under fuel-cell reaction conditions,mainly due to the dealloying of the Pt3Co particles at thecathode.15,66 The enhancement in activity and stability for bothPt5Ce and Pt5La as compared to pure Pt show that these alloysare very promising as cathode catalysts for PEMFCs. However, itshould be anticipated that the chemical synthesis of Pt–La orPt–Ce alloys in the nanoparticulate form, more suitable for theirapplication in PEMFCs, will be technologically challenging, dueto the high reactivity of lanthanide metals and the difficulties ofreducing them by chemical-electrochemical techniques.
New AR-XPS measurements were acquired aer the stabilitytest. The comparison with the spectra achieved just aer theORR measurements provides useful information regarding thechanges in the structure and composition which might occurduring cycling. The aspect of the La 3d and Ce 3d peaks is verysimilar to the one observed in Fig. 3 aer EC measurements.This indicates that no big changes in the chemical state of thesereactive metals occur, as shown in Table S2.† The Pt overlayerstill provides kinetic stability against their dissolution. Fig. 4aand b shows further changes on the catalyst composition aerstability tests. By comparing the concentration ratios aer ORRtesting and aer the stability test it is possible to notice afurther increase, indicating a slight thickening of the Pt over-layer. AR-XPS depth proles of Pt5La and Pt5Ce (Fig. 4c and d)accordingly exhibit small increments in the Pt overlayer thick-nesses. For both alloys, and in particular for Pt5La, thesechanges are very modest, demonstrating the high structuralstability of these alloys.
4. Discussion4.1 Surface stability and active chemical state
The XPS spectra of Fig. 3 have clearly demonstrated the inherentsurface instability of Pt–La and Pt–Ce alloys under air exposure.The tendency towards the surface oxidation of La and Ceprevails; this is despite the very negative heat of formation of
such compounds stabilised by the high alloying temperatures.The metallic components of the La 3d and Ce 3d still accountfor most of the XPS signal (see Table S2†) indicating that thepresence of the alloy introduces kinetic barriers against deepoxidation, while pure La or Ce would quickly form a thick oxidelayer.67,68
Our evidence clearly differs from the recent results andconclusions of Yoo et al. on Pt3La.37 They claim that La atomsare stable on the surface of Pt3La under reaction conditions.However, the peak shape and position of their La 3d peaksresemble those of the La oxide peaks shown in Fig. 3c and S11,†with absent or negligible metallic components. It turns out thatthese spectra are characteristic of compounds where La is in anoxidized state, with fn+1 satellite components almost as intenseas the main La 3d peaks.43,61,69 This consideration, as well as thefact that no explicit details about the purity of the synthesizedalloys or any surface cleaning procedures are given in theirwork37 suggest the presence of oxygen on the surface and theformation of a rather thick La oxide layer. It is also worth notingthat the XRD trace that Yoo et al. report suggests that their Pt3Laphase is a solid solution with the same crystal structure as Pt,albeit with some lattice strain.70,71 In a Pt3La solid solution,although the bulk composition may be constant, there wouldbe random substitution of Pt and La at any given atomiccoordinate. A stable solid solution typically forms in metalcompounds where there are weak interactions between thedifferent constituent atoms. However, the strong interactionbetween Pt and La would provide a signicant driving force toform an ordered intermetallic compound; in such a compoundthe number of La–La nearest neighbours would be minimisedand the number of Pt–La nearest neighbours would be maxi-mised. Notably, the phase diagrams of Pt–La intermetalliccompounds found in the literature do not report the existenceof a stable Pt3La phase.46–48 This is in agreement with our XRDmeasurements on Pt3La (Fig. S1†), composed of a mixture oftwo phases: Pt2La and Pt5La. In our view, the reason for which ameta-stable solid solution was formed under Yoo et al.'sexperimental conditions is that they prepared their compoundsby magnetron sputtering at room temperature, without anyadditional heat treatment. On this basis, the low stability of Yooet al.'s Pt3La solid solution towards air oxidation isunsurprising.
According to the XPS data (Fig. 3e and f, 4c and d and S11†),both the La oxide and metallic La are dissolved from the near-surface region under ORR conditions. Simple thermodynamicconsiderations provide an intuitive explanation for thisphenomenon. First focusing on Pt5La, the instability of theoxide layer is trivial to explain: La2O3 is thermodynamicallyunstable against dissolution to La3+ at pH 0.35 Moreover,metallic La is also unstable under these conditions. The stan-dard dissolution potential of a La atom to La3+ is2.38 V vs. thestandard hydrogen electrode (SHE).72 Accounting for the threeelectrons involved in the reaction, the resulting standard Gibbsfree energy of dissolution of a La atom would be around7.1 eVat 0 V SHE. The standard Gibbs free energy of formation(DGPt5La ¼ 3.8 eV)28 partially stabilizes the La atoms, loweringthe standard Gibbs free energy of dissolution to 3.3 eV. The
Fig. 6 Kinetic current density (per geometric surface area) measuredat 0.9 V of Pt5Gd,33 Pt5Ce, Pt5La and Pt before and after a stability testconsisting of 10 000 cycles between 0.6 and 1.0 V vs. RHE in an O2-saturated 0.1 M HClO4 electrolyte at 100 mV s1.
This journal is © The Royal Society of Chemistry 2014 J. Mater. Chem. A
Paper Journal of Materials Chemistry A
Publ
ishe
d on
07
Janu
ary
2014
. Dow
nloa
ded
by D
TU
Lib
rary
on
10/0
2/20
14 1
3:36
:03.
View Article Online

corresponding standard reduction potential is still 1.1 V vs.SHE. For Pt5Ce a similar analysis results in a standard reductionpotential of Ce3+ to Ce of 1.1 V, essentially the same as forPt5La. These values are 2.1 V lower than the potential a fuel cellcathode may reach during shut down. At that potential, there isa strong driving force of about 6.3 eV for the dissolution of Laand Ce, despite the very negative heat of alloy formation. Henceno La and Ce atoms should be present on the surface of thesecatalysts. Despite the different preparation technique describedby Yoo et al.37 for Pt3La, it is very unlikely that any kind of purePt–La phase could overcome this huge driving force towardsdissolution of the La atoms from the surface; a tendency thatseems to be independent of the bulk structure. This is evenmore unlikely in the absence of any stabilising heat treatment.
On the other hand, the Pt overlayer, formed by the dissolu-tion of the lanthanide metals from the rst few monolayers ofthe alloy, provides kinetic stability to the catalyst. The diffusionof La or Ce would be very slow through the overlayer, due to thestrong Pt–La and Pt–Ce interactions. On the other hand, Pt3Lacontinuously corrodes. We ascribe this difference to the pres-ence of multiple phases in the XRD pattern of Pt3La. Wepreviously demonstrated the inuence of stoichiometry on thestability of PtxY phases:49 Pt2Y and PtY, in particular, heavilycorroded. We anticipate a similar behaviour for the Pt2La phase.Others have made similar observations for alloys of Pt and latetransition metals, when the concentration of the less noblemetal is relatively high.73,74 The high activity and stability ofPt5La and Pt5Ce, in comparison to Pt3La, outlines the impor-tance of comprehensive physical characterization to identify themost active and stable phases.
4.2 Mechanism of activity enhancement
An approximate thickness of the Pt overlayer of around 6–7 Acan be gauged from the angle-resolved depth proles of Fig. 4cand d, on both Pt5La and Pt5Ce, respectively. This wouldcorrespond to approximately 3 Pt monolayers. Assuming thatthe overlayer thickness is uniform, ligand effects would beneglibible.75 It should be noted, however, that the XPS tech-nique averages over a large area, whose homogeneity is notcertain. Furthermore, the algorithms analysing the AR-XPS dataare rather sensitive to uncertainties on the sensitivity factors ofthe peaks used for quantication. Therefore, our data cannotprovide a more precise estimation of the Pt overlayer thickness.
The thick Pt overlayers shown in Fig. 4c and d suggest thatthe high ORR activity is due to strain effects. This notion issupported by the data shown in Fig. 7, which shows that theORR activity of Pt5La, Pt5Ce and Pt5Gd is correlated with thelattice parameter a. We recently proposed that the structure ofthe overlayer would resemble closely packed Pt, as suggested byour DFT calculations on Pt5La.3 A similar behaviour has beenexperimentally observed on single crystal Pt5Y that, in avacuum, forms a compressed Pt overlayer on top of the alloy.76
In acid electrolyte, in situ STM studies on Pt–Fe alloys have alsoshown the formation of a closely packed Pt overlayer, resem-bling Pt(111).77 For this kind of structure the Pt–Pt distance inthe overlayer would be correlated with the distance of the
closest Pt nearest neighbours in the bulk, dPt–Pt.3,33 In the case ofPt5La, Pt5Ce and Pt5Gd it turns out that dPt–Pt ¼ a/2. Conse-quently, a lower value of a suggests increased compressivestrain to the surface and higher ORR activity. We note that in athick Pt overlayer, the strain may relax somewhat, relative to thebulk.13,78 In the future, we will aim to more accurately quantifythe actual strain in the surface overlayer.
5. Conclusions
This study addresses the electrochemical properties of threeORR catalysts: Pt5La, Pt3La and Pt5Ce, the latter being reportedhere, for the rst time, as a highly active ORR catalyst. BothPt5La and Pt5Ce exhibited a more than 3-fold activity improve-ment, relative to Pt, with only minor losses aer acceleratedstability tests. This suggests that they are promising materialsfor future implementation in PEMFCs. In contrast, we foundthat the catalyst with a nominal composition of Pt3La tended tocorrode.
Despite the strong tendency towards the oxidation oflanthanide metals, AR-XPS shows that in the active phase of thecatalyst, La and Ce exist in the metallic form. This powerfultechnique also showed the formation of a 3 monolayer thickPt overlayer, which stabilizes Pt5La and Pt5Ce and prevents thefurther oxidation and dissolution in an electrochemical envi-ronment. This evidence is inconsistent with the recent reportsby Yoo et al. for Pt–La compounds, where La appears in anoxidized state and is also present on the surface of the catalyst.37
AR-XPS and LEIS experiments, as well as simple thermody-namic considerations rationalise our own results. In the pres-ence of the thick Pt overlayer reported here, only strain effectscan explain the enhanced activity of Pt5La and Pt5Ce.
Acknowledgements
For funding of this work we gratefully acknowledge the EU PF7'sinitiative Fuel Cell and Hydrogen Joint Undertaking's project
Fig. 7 Experimental ORR activity (kinetic current density pergeometric surface area at 0.9 V vs. RHE) of polycrystalline Pt5La, Pt5Ce,Pt5Gd33 versus the lattice parameter a of the alloys as determined fromXRD measurements. The dotted line is a linear fit of the points.
J. Mater. Chem. A This journal is © The Royal Society of Chemistry 2014
Journal of Materials Chemistry A Paper
Publ
ishe
d on
07
Janu
ary
2014
. Dow
nloa
ded
by D
TU
Lib
rary
on
10/0
2/20
14 1
3:36
:03.
View Article Online

CathCat (GA 303492), the Danish National Research Founda-tion's Center for Individual Nanoparticle Functionality(DNRF54) and the Danish Ministry of Science's UNIK initiativeCAtalysis for Sustainable Energy (CASE). Particular thanks toassociate professor Jens E. T. Andersen for his help in the ICPmeasurements.
References
1 U. Eberle, B. Muller and R. von Helmolt, Energy Environ. Sci.,2012, 5, 8780–8798.
2 H. A. Gasteiger, S. S. Kocha, B. Sompalli and F. T. Wagner,Appl. Catal., B, 2005, 56, 9–35.
3 I. E. L. Stephens, A. S. Bondarenko, U. Grønbjerg,J. Rossmeisl and I. Chorkendorff, Energy Environ. Sci.,2012, 5, 6744–6762.
4 R. R. Adzic, J. Zhang, K. Sasaki, M. B. Vukmirovic, M. Shao,J. X. Wang, A. U. Nilekar, M. Mavrikakis, J. A. Valerio andF. Uribe, Top. Catal., 2007, 46, 249–262.
5 J. Zhang, M. B. Vukmirovic, Y. Xu, M. Mavrikakis andR. R. Adzic, Angew. Chem., Int. Ed., 2005, 44, 2132–2135.
6 F. T. Wagner, B. Lakshmanan and M. F. Mathias, J. Phys.Chem. Lett., 2010, 1, 2204–2219.
7 V. Stamenkovic, B. S. Mun, K. J. J. Mayrhofer, P. N. Ross,N. M. Markovic, J. Rossmeisl, J. Greeley and J. K. Nørskov,Angew. Chem., 2006, 118, 2963–2967.
8 V. R. Stamenkovic, B. S. Mun, K. J. J. Mayrhofer, P. N. Rossand N. M. Markovic, J. Am. Chem. Soc., 2006, 128, 8813–8819.
9 V. R. Stamenkovic, B. Fowler, B. S. Mun, G. Wang, P. N. Ross,C. A. Lucas and N. M. Markovic, Science, 2007, 315, 493–497.
10 V. R. Stamenkovic, B. S. Mun, M. Arenz, K. J. J. Mayrhofer,C. A. Lucas, G. Wang, P. N. Ross and N. M. Markovic, Nat.Mater., 2007, 6, 241–247.
11 K. J. J. Mayrhofer, K. Hartl, V. Juhart and M. Arenz, J. Am.Chem. Soc., 2009, 131, 16348–16349.
12 L. Gan, R. Yu, J. Luo, Z. Cheng and J. Zhu, J. Phys. Chem. Lett.,2012, 3, 934–938.
13 H. L. Xin, J. A. Mundy, Z. Liu, R. Cabezas, R. Hovden,L. F. Kourkoutis, J. Zhang, N. P. Subramanian,R. Makharia, F. T. Wagner and D. A. Muller, Nano Lett.,2012, 12, 490–497.
14 M. Watanabe, K. Tsurumi, T. Mizukami, T. Nakamura andP. Stonehart, J. Electrochem. Soc., 1994, 141, 2659–2668.
15 S. Chen, H. A. Gasteiger, K. Hayakawa, T. Tada and Y. Shao-Horn, J. Electrochem. Soc., 2010, 157, A82–A97.
16 D. F. van der Vliet, C. Wang, D. Tripkovic, D. Strmcnik,X. F. Zhang, M. K. Debe, R. T. Atanasoski, N. M. Markovicand V. R. Stamenkovic, Nat. Mater., 2012, 11, 1051–1058.
17 I. E. L. Stephens, A. S. Bondarenko, F. J. Perez-Alonso,F. Calle-Vallejo, L. Bech, T. P. Johansson, A. K. Jepsen,R. Frydendal, B. P. Knudsen, J. Rossmeisl andI. Chorkendorff, J. Am. Chem. Soc., 2011, 133, 5485–5491.
18 C. Wang, M. Chi, D. Li, D. Strmcnik, D. van der Vliet,G. Wang, V. Komanicky, K.-C. Chang, A. P. Paulikas,D. Tripkovic, J. Pearson, K. L. More, N. M. Markovic andV. R. Stamenkovic, J. Am. Chem. Soc., 2011, 133, 14396–14403.
19 A. Ohma, K. Shinohara, A. Iiyama, T. Yoshida andA. Daimaru, ECS Trans., 2011, 41, 775–784.
20 J. Greeley, I. E. L. Stephens, A. S. Bondarenko, T. P. Johansson,H. A. Hansen, T. F. Jaramillo, J. Rossmeisl, I. Chorkendorffand J. K. Nørskov, Nat. Chem., 2009, 1, 552–556.
21 J. K. Nørskov, J. Rossmeisl, A. Logadottir, L. Lindqvist,J. R. Kitchin, T. Bligaard and H. Jonsson, J. Phys. Chem. B,2004, 108, 17886–17892.
22 J. Rossmeisl, G. S. Karlberg, T. Jaramillo and J. K. Nørskov,Faraday Discuss., 2009, 140, 337.
23 T. P. Johansson, E. T. Ulrikkeholm, P. Hernandez-Fernandez, P. Malacrida, H. A. Hansen, A. S. Bandarenka,J. K. Nørskov, J. Rossmeisl, I. E. L. Stephens andI. Chorkendorff, Top. Catal., 2013, 1–10.
24 R. A. Walker and J. B. Darby Jr, Acta Metall., 1970, 18, 1261–1266.
25 R. Pretorius, T. K. Marais and C. C. Theron, Mater. Sci. Rep.,1993, 10, 1–83.
26 R. Hultgren, P. D. Desai, D. T. Hawkins, M. Gleiser andK. K. Kelley, Selected Values of the Thermodynamic Propertiesof Binary Alloys, 1973.
27 H. Kleykamp, J. Nucl. Mater., 1993, 201, 193–217.28 K. T. Jacob and Y. Waseda, Thermochim. Acta, 1990, 165, 223–
233.29 K. T. Jacob and Y. Waseda, Bull. Mater. Sci., 1990, 13, 235–
244.30 G. H. Johannesson, T. Bligaard, A. V. Ruban, H. L. Skriver,
K. W. Jacobsen and J. K. Nørskov, Phys. Rev. Lett., 2002, 88,255506.
31 T. Bligaard, G. H. Johannesson, A. V. Ruban, H. L. Skriver,K. W. Jacobsen and J. K. Nørskov, Appl. Phys. Lett., 2003,83, 4527–4529.
32 J. Nørskov, J. Greeley, I. Stephens, A. S. Bondarenko,T. Johansson, H. A. Hansen, T. Jaramillo, J. Rossmeisl andI. Chorkendorff, Platinum and Palladium Alloys Suitable asFuel Cell Electrodes, U.S. Patent No. 20,120,214,083, 2012.
33 M. Escudero-Escribano, A. Verdaguer-Casadevall,P. Malacrida, U. Grønbjerg, B. P. Knudsen, A. K. Jepsen,J. Rossmeisl, I. E. L. Stephens and I. Chorkendorff, J. Am.Chem. Soc., 2012, 134, 16476–16479.
34 P. C. K. Vesborg and T. F. Jaramillo, RSC Adv., 2012, 2, 7933–7947.
35 M. Pourbaix, Atlas of electrochemical equilibria in aqueoussolutions, Nat'L Assoc. Of Corrosion, [S.l.], 1974.
36 S. J. Yoo, K.-S. Lee, S. J. Hwang, Y.-H. Cho, S.-K. Kim,J. W. Yun, Y.-E. Sung and T.-H. Lim, Int. J. HydrogenEnergy, 2012, 37, 9758–9765.
37 S. J. Yoo, S. J. Hwang, J.-G. Lee, S.-C. Lee, T.-H. Lim,Y.-E. Sung, A. Wieckowski and S.-K. Kim, Energy Environ.Sci., 2012, 5, 7521–7525.
38 S. J. Hwang, S.-K. Kim, J.-G. Lee, S.-C. Lee, J. H. Jang, P. Kim,T.-H. Lim, Y.-E. Sung and S. J. Yoo, J. Am. Chem. Soc., 2012,134, 19508–19511.
39 A. S. Bandarenka, A. S. Varela, M. Karamad, F. Calle-Vallejo,L. Bech, F. J. Perez-Alonso, J. Rossmeisl, I. E. L. Stephens andI. Chorkendorff, Angew. Chem., Int. Ed., 2012, 51, 11845–11848.
This journal is © The Royal Society of Chemistry 2014 J. Mater. Chem. A
Paper Journal of Materials Chemistry A
Publ
ishe
d on
07
Janu
ary
2014
. Dow
nloa
ded
by D
TU
Lib
rary
on
10/0
2/20
14 1
3:36
:03.
View Article Online

40 M. Teliska, V. S. Murthi, S. Mukerjee and D. E. Ramaker, J.Electrochem. Soc., 2005, 152, A2159–A2169.
41 P. B. Balbuena, D. Altomare, N. Vadlamani, S. Bingi,L. A. Agapito and J. M. Seminario, J. Phys. Chem. A, 2004,108, 6378–6384.
42 Y. Xu, A. V. Ruban and M. Mavrikakis, J. Am. Chem. Soc.,2004, 126, 4717–4725.
43 A. M. de Asha and R. M. Nix, Surf. Sci., 1995, 322, 41–50.44 M. Juel, S. Martinsen and S. Raaen, Thin Solid Films, 2008,
517, 805–810.45 W. Bronger, J. Less-Common Met., 1967, 12, 63–68.46 T. B. Massalski, J. L. Murray, L. H. Bennett and H. Baker,
Binary alloy phase diagrams, American Society for Metals, 1986.47 S. Reimann and H.-J. Schaller, J. Alloys Compd., 2006, 419,
133–139.48 H. Okamoto, J. Phase Equilib. Diffus., 2008, 29, 122.49 I. E. L. Stephens, A. S. Bondarenko, L. Bech and
I. Chorkendorff, ChemCatChem, 2012, 4, 341–349.50 D. F. van der Vliet, C. Wang, D. Li, A. P. Paulikas, J. Greeley,
R. B. Rankin, D. Strmcnik, D. Tripkovic, N. M. Markovic andV. R. Stamenkovic, Angew. Chem., 2012, 124, 3193–3196.
51 K. J. J. Mayrhofer, D. Strmcnik, B. B. Blizanac,V. Stamenkovic, M. Arenz and N. M. Markovic, Electrochim.Acta, 2008, 53, 3181–3188.
52 M. Nesselberger, S. Ashton, J. C. Meier, I. Katsounaros,K. J. J. Mayrhofer and M. Arenz, J. Am. Chem. Soc., 2011,133, 17428–17433.
53 U. A. Paulus, A. Wokaun, G. G. Scherer, T. J. Schmidt,V. Stamenkovic, N. M. Markovic and P. N. Ross,Electrochim. Acta, 2002, 47, 3787–3798.
54 J. C. Fuggle, M. Campagna, Z. Zolnierek, R. Lasser andA. Platau, Phys. Rev. Lett., 1980, 45, 1597–1600.
55 J. W. Allen, S. J. Oh, O. Gunnarsson, K. Schonhammer,M. B. Maple, M. S. Torikachvili and I. Lindau, Adv. Phys.,1986, 35, 275–316.
56 F. Zhang, P. Wang, J. Koberstein, S. Khalid and S.-W. Chan,Surf. Sci., 2004, 563, 74–82.
57 J. C. Fuggle, J. Less-Common Met., 1983, 93, 159–169.58 L. Schlapbach, Solid State Commun., 1981, 38, 117–123.59 J. C. Fuggle, F. U. Hillebrecht, Z. Zołnierek, R. Lasser,
C. Freiburg, O. Gunnarsson and K. Schonhammer, Phys.Rev. B: Condens. Matter Mater. Phys., 1983, 27, 7330–7341.
60 F. U. Hillebrecht and J. C. Fuggle, Phys. Rev. B: Condens.Matter Mater. Phys., 1982, 25, 3550–3556.
61 W.-D. Schneider, B. Delley, E. Wuilloud, J.-M. Imer andY. Baer, Phys. Rev. B: Condens. Matter Mater. Phys., 1985,32, 6819–6831.
62 A. Pfau and K. D. Schierbaum, Surf. Sci., 1994, 321, 71–80.63 S. Tanuma, C. J. Powell and D. R. Penn, Surf. Interface Anal.,
1991, 17, 911–926.64 The US Department of Energy (DOE), Energy Efficiency
and Renewable Energy http://www.eere.energy.gov/hydrogenandfuelcells/mypp/pdfs/fuel_cells.pdf and the USDRIVE Fuel Cell Technical Team Technology Roadmap http://www.uscar.org/guest/teams/17/Fuel-Cell-Tech-Team, 2013.
65 N. Todoroki, Y. Iijima, R. Takahashi, Y. Asakimori andT. Wadayama, J. Electrochem. Soc., 2013, 160, F591–F596.
66 F. Maillard, L. Dubau, J. Durst, M. Chatenet, J. Andre andE. Rossinot, Electrochem. Commun., 2010, 12, 1161–1164.
67 G. Praline, B. E. Koel, R. L. Hance, H.-I. Lee and J. M. White,J. Electron Spectrosc. Relat. Phenom., 1980, 21, 17–30.
68 T. L. Barr, J. Phys. Chem., 1978, 82, 1801–1810.69 D. D. Sarma, M. S. Hegde and C. N. R. Rao, J. Chem. Soc.,
Faraday Trans. 2, 1981, 77, 1509–1520.70 B. C. Beard and P. N. Ross, J. Electrochem. Soc., 1990, 137,
3368–3374.71 H. Abe, F. Matsumoto, L. R. Alden, S. C. Warren,
H. D. Abruna and F. J. DiSalvo, J. Am. Chem. Soc., 2008,130, 5452–5458.
72 CRC Handbook of Chemistry and Physics, ed. W. M. Haynes,CRC Press, 93rd edn, 2012.
73 A. Bonakdarpour, J. Wenzel, D. A. Stevens, S. Sheng,T. L. Monchesky, R. Lobel, R. T. Atanasoski,A. K. Schmoeckel, G. D. Vernstrom, M. K. Debe andJ. R. Dahn, J. Electrochem. Soc., 2005, 152, A61–A72.
74 C. Wang, M. Chi, G. Wang, D. van der Vliet, D. Li, K. More,H.-H. Wang, J. A. Schlueter, N. M. Markovic andV. R. Stamenkovic, Adv. Funct. Mater., 2011, 21, 147–152.
75 J. R. Kitchin, J. K. Nørskov, M. A. Barteau and J. G. Chen,J. Chem. Phys., 2004, 120, 10240–10246.
76 T. P. Johansson, New Materials for Oxygen ReductionElectrodes, PhD thesis, Department of Physics, TechnicalUniversity of Denmark, 2012.
77 L.-J. Wan, T. Moriyama, M. Ito, H. Uchida and M. Watanabe,Chem. Commun., 2002, 58–59.
78 P. Strasser, S. Koh, T. Anniyev, J. Greeley, K. More, C. Yu,Z. Liu, S. Kaya, D. Nordlund, H. Ogasawara, M. F. Toneyand A. Nilsson, Nat. Chem., 2010, 2, 454–460.
J. Mater. Chem. A This journal is © The Royal Society of Chemistry 2014
Journal of Materials Chemistry A Paper
Publ
ishe
d on
07
Janu
ary
2014
. Dow
nloa
ded
by D
TU
Lib
rary
on
10/0
2/20
14 1
3:36
:03.
View Article Online


This journal is© the Owner Societies 2014 Phys. Chem. Chem. Phys.
Cite this:DOI: 10.1039/c4cp00319e
Towards the elucidation of the high oxygenelectroreduction activity of PtxY: surface scienceand electrochemical studies of Y/Pt(111)
T. P. Johansson, E. T. Ulrikkeholm, P. Hernandez-Fernandez,M. Escudero-Escribano, P. Malacrida, I. E. L. Stephens* and I. Chorkendorff*
We have prepared an yttrium modified Pt(111) single crystal under ultra-high vacuum conditions,
simulating a bulk alloy. A Pt overlayer is formed upon annealing the crystal above 800 K. The annealed
structure binds CO weaker than Pt(111), with a pronounced peak at 295 K in the temperature
programmed desorption of CO. When depositing a large amount of yttrium at 1173 K, a (1.88 1.88)R301
structure relative to Pt(111) was observed by low energy electron diffraction. Such an electron diffraction
pattern could correspond to a (2 2)R301 structure under 6% compressive strain. This structure is in
agreement with the structure of the vacancies in a Pt Kagome layer in Pt5Y rotated 301 with respect to the
bulk of the Pt(111). The Pt overlayer is relatively stable in air; however, after performing oxygen reduction
activity measurements in an electrochemical cell, a thick Pt overlayer was measured by the angle resolved
X-ray photoelectron spectroscopy depth profile. The activity of the annealed Y/Pt(111) for the oxygen
reduction reaction was similar to that of polycrystalline Pt3Y.
Introduction
Global energy demand is continuously increasing.1 With limitedoil and gas supplies it is desirable to establish an energyeconomy based on renewable energy.2 For energy storage muchfocus has lately been on storing energy in the form of fuels. Thiscould e.g. be in the form of alcohols produced from reduction ofCO2,3,4 ammonia from the reduction of nitrogen5 or hydrogenfrom the electrolysis of water.6 Much attention has recently beenput on hydrogen.7 One of the most promising technologies forutilising the energy stored in hydrogen is the low temperaturepolymer electrolyte membrane fuel cell (PEMFC). The commer-cialization of such devices is still hampered by their high cost,which is in part due to the expensive catalysts. In a PEMFC,catalysts are needed for both the hydrogen oxidation (HOR) andthe oxygen reduction reactions (ORR). Expensive Pt-based cata-lysts are typically used for both reactions. However, due to theslow kinetics of oxygen reduction almost ten times more Pt isrequired on the cathode compared to the anode of the PEMFC.8
In order for PEMFCs to become viable, improvements in thecatalytic activity of the ORR catalyst are still needed.9–17
The conditions at the cathode in a PEMFC are extremelycorrosive and, therefore, stability issues limit the choice of
catalyst materials. The ORR is a complex reaction involving thetransfer of 4 protons and 4 electrons.18 Although pure Ptnanoparticles are typically used for the ORR, the most activecatalysts are those formed by a Pt overlayer on Pt bimetallicalloys.10,19 The oxygen reduction activity of Pt alloys has beenstudied extensively both on model catalysts (e.g. bulk poly-crystalline and single crystal surfaces) and on the industriallymore relevant nanoparticles, nanostructured thin films and nano-particle networks.14,20–24 The increased ORR activity measuredon some Pt alloy catalysts is caused by the alloy modifying thePt overlayer in such a way that ORR intermediates are boundslightly weaker than on pure Pt. The optimal ORR catalystshould bind the ORR intermediates HO* and HOO* B0.1 eVweaker than pure Pt.10,25–27 This decrease in binding energy ofORR intermediates can be influenced by two effects, straineffects and ligand effects.26,28–32 Strain effects are related to thelateral strain of the Pt overlayer, e.g. originating from the Ptoverlayer being supported on a material with a different latticeparameter. The binding energy of the intermediates on the Ptoverlayer is decreased for compressive strain and increased fortensile strain. The ligand effect is related to the modification ofthe electronic structure of the Pt surface atoms by subsurfaceatoms of different atomic numbers. Solute atoms must bepresent in close proximity of the Pt surface atoms in order forthe ligand effect to be noticed.10
The surface of Pt3M (M = Ni, Co, Fe, Ti, V) alloys will, underORR reaction conditions, be terminated by a Pt overlayer.21
Center for Individual Nanoparticle Functionality, Department of Physics,
Technical University of Denmark, Building 312, DK-2800 Lyngby, Denmark.
E-mail: [email protected], [email protected]
Received 21st January 2014,Accepted 3rd April 2014
DOI: 10.1039/c4cp00319e
www.rsc.org/pccp
PCCP
PAPER
Publ
ishe
d on
11
Apr
il 20
14. D
ownl
oade
d by
DT
U L
ibra
ry o
n 11
/04/
2014
16:
02:2
4.
View Article OnlineView Journal

Phys. Chem. Chem. Phys. This journal is© the Owner Societies 2014
When the overlayer is produced by acid leaching the so-calledPt skeleton structure is produced.21 The skeleton surface onPt3M (M = Ni, Co, Fe, Ti, V) alloys is not very well defined, but isreported to consist of 100% Pt in the first layer and a minimum of75% Pt in the consecutive layers.21 Markovic and coworkers20,21,33
found that when annealing bulk Pt3M (M = Ni, Co, Fe) alloysunder ultra-high vacuum (UHV) conditions, platinum atoms fromthe second layer exchange place with the solute atoms in thesurface layer. This leads to a structure with 100% platinum in thefirst layer, 50% platinum in the second layer and (roughly) 75%platinum in the following layers. Such a structure is denoted as aPt skin structure.21
The above mentioned alloys are not particularly stableduring oxygen reduction14–16 and we therefore made an inves-tigation to find alloys which have a high heat of formation foralloying while at the same time potentially being active for theORR. In this manner we recently reported Pt3Y and Pt3Sc aspromising ORR catalyst materials, based on measurementsperformed on acid leached polycrystalline bulk alloys.27 ThePt overlayer was formed by acid leaching and found to besimilar to the Pt skeleton surfaces reported by Markovic andcoworkers.21,27,34 Notably, on Pt3Y it was much thicker than weoriginally anticipated, suggesting that the origin of the activitywas somewhat different to our original expectations.
In a recent paper we investigated the possible Pt skinformation on a bulk polycrystalline alloy of Pt3Sc when annealingit under UHV.35 An overlayer was demonstrated to be formed, butafter testing the ORR activity in an acid electrolyte, a 1–2 monolayerPt overlayer developed. For both polycrystalline Pt3Y and poly-crystalline Pt5Y no overlayer formation was observed whenannealing under UHV conditions.36
In the literature, deposition of some rare earth metals underUHV on Pt(111) has been studied, namely La, Ce and Tm.37–43
Tang et al.,37 Baddeley et al.38 and Essen et al.43 all studied thegrowth of thin Ce films on Pt(111) and found that after heattreatment to 770 K, ordered Ce–Pt compounds were formed.Depending on the initial Ce coverage, the following structures,with respect to Pt(111), were observed: (1.96 1.96), (1.94 1.94)with small satellites around the main spots and (1.96 1.96)R301.The satellites had a real space periodicity of 10.2 compared toPt(111). All of these structures were found to be based on thegrowth of crystalline Pt5Ce, which is a hexagonal layer structureconsisting of alternating layers of Pt2Ce and the so calledKagome nets of Pt atoms. The Kagome net is formed fromcorner sharing hexagons of close-packed Pt atoms with amissing atom in the center of each set of six Pt atoms.38,43
Raaen and coworkers measured the desorption temperature ofCO for both Ce, La and Tm on Pt(111).39–42 For all these threesystems a downshift on the order of 120 K in desorptiontemperature of CO was observed, in comparison to Pt(111).
In this paper we use a similar approach to the abovementioned for preparing a Pt overlayer on a Pt–Y sample. Westudy the structure, reactivity and ORR activity of Y depositedon a Pt(111) single crystal. By investigating a single crystal alloysurface, with a well-defined structure and composition, we gainfundamental insight into the reactivity of PtxY.20,26,44–48
ExperimentalUHV setup
The main part of the experiments in this paper was performedin a UHV chamber with a base pressure of 1 1010 mbar, asdescribed earlier.35,49 The sample, a Pt(111) single crystal 5 mmin diameter and 3 mm thick, was supplied by MaTecK, GmbH,Germany. The sample is held by a ‘‘U shaped’’ 0.38 mmtungsten wire and the temperature is measured using a type Kthermocouple which is placed in a hole of the crystal (parallelto the crystal surface). The sample is heated by applying a DCvoltage over the tungsten wire and cooled by either pressurisedair or liquid nitrogen.
For evaporation of yttrium a thermal yttrium evaporator wasconstructed and mounted on the chamber. The yttrium evaporatorwas made by cutting yttrium flakes from a 0.15 mm 99.9% yttriumfoil (supplied by Goodfellow) and attaching them to a coil shaped0.25 mm 99.95% tungsten wire. By applying a voltage on thetungsten wire it was possible to thermally evaporate yttrium.A quartz crystal microbalance (QCM) is mounted in the chamber,enabling deposition rates to be monitored before and afterdeposition on the sample. The QCM is positioned in the line ofsight of the Y evaporator.36
The chamber is equipped with different surface sciencetechniques to investigate the properties of the sample surface.Ion scattering spectroscopy (ISS) is performed using He+ ions,and an acceleration voltage of 1.2 kV. X-ray photoelectronspectroscopy (XPS) utilizes the Al Ka anode (1486.7 eV) of adual anode X-ray gun. A quadrupole mass spectrometer is usedfor temperature programmed desorption (TPD) measurementsof CO. Saturating the sample is done by dosing 100 LangmuirCO and the heat ramp used is 2 K s1. The ordering of thesurface region can be investigated using low energy electrondiffraction (LEED). A high pressure cell (HPC) is attached to themain chamber, enabling high pressure dosing of gases.
Depth profile measurements are performed in a separate UHVchamber by angle resolved X-ray photoelectron spectroscopy(ARXPS). The ARXPS setup is described elsewhere.34,35
Electrochemical setup
The electrochemical experiments were performed using a Bio-Logic Instruments’ VMP2 potentiostat, controlled by a computer.A standard three-compartment glass cell equipped with anexternal jacket attached to a water bath with temperaturecontrol was used for the experiments. All glassware was cleanedin 96% H2SO4 and 30% H2O2 (3 : 1 v/v). This was subsequentlyrinsed several times in hot Millipore water (358 K, 418.2 MO cm1,TOC o 5 ppb). The electrolyte, 0.1 M HClO4 (Merck, Suprapur),was prepared using Millipore water. The counter electrode wasa platinum wire and the reference electrode was a Hg/Hg2SO4
electrode separated from the working electrode compartmentusing a ceramic frit. The measurements were conducted at333 1 K. All potentials in the manuscript are quoted withrespect to the RHE and corrected for Ohmic losses. Followingeach measurement, 0 V vs. RHE was established by carrying outthe hydrogen oxidation and hydrogen evolution reaction in the
Paper PCCP
Publ
ishe
d on
11
Apr
il 20
14. D
ownl
oade
d by
DT
U L
ibra
ry o
n 11
/04/
2014
16:
02:2
4.
View Article Online

This journal is© the Owner Societies 2014 Phys. Chem. Chem. Phys.
same electrolyte. The Ohmic resistance was evaluated by per-forming an impedance spectrum with a peak-to-peak amplitudeof 10 mV, at frequencies from 1 kHz to 500 kHz; its value wastypically ca. 20 O.
The annealed Y/Pt(111) catalysts prepared under UHV con-ditions were inserted into the arbor of a rotating ring diskelectrode (RRDE) and were immersed into the electrochemicalcell under potential control at 0.05 V in a N2 (N5, Air Products)saturated 0.1 M HClO4 electrolyte. The potential was thenconstantly cycled between 0.05 V and 1.0 V at 50 mV s1 and20 mV s1 until a stable cyclic voltammogram was recorded.Afterwards, the ORR activity was measured by cycling the potentialbetween 0 V and 1 V at 50 and 20 mV s1 and 1600 rpm in an O2
(N55, AGA) saturated electrolyte. The kinetic current density forthe oxygen reduction, jk, has been calculated using the followingequation, 1/ j = 1/ jk + 1/ jd, where j is the measured current densityand jd is the diffusion limited current density.
Results
We first investigated whether it is at all possible to make a Ptoverlayer on a Pt–Y alloy by deposition of Y on Pt(111). 3 Å ofyttrium is deposited on the Pt(111) crystal and the surfacesegregation is studied as a function of temperature.
The Pt(111) crystal was sputter cleaned, annealed and thenkept at 317 K while evaporating 3 Å of Y on to the crystal. Fig. 1shows the ISS spectrum before and after Y evaporation. Bothan Y and a Pt peak are observed in the ISS spectrum after Ydeposition. Table 1 shows the concentrations obtained fromXPS. The near surface region mainly consists of Pt and Y, whilesmall amounts of C and O were also observed.
In order to establish at what temperature we can achieveinter-diffusion the sample was then heated under UHV at a rateof 2 K s1 in steps of 50 K, and ISS spectra were acquired foreach 50 K. Fig. 2 depicts the Y to ‘‘Pt + Y’’ ratio as a function ofthe temperature. Evidently, the Y to ‘‘Pt + Y’’ ratio exhibits arapid decrease, corresponding to the formation of a Pt over-layer, at a temperature of around 800 K. The sample wasannealed to a maximum temperature of 1173 K and then cooleddown to 673 K, where detailed XPS spectra were obtained. Thenear surface concentration as measured by XPS is given inTable 1.
We have now established that a Pt overlayer is formed uponannealing Y/Pt(111) above 800 K. However, in order to simulatea bulk PtxY alloy, we will prepare a much thicker alloy layer.
The Pt(111) sample was cleaned by argon sputtering andannealed to 1273 K. The temperature of the sample was thenkept at 1173 K while 90 10 Å (measured on the QCM) of Y wasdeposited on top of the sample. Evaporating at this elevatedtemperature ensures that the Y immediately goes to the sub-surface and is protected from oxidation by the Pt overlayer.Fig. 3 shows the ISS spectrum before (blue line) and after (red line)Y evaporation. Only Pt was observed in both spectra.
Table 2 shows the relative concentrations obtained by XPSafter Y evaporation. A Pt : Y ratio of 4.8 was found, proving thatY is present in the near surface region. Furthermore, therelative concentration of C and O was at the limit of detection.Therefore, the deposition at a higher temperature hinders theformation of yttrium oxide. Combining the results from ISS andXPS gives that the sample consists of a Pt overlayer on topof some Pt–Y system. Assuming the structure to be a singlemonolayer of Pt on top of a PtxY alloy, x was calculated tobe 3.7.36,50
Images of the LEED patterns obtained before (left image)and after (right image) Y deposition and annealing are shownin Fig. 4. The LEED pattern after deposition at 1173 K consists
Fig. 1 ISS spectrum of Pt(111) before (blue) and after (red) deposition of Y.According to the QCM measurements, around 3 Å of Y was deposited.
Table 1 Relative concentration of the different elements as obtained byXPS for the 3 Å Y/Pt(111) crystal
Pt Y C O
After Y dep. 81 11 4 4After Y dep. and annealing 92 6 1 1
Fig. 2 Y to ‘‘Pt + Y’’ ratio in the surface as a function of temperature. Theratio is obtained by integrating the Pt and Y peaks in ISS for every 50 Kusing a linear background. No sensitivity factors are used and the ratioshould therefore only be considered qualitatively. The ratio decreasessignificantly at 800 K corresponding to the formation of a Pt overlayer.
PCCP Paper
Publ
ishe
d on
11
Apr
il 20
14. D
ownl
oade
d by
DT
U L
ibra
ry o
n 11
/04/
2014
16:
02:2
4.
View Article Online

Phys. Chem. Chem. Phys. This journal is© the Owner Societies 2014
of a large hexagon together with a smaller one. Some of theLEED images displayed weak superspots, too low in intensity toenable the analysis of them. The ratio B1/C was measured to be1.72 0.02, which is close to O3, and the angle between B1 andC was 301. Combining vectors B1 and B2 therefore gives vector C,meaning that the larger hexagon can be constructed from thesmaller hexagon. The ratio A/B1 was 1.88 0.02 and the anglebetween A and B1 was 301. Therefore, the annealed Y/Pt(111)showed a (1.88 1.88)R301 structure relative to pure Pt(111). Sucha structure could correspond to a (2 2)R301 structure where thelattice is under 6% compressive strain, or a (O3 O3)R301structure where the lattice is under 9% tensile strain. Thesepossibilities will be considered further in the Discussion section.
100 Langmuir CO was now dosed in order to saturate thesurface of the annealed Y/Pt(111). The blue line in Fig. 5 shows
the CO TPD spectrum of the sample. It is observed that the COis bound weaker than for Pt(111), with a pronounced sharppeak at around 295 K and a smaller peak at around 275 K. Thered line corresponds to the second (repeated) CO TPD of the samesample which was made in order to check the reproducibility. Thefirst and the second TPDs are almost identical.
After the CO TPD experiments, XPS measurements wereagain carried out, showing the same relative concentrationsof Pt, Y, C and O as before, indicating that the surface wasstable to the CO TPD.
Since the samples will later be exposed to air it is interestingto evaluate their performance in an oxygen atmosphere. Thiswas tested by dosing 200 mbar O2 in the HPC for 10 min at300 K. After oxygen exposure, XPS showed 11% of oxygen on thesurface; however, the yttrium 3d peak did not show any oxidefeature. A TPD was consequently performed to test if the oxygenwould preferably desorb or form yttrium oxide. The temperaturewas ramped linearly at 2 K s1 from 304 K to 1173 K. Hardly anyoxygen was observed in the TPD, which could indicate theformation of yttrium oxide during the temperature ramp. XPSmeasurements (not shown here) were performed at 1173 K afterthe CO TPD and showed 5% oxygen. Furthermore, the yttrium3d region displayed some oxidised feature indicating that yttriumoxide was formed. A CO TPD was also performed and it showedroughly the same features as before oxygen exposure; however,the area under the TPD was 35% smaller. Thus the exposure toair did not cause any oxidation of the yttrium unless it is heatedto high temperatures.
The sample was then slightly sputtered in order to removethe formed yttrium oxide, and then annealed to 1348 K. Thehigher annealing temperature was used in order to obtain ahigher degree of ordering on the surface and possibly intensifythe weak superspots in the LEED pattern. Fig. 6 shows theLEED image after annealing to 1348 K. The higher annealingtemperature enlightened two sets of hexagonal superspots, corre-sponding to long range ordered structures. The distances B and C,
Fig. 3 ISS spectrum before (blue) and after (red) Y deposition. Only Pt isobserved, indicating the formation of a Pt skin. Fig. 5 CO TPD of the Y/Pt(111) sample annealed at 1173 K. The first TPD
(blue) and second TPD (red) are compared to the annealed Pt(111) (black).Areas: 1st TPD compared to Pt(111): 0.63, 2nd TPD compared to Pt(111): 0.62.
Table 2 Relative concentration of the different elements as obtained byXPS for the 90 Å Y/Pt(111) annealed at 1173 K and 1348 K. Pt/PtxY refers to aPt overlayer on top of PtxY
Annealed at 1173 K Annealed at 1348 K
Pt 81% 87%Y 17% 12%C 1% 0%O 1% 1%Pt : Y ratio 4.8 7.3X assuming Pt/PtxY 3.7 5.7
Fig. 4 Images of the LEED patterns of Pt(111) (left, T = 316 K) and ofY/Pt(111) annealed to 1173 K (right, T = 373 K).
Paper PCCP
Publ
ishe
d on
11
Apr
il 20
14. D
ownl
oade
d by
DT
U L
ibra
ry o
n 11
/04/
2014
16:
02:2
4.
View Article Online

This journal is© the Owner Societies 2014 Phys. Chem. Chem. Phys.
indicated in the LEED pattern, were measured to be the same asin Fig. 4. The ratios A/D and A/E in the two superspot patternswere 10.4 0.5 and 6.4 0.3, respectively. The angle betweenA and D was 01 and the angle between A and E was 301.Therefore, the superspots correspond to (6.4 6.4)R301 and(10.4 10.4) structures, referring to the original Pt(111) spots. Since6.4O3 E 11.1, combining vectors from the smaller superspotsroughly gives the larger superspots, meaning that the E hexagoncould be interpreted as a higher order diffraction of D.
The blue line in Fig. 7 shows the CO TPD of the sample afterannealing to 1348 K. The TPD displayed the same features asthe one annealed to 1173 K; however, the very distinct peak at295 K was lower in intensity and possessed a bit broadershoulder to the right of it. The CO TPD was repeated two timesand showed very good reproducibility.
Table 2 lists the concentrations of Pt, Y, C and O obtained byXPS after annealing to 1348 K. The higher annealing temperaturecaused an increase in the Pt : Y ratio. Assuming a Pt overlayer on aPtxY structure gives x = 5.7.
Afterwards, the sample was taken out of the chamber tomeasure its oxygen reduction activity. Angle resolved X-ray photo-electron spectroscopy (ARXPS) experiments were carried out ex situ
in order to produce non-destructive depth profiles of the crystaland follow any changes in the surface composition (the sameprocedure as we previously used for different Pt alloys26,34,35,51,52).
Fig. 8 displays the ARXPS depth profile before electro-chemical measurements. Apart from the formation of a smallamount of Y oxide on the surface, the presence of a Pt overlayeron top of a Pt5Y bulk alloy can be observed. This ratio of Pt : Ywas chosen on the basis of the XPS measurements shown inTable 2, together with the fact that Pt5Y is the stable Pt–Y phasewith the highest Pt content.53
Afterwards, the oxygen reduction activity was measured.Fig. 9 shows the measured activity on a Tafel plot. The activityof the annealed Y/Pt(111) sample is significantly higher thanpolycrystalline platinum and close to that of the clean sputteredPt3Y. Fig. 8 also shows the ARXPS depth profile after ORRactivity measurements. The platinum overlayer has substantiallygrown in thickness. This evidence, together with the disappearanceof any Y oxide phase, suggests that yttrium leached out from thesurface layers. Therefore, the Pt skin structure prepared under UHVresults in a Pt skeleton structure upon ORR activity measurementsin an acid electrolyte. This also means that the surface studied
Fig. 6 Images of the LEED patterns of Pt(111) (left, T = 316 K) and ofY/Pt(111) annealed to 1348 K (right, T = 312 K). The increased annealingtemperature causes superspots, indicated on the inset zoom by D and E,to appear.
Fig. 7 CO TPD of the Y/Pt(111) after annealing to 1348 K (red) comparedto the sample annealed to 1173 K (blue) and to pure Pt(111) (black).
Fig. 8 ARXPS depth profile of the 1348 K UHV annealed Y/Pt(111) before(dashed lines) and after (solid lines) ORR activity measurements. The C andO traces have been omitted for clarity.
Fig. 9 Tafel plot of the 1348 K UHV annealed Y/Pt(111) sample comparedwith the sputter cleaned polycrystalline samples of Pt3Y, Pt5Y and Pt. Measure-ments were carried out in O2-saturated 0.1 M HClO4 at 1600 RPM, T = 333 Kand at a scan rate of 50 mV s1. The current was corrected for mass transportlimitations, and normalised according to the geometric surface area.
PCCP Paper
Publ
ishe
d on
11
Apr
il 20
14. D
ownl
oade
d by
DT
U L
ibra
ry o
n 11
/04/
2014
16:
02:2
4.
View Article Online

Phys. Chem. Chem. Phys. This journal is© the Owner Societies 2014
under UHV conditions is different from the one relevant for theelectrochemical experiments. In order to directly correlatemeasurements done under UHV with electrochemical experi-ments it would be necessary to have a surface which is stableunder reaction conditions.20,26,54
Discussion
The ISS data showed that the annealed Y/Pt(111) only has Ptatoms in the surface layer. XPS indicated that Y is present in thenear surface region and, if the near surface region is assumed tobe composed of a Pt overlayer covering a PtxY bulk alloy, x wouldbe roughly 46 depending on the annealing temperature.
Fig. 5 shows the CO TPD for the annealed Y/Pt(111) comparedto Pt(111). The desorption temperature was clearly shifted downon the annealed Y/Pt(111) compared to Pt(111). The CO TPD ofthe annealed Y/Pt(111) consisted of a pronounced peak ataround 295 K and a smaller peak at around 275 K. The originof the sharp peak at around 295 K could be due to strong CO–COinteractions on an ordered CO layer on the surface.55 At around295 K some of the CO from this ordered structure desorbs, whichcauses the ordered CO structure to collapse and immediatelydesorb from the surface.
Since XPS and ISS data indicated the presence of an over-layer consisting of pure Pt on top of a PtxY alloy, the decrease inCO desorption temperature can be either related to ligand orstrain effects.
In our recent article about UHV annealed polycrystallinePt3Sc, the change in desorption temperature of CO was corre-lated with a change in binding energy of the ORR intermediates,O*, HO* and HOO*.35 The optimal ORR catalyst should bindHO* B0.1 eV weaker than pure Pt, which would correspond to adecrease in CO desorption temperature of B85 K.56 For theannealed Y/Pt(111) sample, the onset of the CO desorption wasshifted down B100 K compared to Pt(111). The sharp desorptionfeature at B295 K is also B100 K lower than the center of thepeak for Pt(111). This places the expected ORR activity for theannealed Y/Pt(111) close to optimal.
The LEED pattern from Fig. 4 indicates that the annealedY/Pt(111) has a (1.88 1.88)R301 structure relative to Pt(111),which corresponds to a strained surface. The structure couldcorrespond to a (2 2)R301 structure where the lattice is under6% compressive strain, or a (O3 O3)R301 structure where thelattice is under 9% tensile strain.
Presumably a surface under 6% strain would be more stablethan a surface under 9% strain. Furthermore, a surface undertensile strain would increase the binding of intermediates.The weaker binding of CO in the TPD of Fig. 5 is consistentwith a surface under compressive, rather than tensile strain.Consequently, it appears that the structure under compressivestrain is more likely.
The observed LEED pattern and CO TPD for annealedY/Pt(111) bare many similarities to those reported in the literaturefor the deposition of rare earth metals on Pt(111).37–43 Thesuperspots on Fig. 6 correspond to a long range ordering on
the crystal. The appearance of the superspots could be inducedby the higher annealing temperature leading to a more orderedsurface. However, since the sample was also slightly sputteredbetween experiments, the superspots could also originate fromthe border between the bulk Pt(111) and the Pt–Y alloy layer.Tang et al. observed similar superspots and attributed thissuperstructure to the lattice mismatch between the alloy andthe Pt(111) substrate.37
Considering all of the experiments performed on the annealedY/Pt(111) under UHV, the most probable structure seems to be aPt overlayer on top of a Pt5Y alloy. X-ray diffraction measurementsperformed by Stephens et al.34 on a bulk polycrystalline Pt5Ysample show that the bulk structure is not a closely packedstructure. The Pt5Y alloy consists of alternating layers of Pt2Y andKagome nets of Pt atoms, similar to the structure reported forPt5Ce.38,43 However, the structure of the annealed Y/Pt(111) afterelectrochemical testing is different.
The ARXPS depth profile in Fig. 8 shows that the thicknessof the Pt overlayer changed from a few angstroms to around15 angstroms after electrochemistry. Due to both uncertaintiesin the sensitivity factor for Y and general uncertainty in theARXPS measurements, the absolute value for the thickness ofthe Pt overlayer is indicative. However, the ARXPS clearlyshowed a dramatic change in the overlayer thickness by a factorof around 5. The Pt overlayer does therefore not providesufficient protection against dissolution of the yttrium atomsfrom the subsurface layers. This was also observed for the Ptoverlayer on polycrystalline Pt3Sc, although in that case the post-ORR Pt overlayer thickness was much lower.35 This indicatesthat Pt-skin structures do not seem to be stable for alloys of Ptand early transition metals. As a consequence of the observedthick Pt overlayer on the annealed Y/Pt(111) after ORR testing,the measured increase in the ORR activity cannot be explainedby the ligand effect and could be attributed to the strain effect.
The fact that yttrium is not stable in the second layer couldbe due to different effects. One is the high driving force forY dissolution due to the very negative standard reductionpotential of Y (E0 = 2.372 V for Y ) Y3+).57 Another is the highaffinity of yttrium for oxygen (DH = 1905 kJ mol1 or corre-sponding to a gain of 9.9 eV per yttrium atom for 2Y + 1.5O2 =Y2O3),58 which could favour the formation of subsurface oxygen orsegregation of Y, leading to a depletion of yttrium.59–61
It is interesting to compare the UHV annealed Y/Pt(111)crystal with the UHV annealed Pt3Sc polycrystalline samplefrom our earlier work. For scandium the standard reductionpotential (E0 = 2.077 V for Sc) Sc3+)57 and affinity for oxygen(DH = 1908 kJ mol1 for 2Sc + 1.5O2 = Sc2O3)58 are approxi-mately as high as for yttrium. The heat of formation of Pt3Sc,Pt3Y and Pt5Y is also about the same.27,62 Nevertheless, UHVannealed Pt3Sc showed little change in the Pt overlayer thick-ness after ORR measurements, whereas for UHV annealedY/Pt(111) a thick Pt overlayer was formed. The most strikingdifference between UHV annealed Pt3Sc and UHV annealedY/Pt(111) is the degree of strain. Pt3Sc is under 0.9% tensilestrain whereas UHV annealed Y/Pt(111) is under 3.8% tensilestrain, assuming a Pt3Y structure, or 5% compressive strain,
Paper PCCP
Publ
ishe
d on
11
Apr
il 20
14. D
ownl
oade
d by
DT
U L
ibra
ry o
n 11
/04/
2014
16:
02:2
4.
View Article Online

This journal is© the Owner Societies 2014 Phys. Chem. Chem. Phys.
assuming a Pt5Y structure. We hypothesise that this differencein the degree of strain is the reason for the difference instability of the Pt overlayer.
It seems to be quite plausible that the high activity ofpolycrystalline Pt3Y could also be due to the formation of acompressed Pt overlayer. Although the bulk Pt–Pt interatomicdistance would be greater than that of pure Pt, presumablyupon dealloying the surface would more closely resemble Pt5Y.Our present work shows that a Pt overlayer covering Pt5Y wouldlikely be under compression. Evidently, this thick, compressedPt overlayer differs significantly from our original assumptions.
Conclusion
We have studied the structure and activity of annealed Y/Pt(111).Under UHV conditions the structure was a Pt overlayer on top ofwhat appears to be a Pt5Y alloy. The structure exhibited a cleardecrease in the desorption temperature of CO. This structure is,however, not preserved under electrochemical conditions as athick Pt overlayer is formed. The Pt overlayer does not supplysufficient kinetic stability against yttrium dissolution from thefirst few atomic layers under ORR conditions. Even so, weanticipate that the strong interaction between Pt and Y wouldhinder continued dissolution from deeper layers. It seemslikely that the Pt overlayer formed is under compressive strain,similar to other alloys of Pt and rare earths.10,34,51,52 Our futureinvestigations will focus on the elucidation of the Pt overlayerformed under ORR conditions.
Acknowledgements
Funding by the Danish Council for Technology and InnovationsFTP program and by the Danish Strategic Research CouncilsHyCycle program is gratefully acknowledged. P.H.F. acknowledgesfunding from the Danish Council for Strategic Research inSustainable Energy and Environment-project ‘‘MEDLYS’’. M.E.E.gratefully acknowledges funding from the EU PF7’s initiativeFuel Cell and Hydrogen Joint Undertaking’s project CathCat(GA 303492). The Danish National Research Foundation’s Centerfor Individual Nanoparticle Functionality is supported by theDanish National Research Foundation (DNRF54).
Notes and references
1 BP Statistical Review of World Energy June 2013.http://www.bp.com.
2 N. Armaroli and V. Balzani, Angew. Chem., Int. Ed., 2007, 46,52–66.
3 E. E. Benson, C. P. Kubiak, A. J. Sathrum and J. M. Smieja,Chem. Soc. Rev., 2008, 38, 89–99.
4 Y. Hori, K. Kikuchi and S. Suzuki, Chem. Lett., 1985, 1695–1698.5 B. Hinnemann and J. K. Nørskov, Top. Catal., 2006, 37,
55–70.6 J. Rossmeisl, Z.-W. Qu, H. Zhu, G.-J. Kroes and J. K. Norskov,
J. Electroanal. Chem., 2007, 607, 83–89.
7 G. W. Crabtree, M. S. Dresselhaus and M. V. Buchanan,Phys. Today, 2004, 57, 39–44.
8 H. A. Gasteiger, D. R. Baker and R. N. Carter, Hydrogen FuelCells: Fundamentals and Applications., Wiley-CPH, 2010.
9 H. A. Gasteiger, S. S. Kocha, B. Sompalli and F. T. Wagner,Appl. Catal., B, 2005, 56, 9–35.
10 I. E. L. Stephens, A. S. Bondarenko, U. Grønbjerg, J. Rossmeisland I. Chorkendorff, Energy Environ. Sci., 2012, 5, 6744–6762.
11 A. Rabis, P. Rodriguez and T. J. Schmidt, ACS Catal., 2012, 2,864–890.
12 F. T. Wagner, B. Lakshmanan and M. F. Mathias, J. Phys.Chem. Lett., 2010, 1, 2204–2219.
13 T. Toda, H. Igarashi, H. Uchida and M. Watanabe,J. Electrochem. Soc., 1999, 146, 3750–3756.
14 L. Dubau, J. Durst, F. Maillard, L. Guetaz, M. Chatenet,J. Andre and E. Rossinot, Electrochim. Acta, 2011, 56,10658–10667.
15 L. Dubau, F. Maillard, M. Chatenet, J. Andre andE. Rossinot, Electrochim. Acta, 2010, 56, 776–783.
16 F. Maillard, L. Dubau, J. Durst, M. Chatenet, J. Andre andE. Rossinot, Electrochem. Commun., 2010, 12, 1161–1164.
17 S. Chen, H. A. Gasteiger, K. Hayakawa, T. Tada and Y. Shao-Horn, J. Electrochem. Soc., 2010, 157, A82–A97.
18 J. Rossmeisl, G. S. Karlberg, T. Jaramillo and J. K. Nørskov,Faraday Discuss., 2008, 140, 337–346.
19 I. Katsounaros, S. Cherevko, A. R. Zeradjanin and K. J. J.Mayrhofer, Angew. Chem., Int. Ed., 2014, 53, 102–121.
20 V. R. Stamenkovic, B. Fowler, B. S. Mun, G. F. Wang,P. N. Ross, C. A. Lucas and N. M. Markovic, Science, 2007,315, 493–497.
21 V. R. Stamenkovic, B. S. Mun, M. Arenz, K. J. J. Mayrhofer,C. A. Lucas, G. F. Wang, P. N. Ross and N. M. Markovic,Nat. Mater., 2007, 6, 241–247.
22 A. Bonakdarpour, K. Stevens, G. D. Vernstrom, R. Atanasoski,A. K. Schmoeckel, M. K. Debe and J. R. Dahn, Electrochim. Acta,2007, 53, 688–694.
23 Y. Xu, S. Hou, Y. Liu, Y. Zhang, H. Wang and B. Zhang,Chem. Commun., 2012, 48, 2665–2667.
24 Y. Xu and B. Zhang, Chem. Soc. Rev., 2014, 43, 2439–2450.25 J. K. Nørskov, J. Rossmeisl, A. Logadottir, L. Lindqvist,
J. R. Kitchin, T. Bligaard and H. Jonsson, J. Phys. Chem. B,2004, 108, 17886–17892.
26 I. E. L. Stephens, A. S. Bondarenko, F. J. Perez-Alonso,F. Calle-Vallejo, L. Bech, T. P. Johansson, A. K. Jepsen,R. Frydendal, B. P. Knudsen, J. Rossmeisl and I. Chorkendorff,J. Am. Chem. Soc., 2011, 133, 5485–5491.
27 J. Greeley, I. E. L. Stephens, A. S. Bondarenko, T. P. Johansson,H. A. Hansen, T. F. Jaramillo, J. Rossmeisl, I. Chorkendorffand J. K. Nørskov, Nat. Chem., 2009, 1, 552–556.
28 M. Mavrikakis, B. Hammer and J. K. Nørskov, Phys. Rev.Lett., 1998, 81, 2819–2822.
29 J. R. Kitchin, J. K. Nørskov, M. A. Barteau and J. G. Chen,J. Chem. Phys., 2004, 120, 10240–10246.
30 P. Strasser, S. Koh, T. Anniyev, J. Greeley, K. More, C. F. Yu,Z. C. Liu, S. Kaya, D. Nordlund, H. Ogasawara, M. F. Toneyand A. Nilsson, Nat. Chem., 2010, 2, 454–460.
PCCP Paper
Publ
ishe
d on
11
Apr
il 20
14. D
ownl
oade
d by
DT
U L
ibra
ry o
n 11
/04/
2014
16:
02:2
4.
View Article Online

Phys. Chem. Chem. Phys. This journal is© the Owner Societies 2014
31 F. Calle-Vallejo, J. I. Martınez, J. M. Garcıa-Lastra, J. Rossmeisland M. T. M. Koper, Phys. Rev. Lett., 2012, 108, 116103.
32 H. E. Hoster, O. B. Alves and M. T. M. Koper, ChemPhysChem,2010, 11, 1518–1524.
33 B. S. Mun, M. Watanabe, M. Rossi, V. Stamenkovic,N. M. Markovic and P. N. Ross, J. Chem. Phys., 2005, 123,204717.
34 I. E. L. Stephens, A. S. Bondarenko, L. Bech and I. Chorkendorff,ChemCatChem, 2012, 4, 341–349.
35 T. P. Johansson, E. T. Ulrikkeholm, P. Hernandez-Fernandez,P. Malacrida, H. A. Hansen, A. S. Bandarenka, J. K. Nørskov,J. Rossmeisl, I. E. L. Stephens and I. Chorkendorff, Top. Catal.,2014, 57, 245–254.
36 T. P. Johansson, New Materials for Oxygen Reduction Electrodes,PhD thesis, DTU, 2012.
37 J. Tang, J. M. Lawrence and J. C. Hemminger, Phys. Rev. B:Condens. Matter Mater. Phys., 1993, 48, 15342–15352.
38 C. J. Baddeley, A. W. Stephenson, C. Hardacre, M. Tikhovand R. M. Lambert, Phys. Rev. B: Condens. Matter Mater.Phys., 1997, 56, 12589–12598.
39 B. Vermang, M. Juel and S. Raaen, Phys. Rev. B: Condens.Matter Mater. Phys., 2006, 73, 033407.
40 A. Kildemo, A. Juel and S. Raaen, Surf. Sci., 2005, 581,133–141.
41 A. Ramstad and S. Raaen, Phys. Rev. B: Condens. MatterMater. Phys., 1999, 59, 15935–15941.
42 A. Ramstad, S. Raaen and N. Barrett, Surf. Sci., 2000, 448,179–186.
43 J. M. Essen, C. Becker and K. Wandelt, e–J. Surf. Sci.Nanotechnol., 2009, 7, 421–428.
44 W.-P. Zhou, X. Yang, M. B. Vukmirovic, B. E. Koel, J. Jiao,G. Peng, M. Mavrikakis and R. R. Adzic, J. Am. Chem. Soc.,2009, 131, 12755–12762.
45 A. S. Bandarenka, A. S. Varela, M. Karamad, F. Calle-Vallejo,L. Bech, F. J. Perez-Alonso, J. Rossmeisl, I. E. L. Stephensand I. Chorkendorff, Angew. Chem., Int. Ed., 2012, 51,11845–11848.
46 N. Todoroki, Y. Iijima, R. Takahashi, Y. Asakimori andT. Wadayama, J. Electrochem. Soc., 2013, 160, F591–F596.
47 S. Brimaud, A. K. Engstfeld, O. B. Alves and R. J. Behm,J. Electroanal. Chem., 2014, 716, 71–79.
48 R. Yang, P. Strasser and M. F. Toney, J. Phys. Chem. C, 2011,115, 9074–9080.
49 K. J. Andersson, F. Calle-Vallejo, J. Rossmeisl andI. Chorkendorff, J. Am. Chem. Soc., 2009, 131, 2404–2407.
50 D. Briggs and M. P. Seah, Practical Surface Analysis, JohnWiley & Sons Ltd., 1992, vol. 1 Auger and X-ray PhotoelectronSpectroscopy.
51 M. Escudero-Escribano, A. Verdaguer-Casadevall, P. Malacrida,U. Grønbjerg, B. P. Knudsen, A. K. Jepsen, J. Rossmeisl,I. E. L. Stephens and I. Chorkendorff, J. Am. Chem. Soc.,2012, 134, 16476–16479.
52 P. Malacrida, M. Escudero-Escribano, A. Verdaguer-Casadevall,I. E. L. Stephens and I. Chorkendorff, J. Mater. Chem. A, 2014, 2,4234–4243.
53 B. Predel, Pt-Y (Platinum-Yttrium), in SpringerMaterials - TheLandolt-Bornstein Database, ed. O. Madelung, 1998, vol. 5I,DOI: 10.1007/10542753_2539.
54 V. R. Stamenkovic, B. S. Mun, K. J. J. Mayrhofer, P. N. Rossand N. M. Markovic, J. Am. Chem. Soc., 2006, 128, 8813–8819.
55 S. Raaen and A. Ramstad, Energy, 2005, 30, 821–830.56 M. Ruff, N. Takehiro, P. Liu, J. K. Nørskov and R. J. Behm,
ChemPhysChem, 2007, 8, 2068–2071.57 M. Pourbaix, Atlas of Electrochemical Equilibria in Aqueous
Solutions, National Association of Corrosion Engineers,Houston, Texas, 1974.
58 Standard thermodynamic properties of chemical substances,in CRC Handbook of Chemistry and Physics, ed. W. M. Haynes,CRC Press, Boca Raton, FL, 94th edn, 2013, section 5, pp. 5–17.
59 C. A. Menning and J. G. Chen, J. Power Sources, 2010, 195,3140–3144.
60 C. A. Menning and J. G. Chen, Top. Catal., 2010, 53, 338–347.61 C. A. Menning and J. G. Chen, J. Chem. Phys., 2008, 128, 164703.62 A. Palenzona and S. Cirafici, J. Phase Equilib., 1990, 11, 493–497.
Paper PCCP
Publ
ishe
d on
11
Apr
il 20
14. D
ownl
oade
d by
DT
U L
ibra
ry o
n 11
/04/
2014
16:
02:2
4.
View Article Online


Mass-selected nanoalloys as model catalysts: PtxY nanoparticles for oxygen
electroreduction
Patricia Hernandez-Fernandeza, Federico Masinia, David N. McCarthya, Christian E. Strebela, Daniel Friebelc, Davide Deianab, Paolo Malacridaa, Anders Nierhoffa, Anders Bodina, Anna M. Wise,c Jane H. Nielsena, Thomas W. Hansenb, Anders Nilssonc, Ifan E.L. Stephensa,* Ib Chorkendorffa*
a Center for Individual Nanoparticle Functionality (CINF), Department of Physics, Technical University of Denmark, Kgs Lyngby DK-2800, Denmark b Center for Electron Nanoscopy (CEN), Technical University of Denmark, Kgs Lyngby DK-2800, Denmark c SLAC National Accelerator Laboratory, 2575 Sand Hill Road, MS31, Menlo Park CA 94025, USA * Corresponding authors
Abstract
Low temperature fuel cells are limited by the oxygen reduction reaction, occurring at the
cathode. Their widespread implementation in automotive vehicles requires a decrease in the
loading of Pt necessary to catalyse oxygen reduction by alloying Pt with other metals. PtxY
nanocatalysts should, in principle, exhibit the hitherto unreachable combination of high activity
and stability. Herein, we demonstrate the synthesis, characterisation and catalyst testing of PtxY
nanoparticles prepared through the gas aggregation technique. The catalysts reported here are
highly active, with a mass activity of 3.05 AmgPt-1 at 0.9 V versus a reversible hydrogen
electrode. State-of-the-art commercial Pt/C exhibits up to ~0.55 AmgPt-1 under similar
conditions. Using a variety of characterization techniques, we show that the high activity of PtxY
is exclusively due to a compressive strain exerted onto the Pt surface atoms by the alloy core.
Introduction
Polymer electrolyte membrane fuel cells (PEMFC’s) hold the potential to provide a zero-
emission power source for future automotive applications. However, their widespread
commercialisation is hindered by the high loadings of Pt required to catalyse the oxygen
reduction reaction (ORR) at the cathode. 1-4 An order of magnitude increase in ORR mass
activity, i.e. current density per unit mass Pt, over state-of-the art commercial pure Pt catalysts
would bring the precious metal loading in fuel cells to a similar level to that used for emission
control in internal combustion engines.3,5 Some alloys of PtX (X =Co, Ni, Cu) show higher ORR
1

activity in comparison to pure Pt,1-4 but their long term performance is typically compromised by
their poor stability against dealloying.6,7 New Pt based alloys are required that meet the criteria
of both high activity and stability.
In collaboration with Nørskov, Rossmeisl and coworkers, we discovered a new catalyst that
could bring us one step closer to this goal.8 Pt3Y exhibited the highest ORR activity ever
measured on an extended, polycrystalline surface, to the best of our knowledge only surpassed
by single crystal Pt3Ni(111).9 Subsequent studies from our laboratory show that extended
surfaces of polycrystalline Pt5Y, Pt5Gd and Pt5La also exhibited high ORR activity.3,10,11 The
uniquely negative heat of formation of Pt-rare earth alloys should provide them with greater
kinetic stability than the more commonly tested alloys of Pt and late transition metals.8,11,12
This notion is supported by our own stability tests on extended surfaces 11 as well as those of
Lim and coworkers on sputtered thin films.13,14
To understand the effect of alloying on the ORR activity of Pt, we invoke the theoretical model
developed by Nørksov, Rossmeisl and coworkers.14 The potential losses, or overpotential, for the
ORR on pure Pt catalysts originate from the final step in the reaction;14 the electroreduction of
HO* to H2O (where HO* is an adsorbed hydroxyl intermediate15). Pt alloy ORR catalysts are
typically encased by an overlayer of pure Pt; the less noble metal will dissolve from the
surface.10,16-22 Alloying Pt decreases the overpotential for the electroreduction of HO* to H2O by
weakening the binding to HO*. The optimal catalyst should have an HO* binding that is ~0.1 eV
weaker than Pt(111).3,23 DFT calculations originally suggested that the activity of Pt3Y should be
contingent upon a substantial concentration of Y in the second surface layer,8 i.e. ligand
effects.19,24,25 Nonetheless, subsequent experiments showed that the active phases of
polycrystalline Pt3Y and Pt5Y are encased by a 3-4 monolayer thick overlayer of pure Pt.10 The
considerable thickness of these overlayers excludes the possibility that the enhanced ORR
activity of PtxY is due to ligand effects.. Consequently, the underlying mechanism for the
enhanced activity of PtxY alloys is still an open question.
One hypothesis that we propose to be test is that the activity is due to strain effects,26 which can
be exerted over at least 10 atomic layers.20 A compressive surface strain is the most probable
cause of the enhanced activity for many Pt alloys for the ORR, as demonstrated to be the case on
dealloyed PtCux.20 Given that Y has a larger covalent radius than Pt,27 one would intuitively
expect a Pt overlayer on a Pt-Y alloy core to impose tensile strain on the Pt surface atoms. Even
2

so, this notion is inconsistent with the ORR activity data, as a tensile strain would strengthen,20
rather than weaken the binding of Pt to HO*, which should lead to a higher overpotential for the
ORR.
Thus far, the ORR activity of PtxY has only been demonstrated on extended polycrystalline
surfaces and thin films.8,10,13,14 In order for PtxY to make an impact to PEMFC’s, the catalyst
needs to be synthesised in the nanoparticulate form. In the case of PtxY and other alloys of Pt
and rare earths, such a task is not trivial, given the high affinity of rare earth elements to
oxygen.28 There are reports in the literature where researchers have attempted to produce
nanoparticles of this or similar catalysts.29,30 Nevertheless, there is no firm evidence that metallic
PtxY can be synthesised in the nanoparticulate form and that it shows superior catalytic
performance for the ORR. In contrast, alloys of Pt and late transition metals such as Ni, Co, Cu,
Pd and Fe are less challenging to synthesise; the solute metal element will typically have a much
less negative reduction potential than rare earths such as Y, Gd or La.28 However, alloys or core
shell structures of Pt and late transition metals have been investigated for more than 25 years.31,32
Despite recent advances in the ORR on Pt-late transition metal alloys,21,33-38 we envision that the
relatively uncharted territory offered by alloys of Pt and rare earths should provide much room
for improvement, should their synthesis be possible in nanoparticulate form.
Thus, in order to further the development of PtxY as a catalyst for the ORR, two critical
questions should be addressed: (a) what is the origin of the enhanced catalytic activity? and (b)
can it be prepared in nanoparticulate form? Herein, we address the above challenges by
preparing model size selected nanoparticles of PtxY by gas aggregation. Furthermore, we
characterise the structure and composition of the nanoparticles before and after ORR conditions
using X-ray photoelectron spectroscopy (XPS), ion scattering spectroscopy (ISS), transmission
electron microscopy (TEM) and X-ray absorption spectroscopy (XAS) measurements.
Experimental results
The mass-selected PtxY particles were prepared through the gas aggregation of a Pt9Y target and
time of flight separation as shown in Fig. 1a. The charged nanoparticles were subsequently
deposited directly onto a planar glassy carbon substrate under ultra-high vacuum conditions. By
resorting to a physical method, we can elucidate fundamental relationships between reactivity,
particle size, shape and morphology,39-43 without the inherent artefacts introduced by wet
3

chemical synthesis from the precursors or surfactants. 44-46 Moreover, it allows for the production
of well-defined nanoparticles of materials which are otherwise challenging to synthesise by
conventional chemical methods.
The results of the physical characterisation are summarised on Fig. 1b-k, and described in detail
in the supplementary information. We first attempted to produce the catalysts from a Pt3Y
(rather than a Pt9Y) target. However, this resulted in the formation of nanoparticles with a very
high Y content; the particles corroded excessively, analogous to our earlier results on extended
surfaces of PtY and Pt2Y10.
The surface composition of the as-prepared catalysts was characterized by ISS and XPS, as seen
in Fig. 1b-1d. Fig. 1 c, d show the XPS spectra of the Pt 4f and Y 3d core level regions acquired
after deposition, respectively. The Pt:Y ratios of the as-prepared samples are all ~4, as shown in
Fig. S1 of the supporting information. The XPS spectrum of the Y 3d core level region for the
as-prepared nanoparticles could not be fitted by a single set of peaks, suggesting that the Y is in
more than one chemical state. The position of the most intense, low binding energy peak is
consistent with metallic Y. However, the shift between the metallic Y species and the second,
less intense Y species is inconsistent with the notion that this latter species is Y2O3 see also Fig.
S3 for air exposed samples.47 The unidentified species may be formed from the reaction of Y
with the carbon substrate although the presence of Y hydrate or Y hydroxide cannot be excluded.
The presence of both Pt and Y in the ISS spectrum shown in Fig. 1b, confirms that the surface
layer is composed of both elements.
The particle size distribution (PSD) histograms of the different particles, determined using TEM
are plotted on Fig. 1h-k. In the text and figure captions we refer to the particle according to the
intended size, rather than the measured size. However, when plotting data on numerical axes we
use the measured size, from the mean value in the PSD’s. The sharp narrow peaks on the PSDs
clearly demonstrate the high quality of the mass selection. The presence of satellite peaks at
higher diameters is due to the formation of doubly charged nanoparticles, i.e. with a mass which
is twice the intended mass. This artefact was minimised by optimising the synthesis conditions.
The particles preserve the spherical shape, independent of diameter. Close inspection of the TEM
images suggest that the nanoparticles mostly consist of several crystallites (see supplementary
information).
4

Once deposited and characterised, the alloy catalyst-loaded electrode was transferred from the
vacuum chamber to the arbour of a rotating ring disk electrode assembly, where the oxygen
reduction reaction activity was evaluated in a liquid half-cell containing 0.1 M HClO4. The
electrochemical surface area was measured by CO stripping, see Fig. S4 and supplementary
information for details. The activity of the alloy catalysts, expressed as a kinetic current density
at 0.9 V, is summarised in Fig. 2, both in terms of specific activity (i.e. mAcm-2 microscopic
surface area), and mass activity (i.e. AmgPt-1). For the purpose of comparison, the plots also
include the activity of extended surfaces of sputter-cleaned, polycrystalline Pt3Y, as well as our
previously reported data for pure Pt surfaces.8,10,11,40 Each of the PtxY catalysts exhibits a
marked enhancement in specific activity over pure Pt of the same size, with the exception of the
smallest, 4 nm nanoparticles. Similar to pure Pt, the specific activity of PtxY increases with
particle size, with the activity of the larger nanoparticles converging towards that of extended
polycrystalline surfaces. Most notably, the mass activity of PtxY is not only significantly higher
than that of pure Pt, but within the range of particle sizes studied here it increases monotonically
with particle size. This trend is of great advantage; larger particles are inherently more stable
against dissolution, sintering and Ostwald ripening.3,48 In contrast, pure Pt exhibits a peak in
mass activity at ~3 nm, a suboptimal particle size in terms of stability. The highest mass activity
is found at 9 nm diameter, 3.05 AmgPt-1 at 0.9 V. This is close to the highest activity reported in
the literature (3.3 AmgPt-1 for PtxNi nanoparticles49), over 5.5 times higher than the most active
commercial pure Pt catalyst (0.55 A mgPt-1),50 and 3 times higher than the peak mass activity for
Pt nanoparticles measured in the same manner.40
Upon extended cycling for 9,000 times between 0.6 V and 1 V, the catalyst retained 63 % of its
initial activity, as shown in Fig. S5. Fig. S6 highlights the most of the activity losses occur
during the first 600 cycles. The surface coverage of Pt, measured on the basis of CO-stripping, is
constant with time. This suggests that the losses in activity are due to a decrease in specific
activity, rather than the loss of surface area. Consequently, following some initial performance
losses, it seems that the catalyst reaches a metastable state that is kinetically hindered from
degrading further. Moreover, the specific activity, even after cycling, is still ca. 2-4 times higher
than pure Pt nanoparticles of the same size, as shown in Fig. S5. We note that the activity and
stability of the PtxY nanoparticles compares closely to to the aforementioned PtxNi nanoparticles
which exhibited a record high activity.49 The PtxY nanoparticles retain 63% of their activity after
5

9,000 cycles while for the PtxNi 60% was retained after 5,000 cycles between 0.65 V and 1 V.
Nonetheless, a quantitative comparison of the catalyst stability we report here with other Pt
alloys is challenging. Ideally the stability of the PtxY nanoparticles should be compared with
other Pt-alloy catalysts prepared and tested under identical conditions.
To understand the cause of the high activity of our nanoparticulate alloy catalysts, we performed
a series of ex situ examinations of the active phase. We used scanning transmission electron
microscopy energy dispersive X-ray spectroscopy (STEM-EDS) to map the distribution of Pt and
Y. The STEM images and the corresponding EDS elemental maps of PtxY 9 nm particles before
electrochemical treatment and after ORR activity measurements are shown in Fig. 3. The
combined Pt and Y EDS maps of the as-prepared particles show a homogeneous distribution of
the two elements over the entire particle (Fig. 3a). However, the EDS maps on Fig. 3b reveal that
a Pt-rich shell is formed around the Pt-Y core of the sample that was exposed to the ORR
conditions, due to dissolution of Y. This overlayer can be clearly seen on the EDS line profile on
the inset of Fig. 3b. On the basis of the line profile data, we estimate that the Pt-shell is ~1 nm
thick. These microscopic data are confirmed macroscopically by the ISS and XPS spectra shown
in Fig. 1 b-d to e-g. The total Y intensity is diminished in magnitude on the acid treated sample,
with a Pt:Y XPS ratio of 14.3 for the 9 nm particles. Moreover, only a single set of Y peaks
appears, representing a metallic phase. The presence of the Pt peak and absence of the Y peak on
the ISS spectrum on Fig. 1e confirms that there is no Y at the surface of the catalyst. Further
evidence for the formation of a core-shell structure is described in the supplementary
information.
The identical location-TEM measurements in Fig. S7 show that there is no significant change in
catalyst morphology or size distribution, before and after reaction conditions. Fig. S8 shows the
STEM-EDX mapping of the 9 nm nanoparticles after 9,000 cycles, further confirming the Pt
overlayer formation. To summarise our STEM, XPS and ISS data, thus far, exposure to ORR
conditions results in a significant increase of the Pt:Y ratio in the near-surface region, due to Y
dissolution. This is consistent with our earlier measurements on extended surfaces of Pt3Y and
Pt5Y, which have a 3-4 monolayer thick overlayer.10 On this basis, we can conclude that
enhanced activity of the PtxY nanoparticles cannot be traced back to ligand effects, which leads
us to investigate strain effects.
6

To quantify the strain in the PtxY catalysts, we employed extended X-ray absorption fine
structure measurements (EXAFS), before and after the ORR treatment, in comparison to a bulk
Pt foil and pure Pt nanoparticles. The main output of the EXAFS experiments is summarised in
Fig. 4, where the average nearest neighbour Pt-Pt distance of the different PtxY and Pt catalysts
is plotted as a function of the particle size. For details see Fig. S10 and supplementary
information. All the pure Pt samples exhibit the same Pt-Pt distance, , before and after
electrochemical testing, independent of the particle size. On the contrary, the PtxY catalysts not
only exhibit a lower Pt-Pt distance, relative to pure Pt, but also maintain this compressive strain
after the electrochemical testing. The lowest Pt-Pt distance was displayed by the as-prepared
PtxY samples, with up to 3 % decrease in Pt-Pt distance, i.e. compressive strain versus pure Pt.
After ORR testing, the compression of the PtxY structure diminishes and is clearly dependent on
the particle size, varying from a strain of to -1.0 % for the 4 nm PtxY particles and -2.1 % for
the 9 nm PtxY particles.
Our results conclusively show that alloying Pt with Y brings about an overall compression to the
Pt-Pt distance in PtxY. Exposure to ORR conditions removes the Y from the first atomic layers.
In the absence of Y in the near-surface region, there will be a driving force for the interatomic
distance in the Pt overlayers to expand towards that of pure Pt. Nonetheless, experiments on
Pt/Cu(111) and Cu3Pt(111) single crystals suggest that there would still be some degree of
compressive strain within the overlayer, despite the relaxation.18,20 Assuming that the Pt-Pt
distance determined with EXAFS represents the average over PtxY core and Pt shell, and that a
~1 nm thick overlayer is formed, consistent with the TEM measurements, the Pt overlayer is
compressed by ~ 1.8%.
It is somewhat counterintuitive that alloying Pt with Y reduces the Pt-Pt distance in the alloy,
given that Y is larger than Pt.27 However, in bulk Pt5Y, the nearest neighbour Pt-Pt distance is
2.65 Å, which is compressed by 4 % relative to pure Pt.10 Pt5La and Pt5Gd have bulk structures
to Pt5Y, albeit with different stacking.3,11 The bulk structure of these compounds consists of
alternating rows of pure Pt and Pt-rare earth atoms. According to earlier DFT calculations, a Pt
overlayer covering an extended surface of Pt5La would resemble a compressed closely-packed Pt
7

layer.3 Essentially, the larger rare earth atoms deform the closely packed structure of Pt,
allowing a larger number of Pt atoms to fit onto the Pt overlayer than on bulk Pt.
In Fig. 5 we demonstrate that the activity of PtxY catalysts is strongly correlated to the Pt-Pt
distance in the particles, similar to dealloyed PtCux.20 An increase in compression brings about
an increased ORR activity, relative to Pt, via slightly weakened OH binding to the surface. On
the other hand, PtxY nanoparticles should be inherently more stable than PtCux and other Pt-late
transition metal alloys against continued dealloying under reaction conditions.3,8,11,49 Dealloying
via diffusion of Y through the bulk and the Pt overlayer will be hindered by the strong
interaction between Y and Pt.8 The moderate stability we report here could be improved even
further through optimisation of the catalyst composition and by suitable annealing.38 This will be
a subject of future studies.
In conclusion, the mass activity of the catalyst, at 3.05 AmgPt-1 at 0.9 V is, within the range of
experimental error, as high as the best reported in the literature. By using mass selected
nanoparticles, not only do we provide a proof-of-concept that nanoparticles of Pt-Y alloys are
highly active, but we also shed scientific insight into the underlying mechanism of their
enhanced activity. It turns out that their superior performance is due to a compressive strain
exerted by the catalyst core onto the surface. Our work provides a strong impetus for the
implementation of PtxY in fuel cells. Nevertheless, the methods used here do not allow for mass
production. The next step is to develop the chemical synthesis of this catalyst in bulk quantities,
where the Y content may also be optimised.
Author Contributions
I.C. and I.S. conceived the experiments. P.H-F. performed the electrochemical experiments.
F.M., D.N.M., C.E.S., P.M. and A.N. performed the UHV-based experiments. D.F., A.B. and
A.M.W performed the XAS measurements. D.D. performed the microscopy. P.H.F. designed the
figures. P.H-F. wrote the first draft of the paper. All authors discussed the results and commented
on the manuscript.
Acknowledgements
8

The authors gratefully acknowledge financial support from the Danish Ministry of Science’s
UNIK initiative, Catalysis for Sustainable Energy. The Danish National Research Foundation’s
Center for Individual Nanoparticle Functionality is supported by the Danish National Research
Foundation (DNRF54). The A.P. Møller and Chastine Mc-Kinney Møller Foundation is
gratefully acknowledged for its contribution towards the establishment of the Centre for Electron
Nanoscopy in the Technical University of Denmark. The Interdisciplinary Centre for Electron
Microscopy (CIME) at EPFL is gratefully acknowledged for the use of the FEI Tecnai Osiris
TEM. P.A.H.F. gratefully acknowledges support from the Danish Council for Strategic
Research's project MEDLYS (10-093906). I.E.L.S. was supported by the ForskEL programme's
project CATBOOSTER (2001-1-10669). D.N.M. is the recipient of a HC Ørsted postdoctoral
fellowship. Part of this work is supported by the Department of Energy, Office of Basic Energy
Sciences, US Department of Energy, Basic Energy Science through the SUNCAT Center for
Interface Science and Catalysis. This research was partly carried out at the Stanford Synchrotron
Radiation Lightsource, a National User Facility operated by Stanford University on behalf of the
U.S. Department of Energy, Office of Basic Energy Sciences. We thank John Bargar, Apurva
Mehta, Ryan Davis, Matthew Latimer and Erik J. Nelson for support with the EXAFS
instrumentation and helpful discussions.
9

Figure 1 | Surface characterization of the PtxY nanoparticles before and after ORR activity
measurements. (a) Schematic representation of the cluster source. ISS spectrum for PtxY 9 nm
as-prepared (b) and after ORR (e). XPS spectra of both the Pt 4f and Y 3d core level region for
PtxY 9 nm as-prepared (c, d) and after ORR (f, g) The Pt/Y ratio here is 4 and 15 for as prepared
and after ORR. Particle size distributions and representative TEM micrographs for the PtxY
catalysts of 4 nm (h), 5 nm (i), 7 nm (j) and 9 nm (k).
10

Figure 2 | ORR kinetic current densities and mass activities of the PtxY nanoparticles at 0.9
V recorded at 50 mVs-1, 1,600 rpm and 23 ± 1 °C in O2-saturated 0.1 M HClO4, taken from
the anodic cycle. For comparison, the previously published mass and specific activities of pure
Pt nanoparticles are also plotted.40 Each data point corresponds to the mean value from at least
three independent activity tests; the error bar shows the standard deviation. The ORR activities
were extracted from the anodic polarization scan and corrected for mass transport limitations.
The Pt surface area (cm2Pt) was determined by CO stripping. The amount of Pt deposited in each
electrode was measured with a quartz crystal microbalance for the PtxY catalyst, while for the
pure Pt samples was estimated as reported in40. The Pt3Y pc data corresponds to a sputter cleaned
extended surface of polycrystalline Pt3Y, tested under the same conditions.11
11

Figure 3 | HAADF-STEM images (left) and Y, Pt and combined Pt+Y X-ray EDS elemental
maps (right) for PtxY 9 nm. (a) PtxY 9 nm as-prepared and (b) PtxY 9 nm after ORR. Pt and Y
EDS intensity line profiles extracted from the spectrum image data cube along with the purple
line drawn on the HAADF image are also shown. The thickness of the Pt-rich region varies
around the nanoparticles. We estimated the Pt-shell thickness of the nanoparticles by extracting
ten line profiles across each particle of (b), obtaining a value of 1.0 ± 0.3 nm.
12

Figure 4 | X-ray Absorption Spectroscopy (XAS) analysis. Average nearest neighbor Pt-Pt
distance measured by EXAFS as a function of the particle size for both as-prepared (black) and
after ORR (red) recorded on PtxY. The line is to guide the eye. To compare, we carried out
EXAFS measurements on as-prepared (blue) and electrochemically tested (orange) Pt
nanoparticles. We also measured on a Pt foil (grey) in order to have a reference.
13

Figure 5 | Surface specific activity, extracted from Fig. 2, as a function of the compressive strain
in PtxY, relative to bulk Pt, based on the data shown in Fig. 4. The continuous line serves to
guide the eye.
14

1 Gasteiger, H. A., Kocha, S. S., Sompalli, B. & Wagner, F. T. Activity benchmarks and requirements for Pt, Pt-alloy, and non-Pt oxygen reduction catalysts for PEMFCs. Appl. Catal. B-Environ. 56, 9-35 (2005).
2 Gasteiger, H. A. & Markovic, N. M. Just a Dream-or Future Reality? Science 324, 48-49 (2009). 3 Stephens, I. E. L., Bondarenko, A. S., Grønbjerg, U., Rossmeisl, J. & Chorkendorff, I.
Understanding the oxygen reduction reaction on platinum and its alloys. Energy Environ. Sci. 5, 6744-6762 (2012).
4 Debe, M. K. Electrocatalyst approaches and challenges for automotive fuel cells. Nature 486, 43-51, doi:10.1038/nature11115 (2012).
5 Wagner, F. T., Lakshmanan, B. & Mathias, M. F. Electrochemistry and the Future of the Automobile. J. Phys. Chem. Lett. 1, 2204-2219 (2010).
6 Chen, S., Gasteiger, H. A., Hayakawa, K., Tada, T. & Shao-Horn, Y. Platinum-Alloy Cathode Catalyst Degradation in Proton Exchange Membrane Fuel Cells: Nanometer-Scale Compositional and Morphological Changes. J. Electrochem. Soc. 157, A82-A97 (2010).
7 Maillard, F. et al. Durability of Pt(3)Co/C nanoparticles in a proton-exchange membrane fuel cell: Direct evidence of bulk Co segregation to the surface. Electrochemistry Communications 12, 1161-1164, doi:10.1016/j.elecom.2010.06.007 (2010).
8 Greeley, J. et al. Alloys of platinum and early transition metals as oxygen reduction electrocatalysts. Nature Chemistry 1, 552-556 (2009).
9 Stamenkovic, V. R. et al. Improved oxygen reduction activity on Pt3Ni(111) via increased surface site availability. Science 315, 493-497 (2007).
10 Stephens, I. E. L., Bondarenko, A. S., Bech, L. & Chorkendorff, I. Oxygen electroreduction activity and X-ray photoelectron spectroscopy of alloys of platinum and early transition metals. ChemCatChem 4, 341-349 (2012).
11 Escudero-Escribano, M. et al. Pt5Gd as a highly active and stable catalyst for oxygen electroreduction. J. Am. Chem. Soc. 134, 16476-16479 (2012).
12 Johannesson, G. H. et al. Combined electronic structure and evolutionary search approach to materials design. Physical Review Letters 88, 255506 (2002).
13 Jong Yoo, S. et al. Enhanced stability and activity of Pt-Y alloy catalysts for electrocatalytic oxygen reduction. Chemical Communications 47, 11414-11416 (2011).
14 Hwang, S. J. et al. Role of Electronic Perturbation in Stability and Activity of Pt-Based Alloy Nanocatalysts for Oxygen Reduction. J. Am. Chem. Soc. 134, 19508-19511, doi:10.1021/ja307951y (2012).
15 Sanchez Casalongue, H. et al. Direct observation of the oxygenated species during oxygen reduction on a platinum fuel cell cathode. Nat. Commun. (in press).
16 Toda, T., Igarashi, H., Uchida, H. & Watanabe, M. Enhancement of the electroreduction of oxygen on Pt alloys with Fe, Ni, and Co. J. Electrochem. Soc. 146, 3750-3756 (1999).
17 Stamenkovic, V. R., Mun, B. S., Mayrhofer, K. J. J., Ross, P. N. & Markovic, N. M. Effect of surface composition on electronic structure, stability, and electrocatalytic properties of Pt-transition metal alloys: Pt-skin versus Pt-skeleton surfaces. J. Am. Chem. Soc. 128, 8813-8819 (2006).
18 Yang, R. Z., Strasser, P. & Toney, M. F. Dealloying of Cu(3)Pt (111) Studied by Surface X-ray Scattering. J. Phys. Chem. C 115, 9074-9080, doi:10.1021/jp111978m (2011).
19 Stephens, I. E. L. et al. Tuning the Activity of Pt(111) for Oxygen Electroreduction by Subsurface Alloying. J. Am. Chem. Soc. 133, 5485-5491, doi:10.1021/ja111690g (2011).
20 Strasser, P. et al. Lattice-strain control of the activity in dealloyed core-shell fuel cell catalysts. Nature Chemistry 2, 454-460 (2010).
15

21 Wang, D. L. et al. Structurally ordered intermetallic platinum-cobalt core-shell nanoparticles with enhanced activity and stability as oxygen reduction electrocatalysts. Nature Materials 12, 81-87, doi:10.1038/nmat3458 (2013).
22 Johansson, T. et al. Pt Skin Versus Pt Skeleton Structures of Pt3Sc as Electrocatalysts for Oxygen Reduction. Top. Catal., 1-10 (2013).
23 Nørskov, J. K. et al. Origin of the overpotential for oxygen reduction at a fuel-cell cathode. Journal of Physical Chemistry B 108, 17886-17892 (2004).
24 Kitchin, J. R., Nørskov, J. K., Barteau, M. A. & Chen, J. G. Role of strain and ligand effects in the modification of the electronic and chemical properties of bimetallic surfaces. Physical Review Letters 93, 156801 (2004).
25 Calle-Vallejo, F., Martinez, J. I., Garcia-Lastra, J. M., Rossmeisl, J. & Koper, M. T. M. Physical and Chemical Nature of the Scaling Relations between Adsorption Energies of Atoms on Metal Surfaces. Physical Review Letters 108, doi:11610310.1103/PhysRevLett.108.116103 (2012).
26 Mavrikakis, M., Hammer, B. & Nørskov, J. K. Effect of strain on the reactivity of metal surfaces. Physical Review Letters 81, 2819-2822 (1998).
27 Cordero, B. et al. Covalent radii revisited. Dalton Trans., 2832-2838, doi:10.1039/b801115j (2008).
28 Pourbaix, M. Atlas of Electrochemical Equilibria in Aqueous Solutions. Second edn, (National Association of Corrosion Engineers, 1974).
29 Nishanth, K. G., Sridhar, P. & Pitchumani, S. Enhanced oxygen reduction reaction activity through spillover effect by Pt–Y(OH)3/C catalyst in direct methanol fuel cells. Electrochemistry Communications 13, 1465-1468, doi:http://dx.doi.org/10.1016/j.elecom.2011.09.021 (2011).
30 Jeon, M. K. & McGinn, P. J. Carbon supported Pt–Y electrocatalysts for the oxygen reduction reaction. Journal of Power Sources 196, 1127-1131, doi:10.1016/j.jpowsour.2010.08.048 (2011).
31 Luczak, F. J. & Landsman, D. A. Fuel cell cathode catalyst alloy-comprising noble metal, cobalt and a transition metal. United States patent 4677092-A (1987).
32 Mukerjee, S. & Srinivasan, S. ENHANCED ELECTROCATALYSIS OF OXYGEN REDUCTION ON PLATINUM ALLOYS IN PROTON-EXCHANGE MEMBRANE FUEL-CELLS. J. Electroanal. Chem. 357, 201-224, doi:10.1016/0022-0728(93)80380-z (1993).
33 van der Vliet, D. F. et al. Mesostructured thin films as electrocatalysts with tunable composition and surface morphology. Nature Materials 11, 1051-1058, doi:10.1038/nmat3457 (2012).
34 Cui, C. H., Gan, L., Heggen, M., Rudi, S. & Strasser, P. Compositional segregation in shaped Pt alloy nanoparticles and their structural behaviour during electrocatalysis. Nature Materials 12, 765-771, doi:10.1038/nmat3668 (2013).
35 Snyder, J., Fujita, T., Chen, M. W. & Erlebacher, J. Oxygen reduction in nanoporous metal-ionic liquid composite electrocatalysts. Nature Materials 9, 904-907, doi:10.1038/nmat2878 (2010).
36 Liu, W. et al. Bimetallic aerogels: high-performance electrocatalysts for the oxygen reduction reaction. Angewandte Chemie (International ed. in English) 52, 9849-9852, doi:10.1002/anie.201303109 (2013).
37 Sasaki, K. et al. Highly stable Pt monolayer on PdAu nanoparticle electrocatalysts for the oxygen reduction reaction. Nat. Commun. 3, doi:10.1038/ncomms2124 (2012).
38 Wang, C. et al. Design and Synthesis of Bimetallic Electrocatalyst with Multilayered Pt-Skin Surfaces. J. Am. Chem. Soc. 133, 14396-14403, doi:10.1021/ja2047655 (2011).
39 Nesselberger, M. et al. The effect of particle proximity on the oxygen reduction rate of size-selected platinum clusters. Nature Materials 12, 919-924, doi:10.1038/nmat3712 (2013).
40 Perez-Alonso, F. J. et al. The effect of size on the oxygen electroreduction activity of mass-selected platinum nanoparticles. Angewandte Chemie International Edition 51, 4641-4643 (2012).
16

41 Li, Z. Y. et al. Structures and optical properties of 4-5 nm bimetallic AgAu nanoparticles. Faraday Discussions 138, 363-373, doi:10.1039/b708958a (2008).
42 Yin, F., Wang, Z. W. & Palmer, R. E. Controlled Formation of Mass-Selected Cu-Au Core-Shell Cluster Beams. J. Am. Chem. Soc. 133, 10325-10327, doi:10.1021/ja201218n (2011).
43 Von Issendorff, B. & Palmer, R. E. A new high transmission infinite range mass selector for cluster and nanoparticle beams. Review of Scientific Instruments 70, 4497-4501 (1999).
44 Li, D. G. et al. Surfactant Removal for Colloidal Nanoparticles from Solution Synthesis: The Effect on Catalytic Performance. ACS Catalysis 2, 1358-1362, doi:10.1021/cs300219j (2012).
45 Solla-Gullon, J., Montiel, V., Aldaz, A. & Clavilier, J. Electrochemical characterisation of platinum nanoparticles prepared by microemulsion: how to clean them without loss of crystalline surface structure. J. Electroanal. Chem. 491, 69-77, doi:10.1016/s0022-0728(00)00306-5 (2000).
46 Cuenya, B. R., Baeck, S. H., Jaramillo, T. F. & McFarland, E. W. Size- and support-dependent electronic and catalytic properties of Au-0/Au3+ nanoparticles synthesized from block copolymer micelles. J. Am. Chem. Soc. 125, 12928-12934, doi:10.1021/ja036468u (2003).
47 Reichl, R. & Gaukler, K. H. An Investigation of Air-grown Yttrium Oxide andExperimental Determination of the Sputtering Yield and the Inelastic Mean Free Path. Applied Surface Science 26, 196-210 (1986).
48 Shao-Horn, Y. et al. Instability of supported platinum nanoparticles in low-temperature fuel cells. Top. Catal. 46, 285-305 (2007).
49 Choi, S. I. et al. Synthesis and Characterization of 9 nm Pt-Ni Octahedra with a Record High Activity of 3.3 A/mg(Pt) for the Oxygen Reduction Reaction. Nano Lett. 13, 3420-3425, doi:10.1021/nl401881z (2013).
50 Nesselberger, M. et al. The Particle Size Effect on the Oxygen Reduction Activity of Pt Catalyts: Influence of Electrolyte and Relation to Single Crystal Models. J. Am. Chem. Soc. 133, 17428-17433, doi:10.1021/ja207016u (2011).
17


Understanding the trends in activity and stability of Pt-based cathode electrocatalysts for low-temperature fuel cells
María Escudero-Escribano, Paolo Malacrida, Ulrik Grønbjerg, Vladimir Tripkovic, Jan Rossmeisl, Ifan E.L. Stephens, Ib Chorkendorff
Department of Physics, Technical University of Denmark, 2800 Kgs. Lyngby, Denmark
Abstract
A combination of electrochemical experiments, X-ray characterisation techniques and theoretical modelling has been used to study the trends in activity and stability of alloys of Pt and lanthanides and alkaline earth metals as electrocatalysts for the oxygen reduction reaction (ORR). Pt5Tb presents the highest ORR activity ever measured for a sputter-cleaned polycrystalline Pt-alloy, showing a 6-fold activity enhancement over pure polycrystalline Pt. All the Pt-alloys studied show at least a 3-fold enhancement in activity, being more active than traditionally reported alloys of Pt and late transition metals in the polycrystalline form. Angle-resolved X-ray photoelectron spectroscopy (AR-XPS) measurements confirm that, in all cases, a Pt overlayer with a thickness of few Pt layers is formed after electrochemistry. Accordingly, the effect of alloying Pt is to impose strain onto the Pt overlayer. Moreover, the experimental activity of the Pt-alloy cathode electrocatalysts versus the bulk a lattice parameter measured by X-ray diffraction (XRD) shows a volcano relationship with the top of the volcano close to Pt5Tb. All the reported candidates are not only very active, but also highly stable. Furthermore, we show, for the first time, the trends in stability for Pt-alloys catalysts for the ORR, the stability decreasing as the compressive strain increases. On the basis of the AR-XPS experiments, a model for the estimation of the thickness of the Pt overlayer is developed .It shows that the thickness of the overlayer after the stability test increases as the bulk lattice parameter decreases (i.e., the Pt-Pt distance of the Pt overlayer decreases), in agreement with our experimental results. Therefore, this work demonstrates that we can engineer not only the activity but also the stability of our materials by tuning the Pt-Pt distance of the Pt overlayer.