Redox behaviour of Menadiol derivative at glassy carbon electrode
ELSEVIER Journal of Electroanalytical Chemistry 423 (1997) 67-81
JOUnlq~. Of
SERS investigation of the adsorption and electroreduction of 4-cyanopyridine on a silver electrode l
Chongtie Shi, Wei Zhang, Ronald L. Birke *, John R. Lombardi Department of Chemistn; The CiD" College of The Cio' Universi~ of New York, New York, NY 1003, USA
Received 2 January 1996; revised 24 May 1996
Abstract
Time-resolved surface-enhanced Raman scattering (TR-SERS) has been used to study the adsorption and reduction of 4-cyanopyridine (4-CNPY) in non-buffered 0. I M KCi aqueous solutions on an Ag electrode. At electrode potentials of -0.1 to -0 .6 V vs. SCE, well before the reduction process occurs, the nature of the adsorbed species depends on both the solution concentration and the time following an oxidation-reduction process. At 20.0 mM 4-CNPY a dimer or aggregated surface species which forms dynamically on the surface is deduced from the SERS spectra, whereas at 1.0 mM and below a monomer species oriented vertically to the surface and attached end-on through the ring nitrogen is deduced. A pump-probe TR-SERS method with an applied potential pump and a CW 488 nm optical probe was used to investigate the electrode potential region where the reduction process occurred, > -1 .2 V vs. SCE. In the more dilute solutions, SERS spectra showed that pyridine and CN- are the products of the electrode reaction, whereas at concentrations of 10mM and above the TR-SERS spectra indicated that a bimolecular reaction occurred with the most likely product being azo-4-methylpyridine. Rate constants for reaction steps in both the monomolecular and bimolecular processes are estimated. © 1997 Elsevier Science S.A.
Keywords: 4-Cyanopyridine; Silver electrode; Surface-enhanced Raman scattering; Adsorption; Electroreduction
I. Introduction
As a sensitive surface probe, surface-enhanced Raman scattering (SERS) spectroscopy can be used to obtain molecular information about species on a SERS active surface [1,2]. It has often been utilized to investigate the adsorption processes of molecules [2-5] and the electro- chemical oxidation/reduction processes of organic com- pounds [2,6-I0] on an Ag surface. Intermediates which are stable at special potentials have been observed by steady- state SERS measurements [6-10]. Less information has been obtained with SERS studies concerning short-lived intermediates and kinetics in the elucidation of the mecha- nism of the electroreduction of organic compounds. In previous studies, we have endeavored to probe such inter- mediates and time-dependent processes in the electroreduc- tion of p-nitrobenzoic acid [ 11,12], and the present paper is
* Corresponding author. i It gives us great pleasure to dedicate this paper on the use of surface
enhanced Raman scattering spectroscopy as a tool for the study of the electrochemistry of organic compounds to Professor Petr Zuman who has done so much to advance the field of organic electrochemistry.
a continuation of this type of investigation. Herein, time- resolved SERS is used to study the adsorption and elec- troreduction of 4-cyanopyridine on an Ag electrode, and mechanistic information about these processes is obtained.
Current-potential curves suggest that on a Hg electrode 4-cyanopyridine (4-CNPY) undergoes a four-electron re- duction to 4-aminomethylpyridine in acidic buffered solu- tions and a two-electron reduction to pyridine and cyanide in alkaline buffers [13,14]. In situations which are neither strongly acidic nor strongly basic, the number of electrons transferred during the reduction is between two and four, i.e. both products are formed. However, in an unbuffered solution the cyclic voltammetric results show only one reduction wave, peaking at about - 1 . 4 V on a SERS active Ag electrode [15]. The reduction product suggested in the literature by Furukawa et al. [16] from the SERS results i.~0 pyridine. SERS studies of 4-CNPY at potentials positive of the electroreduction by Takahashi and cowork- ers [17-19] indicate that the orientation of the adsorbed species is affected by the solution concentration, the elec- trode potential and the type of solvent. Rubim [20] also investigated 4-CNPY with SERS on an A~, electrode and found evidence from the - C N stretching mode of the
0022-0728/97/$17.00 Copyright © 1997 Elsevier Science S.A. All rights reserved. PI! S0022-0728(96)048 ! 0-3
68 C. Shiet al. / Journal of Electroanalytical Chemisto, 423 (1997) 67-81
4-CNPY that at very low concentrations (less than 1 × 10 -4 M) the molecule lies flat on the surface, whereas at higher concentrations the molecule adsorbs in an end-on orientation. He also inferred from the SERS spectra the existence of the radical anion species. Previous studies did not investigate in any detail the time-dependent behavior of the SERS spectra occurring at potentials both positive and negative of the region of the onset of electroreduction.
We have used transient SERS methods to study the time-dependent nature of the adsorption process of 4-CNPY on Ag, in the former case, and the mechanism of the electroreduction process in the latter case. The results of these studies show that the mechanisms are much more complicated than revealed by previous steady-state SERS methods. We find that even at potentials positive of where the electroreduction takes place, time-dependent SERS spectra show an adsorption process which can yield either a monomer or an aggregated adsorbed species depending on the solution concentration. The latter species is most likely the dimer. When the potential is moved to the region of electroreduction, the electrode process is also found to depend on the solution concentration of 4-CNPY. At 1.00 mM 4-CNPY, SERS spectra show that pyridine and CN- are the products of the electrode reaction, as also reported earlier by Furukawa et al. [16]. In contrast, at 20.0 mM 4-CNPY our SERS spectral study indicates that the product of the electrode reaction is formed by a bimolecular homogeneous chemical reaction following an electron transfer process.
2. Experimental
2. I. Set-up and chemicals
A Spectra Physics Ar + Model 164 laser at 488 nm was used as a light source. The SERS detecting system in- cluded a three-electrode electrochemical cell with a 99.99% pure Ag working electrode, a Pt counter electrode and a saturated calomel electrode (SCE) as the reference elec- trode. All potentials quoted in this paper are versus the SCE. The electrochemical cell contained an optical win- dow from which the scattered Raman light was collected in a right angle geometry and focused by two large diame- ter, short focal length lenses on the entrance slit of a SPEX 1877 triplemate spectrometer (SPEX Industries, Inc.). In our instrumental set-up a linear diode array photodetector (EG&G PARC, model 1455XC) with 512 diode channels was mounted on the triplemate and controlled by software on a Macintosh Plos computer through an optical multi- channel analyzer (OMA) interface (EG&G PARC, models 1461 and 1304). The detector dwell time (data acquisition time), time delay, and number of repeating cycles were controlled by the software in a gated detection scheme. The frequency resolution of this system was two wavenumbers per diode channel. The potential on the
working electrode was controlled by a potentiostat (EG & G PARC, model 173) and a waveform generator (EG&G PARC, model 175).
4-Cyanopyridine (98%), 4-aminomethylpyridine (98%), 4,4'-bipyridyl hydrate (98%) and 4-pyridinecarboxalde- hyde (98%) were purchased from the Aldrich Chemical Company, Inc. and pyridine was purchased from Mallinck- rodt Inc. The 4-cyanopyridine was recrystallized from deionized-distilled water before use. All solutions were made with deionized-distilled water containing 0.1 M reagent grade KCI.
2.2. Procedure
The adsorption and electroreduction processes of 4- CNPY on an Ag electrode were studied by steady-state SERS as a function of electrode potential and by time-re- solved surface-enhanced Raman spectroscopy (TR-SERS). The 488nm line of the Ar ÷ laser was used as a probe beam. The laser output power was about 200mW, with about 80 mW reaching the electrode surface. Before SERS spectra were taken, the Ag electrode was polished with Buehler micropolish II 0.3 p,m alumina, ultrasonicated and washed in deionized-distilled water, and then pretreated by an oxidation-reduction cycle (ORC). In situ pretreat- ment was carried out in solutions with the Raman active compound present, while ex situ pretreatment was carried out in a solution with only pure 0.1 M KCI. The electro- chemical cell was purged with prepurified nitrogen to remove oxygen before all measurements.
The dwell time for each spectrum varied from 100 lxs to several seconds, depending on the experiment. In order to check whether the cause of changes in the SERS spectra was an electrochemical effect or a laser-induced photoelec- trochemical effect, the SERS spectrum at a given potential was taken at a surface spot which had been irradiated by the laser light for a long time and compared with the spectrum obtained from a new spot on the electrode sur- face which had not been irradiated before the SERS mea- surement. Unless stated otherwise, the SERS spectra were invariant under the two conditions.
A voltage-pump Raman probe (pump-probe) SERS method was used to study the TR-SERS in the microsec- ond time regime under conditions where an electrochemi- cal reaction occurs. In this method, a potential step was used to initiate the electrode reaction and a CW 488nm probe beam was used to excite the SERS spectrum. A pump-probe program with 1000 repetitions in which the model 175 waveform generator triggered the model 1461 OMA interface was used to obtain the spectrum at each delay time with a cleaning pulse on every cycle. In this method, a potential step cycle is used where the initial applied potential is at a rest potential ( - 0 . 4 V) where no electron transfer reaction occurs, a cleaning step follows to + 0.15 V for a time which varies from 2.5 to 5.0 ms, and then the potential is stepped back to - 0 . 4 V for a rest
C. Shi et al . / Journal of Electroanalytical Chemistry. 423 (1997) 67-81 69
period of 30.0 to 40.0 ms where adsorption occurs. The potential is then stepped to a value where an electrode reaction occurs ( - 1 . 2 V ) for a given delay time, after which the spectrum is measured with a dwell time of 100 Vs. The entire potential cycle was fixed at 40.0ms so that one spectrum in the microsecond time domain took 40.0 s to acquire.
3. Results and discussion
3.1. Concentration dependence and band assignment of 4-CNPY SERS spectra
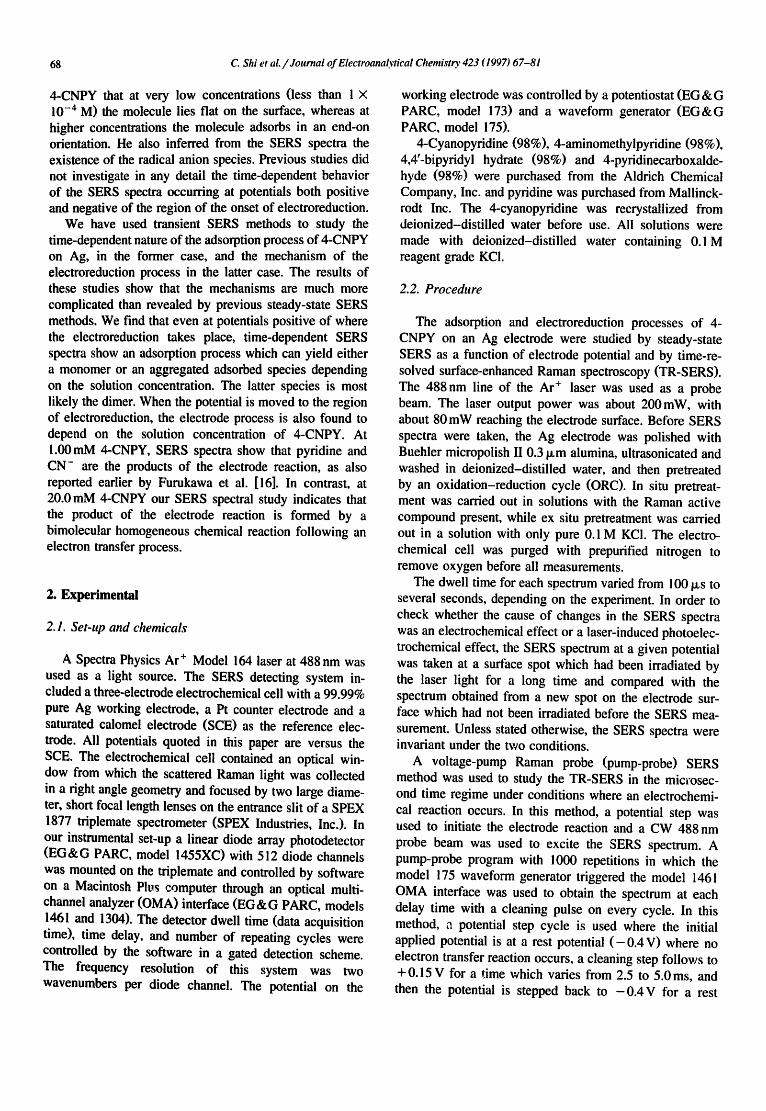
Fig. 1 shows SERS spectra of 4-CNPY at - 0 . 4 V in 0. I M KC! at different concentrations. Basically, two types of spectrum were found which can be related to either a dilute or a concentrated CNPY solution condition respec- tively. One type of spectrum, called type A, tbund for dilute solutions ( l . 0mM or less) is assigned to a simple 4-CNPY molecule or monomer, while the other type of spectrum, called type B, found for the more concentrated solutions (10 to 20mM) is assigned to a dimer or an
20.0 mM
lO.OmM
5.0 mbl
aggregate species. In a solution of 1.0mM CNPY and 0.1 M KCI, the monomer type spectrum A (curve (a) in Fig. l) has bands at 1605, 1502, 1410, 1372, 1214, 1064 and 1008cm -t The spectrum shows two very strong bands at 1605 and 1008cm - l , three medium strength bands at 1502, 1410 and 1214cm - t , and three weak bands at 1372, 1261 and 1064cm -t in the spectral window. The putative dimer or aggregate type spectrum B (curve (d) or (e) in Fig. 1), obtained in concentrated CNPY solutions, has bands at 1600, 1520, 1472, 1450, 1345, 1261, 1208, 1064, 1006, 970 and 847 cm - l . This spectrum shows four very strong bands at 1600, 1520, 1208 and 970cm -1, two medium strength bands at 1261 and 1006 cm- t, one weak band at 1450 cm - t , and several very weak bands at 1472, 1430, 1064 and 847 cm -1. These two types of spectrum share some of the Raman bands, such as the 1600, 1208 and 1006 cm- t bands. However, the 1502 and 1410 cm- i bands belong distinctively to the monomer type spectrum, while the 1520, 1261, 970 and 847cm -I bands belong to the spectra found in more concentrated solutions, which are possibly related to a dimer or an aggregate species. The SERS spectra obtained in intermediate concentrations, such as 2.5 and 5.0 mM CNPY, show a combination of bands from the two distinct types.
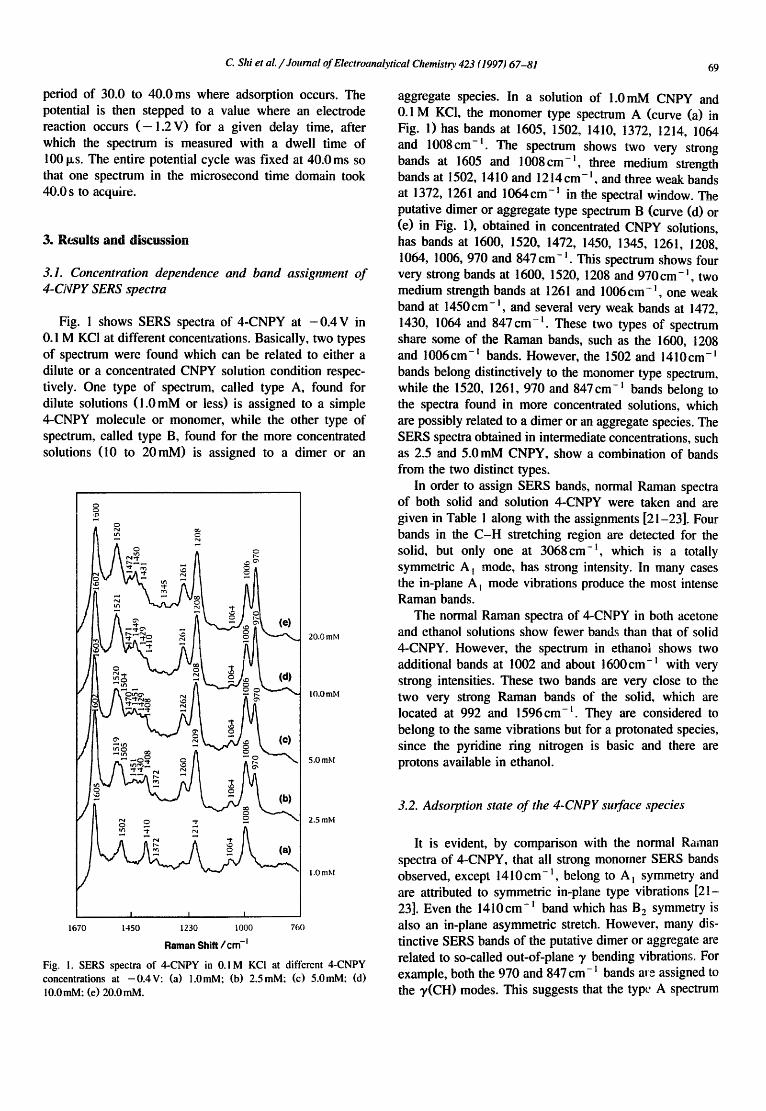
In order to assign SERS bands, normal Raman spectra of both solid and solution 4-CNPY were taken and are given in Table l along with the assignments [21-23]. Four bands in the C - H stretching region are detected for the solid, but only one at 3068cm -t , which is a totally symmetric A t mode, has strong intensity. In many cases the in-plane A t mode vibrations produce the most intense Raman bands.
The normal Raman spectra of 4-CNPY in both acetone and ethanol solutions show fewer bands than that of solid 4-CNPY. However, the spectrum in ethanol shows two additional bands at 1002 and about 1600cm-I with very strong intensities. These two bands are very close to the two very strong Raman bands of the solid, which are located at 992 and 1596cm-t They are considered to belong to the same vibrations but for a protonated species, since the pyridine ring nitrogen is basic and there are protons available in ethanol.
2.5 mM
!.0 mM
I I I
1670 1450 1230 1000 760
Raman S h i f t / c m -I
Fig. 1. SERS spectra o f 4-CNPY in 0.1 M KCI at different 4-CNPY
concentrations at -0.4V: (a) 1.0mM; (b) 2.5mM; (c) 5.0raM; (d) 10.0mM: (e) 20.0mM.
3.2. Adsorption state of the 4-CNPY surface species
It is evident, by comparison with the normal Raman spectra of 4-CNPY, that all strong monomer SERS bands observed, except 1410cm - t , belong to A t symmetry and are attributed to symmetric in-plane type vibrations [21- 23]. Even the 1410cm-I band which has B 2 symmetry is also an in-plane asymmetric stretch. However, many dis- tinctive SERS bands of the putative dimer or aggregate are related to so-called out-of-plane T bending vibration~. For example, both the 970 and 847 cm-! bands are assigned to the T(CH) modes. This suggests that the type A spectrum
7 0 C. Shi et al. / Journal of Electroanalytical Chemistry. 423 (1997) 67-81
e ~
Z u
ua
0
("4 p ~
~ e q
( .q m . ~
P~ I "~ ~ ~t%
m ¢,
"2
.o
o
°
0
• ~- o
° ' ~ e ~ t... o ~
C. Shi et a l . / Journal cf Electroanalytical Chemist~. 423 (1997) 67-81 71
I.~'-
Q~ taJ e~ ' ( b )
o.e.
o.e.
0 100 200 ~ 400
C 2 ImM 2
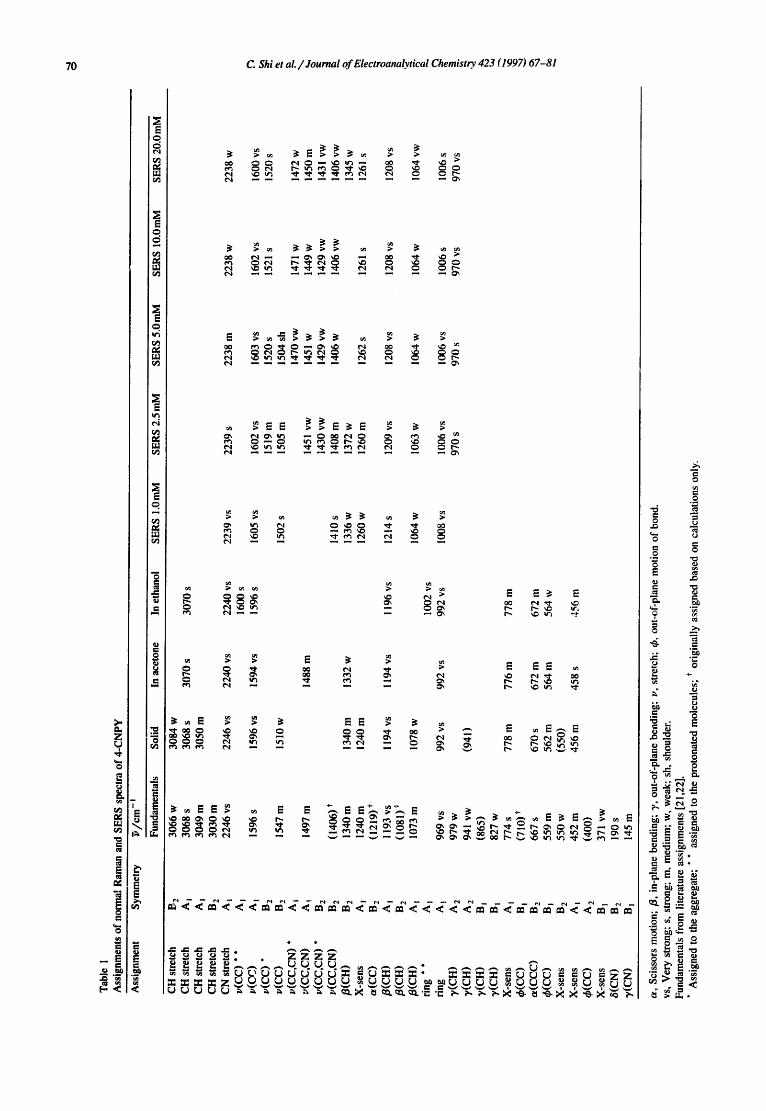
Fig. 2. Concentration dependence of relative SERS intensity of 4-CNPY in 0.1M KCI solutions at -0 .4V: (a) bands 970/1006; (b) bands ! 520/! 006.
1,6
1.4-
corresponds to a monomer species which is adsorbed via its pyridine ring nitrogen on the Ag electrode vertically to a surface plane, since the laser EM field is strongly enhanced for in-plane motions of vertically oriented molecules [ 1 ]. In contrast, the putative dimer or ag~egate spectrum corresponds to a species which is oriented paral- lel or partly parallel to the electrode surface. Additional evidence for this conclusion is that the relative intensity of the CN triple bond stretching with frequency at 2239 cm- decreases with increasing 4-CNPY concentration. The ver- tical orientation of tht3 CN triple bond produces the most intense band, and the parallel orientation produces a much weaker band [24]. Thus the surface concentration of the species taking a parallel or partly parallel orientation in- creases with the bulk 4-CNPY concentration. The relative intensity of the 970 cm- ~ band with respect to the adjacent 1006 cm- t band shows a ~trong concentration dependence, increasing with 4-CNPY concentration. A linear relation- ship is found between the relative intensity and the square of the concentration for band ratios 970/1006 and 1520/1006 when the concentration is smaller than 0.01 M (Fig. 2). This linear relationship is consistent with the formation of a dimer as the bulk concentration increases.
When the electrode is pretreated ex situ in a solution containing only 0.1 M KCI and then dipped into a 0.02 M 4-CNPY solution, the putative dimer or aggregate spec- trum is also observed. An interesting phenomenon is that in 2.5 mM CNPY solutions a type A spectrum is observed after the first two ORC pretreatments, and a combination of types A and B is obtained after another two ORCs. This suggests that in this particular situation the dimer or aggregate is probably formed on the electrode surface when the ORCs produce more adsorption sites for attrac- tion of 4-CNPY molecules from solution.
If the dimer or aggregate does exist, at least on the electrode surface, one possible orientation is that where one of the CNPY molecules adsorbs on the Ag electrode surface vertically through the pyridine ring nitrogen and the other CNPY molecule orients parallel. However, if this
is true the spectrum for the vertically adsorbed species should always be more intense or at least have the same intensity as the spectrum for the parallel oriented species. In fact, in concentrated solutions the spectrum with intense out-of-plane bands overwhelms the vertically oriented spectrum. It seems more likely then that the two adjacent 4-CNPY molecules lie face-to-face but with two cyano groups in opposite directions, so that their dipole moments compensate for each other. Two possible orientations for such a dimer on an electrode surface are face-on and tilted. In both situations the out-of-plane vibration bands should be observed with strong intensity. However, it seems that the tilted orientation is more reasonable, since although the dipole moments are canceled out in the dimer, the elec- trode surface still experiences a local dipole moment of the molecule attached to it. Of course, the local dipole moment will be much weaker than the dipole moment of the individual CNPY molecule because it is partially canceled by the d~ipole moment of the other molecule in the dimer. This model can also be thought of as an aggregate when the surface concentration of the dimers is very high.
3.3. Time dependence of 4-CNPY SERS spectra at poten- tials before the onset of electroreduction
The time-dependent SERS spectra of 4-cyanopyridine were taken in non-buffered aqueous solutions with 0.I M KCI as supporting electrolyte. The pretreatment was per- formed by starting from a variety of different potentials and stepping to + 0.3 V for 2.0 s, with laser light irradiat- ing the electrode surface, and then returning to the starting potential in solutions containing 0.02 M 4-CNPY. Experi- ments without laser irradiation during the ORC were car- ried out for comparison and are discussed later in this paper. Immediately after the pretreatment pulse, the SERS spectra were taken consecutively.
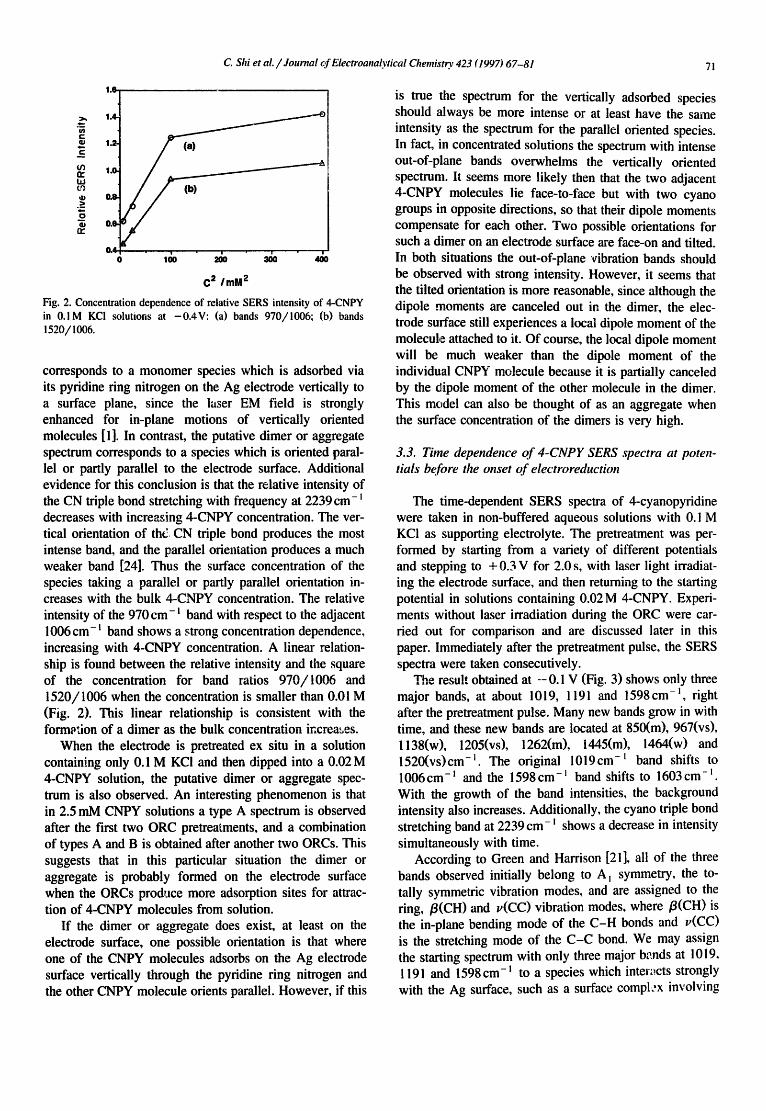
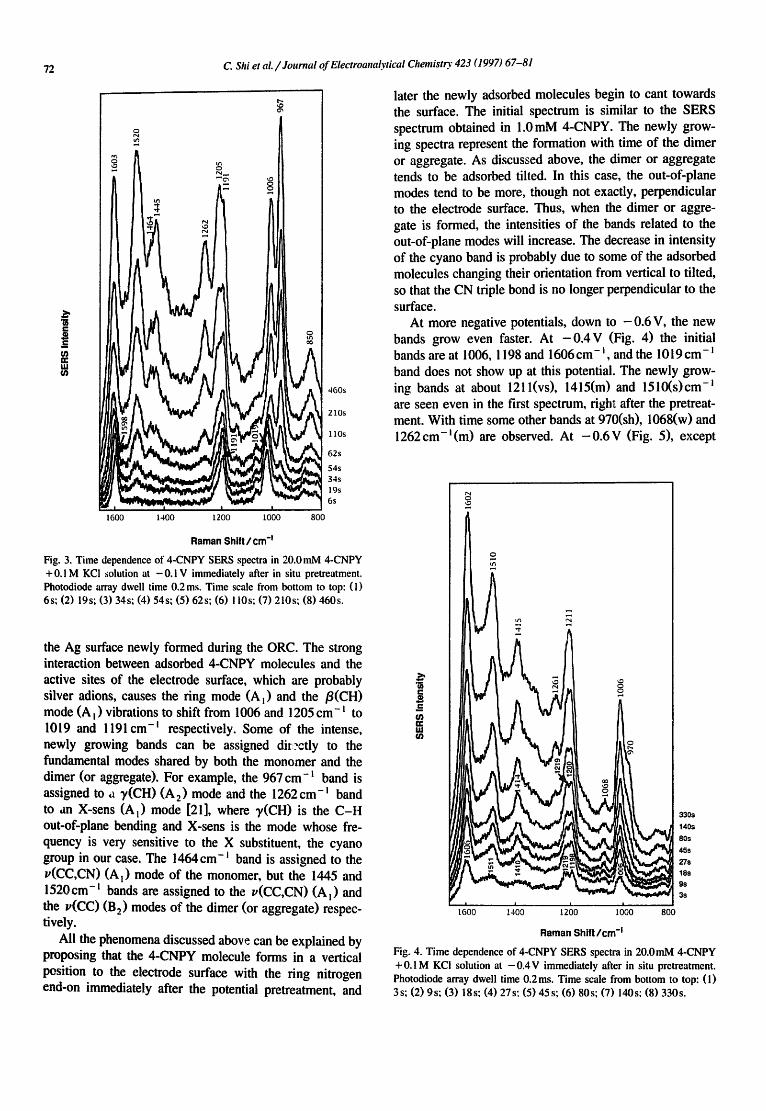
The result obtained at --0.1 V (Fig. 3) shows only three major bands, at about 1019, 1191 and 1598cm -~, right after the pretreatment pulse. Many new bands grow in with time, and these new bands are located at 850(m), 967(vs), 1138(w), 1205(vs), 1262(m), 1445(m), 1464(w) and 1520(vs)cm -l . The original 1019cm -~ band shifts to 1006 cm- l and the 1598 cm- ~ band shifts to 1603 cm- ~. With the growth of the band intensities, the background intensity also increases. Additionally, the cyano triple bond stretching band at 2239 cm- t shows a decrease in intensity simultaneously with time.
According to Green and Harrison [21], all of the three bands observed initially belong to A~ symmetry, the to- tally symmetric vibration modes, and are assigned to the ring, /3(CH) and v(CC) vibration modes, where /3(CH) is the in-plane bending mode of the C-H bonds and v(CC) is the stretching mode of the C - C bond. We may assign the starting spectrum with only three major be.nds at 1019, 1191 and 1598cm -~ to a species which inter::cts strongly with the Ag surface, such as a surface compl:x involving
72 C. Shi et aL / Journal of Electroanalytical Chemisto" 423 (1997) 67-81
¢J I-
c~ n- LU C~
1600 1400 1200 1000 800
4 6 0 s
210s
1 lOs
6 2 s
S4s
34s
19s
6 s
Raman Shift / cm "l
Fig. 3. Time dependence of 4-CNPY SERS spectra in 20.0 mM 4-CNPY +0.1M KCI solution at -0.1 V immediately after in situ pretreatment. Photodiode array dwell time 0.2 ms. Time scale from bottom to top: (1) 6s; (2) 19s; (3) 34s; (4) 54s; (5) 62s; (6) l i0s; (7) 210s; (8) 460s.
the Ag surface newly formed during the ORC. The strong interaction between adsorbed 4-CNPY molecules and the active sites of the electrode surface, which are probably silver adions, causes the ring mode (A t) and the /3(CH) mode (A~) vibrations to shift from 1006 and 1205 cm-~ to 1019 and 1191 cm -~ respectively. Some of the intense, newly growing bands can be assigned diL-ctly to the fundamental modes shared by both the monomer and the dimer (or aggregate). For example, the 967 cm-~ band is assigned to u ~(CH) (A 2) mode and the 1262 cm-i band to an X-sens (A l) mode [21], where ~/(CH) is the C-H out-of-plane bending and X-sens is the mode whose fre- quency is very sensitive to the X substituent, the cyano group in our case. The 1464cm-i band is assigned to the v(CC,CN) (A l) mode of the monomer, but the 1445 and 1520cm-t bands are assigned to the v(CC,CN) (A l) and the v(CC) (B 2) modes of the dimer (or aggregate) respec- tively.
All the phenomena discussed above can be explained by proposing that the 4-CNPY molecule forms in a vertical position to the electrode surface with the ring nitrogen end-on immediately after the potential pretreatment, and
later the newly adsorbed molecules begin to cant towards the surface. The initial spectrum is similar to the SERS spectrum obtained in 1.0 mM 4-CNPY. The newly grow- ing spectra represent the formation with time of the dimer or aggregate. As discussed above, the dimer or aggregate tends to be adsorbed tilled. In this case, the out-of-plane modes tend to be more, though not exactly, perpendicular to the electrode surface. Thus, when the dimer or aggre- gate is formed, the intensities of the bands related to the out-of-plane modes will increase. The decrease in intensity of the cyano band is probably due to some of the adsorbed molecules changing their orientation from vertical to tilted, so that the CN triple bond is no longer perpendicular to the surface.
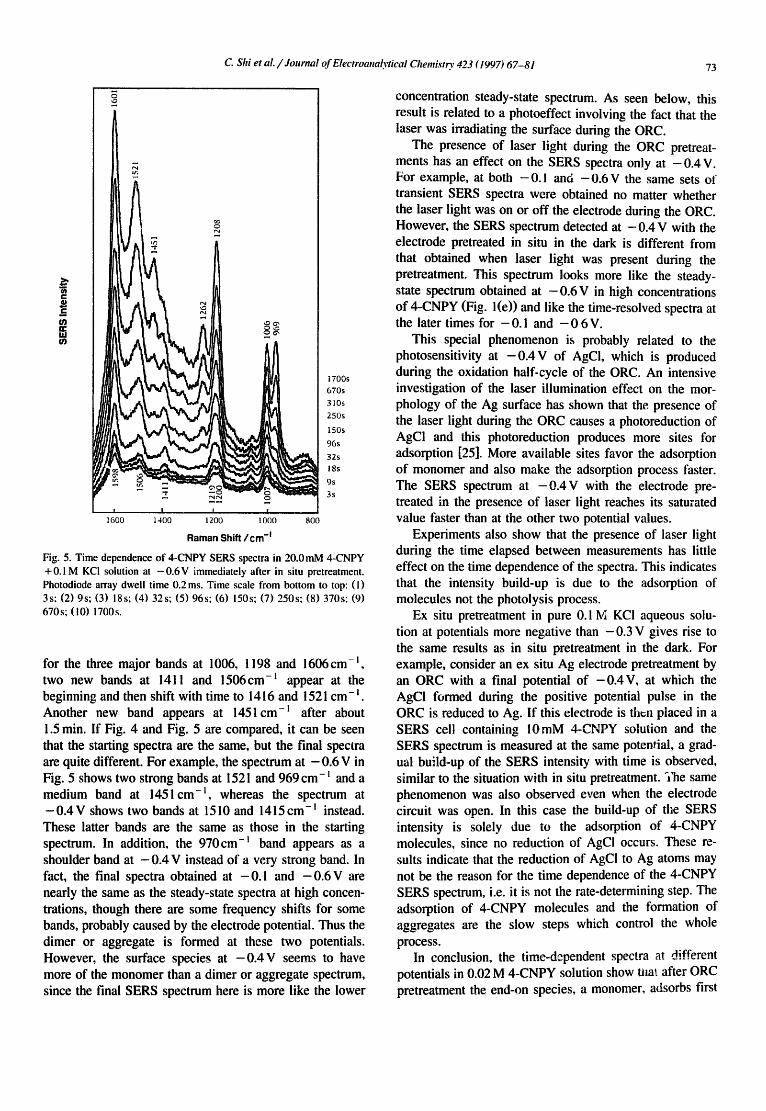
At more negative potentials, down to -0 .6 V, the new bands grow even faster. At - 0 . 4 V (Fig. 4) the initial bands are at 1006, I 198 and 1606 cm- ~, and the l 019 cm- l band does not show up at this potential. The newly grow- ing bands at about 1211(vs), 1415(m) and 1510(s)cm -I are seen even in the first spectrum, righ~ after the pretreat- ment. With time some other bands at 970(sh), 1068(w) and 1262 cm- l (m) are observed. At - 0.6 V (Fig. 5), except
U)
Ill t/)
1600 1400 1200 1000
R a m a n S h i f t / c m - I
330s
140s
80s
45s
27s 18s gs 3s
8OO
Fig. 4. Time dependence of 4-CNPY SERS spectra in 20.0mM 4-CNPY + 0.1 M KCI solution at - 0 . 4 V immediately after in situ pretreatment. Photodiode array dwell time 0.2 ms. Time scale from bottom to top: ( l ) 3s; (2) 9s; (3) 18s; (4) 27s; (5) 45s; (6) 80s; (7) 140s, (8) 330s.
C. Shiet al. / Journal of Electroanalyticai Chemistry 423 (1997) 67-81 73
U"o
e . ,
_= ¢D
ILl
16oo ~4oo lzoo looo 800
Raman S h i R / c m - I
1700s 670s 310s 250s
150s 96s 32s 18s 9s 3s
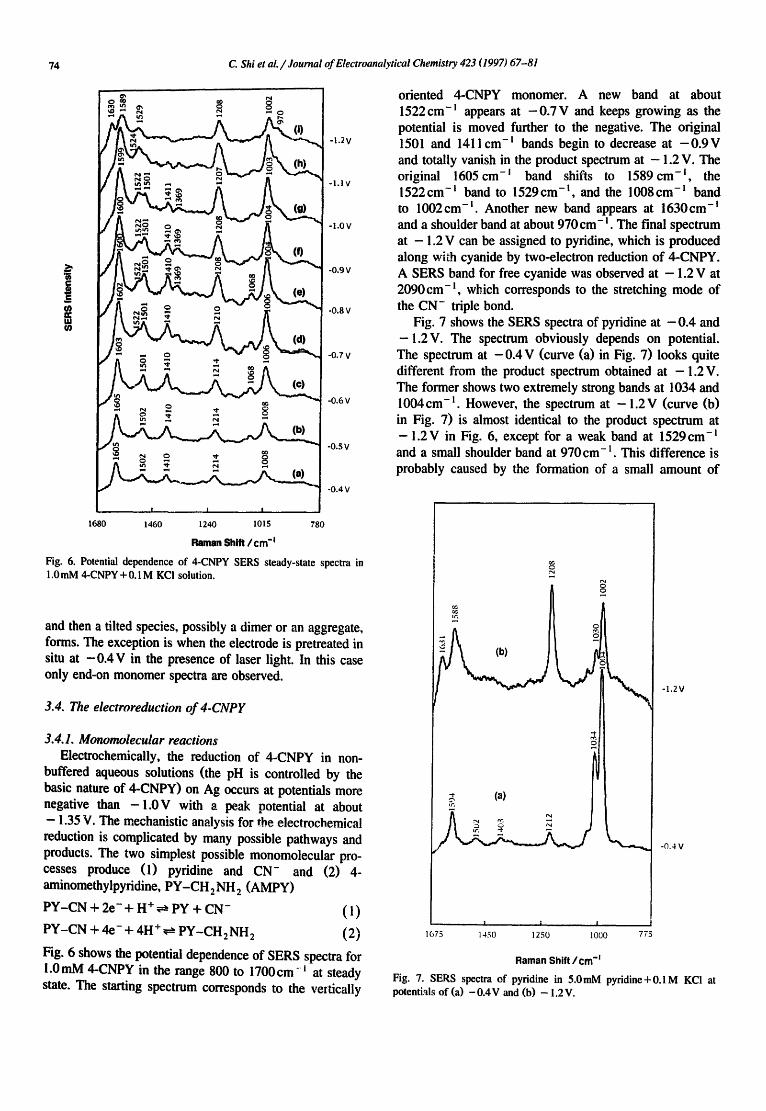
Fig. 5. Time dependence of 4-CNPY SERS spectra in 20.0mM 4-CNPY +0.1 M KCI solution at - 0 . 6 V immediately after in situ pretreatment. Photodiode array dwell time 0.2 ms. Time scale from bottom to top: (1) 3s: (2) 9s; (3) 18s; (4) 32s; (5) 96s; (6) 150s; (7) 250s; (8) 370s; (9) 670s; (10) 1700s,
for the three major bands at 1006, 1198 and 1606 cm- I, two new bands at 1411 and 1506cm- ~ appear at the
- i beginning and then shift with time to 1416 and 1521 cm Another new band appears at 1451 cm -~ after about 1.5 min. If Fig. 4 and Fig. 5 are compared, it can be seen that the starting spectra are the same, but the final spectra are quite different. For example, the spectrum at - 0.6 V in Fig. 5 shows two strong bands at 1521 and 969cm-I and a medium band at 1451 cm -~, whereas the spectrum at - 0 . 4 V shows two bands at 1510 and 1415cm -~ instead. These latter bands are the same as those in the starting spectrum. In addition, the 970cm-~ band appears as a shoulder band at - 0 . 4 V instead of a very strong band. In fact, the final spectra obtained at - 0.1 and - 0.6 V are nearly the same as the steady-state spectra at high concen- trations, though there are some frequency shifts for some bands, probably caused by the electrode potential. Thus the dimer or aggregate is formed at these two potentials. However, the surface species at - 0 . 4 V seems to have more of the monomer than a dimer or aggregate spectrum, since the final SERS spectrum here is more like the lower
concentration steady-state spectrum. As seen below, this result is related to a photoeffect involving the fact that the laser was irradiating the surface during the ORC.
The presence of laser light during the ORC pretreat- ments has an effect on the SERS spectra only at - 0 . 4 V. For example, at both -0 .1 an6 - 0 . 6 V the same sets of transient SERS spectra were obtained no matter whether the laser light was on or off the electrode during the ORC. However, the SERS spectrum detected at - 0 . 4 V with the electrode pretreated in situ in the dark is different from that obtained when laser light was present during the pretreatment. This spectrum looks more like the steady- state spectrum obtained at - 0 . 6 V in high concentrations of 4-CNPY (Fig. l(e)) and like the time-resolved spectra at the later times for - 0.1 and - 0 6 V.
This special phenomenon is probably related to the photosensitivity at - 0 . 4 V of AgCi, which is produced during the oxidation half-cycle of the ORC. An intensive investigation of the laser illumination effect on the mor- phology of the Ag surface has shown that the presence of the laser light during the ORC causes a photoreduction of AgCI and this photoreduction produces more sites for adsorption [25]. More available sites favor the adsorption of monomer and also make the adsorption process faster. The SERS spectrum at - 0 . 4 V with the electrode pre- treated in the presence of laser light reaches its saturated value faster than at the other two potential values.
Experiments also show that the presence of laser light during the time elapsed between measurements has little effect on the time dependence of the spectra. This indicates that the intensity build-up is due to the adsorption of molecules not the photolysis process.
Ex situ pretreatment in pure 0.1 M KC! aqueous solu- tion at potentials more negative than - 0 . 3 V gives rise to the same results as in situ pretreatment in the dark. For example, consider an ex situ Ag electrode pretreatment by an ORC with a final potential of - 0 . 4 V , at which the AgCI formed during the positive potential pulse in the ORC is reduced to Ag. If this electrode is then placed in a SERS cell containing 10raM 4-CNPY solution and the SERS spectrum is measured at the same potential, a grad- ual build-up of the SERS intensity with time is observed, similar to the situation with in situ pretreatment. The same phenomenon was also observed even when the electrode circuit was open. In this case the build-up of the SERS intensity is solely due to the adsorption of 4-CNPY molecules, since no reduction of AgCI occurs. These re- sults indicate that the reduction of AgC! to Ag atoms may not be the reason for the time dependence of the 4-CNPY SERS spectrum, i.e. it is not the rate-determining step. The adsorption of 4-CNPY molecules and the formation of aggregates are the slow steps which control the whole
process. In conclusion, the time-dependent spectra at different
potentials in 0.02 M 4-CNPY solution show that after ORC pretreatment the end-on species, a monomer, adsorbs first
74 C Shi et aL / Journal of Electroanalytical Chemistry 423 (1997) 67-81
,7, -' ~ _ ° o
, -
"
i
L h ~ ; - ,o'
- I . 2 V
- I . I V
-1.0 V
-0.9 V
-0.8 V
-0.7 V
-0.6 V
-0.5 V
-0.4 V
l I I I I
1680 1460 1240 1015 780
Raman S h l t t / c m " l
Fig. 6. Potential dependence of 4-CNPY SERS steady-state spectra in 1.0mM 4-CNPY+0.1M KC! solution.
and then a tilted species, possibly a dimer or an aggregate, forms. The exception is when the electrode is pretreated in situ at -0 .4 V in the presence of laser light. In this case only end-on monomer spectra are observed.
3.4. The electroreduction of 4-CNPY
3.4.1. Monomolecular reactions Electrochemically, the reduction of 4-CNPY in non-
buffered aqueous solutions (the pH is controlled by the basic nature of 4-CNPY) on Ag occurs at potentials more negative than - 1 . 0 V with a peak potential at about - 1.35 V. The mechanistic analysis for the electrochemical reduction is complicated by many possible pathways and products. The two simplest possible monomolecular pro- cesses produce (1) pyridine and CN- and (2) 4- aminomethylpyridine, PY-CH 2 NH 2 (AMPY)
PY-CN + 2e- + H + ~ PY + CN- ( 1 )
PY-CN + 4e- + 4H + ~ py-CH2NH2 (2)
Fig. 6 shows the potential dependence of SERS spectra for 1.0 mM 4-CNPY in the range 800 to 1700 cm- ~ at steady state. The starting spectrum corresponds to the veltically
oriented 4-CNPY monomer. A new band at about 1522cm-~ appears at - 0 . 7 V and keeps growing as the potential is moved further to the negative. The original 1501 and 1411cm -~ bands begin to decrease at - 0 . 9 V and totally vanish in the product spectrum at - 1.2 V. The original 1605 cm- ' band shifts to 1589 cm -~, the 1522cm -~ band to 1529cm - t , and the 1008cm - l band to 1002 em- ~. Another new band appears at 1630 era- and a shoulder band at about 970 cm- ~. The final spectrum at - 1.2 V can be assigned to pyridine, which is produced along with cyanide by two-electron reduction of 4-CNPY. A SERS band for free cyanide was observed at - 1.2 V at 2090cm-m, which corresponds to the stretching mode of the CN- triple bond.
Fig. 7 shows the SERS spectra of pyridine at - 0 . 4 and -1 .2V. The spectrum obviously depends on potential. The spectrum at - 0 . 4 V (curve (a) in Fig. 7) looks quite different from the product spectrum obtained at - 1 . 2 V. The former shows two extremely strong bands at 1034 and 1004cm -l . However, the spectrum at - 1 . 2 V (curve (b) in Fig. 7) is almost identical to the product spectrum at - 1 . 2 V in Fig. 6, except for a weak band at 1529cm -l and a small shoulder band at 970 cm -~. This difference is probably caused by the formation of a small amount of
o
tr.
o
\
• -t a I ()
i 1 ; i
1 ()75 1450 1250 1000 775
-l.2V
-0.4 V
Raman Shi f t /cm "~
Fig. 7. SERS spectra of pyridine in 5.0raM pyridine +0.1 M KCI at potentials of (a) - 0 . 4 V and (b) - 1.2V.
C. Shi et al . / Journal of Electroanalytical Chemistry 423 (1997) 0;-81 75
another compound, such as a product of a bimolecular chemical coupling reaction.
Just as the adsorption state of 4-CNPY depends on the concentrations of the original starting solution, the electro- chemistry also depends on this concentration. As the con- centration increases it is more likely that bimolecular coupling reactions take place.
3.4.2. Bimolecular reactions For 4-CNPY concentrations at or above 20mM, bi-
molecular products could be thought to form through the following mechanistic scheme:
PY-CN + • ~ PY + CN
PY
PY-CN
PY-CN J
2H+,e "
PY-CH=N-N---CH-PY
4-pyridylmethyleneazin
PY-PY
4,4'-bipyridine
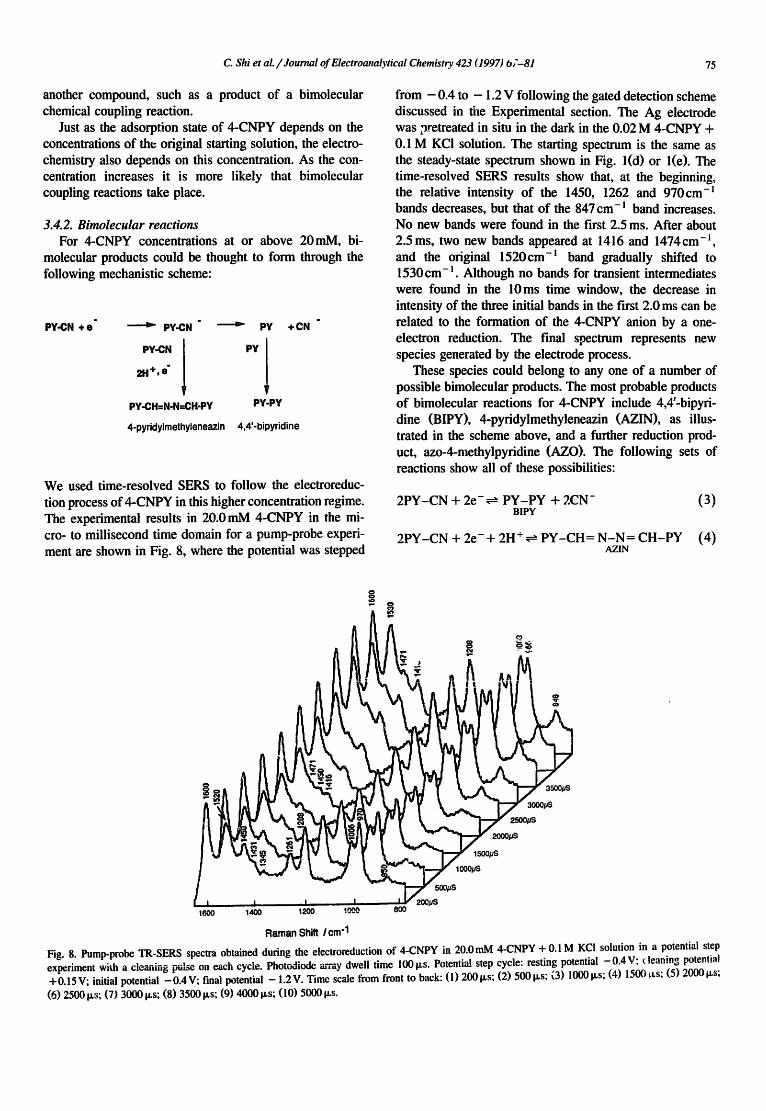
We used time-resolved SERS to follow the electroreduc- tion process of 4-CNPY in this higher concentration regime. The experimental results in 20.0 mM 4-CNPY in the mi- cro- to millisecond time domain for a pump-probe experi- ment are shown in Fig. 8, where the potential was stepped
from - 0.4 to - 1.2 V following the gated detection scheme discussed in the Experimental section. The Ag electrode was pretreated in situ in the dark in the 0.02 M 4-CNPY + 0.1 M KCI solution. The starting spectrum is the same as the steady-state spectrum shown in Fig. l(d) or l(e). The time-resolved SERS results show that, at the beginning, the relative intensity of the 1450, 1262 and 970cm -] bands decreases, but that of the 847 cm- l band increases. No new bands were found in the first 2.5 ms. After about 2.5ms, two new bands appeared at 1416 and 1474cm - l , and the original 1520cm -~ band gradually shifted to 1530cm -~. Although no bands for transient intermediates were found in the 10ms time window, the decrease in intensity of the three initial bands in the first 2.0 ms can be related to the formation of the 4-CNPY anion by a one- electron reduction. The final spectrum represents new species generated by the electrode process.
These species could belong to any one of a number of possible bimolecular products. The most probable products of bimolecular reactions for 4-CNPY include 4,4'-bipyri- dine (BIPY), 4-pyridylmethyleneazin (AZIN), as illus- trated in the scheme above, and a further reduction prod- uct, azo-4-methylpyridine (AZO). The following sets of reactions show all of these possibilities:
2PY-CN + 2 e - ~ P Y - P Y + 2 C N - (3) BIPY
2PY-CN + 2e- + 2H ÷ ~ P Y - C H = N - N = C H - P Y (4) AZIN
P
!..
I | , I I _ " " t 6 0 0 1400 1200 ! 0 0 0 Uoo
Raman Shift Icm "1
~~ ~ 7 35°°vS
25oovs
aooovs
15oovs lOOOvS
500p$
2oovs
Fig. 8. Pump-probe TR-SERS spectra obtained during the electroreduction of 4-CNPY in 20.0 mM 4-CNPY + 0.1 M KCI solution in a potential step experiment wida a cleaning pulse oil each cycle. Photodiode a-ray dwell time 100 I~s. Potential step cycle: resting potential -0 .4V: ('leaning potential + 0.15 V; initial potential - 0 .4 V; final potential - 1.2 V. Time scale from front to back: (1) 200 Ixs; (2) 500 p,s; (3) 1000 p,s; (4) 1500 ~Ls; (5) 2000 la, S;
(6) 2500 V,s; (7) 3000 ~,s; (8) 35001~s; (9) 4000 p,s; (10) 500Oils.

76 C. Shi et al. / Jottrnal of Electroanalytical Chemisto' 423 (1997) 67-81
• ,D ,~
- 1 . 2 V
-I.IV
- I .OV
been irradiated by laser light. The major difference be- tween the spectra in the more concentrated solutions and those in dilute solutions is that four bands at 1470, 1426, 1416 and 847cm-~ appear more intense in the former case (Fig. 9). This indicates that, besides pyridine, at least one other product is produced in the more, concentrated solu- tions. Most likely it is an azo compound which has a Raman band at 1416 cm-~ and comes from a bimolecular process. An assignment of the species will be made later by ruling out other possible products via a comparison of spectra.
-0.9 V
-0.8 V
-0.7 V
- 0 . 6 V
-0.5 V
3.4.3. Concentration dependence of the electroreduction products
The reduction product spectra of 4-CNPY on an Ag electrode in different CNPY concentration solutions at - 1 . 2 V are shown in Fig. 10, having evolved as the potential was swept slowly (0.33 mVs - i ) from - 0 . 4 to - 1.2 V. As mentioned above, two types of product spec- trum, one of which is related to pyridine and the other to a possible azo compound, are obtained in dilute ( l .0mM) and more concentrated (20.0mM) solutions respectively.
- 0 . 4 V
1673 1456 ] 234 1007 772
Raman Shift / cm "=
Fig. 9. Potential dependence of 4-CNPY SERS spectra in 20.0mM 4-CNPY + 0. l M KCi solution.
_c
PY-CH= N-N = C H - P Y + 2e- + 2H + AZIN
~- P Y - C H 2 - N = N - C H2-PY (5) AZO
The steady-state SERS spectra in 20.0raM solutions (Fig. 9) show changes at - 1 . 0 V, as predicted from the CV results. The original bands at 1471 and 847cm -~ begin to increase at - 1.0 V, but the 1450 and 1261 cm- bands begin to decrease. Two new bands appear at 1426 and 1417cm -~ at - 1 . 1 V and keep growing no matter whether the potential stays there or is moved further to the negative. The product spectrum obtained at - 1.2 V is the same as that in the time-resolved SERS experiment. It contains two very strong bands at 1416 and 1208cm -~ five strong bands at 1600, 1530, 1003, 989 and 966cm - l , two medium strength bands at 1471 and 847cm -~, and two strong shoulders at 1590 and 1426cm -I . The 1630cm -m band, which is present in the 1.0mM product spectrum, does not appear in this speo_mm. The SERS spectra are lost if the potential is made more negative than -1 .2 V. Even at this potential, the total intensity of the spectra is much weaker than at more positive potentials and fades with laser light. Intense spectra were obtained at a new point on the Ag electrode surface which had not
2 0 . 0 m M
10.0 mM
5.0 mlq
2.5 mM
1.0 mM
1 6 0 0 14-00 1 2 0 0 i 00O 8 0 0
Raman S h i f t / c m - j
Fig. 10. Effect of concentration on the SERS spectrum of the products of 4-CNPY reduction. Each spectrum, at the different concentrations listed in the figure, is taken at - 1.2 V; later the electrode potential was swept slowly (0.33 mV s - i ) from - 0.4 to - 1.2 V.
C Shiet aL/Journal of Electroanalyticai Chemistry 423 (1997) 67-81 77
r¢',
(a) ~
"N
] I I I
1675 1450 1225 1000 7 7 5
-I.2V
- 0 . 4 V
Raman Shift/cm -I
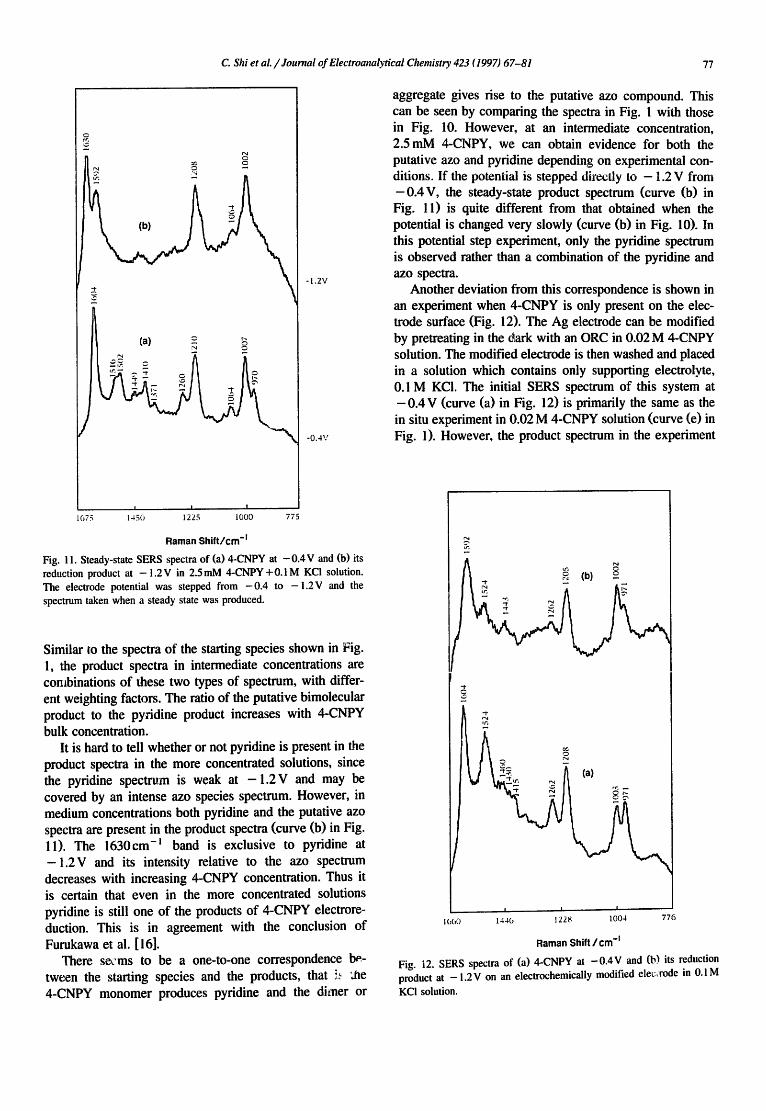
Fig. 1 !. Steady-state SERS spectra of (a) 4-CNPY at - 0 . 4 V and (b) its reduction product at - 1 . 2 V in 2.SmM 4-CNPY +0.1 M KC! solution. The electrode potential was stepped from - 0 . 4 to - 1 . 2 V and the spectrum taken when a steady state was produced.
Similar to the spectra of the starting species shown in Fig. l, the product spectra in intermediate concentrations are combinations of these two types of spectrum, with differ- ent weighting factors. The ratio of the putative bimolecular product to the pyridine product increases with 4-CNPY bulk concentration.
It is hard to tell whether or not pyridine is present in the product spectra in the more concentrated solutions, since the pyfidine spectrum is weak at - 1 . 2 V and may be covered by an intense azo species spectrum. However, in medium concentrations both pyridine and the putative azo spectra are present in the product spectra (curve (b) in Fig. l 1). The 1630cm -l band is exclusive to pyridine at - 1 . 2 V and its intensity relative to the azo spectrum decreases with increasing 4-CNPY concentration. Thus it is certain that even in the more concentrated solutions pyfidine is still one of the products of 4-CNPY electrore- duction. This is in agreement with the conclusion of Furukawa et al. [ 16].
There secms to be a one-to-one correspondence be- tween the starting species and the products, that L ,~ ',t~e 4-CNPY monomer produces pyridine and the dimer or
aggregate gives rise to the putative azo compound. This can be seen by comparing the spectra in Fig. 1 with those in Fig. 10. However, at an intermediate concentration, 2.5mM 4-CNPY, we can obtain evidence for both the putative azo and pyridine depending on experimental con- ditions. If the potential is stepped directly to - 1.2 V from -0 .4V , the steady-state product spectrum (curve (b) in Fig. 11) is quite different from that obtained when the potential is changed very slowly (curve (b) in Fig. 10). In this potential step experiment, only the pyridine spectrum is observed rather than a combination of the pyridine and azo spectra.
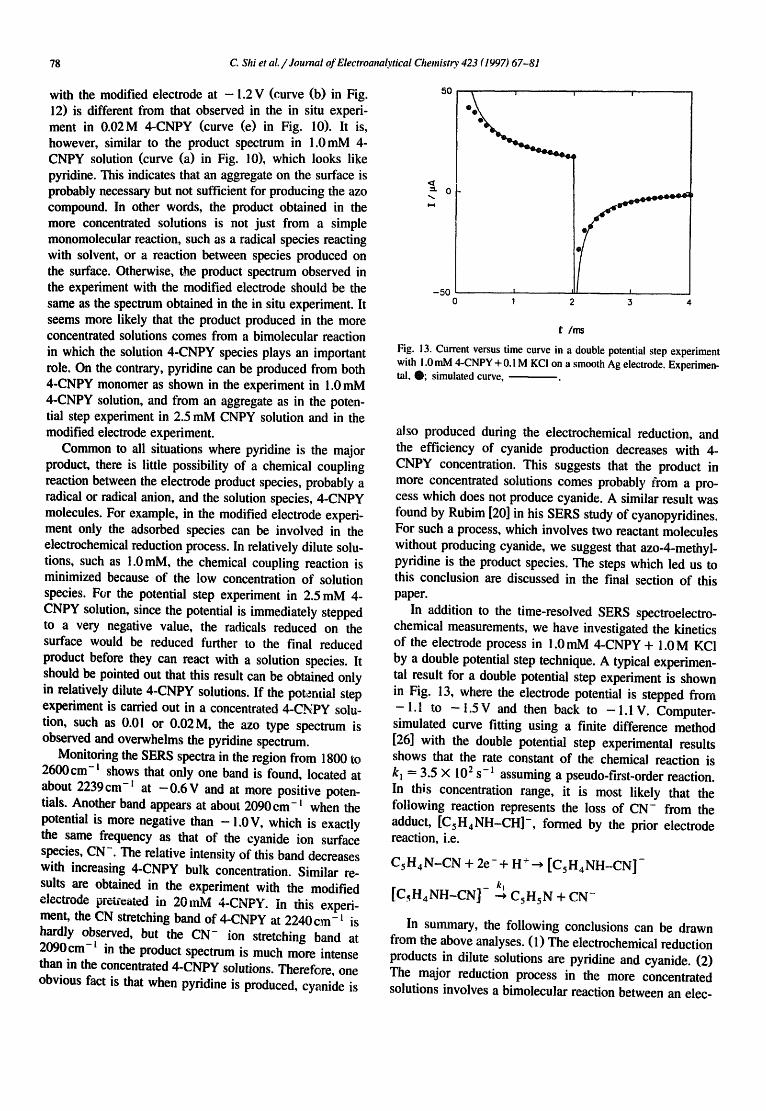
Another deviation from this correspondence is shown in an experiment when 4-CNPY is only present on the elec- trode surface (Fig. 12). The Ag electrode can be modified by pretreating in the dark with an ORC in 0.02 M 4-CNPY solution. The modified electrode is then washed and placed in a solution which contains only supporting electrolyte, 0.1 M KCi. The initial SERS spectrum of this system at - 0 . 4 V (curve (a) in Fig. 12) is primarily the same as the in situ experiment in 0.02 M 4-CNPY solution (curve (e) in Fig. l). However, the product spectrum in the experiment
N
A N ~ 0 ~ (b) ~
-r
A (a) ,r. ~ l l
-~_~ ~ it" ~
I I I
1660 144b 1228 1004 7 7 6
Raman S h i f t / c m "~
Fig. i2. SERS spectra of (a) 4-CNPY at - 0 . 4 V and (b) its reduction product at - 1 . 2 V on an electrochemically modified ele~:crode in 0.1M
KCI solution.
78 C. Shi et al. ~Journal of Electroanalyticai Chemistry 423 (1997) 67-81
with the modified electrode at -1 .2 V (curve (b) in Fig. 12) is different from that observed in the in situ experi- ment in 0.02M 4-CNPY (curve (e) in Fig. 10). It is, however, similar to the product spectrum in 1.0mM 4- CNPY solution (curve (a) in Fig. 10), which looks like pyridine. This indicates that an aggregate on the surface is probably necessary but not sufficient for producing the azo compound. In other words, the product obtained in the more concentrated solutions is not just from a simple monomolecular reaction, such as a radical species reacting with solvent, or a reaction between species produced on the surface. Otherwise, the product spectrum observed in the experiment with the modified electrode should be the same as the spectrum obtained in the in situ experiment. It seems more likely that the product produced in the more concentrated solutions comes from a bimolecular reaction in which the solution 4-CNPY species plays an important role. On the contrary, pyridine can be produced from both 4-CNPY monomer as shown in the experiment in 1.0 mM 4-CNPY solution, and from an aggregate as in the poten- tial step experiment in 2.5 mM CNPY solution and in the modified electrode experiment.
Common to all situations where pyridine is the major product, there is little possibility of a chemical coupling reaction between the electrode product species, probably a radical or radical anion, and the solution species, 4-CNPY molecules. For example, in the modified electrode experi- ment only the adsorbed species can be involved in the electrochemical reduction process. In relatively dilute solu- tions, such as 1.0mM, the chemical coupling reaction is minimized because of the low concentration of solution species. Fer the potential step experiment in 2.5 mM 4- CNPY solution, since the potential is immediately stepped to a very negative value, the radicals reduced on the surface would be reduced further to the final reduced product before they can react with a solution species. It should be pointed out that this result can be obtained only in relatively dilute 4-CNPY solutions. If the potential step experiment is carded out in a concentrated 4-CNPY solu- tion, such as 0.01 or 0.02 M, the azo type spectrum is observed and overwhelms the pyridine spectrum.
Monitoring the SERS spectra in the region from 1800 to 2600cm-t shows that only one band is found, located at about 2239cm-= at - 0 . 6 V and at more positive poten- tials. Another band appears at about 2090cm-~ when the potential is more negative than -1 .0V, which is exactly the same frequency as that of the cyanide ion surface species, CN-. The relative intensity of this band decreases with increasing 4-CNPY bulk concentration. Similar re- sults are obtained in the experiment with the modified electrode prelxeated in 20ndv! 4-CNPY. in this experi- ment, the CN stretching band of 4-CNPY at 2240 era-~ is hardly observed, but the CN- ion stretching band at 2090cm-' in the product spectrum is much more intense than in the concentrated 4-CNPY solutions. Therefore, one obvious fact is that when pyridine is produced, cyanide is
50
0
- 5 0 0
f I I
1 2 3 4
t /ms
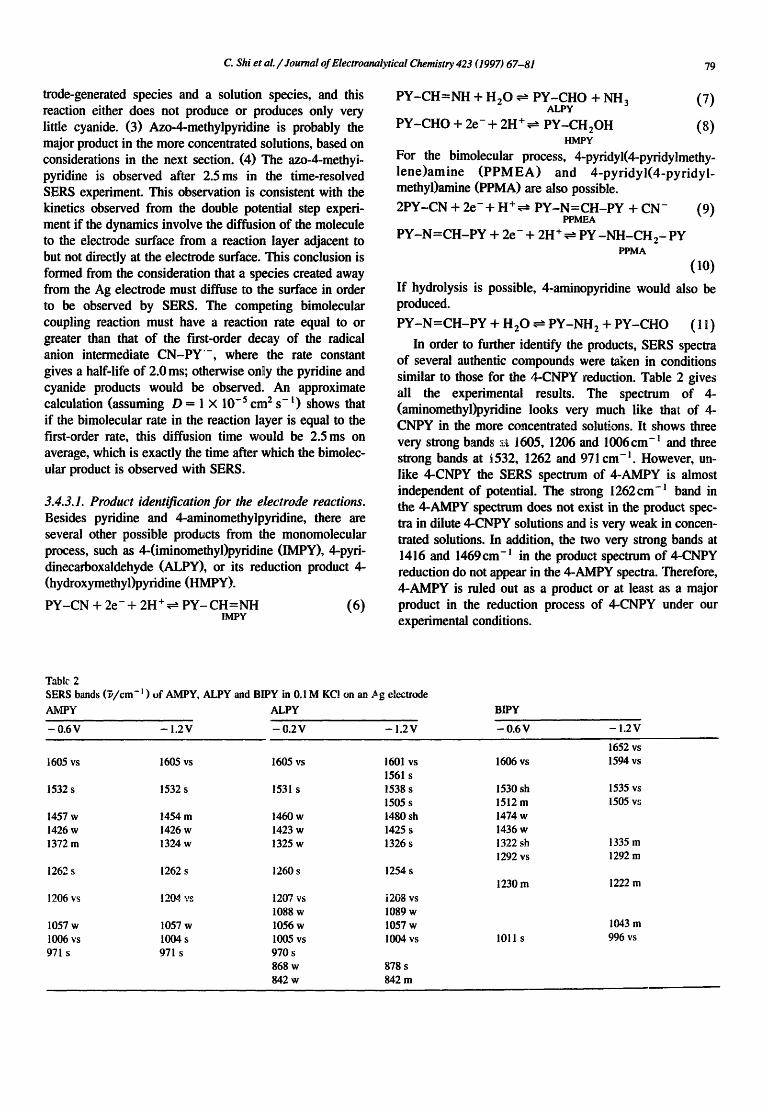
Fig. 13. Current versus time curve in a double potential step experiment with 1.0 mM 4-CNPY + 0.1M KCI on a smooth Ag electrode. Experimen- tal, O; simulated curve,
also produced during the electrochemical reduction, and the efficiency of cyanide production decreases with 4- CNPY concentration. This suggests that the product in more concentrated solutions comes probably from a pro- cess which does not produce cyanide. A similar result was found by Rubim [20] in his SERS study of cyanopyridines. For such a process, which involves two reactant molecules without producing cyanide, we suggest that azo-4-methyl- pyridine is the product species. The steps which led us to this conclusion are discussed in the final section of this paper.
In addition to the time-resolved SERS spectroelectro- chemical measurements, we have investigated the kinetics of the electrode process in 1.0mM 4-CNPY + 1.0M KCI by a double potential step technique. A typical experimen- tal result for a double potential step experiment is shown in Fig. 13, where the electrode potential is stepped from - 1.1 to - 1.5 V and then back to - 1.1 V. Computer- simulated curve fitting using a finite difference method [26] with the double potential step experimental results shows that the rate constant of the chemical reaction is k~ = 3.5 × 10 2 S-l assuming a pseudo-first-order reaction. In this concentration range, it is most likely that the following reaction represents the loss of CN- from the adduct, [CsH4NH-CH]- ' formed by the prior electrode reaction, i.e.
CsH4N-CN + 2e- + H + --> [CsH4NH_.CN ] -
- k I
[C~H4NH-CN] --* CsHsN + CN-
In summary, the following conclusions can be drawn from the above analyses. (1) The electrochemical reduction products in dilute solutions are pyridine and cyanide. (2) The major reduction process in the more concentrated solutions involves a bimolecular reaction between an elec-
C. Shi et aL / Journal of Electroanalytical Chemistry 423 (1997) 67-81 79
trode-generated species and a solution species, and this reaction either does not produce or produces only very little cyanide. (3) Azo-4-methylpyridine is probably the major product in the more concentrated solutions, based on considerations in the next section. (4) The azo-&methyi- pyridine is observed after 2.5ms in the time-resolved SERS experiment. This observation is consistent with the kinetics observed from the double potential step experi- ment if the dynamics involve the diffusion of the molecule to the electrode surface from a reaction layer adjacent to but not directly at the electrode surface. This conclusion is formed from the consideration that a species created away from the Ag electrode must diffuse to the surface in order to be observed by SERS. The competing bimolecular coupling reaction must have a reaction rate equal to or greater than that of the first-order decay of the radical anion intermediate CN-PY'- , where the rate constant gives a half-life of 2.0 ms; otherwise only the pyridine and cyanide products would be observed. An approximate calculation (assuming D-- 1 × 10 -5 cm 2 s -~) shows that if the bimolecular rate in the reaction layer is equal to the first-order rate, this diffusion time would be 2.5 ms on average, which is exactly the time after which the bimolec- ular product is observed with SERS.
3.4.3.1. Product identification for the electrode reactions. Besides pyridine and 4-aminomethylpyddine, there are several other possible products from the monomolecular process, such as 4-(iminomethyl)pyridine (IMPY), 4-pyri- dinecarboxaldehyde (ALPY), or its reduction product 4- (hydroxymethyl)pyridine (HMPY).
PY-CN + 2 e - + 2 H + ~ PY-CH=NH (6) IMPY
PY-CH=NH + H20 ~ PY-CHO + NFI 3 (7) ALPY
PY-CHO + 2 e - + 2 H + ~ PY-CH2OH (8) tIblPY
For the bimolecular process, 4-pyddyl(4-pyridylmethy- lene)amine (PPMEA) and 4-pyridyl(4-pyridyl- methyl)amine (PPMA) are also possible.
2PY-CN + 2 e - + H + ~ PY-N=CH-PY + CN- (9) PPMEA
PY-N=CH-PY + 2e- + 2H + ~ PY -NH-CH 2- PY PPMA
(10) If hydrolysis is possible, 4-aminopyridine would also be produced.
PY-N=CH-PY + H20 ~- PY-NH 2 + PY-CHO (1 l)
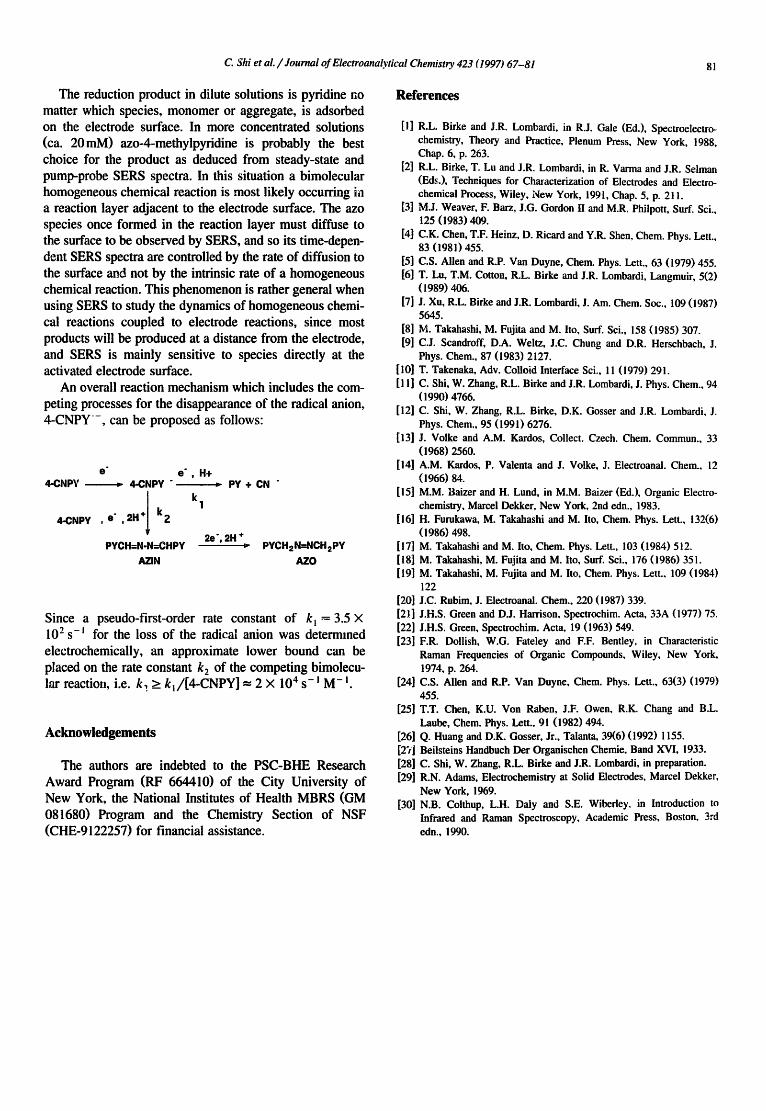
In order to further identify the products, SERS spectra of several authentic compounds were taken in conditions similar to those for the 4-CNPY reduction. Table 2 gives all the experimental results. The spectrum of 4- (aminomethyi)pyridine looks very much like tha~t of 4- CNPY in the more concentrated solutions. It shows three very strong bands .~ 1605, 1206 and 1006 cm- ~ and three strong bands at i532, 1262 and 971 cm -l . However, un- like 4-CNPY the SERS spectrum of 4-AMPY is almost independent of potential. The strong 1262 cm-~ band in the 4-AMPY spectrum does not exist in the product spec- tra in dilute 4-CNPY solutions and is very weak in concen- trated solutions. In addition, the two very strong bands at 1416 and 1469cm -l in the product spectrum of 4-CNPY reduction do not appear in the 4-AMPY spectra. Therefore, 4-AMPY is ruled out as a product or at least as a major product in the reduction process of 4-CNPY under our experimental conditions.
Tablc 2
SERS bands ( ~ / c m - I ) o f AMPY, ALPY and BIPY in 0 . 1 M KCI on an f ig electrode
AMPY A L P Y
- 0 . 6 V - 1 . 2 V - 0 . 2 V - 1 . 2 V
BIPY
- 0 . 6 V - I . 2 V
1652 vs
1605 vs 1605 vs 1605 vs 1601 vs 1606 vs 1594 vs
1561 s
1532 s 1532 s 1531 s 1538 s 1530 sh 1535 vs
1505 s 1512 m 1505 vs
1457 w 1454 m 1460 w 1480 sh 1474 w
1426 w 1426 w 1423 w 1425 s 1436 w
1372 m 1324 w 1325 w 1326 s 1322 sh 1335 m 1292 vs 1292 m
1262 s 1262 s 1260 s 1254 s 1230 m 1222 m
1206 vs 1204 vs 1207 vs i208 vs
1088 w 1089 w
1057 w 1057 w 1056 w 1057 w 1043 m
1006 vs 1004 s 1005 vs 1004 vs 1011 s 996 vs
971 s 971 s 970 s
868 w 878 s
842 w 842 m

80 C. Shi et al./ Journal of Electroanalytical Chemistry 423 (1997) 67-81
One can find phenylmethyleneamine type molecules in Beilsteins Handbook [27]; however, 4-pyridinemethylene- amine was not available to us. Fortunately, 4-pyridine- carboxaldehyde (ALPY) is available and its SERS spectra have been taken at various electrode potentials. The spec- trum of 0.01 M ALPY in 0.1 M KCI at its stable potential, - 0 . 2 V , show three very strong bands at 1605, 1207 and 1005 cm- ~, three strong bands at 1531, 1260 and 970 cm- ~, and seven weak bands at 1460, 1423, 1325, 1088, 1056, 868 and 842 cm-~. Among these bands, only two of them, located at 1531 and 1325cm -~, are unique to ALPY. All others have their correspondents in the 4-CNPY spectrum, although the 868 cm-~ band only shows up in IR, not in the Raman spectrum. A significant change in the spectrum occurs at -0 .6V. When the potential is more negative than - 0 . 6 V, the spectrum remains the same. This spec- trum corresponds to the electroreduction product of ALPY, 1,2-bis(4-pyridyl)-ethane [28]. Compared with the ALPY spectrum at -0 .2 V, the spectrum found between - 0 . 6 and - 1.2 V is quite complicated. The three original bands at 1605, 1207 and 1005 cm-~ remain very strong, but the first band shifts to 1601 cm -~. Three strong new bands appear at 1561, 1538 1505cm -~ and a shoulder band at 1480cm -~. The relative intensities of the 1423, 1325 and 868 cm- t bands become intense, and the 868 cm- ~ band shifts to 878cm -l . Three original bands at 1531, 1460 and 970cm-! disappear from the spectrum. Thus the spectrum of 1,2-bis(4-pyridyl)ethane is quite different from the prod- uct spectra of 4-CNPY reduction. Therefore neither ALPY nor 1,2-bis(4-pyridyl)ethane can be the reduction product of 4-CNPY.
According to Eq. (7) and Eq. (11), ALPY is one of the hydrolysis products of IMPY and PPMEA. Since ALPY is not formed, the other two compounds, ammonia and 4- aminopyridine, will not be formed either. Thus all the possible monomolecular reduction products, except IMPY, have been eliminated. Even IMPY can be eliminated as the product for the following two reasons. (i) According to Baizer and Lund [15] and Adams [29], the hydrolysis of imino compounds occurs easily, thus if it exists, ALPY or HMPY should be observed. (ii) Both pyridine and IMPY are two-electron reduction products of 4-CNPY and these two reactions are in parallel, thus the concentration depen- dences of these two reaction rates are expected to be the same. However, the product spectrum in dilute solutions can be assigned to pyridine. The other product spectrum appears only in higher 4-CNPY concentrations and its relative intensity compared with that of pyridine increases with concentration. Therefore it cannot be assigned to IMPY.
Since the possibility of the reactions shown in Eq. (2), Eqs. (6)-(8) and Eq. (11) have been eliminated, besides pyridine only five possible products are left, and all of them are derived from a bimolecular process. Of these species, 4,4'-bipyridine (BIPY) was the only compound available to us. The BIPY spectrum [6] shows little change
in the potential region from - 0 . 4 to -0 .8V. Two very intense bands are found at about 1606 and 1292 cm -~ , one strong band at 1011 cm -I , two medium strong bands at about 1512 and 1230cm -~, two weak bands at 1474 and 1436cm -~, and two shoulder bands at 1530 and 1322cm - l . These spectra represent stable BIPY. When the potential is more negative than - 1.0V, the 1474cm- band disappears. The intensities of the 1530, 1512, 1322 and 1230 cm-l bands begin to increase and the 1235 cm- l band shifts to 1222cm -~. Another new band at 1652cm- appears at --1.1 V. Large changes in both frequency and relative intensity occur at - 1.2V. The 1606cm -! band shifts to 1594cm -~, the 1530cm -~ band to 1535cm -~, the 1512cm -~ band to 1505cm -~, the 1322cm -~ band to 1335cm -~, and the 1011cm -~ band to 996cm -~. The 1652, 1594, 1535, 1505 and 996cm-~ bands become very intense, but the 1292cm -~ band becomes weaker. In addition, a new band appears at 1043cm -~ When the potential is moved further to the negative, the 1505, 1335 and 1043cm -~ bands keep increasing, but the 1652, 1535 and 1292 cm- I bands decrease. In addition, the 1505 cm- i band shifts to 1500cm -t . It is evident from these experi- ments that BIPY shows totally different SERS spectra from our product spectra at corresponding potentials. Thus BIPY can be eliminated as a product in the 4-CNPY reduction process.
There are only two possible mechanisms with four possible products left. They are PPMEA, PPMA, AZIN and AZO. According to Colthup et al. [30], the C-N single bond stretching frequency is at 1191 to 1171 cm- ~ for the aliphatic secondary amines, and 1342 to 1320 cm- ~ and 1315 to 1250cm- l for the aromatic secondary amines. Also the C = N and N=N double bond stretches are in the frequency ranges 1690 to 1620cm -~ and 1450 to 1400cm -l respectively. Since the product spectrum in concentrated solutions shows one strong, distinct band at 1417cm -~, except for the AZO compound, none of these species could be the product.
4. Conclusion
There are two kinds of 4-CNPY species adsorbed on the Ag electrode surface. The one which is predominant in dilute solutions, ca. 1.0mM, is the simple 4-CNPY molecule adsorbed with an end-on orientation. The other species which plays an important role in more concen- trated solutions (ca. 20mM) is a dimer or aggregate of 4-CNPY adsorbed in a tilted orientation. The transient TR-SERS spectra shows that, in the more concentrated solutions, the monomer adsorbs on the electrode surface first and then the dimer or aggregate is formed. The presence of laser light during the ORC pretreatments has some effect on the formation of the dimer or aggregate at - 0 . 4 V, but little effect on the adsorption process during the time elapsed between measurements.
C. Shi et aL / Journal of Electroanalytical Chemistry 423 (1997) 67-81 81
The reduction product in dilute solutions is pyridine no matter which species, monomer or aggregate, is adsorbed on the electrode surface. In more concentrated solutions (ca. 20mM) azo-4-methylpyridine is probably the best choice for the product as deduced from steady-state and pump-probe SERS spectra. In this situation a bimolecular homogeneous chemical reaction is most likely occurring in a reaction layer adjacent to the electrode surface. The azo species once formed in the reaction layer must diffuse to the surface to be observed by SERS, and so its time-depen- dent SERS spectra are controlled by the rate of diffusion to the surface and not by the intrinsic rate of a homogeneous chemical reaction. This phenomenon is rather general when using SERS to study the dynamics of homogeneous chemi- cal reactions coupled to electrode reactions, since most products will be produced at a distance from the electrode, and SERS is mainly sensitive to species directly at the activated electrode surface.
An overall reaction mechanism which includes the com- peting processes for the disappearance of the radical anion, 4-CNPY-, can be proposed as follows:
e" e' , H+ 4-CNPV = 4 - C N P Y "
!
4-CNPY ,e" ,2H+I k2
PYCH=N-N=CHPY AZIN
k 1
: PY + CN "
2e', 2H + PYCH2N=NCH2PY AZO
Since a pseudo-first-order rate constant of k~ = 3.5 × 10² s-i for the loss of the radical anion was determined electrochemically, an approximate lower bound can be placed on the rate constant k 2 of the competing bimolecu- lar reaction, i.e. k, >_ kl/[4-CNPY] ~ 2 × 10⁴ s- ! M- l
Acknowledgements
The authors are indebted to the PSC-BHE Research Award Program (RF 664410) of the City University of New York, the National Institutes of Health MBRS (GM 081680) Program and the Chemistry Section of NSF (CHE-9122257) for financial assistance.
References
[i] R.L. Birke and J.R. Lombardi, in R.J. Gale (Ed.), Spectroelectro- chemistry, Theory and Practice, Plenum Press, New York, 1988, Chap. 6, p. 263.
[2] R.L. Birke, T. Lu and J.R. Lombardi, in R. Varma and J.R. Selman (Eds.), Techniques for Characterization of Electrodes and Electro- chemical Process, Wiley, New York, 1991, Chap. 5, p. 211.
[3] M.J. Weaver, F. Barz, J.G. Gordon II and M.R. Philpott, Surf. Sci., 125 (1983) 409.
[4] C.K. Chen, T.F. Heinz, D. Ricard and Y.R. Shen, Chem. Phys. Lett., 83 (1981) 455.
[5] C.S. Allen and R.P. Van Duyne, Chem. Phys. Lett., 63 (1979) 455. [6] T. Lu, T.M. Cotton, R.L. Birke and J.R. Lombardi, Langmuir, 5(2)
(1989) 406. [7] J. Xu, R.L. Birke and J.R. Lombardi, J. Am. Chem. Soc., 109 (1987)
5645. [8] M. Takahashi, M. Fujita and M. lto, Surf. Sci., 158 (1985) 307. [9] C.J. Scan&off, D.A. Weltz, J.C. Chung and D.R. Herschbach, J.
Phys. Chem., 87 (1983) 2127. [10] T. Takenaka, Adv. Colloid Interface Sci., 11 (1979) 291. [i 1] C. Shi, W. Zhang, R.L. Birke and J.R. Lombardi, J. Phys. Chem., 94
(1990) 4766. [12] C. Shi, W. Zhang, R.L. Birke, D.K. Gosser and J.R. Lombardi, J.
Phys. Chem., 95 (1991) 6276. [13] J. Volke and A.M. Kardos, Collect. Czech. Chem. Commun., 33
(1968) 2560. [14] A.M. Kardos, P. Valenta and J. Volke, J. Electroanai. Chem., 12
(1966) 84. [15] M.M. Baizer and H. Lund, in M.M. Baizer (Ed.), Organic Electro-
chemistry, Marcel Dekker, New York, 2nd edn., 1983. [16] H. Fumkawa, M. Takahashi and M. Ito, Chem. Phys. Lett., 132(6)
(1986) 498. [17] M. Takahashi and M. Ito, Chem. Phys. Lett., 103 0984) 512. [18] M. Takahashi, M. Fujita and M. Ito, Surf. Sci., 176 (1986) 351. [19] M. Takahashi, M. Fujita and M. Ito, Chem. Phys. Lett., 109 (1984)
122 [20] J.C. Rubim, J. Electroanal. Chem., 220 (1987) 339. [21] J.H.S. Green and D.J. Harrison, Spectrochim. Acta, 33A (1977) 75. [22] J.H.S. Green, Spectrochim. Acta, 19 (1963) 549. [23] F.R. Dollish, W.G. Fateley and F.F. Bentley, in Characteristic
Raman Frequencies of Organic Compounds, Wiley, New York, 1974, p. 264.
[24] C.S. Allen and R.P. Van Duyne, Chem. Phys. Lett., 63(3) (1979) 455.
[25] T.T. Chen, K.U. Von Raben, J.F. Owen, R.K. Chang and B.L. Laube, Chem. Phys. Lett.. 91 (1982) 494.
[26] Q. Huang and D.K. Gosser, Jr., Talanta, 39(6)(1992) 1155. [2"1] Beilsteins Handbuch Der Organischen Chemie, Band XVI, 1933. [28] C. Ski, W. Zhang, R.L. Birke and J.R. Lombardi, in preparation. [29] R.N. Adams, Electrochemistry at Solid Electrodes, Marcel Dekker,
New York, 1969. [30] N.B. Colthup, L.H. Daly and S.E. Wibedey, in Introduction to
Infrared and Raman Spectroscopy, Academic Press, Boston, 3rd edn., 1990.
Copyright © 2022 FDOKUMEN