
Direct feature extraction from multi-electrode recordings ... - UCI
10
Digital Signal Processing 75 (2018) 222–231 Contents lists available at ScienceDirect Digital Signal Processing www.elsevier.com/locate/dsp Direct feature extraction from multi-electrode recordings for spike sorting Shun-Chi Wu a,∗ , A. Lee Swindlehurst b a Department of Engineering and System Science, National Tsing Hua University, Hsinchu 30013, Taiwan b Department of Electrical Engineering and Computer Science, University of California, Irvine, CA 92697, USA a r t i c l e i n f o a b s t r a c t Article history: Available online 31 January 2018 Keywords: Spike sorting Feature extraction Dimensionality reduction Discriminant analysis Information from extracellular action potentials (EAPs) of individual neurons is of particular interest in experimental neuroscience. It advances the understanding of brain functions and is essential in the emerging field of brain-machine interfaces. As EAPs from distinct neurons are generally not recorded individually, a process to separate them from the multi-unit recordings, referred to as spike sorting, is required. For spike sorting, the feature extraction step is crucial. Starting from acquired data, the task of feature extraction is to find a set of derived values or “features” that are informative and non- redundant to facilitate efficient and accurate sorting, compared with using the raw data directly. It not only reduces the dimensionality of the data but also the impact of noise. In this paper, two novel feature extraction algorithms for sorting multi-electrode EAPs are proposed. These algorithms can be seen as generalizations of principal component analysis and linear discriminant analysis, but the features that match the dominant subspaces observed in the multi-electrode data are obtained without the need for vectorizing a multi-electrode EAP or breaking it into separate EAP channels. These algorithms require no construction of EAP templates and are applicable to multi-electrode recordings regardless of the number of electrodes. Clustering using both simulated data and real EAP recordings taken from area CA1 of the dorsal hippocampus of rats demonstrates that the proposed approaches yield features that are discriminatory and lead to promising results. © 2018 Elsevier Inc. All rights reserved. 1. Introduction Extracellular action potentials (EAPs) of individual neurons, re- ferred to as “single-unit activity,” are of particular interest in neu- roscience research. Information derived from these EAPs is essen- tial in understanding how interconnected neurons cause sensation and create responses in a changing environment [1,2], or in restor- ing motor functions in those with severe paralysis [3–5]. However, EAPs from distinct neurons are generally not recorded individually. Even though an extracellular probe is small and can be directly in- serted into biological tissue to accurately target a specific location, it typically acquires a superposition of activity from an unknown number of neurons [6,7]. In addition, the recordings contain vari- ous noise components, such as electrode noise and biological noise (e.g., activity of distant neurons and ionic channel noise). As a re- sult, a process referred to as “spike” sorting, is required to separate out the single-unit activity prior to many applications [8–10]. Spike sorting in practice may involve human intervention; however, vari- ability in the sorted results can be significant from one operator to * Corresponding author. E-mail address: [email protected] (S.-C. Wu). another [11]. Furthermore, manually dealing with large volumes of data can be extremely time-consuming. These factors make an au- tomated spike sorting procedure indispensable. A spike sorting algorithm (see Fig. 1) consists of three basic steps [7,8]: EAP detection and alignment, feature extraction, and clus- tering. EAP detection refers to determining the occurrence times of EAPs in the recordings, normally achieved by detecting changes in amplitude or energy in the data series or by template matching [9,12,13], assuming that the EAP waveforms of interest are known a priori. Temporal alignment refers to the process of arranging the segmented EAP waveforms so that they “line up” in time. This is often done by finding a point of maximum amplitude or maximum slope for each EAP, or for each set of EAPs within a multi-electrode recording [14]. Clustering refers to grouping the extracted features into clusters associated with different putative neurons, and can be achieved through manual cluster cutting or via automated methods such as the k-means or valley-seeking clustering algorithms [9,10]. Starting from acquired data, the task of feature extraction is to find a set of derived values or features that are informative and non- redundant to facilitate efficient and accurate sorting, compared with using the raw data directly. It not only reduces the dimen- sionality of the data but also the effect of noise in the detected https://doi.org/10.1016/j.dsp.2018.01.016 1051-2004/© 2018 Elsevier Inc. All rights reserved.
-
Upload
khangminh22 -
Category
Documents
-
view
0 -
download
0
Transcript of Direct feature extraction from multi-electrode recordings ... - UCI
Digital Signal Processing 75 (2018) 222–231
Contents lists available at ScienceDirect
Digital Signal Processing
www.elsevier.com/locate/dsp
Direct feature extraction from multi-electrode recordings for spike
sorting
Shun-Chi Wu a,∗, A. Lee Swindlehurst b
a Department of Engineering and System Science, National Tsing Hua University, Hsinchu 30013, Taiwanb Department of Electrical Engineering and Computer Science, University of California, Irvine, CA 92697, USA
a r t i c l e i n f o a b s t r a c t
Article history:Available online 31 January 2018
Keywords:Spike sortingFeature extractionDimensionality reductionDiscriminant analysis
Information from extracellular action potentials (EAPs) of individual neurons is of particular interest in experimental neuroscience. It advances the understanding of brain functions and is essential in the emerging field of brain-machine interfaces. As EAPs from distinct neurons are generally not recorded individually, a process to separate them from the multi-unit recordings, referred to as spike sorting, is required. For spike sorting, the feature extraction step is crucial. Starting from acquired data, the task of feature extraction is to find a set of derived values or “features” that are informative and non-redundant to facilitate efficient and accurate sorting, compared with using the raw data directly. It not only reduces the dimensionality of the data but also the impact of noise. In this paper, two novel feature extraction algorithms for sorting multi-electrode EAPs are proposed. These algorithms can be seen as generalizations of principal component analysis and linear discriminant analysis, but the features that match the dominant subspaces observed in the multi-electrode data are obtained without the need for vectorizing a multi-electrode EAP or breaking it into separate EAP channels. These algorithms require no construction of EAP templates and are applicable to multi-electrode recordings regardless of the number of electrodes. Clustering using both simulated data and real EAP recordings taken from area CA1 of the dorsal hippocampus of rats demonstrates that the proposed approaches yield features that are discriminatory and lead to promising results.
© 2018 Elsevier Inc. All rights reserved.
1. Introduction
Extracellular action potentials (EAPs) of individual neurons, re-ferred to as “single-unit activity,” are of particular interest in neu-roscience research. Information derived from these EAPs is essen-tial in understanding how interconnected neurons cause sensation and create responses in a changing environment [1,2], or in restor-ing motor functions in those with severe paralysis [3–5]. However, EAPs from distinct neurons are generally not recorded individually. Even though an extracellular probe is small and can be directly in-serted into biological tissue to accurately target a specific location, it typically acquires a superposition of activity from an unknown number of neurons [6,7]. In addition, the recordings contain vari-ous noise components, such as electrode noise and biological noise (e.g., activity of distant neurons and ionic channel noise). As a re-sult, a process referred to as “spike” sorting, is required to separate out the single-unit activity prior to many applications [8–10]. Spike sorting in practice may involve human intervention; however, vari-ability in the sorted results can be significant from one operator to
* Corresponding author.E-mail address: [email protected] (S.-C. Wu).
https://doi.org/10.1016/j.dsp.2018.01.0161051-2004/© 2018 Elsevier Inc. All rights reserved.
another [11]. Furthermore, manually dealing with large volumes of data can be extremely time-consuming. These factors make an au-tomated spike sorting procedure indispensable.
A spike sorting algorithm (see Fig. 1) consists of three basic steps [7,8]: EAP detection and alignment, feature extraction, and clus-tering. EAP detection refers to determining the occurrence times of EAPs in the recordings, normally achieved by detecting changes in amplitude or energy in the data series or by template matching [9,12,13], assuming that the EAP waveforms of interest are known a priori. Temporal alignment refers to the process of arranging the segmented EAP waveforms so that they “line up” in time. This is often done by finding a point of maximum amplitude or maximum slope for each EAP, or for each set of EAPs within a multi-electrode recording [14]. Clustering refers to grouping the extracted features into clusters associated with different putative neurons, and can be achieved through manual cluster cutting or via automated methods such as the k-means or valley-seeking clustering algorithms [9,10]. Starting from acquired data, the task of feature extraction is to find a set of derived values or features that are informative and non-redundant to facilitate efficient and accurate sorting, compared with using the raw data directly. It not only reduces the dimen-sionality of the data but also the effect of noise in the detected

S.-C. Wu, A.L. Swindlehurst / Digital Signal Processing 75 (2018) 222–231 223
Fig. 1. Typical procedures for spike sorting.
EAPs. Since each neuron fires EAPs of a particular shape, features from EAPs are extracted to emphasize this point. Examples of these features include EAP shape-related features [10,15] such as height, width, peak-to-peak amplitude, principal components (PCs) [10], and wavelet coefficients [16,17]. With the help of an appropriate basis, the latter two feature categories can be extracted by directly projecting the EAPs onto the basis. Matching pursuit (MP) is an-other approach possessing similar properties [18].
Advances in microfabrication technology have enabled the pro-duction of multi-electrode extracellular probes with several closely spaced recording sites. Their use facilitates better sorting quality and increases the number of correctly identified neurons [19–21]. While multi-electrode probes are capable of providing better in-sight into the spatiotemporal nature of the signals produced by each recorded neuron, the resulting massive volumes of data un-questionably pose challenges to revealing discriminant informa-tion required for spike sorting. The simplest approach for ex-ploiting multi-electrode recordings is to apply the above feature extractors (e.g., EAP shape-related features) electrode-by-electrode to form a concatenated feature set [22–24]. With this approach, a large-dimensional space is created where sorting must be per-formed [25]. Applying multivariate matching pursuit (MMP) [18], a computationally efficient multichannel extension of MP, to fea-ture extraction for sorting multi-electrode EAPs is also feasible. However, issues such as how to determine the dictionary for a given set of EAPs, shortening the searching time for the best atom functions, and reducing the size of the concatenated feature vec-tors need to be well considered before applying it to real spike sorting problems. Efforts have also been made to utilize spatial in-formation [26–28] or independent components [29,30] for cluster-ing. Examples of spatial information include neuron locations [26,27] and spatial signatures [28]. However, the estimation of neuron locations requires a “forward model” (e.g., the monopole model) to describe the propagation of EAPs through the extracellular me-dia [31]. The spatial signature, on the other hand, can be extracted without the need for a forward model, but its performance is sen-sitive to noise. Spatial signatures are also seen in the application of locating cerebral sources in electroencephalograms [18]. Indepen-dent component analysis (ICA) is a blind source separation tech-nique that is able to resolve temporally overlapping EAPs, but it requires assumptions about the non-Gaussianity and independence
of the EAPs. Moreover, the observed data are modeled to be a lin-ear mixture of signals [29], and the number of electrodes needs to be greater than the number of neurons [9,30,32]. As the applica-tion of these approaches for unveiling discriminant information in multi-electrode recordings may not satisfactorily achieve the de-sired performance, the search for new methods continues.
To elicit the spatiotemporal information contained in the multi-electrode recordings for the spike sorting application, two block projection based feature extraction algorithms are proposed in this paper. The extraction process begins by identifying two different discriminant subspaces in the recordings. Features are then ex-tracted by directly projecting the multi-electrode data block corre-sponding to each EAP onto these subspaces. Unlike the above men-tioned feature extractors that are applied electrode-by-electrode, the proposed algorithms allow the features to be extracted while maintaining the structure of the data between electrodes so that the relative spatial information between them can be preserved for clustering. To avoid losing this spatial information, one may di-rectly apply principal component analysis (PCA) to the vectorized multi-electrode data block, a technique that will also be covered in Section 3.2. The proposed algorithms can be used for higher-rank signals, where point source models are unable to provide an accu-rate description of the measured EAPs. This higher-rank property is due to the fact that at close range the EAP sources appear to be distributed rather than point sources, or it may be caused by den-dritic current distortion [31,32]. The ability to exploit higher-rank models is an advantage compared with the ICA-based methods which have been proposed under the assumption of instantaneous point source mixtures. With a further dimensionality reduction, the ultimate feature vectors of the proposed algorithms can have dimension as low as that in typical spike sorting applications. Fi-nally, the algorithms are applicable irrespective of the number of electrodes used for the extracellular recordings, and have no need for EAP templates.
The remainder of the paper is outlined as follows. In the next section, we present the data model and underlying assumptions. The PCA based feature extraction techniques and our proposed al-gorithms are given in Section 3. The results of simulations and real experiments are then discussed in Sections 4 and 5, respectively. Finally, some conclusions are offered in Section 6.
2. Data model and assumptions
To focus on the feature extraction problem, we assume that the EAPs on one of the electrodes have been detected using existing approaches (e.g., [10]), and that the multi-channel, time-aligned data segments are isolated accordingly based on these detected EAPs. For the situation where the EAPs from a specific neuron are only seen by a subset of the electrodes in an electrode array, this process may need to be repeated from one electrode to another. This is because any selected electrode whose recordings are used for EAP detection may not contain the EAPs from that specific neu-ron, and repetition is used to avoid this situation. Assuming there are m electrodes and n samples per segment, the data correspond-ing to the i-th detected EAP forms an m × n matrix Xi , which is hereafter referred to as an “EAP bundle.”1 Assuming that each bun-dle consists of an EAP from a single neuron (similar to most of the methods described in [10], the proposed algorithms are not intended to handle the overlapping EAP problem). Moreover, the EAPs from that specific neuron are assumed to be seen by more than one electrode in this bundle. An appropriate model for Xi can be expressed as
1 Xi is also known as a “multi-electrode waveform” in, for example, [12,33,34].

224 S.-C. Wu, A.L. Swindlehurst / Digital Signal Processing 75 (2018) 222–231
Xi = Si + Wi, (1)
where Si ∈ Rm×n represents the noise-free multi-electrode sig-
nal corresponding to the EAP bundle, and Wi accounts for noise and interference. Since neurons act as distributed and not point sources, Si may exhibit a higher-rank structure of the form Si =AiVT
i where Ai and Vi are m × r and n × r matrices, representing respectively the response vectors induced on the multi-electrode probe by signals from different compartments of a target neuron, and their sampled signals. The rank r (normally r < min{m, n} if m and n are large enough) depends on the geometrical relation-ships (e.g., distance between the probe and neuron compartments) and the level of neuron complexity. The elements of Ai represent the ratios of signal amplitudes on different electrodes. Normally, signals from compartments at different locations elicit different re-sponse vectors.
The matrix Wi ∈ Rm×n is composed of background neural and
sensor noise, and is assumed to be spatially and temporally white. However, if it is deemed that interference from undetected back-ground neurons or other electronic sources does not satisfy this condition (which may lead to negative impacts on the detection and clustering performance [35]), a whitening method such as the autoregressive moving average (ARMA) approach can be incorpo-rated into the preprocessing stage to reduce its effect. Subspace-based interference suppression [36] is an alternative to mitigate this concern. Modeling Wi as a wide-sense stationary process and assuming its non-white components to reside in a low-rank sub-space, the idea of [36] is to project the data Xi onto the sub-space orthogonal to the interference to reduce its influence. This low-rank assumption is justified since it is reasonable to assume that the number of important, yet undetected, interference sources in the range of the electrodes should be much smaller than mn(typically, mn > 100). In practice, the orthogonal subspace can be estimated by observing the data recorded when the neurons of in-terest are not active (e.g., between EAP pulses).
The modeling assumptions adopted in this paper are summa-rized as follows:
A1 The EAPs have been previously detected and time-aligned us-ing existing methods and the corresponding EAP bundles have been constructed.
A2 Each bundle contains EAPs from only one target neuron, and the EAPs are seen by more than one electrode in this bun-dle; any measurements with overlapping EAPs have been dis-carded.
A3 If the noise has significant non-white temporal or spatial com-ponents, methods such as the ARMA approach and noise sub-space projection have been incorporated to reduce their ef-fects.
Any violation of these assumptions (e.g., ill-aligned or overlapping EAPs) will lead to a performance degradation in the proposed ap-proaches.
3. Multi-electrode feature extraction
Starting from the acquired data, the task of feature extraction is to find a set of derived values (i.e., features) that are informa-tive and non-redundant to facilitate efficient and accurate sorting, as compared to the raw data. In this section, several algorithms for extracting features from extracellular recordings made with multi-electrode probes are presented. Prior to proceeding with the dis-cussions, we assume that the ensemble average of the N detected bundles, X = 1
N
∑Ni=1 Xi , has been subtracted from the bundles. As
such, the mean subtracted EAP bundle is given by X′i = Xi − X.
However, for simplicity, hereafter we still use Xi instead of X′ to
irepresent these mean subtracted EAP bundles. To begin, the most popular PCA feature extraction algorithm is reviewed. Its general-ization to multi-electrode recordings and the proposed block pro-jection based algorithms are then presented.
3.1. Principal component analysis
By examining the variance–covariance structure of a dataset, PCA attempts to represent the data by identifying the principal components (PCs) that account for most of the data variability. For EAP x(k)
i ∈ R1×n from the k-th electrode of the i-th EAP bundle, the
corresponding PCs can be extracted via
c(k)i = x(k)
i V(k)pca , (2)
where c(k)i ∈ R
1×pk represents the resulting vector of acquired PCs, and the matrix V(k)
pca ∈ Rn×pk is an orthonormal basis for the so-
called principal subspace for all the data from the k-th electrode. The subspace basis is commonly obtained by taking the pk eigen-vectors of the covariance matrix (note that x(k) = 1
N
∑Ni=1 x(k)
i = 0due to the mean subtraction)
S(k)pca = 1
N
N∑i=1
(x(k)i )Tx(k)
i ∈Rn×n , (3)
corresponding to the largest pk eigenvalues. Typically, the number of independent observations (i.e., data vectors x(k)
i ), N , required to properly estimate the covariance matrix is approximately 2 to 3 times the dimension of the matrix (or 2–3 times the rank if the matrix is rank deficient), and pk is chosen to be much less than nand N . Note that an appropriate basis will normally give a com-pact representation for an AP with a minimum loss of information, and the compactness of the PCs is a result of selecting signal di-mensions that have significant variance in the data.
3.2. Generalizations of PCA to multi-electrode recordings
When dealing with multi-electrode recordings, PCA can simply be applied electrode-by-electrode [22,23]. The procedures for PC extraction in different electrodes are the same, and the complete feature vector for the i-th EAP bundle becomes
ci =[
c(1)i · · · c(m)
i
]∈R
1×p , (4)
where p = ∑mk=1 pk . Although this electrode-by-electrode strategy
seems feasible, the resulting feature vector will be suboptimal as it only focuses on the “temporal or morphological” aspect of the data, and ignores the spatial information (i.e., the interrelations between data from different electrodes) of the multi-electrode recordings. As shown in [28], this spatial information is helpful in differentiating between EAPs, because the geometrical relation-ships involved in the neuron compartments and the electrodes differ from one target neuron to another.
To avoid losing this spatial information, we may directly apply PCA to the vectorized EAP bundles xi = vec(Xi)
T ∈ R1×mn (vec(·)
is the vectorization operator to convert a matrix into a column vector):
cvpcai = xiVvpca , (5)
where cvpcai ∈ R
1×p represents the extracted feature vector. Here, Vvpca ∈ R
mn×p is the orthonormal basis obtained by taking the first p eigenvectors derived from the covariance matrix
Svpca = 1
N
N∑xT
i xi ∈Rmn×mn . (6)
i=1

S.-C. Wu, A.L. Swindlehurst / Digital Signal Processing 75 (2018) 222–231 225
Both the spatial and temporal components of the data are simul-taneously considered in constructing Svpca; however, estimating a large covariance matrix like Svpca can be difficult and a large num-ber of EAP bundles are required.
3.3. Block projection feature extraction
Inspired by the concept of [37], the method presented here at-tempts to avoid this curse of dimensionality while retaining the simplicity of PCA in extracting features. In particular, instead of us-ing vectorized EAP bundles, the covariance matrix for determining the eigenvectors is constructed with the bundles directly
Sbp = 1
N
N∑i=1
XTi Xi ∈R
n×n. (7)
Note that EAP bundles Xi from different neurons will generate dif-ferent covariance matrices. After summing up all these covariance matrices, components that are common to them will be strength-ened, while those that are not shared by the covariance matrices of EAP bundles from different neurons will be weakened. How-ever, these “lost” directions correspond to components that contain less data variation (information) and are generally ignored by ap-proaches such as PCA and vPCA. Thus, the corresponding features Cbp
i ∈Rm×d can then be extracted via
Cbpi = XiVbp , (8)
where Vbp is the basis comprised of the d eigenvectors of Sbp cor-responding to the d largest eigenvalues. Because the features are extracted by directly projecting the EAP data block onto a domi-nant subspace of the multi-electrode recordings, we refer to this method as block projection (BP).
At first glance, it may appear that Sbp is similar to S(k)pca , cap-
turing the data variability only from a temporal aspect, since Sbpcomputes the sample covariance matrix of the row vectors (i.e., data from different electrodes) of the detected bundles. The ma-jor difference between these matrices is that data from different electrodes are treated independently in S(k)
pca when multi-electrode recordings are provided, whereas the data in Sbp are processed si-multaneously regardless of which electrode they come from. This allows the data variability to be examined “across the electrodes.” Furthermore, returning to Equation (8), each column vector of Cbp
iis formed by linearly combining all the column vectors of the EAP bundle. The columns of an EAP bundle can be regarded as the response vectors induced on the multi-electrode system by the compartments of a target neuron at various time instants. Each component represents a mixture of EAP signals from different compartments that are projected onto these different electrodes, and each column has an intrinsic spatial distribution related to the positions and orientations of these compartments relative to the electrodes. Thus, the spatial information is retained in the ex-tracted features as a weighted sum of the time-varying structures. Finally, compared to Svpca , Sbp can be evaluated with fewer EAP bundles, not only because of the smaller size of Sbp but also due to the high-rank property of Xi . As for the dimensionality of Cbp
i , it is controlled by the number of electrodes m and the dimension-ality of the dominant subspace d.
3.4. Block discriminant analysis
In this section, we describe an alternative approach that we re-fer to as Block Discriminant Analysis (BDA), which is motivated by the linear discriminant analysis (LDA) approach. Before describ-ing the details of BDA, let us take a further look at the extracted
features of the above methods. To be more general, the BP fea-ture matrix is used in this discussion. Defining the total scatter of the extracted features (a measure of the features’ discriminatory power [37]) to be
Jtot = tr
[1
N
N∑i=1
(Cbpi )TCbp
i
], (9)
we have
Jtot = tr[
VTbpSbpVbp
](10)
after substituting Equation (8) into Equation (9). Since Vbp is com-posed of the eigenvectors of Sbp corresponding to the largest eigenvalues, it maximizes the total scatter of the features in the reduced subspace. As Sbp is actually the total scatter of the EAP bundles in the original space, the goal in choosing the projection matrix is to retain this scatter as much as possible in the reduced subspace. This also holds for the features extracted by other PCA related methods. However, the directions that confine the maxi-mum scatter are not necessarily the ones that lead to maximum separation between EAP bundles. This is because the total scatter is composed of both the between-class scatter and the within-class scatter [38]. The former is for class separability evaluation, and the latter is a compactness measure for a class.
To allow the original data to be best separated in the reduced subspace, LDA alternatively seeks a basis VLDA that maximizes the ratio of the between-class scatter and within-class scatter:
VLDA = arg maxV
tr(VTSbV)
tr(VTSw V). (11)
LDA [12] is optimal in the Bayesian sense if the classes are Gaus-sian and homoscedastic; however, it is only applicable in a super-vised scenario, i.e., in which a training dataset whose labels are available so that Sb and Sw can be calculated. Moreover, the data need to be vectorized once the multi-electrode recordings are pro-vided. What makes application of LDA to spike sorting difficult is that spike sorting is actually an unsupervised classification prob-lem. As a result, Equation (11) needs to be modified to avoid the need for knowledge of the class labels. Furthermore, to avoid the curse of dimensionality, it is preferred that EAPs be clustered with-out vectorization.
As mentioned above, the total scatter is comprised of the between-class and the within-class scatter. Thus, the total scat-ter (i.e., Sbp) can be used as a substitute for Sb if Sw can be kept as compact as possible [38]. The latter can be achieved by ensur-ing that EAPs in the original domain that are “similar or close” to each other remain close to each other after being projected onto the reduced subspace. To estimate the basis of this latter subspace, spectral graph theory can be adopted [39]:
Vgl = arg minV
J gl(V) = arg minV
∑i, j
∥∥Ci − C j∥∥2
F wij
= arg minV
∑i, j
tr{(XiV − X jV)T(XiV − X jV)}wij ,(12)
where ‖ · ‖F denotes the Frobenius norm, and wij represents an edge weight to describe the similarity between EAP bundles in the original space. To construct an appropriate weighted graph, only those bundles that are among the k-nearest neighbors of the i-th bundle are considered to be connected to it, and wij �= 0 for these bundles. This cost function is minimized if the nearby EAP bundles Xi and X j are projected via Vgl onto nearby features Ci and C j in the reduced subspace. Further expanding Equation (12), we have
J gl(V) = 2tr{VTX(L ⊗ Im)XTV} = 2tr{VTSglV} , (13)

226 S.-C. Wu, A.L. Swindlehurst / Digital Signal Processing 75 (2018) 222–231
where ⊗ denotes the Kronecker product, Im is the identity matrix of size m, X = [XT
1, . . . , XTN ] ∈ R
n×mN , and L = D − W is called the Laplacian matrix of the graph with the diagonal matrix D ∈ R
N×N
having diagonal entries dii = ∑j wij . The matrix W is comprised
of all the edge weights w ′i j s, which are calculated using
wij = e−dis(Xi ,X j)2/ti j , (14)
where dis(·, ·) is a similarity measure for any two EAP bundles with control parameter ti j . The derivation of Equation (13) is pro-vided in the appendix.
In conclusion, a conceptually feasible unsupervised discriminant analysis for EAP bundle feature extraction can be formulated as follows. Ignoring the leading scalars, the basis of the reduced sub-space is first determined via
VBDA = arg maxV
Jtot(V)
J gl(V)
= arg maxV
tr{VTXXTV}tr{VTX(L ⊗ Im)XTV} , (15)
where XXT = NSbp . This optimization problem is the so-called trace ratio problem involved in many dimensionality reduction al-gorithms. Conventionally, the solution is approximated via a gen-eralized eigenvalue decomposition; however, other methods have also been proposed [40]. Once VBDA is obtained, the corresponding features of any AP bundle can be extracted with Equation (8).
3.5. Feature reduction
To limit the number of features as required in most of the spike sorting applications, further dimensionality reduction may be re-quired. This can be easily achieved with the following approach. Denoting the extracted feature vector for a given EAP bundle as fi ∈R
1×p , the reduction can be achieved by projecting the fi onto a lower-dimensional subspace determined by performing the eigen-value decomposition on the sample covariance matrix of the fea-tures: S f = 1
N
∑Ni=1 fT
i fi , and taking the first N f eigenvectors to be its basis V f ∈ R
p×N f . The resulting feature vectors are then fiV f ∈ R
1×N f , and N f is the number of features to be used for clustering.
4. Simulations and discussions
4.1. Simulation setup
A compartmental model of the layer 5 visual cortical neu-ron [41] was adopted in the extracellular simulation for this study [28,42]. The neuron was assumed to be activated by synap-tic inputs uniformly distributed throughout the dendrites in NEU-RON [43,44]. Together with the known cell geometry, the resulting transmembrane currents of all compartments were used to gen-erate the extracellular potentials around the neuron based on a combination of line and point source approximations [45]. Five identical neurons modeled as described above were randomly ar-ranged as in Fig. 2 to mimic the parallel organization of neurons in cortical columns. All somata were separated by between 50 and 94 μm. Extracellular recordings were assumed to be taken from the gyrus with the tetrode tip placed at various points in the x–z plane and along the y-axis: (1) [75.0 0.0 0.0], (2) [0.0 0.0 75.0], (3) [−75.0 0.0 0.0], (4) [0.0 0.0 −75.0], (5) [0.0 50.0 0.0], and (6) [0.0 0.0 0.0].
The tetrode geometry specifications including sensor positions were adopted from a commercial supplier [46], and the sampling rate of the recordings was set at 20 kHz. The clear extracellular
Fig. 2. Top: Two-dimensional projection of the pyramidal cell models in our simula-tion. Bottom: Close-ups of the 5 neurons from different perspectives. Somata, axon hillocks/initial segments and dendrites are in blue, magenta and green, respectively. The extracellular recordings are taken with the tetrode tip placed at various posi-tions in the x–z plane and along the y-axis: (1) [75.0 0.0 0.0], (2) [0.0 0.0 75.0], (3) [−75.0 0.0 0.0], (4) [0.0 0.0 −75.0], (5) [0.0 50.0 0.0], and (6) [0.0 0.0 0.0]. (For interpretation of the references to color in this figure legend, the reader is referred to the web version of this article.)
Fig. 3. Clear extracellular recordings from 5 simulated neurons with the tetrode tip placed at (a) [75.0 0.0 0.0], (b) [0.0 0.0 75.0], (c) [−75.0 0.0 0.0], (d) [0.0 0.0 −75.0], (e) [0.0 50.0 0.0], and (f) [0.0 0.0 0.0] in a local coordinate system.
recordings from these 5 neurons taken with the tetrode are pro-vided in Fig. 3. A signal length of 2 ms (41 time samples per bundle) was adopted based on the duration of a typical EAP. We define the EAP bundle power ratio to be the ratio of the square of the largest singular value of the EAP bundle to the sum of the squares of all singular values. The ratio will be 100% if the neuron

S.-C. Wu, A.L. Swindlehurst / Digital Signal Processing 75 (2018) 222–231 227
is well represented by a point-source monopole (rank one data). In the simulated data, ratios as low as 75.4% and as high as 99.4% were observed for the neurons seen by the tetrode at various po-sitions. This indicates the appropriateness of the high-rank model of Equation (1) in some cases for describing the data taken by the tetrode. The noisy measurements were simulated by adding white Gaussian noise to the clear extracellular recordings with a standard deviation σw . Depending on the position relative to the neurons, this resulted in a signal-to-noise ratio (SNR) ranging from 0.349 to 8.723 with a mean and median of 1.576 and 1.043, respectively, when σw = 0.01 mV. The SNR was calculated using
SNR = RMS(ski )
σw(16)
with RMS(ski ) representing the root-mean-square value of the
recorded EAP signal of the i-th neuron from the k-th electrode.
4.2. Performance evaluation and discussion of results
Five feature extraction algorithms were implemented for perfor-mance comparison: (i) single-electrode PCA that performs principal component analysis on the tetrode tip measurements, (ii) multi-electrode PCA, also referred to as mPCA below, in which the first 5 PCs of each channel are extracted, leading to a 20-dimensional fea-ture vector for each EAP bundle before feature reduction, (iii) vec-torized PCA (vPCA) that performs the principal component anal-ysis on the vectorized EAP bundles as specified in Equation (5), (iv) block projection (BP) that extracts the AP features via Equa-tion (8), and (v) block discriminant analysis (BDA) discussed in Section 3.4. To avoid the calculation of a matrix inverse, the trace ratio problem was solved by finding a matrix that simultaneously diagonalizes both Sgl and Sbp following the procedures described in [47]. The Euclidean norm was adopted as the similarity measure of Equation (14), and ti j was set as suggested in [39]. For a given EAP bundle, 10 nearest bundles were included in the formation of the weighted graph. All the extracted features were classified us-ing the k-means clustering algorithm [48] with k = 5 and the L1 distance metric.
4.2.1. Clustering accuracyFactors including the number of features, the number of EAPs
per neuron, and noise level that may influence the clustering ac-curacy were investigated. In the first simulation, the influence of the number of features on the classification error rates was inves-tigated. The value of N f was varied from 1 to 5. A small noise level of σw = 0.01 mV was adopted, and 50 EAP bundles were collected for each neuron. Fig. 4 depicts the classification error rates aver-aged over 100 trials and one standard deviation error bars with the recordings taken at the 6 different positions. As expected, in most cases the classification errors of all the algorithms decrease as the number of features increases. Due to the elimination of informa-tion from other electrodes, single-electrode PCA was error-prone, and in some cases the classification errors increase even when the number of features increases, as seen in Fig. 4 (c). At this specific position, the EAPs from the 5 neurons seen on the tetrode possess similar waveforms (refer to the first column of Fig. 3 (c)) so that the principal subspace in which these EAPs reside will be of low dimension (2 in this case). This indicates that when the number of features is more than 2, PCs corresponding to noise instead of EAPs will start to appear in the feature sets used for clustering. Cluster-ing EAPs using an increasing number of noise features will thus be more error-prone. Among the multi-electrode approaches, the block based methods (i.e., BP and BDA) performed slightly better, especially BDA. This indicates the advantage of retaining the spatial information in the clustering. Moreover, determining the projection
Fig. 4. Influence of the number of features on classification error rates. Five feature extraction algorithms were implemented for comparison with σw = 0.01 mV. The tetrode tip was placed at (a) [75.0 0.0 0.0], (b) [0.0 0.0 75.0], (c) [−75.0 0.0 0.0], (d) [0.0 0.0 −75.0], (e) [0.0 50.0 0.0], and (f) [0.0 0.0 0.0].
matrix simply through the maximization of the total scatter may be suboptimal. Only a method such as BDA can better extract the discriminant information. This can be seen from Fig. 4 (d), where the tetrode tip was placed at [0.0, 0.0, −75.0], and Units 4 and 5 were very far from all 4 electrodes. Due to the fact that these EAPs were weak and similar in shape (see Fig. 3 (d)), their clus-ters were close to each other. Because BDA is able to ensure that EAPs in the original domain that are close to each other remain close to each other after being projected onto the reduced sub-space, the limited cluster deviation could be preserved and this led to a better classification result. Even though vectorized PCA is a fully spatiotemporal method, it performed no better than mPCA. This may be due to the difficulty in estimating Svpca .
In the second simulation, we studied the influence of the num-ber of collected EAP bundles on the classification error rates. The number of EAPs from each neuron was varied from 10 to 50. The number of features and the level of σw were kept at 5 and 0.01 mV, respectively. The resulting classification error rates are shown in Fig. 5. One thing that all 5 algorithms have in common is that the basis matrices used in these algorithms are derived from their corresponding covariance matrices via the eigenvalue decom-position, and that estimation performance largely depends on the number of available EAP bundles. We see from the figures that as the number of EAPs per neuron increases, the resulting error rates of all the algorithms decrease. To achieve a specific error rate, in all cases the BP based approaches required fewer EAPs. This may be because of the simultaneous calculation of Sbp and Sgl using the EAPs from various electrodes and the multi-rank nature of the EAP bundles, which leads to a better estimate of their covariance ma-trices and thus better classification rates. Although the size of the PCA or mPCA covariance matrix is small, only partial EAPs were

228 S.-C. Wu, A.L. Swindlehurst / Digital Signal Processing 75 (2018) 222–231
Fig. 5. Influence of the number of APs per neuron on classification error rates, N f = 5, σw = 0.01 mV, tetrode tip placed at the same positions as in Fig. 4.
used in their calculation, and thus they have the worst perfor-mance.
The influence of noise levels on the classification error rates was studied next with σw varied from 10 to 20 μV. N f was kept at 5, and the number of EAPs per neuron was set at 50. As shown in Fig. 6, the BP based algorithms are more robust to noise, with BDA performing the best. The robustness of all the algorithms to the added noise comes from eliminating the PCs with the smallest eigenvalues. As the feature vectors extracted by the BP based al-gorithms are weighted sums of the data from different columns of the multi-electrode recordings, they are capable of providing an additional filtering (smoothing) that makes the algorithms even more robust.
4.2.2. Algorithm performance under practical settingsFactors including a large number of EAPs or electrodes and the
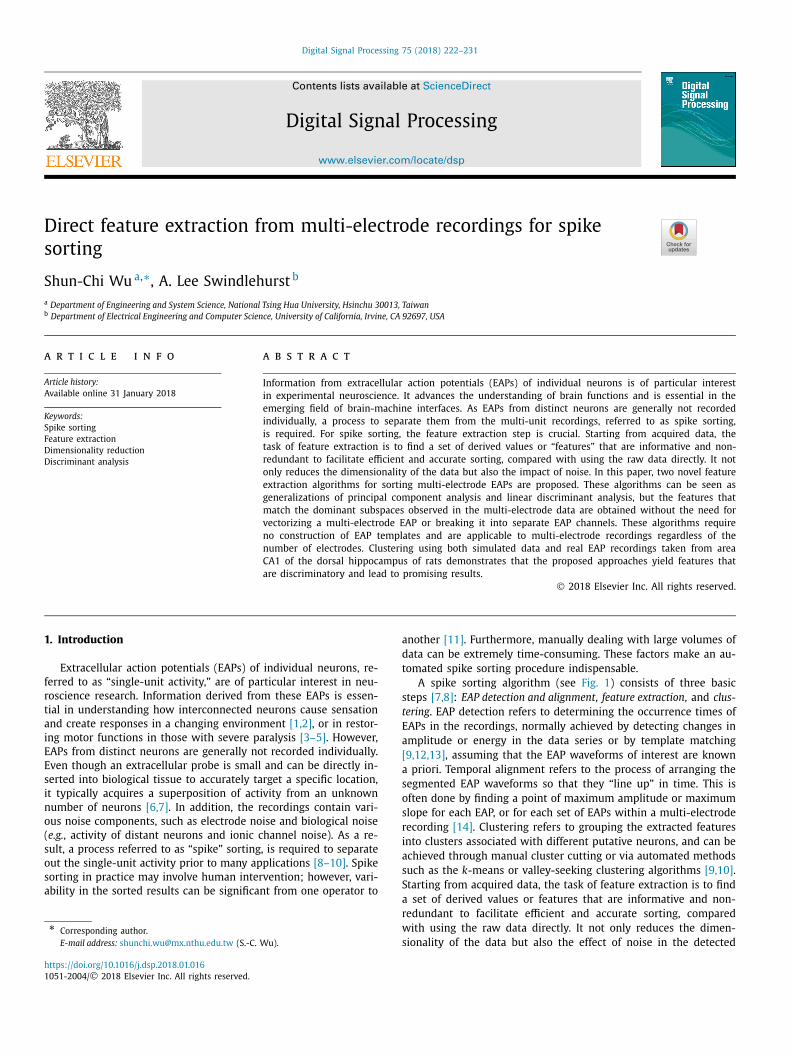
variable number of EAPs that are encountered in practice may im-pact the performance of the algorithms under investigation. To see the impact of a large number of EAPs, we placed the tetrode with its tip at the position [0.0, 0.0, −75.0], where the error rates have not yet converged as can be seen from Fig. 5 (d). The number of EAPs fired per neuron increased from 100 to 500 so that the total number of received EAPs varied from 2000 to 10000 (i.e., 4 × 5 × 500). The number of features and the noise level were kept at 5 and 0.01 mV, respectively. Again, when more EAPs are included, the resulting error rates and error variances of all the al-gorithms decrease as shown in Fig. 7 (a). Referring to Fig. 7 (b), the mean MATLAB computation time (averaged over 100 trials with an Intel Xeon CPU E5-2609 v2) required to implement each algorithm increases. BDA is the most computationally demanding because of the construction of the graph. vPCA is second due to the calcula-tion of Svpca , which takes 0.463 s when the number of EAPs per
Fig. 6. Influence of noise level on classification error rates, N f = 5, tetrode tip placed at the same positions as in Fig. 4.
neuron was 500. Under the same conditions, the mean computa-tion times were 0.036, 0.133 and 0.101 s for PCA, mPCA, and BP, respectively.
The influence of the number of electrodes on algorithm perfor-mance was studied next. To increase the number of electrodes, we added more tetrodes around the 5 simulated neurons. The tetrode tips, except for the one at [0.0, 50.0, 0.0]), were positioned at the vertices of 3 regular octagons on the x–z plane centered at the origin, whose circumradii are 50, 75 and 100 μm. Note that the positions (a), (b), (c) and (d) shown in Fig. 3 correspond to the ver-tices of an octagon of circumradius 75 μm. For the single-electrode PCA, the recording from the electrode at [0.0, 50.0, 0.0] was used. The number of EAPs per neuron, the number of features, and the noise level were 50, 5 and 0.01 mV, respectively. As can be seen from Fig. 7 (c) and (d), increasing the number of electrodes helps correctly distinguish EAPs from different neurons, leading to an er-ror rate of 0% for all the algorithms in this 5-neuron simulation. BDA requires more computation time for reasons discussed before. Interestingly, the mean computation time for vPCA is comparable to that of BDA when the number of electrodes is 100. As the num-ber of electrodes increases, the number of floating point operations (flops) required to calculate Svpca is proportional to the square of the number of electrodes. In this simulation, this calculation took 32.744 s out of the total 40.386 s computation time. BP used only 0.177 s to finish all the calculations, while maintaining the same error rate.
To see the influence of variable numbers of spikes on the per-formance of the algorithms, we intentionally set the number of EAPs from one of the neurons to be 10 times that of the others. This number varied from 1000 to 3000 at increments of 500 for cases 1 to 5. The tetrode tip was placed at [0, 0, 0] (i.e. position (f) in Fig. 5) since the error rates for all the algorithms here were 0% even using a small number of EAPs. The number of features and
S.-C. Wu, A.L. Swindlehurst / Digital Signal Processing 75 (2018) 222–231 229
Fig. 7. Error rates and average MATLAB computation times for various algorithms under different conditions. (a) and (b): a large number of APs. (c) and (d): a large number of electrodes. (e) and (f): variable numbers of APs.
the noise level were maintained at 5 and 0.01 mV. The results are shown in Fig. 7 (e) and (f). For this scenario, none of the algorithms achieved a 0% error rate even when the total number of EAPs in-creased to 16800 (i.e., 4 × (3000 + 4 × 300)). By selecting signal dimensions that have significant variance in the data, PCA-related approaches are able to give compact representations for an EAP with a minimum loss of information. However, when one neuron fires more EAPs than others, its APs will dominate the covariance matrix and also the subsequently selected basis vectors. The re-sulting basis will then maximize the total scatter of the APs from that specific neuron instead of the total scatter of all the EAPs. As a result, feature clusters of all the EAPs will overlap each other and thus will lead to higher error rates. This is a common disadvantage of approaches like those studied here that rely on data-dependent bases for extracting features. Interestingly, when the ratio was re-duced to 5 (e.g., 1500 versus 300), the error rates became 0 as shown in Case 6 of Fig. 7 (e).
In summary, although there are many applications where the probes are quite small (with only a handful of electrodes) and re-ceive signals from a relatively small number of neurons [19,26,30], cases involving very large electrode arrays or data sets with very large numbers of EAPs would clearly have to be addressed by other methods, especially for BDA. However, the computational load of BDA can be reduced by breaking the data set into smaller segments, although this would require a method for combining to-gether the results from different data segments.
4.2.3. Computational complexityTo get a sense of the computational complexity of the var-
ious algorithms, note that the computational load is dominated
by the calculation of various covariance matrices and their corre-sponding eigenvalue decompositions, and thus our analysis focuses on them. In particular, the covariance and eigenvalue computa-tions of PCA require O (Nn2) and O (n3) flops, respectively, result-ing in a computational cost on the order of O (Nn2 + n3). mPCA requires O (mNn2 + mn3) flops, or simply m times that of PCA. Since Svpca is of size mn × mn, vPCA needs O (N(mn)2 + (mn)3)
flops. The calculation of Sbp requires O (mNn2) flops, but its eigen-value decomposition requires only O (n3) because the size of Sbpis only n × n. Consequently, the order of computation for imple-menting BP is O (mNn2 + n3). For BDA, constructing the graph (i.e., calculating the wij in Equation (14) requires calculation of the Euclidean norm of the difference matrices of
(N2
)AP bundle
pairs. This requires O ((N
2
)Nn2) flops, assuming use of the singu-
lar value decomposition. The calculation of Sgl and Sbp requires at least O (2mNn2) flops. Solving Equation (15) via a generalized eigenvalue decomposition requires one matrix inverse, one matrix multiplication, and one eigenvalue decomposition, resulting in a complexity of O (3n3). The total complexity of BDA is thus on the order of O (
(N2
)Nn2 + 2mNn2 + 3n3).
5. Experiments with real measurements
In this section, the applicability of the proposed block based feature extraction algorithms to real EAP signals was studied. The extracellular recordings used for this study were taken from area CA1 of the dorsal hippocampus of anesthetized rats [23,49,50], which were amplified and band-pass filtered between 1 Hz and 3000 kHz. Five of the datasets including d11221.002, d11222.001, d12821.001, d14521.002, and d1122109 were selected for the present evaluation. Although the recordings were taken with a sampling rate of either 10 kHz or 20 kHz, these 20 kHz sam-pled datasets were of better quality [51]. Except d1122109 which was made with silicon electrode arrays at 6 recording sites spaced 25 μm apart, the remaining datasets were taken with wire tetrodes consisting of four 13-mm polyimide-coated nichrome wires. Even though the multi-electrode recordings of d1122109 had 6 chan-nels, only 4 of them were utilized. The occurrence of EAPs was detected by means of simultaneously acquired intracellular record-ings. Like [49], an EAP was identified if it occurred within 1 ms on either side of the peak of a specific intracellular AP. For each dataset, 50 EAP bundles of 2 ms duration (41 time samples per bundle) were isolated as depicted in Fig. 8. The EAPs of a specific neuron taken from the same channel had similar waveforms, and the average waveforms (depicted in red) of the 5 identified units appear to be distinct. The SNRs of these EAPs varied from 1.371 to 4.997, with a mean and median of 2.945 and 2.556, respectively. To estimate the SNRs, we first found σw for each channel. This was done by removing the portions of the recordings corresponding to the identified EAPs, and then calculating the standard deviation of the remaining data. Once σw was obtained, the SNR was calcu-lated using Equation (16). These 250 EAP bundles were then used for performance evaluation.
As with the simulated data examples, features from the follow-ing algorithms were identified: (i) single-electrode PCA (channel 1 only), (ii) multi-electrode PCA, (iii) vectorized PCA, (iv) block projection, and (v) block discriminant analysis. As the EAPs were well collected, no significant interference was found. Finally, the k-means clustering algorithm with k = 5 and the L1 distance met-ric was used to group the EAPs with N f varied from 2 to 5. To reduce the influence of the cluster center initialization in the k-means clustering algorithm, 100 trials were conducted for each number of features. The classification error rates are plotted in Fig. 9. Single-electrode PCA performed the worst as it relied only on data from the first channel, and Units 3 and 4 have very similar

230 S.-C. Wu, A.L. Swindlehurst / Digital Signal Processing 75 (2018) 222–231
Fig. 8. EAP bundles identified from the 5 datasets taken from area CA1 of the dorsal hippocampus of anesthetized rats. The EAPs of different neurons are represented by different colors with the average waveforms depicted in red. The sampling rate was 20 kHz. (For interpretation of the references to color in this figure legend, the reader is referred to the web version of this article.)
Fig. 9. Influence of the number of features on classification error rates.
waveforms in that channel, as can be seen from Fig. 8. Additional discriminant information is given by channels 2 to 4. This is likely why the multi-electrode-based algorithms exhibited better classi-fication rates in this case. Among the algorithms, BDA performed the best for the reasons discussed in the previous section. Once more than 3 features were used for clustering, an error rate of 0% was achieved at the price of a higher computational load.
6. Conclusions
This paper has presented two novel block projection based algorithms to extract features from multi-electrode extracellular recordings in spike sorting applications. The extraction process be-gins by determining some specific subspaces of the multi-electrode recordings through the eigenvalue decomposition of the total scat-ter and the proposed block discriminant criterion. Features are
then extracted by directly projecting the EAP bundles onto these subspaces. Accompanied by a further dimensionality reduction, the ultimate feature vectors can be of low dimension. Various factors that may influence the clustering results are studied through a se-ries of simulations to determine the proper settings to be used in the proposed algorithms. Results from these simulations demon-strate that the proposed approaches yield features that are more discriminatory. Using real EAP recordings taken by a tetrode (or an electrode array) from area CA1 of the dorsal hippocampus of rats, the BDA features are shown to lead to the best results, achieving an error rate of 0% while clustering 250 EAPs from the 5 identified neurons.
Acknowledgments
The authors would like to thank Buzsaki Lab for making their recordings publicly available. Help from Jeff Teeters for creating an account at CRCNS.org is appreciated. Shun-Chi Wu was supported by the Ministry of Science and Technology of Taiwan, R.O.C. (MOST 106-2221-E-007-059).
Appendix A. Derivation of Equation (13)
J gl(V) =∑i, j
tr{(XiV − X jV)T(XiV − X jV)}wij
= 2∑i, j
tr{(VTXTi XiV − VTXT
i X jV)wij}
= 2tr{VT(∑
i
XTi Xi
∑j
wij −∑
i j
XTi X j wij)V}
= 2tr{VT([XT1, . . . ,XT
N ](D ⊗ Im)
⎡⎢⎣
X1...
XN
⎤⎥⎦
− [XT1, . . . ,XT
N ](W ⊗ Im)
⎡⎢⎣
X1...
XN
⎤⎥⎦)V}
= 2tr{VTX(L ⊗ Im)XTV} = 2tr{VTSglV} .
References
[1] G. Buzsáki, Large-scale recording of neuronal ensembles, Nat. Neurosci. 7 (2004) 446–451.
[2] R.Q. Quiroga, S. Panzeri, Extracting information from neuronal populations: information theory and decoding approaches, Nat. Rev. Neurosci. 10 (2009) 173–185.
[3] L.R. Hochberg, M.D. Serruya, G.M. Friehs, J.A. Mukand, M. Saleh, A.H. Caplan, A. Branner, D. Chen, R.D. Penn, J.P. Donoghue, Neuronal ensemble control of prosthetic devices by a human with tetraplegia, Nature 442 (2006) 164–171.
[4] M.D. Linderman, G. Santhanam, C.T. Kemere, V. Gilja, S. O’Driscoll, B.M. Yu, A. Afshar, S.I. Ryu, K.V. Shenoy, T.H. Meng, Signal processing challenges for neu-ral prostheses, IEEE Signal Process. Mag. 25 (2008) 18–28.
[5] S. Todorova, P. Sadtler, A. Batista, S. Chase, V. Ventura, To sort or not to sort: the impact of spike-sorting on neural decoding performance, J. Neural Eng. 2014 (2014) 056005.
[6] J.G. Cham, E.A. Branchaud, Z. Nenadic, B. Greger, R.A. Andersen, J.W. Burdick, Semi-chronic motorized microdrive and control algorithm for autonomously isolating, optimizing and maintaining extracellular action potentials, J. Neuro-physiol. 93 (2005) 570–579.
[7] R.Q. Quiroga, Spike sorting, Curr. Biol. 22 (2012) R45–R46.[8] H.G. Rey, C. Pedreira, R.Q. Quiroga, Past, present and future of spike sorting
techniques, Brain Res. Bull. 119 (2015) 106–117.[9] S. Gibson, J.W. Judy, D. Markovic, Spike sorting: the first step in decoding the
brain, IEEE Signal Process. Mag. 29 (2012) 124–143.[10] M.S. Lewicki, A review of methods for spike sorting: the detection and classifi-
cation of neural action potentials, Netw. Comput. Neural 9 (1998) R53–R78.
S.-C. Wu, A.L. Swindlehurst / Digital Signal Processing 75 (2018) 222–231 231
[11] F. Wood, M.J. Black, C. Vargas-Irwin, M. Fellows, J.P. Donoghue, On the variabil-ity of manual spike sorting, IEEE Trans. Biomed. Eng. 51 (2004) 912–918.
[12] F. Franke, R.Q. Quiroga, A. Hierlemann, K. Obermayer, Bayes optimal template matching for spike sorting – combining fisher discriminant analysis with opti-mal filtering, J. Comput. Neurosci. 38 (2015) 439–459.
[13] M. Pachitariu, N.A. Steinmetz, S.N. Kadir, M. Carandini, K.D. Harris, Fast and accurate spike sorting of high-channel count probes with KiloSort, Adv. Neural Inf. Process. Syst. 29 (2016) 4448–4456.
[14] R. Chandra, L.M. Optican, Detection, classification, and superposition resolution of action potentials in multiunit single-channel recordings by an on-line real-time neural network, IEEE Trans. Biomed. Eng. 44 (1997) 403–412.
[15] Z. Yang, Q. Zhao, W. Liu, Improving spike separation using waveform deriva-tives, J. Neural Eng. 6 (2009) 046006.
[16] J.C. Letelier, P.P. Weber, Spike sorting based on discrete wavelet transform co-efficients, J. Neurosci. Methods 101 (2000) 93–106.
[17] R.Q. Quiroga, Z. Nadasdy, Y. Ben-Shaul, Unsupervised spike detection and sort-ing with wavelets and superparamagnetic clustering, Neural Comput. 16 (2004) 1661–1687.
[18] P.J. Durka, A. Matysiak, E.M. Montes, P.V. Sosa, K.J. Blinowska, Multichannel matching pursuit and EEG inverse solutions, J. Neurosci. Methods 148 (2005) 49–59.
[19] C.M. Gray, P.E. Maldonado, M. Wilson, B. McNaughton, Tetrodes markedly im-prove the reliability and yield of multiple single-unit isolation from multi-unit recordings in cat striate cortex, J. Neurosci. Methods 63 (1995) 43–54.
[20] F. Franke, R. Pröpper, H. Alle, P. Meier, J.R. Geiger, K. Obermayer, M.H. Munk, Spike sorting of synchronous spikes from local neuron ensembles, J. Neuro-physiol. 114 (2015) 2535–2549.
[21] C. Rossant, S.N. Kadir, D.F.M. Goodman, J. Schulman, M.L.D. Hunter, A.B. Saleem, A. Grosmark, M. Belluscio, G.H. Denfield, A.S. Ecker, A.S. Tolias, S. Solomon, G. Buzsáki, M. Carandini, K.D. Harris, Spike sorting for large, dense electrode arrays, Nat. Neurosci. 19 (2016) 634–641.
[22] J. Csicsvari, H. Hirase, A. Czurko, G. Buzsaki, Reliability and state dependence of pyramidal cell-interneuron synapses in the hippocampus: an ensemble ap-proach in the behaving rat, Neuron 21 (1998) 179–189.
[23] K.D. Harris, D.A. Henze, J. Csicsvari, H. Hirase, G. Buzsáki, Accuracy of tetrode spike separation as determined by simultaneous intracellular and extracellular measurements, J. Neurophysiol. 84 (2000) 401–414.
[24] J.-O. Muthmann, H. Amin, E. Sernagor, A. Maccione, D. Panas, L. Berdondini, U.S. Bhalla, M.H. Hennig, Spike detection for large neural populations using high density multielectrode arrays, Front. Neuroinform. 9 (2015) 28.
[25] G.T. Einevoll, F. Franke, E. Hagen, C. Pouzat, K.D. Harris, Towards reliable spike-train recordings from thousands of neurons with multielectrodes, Curr. Opin. Neurobiol. 22 (2012) 11–17.
[26] M.I. Chelaru, M.S. Jog, Spike source localization with tetrodes, J. Neurosci. Methods 142 (2005) 305–315.
[27] A.A. Szymanska, A. Hajirasooliha, Z. Nenadic, Source location as a feature for the classification of multi-sensor extracellular action potentials, Proc. IEEE EMBS (2013) 235–238.
[28] S.-C. Wu, A.L. Swindlehurst, Z. Nenadic, A novel framework for feature extrac-tion in multi-sensor action potential sorting, J. Neurosci. Methods 253 (2015) 262–271.
[29] D. Jäckel, U. Frey, M. Fiscella, F. Franke, A. Hierlemann, Applicability of inde-pendent component analysis on high-density microelectrode array recordings, J. Neurophysiol. 108 (2012) 334–348.
[30] S. Takahashi, Y. Sakurai, M. Tsukada, Y. Anzai, Classification of neuronal activ-ities from tetrode recordings using independent component analysis, Neuro-computing 49 (2002) 289–298.
[31] Z. Somogyvári, L. Zalányi, I. Ulbert, P. Érdi, Model-based source localization of extracellular action potentials, J. Neurosci. Methods 147 (2005) 126–137.
[32] Y. Shiraishi, N. Katayama, T. Takahashi, A. Karashima, M. Nakao, Multi-neuron action potentials recorded with tetrode are not instantaneous mixtures of sin-gle neuronal action potentials, Proc. IEEE EMBS (2009) 4019–4022.
[33] J. Müller, M. Ballini, P. Livi, Y. Chen, M. Radivojevic, A. Shadmani, V. Viswam, I.L. Jones, M. Fiscella, R. Diggelmann, A. Stettler, U. Frey, D.J. Bakkum, A. Hier-lemann, High-resolution CMOS MEA platform to study neurons at subcellular, cellular, and network levels, Lab Chip 15 (2015) 2767–2780.
[34] C. Pouzat, O. Mazor, G. Laurent, Using noise signature to optimize spike-sorting and to assess neuronal classification quality, J. Neurosci. Methods 122 (2002) 43–57.
[35] I. Bankman, K. Johnson, W. Schneider, Optimal detection, classification, and su-perposition resolution in neural waveform recordings, IEEE Trans. Biomed. Eng. 40 (1993) 836–841.
[36] S.C. Wu, A.L. Swindlehurst, P.T. Wang, Z. Nenadic, Projection vs. prewhiten-ing for EEG interference suppression, IEEE Trans. Biomed. Eng. 59 (2012) 1329–1338.
[37] J. Yang, D. Zhang, A.F. Frangi, J.-Y. Yang, Two-dimensional PCA: a new approach to appearance-based face representation and recognition, IEEE Trans. Pattern Anal. Mach. Intell. 26 (2004) 131–137.
[38] K. Fukunaga, Introduction to Statistical Pattern Recognition, Academic Press, New York, 1990.
[39] Y. Ghanbari, L. Spence, P. Papamichalis, A graph-laplacian-based feature extrac-tion algorithm for neural spike sorting, Proc. IEEE EMBS (2009) 3142–3145.
[40] E. Kokiopoulou, J. Chen, Y. Saad, Trace optimization and eigenproblems in di-mension reduction methods, Numer. Linear Algebra 18 (2011) 565–602.
[41] Z.F. Mainen, T.J. Sejnowski, Influence of dendritic structure on firing pattern in model neocortical neurons, Nature 382 (1996) 363–366.
[42] Z. Nenadic, J.W. Burdick, A control algorithm for autonomous optimization of extracellular recordings, IEEE Trans. Biomed. Eng. 53 (2006) 941–955.
[43] M.L. Hines, N.T. Carnevale, The neuron simulation environment, Neural Comput. 9 (1997) 1179–1209.
[44] G.R. Holt, C. Koch, Electrical interactions via the extracellular potential near cell bodies, J. Comput. Neurosci. 6 (1999) 169–184.
[45] G. Holt, A Critical Reexamination of Some Assumptions and Implications of Cable Theory in Neurobiology, Ph.D. dissertation, California Instit. Technol, Pasadena.
[46] Thomas recording: tetrode datasheet, http://www.thomasrecording.com/products.html, 2011.
[47] H. Yu, J. Yang, A direct LDA algorithm for high-dimensional data – with appli-cation to face recognition, Pattern Recognit. 34 (2001) 2067–2070.
[48] R.O. Duda, P.E. Hart, D.G. Stork, Pattern Classification, Wiley–Interscience, New York, 2001.
[49] D.A. Henze, Z. Borhegyi, J. Csicsvari, A. Mamiya, K.D. Harris, G. Buzsáki, Intra-cellular features predicted by extracellular recordings in the hippocampus in vivo, J. Neurophysiol. 84 (2000) 390–400.
[50] D.A. Henze, K.D. Harris, Z. Borhegyi, J. Csicsvari, A. Mamiya, H. Hirase, A. Sirota, G. Buzsáki, Simultaneous Intracellular and Extracellular Recordings from Hip-pocampus Region CA1 of Anesthetized Rats, Collaborative Research in Compu-tational Neuroscience, 2009, CRCNS.org.
[51] T. Takekawa, Y. Isomura, T. Fukai, Accurate spike sorting for multi-unit record-ings, Eur. J. Neurosci. 31 (2010) 263–272.
Shun-Chi Wu received the B.S. and M.S. degrees in Engineering and System Science from National Tsing Hua University, Hsinchu, Taiwan, in 2000 and 2002, respectively, and the Ph.D. degree in Electrical Engineer-ing and Computer Science from University of California, Irvine, in 2012. From 2003 to 2007, he was a research assistant at National Space Or-ganization, Hsinchu, Taiwan. In 2013, he was employed at IMEC, Taiwan Co., of Hsinchu, Taiwan, where he was involved in the design of algo-rithms and architectures for several wearable devices. He is currently an assistant professor of Engineering and System Science at National Tsing Hua University. His research interests include biomedical signal processing, biometric recognition, source localization/reconstruction, and brain con-nectivity analysis.
A. Lee Swindlehurst received the B.S. and M.S. degrees in Electrical En-gineering from Brigham Young University, Provo, Utah, in 1985 and 1986, respectively, and the PhD degree in Electrical Engineering from Stanford University in 1991. He was on the faculty of the Department of Electrical and Computer Engineering at Brigham Young University from 1990–2007, where he was a Full Professor and served as Department Chair from 2003–2006. During 1996–1997, he held a joint appointment as a visit-ing scholar at both Uppsala University, Uppsala, Sweden, and at the Royal Institute of Technology, Stockholm, Sweden. From 2006–2007, he was on leave working as Vice President of Research for ArrayComm LLC in San Jose, California. He is currently a Professor in the Electrical Engineering and Computer Science Department at the University of California Irvine (UCI), a former Associate Dean for Research and Graduate Studies in the Henry Samueli School of Engineering at UCI, and a former Hans Fischer Senior Fellow in the Institute for Advanced Studies at the Technical Uni-versity of Munich. His research interests include detection and estimation theory for radar, wireless communications, and biomedical signal process-ing, and he has over 300 publications in these areas. Dr. Swindlehurst is a Fellow of the IEEE, past Editor-in-Chief of the IEEE Journal of Selected Topics in Signal Processing, and past member of the Editorial Boards for the EURASIP Journal on Wireless Communications and Networking, IEEE Sig-nal Processing Magazine, and the IEEE Transactions on Signal Processing. He is a recipient of several paper awards: the 2000 IEEE W. R. G. Baker Prize Pa-per Award, the 2006 and 2010 IEEE Signal Processing Society’s Best Paper Awards, the 2006 IEEE Communications Society Stephen O. Rice Prize in the Field of Communication Theory, and the 2017 IEEE Signal Processing Society Donald G. Fink Overview Paper Award.