CARBON-PLASTIC COMPOSITE ELECTRODE ... - UNSWorks
354
CARBON-PLASTIC COMPOSITE ELECTRODE FOR VANADIUM REDOX FLOW BATTERY APPLICATIONS A thesis submitted as part of the requirements for the degree of Doctor of Philosophy (Ph.D.) by SHillUANG ZHONG (M.E.) School of Chemical Engineering and Industrial Chemistry University of New South Wales AUSTRALIA March, 1992
-
Upload
khangminh22 -
Category
Documents
-
view
0 -
download
0
Transcript of CARBON-PLASTIC COMPOSITE ELECTRODE ... - UNSWorks

CARBON-PLASTIC COMPOSITE ELECTRODE FOR VANADIUM
REDOX FLOW BATTERY APPLICATIONS
A thesis submitted as part of the requirements for the degree of
Doctor of Philosophy (Ph.D.)
by
SHillUANG ZHONG (M.E.)
School of Chemical Engineering and Industrial Chemistry
Th~ University of New South Wales
AUSTRALIA
March, 1992

ill-,'lYERSITY OF NEW SOlJTH WALES Thesis/Project Report Sheet
. ZHoN, SurnameorFum1lyname: ............................................................................................................................................................................................. .. SH t HU P.,.1'-iC#' First name: ...................... .....• : ....... ................................. , ... ... .. ... . .. . .. Other name/s ................................................. , ................................................... ..
Abbreviation for degree as given in the University calendar: ...... P.h ... :P. ........................................................................................................................ .. &hool: ..... .CHEr.1 ..... iN..� ..... t. ... L.Ne .... c.t:!.!?.M ............ Faculty: ....... Af..f.!df'-?: .... :?...�.1��� ................................................ ..1itk:: •......... P.:A�.6..P!:':!.::: .... e�.f.\§.T.!.f.-..... f.P..1:1 .. r..!?:?. . .t.I.€.§..'!F..<;;r.rsQP...& .... E.<?.& .. r.�.t::!A..e.r.�.M ...... �:!::':?.� .... . ................ F..£.r.9.� .... !?..f:tT.JJ§.f!:.Y.. ...... /2:r.r.:.i:.1 ... �6.C!.9..t:!:§: ................................................................................................................ ... • ••• • • •••• • • • • •••• • • • .. •••••••••• ••• • • .. • • • • • • ••••••••••••• .. •• .. ••• • .. • •• .. •••••••••"""'•••••••••••••• • • •••• .. •••10 .. noooOOOO,.ooooooooo,o,ou, .. ,o .. oooOOOOOo••OOOo>•••""HOOOOHo•H•••••H•H••HH.HH•o•uooo•HU .. O
Abstract 350 words maximum: (PLEASE TYPE)
Carbon-plastic composite electrodes (CPCE) for the vanadium redox flow battery (Vbattery) have been developed and investigated. Electrical, mechanical and electrochemical propenies a,; well as the solution permeability of the carbon-plastic composite (CPC) materials were evaluated. The electrode kinetics of vanadium redox couples at graphite electrodes, and the activation treatment on the surface of the CPC was also studied. The surface physical and chemical pmpcnies of carbon/graphite felts were investigated intensively with SEM and XPS techniques to establish their suitability and properties as electrode active layers on the CPCE. Electrocatalysis and cell performance of the V-battery employing the CPCE were also evaluated.
CPC material modified with SEBS rubber has been shown to have excellent electrical and mechanical properties, as well as being solution impermeable. An overall energy efficiency of 88% has been achieved for a V-battery employing the CPCE at a charge/discharge current density of 21.7 mA/cm2
• The electrodes were tested for more than 5780 hours (1240 cycles) and shown excellent stability.
The redox reactions of vanadium redox couples are electrochemically irreversible at the flat graphite electrode. The io for V(V)N(IV) couple was determined to be 2.47 x 10
4 A/cm2• The k0
for V(III)N(II) couple was calculated to be 3.63 x 104 cm/sec. The diffusivity of V(IV) and V(III)
species ·was found independent of vanadium concentration with diffusion coefficient values of 2.14 x IO"' cni2/scc and 1.25 x. 1� cm2/sec respectively.
The PAN based GFD 2 graphite felt was found more stable in air and anodic oxidation than that of rayon based FMI graphite felt. XPS analysis revealed that anodic oxidation of the CPCE in the V-battery results in a formation of four types of carbon-oxygen groups on the graphite felt surf ace. The overcharged samples show a high surface concentration of -CO3• groups which is believed to contribute to electrode deterioration.
Excellent cell performance has been achieved by using silver as the electrocatalyst for the negative electrode and a thermally treated GFD 2 felt as the positive electrode. A cell resistance value of 1.5 n.cm2 and an overall energy efficiency of 80% at 100 mA/cm2 were observed with a V-battcry using these catalysed electrodes.
Ded.aral!on relating to dlspo�ltlon of project reportltbesls
I am fully •wm of the policy of the university relating to the retention and use ofhigherde�,projectreports and theses, namelythatthe University retains thecopicuubmitt«l for examination 11.nd is free to allow them to be con.sultedprb9rrowed. Subject to the provisions oft.be CopyrightAct 1968, the Universitymay issue aprojectreportortheais in whole orln part, in photostate orrnictofilm or other copying medium. l also authorise the publication by University Microfilms of a 350word abstract in Dissenation Abstracts International (applicable to doctorates only).... ................ 11.. .•. 3 .. 0�;1, .................... .
The Univc1tity recognises that there maybe exceptional circumstance�, requiring �t,rlction.s on oqpying or conditions on ust, Reques,"1�trestrlction for a period ofupto 2 years must he made in writing to the Registrar. Requests for a lcingerperiod of restrictio�.r,a)1'1pecoia�ineitcepti9nal cWumstances ifaccompanied bya letter of support from the Supervisor or Head of School. Such requests must he submitted' with the'thesis/proJ�,report. FOR OFFICE USE ONLY Date of completion of requirements for Award:
V Tms SHEET IS TO BE GLUED TO THE INSIDE FRONT COVER OF nm TI:mSIS

I hereby declare that this submission is my own work and that, to the best of my
knowledge and belief, it contains no material previously published or written by
another person nor material which to a substantial extent has been accepted for the
award of any other degree or diploma of a university or other institute of higher
learning, except where due acknowledgment is made in the text.
PUBLICATIONS ARISING FROM THIS STUDY
1. S. Zhong, R. Butford and M. Skyllas-Kazacos, "Composite Conducting Polyethylene Electrode for Electrochemical Application", Proceedings of Workshop on New Developments in Electrode Materials and their Applications, Dept. of Ind., Tech. and Commerce, Australia (Ed. Leo Wood and Alan J. Jones), Wollongong, New South Wales, Feb., (1990) 276-284.
2. S. Zhong, M. Kazacos, R.P. Burford and M. Skyllas-Kazacos, "Fabrication and Activation Studies of Conducting Plastic Composite Electrodes for Redox Cell Applications", J. Power Sources, 36 (1991) 29-43.
3. S. Zhong and M. Skyllas-Kazacos, "The Electrochemical Behaviour of V(V)N(IV) Redox Couple at Graphite Electrode", J. Power Sources, 39 (1992) 1-9.
4. S. Zhong and M. Skyllas-Kazacos, "Activation Studies of Conducting Carbon-plastic Electrodes for Vanadium Redox Battery Applications", Electrochemistry in Australia: From Natural Resources to Value Added Products, Royal Australian Chemical Institute Electrochemistry Division, New Castle, July, (1991).
5. S. Zhong, M. Kazacos and M. Skyllas-Kazacos, "Carbon-plastic Electrode Material", Australian Patent (applied), Aug. (1991).
6. S. Zhong, M. Kazacos and M. Skyllas-Kazacos, "Fabrication and Evaluation of Carbon-plastic Electrodes for Vanadium Battery application", to be submitted.
7. S. Zhong, C. Padeste, M. Kazacos and M. Skyllas-Kazacos, "Surface Physical and Electrochemical Characteristics of Carbon Fibre Electrodes", J. Power Sources, submitted.
8. S. Zhong, M. Kazacos and M. Skyllas-Kazacos, "Electrocatalysts for Vanadium Redox Flow cell System", to be submitted.

ACKNOWLEDGMENTS
I wish to thank Associate Professor Maria Skyllas-Kazacos for the help,
supervision and guidance she has given throughout the study of this project. I also
wish to thank Professor Robert P. Burford for his help and advice in polymer
processing and properties measurement and Dr. Celestino Pedeste for his help in
XPS analysis.
The help and encouragement of Mr. Michael Kazacos during my study is most
appreciated. The assistance of Mr. Youzhen Cheng, Dr. Djen Keshermen, Messrs.
Dun Rui Hong, S. C. Chieng, H. Chau, Mrs Kate Nasev and Mr. Steve Jacenyick,
as well as the staff of vanadium development team and fellow postgraduate
students of the electrochemistry group, are gratefully acknowledged.
I would also like to thank the NSW Department of Minerals and Energy, Australia
and the Australian Research Council for their financial support.
Especially, I wish to thank my wife, Nianshan Hu, for her love, encouragement
and full support throughout the duration of my studies. Also, thanks to my
parents, sisters and brothers, for their love and support during the whole of my
life.
i
ABSTRACT
Carbon-plastic composite electrodes for the vanadium redox flow battery have
been developed and investigated. Electrical, mechanical and electrochemical
properties as well as the solution permeability of the carbon-plastic composite
materials were evaluated. The electrode kinetics of vanadium redox couples at
graphite electrodes, and the activation treatment on the surface of the carbon
plastic composite were also studied. The surface physical and chemical properties
of carbon/graphite felts were studied intensively with SEM and XPS techniques to
establish their suitability and properties as electrode active layer on the conducting
plastic composite electrodes. Electrocatalysis and cell performance of the
vanadium redox flow battery employing the composite electrode was also
evaluated.
Carbon-HDPE composite material (composition of 60% HDPE, 20% graphite
fibre, 20% carbon black) modified with SEBS thermo-plastic rubber has been
shown to have excellent electrical and mechanical properties, as well as being
solution impermeable. Chemical treatment of graphite fibre based composite
results in a surface area enhancement and an improved reactivity for the vanadium
ion redox reactions.
An overall energy efficiency of 88% can be achieved with the graphite
felt/carbon-HDPE composite electrodes at a cell charge/discharge current density
of 21.7 mA.cm-2• The composite electrodes were tested for more than 5780 hours
(1240 cycles) in the vanadium redox battery and have shown excellent stability.
ii

The kinetics of the V(V)N(IV) and V(ill)N(TI) redox couple reactions have been
found to be electrochemically irreversible at the flat graphite electrodes. The
exchange current density, i0, for V(V)N(IV) couple at this electrode was
determined to be 2.47 x 10⁴ A.cm·2• The electron transfer rate constant for
V(ITI)N(II) couple was calculated to be 3.63 x 104 cm.s·1• The diffusivity of
V(IV) and V(III) species was found independent of vanadium concentration with
diffusion coefficient values of 2.14 x 10·6 cm2.s·1 and 2.60 x 10"6 cm2.s·1
respectively. The equilibrium exchange current density values at graphite felt
electrodes increased by a factor 102, however, showing that acceptable charge
transfer rate are possible with these porous flow-through electrodes.
The PAN based GFD 2 graphite felt was found more stable in air and anodic
oxidation than that of rayon based FMI graphite felt. XPS analysis revealed that
when operated as positive electrodes under normal cell charge/discharge
conditions, four types of carbon-oxygen groups formed on the graphite felt
surface. The overcharged samples show a high surface concentration of -Co3•
groups which is believed to contribute to electrode deterioration.
In the electrocatalysis and activation studies, excellent cell performance was
achieved by using silver as the electrocatalyst for the negative electrode and a
thermally treated GFD 2 felt as positive electrode. A cell resistance of 1.5 Q.cm2
and an overall energy efficiency of 80% at 100 mA.cm2 were observed with a
vanadium cell employing these catalysed electrodes, compared with 3.0 Q.cm2 for
the untreated electrodes.
iii
TABLE OF CONTENTS
ACKNOWLEDGEMENTS
ABSTRACT TABLES OF CONTENTS
LIST OF FIGURES LIST OF TABLES
LIST OF SYMBOLS
CHAPTER I INTRODUCTION
1.1 Background
1.2 Early Research Work on Electrodes for the Vanadium Redox Flow Battery
1.3 The Aim of the Present Project and Brief Description
of the Thesis
CHAPTER II LITERATURE REVIEW
2.1 General Requirements for Electrodes Used in the Redox Flow Battery
2.2 Electrodes Used in Redox Flow Cells
2.2.1 Electrode Materials
2.2.2 Structural Characteristics of Electrodes for Redox
Flow Cells
2.3 Conducting Carbon-Plastic Composite Electrodes
2.3.1 The Concept of Conducting Carbon-Plastic Composite Electrodes
2.3.2 Advances in Carbon-Plastic Composite Electrodes
2.3.2.1 Carbon-PTFE Composite Electrodes
2.3.2.2 Polyolefm Based Carbon-Plastic Composite
lV
i
ii
iv xi
XXI
xxiv
1
1
4
6
9
9
12
12
16
25
25
27 27

Electrodes
2.4 Carbon-Plastic Composite Materials
2.4.1 Mechanism of Electrical Conducting in Composite Materials
2.4.2 The Effect of Conducting Fillers Content on Electrical Conductivity of Composites
2.4.3 The Influence of Particle Sizes and Surface Area of Conducting Fillers on Electrical Conductivity
2.4.4 The Influence of Polymer Phase on Electrical Conductivity of Composites
2.5 Carbon/Graphite as Electroactive Layer
2.5.1 Surface Microstructure of Carbon/Graphite Materials
29
34
35
37
38
39
40
and Its Relation to Interaction with Oxygen 42
2.5.2 Carbon-Oxygen Surface Complexes and Surface Treatment 48 2.5.2.1 Formation of Carbon-Oxygen Surface Complexes 48 2.5.2.2 Specific Carbon-Oxygen Surface Complex and Their
Influence on Electrochemical Behaviour of Carbon Electrodes 54
2.5.3 Electrocatalysts 59
2.6 Theoretical Background 61
2.6.1 Electrochemical Techniques 61 2.6.1.1 Cyclic Voltammetry 62
2.6.1.2 Rotating Disc Voltammetry 66
2.6.2 Performance Characteristics of Redox Flow Cell 68 2.6.2.1 Polarisation Curve and Cell Resistance 68 2.6.2.2 Cell Efficiencies 70
v

CHAPTERITI EXPERTIWENTAL
3.1 Preparation and Evaluation of Carbon-Plastic Composite Sheets and Electrodes
3.1.1 Preparation 3 .1.1.1 Materials
3.1.1.2 Equipment 3.1.1.3 Preparation Procedure
3.1.2 Evaluation 3.1.2.1 Evaluation of Electrical and Physical Properties
for Composite Materials 3.1.2.2 Evaluating of Electrical and Electrochemical
Properties of Composite Electrodes
3.2 Experimental Procedures for Electrode Kinetics and Electrode Activation Study
3.2.1 Electrode Kinetics Study
3.2.1.1 Electrodes 3.2.1.2 Electrolyte and Electrochemical Cell
3.2.1.3 Electrochemical Equipment
3.2.2 Surface Chemical Treatment f Carbon-Plastic Composite Materials
3.2.2.1 Preparation of Carbon-Plastic Composite Materials
3.2.2.2 Preparation of Carbon-Plastic Composite Electrodes for Chemical Treatment and Cyclic Voltammetry
3.2.2.3 Procedure for Surface Chemical Treatment
3.2.2.4 Evaluation
3.3 Graphite Felts Studies
3.3.1 Felt Materials
3.3.2 Physical Property Measurements
3.3.3 Evaluation of Electrochemical properties
3.3.3.1 Preparation of Carbon-Plastic Electrodes for
vi
72
72
72
73
74 77
79
81
84
97
97 97 99
100
102 102
103
105
105
106
106
106
107
Cyclic Voltammetry
3.3.3.2 Design of the Felt-Electrode Support
3.3.3.3 Measurement Conditions
3.3.4 Oxidation of the Felt Samples and Surface Analysis
3.3.4.1 Air-Oxidation 3.3.4.2 Electrochemical Oxidation
3.3.4.3 Oxidation in Positive Half-Cell of the Vanadium Redox Flow Battery
3.3.5 Felt Activation Treatment and Evaluating 3.3.5.1 Activation Treatment
3.3.5.2 Evaluations
-~
CHAPTER IV FABRICATION AND EVALUATION OF CARBONPLASTIC COMPOSITE MATERIALS AS ELECTRODE MATRIX LAYERS
4.1 Low Density Polyethylene Based Carbon-Plastic
Composites
4.1.1 Electrical Conductivity of Composites
4.1.1.1 The Effect of Content and Type of Carbon Fillers 4.1.1.2 The Effect of Processing on Resistivity
4.1.1.3 The Effect of Carbon Black on Resistivity
4.1.1.4 The Effect of Composition on Resistivity
4.1.2 Mechanical properties
4.1.3 Permeation
4.1.4 Electrochemical Stability and Activity of the
Carbon-LDPE Composite Electrodes
4.1.4.1 Electrochemical Stability
4.1.4.2 Cell Performance of Composite Electrodes
4.2 High Density Polyethylene Based Carbon-Plastic
107 108
108
110
111
111
1}'~·
113
113
113
116
117
117 118
124
127 129
130
135
137
137
141
Composites and Electrodes 142
4.2.1 Evaluation of SEBS Modified Carbon-HDPE Composites 143
Vll
4.2.1.1 Effect of Composition on Electrical and
Mechanical Properties
4.2.1.2 Solution Permeability of the SEBS Modified
Carbon-HDPE Composites
4.2.1.3 Microstructure of SEBS Modified Carbon-HDPE
Composites
4.2.2 Evaluation of SEBS Modified Carbon-HDPE Composite
Electrodes
4.2.2.1 Electrical Resistance and Cell Resistance
4.2.2.2 Cell Performance Testing
Constant Current Charge/Discharge Behaviour
The Effect of Current Density on Cell Efficiency
Short-Term Cell Performance Test
Long-Term Cell Stability Test
Electrode Deterioration Test
4.3 Summary
143
148
151
153
153
160
161
161
164
164
167
174
CHAPTER V ELECTRODE KINETICS AND ACTIVATION STUDIES 176
5.1 Electrode Kinetics of V(V)N(IV) and V(III)N(II)
Couples at Graphite Electrode
5.1.1 The Electrode Kinetics of V(V)N(IV) Couple
5.1.1.1 Reproducibility of Electrode Surface Preparation
5.1.1.2 Cyclic Voltammetry
5.1.1.3 Rotating Disc Voltammetry
5.1.1.4 Diffusion Coefficient
5.1.1.5 Kinetics Parameters
5.1.2 The Electrochemical Behaviour of V(III)N(II) Couple
5.1.2.1 The Effect of Electrochemical Oxidation on
Electrode Behaviour
5.1.2.2 Determination of Kinetics Parameters
5.2 Chemical Activation of the Carbon-Plastic Composite
Substrates
5.2.1 Influence of Treatment Time
vm
176
177
179
179
182
186
196
200
201
203
208
210
5.2.2 The Effect of Treatment Temperature 219
5.2.3 Cyclic Stability 222
5.2.4 Mechanism of Chemical treatment 225
5.3 Summary 225
CHAPTER VI GRAPHITE FELT AS ELECTRODE ACTIVE LAYER 229
6.1 Comparison of Characteristics of Some Graphite Felts
6.1.1 Electrical Conductivity of Graphite Felt
6.1.2 Surface Area and Pore Size of Graphite Felt Samples
6.1.3 Electrochemical Activity of Commercial Graphite
Felts
6.2 Surface Microstructure and Oxidation Characteristics
of FMI and GFD Graphite Felts
6.2.1 The Effect of Anodic Oxidation on Electroactivity
of Felt Electrodes in Vanadium Solution
6.2.2 The Effect of Gas Oxidation on the Formation of
Surface Carbon-Oxygen Complex
6.2.3 Surface Microstructure of Fibres in FMI and GFD 2
Felts
6.2.4 The Effect of Charging and Overcharging on the
Surface Characteristics of Graphite Felt Electrodes
6.2.4.1 General Analysis
6.2.4.2 Samples Used as Electrodes at Normal and
Overcharging Cell Operating Conditions
lX
231
231
232
237
244
246
250
263
264
267
269
6.3 Electrocatalysis Studies
6.3.1 Activation Evaluation of Treated Felt Samples With
Cyclic Voltammetry
6.3.2 The Effect of Concentration of AgN03 Solution on
Characteristics of Treated GFD 2 Felt
6.3.2.1 Effect of AgN03 Concentration on Weight Increase
6.3.2.2 The Effect of Deposited Silver on Felt Electrical
Resistivity
6.3.2.3 Effect of Deposited Silver on Cell Resistance and
polarisation behaviour
6.3.3 Cell Performance Test
6.3.3.1 The Influence of Treatment on Cell Efficiencies
6.3.3.2 The Effect of Current Density
6.3.3.3 The Cell Discharge Behaviour
6.3.3.4 Long-Term Stability Test
6.4 Summary
CHAPTER VII CONCLUSIONS
REFERENCES
X
280
281
290
290
292
292
295
296
298
300
302
304
306
311

LIST OF FIGURES
Figure Page
1.1 Two-tank electrically rechargeable redox flow cell. (Ref 3.) 2
2.1 Configuration of NASA laboratory redox flow cell. (Ref 4.) 19
2.2 Components of a single redox flow cell and full-function
stack. (Ref 183) 20
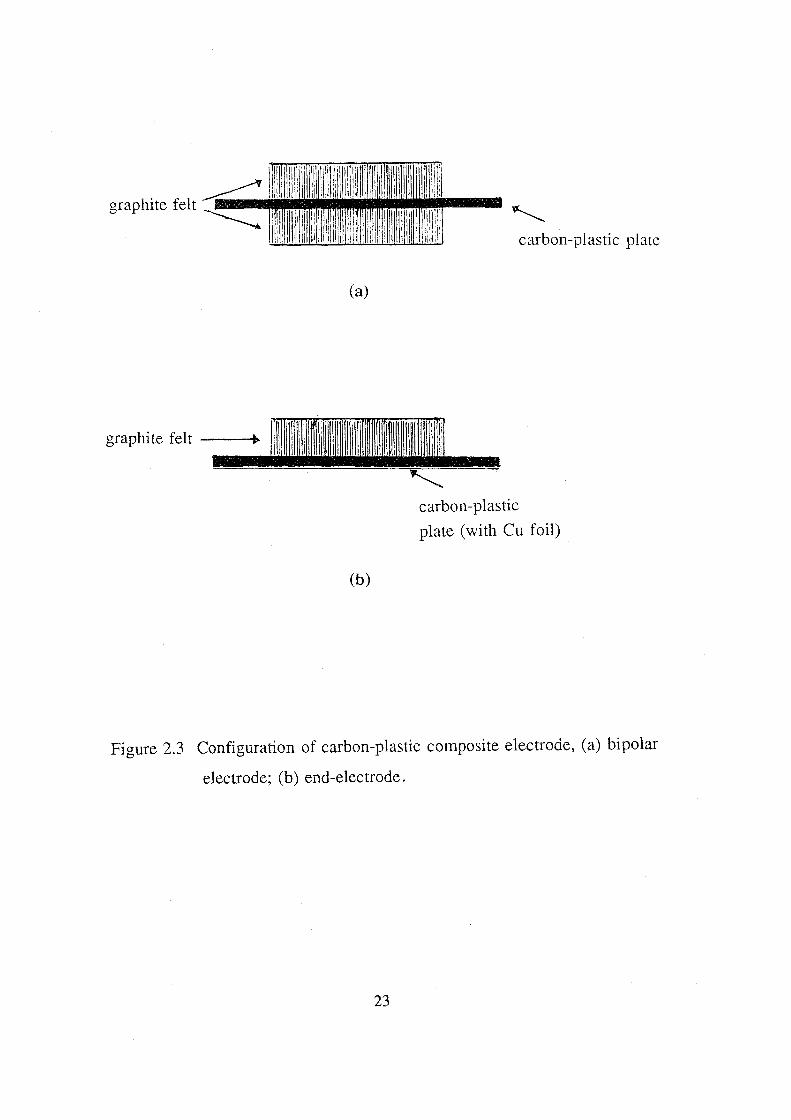
2.3 Configuration of carbon-plastic composite electrode,
(a) end-electrode; (b) bipolar electrode. 23
2.4 Transition-like phenomena of composite material (Ref 87.). 36
2.5 Schematic diagram of the carbonisation process for a
graphitizable organic material (Ref 102.). 43
2.6 Structural comparison of graphite and carbon, (a) graphite;
(b) carbon (Ref 101.). 45
2.7 Proposed functional groups on carbon (Ref 101.). 55
2.8 Cyclic Voltammograms of three typical electrode process,
(a) reversible, diffusion controlled; (b) Totally irreversible;
(c) quasi-reversible (Ref 183.). 63
2.9 Typical cell polarisation behaviour of redox flow cell system
(Ref 44.). 64
2.10 Constant-current charge and discharge performance of the
vanadium redox flow cell (Ref 44.). 69
X1

3.1 Equipment for preparing carbon-plastic composite sheet and
electrode (a) internal mixer; (b) hot-pressure. 76
3.2 Configuration of moulds used for preparing carbon-plastic
composite sheet and electrode: (a) mould for making sheet;
(b) window-mould for bonding graphite felt onto composite sheet. 78
3.3 Flow-chart of the process for preparing carbon-plastic
composite and electrodes. 80
3.4 The set-up for resistivity measurement (ASTM D-991). 82
3.5 Diagram of testing apparatus for evaluating permeability of
carbon-plastic composite. 85
3.6 Four-probe method for measuring the resistance of
carbon-plastic composite electrodes, (a) for end-electrode;
(b) for bipolar. 87
3.7 Expanded diagram of a single-cell vanadium redox flow battery. 89
3.8 Expanded diagram of a two-cell multi-cell vanadium redox flow
battery. 90
3.9 Electrical circuit used for charge-discharge cycling. 96
3.10 Construction of graphite rod electrode used for cyclic
voltammetry and rotating disc voltammetry. 98
3.11 Electrochemical cell for cyclic voltammetry and rotating disc
voltammetry. 101
3.12 Schematics of carbon-plastic composite sheet and electrode for
chemical treatment studies: (a) composite sheet; (b) electrode
construction. 104
xu

3.13 Construction of carbon-plastic/graphite-felt composite electrode
for cyclic voltammetry. 109
3.14 Modified NASA cavity fill-in single cell used as test cell
for activated felt electrodes for vanadium redox flow system. 115
4.1 Effect of carbon content on resistivity of carbon-LDPE
composite. 119
4.2 The development of graphite fibre network in carbon-LOPE
composite. Magnification: 100x. Fibre content: a) 5%;
b)10%; c) 20%. 122
4.3 Effect of blending time on data scattering. 125
4.4 Effect of carbon black (black pearl) to graphite fibre
ratio on resistivity. Proportion of polymers: sample 1,
65% LDPE + 5% SEBS; sample 2, 60% LDPE + 10% SEBS;
sample 3, 55% LDPE + 15% SEBS. 128
4.5 Effect of carbon black (black pearl) to graphite fibre
ratio on mechanical properties. Solid line: tensile strength;
dashed line: elongation. Proportion of polymers same as that
for Figure 4.4. 132
4.6 Effect of rubber content on mechanical properties. Solid
line: tensile strength; dashed line: elongation. Carbon
fillers: sample 1, 5% CB + 25% GF; 2, 10% CB + 20% GF;
3, 20% CB + 10 GF% (CB =black pearl, GF =graphite fibre). 134
4.7 Permeation behaviour of carbon-LOPE composite of composition
70% LDPE, 15% CB (black pearl), 15% GF (graphite fibre). 136
4.8 Cyclic voltammogram of graphite felt bonded to (1)
carbon-LOPE composite and (2) to graphite rod electrode,
sweep rate: 100 mv.s·1, vs SCE. Composition of composite
given as that for Figure 4.7. 138
xm
4.9 Cyclic voltammetry stability testing for carbon-LOPE
composite electrode. Sweep rate: 100 mv.s·I, vs SCE,
100 cycles. Composition of composite same as that for
Fig. 4.7. 140
4.10 Effect of SEBS content on electrical and mechanical
properties of carbon-HDPE composites. Composition given
as sample 1,2,3 and 4 in Table 4.11. 147
4.11 Permeation behaviour of SEBS modified carbon-HDPE
composite of composition 40% HDPE, 20% SEBS, 10% CB
(Degussa XE 2), 10% CB (Degussa FW 200), 20% GF. 150
4.12 Cross section of a SEBS modified carbon-HDPE composite
(Cu-mesh backed), magnification: a) 40x: b):440x.
Composition same as that for Fig. 4.11. 153
4.13 Reproducibility Evaluation of four-probe method for
measuring resistance of composite electrode 155
4.14 Effect of processing on resistance of composite electrodes
(Composition of electrode matrix same as that for Fig. 4.11). 156
4.15 Morphology of composite electrode, a) cross section of
boundary area, b) electrode matrix layer surface (felt
has been removed). Composition of electrode matrix same
as Fig. 4.11, Graphite felt: GFD 2. 158
4.16 Typical charge/discharge curve of vanadium redox cell
employing SEBS modified carbon-HDPE composite electrode
(matrix layer: same as that for Fig. 4.11; active layer:
Toray felt). ich. = idis. = 21.7 rnA cm·2; cell voltage
up limit= 1.75 V, lower limit= 0.80 V. 162
4.17 Effect of current density on the cell efficiencies of a
vanadium redox flow cell employing SEBS modified
carbon-HDPE composite electrodes. Electrodes and other
xiv

conditions same as that for Fig. 4.16. 163
4.18 Short-term single cell performance of the composite
electrodes of Fig. 4.16. Other conditions same as that
for Fig. 4.16. 165
4.19 Short-term performance of a two-cell vanadium redox
battery with the composite electrodes of Fig. 4.16.
Curves 1: coulombic, 2: voltage; 3, energy efficiencies.
ich. = idis. = 30 mA.cm-2• Other conditions same as that
for Fig. 4.16. 166
4.20 Long-term single cell stability test for the composite
electrodes of Fig. 4.16, a) efficiency variation,
l:coulombic, 2: voltage, 3: energy; b) voltage efficiency
variation. Other conditions same as that for Fig. 4.16. 168
4.21 Effect of overcharging time on cell resistance of
vanadium redox flow cell with the (Toray felt)/(SEBS
modified carbon-HOPE) composite electrodes. 170
4.22 Effect of overcharging on cell performance with the
composite electrodes of Fig. 4.21. 171
4.23 Cross section of Japanese Toray composite end-electrode.
Magnification: 20x. a) normal electrode; b) after seriously
overcharged. 173
5.1 Cyclic voltammograms for graphite electrode in 0.1 M
VOSOJ3 M H2S04 solution, sweep rate: 10 mv.s-1•
(a) anodic voltammograms for testing reproducibility of
surface preparation; (b) cyclic voltammograms for testing
the cyclic stability, 1st to lOth cycles. 181
5.2 Cyclic voltammograms of graphite electrode in (a) 0.05 M V(V)
+ 0.05 M V(IV) in 3M H2S04; (b) 3M H2S04• sweep rates: 1,
10, 20, 40, 60 mv.s-1 for curves 1 to 5 respectively. 184
XV

5.3 Cyclic voltammograms of graphite electrode in the potential
range 0 to 0.9 V, other conditions are same as those for
Figure 5.2(a). 185
5.4 Cathodic and anodic voltarnrnograms of a rotating disc graphite
electrode in electrolyte of Figure 5.2(a); sweep rate: 1 m V.s-1;
(a) rotation speeds: zero, 60 rpm, 120 rpm, 240 rpm, 600 rpm,
1200 rpm for curves 1 to 6 respectively. (b) rotation speeds:
1200 rpm, 1800 rpm, 2400 rpm for curves 1 to 3 respectively. 188
5.5 Plot of limiting current density(iJ vs square root of angular
velocity for anodic voltarnmograms of Figure 5.4. 190
5.6 Anodic rotating disc voltammograms at a graphite electrode in
0.5 M V(IV)/3 M H2S04 solution. rotation speeds: 120 rpm,
360 rpm, 720 rpm, 1080 rpm for curves 1 to 4 respectively. 192
5.7 (a) Plot of limiting current density vs square root of angular
velocity at various vanadium concentrations; (b) Plot of
limiting current density vs vanadium concentration at various
electrode rotation speeds. 194
5.8 Plot of iL jconc. vs square root of angular velocity for
anodic voltammograms of Figure 5.6 at various concentrations. 195
5.9 Plot of anodic overpotential vs log(iL.a - i)/i from
voltammograms of Figure 5.4. 197
5.10 Cathodic and anodic polarisation curves of graphite felt and
reticulated vitreous carbon (RVC) electrodes in 1.0 M V(V)
+ 1.0 M V(IV) in 3 M H2S04• 199
5.11 Cyclic voltammograms of graphite electrode in 0.1 M V3+/3 M
H2S04 solution, scan rate: 40 mv.s·1• 1, normally polished;
2, 3 min anodicly oxidised (dash line for 6 and 9 min anodic
oxidation). 202
XVI
5.12 Cyclic voltammograms of 9 mins anodicly oxidised graphite
electrode in 0.1 M V3+/3 M H2S04• Numbers on curves
corresponding to scan rates in mV.s-1 205
5.13 Peak current vs. square root of scan rate for voltammograms
in Fig. 5.12. 205
5.14 Ln(ipc) vs. (~ -E0') for voltammograms in Fig. 5.12. 209
5.15 Cyclic voltammograms of PE2525 composite electrode in 1 M
V(Ill) + 1 M V(IV)/3 M H2S04 vanadium solution, 1) untreated;
2) 5 mins treated; 3) graphite (scan rate = 100 m V.s-1). 211
5.16 Cyclic voltammograms of PE75 composite electrode in vanadium
solution (same as mentioned in Figure 5.15), 1) untreated;
2) 5 mins treated; 3) graphite( scan rate = 100 m V.s-1). 212
5.17 Cyclic voltammograms of graphite electrode in vanadium solution
(same as mentioned in Fig.5.15), 1) untreated; 2) 5 mins treated
(scan rate= 100 mV.s"1). 214
5.18 The effect of treatment time on peak current for PE2525
composite electrode. 216
5.19 The effect of treatment time on peak current for PE75
composite electrode. 218
5.20 The effect of treatment temperature on peak current for PE7 5 and
PE2525 composite electrode. 221
5.21 The cyclic stability test of treated PE 2525 composite electrode
(30 mins, 65°C), scan rate= 100 mV.s-1• 223
5.22 The cyclic stability test of treatment composite electrode: 1) 1 hr;
2) 2 hrs; 3) 4 hrs; all treated at 65°C (scan rate= 100 mV.s"1). 224
5.23 Cyclic voltammograms of PE composite bonded with graphite felt:
xvii

1) untreated; 2) 5 mins at 65°C; 3) 40 mins at 65°C (scan
rate = 100 mv.s-1). 226
5.24 SEM pictures of treated (4 hrs) PE75 composite material,
a) surface direction; b) cross-section. 227
6.1 Pore and surface area distribution of GFD 2 graphite felt,
(a) pore intrusion volume; (b) cumulative surface area. 235
6.2 Cyclic voltammograms of various graphite felt electrodes in
0.05 M V(lll) + 0.05 M V(IV) in 3M H2S04 solution, sweep
rate: 60 mv.s-1; (a) FMI; (b) GFA 2; (c) GFD 2 and (d) RVG 1000. 241
6.3 Cyclic voltammogram of graphite rod electrode in vanadium
solution (same as that in Figure 6.2); sweep rate: 60 mv.s-1• 243
6.4 Cyclic voltammograms of graphite felt electrodes in 3 M H2S04
solution, (1) before anodic oxidation; (2) after holding at
+1.5 V for 15 minutes, (a) FMI; (b) GFD 2. Sweep rate: 60 mV.s-1• 249
6.5 Cyclic voltammograms of graphite felt electrodes in 0.1 M
VOSOJ3 M H2S04 solution, (1) before anodic oxidation;
(2) after holding for 15 minutes at + 1.5 V in 3 M H2S04,
(a) FMI; (b) GFD2. 252
6.6 Overall XPS spectra of GFD 2 graphite felt, (N) untreated;
(T) treated in air at 400 °C for 30 hours. 254
6.7 C(ls) region XPS spectra of graphite felts treated in air and
in N2 at 400 °C for 30 hours, (a) GFD 2; (b) FMI. 255
6.8 0(1s) XPS region spectra of graphite felts treated in air and
in N2 at 400 °C for 30 hours, (a) GFD 2; (b) FMI. 258
6.9 Fitted 0(1s) XPS spectra of FMI graphite felts treated at 400
°C for 30 hours, (a) in N2; (b) in air. 260
XVlll
6.10 Fitted 0(1s) XPS spectra of GFD 2 graphite felts treated at 400
°C for 30 hours, (a) in N2; (b) in air. 262
6.11 Side-view of graphite felt fibres, (a) FMI; (b) GFD 2. 265
6.12 Cross-section of graphite felt fibres, (a) FMI; (b) GFD 2. 266
6.13 Fitted C(ls) spectra of FMI graphite felt, (a) treated in
N2 at 400 °C for 30 hours; (b) after normal use as electrode;
(c) after overcharge for 50 minutes at 21.7 mA.cm·2• 272
6.14 Fitted C(ls) spectra of GFD 2 graphite felt, (a) treated in
N2 at 400 °C for 30 hours; (b) after normal use as electrode;
(c) after overcharge for 50 minutes at 21.7 mA.cm·2• 274
6.15 C(ls) region spectra of FMI graphite felt, (a) treated in
N2 at 400 °C for 30 hours; (b) after normal use as electrode;
(c) after overcharge for 50 minutes at 21.7 mA.cm·2• 277
6.16 C(1s) region spectra of GFD 2 graphite felt, (a) treated in
N2 at 400 °C for 30 hours; (b) after normal use as electrode;
(c) after overcharge for 50 minutes at 21.7 mA.cm-2• 279
6.17 Cyclic voltammogram of thermally-treated (in air at 400 °C for 30
hours) GFD 2 graphite felt electrode in vanadium solution (same as
for Figure 6.2), sweep rate: 60 mv.s·1• 282
6.18 Cyclic voltammogram of GFD 2 graphite felt electrode treated with
0.1 M NiS04 solution (conditions same as that for Figure 6.17). 283
6.19 Cyclic voltammogram of GFD 2 graphite felt electrode treated with
0.1 M MnS04 solution (conditions same as that for Figure 6.17). 284
6.20 Cyclic voltammograms of GFD 2 Graphite felt electrode treated
with 0.1 M AgN03 solution, (a) in the same vanadium solution as
for Figure 6.17; (b) in 3M H2S04; (c) after 50 cycles within the
potential range of -0.7 V to +0.5 V. 288
XIX
6.21 The effect of AgN03 concentration on the increased weight of
treated GFD 2 graphite felt. 291
6.22 Polarisation behaviour of a vanadium redox flow cell
employing GFD 2 graphite felt electrode treated under
various conditions. Electrolyte: 2 M vanadium sulphate
in 2.5 M H2S04; Membrane: CMV. Solid line: charging;
dashed line: discharging. 294
6.23 A typical charge/discharge curve of a vanadium redox flow
cell employing treated GFD 2 graphite electrode (positive:
thermally treated; negative: treated with 0.05 M AgN03).
Current density: 40 mA.cm·2• Other conditions same as for
Figure 6.22. 297
6.24 The effect of current density on cell efficiencies of a
vanadium redox flow cell with thermally and AgN03 treated
GFD 2 graphite felt electrodes. Other conditions same as
for Figure 6.22. 299
6.25 Cell discharge behaviour of the vanadium redox flow cell
with thermally and AgN03 treated GFD 2 graphite felt
electrodes. Other conditions same as for Figure 6.22 301
6.26 Long~term stability test on the vanadium redox flow cell
with thermal and AgN03 treated GFD 2 graphite felt
electrodes. Charge/discharge current density: 100 rnA cm-2;
upper and lower voltage limits are 1.75 V and 0.8 V
respectively. Other conditions same as for Figure 6.22. 303
XX

LIST OF TABLES
Page
2.1 Characteristics comparison of graphite and carbon 47
3.1 Composition and resistivity of composite PE used in
chemical treatment studies (CB = carbon black,
GF = graphite fibre) 102
4.1 Resistivity comparison of carbon-LDPE composites 120
4.2 Resistivity comparison of different composition
(CB =Cabot Black Pearl2000) 123
4.3 Composition of a typical carbon-LDPE composite 123
4.4 The effect of blending time on resistivity of
carbon-LDPE composites 126
4.5 Composition of carbon-LDPE composite materials 129
4.6 Comparison of the electrical resistivity of
carbon-LDPE composites 130
4.7 Composition and mechanical properties of rubber modified carbon-LDPE composites 133
4.8 Cell performance of carbon-LDPE composite electrodes 141
4.9 Composition of carbon-plastic materials 144
4.10 Comparison of the electrical and mechanical properties
of the prepared carbon-plastics with commercial available conductive materials 145
4.11 Optimisation study on the SEBS modified carbon-HDPE composite 146
xxi

4.12 Resistivity and mechanical properties of SEBS modified
carbon-HOPE composite materials (thickness of samples
= 0.75-0.85 mm) 148
4.13 Electrical resistance comparison for some SEBS modified
(carbon-HDPE)/(graphite-felt) Electrodes 157
4.14 Cell resistance comparison for some SEBS
modified (carbon-HDPE)/(graphite-felt) electrodes 160
5.1 Summary of limiting current density versus angular velocity
for the V (IV) oxidation reaction 189
5.2 Diffusivity of V(IV) species 191
5.3 The kinetic parameters of V(V)N(IV) couple 198
5.4 Experimental and calculated data for V(ill) + e = V(ll) reaction 207
5.5 The influence of treatment time on the electrode behaviour
of PE2525 ("e" electrode) in [1 M V(IV) + 1 M V(V)]/2.5 M H2S04 215
5.6 The influence of treatment time on the electrode behaviour
of PE2525 ("s" electrode) in [1 M V(IV) + 1 M V(V)]/2.5 M H2S04 215
5.7 The influence of treatment time on the electrode behaviour
of PE75 ("s" electrode) in [1 M V(IV) + 1 M V(V)]/2.5 M H2S04 217
5.8 The influence of treatment time on the electrode behaviour
of PE75 ("e" electrode) in [1 M V(IV) + 1 M V(V)]/2.5 M H2S04 217
5.9 The influence of treatment time on the electrode behaviour of
graphite in [1 M V(IV) + 1 M V(V)]/2.5 M H2S04 219
5.10 The effect of treatment temperature on the electrode
behaviour of PE2525("e") electrode in
[1 M V(IV) + 1 M V(V)]/2.5 M H2S04 220
xxii
5.11 The effect of treatment temperature on the electrode behaviour
of PE75("e") Electrode in [1 M V(IV) + 1 M V(V)]/2.5 M H2S04 220
6.1 Comparison of electrical resistivity of commercially
available graphite felts 232
6.2 Surface area comparison of some commercial graphite felts 236
6.3 Electrochemical activity comparison of some felt electrodes 242
6.4 XPS results comparison on FMI and GFD 2 felts 263
6.5 O:C ratios for felt samples with various treatments 268
6.6 Results from C 1 s peak curve fitting 270
6.7 Comparison of FMI and GFD 2 graphite felts 280
6.8 The effect of surface treatment on the electrochemical
activity of GFD 2 felt 289
6.9 The effect of AgN03 concentration on weight change of the felt 290
6.10 The effect of deposited silver on resistivity 292
6.11 Cell resistance of GFD 2 felt in 25 cm2 cell (CMV membrane) 293
6.12 Cell performance of GFD 2 felt in 25 cm2 cell (CMV membrane) 298
6.13 The effect of discharging current density on the capacity of the
vanadium redox flow cell with activated electrode 302
xxiii
Symbol
A
c
d
El%
I
i
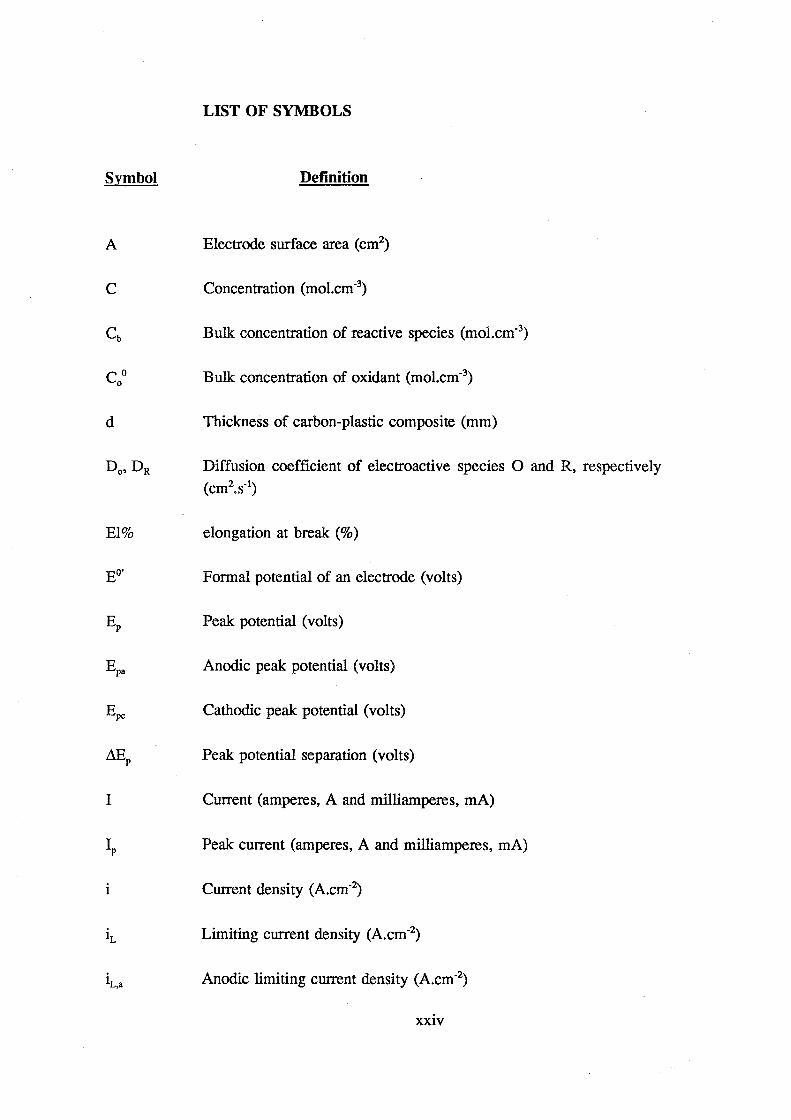
LIST OF SYMBOLS
Definition
Electrode surface area (cm2)
Concentration (mol.cm-3)
Bulk concentration of reactive species (mol.cm-3)
Bulk concentration of oxidant (mol.cm-3)
Thickness of carbon-plastic composite (mm)
Diffusion coefficient of electroactive species 0 and R, respectively (cm2.s-1)
elongation at break (%)
Formal potential of an electrode (volts)
Peak potential (volts)
Anodic peak potential (volts)
Cathodic peak potential (volts)
Peak potential separation (volts)
Current (amperes, A and milliamperes, rnA)
Peak current (amperes, A and milliamperes, rnA)
Current density (A.cm-2)
Limiting current density (A.cm-2)
Anodic limiting current density (A.cm-2)
xxiv
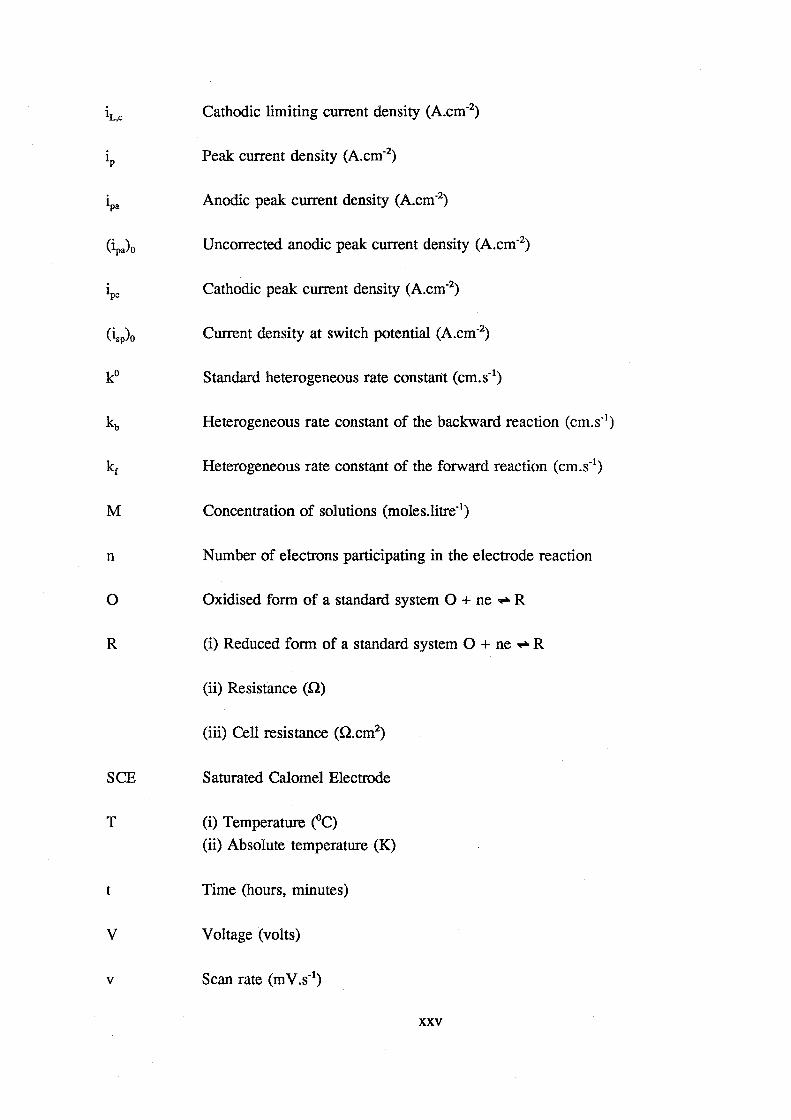
IL,c Cathodic limiting current density (A.cm-2)
4 Peak current density (A.cm-2)
ipa Anodic peak current density (A.cm-2)
(ipa)o Uncorrected anodic peak current density (A.cm-2)
4c Cathodic peak current density (A.cm-2)
(isp)o Current density at switch potential (A.cm-2)
k0 Standard heterogeneous rate constant (cm.s-1)
kb Heterogeneous rate constant of the backward reaction (cm.s-1)
kr Heterogeneous rate constant of the forward reaction (cm.s-1)
M Concentration of solutions (moles.litre-1)
n Number of electrons participating in the electrode reaction
0 Oxidised form of a standard system 0 + ne ,.. R
R (i) Reduced form of a standard system 0 + ne ,.. R
(ii) Resistance (Q)
(iii) Cell resistance (Q.cm2)
SCE Saturated Calomel Electrode
T (i) Temperature (°C)
(ii) Absolute temperature (K)
t Time (hours, minutes)
v Voltage (volts)
v Scan rate (mv.s-1)
XXV
Tla
Tlc
TlE
'Tlv
n
p
v
O'u
Constants
F
R
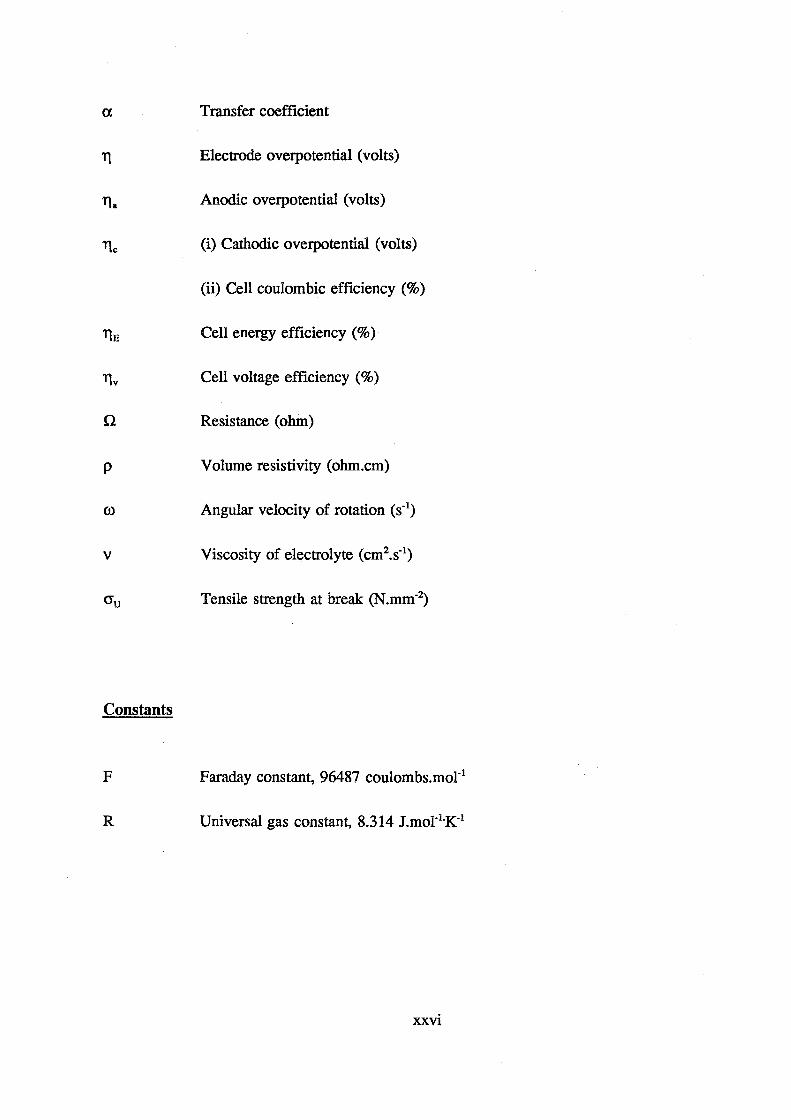
Transfer coefficient
Electrode overpotential (volts)
Anodic overpotential (volts)
(i) Cathodic overpotential (volts)
(ii) Cell coulombic efficiency (%)
Cell energy efficiency (%)
Cell voltage efficiency (%)
Resistance (ohm)
Volume resistivity (ohm.cm)
Angular velocity of rotation (s-1)
Viscosity of electrolyte (cm2.s-1)
Tensile strength at break (N.mm-2)
Faraday constant, 96487 coulombs.mot-1
Universal gas constant, 8.314 J.mol-I.K1
xxvi

1.1 Background
CHAPTER I
INTRODUCTION
Over the past two decades, a new electrochemical energy storage system, the
redox flow battery, has been investigated widely and developed intensively [1].
Originally disclosed by Morrill in 1971[2], the concept of a redox flow battery
was defined as an electrochemical energy storage device which had electrolytes
containing electroactive species flowing past the inert electrodes and remaining
dissolved throughout cycling (Figure 1.1). This new system differs from the usual
energy storage batteries in two major aspects: the electrolyte and electrode. Instead
of being stored within the battery container, the energy-bearing chemicals of the
redox battery, or electrolytes, are stored in separate liquid reservoirs; differing
from the other batteries, in which the electrodes are involved in electrochemical
reactions as reactants or products and usually leading to the limitation of life time,
the electrodes (inert electrical conducting materials) of the redox flow battery act
as a source or sink for electrons, and in both halves of the cell, the components of
the half reaction are the two oxidation states of a constituent of the electrolytic
phase. These two major differences give this new battery system some of the most
attractive features: infinite power or energy storage capability and cycle life.
Extensive pioneering research work on the development of a promising redox flow
battery was conducted by the Lewis Research Centre which was founded by
1

Figure 1.1
Anode fluid
Inert electrode
Cathode fluid
membrane
Two-tank electrically rechargeable redox flow cell. (Ref 3 .) •
2

NASA (National Aeronautics and Space Administration, U.S.A.) from the early
1970s to the early 1980s. The outcome from this decade of extensive research,
was the Fe-Cr redox flow battery system, considered by many at that time to be
the most promising of its kind[3-ll]. Although there are a number of other redox
flow battery systems being studied and developed throughout the world, most of
the effective research has been based on systems which contain more than one
redox species when fully discharged, leading to a few disadvantages for redox
flow batteries, such as electrolyte contamination and battery capacity losses
whenever the anolyte and the catholyte cross over or leak through the separator.
Efforts to establish a common redox species battery system and a few possible
systems like Fe3+/Fe2+//Fe2+/Fe0 and Cf'+/C~+//Cr3+/cr+ [12] have been studied, but
no effective design was reported.
On the other hand, vanadium has the specific electronic configuration, i.e., 3d34s2,
which results in the oxidation states of +5, +4, +3 and +2 in aqueous systems[13-
23]. This property attracted some interest in utilising vanadium redox couples in
either fuel cell or redox flow cell[4, 24], however, there were no real efforts in
this area until the mid 1980's when Skyllas-Kazacos and co-workers, carried out
an electrochemical study of vanadium redox couples in various electrolytes and at
a range of electrodes[25-27]. This work led to the invention of a new all
vanadium redox flow battery system[25].
In this system, V(V)N(IV) and V(III)N(II) redox couples with sulphuric acid
media are employed as catholyte and anolyte respectively. An open circuit voltage
3

of higher than 1.5 V is obtained when the cell is fully charged. The redox
reactions in both halves of the cell can be illustrated as:
positive half-cell:
( 1-1)
negative half-cell:
(1-2)
Because of its unique advantages[25] over other conventional energy generation
and storage systems, a research and development project for the vanadium redox
flow battery was therefore established, and the investigation has covered electrode,
electrolyte, membrane and battery design. As one of the most important
components of the battery, the electrode and its related characteristics doubtlessly
became one of the key aspects of the research and development which led to the
present study.
1.2 Early Research Work on Electrodes for the Vanadium Redox Flow
Battery
The initial studies were conducted by Sum and Skyllas-Kazacos on glassy carbon
4
and graphite electrodes[27]. Using cyclic voltammetry and rotating disc
voltammetry, they concluded that the electron transfer rate for V(V)N(IV) couple
at glassy carbon electrode is rather slow with a value of k0 = 7.5 x 10⁴•
Rychcik and Skyllas-Kazacos subsequently investigated the suitability of various
electrode materials for the V(V)N(IV) reactions and showed that on gold and
glassy carbon electrodes, the redox reactions were be irreversible, while on the
lead and titanium electrodes, passivating phenomena were observed in the
potential range of interest[26]. According to their report, platinised titanium and
iridium oxide-coated DSA (dimensional stable anode) showed better
electrochemical reversibility and cell performance, but the high cost of these
materials would be prohibitive for large-scale applications.
The possibility of using a conducting polymer, like polypyrrole, as the electrode
material for the vanadium battery was also investigated. Unfortunately, the results
were not satisfactory even though high electrical conductivity polypyrrole samples
were already fabricated[28]. In the mean time, Japanese carbon-plastic/graphite
felt composite electrodes were introduced to the vanadium battery system and
were found to be most promising electrodes leading to overall energy efficiencies
of up to 90% in 3 KW prototype batteries. However, the high cost and the
unsatisfactory mechanical properties of these electrodes were identified as
requiring further optimisation before commercialisation of the vanadium redox
flow battery.
5
1.3 The aim of the present project and brief description of the thesis
The aim of this project was to develop a carbon-plastic composite electrode and
study the relevant characteristics for the redox cell applications. Since a carbon
plastic composite electrode has a multi-layer structure, each layer being designed
for a different function to achieve satisfactory cell performance for the overall
electrode[29], some specific aspects for each layer should be emphasised. It is
therefore necessary to separate the project into the following sections: electrode
matrix layer studies, electrode kinetics and activation studies and electrode surface
layer studies.
In Chapter II, a literature review on carbon-plastic composite electrodes is
presented. Chapter ill deals with the experimental aspects involved in this project.
Chapter IV concentrates on the development and studies of carbon-plastic
composite materials used as the matrix layer of the composite electrode. The study
was initiated with low density polyethylene (LDPE) plastic which is the most
common and economical polymer material. Conducting fillers based on
carbon/graphite products were screened to determine a suitable composition for
obtaining satisfactory electrical conductivity. In order to enhance the mechanical
properties of the polyethylene based carbon-plastic composite material, however,
further work was directed at thermo-plastic rubber modification and the
preparation of rubber modified carbon-plastic composite material and electrodes.
The most important part of the chapter is the evaluation of the composite
6

materials and electrodes in a laboratory scale vanadium battery. Short-term
performance testing, long-term variation and stability testing as well deterioration
tests on the electrodes, are included in this section.
As a graphite felt based composite material is employed as the electrode for the
vanadium battery, it is desirable to establish the electrode kinetics at the graphite
electrode. Graphite felt was selected as the electrode material since it has a high
surface area for the reactions and earlier studies[27] have shown that graphite is
stable over a wide range of voltages in the vanadium redox system. The ftrst part
of Chapter V deals with the electrode kinetics of V(V)N(IV) and V(III)N(II)
couples at a graphite rod electrode. On the other hand, even though the thick
graphite felt used as the active layer of the composite electrode offers the benefit
of a large surface area and minimum polarisation losses, it results in high
hydraulic pressure when the electrolyte is passing through. Minimising the
thickness or totally eliminating the felt layer may solve this problem. This was
thus a further objective of the second which concentrates on activation studies
conducted directly on the surface of the carbon-plastic composite material.
Chapter VI concentrates on a comparison of some of the physical properties of
several kinds of thin graphite felts which were evaluated as active layers for the
electrodes. The measurements cover surface area, pore size and distribution,
electrical conductivity and electrochemical activity of felt samples from different
sources. The focus then shifts to the surface characteristics of the carbon/graphite
felts and their relationship to the electrochemical activity. Carbon-oxygen surface
7
functional groups on the felt surface and the conditions leading to their formation
are discussed. Intensive investigation on this aspect is carried out by XPS method
(X-ray photoelectron spectroscopy) and scanning electron microscopy (SEM) to
compare some surface physical and chemical properties of two different types of
graphite felts as well as their effect on the electrochemical reactivity and
electrooxidation stability. The third part of the chapter describes the
electrocatalysis of the selected graphite felt for the vanadium redox reactions in
both halves of the cell, and also presents the results from the cell performance
testing of the successfully catalysed electrodes.
The thesis ends with conclusions of the work carried out, and a number of
suggestions for further research on the carbon-plastic composite electrodes for the
vanadium redox battery applications.
8

CHAPTER II
LITERATURE REVIEW
2.1 General Requirements for Electrodes used in the Redox Flow Battery
The general requirements of the electrode material for a redox flow battery
system, can be roughly divided into three major aspects: physical, chemical and
electrochemical[31]. The physical requirements include high electrical conductivity
and mechanical strength. High electrical conductivity enables the cell to have
minimum ohmic losses during operation. Satisfactory mechanical strength of the
material is required to withstand the hydraulic pressure from the electrolyte
pumping without dimensional change during battery operation and to physically
withstand bending during assembly. Secondly, the electrode materials should be
chemically and electrochemically stable. Therefore, it should not be attacked by
the electrolyte while immersed or when current is passing through the system.
Finally, the electrochemical requirements for an electrode material are the most
important and hardest to satisfy and we need to consider some theoretical aspects
to grasp them more fully. The basic function of a cell or battery is to provide the
highest possible cell voltage and current so that the maximum power or energy
can be obtained from this electrochemical system. For example, the cell voltage of
any electrochemical cell can be simply described as[30]:
(2-1)
9
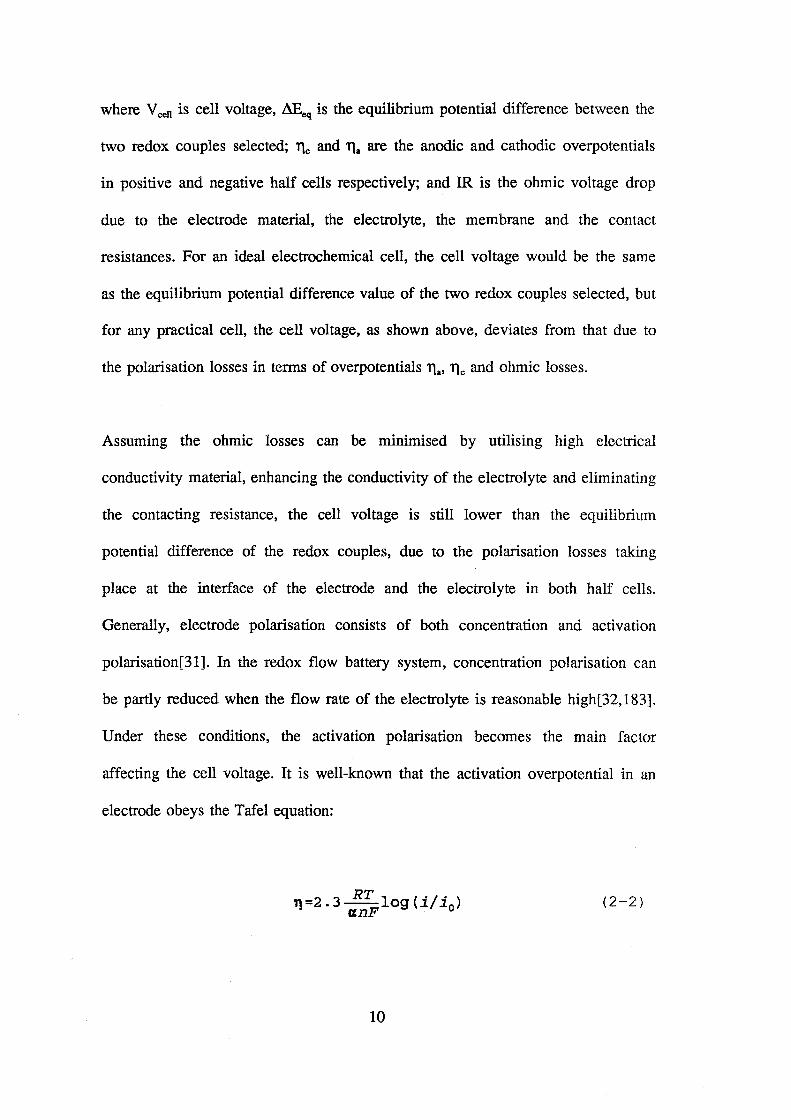
where Vcen is cell voltage, AEeq is the equilibrium potential difference between the
two redox couples selected; 'Tlc and 'Tla are the anodic and cathodic overpotentials
in positive and negative half cells respectively; and IR is the ohmic voltage drop
due to the electrode material, the electrolyte, the membrane and the contact
resistances. For an ideal electrochemical cell, the cell voltage would be the same
as the equilibrium potential difference value of the two redox couples selected, but
for any practical cell, the cell voltage, as shown above, deviates from that due to
the polarisation losses in terms of overpotentials 11 •• 'Tlc and ohmic losses.
Assuming the ohmic losses can be minimised by utilising high electrical
conductivity material, enhancing the conductivity of the electrolyte and eliminating
the contacting resistance, the cell voltage is still lower than the equilibrium
potential difference of the redox couples, due to the polarisation losses taking
place at the interface of the electrode and the electrolyte in both half cells.
Generally, electrode polarisation consists of both concentration and activation
polarisation[31]. In the redox flow battery system, concentration polarisation can
be partly reduced when the flow rate of the electrolyte is reasonable high[32,183].
Under these conditions, the activation polarisation becomes the main factor
affecting the cell voltage. It is well-known that the activation overpotential in an
electrode obeys the Tafel equation:
f1=2.3 RT log(i/i0 ) a.nF
10
(2-2)

where i is the current density passing through the working electrode, i0, the
exchange current density and 2.3RT /a.nF is the Tafel slope. According to the
equation, there are two ways to minimise the activation overpotential: by
enhancing the exchange current density or decreasing the applied current density.
The former is normally linked to the nature of the electrode material, however,
electrocatalysts are also widely used to enhance the exchange current density of
certain redox reactions[30]. The best example of this is given by Bowden and
Rideal [33]: The i0 value for hydrogen evolution was found to be w-to A.cm-2 on
mercury while 10-3A.cm-2 for the same reaction on platinum. Further increases in
i0 can be achieved by employing porous materials and the advantages of which are
briefly summarised by Bennion[34] as:
i. It reduces the true current density for a given apparent or overall current thus
minimising the activation overpotential;
ii. It increases the mass transfer rate of the reactants by reducing the distance
between the storage site and the reaction site.
Hence, from these electrochemical considerations, a suitable electrode for a redox
flow cell should meet the following basic requirements:
1. high electron transfer rate, i.e., high exchange current density for the expected
redox reactions;
2. large surface area which reduces the current density and maximises the total
current;
3. suitable surface structure for the electrolyte to access the electrode surface
readily therefore minimising the concentration polarisation.
11
Beside these technical requirements, careful consideration must also be given to
the cost of the electrode materials. Inexpensive materials are always welcomed
and considered whenever a new system is to be used in an industrial and therefore
large-scale setting.
2.2 Electrodes used in Redox Flow Cells
2.2.1 Electrode materials
In the initial research on the redox flow cell conducted by NASA-Lewis research
centre, a range of electrode materials were screened[35]. Carbon, being readily
available and inexpensive, was the first candidate material tested for several redox
couples. The evaluation was carried out using cyclic voltammetry and the results
indicated that only the Fe(ill)/Fe(II) redox reaction is electrochemically reversible
on the carbon electrode. The other redox couples like Cr(lll)/Cr(ll), V(V)N(IV),
· V(Ill)N(ll), Br-/Br3• and Ti02+/I'i3+ were found to be irreversible. In particular,
for the two promising redox couples, Cr(ill)/Cr(II) and Ti02+/fi3+, the carbon was
found to be a poor electrode material. It was observed that in the chromium
system, the coevolution of hydrogen limited the rate of charge(reduction of
chromic ion) to only a few milliamperes per cm2(io = 0.1 mA.cm·2 on carbon),
while with the titanium redox couple, a surface poisoning reaction took place
during charging.
Further studies indicated that on the B4C electrode, the bromine redox reaction
12

showed fair reversibility, while Cr(III)/Cr(ll) and V(Ill)N(II) showed improved
electrochemical behaviour on this same electrode. More extensive tests were
conducted using a laboratory scale single cell with porous carbon and graphite
materials in different forms such as cloth, felt, foam, carbon chips and reticulated
vitreous carbon (RVC)[35]. It was found that the capacity loss was unacceptably
high for the Fe-Cr redox cell. Therefore, the screening was expanded to utilise
metals like Ag, Ta, Pb, Bi, Ti and Nb, and alloys such as Hg-Ag, Hg-Pb and W
Re in an attempt to find a more reactive surface for the Cr(ID)/Cr(ID redox
reactions. Better cell efficiencies and power outputs were obtained with some non
graphite surfaces such as Pb, but an undesirable lead dissolution during charge
was observed. For the titanium couple, it was found that an oxidised screen of an
alloy of 97 percent tungsten-3 percent rhenium gave much better reversibility than
the graphite electrode.
As a result of the early research work on electrode materials, a further project was
establish to develop an electrocatalytic surface on the graphite felt substrate[36-
38]. The Gold-Lead catalyst system was found to be successful for enhancing the
Cr(III)/Cr(ID redox reaction rate and reducing hydrogen evolution. This was
believed to be due to the catalysing ability of gold for the redox reactions and the
high overpotential for hydrogen evolution on the lead surface. The catalyst system
was prepared either by electrodepositing gold and lead[36] or by gas
reduction[37]. In both case, encouraging results were achieved from the cell
performance testing with the gold-lead catalysed graphite felt electrode.
13
To avoid using the expensive metal catalyst, further efforts were made with
surface ion-etching onto the planer carbon surface and with using silver-lead and
bismuth-lead catalysts as an alternative to the gold-lead system[37]. The former
one produced a negative effect, i.e., hydrogen evolution was more active than the
chromium reaction, while the latter showed some benefit but not as good as the
gold-lead catalyst.
A Japanese group at ETL (Electrotechnical Laboratory) which has also been very
active in the development of the redox flow battery, also carried out electrode
materials screening[39-41]. Their interest in electrode materials has concentrated
on various graphite fibres from all the sources throughout Japan, and over one
hundred carbon/graphite fibres obtained by pyrolysis of various hydrocarbon
substrates were evaluated. The results obtained indicated that some of the PAN
(polyacrylonitrile) based graphite fibre electrodes showed good cell voltage
efficiencies and are suitable as electrode materials.
Another valuable research effort on electrode materials for redox flow cell was
conducted by Ashimura and Miyake[32]. In their studies, a porous flow-through
carbon electrode was employed. The cathodic polarisation behaviour of the
Fe(IIT)/Fe(m and BrJ.Br· redox reactions with the electrode was evaluated and
compared with that obtained with a smooth platinum electrode. The results
revealed that the electrode kinetics on this electrode were controlled by mass
transfer, and the electrode polarisation was reduced as the flow rate of the
electrolyte increased. The effect of electrode thickness and surface area were also
14

evaluated, and it was found that increasing both the surface area and electrode
thickness resulted in a decreased polarisation.
Electrode materials evaluation and development were also carried out in the all
vanadium redox battery system[26,27,42-45]. A number of materials including
metals like gold, lead, platinised titanium, iridium oxide dimensional stable anode
(DSA) and carbon graphite products, such as graphite plate and rod, glassy carbon,
carbon/graphite felts, carbon cloth and graphite paper were tested. It was reported
that on gold and glassy carbon electrodes the V(V)N(IV) redox reactions are
irreversible, while on the lead and titanium electrodes, passivating phenomena
were observed in the potential range of interest. However, platinised titanium and
iridium oxide DSA electrode showed better electrochemical reversibility and cell
performance than the other materials[26]. The glassy carbon electrode showed a
slow electrode reaction rate for both V(V)N(IV) and V(III)N(II) couples and was
also very sensitive to the electrode surface preparation procedure[27 ,42].
Other efforts were concentrated on using carbon/graphite felt based electrodes[43-
45], and promising results were obtained from both the laboratory small scale
cells[ 43,44] and a 1 KW prototype battery[ 45]. In the former case, one cell with a
carbon felt electrode was tested over 2,000 hours and still retained good
charging/discharging behaviour, while a 90% overall energy efficiency was
obtained from the 1 KW prototype battery employing graphite felt/carbon-plastic
composite electrodes.
In summary, it appears that the preferred electrode materials for a redox flow cell
15

are porous carbon/graphite felts, cloths and foams, even though the electrode
kinetics for most redox couples on these surface are relatively slow.
2.2.2 Structural Characteristics of Electrodes for Redox Flow Cells
A suitable structure of the electrodes is always desirable for any kind of
electrochemical cell or battery. For example, in order to maximise the power
output in the hydrogen-oxygen fuel cell, metal materials, such as palladium,
platinum, silver and nickel, which possess high activity for the hydrogen and
oxygen reactions, always have high porosity to assist the electrochemical reactions
in the gas-solution-solid interface[46]. For a redox flow cell, even though only two
phases are involved, the importance of a porous structure still applies. It is
generally agreed that, most redox reactions at a carbon electrode are slow, i.e.,
they exhibit low exchange current density values. According to a simple
mathematical model of a porous electrode, i0, the exchange current density, act as
the product ai0 where "a" is the active electrode area per unit volume. If the value
of io for a desired reaction is low, it might still be made to operate at an
acceptable apparent current density and low overpotential by using a porous
electrode with a large "a". The other benefit of using a porous electrode, as
mentioned previously, is the increase in the mass transport rate by reducing the
distances between storage sites and reaction sites[34]. This is probably the reason
why in almost all redox flow cell systems, porous electrodes are commonly
employed.
16

Even though the principle is the same for each, there are still a number of types of
porous electrodes that exist for redox flow cell application, each with its
advantage and disadvantages. The discussion which follows looks at four types of
electrode:
1). Bulk porous electrode
Bulk porous electrode means that the bulk electrode material has a porous
structure and the electrode functions as current collector and electrochemical
reactor. This kind of electrode is widely used in fuel cells. The "Raney" electrode, ,,
which is made of a electroactive metal for the hydrogen or oxygen reactions, is an
example. By forming a metal mixture of an active metal with a undesirable metal
like aluminium, and then dissolving the unwanted metal in strong alkaline
solution, a porous metal electrode, the Raney electrode can be obtained[ 46]. The
method for making a porous carbon electrode is also reported in the same book.
As another example, bulk porous carbon electrodes were employed as positive and
negative electrodes for Fe-Cr and Fe-Br redox flow cells by Ashimura et al[32,
47-50]. In their research, the pore size and surface area of the porous carbon
electrode and their effects on electrolyte flow rate, electrode polarisation behaviour
and cell performance characteristics were evaluated. The regeneration of the redox
couple was also one of their main interests.
The advantages of this kind electrode is the ease of operation and assembly. Its
main disadvantage is the lack of design flexibility.
17

2). NASA cavity fill-in electrode
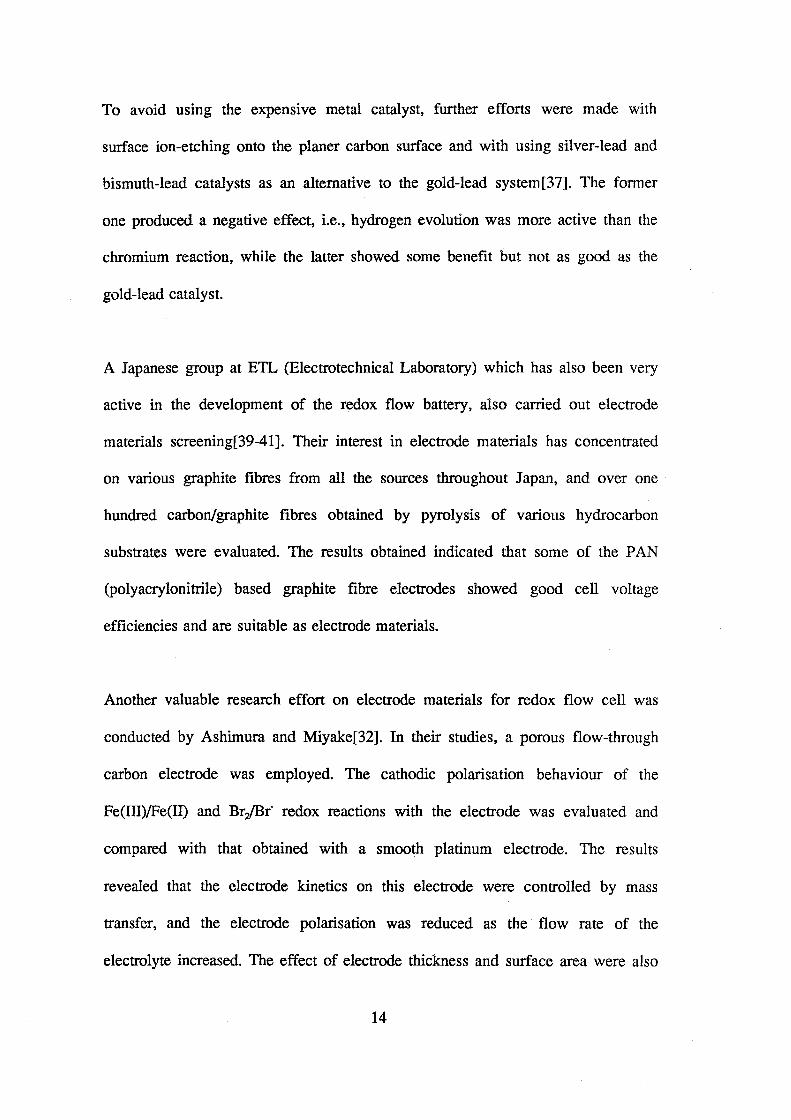
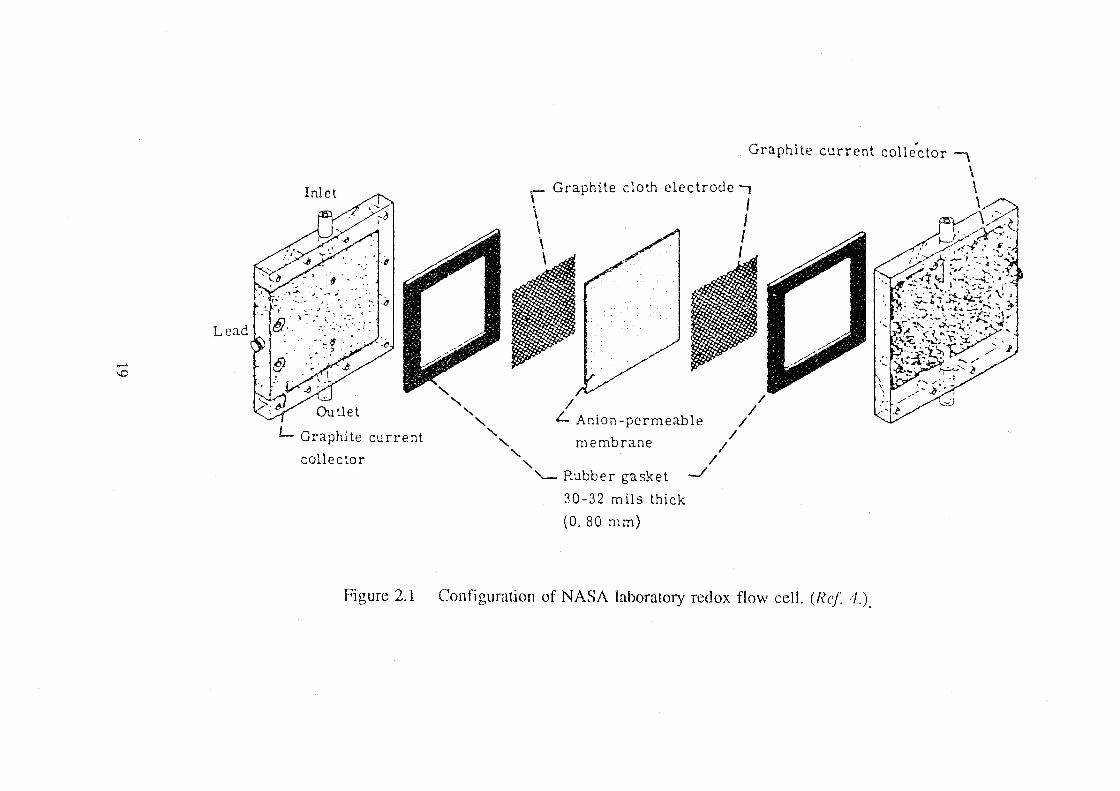
The configuration of a typical NASA laboratory scale redox cell is illustrated by
Figure 2.1[4] and 2.2[183]. Among the components shown, two pieces of graphite
cloth are the inert electrodes for both the positive and negative half cell. Two
graphite plates in the cell terminal are used as current collectors by contacting the
graphite cloth by compression. Because the cell cavity is determined by the
thickness of flow frame and the carbon/graphite felt or cloth are compressed to the
same thickness, it is called a cavity fill-in electrode. This electrode design was
copied by other groups who studied redox flow cell, like the Japanese group at
ETL[38-40]. In the early research work on the all-vanadium redox flow cell
reported in 1987[43], this concept was also employed and the cell performance
was tested with Le carbonne graphite felt electrodes.
It can be seen that in this design, the electrode consists of two zones: an
electrically conducting zone and an electrochemical reaction zone. The graphite
plate in each terminal of the cell functions as the electrically conducting zone, or
in general, as the current collector, while the graphite felt or cloth acts as the
active layer for redox reactions. The separation of these two layers gives the cell
the benefits of being easy to seal and easy to replace the active electrode
materials. The problem it raises is that the thickness of the active layer should be
18
Lead
,_. \0
Inlet
L Graphite current
collector
Figure 2.1
' ' ' ' ' ' ' '
Graphite
Graphite cloth electrode-, I J I I
/ L Anion-permeable
membrane
'-Rubber gasket
30-32 mils thick
(0. 80 mm)
-./
/ /
/
/ /
/
current collector \ \ \ \
Configuration of NASA laboratory redox flow cell. (Ref 4.).
Trim cells
Insulator
pi<Jte
End plate
llll!
Bipolor p\ote
Outlet
Hydrogen inlet
Repeating/ ): cell units '''"
Reb<Jiance cell Open-circuit voltage cell
Figure 2.2 Components of a single redox flow cell and full- function stack.
(Ref 183).
20

higher than the flow frame otherwise high ohmic losses will be introduced by the
poor contact between the active layer and current collector. A high compression,
however, leads to a high pressure drop through the cell, which must be avoided if
pumping energy losses are to be minimised. The other disadvantage of this
electrode arrangement is that the poor flexibility of carbon/graphite materials
requires the carbon/graphite plates to have a minimum thickness (e.g. 0.5 em),
resulting in a high space occupation of the cell stack.
3). Multi-layer bonded structure- conducting carbon-plastic composite electrode
It is not a new idea that a better electrode structure for the redox flow cell could
be achieved with a multi-layer bonded structure. In their paper on the technology
of PTFE-bonded carbon-plastic composite electrodes for fuel cell application in
the past few decades, Kordesh et al[29] pointed out that to optimise the properties
of a fuel cell, only a multi-layered, composite electrode structure can be
successful. The principle layers considered for the fuel cell electrodes are as
follow:
(i). A highly catalysed carbon layer is required. It should not be too hydrophobic,
otherwise it will not achieve a good interfacial contact with the electrolyte.
(ii). The second layer, often called the"diffusion layer", has the purpose of
transporting the gas with a minimum of gas-pressure drop (absolute or partial
pressure drop) to the wet catalysed carbon layer.
(iii). The third component is the current collector.
21
Even though the functions of each layer are not exactly the same for the redox
flow cell, the principle is almost the same. In the redox flow cell, layer (i) and (ii)
would merge into one layer and instead of the requirement of possessing low gas
pressure drop, it should allow rapid access by electrolyte so that the hydraulic
pressure can be minimised.
This idea has already been successfully applied not only to a fuel cell but also to a
redox flow cell system. Fujii et al, of the Japan's NEDO (New Energy
Development Organisation) used carbon-plastic composite electrodes for 80, 400
and 4000 KW zinc/bromine battery stacks and reported the advantages of low cost
and large capacity by using conductive carbon-plastic composite electrodes[51-
53]. Kazacos and Skyllas-Kazacos also presented encouraging cell performance
results, e.g. 88% overall energy efficiency, in both laboratory and 1 KW prototype
vanadium redox battery with the same type of electrodes[43,44].
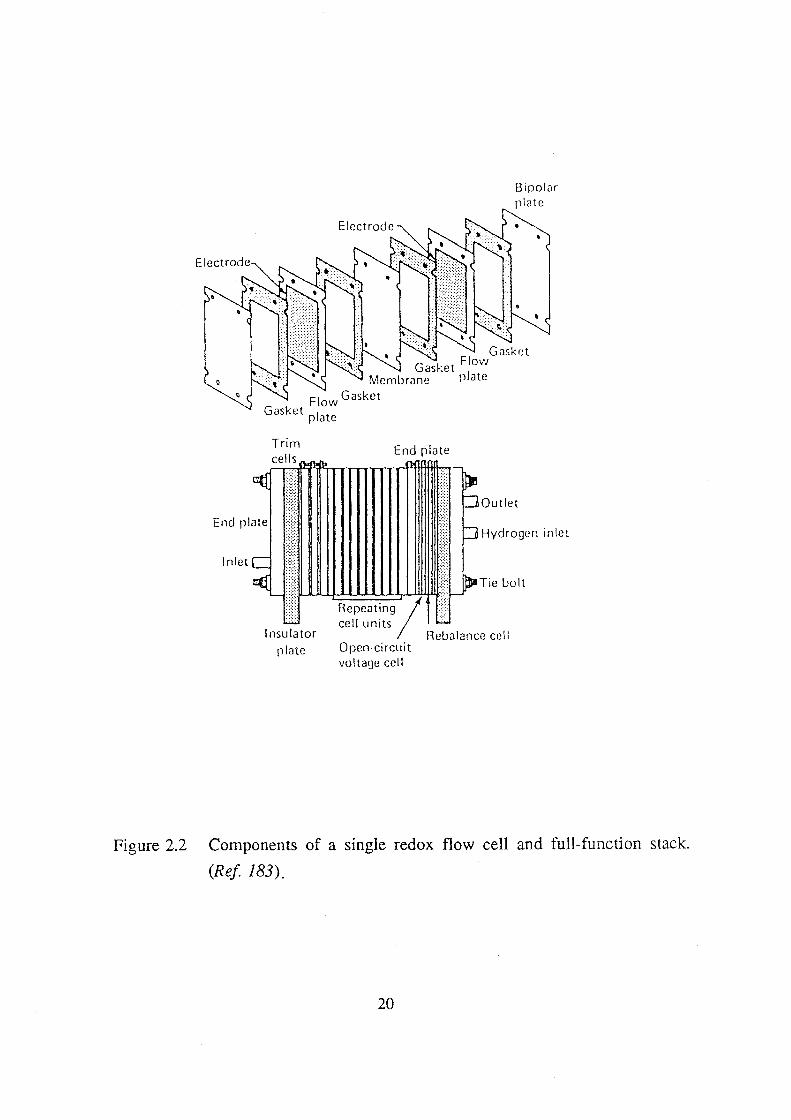
The structure of carbon-plastic composite electrode is shown in Figure 2.3.
Differing from the NASA type electrode, the electrically conducting layer, the
graphite plate, is replaced by a conducting carbon-plastic layer with a metal foil or
mesh which increases the electrical conductivity of the composite materials (in the
case of end-electrode) and the principle layers are bonded to form a complete
electrode. Depending only on the electrical conductivity of the material and the
bonding techniques, and not on the compression of the electrode active layer to
the graphite plate, the ohmic losses from contact can thus be minimised. The other
main benefits of using conducting carbon-plastic composite electrodes are their
22
graphite felt ~ ------
!IIJ\ ~llll 1 1\1111
II l)l\11\'ll\\li1
1ji'I!\l\\. \\ '\ 1~\1!1: tl: II I .J.Itl 1.\r , 1.,
1~!!1!11 Jlllj ~~~~~~ ~ jml!jlll jll\1 I \!IIlli 1
11111:! IIi i[,Jiq lit lill·i ill ·I, IH.! carbon-plastic plate
(a)
graphite felt ~
carbon-plastic
plate (with Cu foil)
(b)
Figure 2.3 Configuration of carbon-plastic composite electrode, (a) bipolar
electrode; (b) end-electrode.
23

low weight and low cost compared with the graphite or carbon plate, and the ease
with which they can be moulded into any size and shape. This means that a thin,
impermeable and conducting carbon plastic sheet can be used as an alternative to
a graphite plate leading to a significant reduction in cell thickness.
4). Multi-function Electrodes
The term multi-function electrodes refers to electrodes which have functions in
addition to those of a normal electrode. One example is a flow frame attached
bipolar carbon-plastic electrode created by the Exxon Research and Engineering
Company[54]. In order to overcome a number of problems encountered in the
Zinc-Bromine redox cell, such as cell leakage caused by electrode thickness
variation, the necessity for inner tie rod bolts and slow processing, resulting from
the separation of bipolar electrode and flow frame, an insert-injection moulding
technique was developed. By replacing the former separate structures with the
insert-injection moulded electrodes (one bipolar electrode and two flow frames
being combined together), the problems mentioned were greatly diminished. The
labour per unit cell was also decreased.
The other example was given by DeCasperis et al, who invented an electrode with
the thickness and porosity of the edge part being different from that of the central
part to prevent gas leakage in the fuel cell[55]. By using a thermosetting resin
carbon fibre composite material, a highly effective edge sealed electrode was
completed, and gas leakage was minimised.
24

As the third type of electrode structure described above was the main interest of
the present project, further detailed discussion is presented in the following
section.
2.3. Conducting Carbon-Plastic Composite Electrode
2.3.1 The concept of conducting carbon-plastic composite electrode
Nearly all plastics are poor conductors of electricity, and their resistivity is in the
order of 1012-1016 n.cm. In the past few decades, the demand for plastics with
certain electrical conductivity is increasing. Depending on the application, the
requirements for the electrical conductivity vary. For example, in the case of
preventing static charges for safety reasons, a material with a resistivity value of
1 OS n.cm might be adequate, while in the case of electrode materials for energy
storage and conversion, as described previously, the higher the conductivity, the
better the materials for battery application. As an example, a conductive plastic
with a resistivity value less than 5 n.cm was considered as a candidate for
developing an electrode material for the zinc-bromine battery[54]. The
conductivity of conducting plastics required for the electrochemical cell
application should be at least close to those of metal conductors.
There are two different methods for producing conductive plastics:
25

(i). By synthesising special polymers that have conjugated double bonds that can
be made highly conductive by complexing or doping[56-58], i.e., intrinsically
conductive polymer.
(ii). By incorporating conductive fillers in insulating plastic matrices which can be
defined as composite materials.
As reviewed by Chandler and Pletcher[59], there is a large number of intrinsically
conducting polymers. Among them, polypyrrole, polyacetylene, polyaniline and
polyfuran are characterised by electronic conductivities up to 104 n-1.cm-t, which is
certainly high enough for them to act as their own current collector and hence
possible to be used as electrodes for battery systems. Unfortunately, most of these
are unstable when exposed to ambient conditions. For example, the conductivity of
polyacetylene decreases with time even under inert condition. Polypyrrole which is
considered the most stable conducting polymer, was found to be attacked by the
acidic and oxidative positive electrolyte of the vanadium battery[28]. Therefore,
intrinsically conducting polymers are unsuitable for this project.
Composite materials are formed by incorporating conductive fillers in insulating
plastic matrices. There are a few kinds of conducting fillers commonly employed
in fabricating conducting composite plastics. They are:
1) carbon black, carbon/graphite fibres and powders;
2) metals in the form of powders, fibres and ferrites;
3) metal-coated fillers, e.g. aluminised glass fibres, nickel-plated mica, etc.
26

Since the metal filler would be attacked by the acidic electrolyte, the interest of
the present study is further narrowed onto the field of composite materials based
on carbon and graphite fillers.
In general, the composite sheet itself has a low surface area and it is always
necessary to attach an active layer to form a complete electrode. These active
layers are also made of carbon or graphite. Therefore. the concept of carbon
plastic composite materials are those made by mixing conductive carbon fillers
with nonconductive plastic resins. Carbon-plastic composite electrodes refer to
those consisting of carbon-plastic composite matrix layers and electroactive
surface layers based on carbon or graphite.
2.3.2 Advances in Carbon-plastic Composite Electrodes
2.3.2.1 Carbon-PTFE composite electrodes
The early applications of carbon-plastic composite electrodes in electrochemical
cell research was based on carbon-polytetrafluoroethylene (PTFE) composites. A
detailed overview in this area was given by Kordecsh et al[29], and as described
in their paper, The Energy Research Corporation (ERC) made a great deal of
effort to develop carbon-PfFE composite electrodes for fuel cell applications. For
example, in order to improve the electrode hydrophilicity of the normal carbon
PTFE composite electrode for fuel cell and other electrochemical cell applications,
Baker et al[60] invented a new composite electrode material using a low
27

percentage of PTFE and a high proportion of electroactive material. The
composite electrodes were then tested in a few different batteries like nickel-zinc,
silver oxide-zinc, and nickel-cadmium cells. Higher cell open-circuit voltages and
amps-hours were obtained from this novel carbon-PTFE composite electrode.
Again Baker et al described PTFE-bonded substrates and PTFE-bonded fuel cell
electrodes in great detai1[61]. The substrate manufacturing starts with graphite and
dry powder PTFE (7.5%), mixed into a lubricant (mineral spirit); the lubricant is
filtered off and the remaining "dough" is rolled in repeated milling operations to a
sheet with a thickness of 0.25 mm. In the next step the dried material was pressed
at about 25 kg/cm2 pressure. The sheets have a porosity of 55% and a resistivity
of 0.05 Q.cm in the plane and 0.07 Q.cm perpendicular to it.
Other examples can be seen in a series of U.S. Patents [62-65]. The former
patents[62-64] propose the use of non-conductive plastic binders which are
rendered conductive by the presence of conductive carbon. Such conductive
plastic, e.g., PTFE, is admixed with active material and the mixture is then
fabricated into sheet form by moulding under pressure at the melting temperature.
The latter patent[65], PTFE is used to provide a degree of hydrophobicity in a
battery electrode, analogous to the fuel cell electrode use of PTFE, to increase the
gas recombination capability of the battery and hence diminish the rate of battery
internal pressure development.
More details about the carbon-PTFE composite electrode was given by Kordesch
et al in [29], while the effects of physical structure on the cell performance of
28
· carbon-PTFE composite electrode was studied by Liu[66].
2.3.2.2 Polyolefin Based Carbon-Plastic Composite Electrodes
Apart from PTFE plastic which is expensive and difficult to process, polyolefin is
low cost and easily moulded. Furthermore, polyolefin plastics are chemically
stable in most aqueous systems and organic solvents. They are mechanically rigid
and non-brittle, making them the most common plastic resins employed in
fabricating carbon-plastic composite materials and electrodes for electrochemical
cell applications.
The development of polyolefin based carbon-plastic composite electrodes started
in 1959 at Union Carbide Corporation (UCC). The early research work developed
an electrode for an oxygen sodium-amalgam cell. Polyethylene bonded active
carbon was used as the electrode active layer[67]. In the years between 1960 and
1970 the development of multi-layered plastic-bonded "composite" electrodes was
aimed at alkaline hydrogen-air fuel cells. The plastic materials were polyethylene
and PTFE[29].
A great deal of research work in this field was encouraged after the redox flow
cell concept was introduced. Bellows et al[54], who was developing a circulating
zinc-bromine battery found that previous zinc-bromine batteries had been plagued
by bromine corrosion of metallic electrodes. Even titanium-based electrodes
showed evidence of pitting corrosion, resulting from bipolar shunt currents and
29
from cell reversal. By using a conductive carbon-plastic composite electrode, this
particular problem has been solved. The carbon-plastic composite electrode is used
for both the zinc and bromine electrodes. An extra layer of porous carbon is added
at the Br2 electrode to increase the reactive surface area. According to their report,
the conductivity of the carbon-plastic composite electrode they developed was
sufficiently high (about 1 (O.cm)"1 ) that there is virtually no ohmic loss in the
case of the bipolar electrodes. However, it is not high enough for monopolar, i.e.,
end-electrodes, but a metallic current collector can be moulded into the carbon
plastic to increase lateral conductivity. There is no observable contact resistance
between the metal screen and carbon-plastic because of the high contact area and
high compressive stresses being used during moulding operations.
As the electrode component, an electrically conductive carbon-polyolefin
composite material was invented by Tsien[68], member of the mentioned zinc
bromine battery research and development group of Exxon Research and
Engineering Company. In his invention, a balanced mixture of fillers was
employed to increase the extrudability of the composite materials. The
composition of the composite comprised a polypropylene-ethylene copolymer; a
silica filler; a fibre-reinforcing agent and a high surface area carbon black. A
composite having 100 parts of copolymer, 15 to 30 parts of carbon black, 0.25 to
1.0 parts fumed silicon dioxide and 1 to 10 parts of a fibre reinforcing agent
selected from carbon fibres and glass fibres gives rise to an electrical resistivity
of about 2 Q.cm and excellent flexural strength, suitable for electrode fabrication.
30
Additional inventions in polyolefm based carbon-plastic composite and electrodes
can be seen in U.S. Patents[69-72]. For example, Meyer[69] invented a high
density polyethylene based carbon-plastic material with stabilising agents to
prevent deterioration of the electrical conductance characteristics, while
Kawashima et al[70] described their invention of a temperature sensitive carbon
polyethylene composite material to allow this material only to work within a
certain temperature range. A great deal of research and development of carbon
plastic electrodes with different composition and structure were reported in recent
decades. Among them, Ogawa and Kishi[73] , of the Toho Rayon Co. Ltd.,
reported a bipolar electrode for redox flow cells. The electrodes are prepared from
mixtures of carbon fibres and carbon black blended with a resin. Thus, a mixture
of 35% conductive carbon black and 65% powdered polyethylene was hot pressed
to form plates having 30 mm diameter manifolds and slit, and areas around the
manifolds and the slits were coated with a polyethylene based electrical insulator
to obtain bipolar electrodes. A 6-cell Fe-Cr redox flow battery using these bipolar
electrodes was found to give high coulombic efficiencies and a low cell resistance,
e.g. 94.2% and 2.3 O.cm2 respectively. Ogawa et al also invented an activation
technique to active a carbon felt electrode made of acrylic-based carbon fibres[74].
The felt was carbonised at 1300 °C, in nitrogen gas for 5 minutes, activated at 880
°C in steam for 30 minutes, and electrolysed in a 20% hypochlorite solution with
3 V d.c. for 5 minutes to obtain a felt with surface area of 20 m2/g and containing
3.9% N and 28 ppm Cl. An Fe-Cr redox flow cell using this electrodes had
coulombic efficiencies over 98%. Jinnai[75] developed a carbon-plastic electrode
which consists of composite materials having around 50% carbon black and
31

graphite powder and two electroactive layers, a porous carbon-plastic layer and a
carbon cloth. Long life time, light weight and low cost was reported for this
electrode. To improve the cell performance of carbon-plastic electrodes in a large
capacity redox flow cell, Kitamura[76] of Mitsubishi Plastics Industries Ltd.
invented a non-fraying and long lifetime electrode with an edge-sealed structure.
Instead of using the conventional blend techniques for preparing carbon-plastic
composite materials, a new method was created by some Japanese researchers[77-
81]. Kitanak:a et al invented a polyolefin based carbon-plastic composite electrode
with very low electrical resistance through the thickness direction and suitable for
redox flow and metal-halogen batteries application[77,78]. According to their
report, 2 carbon fibre mats (base wt. 30 g/m2) and three pieces of 100 micron
conductive polypropylene sheets were stacked alternately, pressed at 250 °C, and
15 kg/cm2 for 5 min, cooled to 100 °C, the pressure was released, the composite
was cooled to room temperature, sandwiched between a pair of PAN-base fibre
cloth (fibre diameter 7 micron, 6000 fibres/strand, and base wt. 600g/m2), pressed
at 240 °C, and 10 kg/cm2 for 5 minutes, cooled to 100 °C, the pressure was
released, and cooled to room temperature to obtain an electrode having a
resistance of 0.045 n.cm2 in its thickness direction and impermeable to liquid.
These electrodes have been employed in the vanadium redox flow battery and
promising results were obtained under the normal cell performance
conditions[44,45]. However, electrode deterioration phenomena was observed
when the cell was operated under overcharge condition for a short period.
Furthermore, small pinhole in the conducting plastic layer led to eventual
32

penetration of the electrolyte to the copper current collector at the end-electrode
resulting in corrosion of the copper and contamination of the vanadium
electrolytes[192].
Fushimi[79], of The Meidensha Electric Mfg. Co. Ltd., also invented a carbon
polyethylene composite electrode, which has a polyethylene-impregnated carbon
fibre sheet sandwiched between a pair of carbon-plastic layers and then pressed to
form the electrode matrix layer. Electrode of this structure were reported to have a
high resistance to warping, and Zn-Br batteries using these electrodes have long
cycle life.
Employing the similar principle, but using epoxy resin instead of polyolefin
plastic, Ogawa and Kishi[80,81] reported a successful bipolar electrode for redox
flow batteries application. This electrode was fabricated by hot-pressing 3 pieces
of carbon-fibre cloth impregnated with a blend of carbon-resin to form a 0.1-lmm
thick bipolar matrix plate and then bonding two carbon-fibre sheets on both sides
to complete the manufacturing. A Fe-Cr redox battery using this bipolar electrodes
had 1.8 n.cm2 cell resistance and 81.4% energy efficiency.
It is obvious that the latter technique, i.e. the "sandwich method", of fabricating
carbon-plastic composite electrodes has some advantages such as uniform
electrical conductivity and mechanical properties through the plane. However, the
thickness of the blended carbon-plastic layer is a critical point, because when too
thick it will result in the electrical resistance increasing through the thickness
33
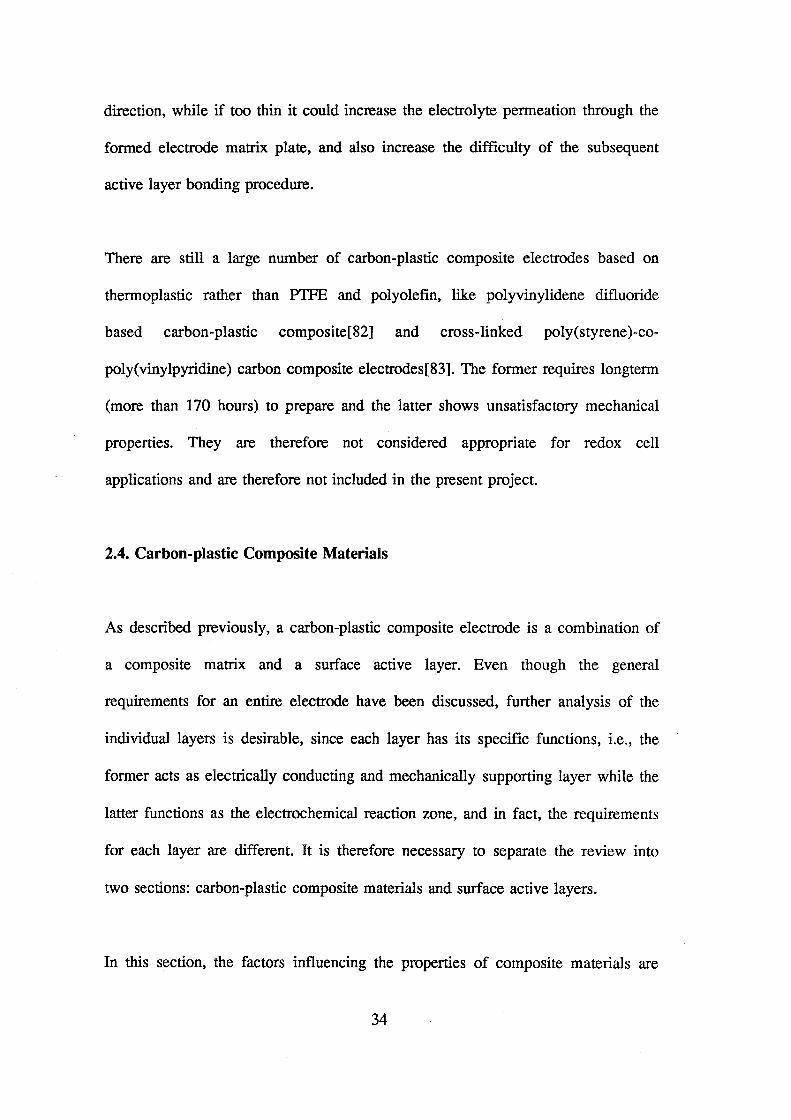
direction, while if too thin it could increase the electrolyte permeation through the
formed electrode matrix plate, and also increase the difficulty of the subsequent
active layer bonding procedure.
There are still a large number of carbon-plastic composite electrodes based on
thermoplastic rather than PTFE and polyolefin, like polyvinylidene difluoride
based carbon-plastic composite[82] and cross-linked poly(styrene)-co
poly(vinylpyridine) carbon composite electrodes[83]. The former requires longterm
(more than 170 hours) to prepare and the latter shows unsatisfactory mechanical
properties. They are therefore not considered appropriate for redox cell
applications and are therefore not included in the present project.
2.4. Carbon-plastic Composite Materials
As described previously, a carbon-plastic composite electrode is a combination of
a composite matrix and a surface active layer. Even though the general
requirements for an entire electrode have been discussed, further analysis of the
individual layers is desirable, since each layer has its specific functions, i.e., the
former acts as electrically conducting and mechanically supporting layer while the
latter functions as the electrochemical reaction zone, and in fact, the requirements
for each layer are different. It is therefore necessary to separate the review into
two sections: carbon-plastic composite materials and surface active layers.
In this section, the factors influencing the properties of composite materials are
34

reviewed, especially, as the most important factor for electrode materials
applications, electrical conductivity of carbon-plastic composite materials are
emphasised. In order to understand more about the electrical conductivity
behaviour of composite materials, composite materials filled with metallic particles
are also included.
2.4.1 Mechanism of Electrical Conducting in Composite Materials
Being a mixture of insulating polymers and conducting carbon fillers, carbon
plastic composite materials are the typical two-phase systems. A transition-like
phenomenon (i.e., the conductivity of the composite discontinuously increases at
some content of the conductive phase) is always observed in conductive composite
materials (see Figure 2.4). The electrical conduction mechanism of two-phase
systems, in particularly, thermoplastics and elastomer have been well studied[84-
94], and a few models have been established to explain and predict the electrical
conduction behaviour for existing or new composite materials. Grekila and
Tien[84] studied the electrical conductivity of Zr02-Ca0 composite and explained
the electrical conduction phenomena with a "contact" theory. This means that
when the content of conducting phase reaches a certain value, the electrical paths
formed by contacting are completed, therefore, the sharp increase in conductivity
can be obtained after that point. Aharoni[85] also utilised a concept of an average
number of contacts to discuss the possibility of the electrical network formation of
thermoplastic composites. Some other researchers[89,90] who studied the electrical
conduction behaviour of elastomer composites have a different point of view.
They believe that the jump of the electrical conductivity is due to the "tunnel
effect" in the thin layers of insulating phase sandwiched by conducting
35
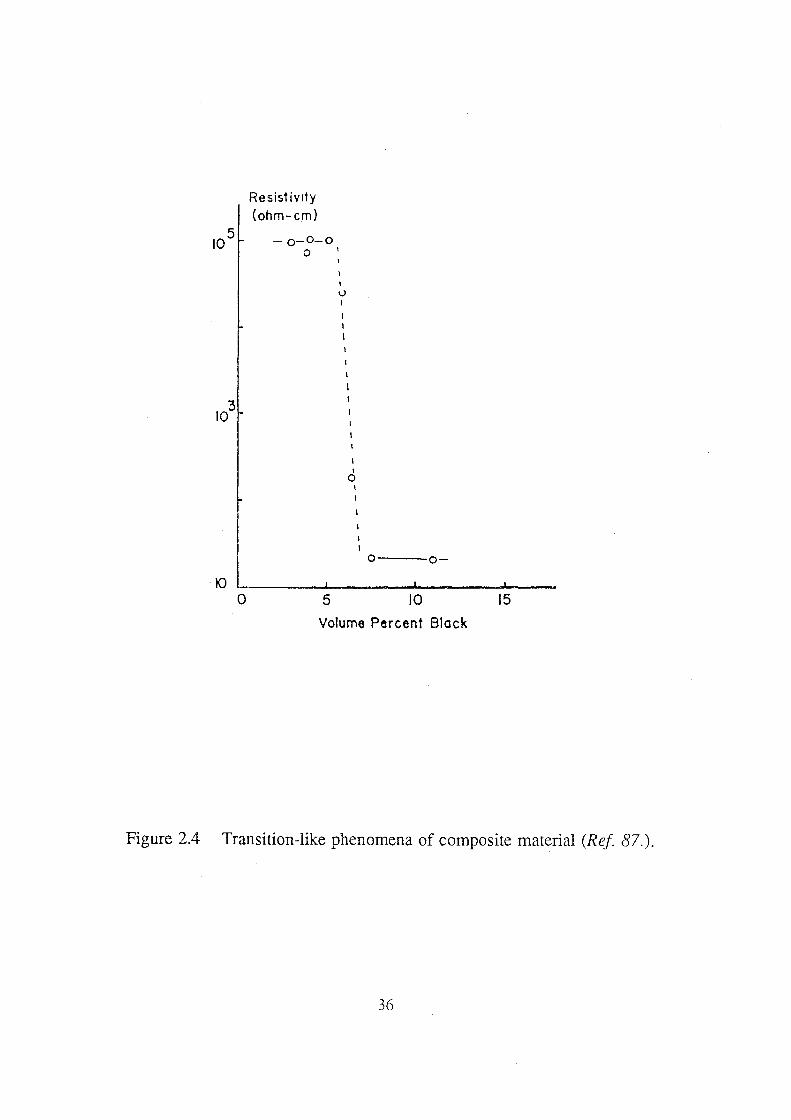
3 10
Resistivity (ohm- em)
- o-O-o 0 '
v 1
' 0 '
o o-
~ ~------_.--------~--------~---0 5 10 15
Volume Percent Block
Figure 2.4 Transition-like phenomena of composite material (Ref 87.).
36

particles, and not to a "passing through network condition". Some different
interpretations were given by Bueche[86,87] and Miyasaka et al[88]. The former
applied Ploy's "gelation" theory to predict the sharp increase of the electrical
conductivity at the particular carbon contents, while the latter raised a "particle
coagulation" theory based on their experimental result observed, i.e., gas
absorptivity of carbon powder in the carbon-natural rubber composites markedly
decreases near the break point of the electrical conductivity, and this reduction
must be due to the decrease in the sorption sites on the surface of carbon particles,
which is caused by the coagulation of the particles.
2.4.2. The Effect of Conducting Filler Content on Electrical Conductivity of
Composites
Regardless of the different explanations of the sharp change of conductivity, one
common point that can be seen is that a certain critical content of conducting
fillers should be added to the composite so that the composite behaves as an
electrical conductor and that the conductivity of the composite will be determined
by the number and geometry of continuous paths of the conducting phase[84].
Depending on the nature and the particle size of the conducting filler, the critical
content and trends of conductivity against content after the critical point are
different. For the Zr02-Ca0 system, the critical content of CaO was 0.39 mole
fraction[84], while for PVC-Ni system, it was found to be 10% (volume percent)
Ni of the composite[93]. In a PMMA-Cu composite, the sharp change in
conductivity was also found around 10 volume percent[92], at which the resistivity
value of the composite changed from 1012 .Q.cm to 1~ .Q.cm, while in a ~6H74
wax-carbon black system, the critical increase in conductivity was observed at 7
volume percent black[87], where resistivity drops from 105 down to 101 .Q.cm.
37
Mter the critical point, the trend in electrical conductivity versus content of
conducting filler is moderate. For example, in the iron/polymide-amide composite,
"square" resistivity changed from 4x10¹¹ Q to 3.6xl(f Q at 19.5 V% iron and only
a very small decline was observed when the iron content increases up to 50 V%
[85]. However, depending on the type and particle size of the fillers, some
difference can be observed[84,85,87,92,93].
2.4.3 The Influence of Particle Sizes and Surface Area of Conducting Fillers
on Electrical Conductivity
According to the two-phase electrical conducting theories[84-88], in particular, the
"contacting" theory discussed in [84,85], the electrical conducting paths are
formed by contacts between conducting filler particles. Therefore, increasing the
possibility and the area of contact should lead to an increase of conductivity. The
surface area of conducting fillers increases with decreasing particle size, so that
this will result in a large contact area. By applying small particles and increasing
the content of total particles, the probability of forming current paths increases.
Based on various experimental results, Scarisbrick[95] pointed out that at a
distance of less than 10 nm between the particles, a transfer of electrons through
the polymer becomes probable. Malliaris et al[93] studied the influence of particle
size on the electrical conductivity of a HDPE-Ni compacted mixture system and
found that, at the same loading, increasing the ratio of ~ (radius of polymer
particles) to ~ (radius of metal particles) resulted in an increase in the electrical
conductivity of the composite. The critical content at which conductivity suddenly
jumps, also decreases. A few mathematical models [86,88,93] have been
established and used to predict the relationship between resistivity of composites
and the characteristics of conducting fillers (particle size and volume). For
38

example, Malliaris and Turner [93] related the volume of conducting fillers to the
radius ratio of polymer to metal particles:
VB = 100[l+(<l>/4)(R/Rm)J1
where V u is the volume at which the formation of the electrical conduction path
completed, and ~ is the radius of polymer and ~ the radius of metal, and <I>, a
factor which depends in the mode of packing of the metallic particles. This model
has been found to be fitted by experimental data.
The influence of carbon black particle size on the electrical conductivity of the
carbon-plastic composites has been extensively and intensively investigated[96-
99]. Even though the electrical conductivity of carbon black is lower than that of
metal particles, the trends in the relationship between conductivity and particle
size are the same.
2.4.4 The Influence of Polymer Phase On Electrical Conductivity of
Composites
The previous few sections on composite materials, focussed only on the
conducting phase. As described by Grekila et al[84], however, the properties of
two-phase system are dependent on the microstructure as well as on the properties
of each phase. The polymer phase, although insulating to electrical current, acts as
a matrix for the composite, influencing the conductivity of composite materials in
several ways as a result of the different polymer characteristics. Essentially, these
are[96]:
a) different rheological behaviour in the processing stages;
b) different wettablity of polymer for conducting fillers, especially, for carbon
39

black;
c) different crystallinity;
d) multi-phase polymer construction(e.g. ABS);
e) the specific resistance of the polymer itself.
One of the most important factors, the influence of crystallinity of the polymer on
the electrical conductivity, was examined and comparison was given for several
carbon black-thermoplastic composites. It was found that the conductivity of the
composites at the same carbon black loading obeyed the sequence: PP
(polypropylene) >HDPE (high density polyethylene) >LDPE (low density
polyethylene) which corresponds to the crystallinity order[96].
It should also be noted that the crystallinity of the polymer phase is affected
greatly by a number of factors, such as process history and characteristics of
fillers. The former includes cooling speed, rheological conditions, presssure
conditions and availability of a crystal-nucleus promoting substance, while the
latter relates to type and particle size of conducting fillers[96].
Miyasaka et al[88] also concentrated their studies on the influence of the polymer
phase on the electrical behaviour of the composites and concluded that the critical
carbon content corresponding to the break point varies depending on the polymer
species and tends to increase with the increase in the surface tension of the
polymer species.
There are still other factors, like processing conditions, influencing the electrical
behaviour of the composite materials. These are not covered in the present review,
however, detailed discussion can be obtained from references [96-99].
2.5. Carbon/Graphite as Electroactive Layer
40

Carbon/graphite materials are widely used as electrodes for electrochemical cell
applications because they are inert to most chemicals and solvents, and also
because of their reasonable cost. There are a great deal of commercially available
carbon and graphite products, each composed almost exclusively of carbon atoms
and yet having distinctive properties[100]. In the field of redox flow cell,
carbon/graphite materials in high surface area, high porosity forms are the most
preferred[34]. The utility of carbon cloth in NASA Fe-Cr redox flow cell is one of
examples[35-38]. But again there are several hundred grades of carbon cloth and
felts available from different sources and it was found that the variation in
electrochemical activity from felt to felt is considerable [39-41]. An understanding
of the physical and chemical properties of carbon/graphite materials employed as
electroactive layer and their relationship to the electrochemical reactivity would
thus assist in the optimisation of efficiency for a certain electrochemical system.
On the other hand, oxygen complexes are easily formed on the carbon and
graphite surface[101] and are known to influence the electrochemical behaviour of
the electrodes. Suitable surface treatment would enhance the electroactivity while
severe oxidation would result in deterioration of the carbon/graphite electrodes.
Furthermore, compared with noble metal electrodes, the electron transfer rate of
many redox reactions at carbon/graphite electrodes is much slower. It was realised
that trace amounts of some noble metal on carbon substrate give much better
electrode performances[36-38]. A consideration of electrocatalysts is therefore
desirable.
41

2.5.1 Surface Microstructure of Carbon/Graphite Materials and Its Relation
to Interaction with Oxygen
Thrower[lOO] has stated that the properties of carbon/graphite are always
determined by the microstructure of the materials, which are in turn determined by
the starting materials, or precursors, and the processing conditions including
forming method, heating rate, fmal temperature, etc. The details of the
carbonisation process and the formation of possible compounds and structures
according to each temperature step were clearly described by Singer and his co
worker[102,103]. As an example, Figure 2.5 illustrates the carbonisation process
for a graphitizable organic material. Depending on the processing temperature, the
materials will behave like carbon (below 2500 °C) or graphite (above 2500 °C) or
in many cases, have both characteristics. From the aspect of microstructure,
Golden et al[lOl] defmed graphite as crystalline carbon, which exhibits well
ordered parallel stacks of carbon layers, and carbon black as amorphous
microcrystalline carbon which is composed of more disordered structures. A
schematic diagram explaining the structural difference between these two typical
carbon materials is shown in Figure 2.6[101].
Besides the processing conditions, the microstructure of carbon/graphite materials
are dependent on the precursors, or raw materials used. Again Thrower[lOO]
studied the effect of precursors including needle coke, fluid coke and Santa Maria
coke, on the microstructure of the final graphite products by transmission electron
microscopy (TEM) and concluded that different precursors can be used to produce
42

-H
CC0~-5000C AROMATIC HYDROCARBON
l COKE
J CARBON
" GRAPHITE
Figure 2.5 Schematic diagram of the carbonisation process for a
graphitizable organic material (Ref 102.).
43
graphite materials with quite different microstructures.
In contrast to the bulk carbon/graphite materials considered above, carbon fibres
are relatively new materials. New types of fibres from various sources are
constantly being introduced and the influence of processing on the microstructure
of the fibres is still not well understood. However, the raw materials for
fabricating carbon fibres are well recognised. The most common precursors used
for carbon fibre manufacture are rayon, polyacylonitrile (PAN) and pitch[lOO],
among them, the latter two are of major current importance. The effect of
precursors on the microstructure of carbon fibres has been reviewed by
Johnson[104], and it is generally agreed that PAN and pitch based fibres have
their own specific microstructure. For high modulus (type I) PAN fibres, it is well
recognised that they have an outer sheath in which the turbostratic layer planes
and crystallites are more highly oriented than in the core, and are also
considerably larger, while the structure of the central core region is very
complicated and considered much more random[105].
In pitch fibres which have an almost perfectly circular cross section, the crystallite
size is larger and is considered a consequence of the liquid crystal origin[106].
Thrower and Jones studied pitch fibres (VSB-32) and found that they have a
similar microstructure to the high modulus PAN fibres, which are composed of a
microfibrillar core surrounded by an oriented sheath[107].
Many other factors which are not included here are also very important in
44

(a)
Stt·ucture of Microcrystalline Carbon
(b)
Figure 2.6 Structural comparison of graphite and carbon, (a) graphite; (b)
carbon (Ref 101.).
45

influencing the microstructure of carbon/graphite materials. It is therefore not
surprising that the remarkable differences in properties, especially chemical and
electrochemical activity are always observed for carbon products. It would be of
great value therefore, to relate the microstructure and the activity of carbon so that
a maximum efficiency would be obtained by using the proper carbon materials or
by modifying the surface to suite the selected system requirements.
Golden et al studied the relation between crystalline nature and the oxygen
chemisorption ability of carbon materials and concluded that the chemisorption of
oxygen on carbon is associated with unsaturated carbon atoms either at the edge
of basal planes or present as defects in the basal planes. Both edge area and defect
concentration are greater in microcrystalline carbon than in graphitic materials
[101]. Based on their interpretation, a summary can be made in Table 2.1.
In fact, the oxygen chemisorption on carbon/graphite surface at room temperature
has been recognised for over 100 years. The early reports were given by a few
researcher who studied the gas adsorption behaviour on charcoal surfaces. For
example, Smith, in 1863, reported that oxygen had irreversible adsorption on
charcoal[l08]. His observation was proved later by Lowry and Hulett[109].
Further evidence for the oxygen-carbon interaction was supported by Ward and
Rideal[110], who found that even at 0 °C, the heat of 0 2 adsorption on carbon was
40 Kcal/mole, indicating the strong adsorption tendency.
46

Table 2.1 Characteristics Comparison of Graphite and Carbon
Characteristics Graphite Carbon
structure crystalline microcrystalline
edge area small large
concentration of surface lower higher
defect sites
unpaired electrons lower higher
concentration
capacity for chemisorption of weak: strong
02
formation of carbon-oxygen less extensive more extensive
surface complex
More ,recently, one group of scientists intensively studied the oxygen
chemisorption behaviour on carbon surfaces[lll-114] . As one example, they
studied the oxygen chemisorption behaviour on a cleaned carbon surface in the
temperature range 25 °C to 400 °C with an oxygen pressure of 500 millitor, and
found out that within the temperature range 25-250 °C, oxygen was adsorbed in
the form of lactone groups, while above 300 °C, it appeared as carbonyl
groups[lll]. They also studied oxygen chemisorption on a highly graphitised
carbon black which was previously oxidised in oxygen at 625 °C, in the
temperature range 300 to 600 °C at low pressures up to 0.5 mm Hg, and reported
that a peak: adsorption was obtained at a temperature around 400 °C[112-114].
47
2.5.2 Carbon-Oxygen Surface Complexes and Surface Treatment
The strong carbon-oxygen interaction resulting from the microcrystalline structure
of carbon/graphite materials leads to the existence of various carbon-oxygen
functional groups, or in other words, carbon-oxygen surface complexes[101].
2.5.2.1 Formation of Carbon-Oxygen Surface Complexes
The formation of carbon-oxygen surface complexes has been widely investigated.
The use of oxidising gases is one of the effective ways to obtain various surface
functional groups. Ogawa studied the effects of oxidation conditions on the
formation of carbon-oxygen surface complexes and reported that when carbon is
heat treated and cooled in a high vacuum, some functional groups which show
basic behaviour existed, while on exposure to oxygen at 400 °C, the functional
groups turned acidic[l15]. The temperature dependence of surface functional
group formation was studied by Kruyt et al[l16], and by Boehm[l17]. According
to their reports, when carbon materials were treated in oxygen gas between 200 °C
and 500 °C, acidic surface groups are formed, while basic surface complexes were
observed when the carbon was treated in a vacuum or in an inert gases
atmosphere, and then contact with oxygen only after cooling to low temperature.
King[ 118] reported that the acidic surface was obtained when carbon was exposed
to oxygen near its ignition point temperature and the maximum amount of acidic
surface functional groups were formed at 420 °C.
48
Again Boehm and co-workers[ll9], studied the reaction of oxygen with
microcrystalline carbon and found that in the temperature range 400-450 °C, four
kinds of carbon-oxygen surface complexes with different acidities were formed.
The acidity of the four groups is in the order of: carboxyl group > hydroxy
lactone > phenolic hydroxyl group > carbonyl group.
Oxygen is not the only gas which can react with carbon to form surface
complexes, many oxidising gases are also effective for this purpose. Smith et a1
found that treatment of activated carbon samples with water at 100 and 200 °C for
various periods of time resulted in the formation of two different carbon-oxygen
surface functional groups[120]. It has been reported also that C02[121] and oxides
of nitrogen[122] react with carbon, forming carbon-oxygen complexes as
intermediates.
Oxidising solutions are also used to form carbon-oxygen surface complexes. A
20% increase in oxygen content was observed when a charcoal sample was treated
with concentrated nitric acid[123]. Behrman and Gustafson[124] reported that after
reacting repeatedly with chlorine water at room temperature, a sugar charcoal
sample showed oxygen content up to 25% when the treated sample was outgassed
at 1200 °C. Similar research was carried out by some other scientists and
supporting results were reported[l25,126].
Some more intensive research was conducted on the treatment of carbon with
concentrated nitric acid. Using either charcoal or carbon black, some workers have
49

suggested that such treatment leads to the formation of carboxylic, phenolic and
quinonic groups[l27]. In addition, Boehm et al also reported that reactions of
carbon with aqueous sodium hypochlorite lead to the formation of phenolic and
carboxylic groups[l19].
As the oxygen-carbon interactions are very extensive, electro-oxidising, or anodic
polarisation can also result in the formation of surface functional groups. The
existence of surface functional groups formed by anodic electrolysis is confirmed
by the work of Laser and Ariel[128] who studied the behaviour of glassy carbon
on anodic polarisation and subsequent reduction in acid medium. From current
voltage and reflectance-voltage curves they concluded that the overall process on
anodic polarisation is the results of three processes: formation of a redox couple
caused by oxygen chemisorption, irreversible redox reactions of existing surface
groups and, at sufficiently positive potentials, the evolution of oxygen. Possible
surface groups formed on oxidation are, for example, carbonyl groups that
subsequently can be reduced to hydroxyl groups at more negative electrode
potentials.
The quinone/hydroquinone couple is also a possible surface group, as found on
oxidised/reduced pyrolytic graphite[129]. Dunsch and Naumann also reported
evidence for the existence of oxygen-containing groups and chemisorbed oxygen
at the glassy carbon surface[l30]. Further evidence for the existence of carbon
oxygen surface complexes was given by Cabaniss et al[l31] who studied the
effect of anodic polarisation on the electroactivity of a glassy carbon electrode
50
(GCE) to ruthenium complex redox reactions. The electrode was anodically
oxidised in nondegassed 0.1 M H2S04 at an applied potential of +1.8 V vs SCE
for 30 minutes. X-ray photoelectron spectroscopy was employed to analyse the
surface groups of the oxidised and oxidised-reduced GCE surface. Results
obtained proved that the oxidation results in an increase in the concentration of
phenol, alcohol, ether ketone, quinone and aldehyde surface groups but a decrease
in the carboxylate and acid anhydride groups.
Although a relatively new material, carbon/graphite fibres and their surface
properties have been investigated extensively and intensively[131-161]. The most
representative research work on the formation and existence of carbon-oxygen
functional groups on carbon fibres would be that conducted by the research team
directed by Sherwood[151-161]. Using X-ray photoelectron spectroscopy as the
main technique to analyse the surface groups, a continuing and systematic research
has been carried out since 1982. Proctor and Sherwood, in 1982, discussed the
ability and power of XPS as a surface analysis technique for identifying the small
changes in the chemical properties of the carbon fibre surfaces caused by heating,
and also used the technique to study the effect of heat treatment on the carbon
oxygen functional groups of PAN based carbon fibres[151]. The comparison was
made between a sample without any treatment and a sample treated at 1400 °C.
Results showed that the heat treatment causes some losses of oxygen (01jC15
intensity ratio = 0.058 and 0.022 for untreated and heat treated sample
respectively), but increases the number of carbon-oxygen surface groups.
51
Proctor and Sherwood later studied the effect of chemical treatment on the
formation of surface groups on carbon fibres[152]. The research was carried out in
sulphuric acid and ammonium bicarbonate solution. According to their report, the
anodic potential and electrolyte both play an important role in the surface group
formation, since C=O groups were detected when the fibre electrode was
anodically polarised at a lower potential and C-0 groups appeared at rather high
anodic polarisation. C-N groups were detected only in the sample which had been
anodically electrolysed in ammonium bicarbonate solution.
Further studies of electrochemical treatment have involved different solutions and
different pH's. Kozlowski and Sherwood[153] treated PAN based carbon fibre
electrodes electrochemically in nitric acid solution and concluded that the amount
of surface carbon-oxygen groups is dependent on the anodic potential applied, the
oxidation time and also the concentration of nitric acid. The main carbon-oxygen
functional group formed in this case was carbonyl. It was also found that 12
minutes is the time needed to obtain the maximum surface oxide formation when
the fibre electrode was treated at +2.0 V vs SCE in 0.18 mol/L HN03• A
substantial topographical change was also observed for the sample treated under
severe oxidation conditions, e.g. + 3.0 V vs SCE for 20 minutes. The effects of
pH on the surface properties of carbon fibres were concluded as: the amount and
type of surface oxides varies considerably depending on the pH of the electrolyte.
C=O groups increase with pH, while C-OH decrease with pH, and carboxylic
acid/ester (-C02R) groups were present and seen to increase with pH[154]. Some
more details about the effect of electrochemical treatment on the surface chemistry
52
of carbon fibres are described in [155-157].
More recently, Xie and Sherwood reported their research on the surface functional
groups of carbon fibres from different precursors[158]. According to XPS analysis,
differences were found between PAN and pitch based carbon fibres: In the core
and valence-band region, a highly graphitic and an almost unoxidised nature was
observed for pitch based carbon fibres. They also conducted a new study using
microwave plasma to treat PAN and pitch based carbon fibres. In PAN fibres, an
air plasma treated sample showed an increase in C=O groups. This was also
observed in Pitch fibres. Differences were reported between these two fibres: for
PAN fibre, a longer treatment time caused fibre damage, while pitch fibres
showed a treatment time independent behaviour up to 20 minutes, indicating that
it is harder to be oxidised [159-161].
Sun also investigated the treatment of a rayon based graphite felt (FMI graphite
felt) for redox flow cell applications[28]. Oxidising solutions and gases, and
anodic oxidation methods were employed. A considerable increase in surface
oxygen ratio (to carbon) was reported for the samples subjected to various
treatments. It was identified by XPS analysis that the amount of C-0 and C=O
groups increased after treatment.
53
2.5.2.2. Specific Carbon-Oxygen Surface Complexes and Their Influence on
Electrochemical Behaviour of Carbon Electrodes
As discussed in the previous section, a number of carbon-oxygen surface
complexes are believed to be present on carbon surfaces. As summarised by
Yeager et al, the main surface groups are carboxyl, phenol, quinone, lactone and
anhydride and cyclic peroxide[162], although hydroquinones, aldehydes,
fluorescene-type lactones, normal lactones and ethers have also been suggested.
Figure 2.7 shows the structure of the proposed functional groups.
The chemical nature of surface groups on carbon can be characterised by their
acidity, i.e. the ability to adsorb acids or bases. Much effort has been made to
determine the chemical nature of various carbon-oxygen surface complexes(see
references in [101]). As a general agreement, carboxylic, lactone and phenolic
groups are acidic surface complexes, and carbon with these functional groups on
the surface is considered to have an "acidic" nature. Even though some "basic"
character of carbon has been observed, there is still no satisfactory interpretation
for the experimental phenomena[lOl].
However, the influence of surface functional groups on the electrochemical
reactions is well recognised. For instance, Yeager et al reported that the oxygen
reduction reaction is inhibited on a basal plane graphite surface, but is relatively
easy on other types (e.g. that include edge plane) carbon electrode[162]. Kamau et
al studied the relation of electrochemical activity to the surface functional groups
54
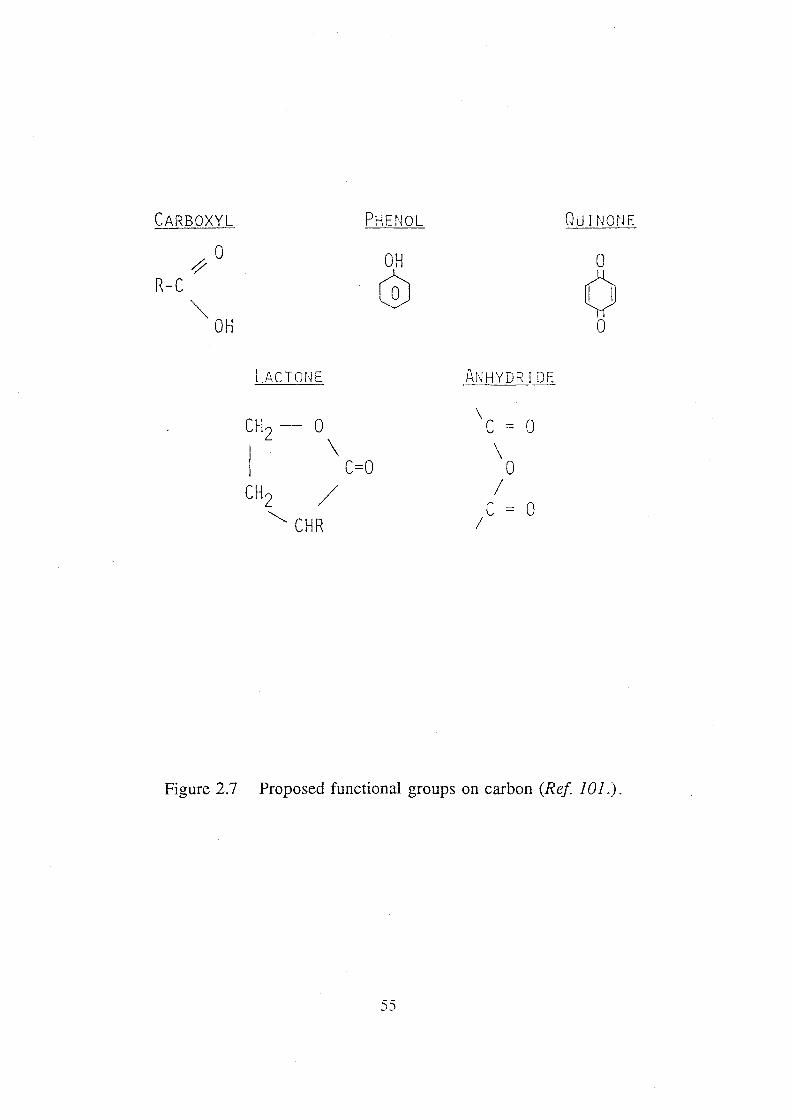
CARBOXYL PHE~~OL
~0 OH R-C @
~OH
LAC TOt~ E
CH2 - 0
I \ C=O
CH2 /
~ CHR
.~r·mYDR I DE
\ c = 0 \
0 I
c = 0 I
QurNmJE
0
0 0
Figure 2.7 Proposed functional groups on carbon (Ref 101.).
55
on the glassy carbon electrode surface and concluded that the existence of
phenolic-like groups, introduced by high speed polishing, enhances the
electroactivity of GCE for the anodic oxidation of ferrocyanide and
ascorbate[l63]. Sundberg et al also reported that carbonyl surface groups were
found on an electrochemically treated glassy carbon electrode, and the treated
electrode showed better reproducibility and electrocatalytic performance for the
oxygen reduction reaction in chloride media[164]. Studying the activation of
highly ordered pyrolytic graphite electrodes for heterogeneous electron transfer,
Bowling et al tried to link the electrochemical performance with carbon
microstructure[l65]. The electrochemical and vibrational spectroscopic properties
of a highly ordered pyrolytic graphite electrode were determined before and after
modification by electrooxidation or pulsed laser irradiation. Both treatments
greatly accelerated the heterogeneous electron transfer rate constants for the
Fe(CN)t'4- and dopamine redox systems by approximately six orders of
magnitude. This enhancement was believed to be due to the increase of surface
active sites.
The relation of surface groups to electroactivity of carbon fibre electrodes has also
been widely investigated. Wightman et al studied the electrochemical reversibility
of carbon fibre electrodes in ascorbic acid and ferricyanide solution and found out
that the reversibility on a carbon fibre electrode treated with high current density
increased significantly[166]. Jannakoudakis used an electrooxidation method to
modify carbon fibre electrodes[167]. The fibre electrodes were treated in 1 N
N~S04 solution by potentiostatic double-pulse application for 6 minutes. The
56

applied potential range extended from +2.3 V to -0.3 V versus SCE and the
duration of oxidative pulse was six times longer than that of the reductive pulse. It
was believed that after treatment, a large number of surface acidic groups is
obtained, since the subsequent palladium electrodeposition was successfully
carried out due to the Pd ions exchanging with the hydrogen ions of the acidic
groups formed on the fibre surface.
Sun also successfully explained the relationship between the enhancement of
vanadium redox cell efficiencies and the surface functional groups formed in the
graphite fibre electrode surface[28]. He treated the graphite fibre electrode
thermally with oxidising solution and electrochemical methods, and found that the
surface oxygen content changed, resulting in the enhancement of the
electroactivity for vanadium redox reactions[28].
In contrast with the opinion that the carbon-oxygen surface complexes enhance the
electrode activity, a few researchers have a different point of view. Poon et
al[l68] studied the effects of a laser pulse on the electroactivity of a glassy carbon
electrode for the ferri-/ferrocyanide and ascorbic system, and concluded that, fast
electron transfer for ferri-/ferrocyanide, dopamine and ascorbic acid is unrelated to
background current, adsorption, ablation, surface oxygen content, and microscopic
surface area. They concluded that the most likely laser effects that promote
electron transfer are desorption of impurities and formation or exposure of active
region on the glassy carbon surface[168].
57

Lausevic and Jenkins also reported the effects of anodic oxidation on the
electroactivity of a glassy carbon electrode and suggested that if glassy carbon is
used as an anode there is a danger of irreversible change of surface morphology
and chemistry, resulting eventually in severe spalling erosion by the formation of
a non-adherent oxidised layer leading to cases of catastrophic exfoliation at high
voltage or high current density[l69]. An oxide film formed on the surface of
pyrolytic graphite electrode during anodic electrolysis was also observed, and it
was considered that the ftlm interferes with the electroactivity of the
electrode[170]. Lipka et al also pointed out that graphite fibres can be oxidised
when maintained for an extended length of time at high anodic potentials where
substantial oxygen evolution occurs leading to loss of mechanical stability and
increased resistivity[171]. Further evidence was given by Neffe who studied the
effects of electrochemical oxidation on the PAN based carbon fibre
electrodes[l72]. He found that anodic oxidation of the fibres at 2.7 V vs SCE in 1
M sulphuric acid with 2000 C/g charge passing, produces cracking of the fibre
skin perpendicular, parallel or askew to the fibre axis.
A major conclusion that can be drawn therefore is that carbon and oxygen have
strong interactions and that there are several ways to produce carbon-oxygen
surface complexes which can somewhat enhance electroactivity of certain redox
reactions. However, over-oxidation of carbon will degrade the electrochemical
properties.
58

2.5.3 Electrocatalysts
As pointed out by Pletcher[30], the need for electrocatalytic materials is most
obvious in large energy intensive electrolytic processes as well as in large battery
systems for load levelling or energy storage. Carbon and graphite, especially,
carbon and graphite felts and cloth are widely used as electrode materials for
redox flow systems. Unfortunately, electron transfer rates for most redox couples
on carbon surface are slow, even though some surface treatments have been found
to enhance the reactivity. In addition, for redox flow cell systems, oxygen
evolution in the positive half cell and hydrogen in the negative half cell during
charging, result in coulombic losses of the cell. Catalysts which can inhibit these
side reactions and enhance the rate of main reactions are therefore desirable. The
importance of using electrocatalysts was also overviewed by Bockris
recently[173].
Depending on the nature of electrochemical system, many materials can be used
as electrocatalysts. For example, metal oxides were employed as electrode
catalysts for ascorbic acid oxidation. Dispersed onto a glassy carbon surface, 37
metal oxides (MOx's) were evaluated[l74]. It was found that the highest degree of
activation was exhibited by those MOx's with a metal oxidation state of +3 or
higher, such as zirconium oxide, cobaltic oxide, chromic oxide, etc.
In many cases, noble metals are utilised as electrocatalysts. As described
previously, the NASA research group successfully developed a number of
59

electrocatalytic systems, such as Au-Pb, Ag-Pb and Bi-Pb to catalyse the
chromium reaction and depress hydrogen evolution in the Fe-Cr redox cell[36-38].
Jannak:oudakis electrodeposited palladium onto a carbon fibre electrode surface
and found that the catalysed electrode showed high activity in the electrooxidation
of formic acid, the electroreduction of nitrobenzene and in the hydrogenation of
benzoyl chloride and oleic acid[167]. Cheng and Hollax studied the electrode
kinetics and electrocatalysis of Cr(ill)/Cr(II) reactions with cyclic voltammetry
and found that at a graphite electrode with small amounts of Au, the addition of
thallium-I-chloride not only accelerates the Cr(ill)/Cr(II) reaction in HCl
electrolyte catalytically, but also raises the hydrogen overpotential more than lead
and bismuth, which were the heavy metal catalysts already tested in the practical
Fe-Cr redox flow cel1[175].
Ashimura et al studied the performance of a iron-titanium redox fuel cell system,
and utilised platinum black loaded on carbon black as catalyst to regenerate the
reactants[48]. This catalyst was also used in some other redox cell
system[ 47 ,49,50].
Silver and its compounds are also used as electrocatalysts. Dekanski et al reported
an electroactivity improvement of glassy carbon electrode by immersing the
electrode into AgN03 solution for about 30 days. A deposition of metallic silver
has been observed on the treated samples[176]. Another example was given by
Takeuchi and Thiebolt[177].
60
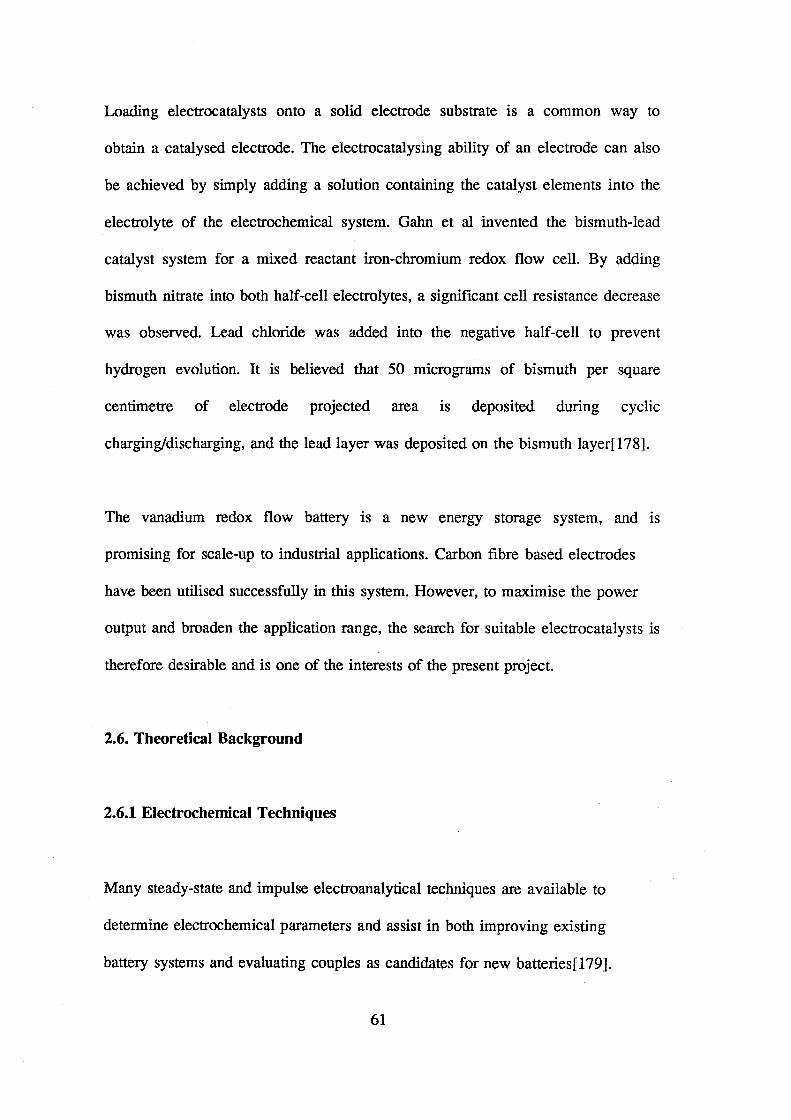
Loading electrocatalysts onto a solid electrode substrate is a common way to
obtain a catalysed electrode. The electrocatalysing ability of an electrode can also
be achieved by simply adding a solution containing the catalyst elements into the
electrolyte of the electrochemical system. Gahn et al invented the bismuth-lead
catalyst system for a mixed reactant iron-chromium redox flow cell. By adding
bismuth nitrate into both half-cell electrolytes, a significant cell resistance decrease
was observed. Lead chloride was added into the negative half-cell to prevent
hydrogen evolution. It is believed that 50 micrograms of bismuth per square
centimetre of electrode projected area is deposited during cyclic
charging/discharging, and the lead layer was deposited on the bismuth layer[l78].
The vanadium redox flow battery is a new energy storage system, and is
promising for scale-up to industrial applications. Carbon fibre based electrodes
have been utilised successfully in this system. However, to maximise the power
output and broaden the application range, the search for suitable electrocatalysts is
therefore desirable and is one of the interests of the present project.
2.6. Theoretical Background
2.6.1 Electrochemical Techniques
Many steady-state and impulse electroanalytical techniques are available to
determine electrochemical parameters and assist in both improving existing
battery systems and evaluating couples as candidates for new batteries[l79].
61
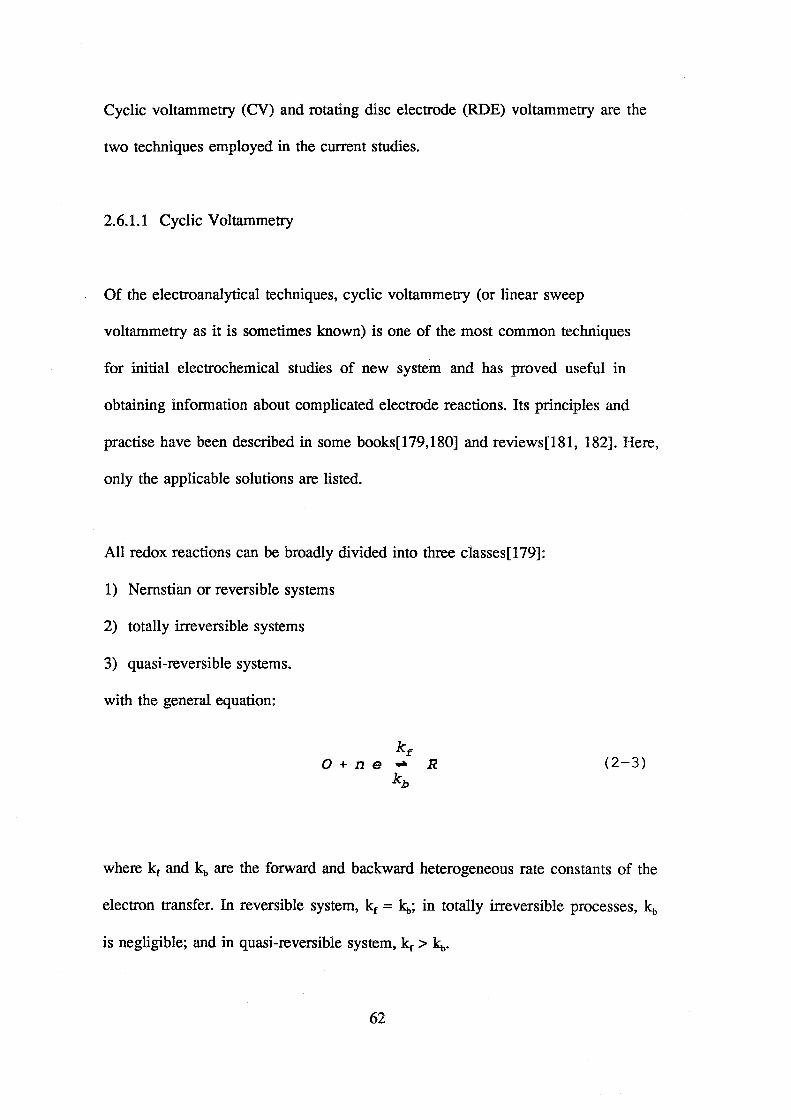
Cyclic voltarnmetry (CV) and rotating disc electrode (RDE) voltarnmetry are the
two techniques employed in the current studies.
2.6.1.1 Cyclic Voltammetry
Of the electroanalytical techniques, cyclic voltammetry (or linear sweep
voltarnmetry as it is sometimes known) is one of the most common techniques
for initial electrochemical studies of new system and has proved useful in
obtaining information about complicated electrode reactions. Its principles and
practise have been described in some books[l79,180] and reviews[181, 182]. Here,
only the applicable solutions are listed.
All redox reactions can be broadly divided into three classes[179]:
1) Nemstian or reversible systems
2) totally irreversible systems
3) quasi-reversible systems.
with the general equation:
(2-3)
where kr and kb are the forward and backward heterogeneous rate constants of the
electron transfer. In reversible system, kc = ~; in totally irreversible processes, ~
is negligible; and in quasi-reversible system, kc > ~.
62

(b)
Potential E
(c)
~
~r-----~======~~==~~~3:--------::J u
Figure 2.8 Cyclic Voltammograms of three typical electrode process, (a)
reversible, diffusion controlled; (b) Totally irreversible; (c) quasi
reversible (Ref 183.).
63
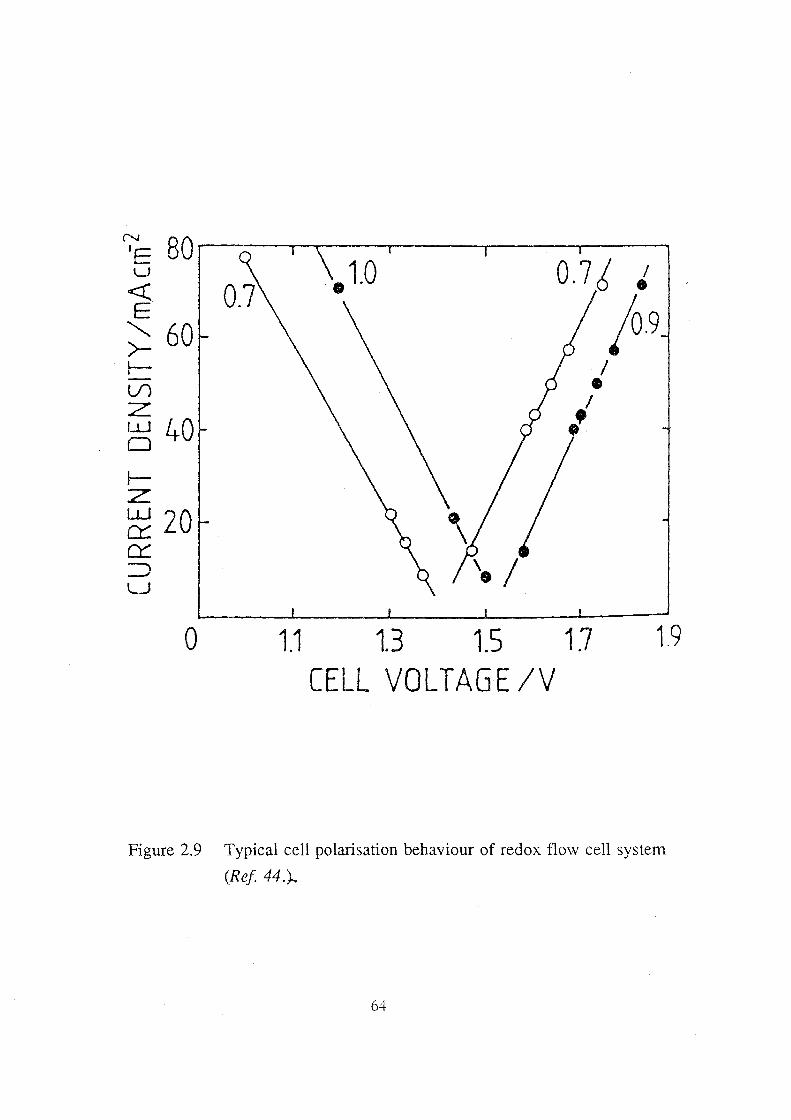
~E so~----~~--~----~------~--~ u <t E
""' 60 >-!-l/)
z ~ 40 1-z ~ 20 cc: ::J u
0 1.1 1.3 1.5 1.7 CELL VOLTAGE /V
I •
1.9
Figure 2.9 Typical cell polarisation behaviour of redox flow cell system
(Ref 44.)..
64

According to the nature of the electrochemical reactions, the cyclic voltammogrms
have different shapes. Figure 2.8(a), (b) and (c) represent three typical
voltammograms of reversible, irreversible and quasi-reversible process
respectively[l83]. A reversible, diffusion-controlled reaction exhibits an
approximately symmetrical pair of current peaks as shown in Figure 2.8(a). The
peak potential separation .1Ep can be determined by the equation:
llE = 2. 3RT P nF
(2-4)
and the value is independent of potential sweep rate. A completely irreversible
electrode process produces a single peak as shown in Figure 2.8(b). The peak
potential is sweep-rate dependent.
The corresponding peak current for reversible and irreversible redox reactions
can be described as:
(2-5)
• 0 an F , ~p=O. 227 nFAC0 exp [- ( a ) (E.,...-E0 )
RT "' (2-6)
65

where: 4 - peak current (amperes, A)
A- area of electrode (cm2)
Co 0 - bulk concentration of species 0 (mol.cm -3)
v - potential sweep rate (V.s-1)
Do - diffusion coefficient of 0 (cm2.s-1)
For quasi-reversible processes the current peaks are separated more and the
shape of the peak is less sharp at its summit and is generally more rounded as
shown in Figure 2.8(c). Again the peak potential is dependent on the sweep rate
and the separation is much greater than that given by equation 2-4. The
mathematical model and data analysis for this electrode process is more
complicated[ 179].
2.6.1.2 Rotating Disc Electrode Method
For an electrode process which is limited by mass transport, rotating disc
voltammetry is often employed to investigate the mechanisms of redox reactions
and determine the diffusion coefficient. The Levich equation is the most important
principle for this electroanalytical technique[179]:
(2-7)
where iL is limiting current density (A.cm-2); n, the number of electrons
participating in the reaction; D, the diffusivity of reactive species (cm2.s-1); v, the
viscosity of electrolyte (cm2.s-1), m, the angular velocity of rotation (s-1) and Cb,
66

the concentration of reactive species in the bulk electrolyte (mol.cm-3).
Rotating disc voltammetry also can be used for determining the basic
electrochemical parameters io and a. of an electrode process limited by mass
transfer[179]. As described by Bard, for an electrode reaction which is
activation controlled, the exchange current density i 0 and transfer coefficient a.
can be determined by the well-known Tafel equation. For an electrode process
affected by mass transport, the following equation applies[179]:
RT io RT <i1. c-i) 11 =--ln-.-+ --ln--=.:._.:::--a.nF ~ 1 , c a.nF i
( 2-8)
where T) is cathodic overpotential; R, the normal gas constant; T, the temperature;
a., the transfer coefficient; n, the number of electrons participating in the reaction;
F, the faraday's constant; J.o, the exchange current density; i1.c, the cathodic limiting
current density and i, the measured cathodic current density.
Equation (2-8) indicates that cathodic overpotential should be linearly related to
ln(i1,c-i)/i, and io and a. can be determined by the intercept and the slope of the
straight line.
2.6.2 Performance Characteristics of Redox Flow Cell
67

As a new energy storage system, a number of characteristics for redox flow cell
should be taken into account. Among them, cell polarisation behaviour, cell
resistance and efficiencies are the basic factors for evaluating an electrochemical
cell[l83].
2.6.2.1 Polarisation Curve and Cell Resistance
In redox flow cell systems, the reactant is flowing through the electrode, as
mentioned previously. The flow rate therefore influences the polarisation
behaviour of the cell. Hence, an assumption of a constant electrolyte flow rate is
necessary when the polarisation behaviour of the cell is evaluated. In this way
conventional polarisation curves can be drawn for each of several different state-of
charge (SOC) levels. Figure 2.9 shows typical polarisation curves obtained for a
vanadium redox flow cell[44]. The numbers near the curves indicated the SOC.
The linear voltage-current relationship indicates that the ohmic polarisation is the
principle cause for the polarisation[183].
The slope of the linear voltage-current curve is defined as the cell resistance with
a unit of n.cm2• It includes the faradaic resistance, electrolyte resistance,
membrane resistance and resistance of electrode materials and electrical contact.
Cell resistance is usually utilised to evaluate the performance of an
electrochemical cell, especially, the voltage efficiency of the cell, however, it is
difficult to determine the resistance of the individual components.
68
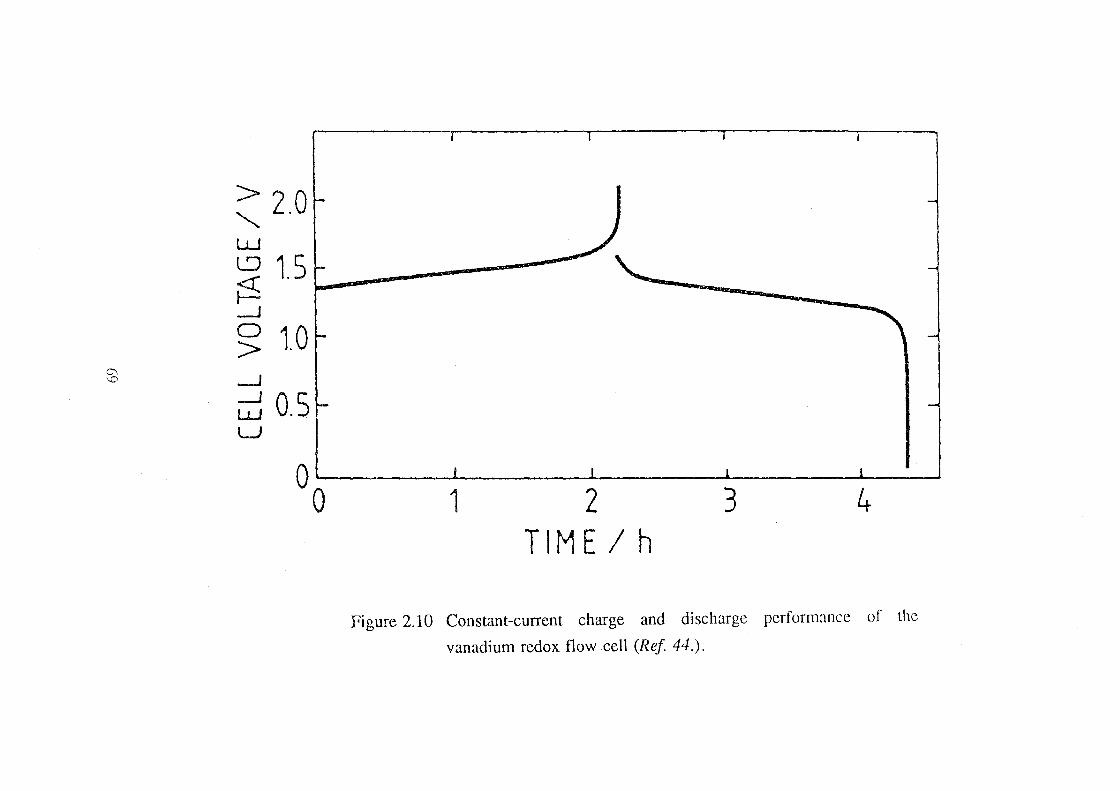
2: 2.0 w ~ 1.5 r--: _J
§; 1.0 0\
_J '-0
uj 0.5 L)
00 1 2 3 4 TIME/h
Figure 2.10 Constant-current charge and discharge performance of the
vanadium redox flow cell (Ref 44.).
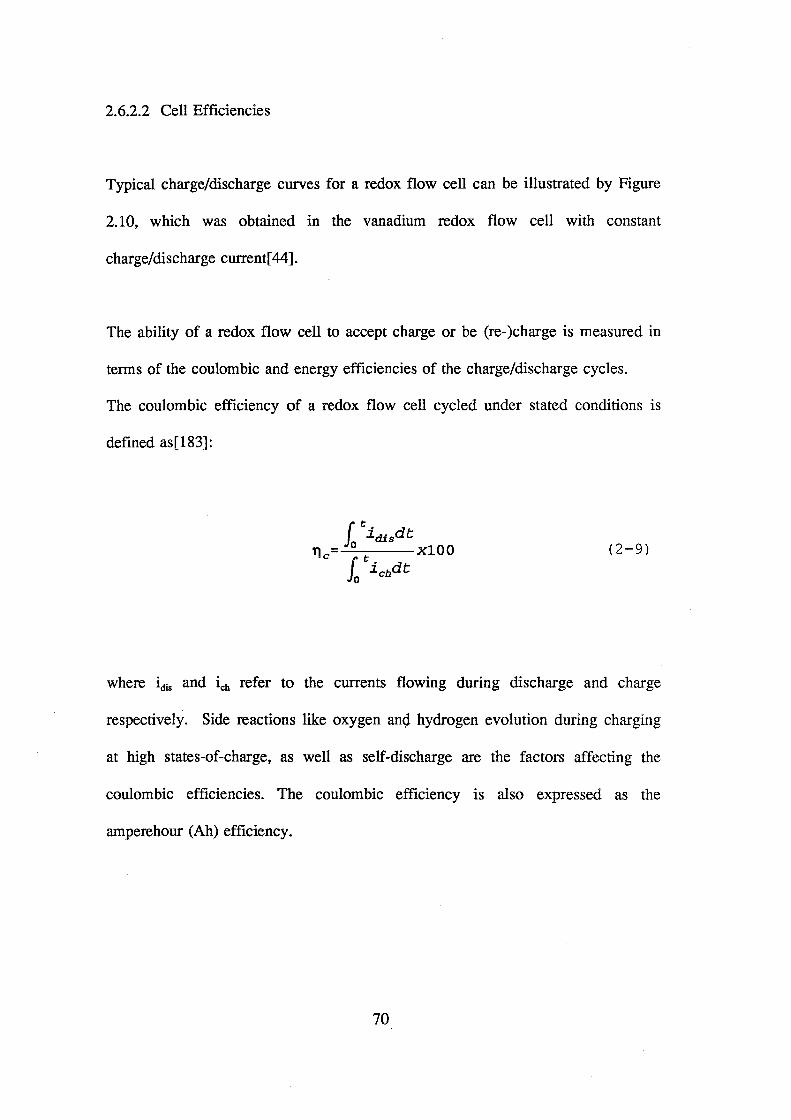
2.6.2.2 Cell Efficiencies
Typical charge/discharge curves for a redox flow cell can be illustrated by Figure
2.10, which was obtained in the vanadium redox flow cell with constant
charge/discharge current[ 44].
The ability of a redox flow cell to accept charge or be (re-)charge is measured in
terms of the coulombic and energy efficiencies of the charge/discharge cycles.
The coulombic efficiency of a redox flow cell cycled under stated conditions is
defined as[183]:
(2-9)
where idis and ich refer to the currents flowing during discharge and charge
respectively. Side reactions like oxygen anQ. hydrogen evolution during charging
at high states-of-charge, as well as self-discharge are the factors affecting the
coulombic efficiencies. The coulombic efficiency is also expressed as the
amperehour (Ah) efficiency.
70
The overall cycle energy efficiencies is given by
(2-10}
~here vdis and vch are the cell voltages during discharge and charge respectively.
The overall cycle energy efficiency is also called the watt-hour (Whr) efficiency.
The Energy efficiency is influenced by both the coulombic efficiency and cell
polarisation losses. A quantitative measure of the effects of the cell polarisation
during the charge-discharge cycle are revealed in the voltage efficiency given by:
(2-11}
The voltage efficiency is alway related to the cell resistance. The higher the
resistance the lower the voltage efficiency. As mentioned previously in this
section, cell resistance consists of faradaic resistance, electrolyte resistance,
membrane resistance, electrode material and contact resistance, therefore, voltage
efficiency is easily affected by each of the cell components.
71

CHAPTER ill
EXPERIMENTAL
As the main body of the thesis is separated into three chapters, each emphasising
specific aspect of the carbon-plastic composite electrode, it is desirable to describe
the experimental procedures separately and correspondently to the relevant
chapter. Hence, the first part of this chapter deals with the experimental aspects of
preparation and evaluation of carbon-plastic composite electrodes. The second part
focuses on the illustration of some electrochemical techniques which were
employed to study the electrode kinetics and evaluate the effects of electrode
surface activation. Relevant to the surface characterisation of the graphite felt
electrodes, the third part of this chapter concentrates on some surface analytical
techniques such as scanning electron microscopy (SEM) and X-ray photoelectron
spectroscopy (XPS).
3.1 Preparation and Evaluation of Carbon-Plastic Composite Sheets and
Electrodes
3.1.1 Preparation
The materials, apparatus and procedures to prepare the carbon-plastic composite
sheets and electrodes are detailed below.
72
3.1.1.1 Materials
Carbon and graphite products
carbon black:
CABOT "black pearl 2000" (Cabot Corporation, Billerica Technical Center, USA)
Degussa FW 200 carbon black (fine powder, 13-35 nm, Degussa Australia Pty.
Ltd.)
Degussa XE-2 carbon black (coarse powder,> 35 nm)
graphite powder: LONZA KS-2.5 graphite (LONZA Inc. Fairlawn, USA)
graphite fibre: KUREHA C-203s (Kureha Chemical Industry Co., Ltd., Chuo-ku,
Tokyo, Japan).
Polymers
low density polyethylene (LDPE, MPI 7(17/1200), Manis Pty. Ltd., Australia)
high density polyethylene (HDPE, Hostalen GM 7655, Hoechst Australia Ltd.,
Melbourne, Australia)
polypropylene (PP, Hostalen PPT 1070, Hoechst Australia Ltd., Melbourne)
styrene-ethylene-butylene-styrene copolymer (SEBS, National Starch and Chemical
Pty. Ltd., Australia)
Graphite Felt
FMI graphite felt, 6 mm, Fibre Materials, Inc., Maine, USA
Toray Graphite felt, 6 mm, Toray Industries, Inc., Tokyo, Japan.
Le Carbonne Graphite felt, 6 mm, Le Carbone-Lorraine Australia Pty. Ltd.
73
Metal mesh
Swiss Screen, 100 mesh (150 micron) brass mesh (Swiss Screen Pty. Ltd.,
Australia)
3.1.1.2 Equipment
An internal mixer (RHEOMIX-600, HAAKE INC., U.S.A) was employed to blend
the carbon-plastic composite materials. A heating and temperature controlling
system was designed to adjust and control the temperature of the mixing head of
the machine from ambient to 250 °C. The capacity of the chamber was designed
for producing up to 70 grams polymer mixture, however, depending on the density
of the ingredients, the weight of mixtures varies. A pressing machine (STACY
HYDRAULICS 40 tonnes hot press, A.E.I. Engineering Pty. Ltd., Australia) was
required for moulding the composite sheets and fabricating the composite
electrodes. It also has heating and temperature controlling system in the
temperature range up to 300 °C. The two heating plates were designed with
dimensions 65x50 em. A cooling water system was also installed through the
heating plates, enabling a quench process to be applied whenever necessary.
Figure 3.1(a) and 3.1(b) show the photos of these machines.
Two types of moulds are needed for fabricating the composite materials and
electrodes. Type 1 is for casting the mixed carbon-plastic into thin sheets. These
74

(a)
75

Figure 3.1
(b)
Equipment for preparing carbon-plastic composite sheet and
electrode, (a) internal mixer; (b) hot-pressure.
76

moulds are made of moulding steel and two sizes, 152x152x(0.3-2.0) mm and
210x210x(0.3-1.0) mm were employed. One of the moulds used was shown in
Figure 3.2(a). Type 2 mould is for bonding the graphite felt onto the composite
sheet to form the composite electrodes. Depending on the thickness of the felts
and the shapes of the electrodes, the dimension of the mould varies. For example,
for the 6 mm graphite felts, the window thickness was 4 mm, while for a 3 mm
graphite felt, a window thickness of 2 mm was employed. The Window thickness
being two-thirds that of the felt is designed for obtaining enough pressure in felt
bonding process. A typical window mould for bonding the graphite felt on to the
composite was illustrated in Figure 3.2(b).
3.1.1.3 Preparation Procedure:
Depending on the polymer used, the processing temperature and time varies.
However, the sequences are the same. The following is an example for making a
rubber modified carbon-plastic composite and relevant composite electrodes. The
procedure is also illustrated in Figure 3.3.
The ingredients, except for the graphite fibre, were dry mixed properly and then
blended at the blade speed of 50 rpm in the internal mixer at 195 °C for 10 min
utes, followed by the addition of the graphite fibre slowly and then blending at
least for another 20 minutes. The mixture was pressure-moulded with 250 kg/cm2
pressure at 220 °C for at least 30 minutes. The moulded composite material was
77

Figure 3.2
cover
mould / ~-=-:Z __ ~/7 ~/========--~· 7
(a)
(b)
Configuration of moulds used for preparing carbon-plastic
composite sheet and electrode: (a) mould for making sheet; (b)
window-mould for bonding graphite felt onto composite sheet.
78

cooled down rapidly to obtain the thin, smooth, conductive and flexible carbon
plastic sheet.
To prepare an end-electrode, only two more steps are needed. Firstly, a metal
mesh (copper or brass mesh is preferred) is placed in the bottom of the mould.
The carbon-plastic sheet is placed on top and the mould heated up to 220 °C. The
temperature is maintained for 20 minutes before applying the same pressure of
250 kg/cm2 for 15 minutes. Secondly, while keeping the hot carbon-plastic sheet
with the metal mesh backing in the mould, a window is placed on the top of the
hot sheet and a graphite felt is placed in the window. A pressure of a quarter of
the original pressure is then applied to the mould with the window, and this is
maintained for 10 minutes. The mould is then rapidly cooled down to obtain the
carbon-plastic and graphite felt composite end-electrode.
To manufacture a bipolar electrode, two windows are required. Placing the two
windows on both sides of the prepared composite carbon-plastic sheet, two pieces
of electrochemically active layers are placed into the two windows. By following
the same procedure of bonding felt for the end-electrode, a bipolar electrode can
be obtained.
3.1.2 Evaluation
The important properties governing the use of materials as electrodes, include:
electrical conductivity, mechanical integrity, permeability, electrochemical activity,
79
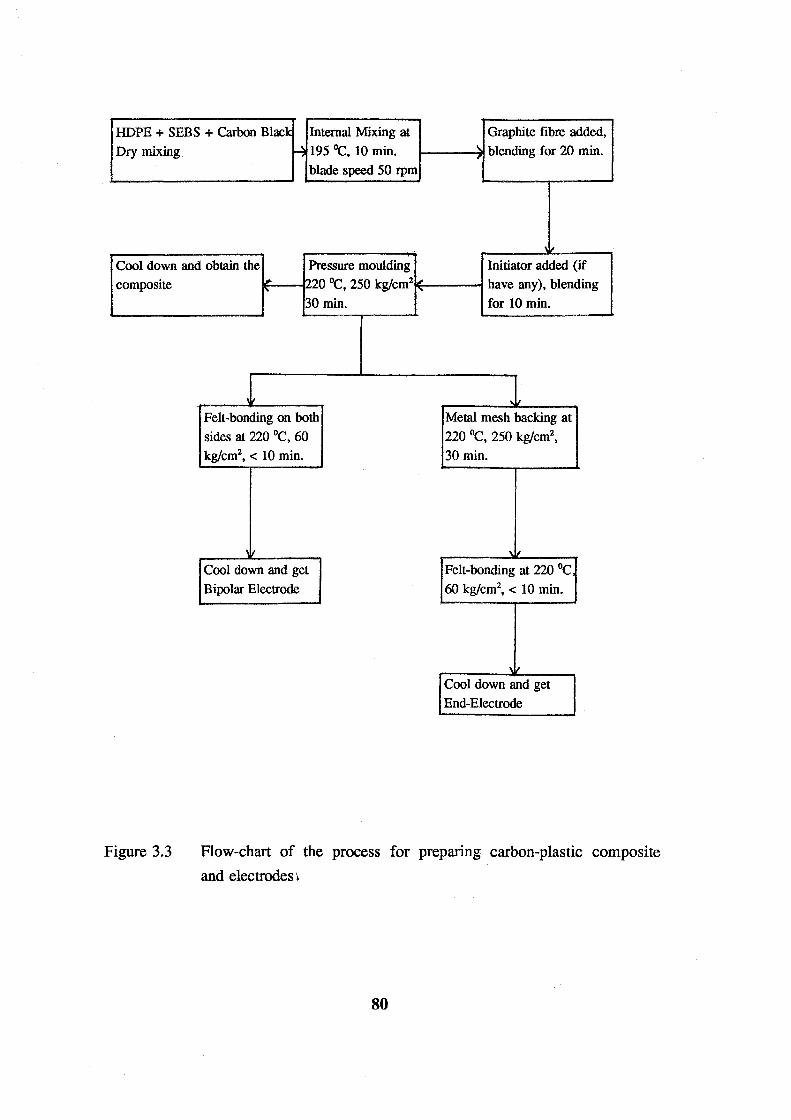
HDPE + SEBS + Carbon Black Internal Mixing at Graphite fibre added,
Dry mixing ~ 195 OC, 10 min. I----?~~ blending for 20 min.
blade speed 50 rpm
Cool down and obtain the Pressure moulding Initiator added (if
composite
Figure 3.3
1F-(-~~L..20 OC, 250 kg/cm21't~:-----t have any), blending
30 min. for 10 min.
Felt-bonding on both
sides at 220 °C, 60
kg/cm2, < 10 min.
Cool down and get
Bipolar Electrode
l Metal mesh backing at
220 °C, 250 kg/cm2,
30 min.
Felt-bonding at 220 °C
60 kg/cm2, < 10 min.
Cool down and get
End-Electrode
Flow-chart of the process for preparing carbon-plastic composite
and electrodes 1
80
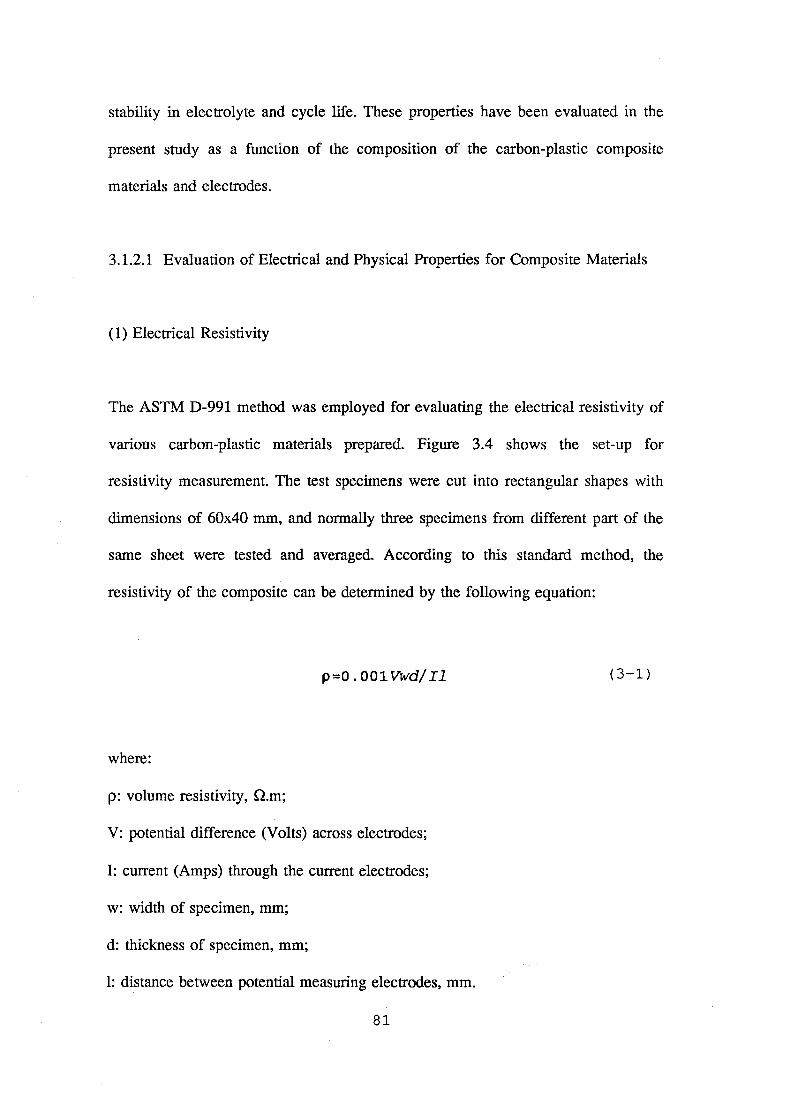
stability in electrolyte and cycle life. These properties have been evaluated in the
present study as a function of the composition of the carbon-plastic composite
materials and electrodes.
3.1.2.1 Evaluation of Electrical and Physical Properties for Composite Materials
(1) Electrical Resistivity
The ASTM D-991 method was employed for evaluating the electrical resistivity of
various carbon-plastic materials prepared. Figure 3.4 shows the set-up for
resistivity measurement. The test specimens were cut into rectangular shapes with
dimensions of 60x40 mm, and normally three specimens from different part of the
same sheet were tested and averaged. According to this standard method, the
resistivity of the composite can be determined by the following equation:
p=O. 001 Vwd/ Il
where:
p: volume resistivity, n.m;
V: potential difference (Volts) across electrodes;
I: current (Amps) through the current electrodes;
w: width of specimen, mm;
d: thickness of specimen, mm;
1: distance between potential measuring electrodes, mm.
81
( 3-1)
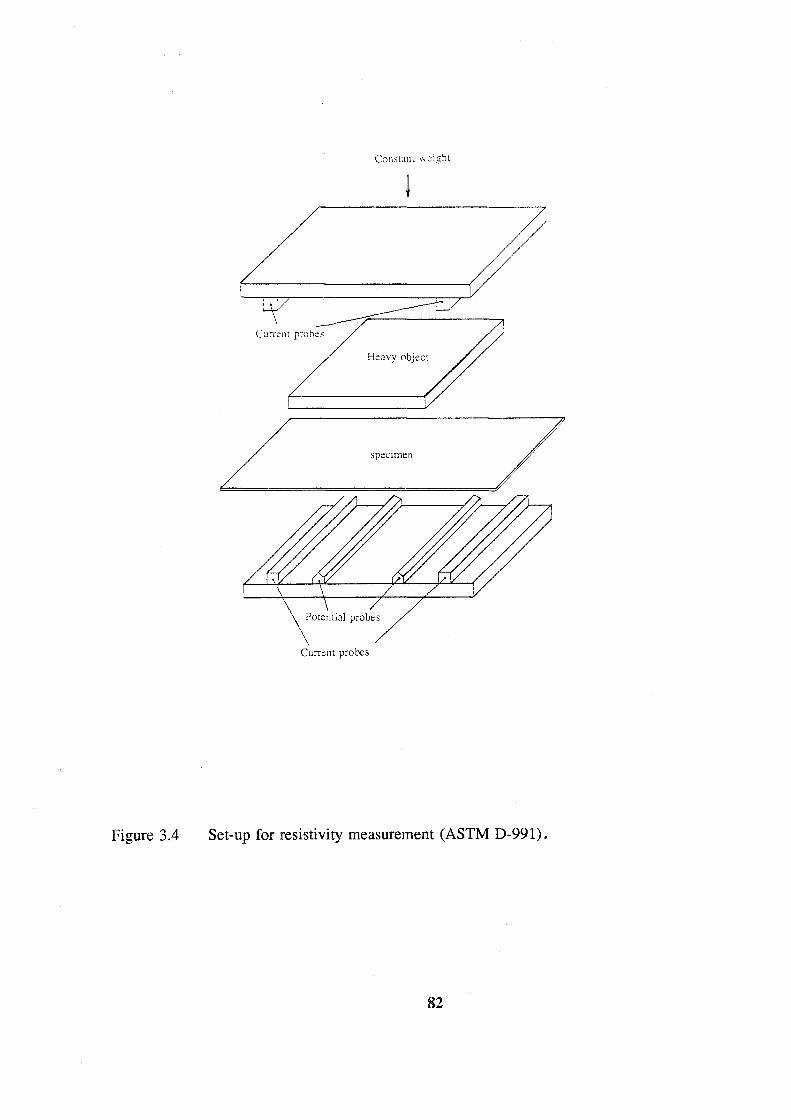
Constant "eight
Heavy object
Current probes
Figure 3.4 Set-up for resistivity measurement (ASTM D-991).
82

(2) Mechanical Properties
The mechanical properties of the composite materials were characterised by the
values of tensile strength at break and percentage elongation at break and were
determined by ASTM D 638 method. The tests were performed on an Instron M
1115 Universal Testing machine within the Polymer Science Department at
UNSW. Again, at least three specimens were cut from different parts of the same
composite sheet using a 4 em standard specimen puncher. The specimens were
then tested with an intergrip distance of 2 em and a cross head speed of 0.1
em/min and an accompanying chart speed of 5 em/min. The low cross head speed
was selected since the highly loaded carbon-plastic composites is very brittle. The
tensile strength of the specimens can be therefore determined by the following
equations:
(3-2)
where cru is tensile strength at break with units of N/mm2, W is the load at break,
in Newtons, and A0 is the original cross-section area in mm2•
%El =IlL/ L 0x100 (3-3)
(3-4)
where %EL is the elongation at break, Lll.. = L-L0, the difference in the length of
83
the specimen at break and at origin; Sx-head• the speed of the cross head, em/min;
schart• the chart paper speed, em/min, and d, the distance of chart travelled, em.
(3) Permeability
To evaluate the permeation rate of the material, a small round cell fitted with
solution pumping system was employed, the sheet being used as a separator
between the two electrolyte compartments. The thickness of the composite sheet
employed was 0.35 mm (half the thickness of those used for electrode fabrication).
On one side was 2M V(IV) in 3M H2S04 solution(the positive electrolyte of
vanadium battery) and on the other side was distilled water(see Figure 3.5). Both
solutions were pumped for 15 days, and 5 ml of sample was withdrawn from the
water side periodically. The concentration of vanadium and sulphur(as SOt) in
the blank solution was determined using Inductively Coupled Plasma (ICP)
analysis.
3.1.2.2 Evaluation of Electrical and Electrochemical Properties of
Composite Electrodes
(1) Electrical Resistance Determination for composite electrodes
To determine the electrical resistance of the carbon-plastic/graphite-felt composite
electrodes, the four-probe method was employed. Figure 3.6(a) illustrates the
principle of the testing.
84
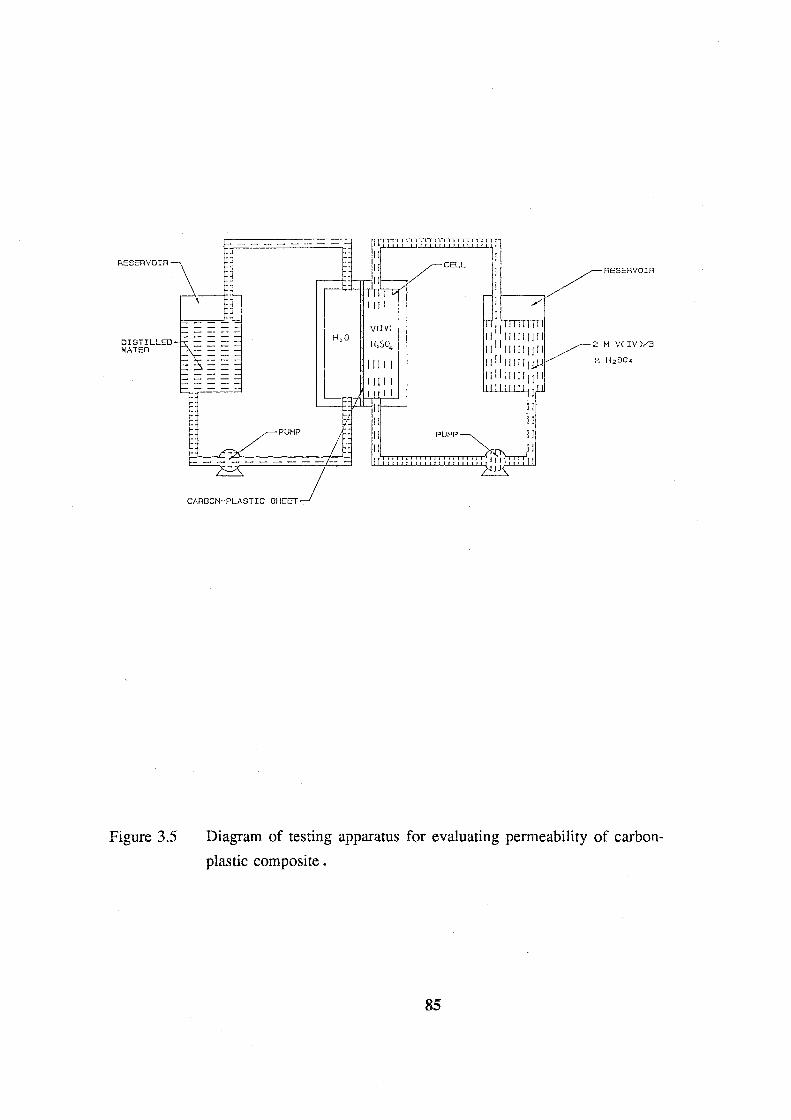
RESERVOIR
DISTILLED WATER
Figure 3.5
CARBON-PLASTIC SHEET
2 ~1 V( IV )/3
11 H 2 so ..
Diagram of testing apparatus for evaluating permeability of carbon
plastic composite .
85

The resistance of end-electrode is determined by measuring the current-voltage
curves and then working out the slope of the I-V curve by the linear regression
method. For the end-electrodes, two end-electrodes are laid tete-a-tete and set
between two copper plates. These copper plates are compressed with a pressure of
50 g/cm2• A series DC current is then applied to the testing electrodes through the
copper plates. Potential drop values are obtained by a multimeter which is
connected to the other two corners of the copper plates. Plotting the potential drop
in Volts versus the current density in A.cm-2 and working out the value of the
slope, the resistance of two end-electrodes can be determined with units of Q.cm2•
The resistance of an individual end-electrode is taken as half of the value
determined above.
The resistance of a bipolar electrode can also be determined by the same method.
However, only one bipolar electrode is needed and is also set between two copper
plates (see Figure 3.6(b)).
(2) Evaluation of Electrochemical Properties
i) Test Cell Construction
In contrast to electrical resistance testing of the electrodes which does not involve
any electrochemical reaction, the electrochemical properties of the electrodes are
measured using a complete vanadium redox flow cell.
86

Figure 3.6
DC current
DC current
constant pressure
50 g/cm2
(a)
constant pressure
50 g/cm2
(b)
copper plate
copper plate
Four-probe method for measuring the resistance of carbon-plastic
composite electrode, (a) for end-electrode; (b) for bipolar .
87
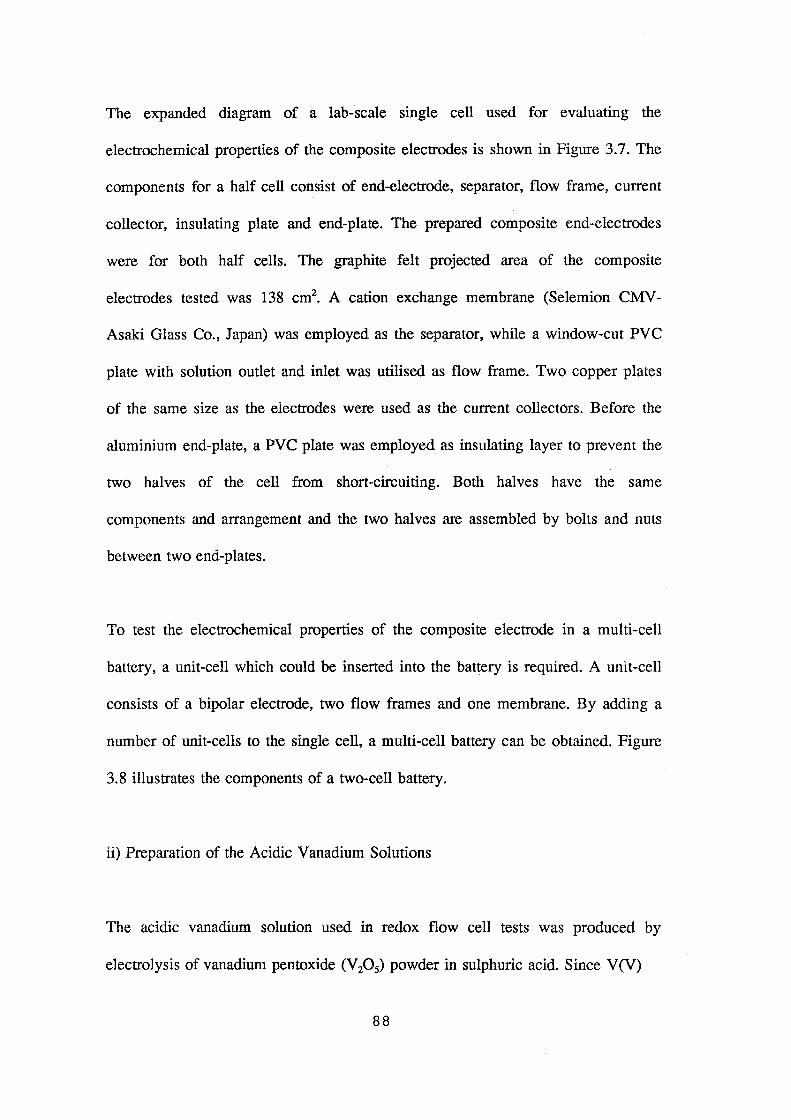
The expanded diagram of a lab-scale single cell used for evaluating the
electrochemical properties of the composite electrodes is shown in Figure 3.7. The
components for a half cell consist of end-electrode, separator, flow frame, current
collector, insulating plate and end-plate. The prepared composite end-electrodes
were for both half cells. The graphite felt projected area of the composite
electrodes tested was 138 cm2• A cation exchange membrane (Selemion CMV
Asaki Glass Co., Japan) was employed as the separator, while a window-cut PVC
plate with solution outlet and inlet was utilised as flow frame. Two copper plates
of the same size as the electrodes were used as the current collectors. Before the
aluminium end-plate, a PVC plate was employed as insulating layer to prevent the
two halves of the cell from short-circuiting. Both halves have the same
components and arrangement and the two halves are assembled by bolts and nuts
between two end-plates.
To test the electrochemical properties of the composite electrode in a multi-cell
battery, a unit-cell which could be inserted into the battery is required. A unit-cell
consists of a bipolar electrode, two flow frames and one membrane. By adding a
number of unit-cells to the single cell, a multi-cell battery can be obtained. Figure
3.8 illustrates the components of a two-cell battery.
ii) Preparation of the Acidic Vanadium Solutions
The acidic vanadium solution used in redox flow cell tests was produced by
electrolysis of vanadium pentoxide (V20 5) powder in sulphuric acid. Since V(V)
88

Figure 3.7 Expanded diagram of a single-cell vanadium redox flow battery.
89
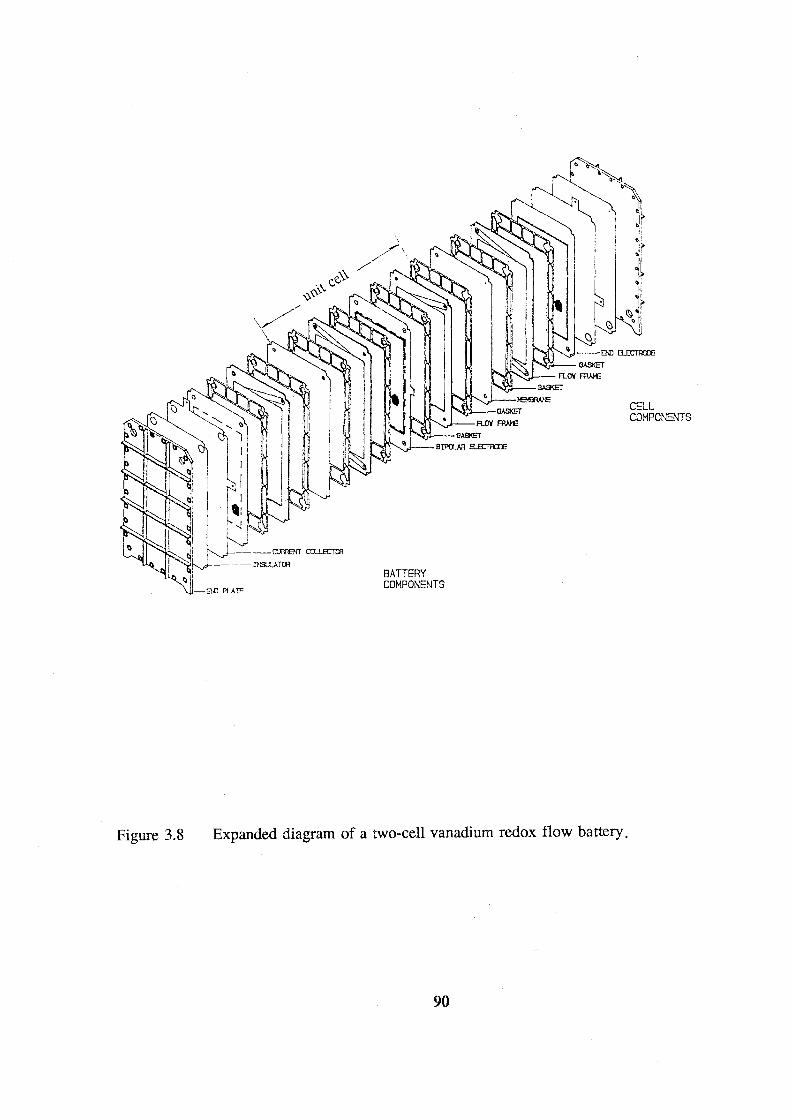
Figure 3.8
BATTERY COMPONENTS
Expanded diagram of a two-cell vanadium redox flow battery.
90
CELL COMPONENTS

can not be obtained directly from the insoluble V20 5 and as V(ll) and V(III)
sulphate are not commercially available, these also had to be specially prepared as
described below:
a) Preparation of 2M V3·5+/2.5 M H2S04 solution
Solution of composition 1 M V(III) + 1 M V(IV) sulphate (2 M V3·5+) in 2.5 M
H2S04 solution was obtained by electrolysis of 1 mole per litre vanadium
pentoxide suspension in 5 molar sulphuric acid. The electrolytic cell employed
was made of perspex, with two lead electrodes and a Selemion CMV membrane
which was used to separate the two half-cell compartments. The vanadium
pentoxide suspension was placed into the negative half-cell, and the positive half
cell was filled with the same H2S04 supporting electrolyte as that of the negative
half-cell. The cathodic electrolyte was agitated by bubbling nitrogen in order to
prevent V 20 5 solid from settling to the bottom of the cell. This also aided in the
mass transport of vanadium ions and vanadium pentoxide in the vicinity of the
cathodic surface where reduction occurs. A DC power supply and two multimeters
were employed. During the electrolysis process, the following reactions occur at
the cathode:
(3-5)
(3-6)
91

(3-7)
(3-8)
The V2+ ion obtained also reacts with V20 5 solid directly in the solution,
(3-9)
and with V02+ to form V3+. Assuming 100% current efficiency in the production
of V(III) and V(IV), the theoretical time required to form a 50:50 mole% mixture
was calculated for a current density of 20 mNcm2• After electrolysis was
completed at the theoretical time, 2M V35+/2.5 M H2S04 solution (i.e. isovolumic
mixture of V3+ and V02+ solution) was emptied into a measuring cylinder and
distilled water added to reach the original mark, making up for water loss during
electro! ysis.
b) Preparation of V(II), V(V), V2·5+ and V4·5+ sulphate solution
Equal volumes of 2 M V3.5+/2.5 M H2S04 solution were placed in each half-cell of
the vanadium redox flow cell and then a charging current applied. During
charging, the following reactions take place:
at the positive half cell:
92
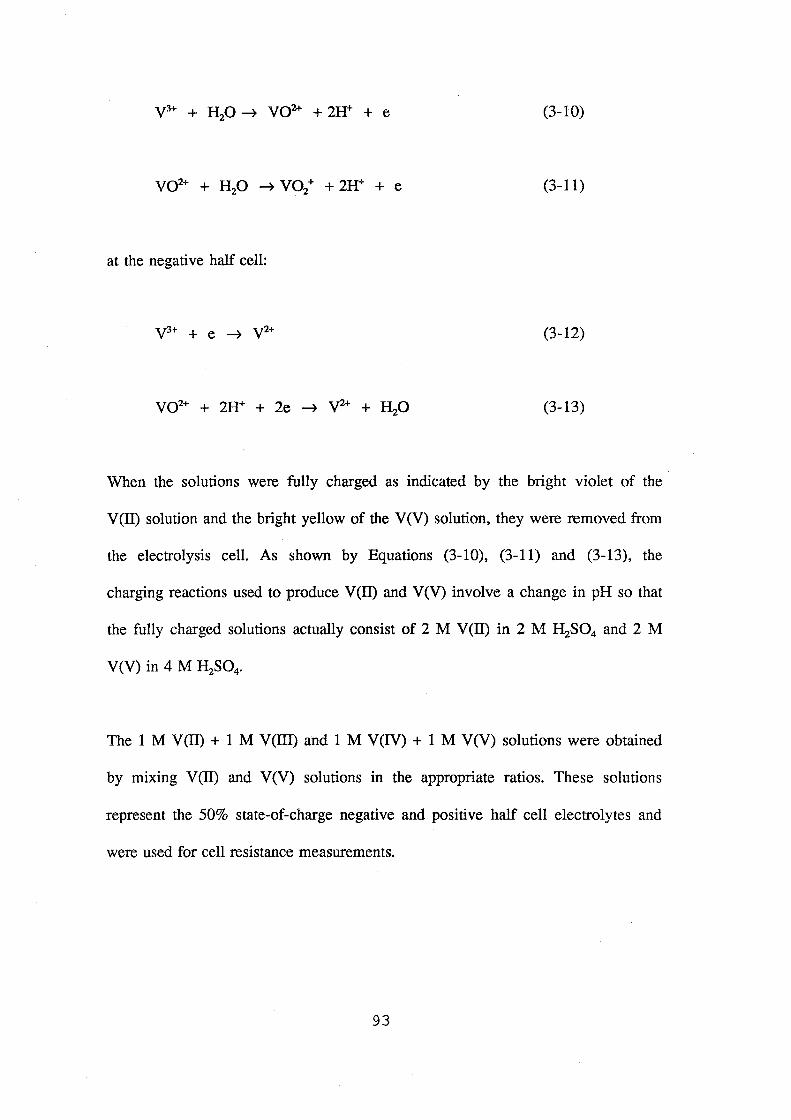
(3-10)
(3-11)
at the negative half cell:
(3-12)
(3-13)
When the solutions were fully charged as indicated by the bright violet of the
V(II) solution and the bright yellow of the V(V) solution, they were removed from
the electrolysis cell. As shown by Equations (3-10), (3-11) and (3-13), the
charging reactions used to produce V(II) and V(V) involve a change in pH so that
the fully charged solutions actually consist of 2 M V(ll) in 2 M H2S04 and 2 M
V(V) in 4 M H2S04•
The 1 M V(II) + 1 M V(ITI) and 1 M V(IV) + 1 M V(V) solutions were obtained
by mixing V(ll) and V(V) solutions in the appropriate ratios. These solutions
represent the 50% state-of-charge negative and positive half cell electrolytes and
were used for cell resistance measurements.
93

iii) Cell resistance measurement
Cell resistance is one of the basic parameters widely used for evaluating the
performance of an entire electrochemical cell. It is also used to study the
properties of individual cell components, such as electrodes, electrolytes and
separators. In the last section of Chapter II, the concept and determination of cell
resistance have been described. However, the details of testing are described as
follow:
A complete vanadium redox flow cell, a DC power supply, two multimeters, a
resistor of 0.1 n, two Iwaki MD-10 magnet pumps, two glass reservoirs with PVC
tubes connected to the cell and pumps were employed for the cell resistance tests.
This equipment was also used for evaluating the cell performance of the
composite electrodes. The electrolytes used in each half cell corresponded to 50%
state-of-charge (SOC) vanadium solutions, i.e. 1 M V(II) + 1 M V(III) in 2 M
H2S04 solution as the negative electrolyte, and 1 M V(N) + 1 M V(V) in 3.5 M
H2S04 solution as the positive electrolyte. The cell was charged for 1 minute at a
constant current density within the range from 5 to 40 mA.cm-2• After a 15
seconds rest interval, the cell was discharged for 1 minute at the same current
density as that used for charging. The above procedure was repeated at various
current densities to obtain plots of current versus voltage for the charge and
discharge cycle. From the slopes of these I-V plots, values of cell resistance could
be calculated for the charge and discharge processes at 50% SOC.
94
iv) Cell Performance Testing
In addition to the apparatus used for cell resistance tests, an Automatic Battery
Cycling Controller and a YOKOGA W A 3057 Portable Chart Recorder were
required for recording the cell charge/discharge behaviour (see Figure 2.10). The
cell charge and discharge cycles were controlled automatically and continuously
by the controller between set upper and lower cell voltage limits. The electrical
circuit used for the charge/discharge cycling is shown in Figure 3.9.
For single cell performance tests, two carbon-plastic composite end-electrodes
were needed, while in the case of a multi-cell battery, a number of bipolar
electrodes plus two end-electrodes were required. For example, in a two cell
multi-cell battery, two end-electrodes and one bipolar electrode are utilised.
Equal volumes of 2 M V3.5+/2.5 M H2S04 solution were used initially in each half
cell to generate the positive and negative fully charged electrolytes from an initial
charging cycle. It is necessary to balance the electrolytes in the initial cycle if the
electrolyte in both sides of the cell are not charged to 100% SOC at the same
time.
After balancing the solution and making sure non-leakage in the system is leak
proof, cell voltage, current and time for each charge/discharge cycle are recorded.
Cell efficiencies can be calculated from the recorded curves by using the equations
listed in Section 2.6.
95

DC power supply I I
~-- -+! --"-'-0----, I
automatic cycling controller
chart recorder
-\ \ :
;
\ i
flow cell
!+-Tl ' I I
L___ i ~~II
Figure 3.9 Electrical circuit used for charge-discharge cycling.
96
3.2 Experimental Procedures for Electrode Kinetics and Electrode
Activation Study
3.2.1 Electrode Kinetics Study
Cyclic voltammetry and rotating disc voltammetry were employed for studying the
electrode kinetics of V(V)N(IV) redox couple. The following apparatus was
utilised.
3.2.1.1 Electrodes
A graphite rod working electrode was employed for studying the electrode kinetics
of the V(V)N(IV) redox couple. A graphite rod of 3.5 mm in diameter (cross
sectional area = 0.096 cm2, CMG, Carbon Brush MFG Pty Ltd, Rosebery,
Australia) was cut 2.5 em long and then electrically connected to a stainless steel
rod by inserting the graphite rod into the same diameter hole drilled in one end of
the stainless steel rod. The graphite rod and lower part of the metal rod were
sealed in epoxy resin. After the resin cured, a machining process was applied to
obtained a graphite electrode for cyclic voltammetry and rotating disc
voltammetry. Figure 3.10 shows the construction of the graphite rod electrode.
The graphite rod electrode was polished with 600 grit (= P1200) silicon carbide
polishing paper, followed by 800 grit Flexboc polishing paper and 0.3 micron
alumina powder (Buehler Ltd, Lake Bluff, IL, USA) on a polishing cloth(LECO
97
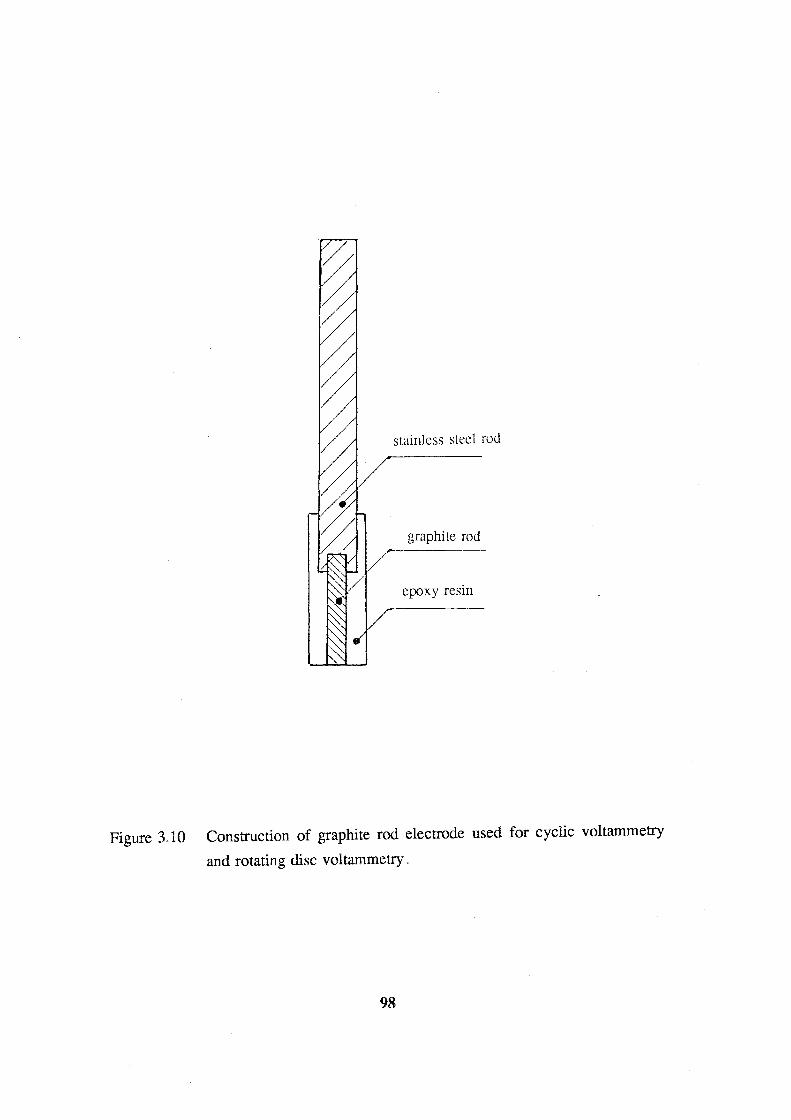
stainless steel rod
graphite rod
epoxy resin
Figure 3.10 Construction of graphite rod electrode used for cyclic voltammetry
and rotating disc voltammetry .
98

Corporation, Michigan, USA). The electrode was then rinsed thoroughly with
distilled water, followed by ultrasonification for 15 minutes using an Ultrasonic
cleaner (LECO Corporation, Michigan, USA).
In addition to the graphite rod electrode, graphite felt and Reticulated Vitreous
Carbon (RVC) electrodes were also employed for steady-state voltammetry
studies. These electrodes were prepared by heat-pressing a piece of graphite felt
and RVC onto one side of a conducting plastic sheet with copper foil backing on
the other side (see section 3.1.1). The geometric surface area for these electrodes
was 1 cm2• A wire was soldered onto the copper foil for electrical contact. The
back including the soldered area of these electrodes was sealed by PVC glue
painting to prevent copper from being attacked by the solution.
A pure platinum wire was used as counter electrode, while a type K -601 (with
saturated K2S04 solution) Hg/Hg2S04 electrode (Radio Meter Co.) was employed
as reference electrode.
3.2.1.2 Electrolyte and Electrochemical Cell
Two kinds of electrolytes were employed. The frrst one was VOSOiMerck, BDH
Chemical Australia Pty Ltd) of various concentrations in 3 M H2S04• The second
electrolyte was a 50:50 mixture of V(IV) and V(V) corresponding to a 50% state
of charge (SOC) positive vanadium redox cell solution. The latter was prepared by
mixing equal volumes of V(N) solution (0% SOC) with V(V) solution (100%
99

SOC, which had been prepared by fully charging the V(IV) solution to V(V) in
the positive half-cell of a vanadium redox cell).
The electrolysis cell used for this study is shown in Figure 3.11.
3.2.1.3 Electrochemical equipment
The cathodic and anodic linear sweep voltammograms and the cyclic voltammo
grams were obtained with a Pine RD3 potentiostat(Pine Instrument Co., Grove
City, Pennsylvania, USA) and a model-D Riken Denshi X-Y recorder. The elec
trode rotation speed was controlled by a MSR speed controller(Pine Instrument
Co.) combined with a Type 0824-16 Bi-Mode Torque Unit(Servo-Tek Production
Co., Hawthorn, N.J., USA). All potentials were measured against a Hg/Hg2S04
reference electrode and are reported with respect to the Hg/Hg2S04 reference in
this study. Cathodic or anodic linear sweep voltammograms were always started
from the static potential and the cathodic voltammogram was obtained before the
anodic one. In the case of cyclic voltammetry, the initial scan direction was
always positive.
100

6 em
N 2
electrolyte
working electrode
Tenon cover
\,
7 em
reference electrode
counter electrode /
1
,/
(Pt wire)
I I
I ..;
I I L. -i
2em
Figure 3.11 Electrochemical cell for cyclic voltammetry and rotating disc
voltammetry .
101

3.2.2 Surface Chemical Treatment of Carbon-Plastic Composite Materials
3.2.2.1 Preparation of Carbon-plastic Composite Materials for Chemical
Treatment
In order to eliminate the use of the graphite felt layer on the composite, direct
chemical treatment of the carbon-plastic composite surface was conducted.
Considering that a highly conductive surface is always required for an electrode
material, two specific composite materials with higher loading of conducting
fillers were prepared. Low density polyethylene (LDPE) was employed because of
its ease of processing for a high filler loading. The preparation procedure was the
same as that described in Section 3.1.1.3, however, the processing temperature
was 140 °C. The composition and resistivity of the two composites (named
PE2525 and PE75 respectively) are listed in Table 3.1.
Table 3.1 Composition and Resistivity of Composite PE used in Chemical
Treatment Studies (CB =carbon black, GF =graphite fibre)
samples composition(%) Resistivity (O.cm)
PE2525 LDPE 50
C.B. 25 0.13
G.F. 25
PE75 LDPE 25
G.F. 75 0.17
102
3.2.2.2 Preparation of Carbon-plastic Composite Electrodes for Chemical
Treatment and Cyclic Voltammetry
Small rectangular (7xl.6x10 mm) specimens were cut from each of the composites
PE2525 and PE75 in Table 3.1, firmly contacted to a graphite rod, and then sealed
in a glass tube with epoxy resin. The surface area of the prepared electrodes was
0.11 cm2• Two kinds of electrodes were prepared for each composite, one
designated the "s" electrode and the other called the "e" electrode. For the "s"
electrode the surface exposed to the electrolyte is the as-prepared surface of the
composite, while for the "e" electrode, the cross section of the composite is
exposed to the solution (see Figure 3.12). For comparison, a graphite plate
electrode with the same surface area was fabricated in the same way.
For the purpose of simulating the electrode working conditions during battery
operation, a small electrode was also fabricated for the cyclic voltametric tests as
follows. A piece of graphite felt with a diameter of 1 em and a piece of copper
mesh of the same size were heat-pressed onto either side of the composite
polyethylene sheet; the felt side was used as the working surface and the copper
mesh as the current collector. The copper mesh side with electrical connection was
then sealed with epoxy resin. The electrode projected surface area was 0.785 cm2•
103
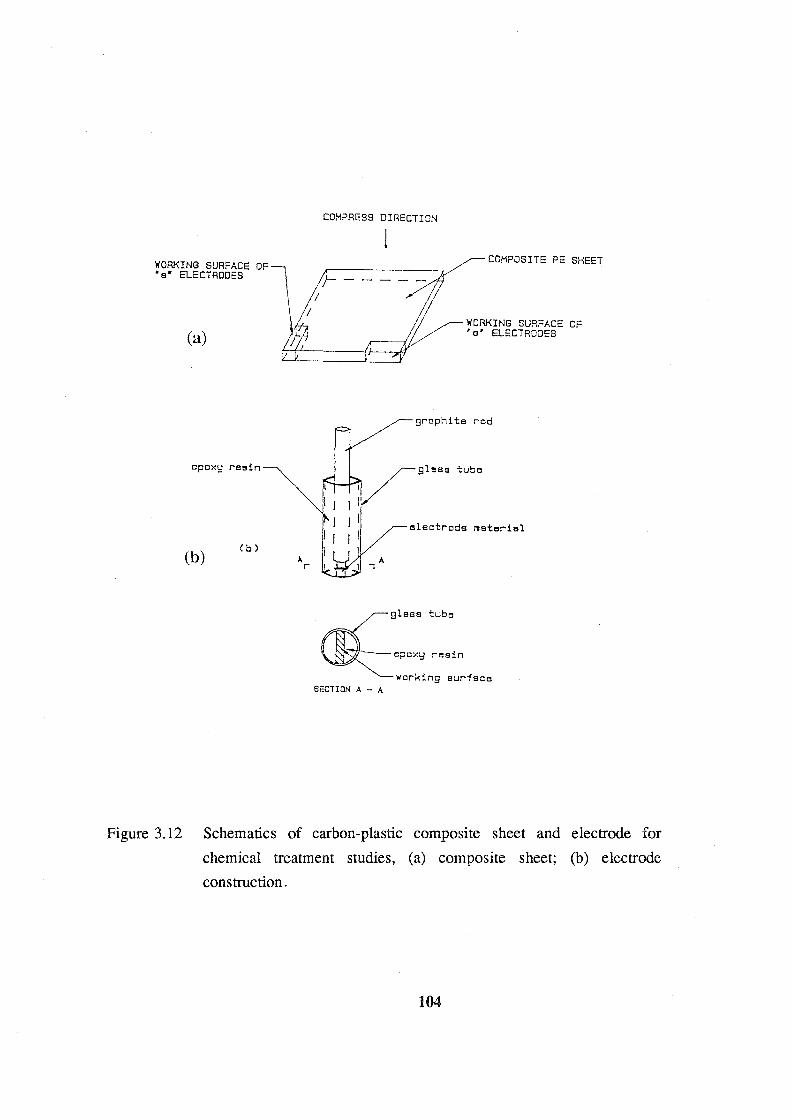
WORKING SURFACE OF •a• ELECTRODES
(a)
epoxy resin
(b) (b)
COI-1PRESS DIRECTION
COMPOSITE PE SHEET
WORKING SURFACE OF 'e' ELECTRODES
graphite rod
glees tube
electrode ~eteriel
~glass tube
~epoxy resin
working surface SECTION A -A
Figure 3.12 Schematics of carbon-plastic composite sheet and electrode for
chemical treatment studies, (a) composite sheet; (b) electrode
construction.
104
3.2.2.3 Procedure for Surface Chemical Treatment of Conducting Plastic
The chemical treatment solution employed had the following composition:
H2S04 (97%) A.R.
K2Cr20 7 A.R.
H20
800 g/1
30 g/1
The prepared electrodes were immersed into the solution for various times and at
various temperatures.
3.2.2.4 Evaluation of Surface Treatment of Conducting Plastic
The effectiveness of surface treatment was evaluated using cyclic voltammetry and
scanning electron microscopy (SEM).
The prepared electrodes were placed into the electrolyte [(1 M V3+ + 1 M
V02+)/(3M H2S04)] together with a SCE reference electrode and a graphite
plate(3x4 em) counter electrode. A PAR 174 potentiostat/galvanostat and its
associated equipment were employed for the cyclic voltammetric experiments.
The treated surfaces of the carbon-plastic composite materials were also examined
under the scanning electron microscope.
105

3.3 Graphite Felts Studies
3.3.1 Felt Materials
The following felts samples were employed for this study:
FMI: 3 mm in thickness, FMI graphite felt (Fibre Materials, Inc., Maine, USA)
GFD 2: 2.5 mm in thickness, Sigri Electrographit GMBH, Germany
GFA 2: 3.0 mm in thickness, same as above
RVG 1000: 2.0 mm in thickness, Le Carbone-Lorraine Australia Pty. Ltd.
Toray: 6 mm in thickness, Toray Industries, Inc., Tokyo, Japan.
3.3.2 Physical Property Measurements
(1) Electrical Conductivity
The electrical conductivity of different felt samples was tested with ASTM D-991
method which was described in Section 3.1.2.1.
(2) Surface Area and Pore Size
The mercury intrusion method was employed to measure the pore size and surface
area of the different felts. An AutoPoro-9200 instrument (Micromeritics, USA)
was employed, and the results were analysed and printed out by the computer
106
system (Malvern Instruments, England).
3.3.3 Evaluation of Electrochemical Properties
The cyclic voltammetry method was employed to evaluate the electrochemical
activity of different felts. The apparatus used are the same with those described in
Section 3.2.1.3.
3.3.3.1 Preparation of Carbon-Plastic Composite Electrodes for Cyclic
Voltammetry
The felt samples were punched with a 6 mm diameter puncher and then hot
pressed to the SEBS modified carbon-HDPE composite sheet which had a copper
mesh backing to complete the fabrication of a small graphite felt composite·
electrode. To prevent the felt from being crushed during pressing, a metal plate
with holes of 6 mm diameter, was employed during the felt-bonding procedure. A
release film with holes of the same diameter was also used between the metal
plate and the composite sheet to prevent them from sticking together. After hot
bonding the felt samples onto the carbon-plastic composite sheets, a 12 mm
diameter puncher was employed to punch out the entire small composite electrode,
i.e. a 6 mm diameter felt layer with a 12 mm diameter carbon-plastic matrix plate.
The extra 3 mm around the edge was required for placing an '0' ring to stop
solution leakage to the metal current collector.
107
3.3.3.2 Design of the Felt-Electrode Support
The small carbon-plastic composite electrode was then placed into a specially
designed electrode support which is described in Figure 3.12. The electrode
support consisted of a current collector, pressing tube, housing tube and '0' ring.
The current collector was a copper rod with copper plate in the bottom to make
electrical contact to the felt electrode when the pressing tube was screwed in. The
housing tube and the '0' ring combined with the pressing tube to enable the felt
part of the electrode to be exposed to the electrolyte while preventing the
electrolyte from getting into the housing tube through the composite sheet. This
special design of the electrode support made the replacement of the felt electrode
very easy and convenient.
3.3.3.3 Measurement Conditions
The felt electrode placed in the electrode support was then used as a working
electrode. A platinum wire was employed as counter electrode and a Hg/HgS04
was used as reference electrode. The sweep was started from the electrode's static
potential and the initial direction was always positive. The sweep rate employed
was 60 mV/sec and the testing was carried out in a solution of 0.05 M V(ID) +
0.05 M V(IV) in 3M H2S04•
108
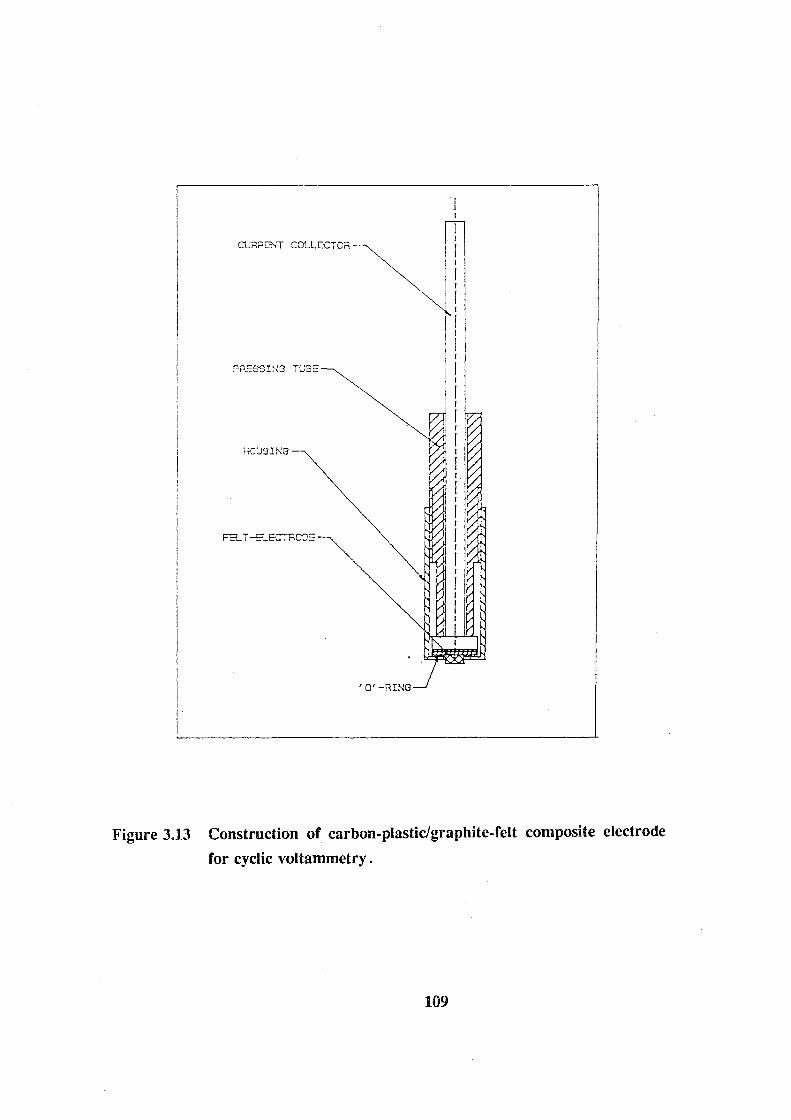
HDU9!~~G
Figure 3.13 Construction of carbon-plastic/graphite-felt composite electrode
for cyclic voltammetry .
109

3.3.4 Oxidation of Felt Samples and Surface Analysis
To compare the oxidation sensitivity and stability, FMI and GFD graphite felts,
which are currently used as electrodes in the vanadium redox battery, were
oxidised under various conditions and then analysed by Scanning Electron
Microscopy (SEM) and X-ray photoelectron spectroscopy (XPS).
The SEM analysis was conducted with a S 360 Scanning Electron Microscope unit
set in University of New South Wales (manufactured by Laica Cambridge Ltd.,
England), while XPS measurement was carried out by Dr. Celestino Padeste using
a X-ray Photoelectron Spectroscope at the Surface Analysis Centre, School of
Chemistry, UNSW. Details are as follows:
The XPS spectra were recorded on a KRA TOS XSAM 800 spectrometer equipped
with a hemispherical analyser. Mg Ka. radiation was used at a maximum power of
180 Watt. The base pressure in the analyser chamber was less 10-9 torr from each
sample a piece of about 4x2x10 mm was cut and mounted on a stainless steel
sample holder overlapping the edge of the holder in a way that the sample could
be measured without significant intensity from the steel holder. The analyser was
run in the fixed transmission mode at pass energy 80 e V /1 e V step size for wide
scan spectra and pass energy 40 eV/0.1 eV step size for high resolution spectra of
the Cls and 01s regions. Typical acquisition times were about 5 minutes for wide
scans, and 7-10 minutes for the region spectra. The spectrometer was calibrated on
the Cu 2p312 line (932.7 eV) and the Ag 3d512 line (386.2 eV). Instrument control
110

as well as data collection and processing were performed using KRATOS DS800
software on a PDP 11 computer.
3.3.4.1 Air-oxidation
Both FMI and GFD graphite felt samples were cut into strips with a dimensions of
5x2 em. The samples were placed in a furnace and heated up to 400 °C. After
exposure to air at this temperature for 30 hours, the samples were taken out from
the furnace, cooled down and stored in glass sample tubes for surface analysis.
For comparison, another two samples were treated with nitrogen gas at the same
temperature and time period.
3.3.4.2 Electrochemical Oxidation
FMI and GFD felt electrodes were fabricated with the method described in Section
3.3.3.1 and then placed in the electrode support (see Section 3.3.3.2). Using the
electrochemical equipment and electrolysis cell shown in Section 3.2.1.3, the two
felt electrodes were held at + 1.5 V versus Hg/Hg2S04 reference electrode for 15
minutes respectively. Cyclic voltammetry was used to evaluate the effect of
anodic-oxidation on the electrochemical activity of the felt electrodes for the
vanadium redox reactions.
111

3.3.4.3 Oxidation in Positive Half-Cell of the Vanadium Redox Flow Battery
In the positive half-cell of the vanadium redox battery, during charging at
relatively high SOC, and after the reaction of V(IV) ~ V(V) is completed, oxygen
evolution can occur if the charging current is still applied to the battery. The
generated oxygen might attack the felt electrode and result in degradation of the
electrode. An experiment was thus conducted to compare the oxidation stability of
the FMI and GFD felts under normal and overcharging cell operating conditions.
Two pairs of FMI and GFD felt end-electrodes were fabricated with the procedure
described in Section 3.1.1.3. The felt projected area was 138 cm2• The electrodes
were tested in a single cell battery. A charging/discharging current of 3 amperes
was applied to the cell, and retained for 50 minutes after the electrolytes in both
halves were fully charged. The positive electrode was then removed from the cell,
washed thoroughly with tap water, and then immersed in distilled water over
night. After draining the water from the felts, the cleaned electrode was dried in
an oven at 60 °C for 8 hours. Felt samples were taken from these electrodes and
analysed with X-ray photoelectron spectroscopy (XPS). For comparison, FMI and
GFD felt samples were also taken from positive electrodes operated in the
vanadium redox battery under normal charging/discharging conditions, i.e. in the
potential range where the vanadium redox reactions are predominant. After
handling in the same way, these samples were also analysed with XPS.
112

3.3.5 Felt Activation Treatment and Evaluation
3.3.5.1 Activation Treatments
The GFD 2 graphite felt was used for the activation treatments. The treatments
included thermal treatment and electrocatalysts. For the thermal treatment, the felt
sample was simply placed in the furnace at a temperature of 400 °C for 30 hrs.
For the electrocatalysis treatment, the felt samples were firstly treated under the
same conditions as the thermal treatment and then placed into solutions containing
the catalyst ions to be investigated. Three kinds of solutions were prepared for this
study: 0.1 M NiS04, 0.1 M MnS04 and 0.1 M AgN03• After the felt was saturated
with the catalyst solution, it was placed in the furnace and dried at 100 °C for 48
hrs. The amount of loaded catalyst was determined by a Mettler AK 160
electronic balance (Cyrulla's Instruments).
3.3.5.2 Evaluations
Using the procedure described in Section 3.3.3.1, the treated felt samples were
hot-bonded to form the small felt electrodes. The effect of the activation
treatments on the electroactivity of the felt electrodes were evaluated by cyclic
voltammetry described in Sections 3.3.3.2 and 3.3.3.3.
The successfully treated felt samples were also evaluated in a vanadium redox
flow cell. Because of the limitations imposed by the felt samples, the tests were
113

carried out with a small-scale test cell (see Figure 3.14) which had a modified
NASA cavity fill-in cell structure [28]. Cell resistance, polarisation behaviour and
long-term stability tests were conducted.
114

P.V.C. plate membrane Eraphitc plate
copper rod
neoprene rubber gasket
Figure 3.14 Modified NASA cavity fill-in single cell used as test cell for
activated felt electrode for the vanadium redox flow system.
115
CHAPTER IV
FABRICATION AND EVALUATION OF CARBON-PLASTIC COMPOSITE
MATERIALS AS ELECTRODE MATRIX LAYERS
As discussed in the previous · sections, carbon-plastic composites are promising
electrode materials for a large number of industrial electrochemical applications
since they offer a low cost, low weight alternative to the commonly used graphite
or carbon electrodes and can also be easily moulded into any shape and size.
Japanese made carbon-plastic composite electrodes (Toray industries) have been
successfully used in the vanadium redox flow battery, and energy efficiencies of
up to 90% have been achieved with these electrodes in 1 kW (normal batteries)
[44,45]. Unfortunately, some disadvantages, such as mechanical brittleness,
solution permeability (particularly for the end-electrodes) and high cost, were
noted in recent studies.
In order to scale-up the vanadium redox flow battery for commercialisation, an
electrode material with better long-term cell performance and lower cost is
desirable. The objective of the present study is to develop formulations and
processes to give such a product. Because of its chemical stability and cost
effectiveness, polyolefin thermo-plastics were employed as the basic materials for
the composites. In particular, low density polyethylene (LDPE) was used for the
initial study because of its cost and processing effectiveness, while high density
polyethylene (HDPE) was utilised for the more intensive investigation, since
116
further requirements in mechanical properties such as toughness and rigidness are
desirable for the materials to be used as electrodes.
The important properties governing the use of materials as electrode matrix layers,
were described earlier, but include: conductivity, mechanical integrity,
permeability, electrochemical activity and stability during cell operation. These
properties have been evaluated in this chapter as a function of the composition of
the carbon-plastic composites. However, for the low density polyethylene (LDPE)
based composites, the study was limited to the effect of formulation on the
electrical properties, while for the high density polyethylene (HDPE) based
composites, the study focussed on the cell performance characteristics of the
composites as the matrix layer of the composite electrodes in the vanadium redox
cell.
4.1 LOW DENSITY POLYETHYLENE BASED CARBON-PLASTIC
COMPOSITE
4.1.1 Electrical Conductivity of Composites
According to the electrical conduction theory of two-phase systems[84-88], the
conductivity of a composite is dependent greatly on the content, the type and the
shape of the conducting fillers. Because of its chemical inertness, carbon and
graphite products were employed as conducting fillers. There are a great deal of
commercially available carbon and graphite products. As the common types used
117
in composite plastic manufacture, carbon powders, graphite powder and chopped
graphite fibre were utilised for the initial studies.
4.1.1.1 The Effect of Content and Type of Carbon Fillers
Figure 4.1 and Table 4.1 show the electrical resistivity behaviour of three carbon
materials used in the same proportion in the conducting composite mixture. From
the Figure and the Table, it is clear that for each composite, the resistivity
decreases with an increase in the carbon content, indicating that the average
electrical contact area of the filler particles increases when the total amount of
filler increases[84,85]. However, the dependence of resistivity on the carbon
contents for each composite is different. For the composites with graphite powder
filler (GP), the resistivity decreases only slightly with carbon content up to 20%,
while for the composite containing carbon black (CB, Black Pearl 2000), it is seen
to have a less marked dependence on filler. A dramatic decrease in resistivity (7
orders of magnitude) when the graphite fibre (GF) content was increased from
10% to 20% is observed, however. It is believed that an electrical network for the
passage of current through the composite is formed when the content reaches a
certain value. In order to prove this, samples with different graphite fibre content
were examined under the optical microscope. The samples were prepared as thin
sheets (0.3 mm in thickness) with the procedure described in section 3.1.1.3 and
examined with an Vanox Olympus Universal Research microscope (Olympus
Optical Co. Ltd., Tokyo, Japan), the relevant photos were being taken with the
attached camera.
118

15
o GP b. GF o CB
.--. 12 ~ '""' E 0 .
~~ E ...c 0 9 0 '-'
::J) 4-'
> 4-' B en ·-en ID L ...__.
0) 3 0 a_________o .&
0 0 5 10 15 20 25
content (7.)
Figure 4.1 Effect of carbon content on resistivity of carbon-LDPE composite.
119

Figure 4.2 shows the microstructure of the composites. It can be seen from the
photos that the contact between fibres become more sufficient when the fibre
content increases, especially, for the composite containing 20 % graphite fibres.
Comparing the resistivity values of the three composites at the same loading, the
use of graphite powder gives rise to a less conductive composite than the other
materials. Within the content range studied (5% to 20%), the composite with
carbon black (black pearl 2000) shows the best electrical conductivity. This might
be due to the high surface area of black pearl which results in high value of
average contact numbers inside the composite[85]. However, at a content of 20%,
the conductivity of composite with chopped graphite fibre is close to that achieved
with carbon black. Based on this experimental result, carbon black and chopped
graphite fibre were considered as conducting fillers for the further studies.
Table 4.1 Resistivity comparison of carbon-LDPE composites
Content Materials Resistivity
(%) (O.cm)
graphite powder > 1012
5% graphite fibre 1 X 10¹⁰
carbon black (Black Pearl) 3.13 X 10²
graphite powder 3.3 X 10¹⁰
10% graphite fibre 2.4 X 10⁸
carbon black (Black Pearl) 3.26 X 10
graphite powder 3.3 X 10⁹
20% graphite fibre 4.9
carbon black (Black Pearl) 8.2
120
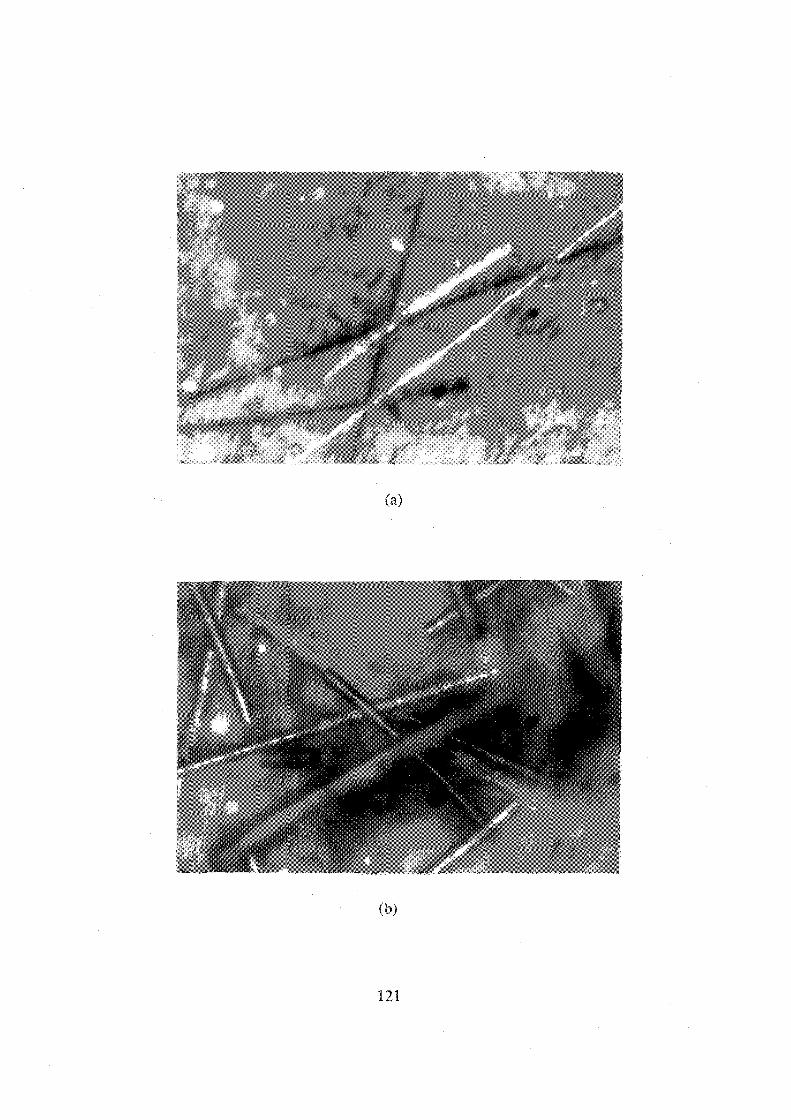
(a)
(b)
121
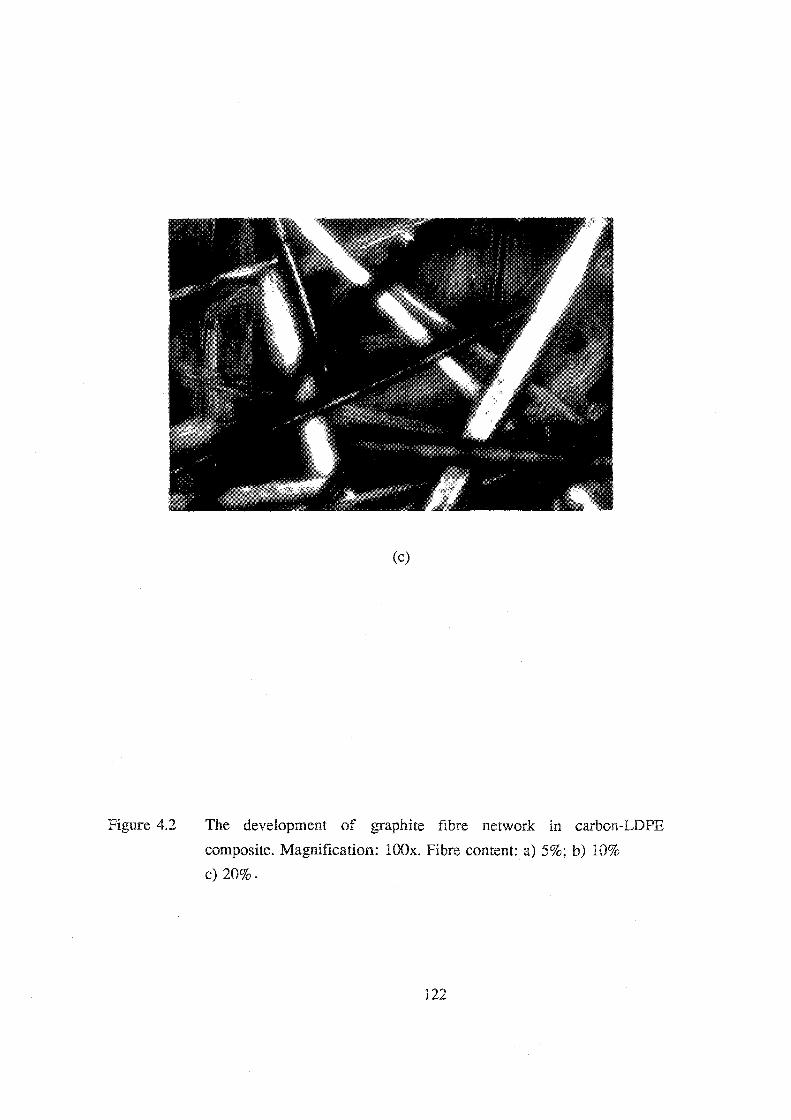
Figure 4.2
(c)
The development of graphite fibre network in carbon-LDPE
composite. Magnification: lOOx. Fibre content: a) 5%; b) 10%
c) 20%.
122
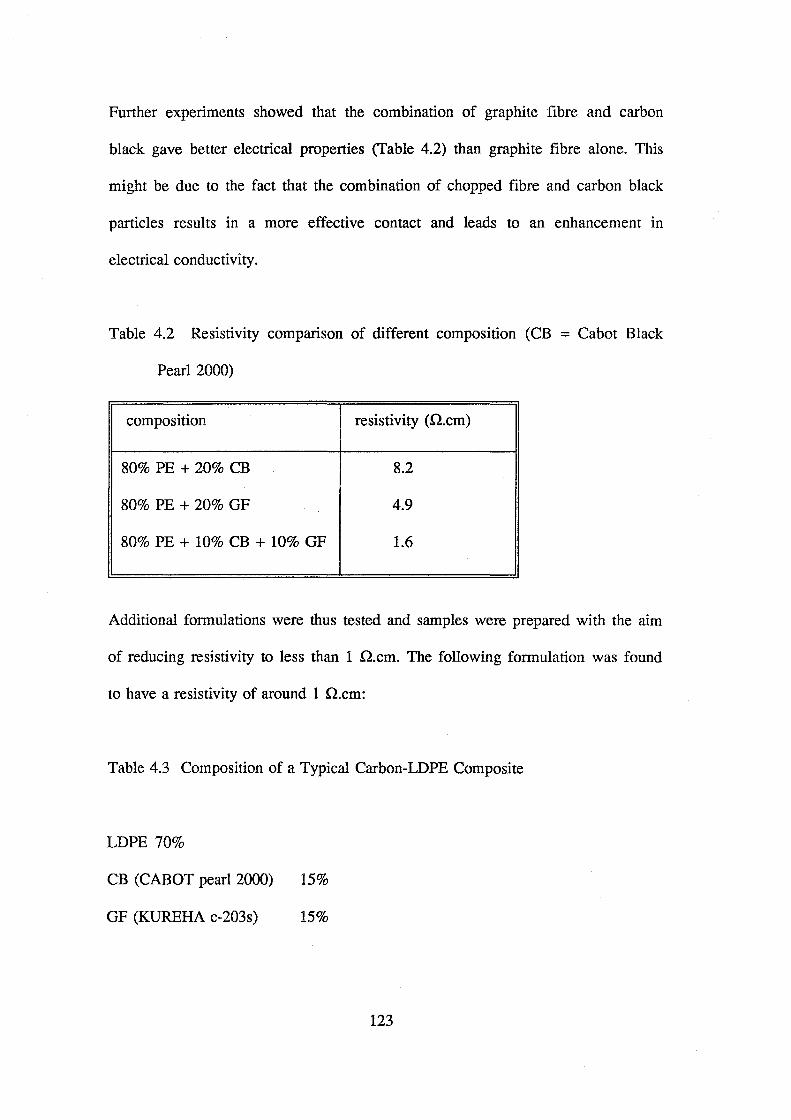
Further experiments showed that the combination of graphite fibre and carbon
black gave better electrical properties (Table 4.2) than graphite fibre alone. This
might be due to the fact that the combination of chopped fibre and carbon black
particles results in a more effective contact and leads to an enhancement in
electrical conductivity.
Table 4.2 Resistivity comparison of different composition (CB = Cabot Black
Pearl 2000)
composition resistivity (Q.cm)
80% PE + 20% CB 8.2
80% PE + 20% GF 4.9
80% PE + 10% CB + 10% GF 1.6
Additional formulations were thus tested and samples were prepared with the aim
of reducing resistivity to less than 1 Q.cm. The following formulation was found
to have a resistivity of around 1 Q.cm:
Table 4.3 Composition of a Typical Carbon-LDPE Composite
LDPE 70%
CB (CABOT pearl 2000) 15%
GF (KUREHA c-203s) 15%
123
4.1.1.2 The Effect of Processing on Resistivity
As an electrode matrix layer, the electrical homogeneity throughout the composite
sheet is considered as one of the most important characteristics. The combination
of graphite fibre and carbon black as conducting fillers for carbon-plastic
composites gave rise to a better electrical conductivity, it also, however, might
cause an electrical non-homogeneity, since it affects the mixing and moulding
process during preparation. It is therefore necessary to evaluate the effect of
processing conditions, in particular the internal blending time, on the electrical
homogeneity of the carbon-LDPE composites.
Since the melting point of the selected LDPE is 114 °C, and the viscosity of the
highly loaded carbon-plastic mixture at Tm is very high, the interal mixing and
moulding temperature was set at 150 °C to ease the processing. The composition
used in this experiment is shown in Table 4.3. Keeping the other processing
conditions constant (see section 3.1.1.3), the samples were blended at a blade
speed of 50 rpm for various time periods and then moulded into thin sheets with
dimensions 150 x 150 mm. Three specimens sized 60 x 40 mm were cut from
different parts of each sheet and measured with the ASTM D-991 method.
Table 4.4 shows the experimental results. Column p gives the resistivity value of
each specimen corresponded to blending times of 5, 10, 20 and 40 minutes. The
last column of the Table shows the maximum and the relative deviation values of
the specimens. This is also illustrated in Figure 4.3.
124

0.7
0.6 o experimental 1+< average
0
r-.. n o.5 . E 0 ..c 0 .._., 0.4 . ::D 0 .....,
·;: 0.3 0 0 0
-j-1
en ~ 0.2 L
0.1
0.0 0 10 20 30 40 50
blending time. tcmin)
Figure 4.3 Effect of blending time on data scattering .
125
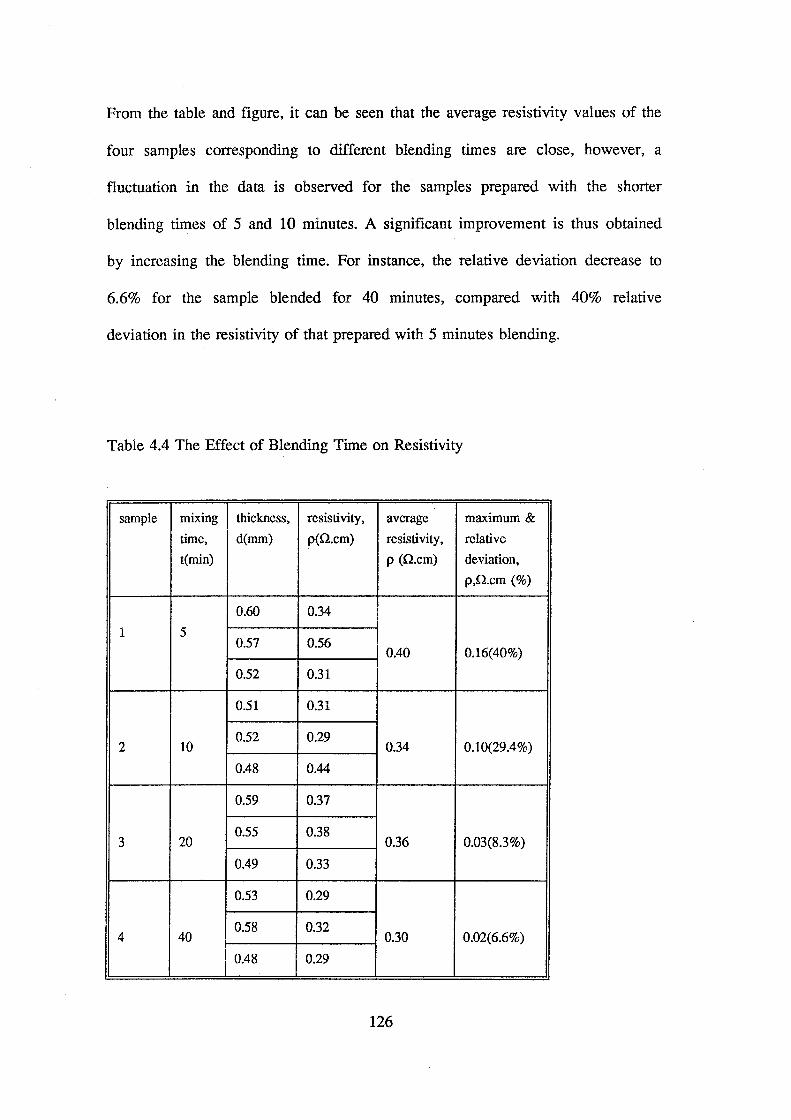
From the table and figure, it can be seen that the average resistivity values of the
four samples corresponding to different blending times are close, however, a
fluctuation in the data is observed for the samples prepared with the shorter
blending times of 5 and 10 minutes. A significant improvement is thus obtained
by increasing the blending time. For instance, the relative deviation decrease to
6.6% for the sample blended for 40 minutes, compared with 40% relative
deviation in the resistivity of that prepared with 5 minutes blending.
Table 4.4 The Effect of Blending Time on Resistivity
sample mixing thickness, resistivity, average maximum &
time, d(mm) p(Q.cm) resistivity, relative
t(min) p (Q.cm) deviation,
p,Q.cm (%)
0.60 0.34
1 5 0.57 0.56
0.40 0.16(40%)
0.52 0.31
0.51 0.31
2 10 0.52 0.29
0.34 0.10(29.4%)
0.48 0.44
0.59 0.37
3 20 0.55 0.38
0.36 0.03(8.3%)
0.49 0.33
0.53 0.29
4 40 0.58 0.32
0.30 0.02(6.6%)
0.48 0.29
126
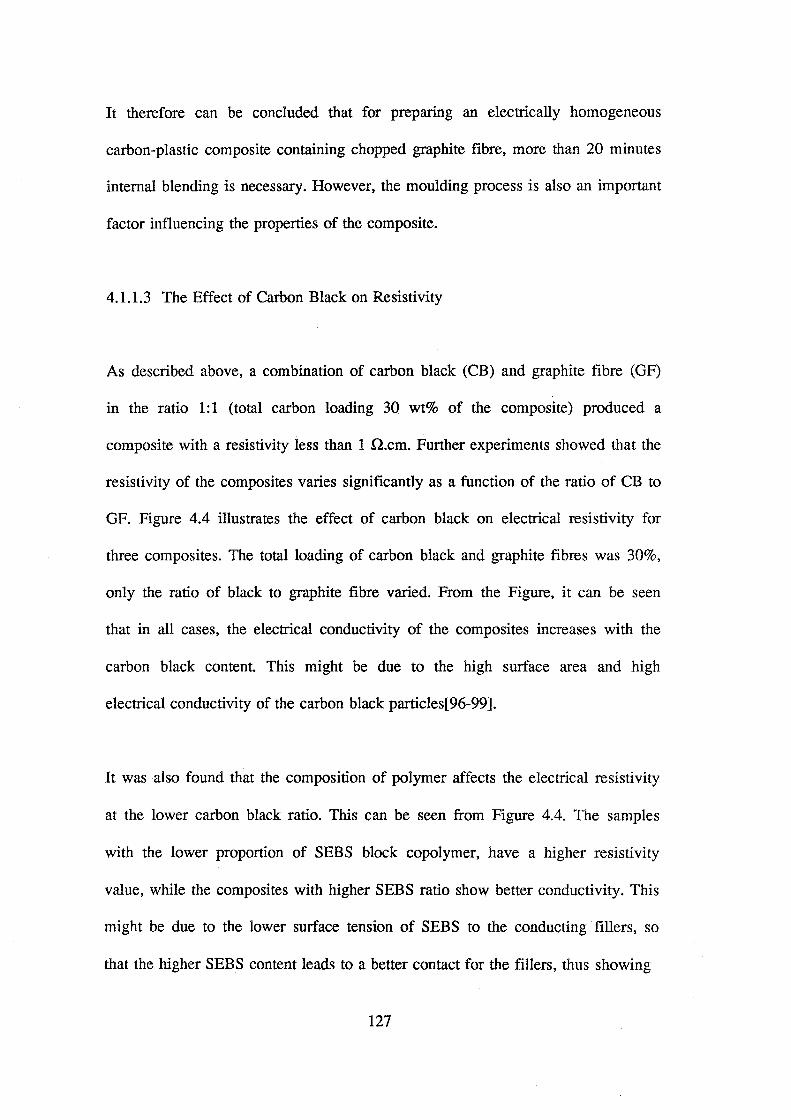
It therefore can be concluded that for preparing an electrically homogeneous
carbon-plastic composite containing chopped graphite fibre, more than 20 minutes
internal blending is necessary. However, the moulding process is also an important
factor influencing the properties of the composite.
4.1.1.3 The Effect of Carbon Black on Resistivity
As described above, a combination of carbon black (CB) and graphite fibre (GF)
in the ratio 1:1 (total carbon loading 30 wt% of the composite) produced a
composite with a resistivity less than 1 n.cm. Further experiments showed that the
resistivity of the composites varies significantly as a function of the ratio of CB to
GF. Figure 4.4 illustrates the effect of carbon black on electrical resistivity for
three composites. The total loading of carbon black and graphite fibres was 30%,
only the ratio of black to graphite fibre varied. From the Figure, it can be seen
that in all cases, the electrical conductivity of the composites increases with the
carbon black content. This might be due to the high surface area and high
electrical conductivity of the carbon black particles[96-99].
It was also found that the composition of polymer affects the electrical resistivity
at the lower carbon black ratio. This can be seen from Figure 4.4. The samples
with the lower proportion of SEBS block copolymer, have a higher resistivity
value, while the composites with higher SEBS ratio show better conductivity. This
might be due to the lower surface tension of SEBS to the conducting fillers, so
that the higher SEBS content leads to a better contact for the fillers, thus showing
127

15 I 0
12 o sarrple 1 E \ u . E
A sarrple 2 ..c g 0
• :J)
o sarrple 3 -jJ
·-> 8
-jJ \ CD ·-
CD Q) L
3 A
8~ :8==--0
0.0 0.5 1 .0 1.5 2.0 2.5 ratio of CB to GF
Figure 4.4 Effect of carbon black (black pearl) to graphite fibre ratio on
resistivity. Proportion of polymers: sample 1, 65% LDPE + 5%
SEBS; sample 2, 60% LDPE + 10% SEBS; sample 3, 55% LDPE + 15% SEBS.
128
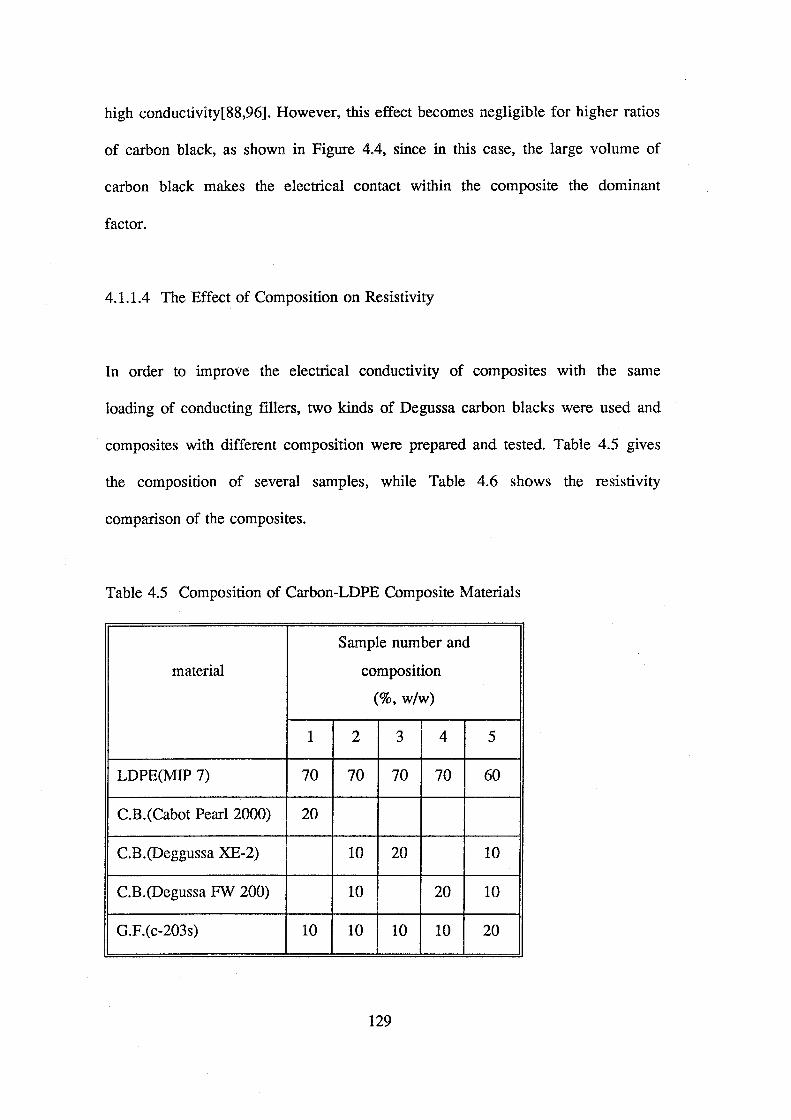
high conductivity[88,96]. However, this effect becomes negligible for higher ratios
of carbon black, as shown in Figure 4.4, since in this case, the large volume of
carbon black makes the electrical contact within the composite the dominant
factor.
4.1.1.4 The Effect of Composition on Resistivity
In order to improve the electrical conductivity of composites with the same
loading of conducting fillers, two kinds of Degussa carbon blacks were used and
composites with different composition were prepared and tested. Table 4.5 gives
the composition of several samples, while Table 4.6 shows the resistivity
comparison of the composites.
Table 4.5 Composition of Carbon-LDPE Composite Materials
Sample number and
material composition
(%, w/w)
1 2 3 4 5
LDPE(MIP 7) 70 70 70 70 60
C.B.(Cabot Pearl 2000) 20
C.B.(Deggussa XE-2) 10 20 10
C.B.(Degussa FW 200) 10 20 10
G.F.(c-203s) 10 10 10 10 20
129
Table 4.6 Comparison of the Electrical Resistivity of Carbon-LDPE Composites
Sample Thickness (mm) Resistivity (O.cm)
(by ASTM D-991)
1 0.34 0.42
2 0.34 0.24
3 0.32 0.15
4 0.25 0.43
5 0.32 0.21
It can be seen from Table 4.6 that for the same carbon black loading, the
composite with Cabot Pearl 2000 and Degussa FW 200 have similar resistivity
values, The lowest resistivity value is obtained by using Degussa XE 2 carbon
black, however, this sample was more physically brittle. Sample 2 was thus
prepared with a combination of the two kinds of Degussa carbon blacks, and the
resulting composite gave good electrical conductivity with better mechanical
properties. Even lower resistivity is observed for sample 5, which also contained
both Degussa XE-2 and FW 200, but in which the content of chopped graphite
fibre was higher.
4.1.2 Mechanical properties
Increasing the ratio of carbon black to graphite fibre resulted in an enhancement
of electrical conductivity, but also caused a deterioration in the mechanical
130
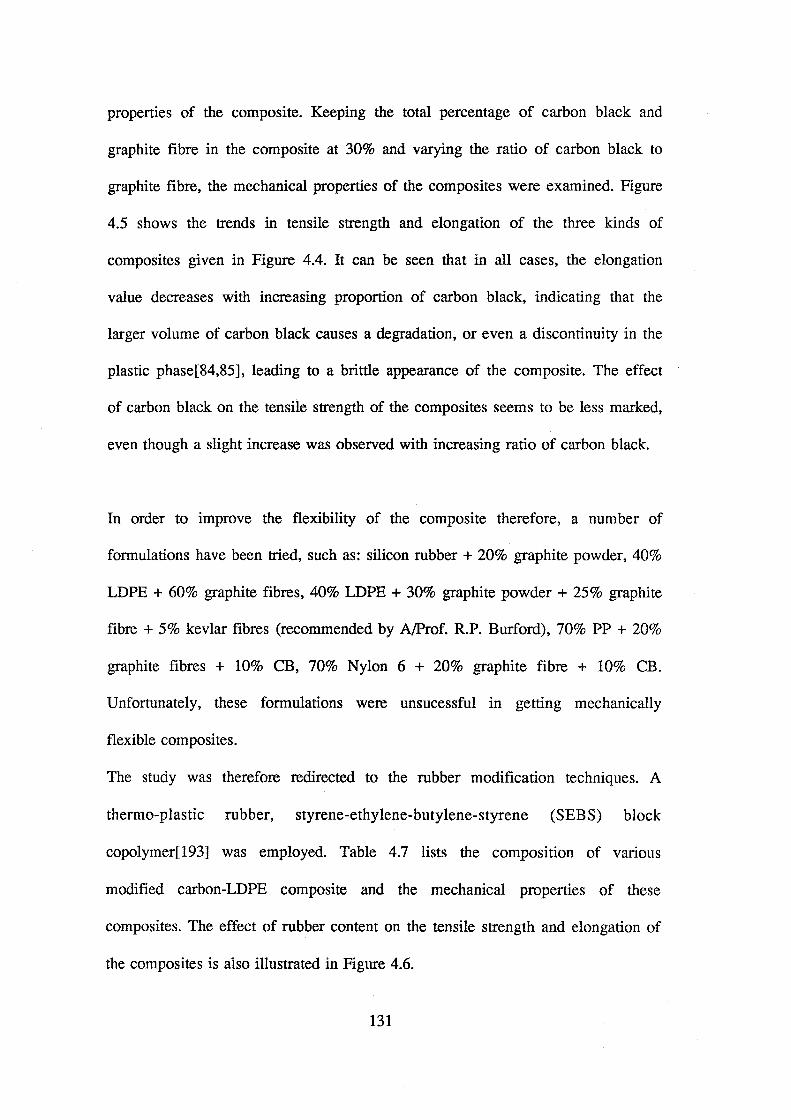
properties of the composite. Keeping the total percentage of carbon black and
graphite fibre in the composite at 30% and varying the ratio of carbon black to
graphite fibre, the mechanical properties of the composites were examined. Figure
4.5 shows the trends in tensile strength and elongation of the three kinds of
composites given in Figure 4.4. It can be seen that in all cases, the elongation
value decreases with increasing proportion of carbon black, indicating that the
larger volume of carbon black causes a degradation, or even a discontinuity in the
plastic phase[84,85], leading to a brittle appearance of the composite. The effect
of carbon black on the tensile strength of the composites seems to be less marked,
even though a slight increase was observed with increasing ratio of carbon black.
In order to improve the flexibility of the composite therefore, a number of
formulations have been tried, such as: silicon rubber + 20% graphite powder, 40%
LDPE + 60% graphite fibres, 40% LDPE + 30% graphite powder+ 25% graphite
fibre + 5% kevlar fibres (recommended by A/Prof. R.P. Burford), 70% PP + 20%
graphite fibres + 10% CB, 70% Nylon 6 + 20% graphite fibre + 10% CB.
Unfortunately, these formulations were unsucessful in getting mechanically
flexible composites.
The study was therefore redirected to the rubber modification techniques. A
thermo-plastic rubber, styrene-ethylene-butylene-styrene (SEBS) block
copolymer[193] was employed. Table 4.7 lists the composition of various
modified carbon-LDPE composite and the mechanical properties of these
composites. The effect of rubber content on the tensile strength and elongation of
the composites is also illustrated in Figure 4.6.
131
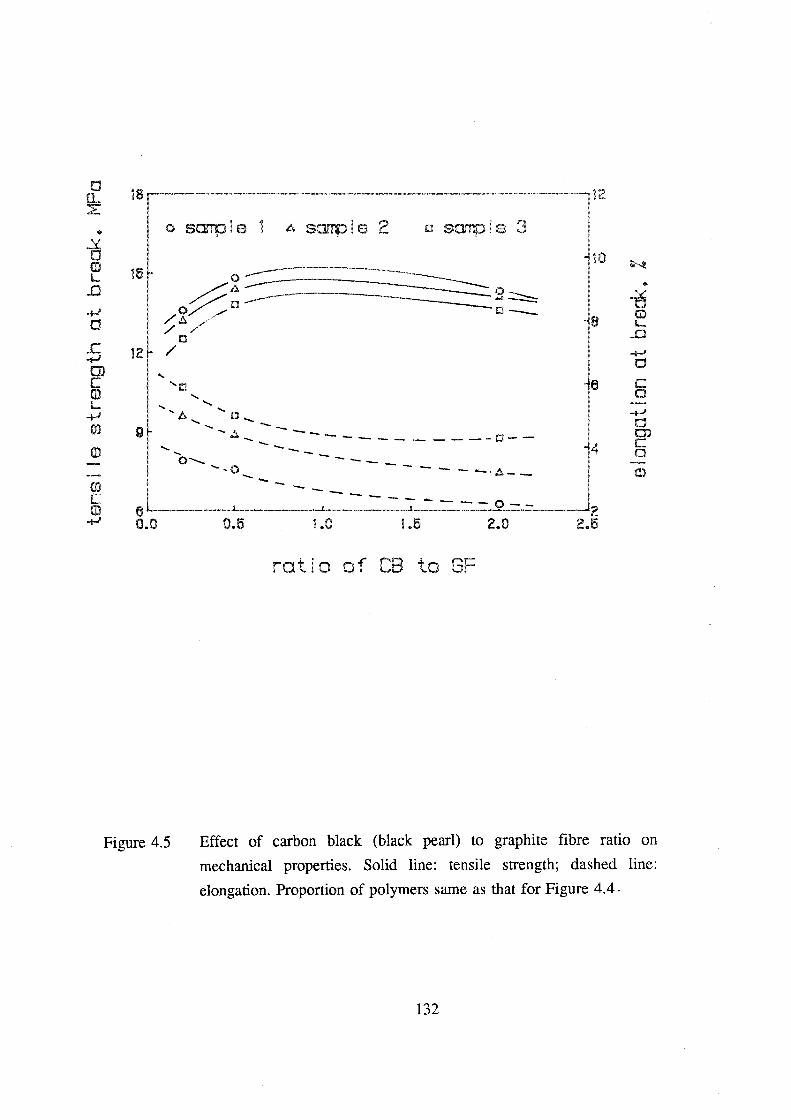
~ 18·---------------~--------~----------~···-----·--·-~--~ :2:
.. -a m L
..0
+-' a ..c +-' rn c (!) L
+-' (I)
m
(I) c m +'
o sarrpie 1 A sarrpie 2 o sample 3
16
8
12
'
g
... ... ...... .... A..._ c.._
..... --'!:a.---... ---------------0--.._
.._- --- --- ----"-·A--4
61...----~·
--- --- -----o--·-----~z
0.0 0.5 1.0 1.5 2.0 2.6
ratio of CB to GF
... -a
CD L
...a
.......... 0
c 0
-+-' 0 0) c 0
m
Figure 4.5 Effect of carbon black (black pearl) to graphite fibre ratio on
mechanical properties. Solid line: tensile strength; dashed line:
elongation. Proportion of polymers same as that for Figure 4.4 .
132
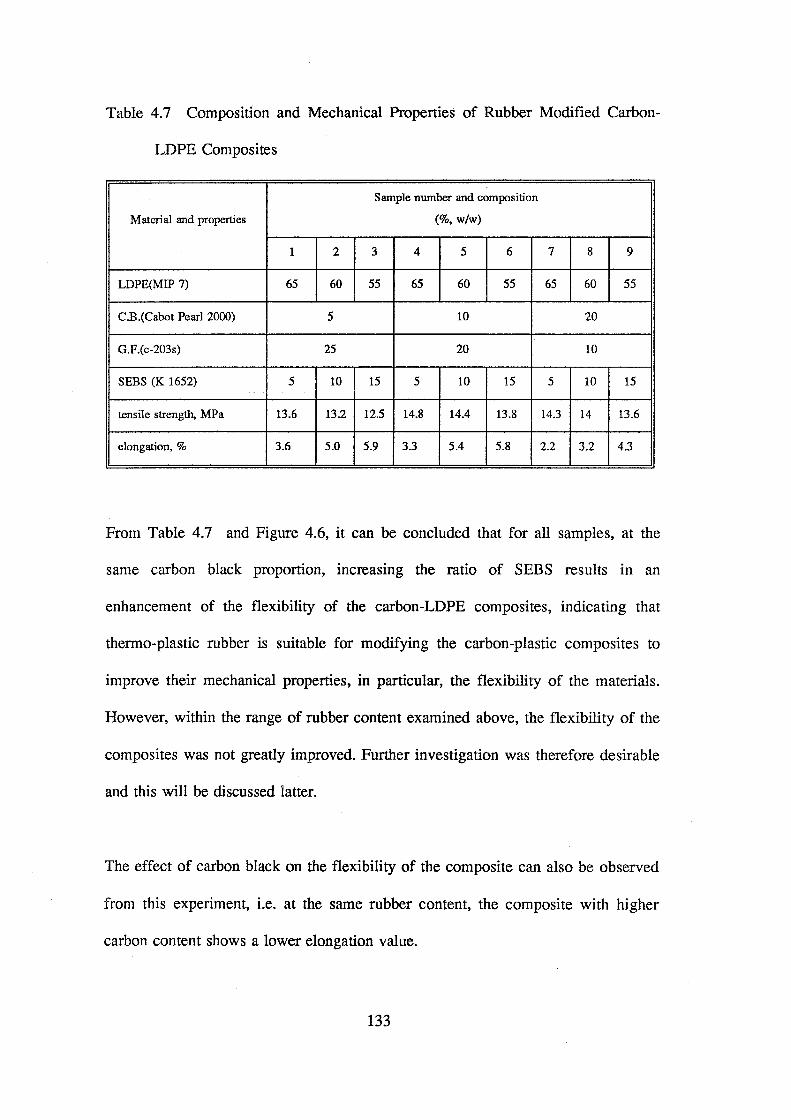
Table 4. 7 Composition and Mechanical Properties of Rubber Modified Carbon
LOPE Composites
Sample number and composition
Material and properties (%, w/w)
1 2 3 4 5 6 7 8 9
LDPE(MIP 7) 65 60 55 65 60 55 65 60 55
C.B.(Cabot Pearl 2000) 5 10 20
G.F.(c-203s) 25 20 10
SEBS (K 1652) 5 10 15 5 10 15 5 10 15
tensile strength, MPa 13.6 13.2 12.5 14.8 14.4 13.8 14.3 14 13.6
elongation,% 3.6 5.0 5.9 3.3 5.4 5.8 2.2 3.2 4.3
From Table 4.7 and Figure 4.6, it can be concluded that for all samples, at the
same carbon black proportion, increasing the ratio of SEBS results in an
enhancement of the flexibility of the carbon-LDPE composites, indicating that
thermo-plastic rubber is suitable for modifying the carbon-plastic composites to
improve their mechanical properties, in particular, the flexibility of the materials.
However, within the range of rubber content examined above, the flexibility of the
composites was not greatly improved. Further investigation was therefore desirable
and this will be discussed latter.
The effect of carbon black on the flexibility of the composite can also be observed
from this experiment, i.e. at the same rubber content, the composite with higher
carbon content shows a lower elongation value.
133

a a_ :E
• 15 -a
CD 1... .n ..,.._; 12 a
..c
..,.._;
~ g co 1...
.4-J 00
OJ 6
o sarple 1
--.... --·0
8
6
-- -c -
.. -a co 1...
..0
.4-J a c 0
....j.J
a CD c a CD -
3 L_l. ---~....c=----..1..,--_ -- ..........___ ___ 2 0 HJ 20 3J
Figure 4.6
content of SEBS to total polymer, Z
Effect of rubber content on mechanical properties. Solid line: tensile
strength; dashed line: elongation. Carbon fillers: sample 1, 5% CB +
25% GF; 2, 10% CB + 20% GF; 3, 20% CB + 10 GF% (CB = black pearl, GF = graphite fibre).
134
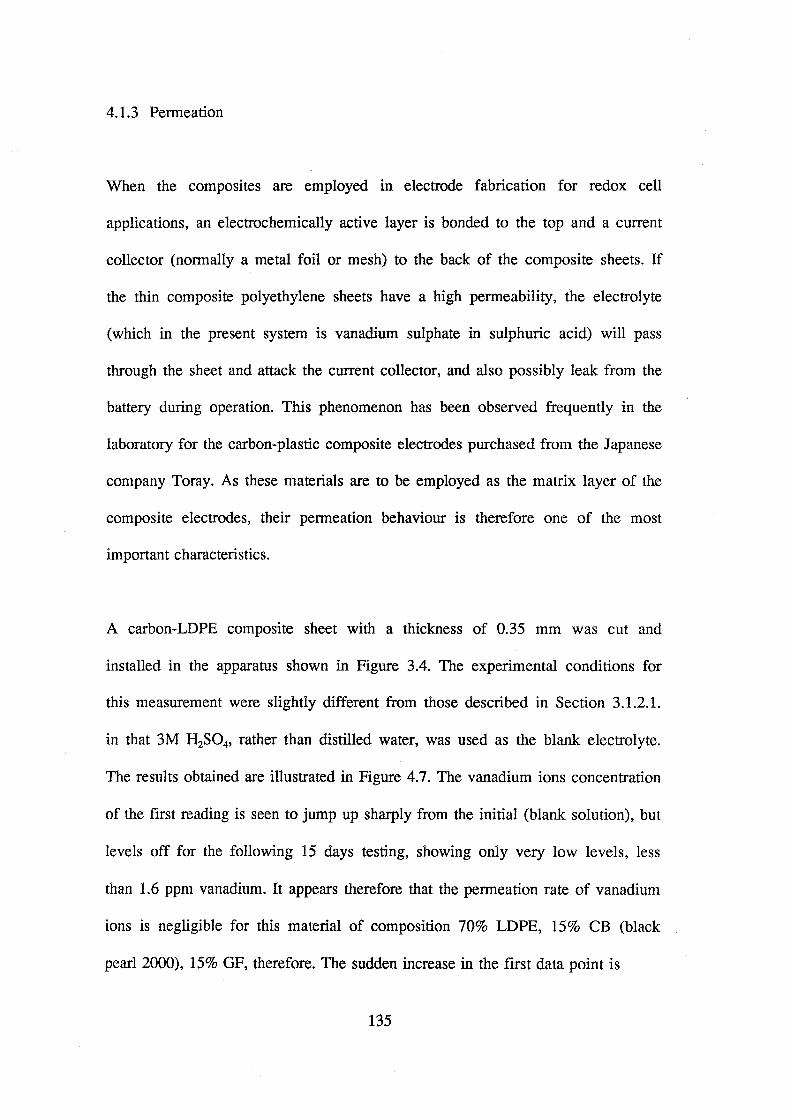
4.1.3 Permeation
When the composites are employed in electrode fabrication for redox cell
applications, an electrochemically active layer is bonded to the top and a current
collector (normally a metal foil or mesh) to the back of the composite sheets. If
the thin composite polyethylene sheets have a high permeability, the electrolyte
(which in the present system is vanadium sulphate in sulphuric acid) will pass
through the sheet and attack the current collector, and also possibly leak from the
battery during operation. This phenomenon has been observed frequently in the
laboratory for the carbon-plastic composite electrodes purchased from the Japanese
company Toray. As these materials are to be employed as the matrix layer of the
composite electrodes, their permeation behaviour is therefore one of the most
important characteristics.
A carbon-LDPE composite sheet with a thickness of 0.35 mm was cut and
installed in the apparatus shown in Figure 3.4. The experimental conditions for
this measurement were slightly different from those described in Section 3.1.2.1.
in that 3M H2S04, rather than distilled water, was used as the blank electrolyte.
The results obtained are illustrated in Figure 4. 7. The vanadium ions concentration
of the first reading is seen to jump up sharply from the initial (blank solution), but
levels off for the following 15 days testing, showing only very low levels, less
than 1.6 ppm vanadium. It appears therefore that the permeation rate of vanadium
ions is negligible for this material of composition 70% LDPE, 15% CB (black
pearl 2000), 15% GF, therefore. The sudden increase in the first data point is
135

E §: 1.2 .
c ~ 1.0 4-1 a L
~ 0.8 m 0 c 8 0.6 r.
+ 5 0.4 >
0.2
l ______ o---- I o----6
0 0
o.ooL-----~3------~e-------gL------,~2------~,5------~,s
t.i me( dOt:J)
Figure 4.7 Permeation behaviour of carbon-LDPE composite of composition
70% LDPE, 15% CB (black pearl), 15% GF (graphite fibre).
136

however, thought to come from the solution pumping system which had
previously been operated with a vanadium redox cell before this test. The actual
vanadium levels resulting from permeation through the composite layer is
therefore probably lower than shown in Figure 4.7.
4.1.4 Electrochemical Stability and Activity of the Carbon-LDPE Composite
Electrodes
4.1.4.1 Electrochemical Stability
In the vanadium redox battery, the following reactions occur during charging and
discharging:
At the positive electrode:
charging
V02+ + H20 - e ~ VO/ + 2H+ discharging
At the negative electrode:
charging y3++e ~ y2+
discharging
In addition, oxygen and hydrogen can evolve at the positive and negative
electrodes respectively during charging at high SOC's, or if the battery is
overcharged.
137
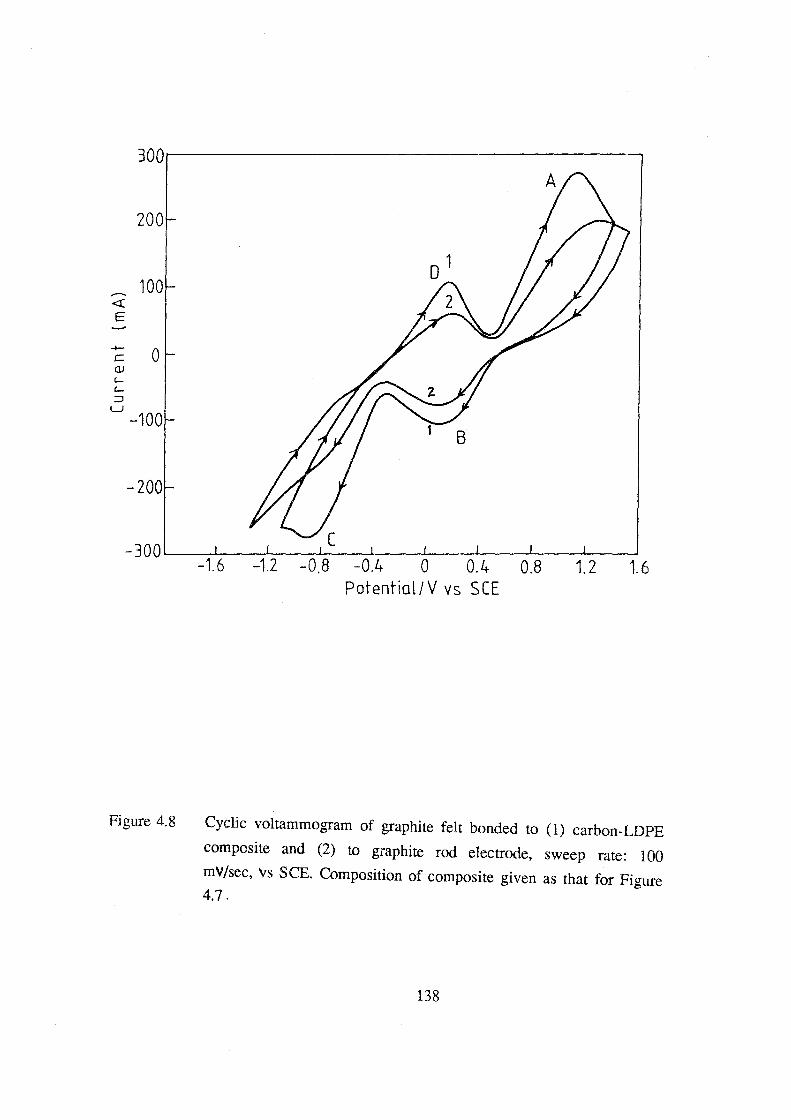
-c: ClJ
300.....-----------------~
-300 L __ _J1.:_6 --!:--~--:_0f-.4-:---!;-7,:--~;---;:;--;1. 6
Potential IV vs SCE
Figure 4.8 Cyclic voltarnmograrn of graphite felt bonded to (1) carbon-LDPE
composite and (2) to graphite rod electrode, sweep rate: 100
rnV/sec, \ts SCE. Composition of composite given as that for Figure 4.7.
138
A good electrode for the vanadium redox flow battery should have a high electro
chemical activity for the vanadium redox reactions, and also be stable to the
oxidative V(V) ions and oxygen which may be formed during charging. These
characteristics were thus evaluated using cyclic voltammetry. Figure 4.8 shows
cyclic voltammograms obtained for a conducting plastic electrode (composition
70% PE,l5% CB, 15% OF) onto which a piece of FMI graphite felt was bonded.
The four peaks corresponding to the above electrode reactions of the four
vanadium species can be observed (peaks A and B corresponding to V(IV)
oxidation and V(V) reduction respectively and peaks C and D to V(III) reduction
and V(II) oxidation respectively), thus indicating that the graphite felt bonded
composite polyethylene electrode structure has good electrochemical activity in the
electrolyte. Curve 2 illustrates the electrochemical behaviour of a similar size
graphite rod electrode with the same graphite felt bonded (with silicon glue) to the
surface. A broader current peak and larger peak potential separation are observed
for the latter electrode, which is probably due to a higher contact resistance
leading to high IR drops with the latter electrode. From the two curves, it appears
that the composite polyethylene is a better electrode substrate material, probably
because a lower contact resistance between the graphite felt and carbon-plastic
composite substrate can be achieved by heat pressing. Figure 4.9 gives further
cyclic voltammetry results which show the stability of the electrode during
operation. After 100 cycles, a negligible change in the electrode behaviour was
recorded, showing that these materials have excellent long-term characteristics for
the vanadium battery applications.
139

<{ E
300
0
-200
-1.6 -1.2 -0.8 -0.4 0 0.4 0.8 1.2 Potential/V vs SCE
Figure 4.9 Cyclic voltammetry stability testing for carbon-LDPE composite
electrode. Sweep rate: 100 mV-si,'., vs SCE, 100 cycles.
Composition of composite same as that for Fig. 4.7.
140 .

4.1.4.2 Cell Performance of Composite Electrodes
Further to the cyclic voltammetry study which indicated the electroactivity and
cycling stability of the composite electrodes, additional carbon-LDPE composite
electrodes were prepared for cell performance testing. Two types of laboratory
scale redox flow cells were employed: a 23 cm2 flow-through square cell and a 95
cm2 flow-by round cell. With the preparation procedure described previously, end-
electrodes corresponding to the cavity of each cell design were prepared and tested
Equal volume of 2 M V3.5+/2.5 M H2S04 solution (see Section 3.1.2.2) were
employed as electrolytes for both sides of the vanadium battery for the initial
cycle and the following test. A cation exchange membrane (CMV) was used as
separator for all tests. A constant charge/discharge current of 40 mA.cm·2 was
applied for both flow-through and flow-by test cells. Using the apparatus
illustrated in Figure 3.8, the cell charge/discharge curves were recorded. Average
cell efficiencies for 5 consecutive cycles were determined and these are listed in
Table 4.8.
Table 4.8 Cell Performance of Carbon-LDPE Composite Electrodes
efficiency, % flow-through cell flow-by cell
(23 cm2) 95 cm2
FMI felt FMI felt Toray felt
columbic, Tlc 92 96 91
voltage, Tlv 70 73 71
energy, Tle 65 70 64
141

It can be seen from Table 4.8 that the carbon-LDPE composite electrode with the
Toray graphite felt as the electrode active layer shows the highest cell efficiencies.
This might be due to the better electroactivity of the felt layer. For the electrode
employing the FMI felt, the cell efficiencies obtained from both the flow-through
and flow-by test cells were similar. The cell efficiencies obtained here indicate
that the carbon-LDPE composite electrode is a promising candidate for application
in the vanadium redox flow cell. However, further study is necessary for
enhancing electrochemical activity of the composite electrode, although improved
cell design should lead to significantly higher energy efficiencies in the vanadium
redox battery.
4.2 HDPE Based Carbon-Plastic Composites and Electrodes
From all the results discussed above, it can be concluded that the LDPE based
composite has good electrical conductivity, and promising cell efficiencies can be
obtained with the electrodes which were made by bonding a piece of graphite felt
onto the composite sheet. However, this composite material was found to be very
brittle and easily broken during assembly. It was also found that the thermo-plastic
rubber, SEBS block copolymer, can improve the flexibility of the LDPE based
composites, but at the proportion range investigated, the enhancement in
elongation value of the composites was not significant. Further studies were
therefore desirable. On the other hand, for use as an electrode substrate, especially,
142

for a larger electrode, rigidness of the composite sheet is required so that the
electrodes assembled in the battery, in particular, the bipolar electrodes can
withstand the hydraulic pressure without shifting. Thus, more intensive studies
were focussed on optimising mechanical properties of the HDPE based composites
by thermo-plastic rubber modification while maintaining the electrical conductivity
and impermeable properties. Furthermore, with the successful composite materials
used as the electrode matrix layer, cell performance tests including polarisation
behaviour, cell resistance, efficiencies and long-term stability of the composite
electrodes with various active layers are emphasised. Electrode deterioration test
under overcharge condition is also discussed.
4.2.1 Evaluation of SEBS Modified Carbon-HDPE Composites
4.2.1.1 Effect of Composition on Electrical and Mechanical Properties
In this section, the composition of the Rubber Modified Carbon-Plastic Composite
has been studied in relation to the electrical and mechanical properties of the
materials prepared. Based on the results obtained from the initial studies, two
kinds of Degussa carbon black powders and Kuraha graphite fibre chops were
used as electrical conducting fillers with a proportion of 10%, 10% and 20%
respectively. Considering the requirement of mechanical rigidity, two of the most
common thermo-plastics, high density polyethylene (HDPE) and polypropylene
(PP) were selected as the basic polymers. Styrene-ethylene-butylene-styrene
(SEBS) was selected as the modifying polymer. For comparison, LDPE based
143
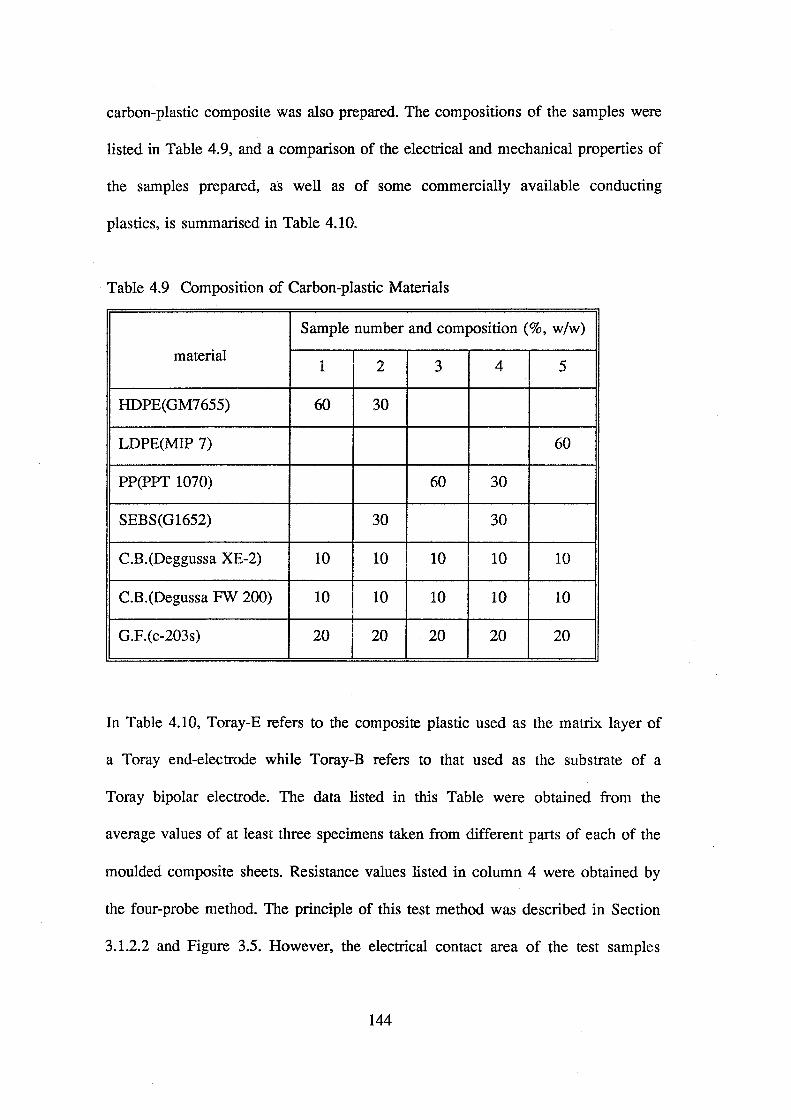
carbon-plastic composite was also prepared. The compositions of the samples were
listed in Table 4.9, and a comparison of the electrical and mechanical properties of
the samples prepared, as well as of some commercially available conducting
plastics, is summarised in Table 4.10.
Table 4.9 Composition of Carbon-plastic Materials
Sample number and composition (%, w/w)
material 1 2 3 4 5
HDPE(GM7655) 60 30
LDPE(MIP 7) 60
PP(PPT 1070) 60 30
SEBS(G1652) 30 30
C.B.(Deggussa XE-2) 10 10 10 10 10
C.B.(Degussa FW 200) 10 10 10 10 10
G.F.(c-203s) 20 20 20 20 20
In Table 4.10, Toray-E refers to the composite plastic used as the matrix layer of
a Toray end-electrode while Toray-B refers to that used as the substrate of a
Toray bipolar electrode. The data listed in this Table were obtained from the
average values of at least three specimens taken from different parts of each of the
moulded composite sheets. Resistance values listed in column 4 were obtained by
the four-probe method. The principle of this test method was described in Section
3.1.2.2 and Figure 3.5. However, the electrical contact area of the test samples
144
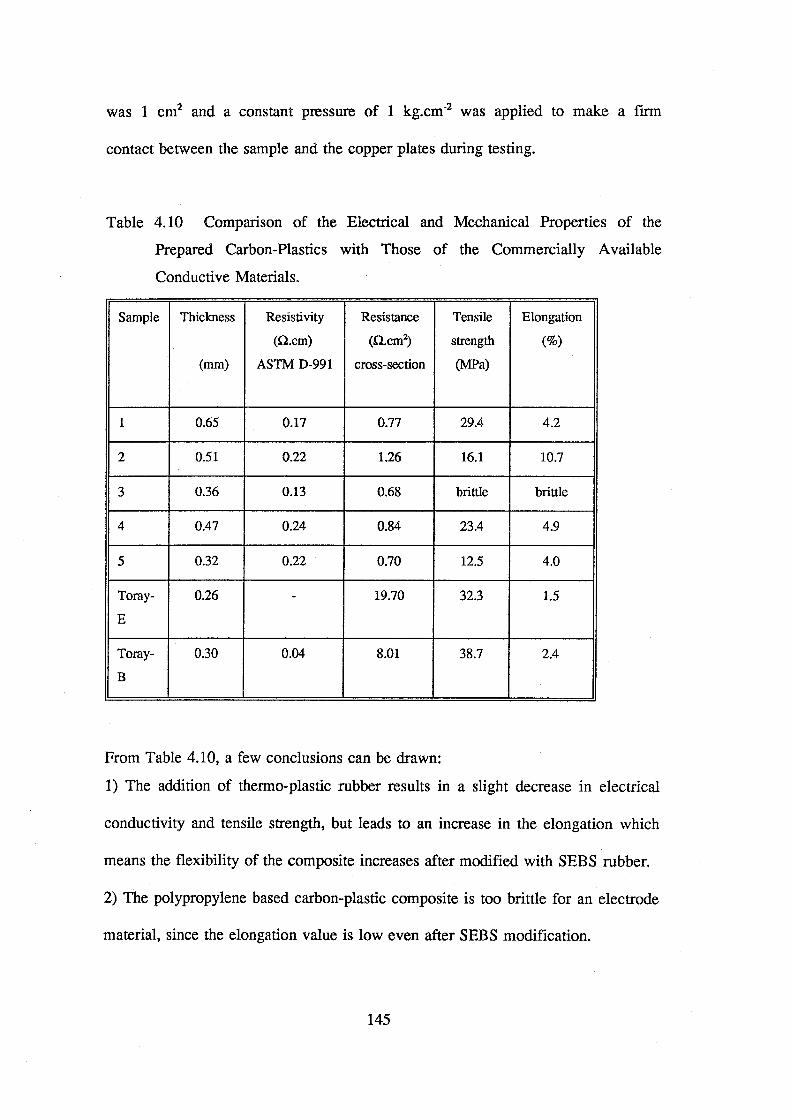
was 1 cm2 and a constant pressure of 1 kg.cm·2 was applied to make a firm
contact between the sample and the copper plates during testing.
Table 4.10 Comparison of the Electrical and Mechanical Properties of the
Prepared Carbon-Plastics with Those of the Commercially Available
Conductive Materials.
Sample Thickness Resistivity Resistance Tensile Elongation
(Q.cm) (Q.cm~ strength (%)
(mm) ASTM D-991 cross-section (MPa)
1 0.65 0.17 0.77 29.4 4.2
2 0.51 0.22 1.26 16.1 10.7
3 0.36 0.13 0.68 brittle brittle
4 0.47 0.24 0.84 23.4 4.9
5 0.32 0.22 0.70 12.5 4.0
Toray- 0.26 - 19.70 32.3 1.5
E
Toray- 0.30 0.04 8.01 38.7 2.4
B
From Table 4.10, a few conclusions can be drawn:
1) The addition of thermo-plastic rubber results in a slight decrease in electrical
conductivity and tensile strength, but leads to an increase in the elongation which
means the flexibility of the composite increases after modified with SEBS rubber.
2) The polypropylene based carbon-plastic composite is too brittle for an electrode
material, since the elongation value is low even after SEBS modification.
145

3) comparing the electrical and mechanical properties of the SEBS modified
carbon-HDPE composite and the Japanese Toray sample, although the electrical
conductivity along the surface direction (column 3 in Table 4.10) is not as high,
the conductivity of the modified composite in the cross-sectional direction and the
flexibility are better than the Toray one.
Even though the results obtained show that carbon-HDPE modified with SEBS in
the ratio of 1:1 (SEBS : HDPE) has good mechanical properties as well as
electrical conductivity, further optimisation of the ratio of rubber to plastic is
needed, since a high ratio of rubber will result in a high amorphous phase inside
the composite and a decrease in the electrical conductivity and the rigidness of the
composite. Table 4.11 shows the composition of the various SEBS modified
samples prepared. Table 4.12 gives the comparison of the mechanical and
electrical properties for the different compositions. The variation in the properties
of the composite as a function of the SEBS content is illustrated in Figure 4.10.
Table 4.11 Optimisation study on the SEBS Modified Carbon-HDPE Composite
Materials Sample number and content(%, w/w)
1 2 3 4
HDPE(GM 7665) 60 50 40 30
SEBS(G 1652) 10 20 30
C.B.(Degussa XE-2) 10 10 10 10
C.B.(Degussa FW200) 10 10 10 10
G.F.(Kuraha c-203s) 20 20 20 20
146

1.0 40
o res i s t i v I t!d A tens I I e strength o e I ongat.l on
0.8 \ 15 3) ,...., ,...., A a
E (L 0 :L ,...., . .._,
~ E .c ._, -6 0.6 -rJ
c Ol 0
._, c :;:; 10
:J) 20
Q) -rJ L
a -rJ 0) > CD c :;:; 0.4 A 0 (f)
Q)
-Q) (f) CD
Q) c 5 L
0----------10 Q)
0.2 D -rJ
/ 0--..._ /0
0 0.0 0 0 10 20 30 40
SEBS contentC7.)
Figure 4.10 Effect of SEBS content on electrical and mechanical properties of
carbon-HDPE composites. Composition given as sample 1,2,3 and 4
in Table 4.11 .
147
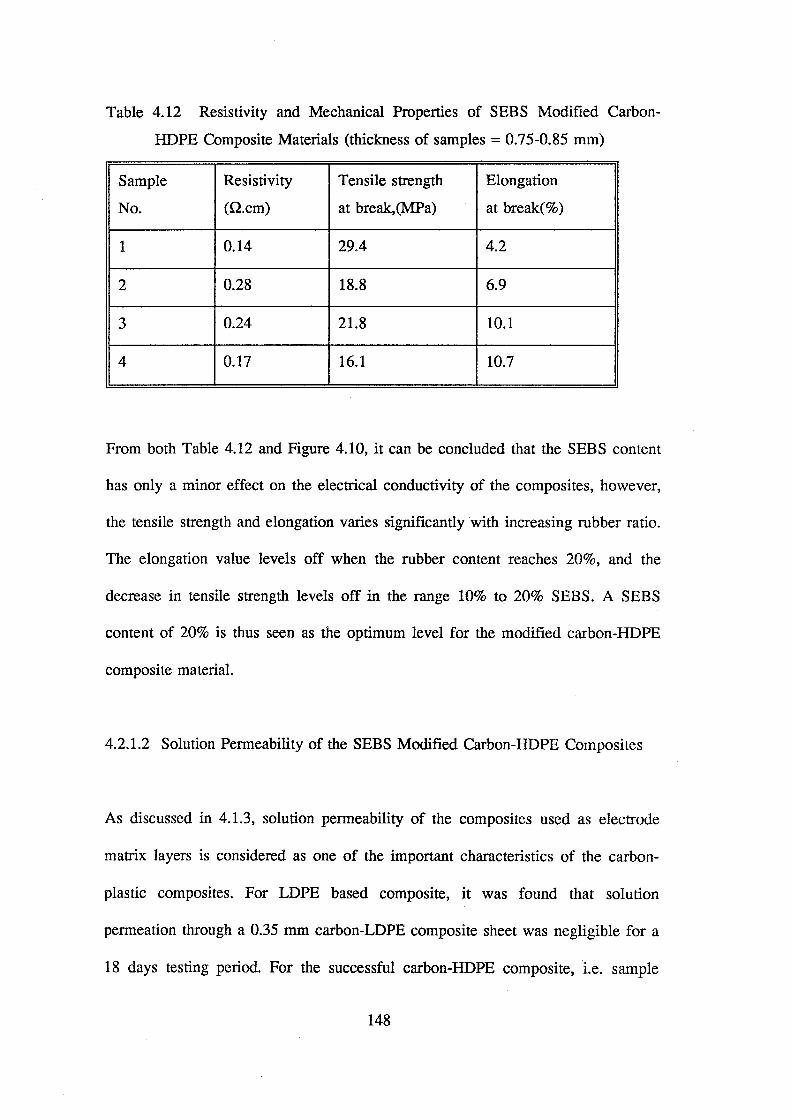
Table 4.12 Resistivity and Mechanical Properties of SEBS Modified Carbon
HDPE Composite Materials (thickness of samples= 0.75-0.85 mm)
Sample Resistivity Tensile strength Elongation
No. (Q.cm) at break,(MPa) at break(%)
1 0.14 29.4 4.2
2 0.28 18.8 6.9
3 0.24 21.8 10.1
4 0.17 16.1 10.7
From both Table 4.12 and Figure 4.10, it can be concluded that the SEBS content
has only a minor effect on the electrical conductivity of the composites, however,
the tensile strength and elongation varies significantly with increasing rubber ratio.
The elongation value levels off when the rubber content reaches 20%, and the
decrease in tensile strength levels off in the range 10% to 20% SEBS. A SEBS
content of 20% is thus seen as the optimum level for the modified carbon-HDPE
composite material.
4.2.1.2 Solution Permeability of the SEBS Modified Carbon-HDPE Composites
As discussed in 4.1.3, solution permeability of the composites used as electrode
matrix layers is considered as one of the important characteristics of the carbon-
plastic composites. For LDPE based composite, it was found that solution
permeation through a 0.35 mm carbon-LOPE composite sheet was negligible for a
18 days testing period. For the successful carbon-HDPE composite, i.e. sample
148

number 3 in Table 4.11, solution impermeability is also expected. Therefore, a
similar test as described below, was conducted.
A small round cell fitted with solution pumping system was employed (see
Section 3.1.2 and Figure 3.4), the sheet being used as a separator between the two
electrolyte compartments. The thickness of the composite sheet employed was
0.35 mm (half the thickness of those used for electrode fabrication). On one side
was 2 M V(IV) in 3 M H2S04 solution (the positive electrolyte of vanadium
battery) and on the other side was distilled water (see Figure 3.4). Both solutions
were pumped for 15 days, and 5 ml samples were withdrawn from the water side
periodically. The concentration of vanadium and sulphur (as SO/) in the blank
solution was determined using Inductively Coupled Plasma (ICP) analysis, and the
results are illustrated in Figure 4.11.
The non-zero intercepts in Figure 4.11 is again probably due to impurities
introduced from the pumps, the containers and other cell components. A higher
sulphur concentration was also detected throughout the testing, which might be
due to the difference in bulk concentration as well as the difference in ion
permeability between the sulphate and vanadium ions. However, the detected
values of both vanadium and sulphur are very low during the 15 day period,
showing that the composite material prepared is suitable for redox cell
applications.
149
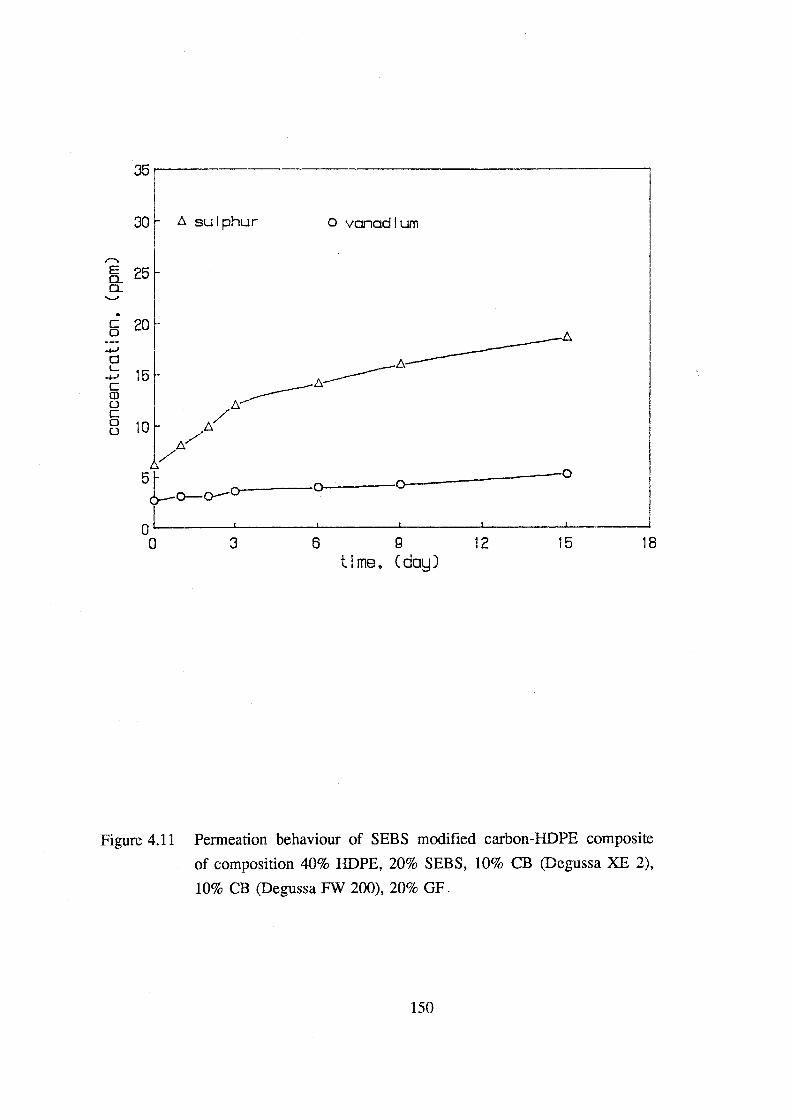
35~--------------------------------------------~
30 1:!. suI phur
r-.
E 25 0.. 0.. .......
~ 20~ a
.!::; 15 c Q) (.) c 8 10
5cl-o-o-o--
0 0 3
o vanadium
0 0
6 9 12 15 18 time. Cda!::J)
Figure 4.11 Permeation behaviour of SEBS modified carbon-HDPE composite
of composition 40% HDPE, 20% SEBS, 10% CB (Degussa XE 2),
10% CB (Degussa FW 200), 20% GF.
150
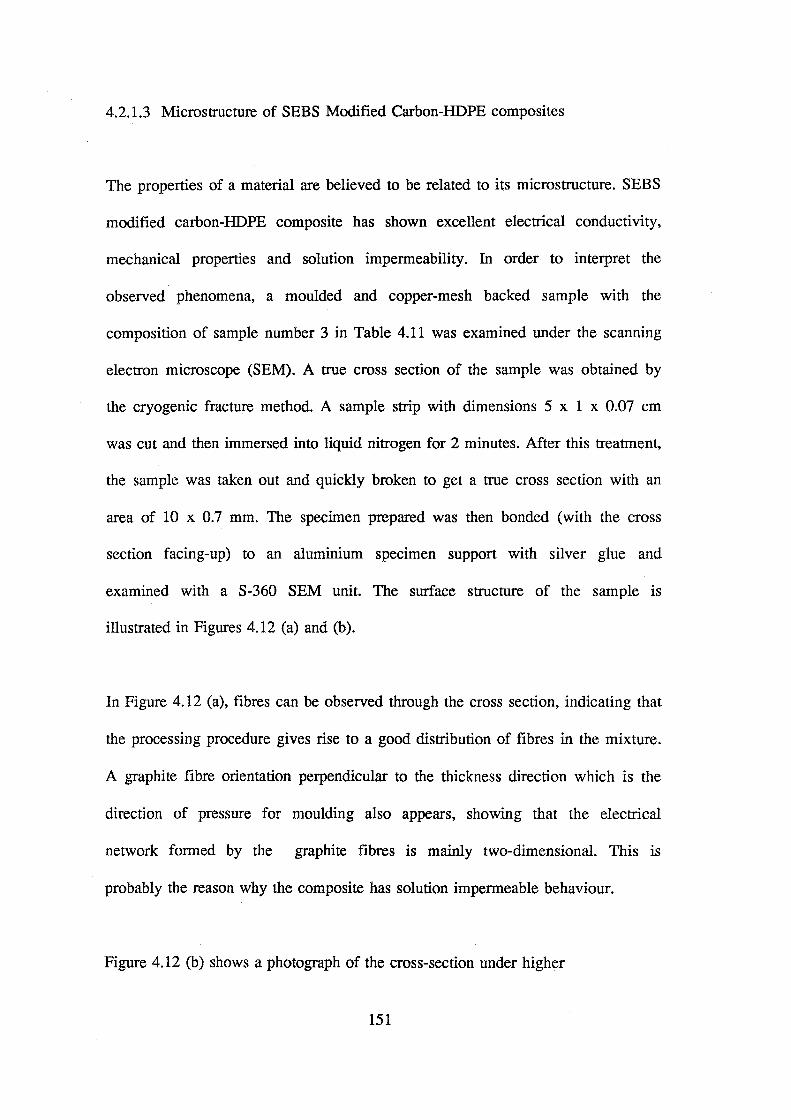
4.2.1.3 Microstructure of SEBS Modified Carbon-HDPE composites
The properties of a material are believed to be related to its microstructure. SEBS
modified carbon-HDPE composite has shown excellent electrical conductivity,
mechanical properties and solution impermeability. In order to interpret the
observed phenomena, a moulded and copper-mesh backed sample with the
composition of sample number 3 in Table 4.11 was examined under the scanning
electron microscope (SEM). A true cross section of the sample was obtained by
the cryogenic fracture method. A sample strip with dimensions 5 x 1 x 0.07 em
was cut and then immersed into liquid nitrogen for 2 minutes. After this treatment,
the sample was taken out and quickly broken to get a true cross section with an
area of 10 x 0.7 mm. The specimen prepared was then bonded (with the cross
section facing-up) to an aluminium specimen support with silver glue and
examined with a S-360 SEM unit. The surface structure of the sample is
illustrated in Figures 4.12 (a) and (b).
In Figure 4.12 (a), fibres can be observed through the cross section, indicating that
the processing procedure gives rise to a good distribution of fibres in the mixture.
A graphite fibre orientation perpendicular to the thickness direction which is the
direction of pressure for moulding also appears, showing that the electrical
network formed by the graphite fibres is mainly two-dimensional. This is
probably the reason why the composite has solution impermeable behaviour.
Figure 4.12 (b) shows a photograph of the cross-section under higher
151

a)
b)
Figure 4.12 Cross section of a SEBS modified carbon-HDPE composite (Cu
mesh backed), magnification: a) 40x: b):440x. Composition same as
that for Fig. 4.11 .
152

magnification. It can be seen that the graphite fibres are "sandwiched" by the
continuous phase of polymer-carbon black mixture, explaining the good electrical
and mechanical properties of the composites. However, carbon black particles can
not be identified under this testing condition.
4.2.2. Evaluation of SEBS Modified Carbon-HDPE Composite Electrode
4.2.2.1 Electrical Resistance and Cell Resistance
The composite sheet of composition number 3 in Table 4.11 has thus been found
to be suitable for use as an electrode matrix layer for the redox cell. A number of
end-electrodes were thus fabricated with different active layers by hot-bonding
(see Section 3.1.1.3 and Figure 3.3) onto the sheet, and the electrical resistance
values of the composite electrodes determined using the four-probe method, for
which the measuring procedure and method for determining resistance values were
described in Section 3.1.2.2 and Figure 3.5.
The reliability of the testing method was first evaluated. A pair of commercially
available Toray end-electrodes was used for this evaluation. Three independent
measurements were carried out on the same electrodes to establish any deviation
caused by the test procedure. Figure 4.13 shows the results obtained. Only a slight
variation was observed, indicating that reproducible result can be achieved with
this method.
153

70
r-,/ 60 0 isi:. o 3rd 0
D.
50 D. 2nd r--.
> E
"---'
> 40 .
Q) 0) d 30 __,_..
0 >
20
10 0/0
0 0 5 10 15 20 25 30 35 40 45
oppl ied current dens it'd. i CmR/cm 2 )
Figure 4.13 Reproducibility Evaluation of four-probe method for measuring
resistance of composite electrode .
154

To evaluate the electrical resistance variation caused by processing, four pairs of
end-electrodes prepared by the procedure described in Section 3.1.1.3 and Figure
3.3 were tested. All the electrodes were made by hot bonding Toray graphite felt
onto the SEBS modified, copper mesh backed carbon-plastic composites. A good
reproducible result can also be seen in Figure 4.14, showing that the variation
introduced from the preparation procedure is minor.
Thus, the data obtained with four-probe method is believed to be reliable. The
electrical resistance of various composite electrodes prepared in this laboratory
were therefore evaluated with this method and the results are listed in Table 4.13.
For comparison purpose, the resistance of commercial Toray electrodes was also
tested.
Table 4.13 shows that resistance of various composite electrodes varies
corresponding to the different active layer used. The lowest resistance value was
obtained for the electrode fabricated with Toray graphite felt, while the highest
was observed from that with the FMI felt. This could be due to either the different
electrical properties and surface area of the different graphite felt materials, but is
most likely due to the variations in the contact resistance between the graphite felt
and composite sheet during hot-bonding. The different felt materials probably
require slightly different bonding condition to achieve optimum contact. Table
4.13 also shows that the resistance value of the composite end-electrode prepared
with Toray felt is close to that of the Japanese Toray electrode, even though the
thickness of composite sheet is more than two times greater than that of latter one.
155

30~----------------------------------------~
o No. i L-. No.2 o No.3 *No.4
r--.. 20 0 > E * "--'
> . 0 Q)
o/*L-. ()) d _....,
0 10 c,D >
OD /*
/''' :0
0 0 3 6 g 12 15 18
applied current densit\j. CmA/cm 2 )
Figure 4.14 Effect of processing on resistance of composite electrodes
(Composition of electrode matrix same as that for Fig. 4.11).
156
This indicates that the electrical properties of SEBS modified carbon-HDPE
composite are superior to those of Japanese Toray carbon-plastic.
Table 4.13 Electrical Resistance Comparison for Some SEBS Modified Carbon-
HDPE/Graphite-felt Electrodes
Electrode Thickness (from Resistance through
Cu to plastic), mm thickness direction
(ohm.cm2)
1. end electrode
PRJFMI felt(6 mm) 0.9 2.35
PR/Le carbon felt (6 mm) 0.9 1.51
PR!foray Felt (6 mm) 1.00 0.68
purchased Toray end- 0.28 0.7
electrode
2. bipolar
purchased Toray bipolar 0.30 1.11
electrode
PR!foray felt 0.70 1.74
Figure 4.15 (a) and (b) show photographs of the cross section and the matrix layer
surface (the bonded felt has been removed) of a typical SEBS modified composite
electrode prepared in this study. Again, cryogenic fracture method was employed
to obtain the true cross section and surface. From Figure 4.15 (a), a firm bonding
between felt and composite matrix layer can be seen, indicating that the
157
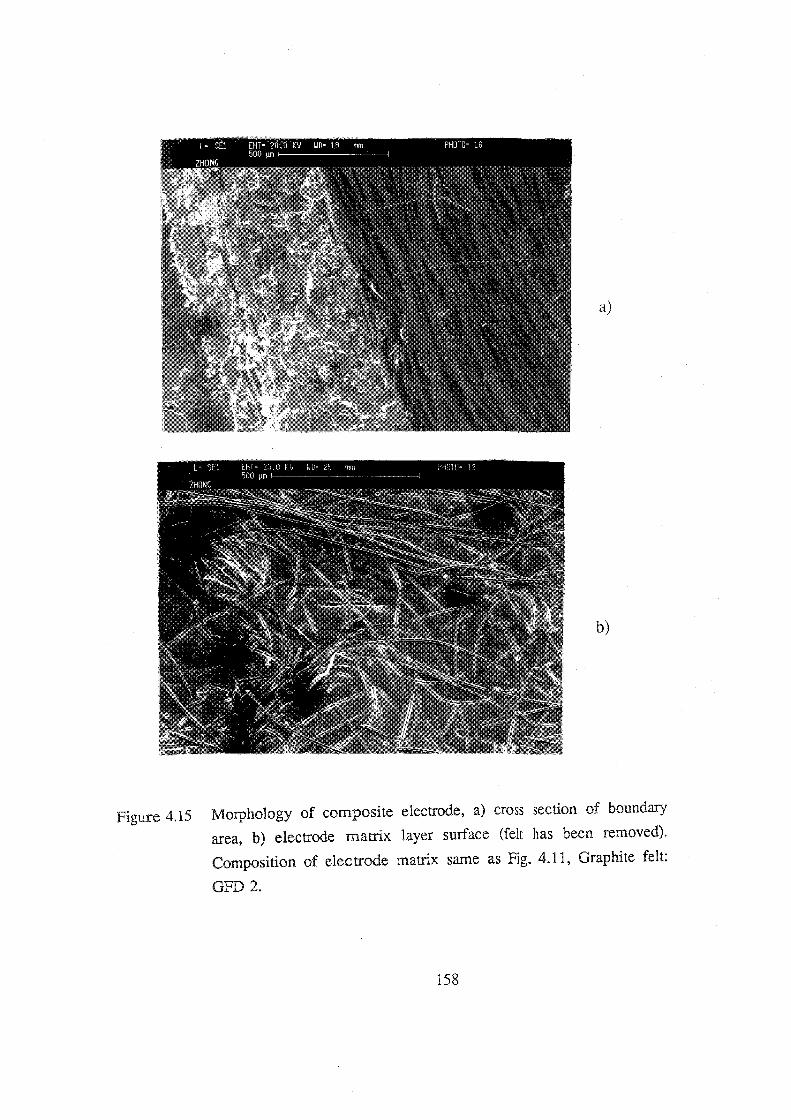
a)
b)
Figure 4.15 Morphology of composite electrode, a) cross section of boundary
area, b) electrode matrix layer surface (felt has been removed).
Composition of electrode matrix same as Fig. 4.11, Graphite felt:
GFD2.
158

effectiveness of the electrical contact between surface active layer and composite
matrix layer can be obtained by the processing procedure designed. In order to
obtain further information about the electrical contact between the graphite felt
and the composite materials, the bonded felt was removed by cryogenic fracture
method: put the composite electrode into liquid nitrogen for 2 minutes and then
break along the interface. The exposed matrix layer surface (top view) is shown in
Figure 4.15 (b). The large amount of the fibres seen from the photograph, i.e.
Figure 4.15 (b) explains the efficient electrical conductivity of the composite
electrode.
Cell resistance values of the vanadium redox flow cell employing the composite
electrodes were also tested using a complete single cell and associated apparatus
(see Figure 3.8) with 50% state of charge (SOC) electrolyte in both positive and
negative half cell. Cell resistances for various carbon-plastic composite electrodes
were determined by the principle described in section 2.6.2.1 and are shown in
Table 4.14. From this table, it can be seen that the composite electrodes
employing the Toray graphite felt have the lowest cell resistance, compared with
the other types of felt and the Japanese electrode. This may be due to the high
real surface area and good electrical conductivity of the felt material. Further
evaluation and comparison on some physical properties of felt materials will be
discussed in Chapter VI.
The Toray graphite felt was thus employed to fabricate composite electrode for a
series of cell performance tests in the vanadium redox flow cell.
159
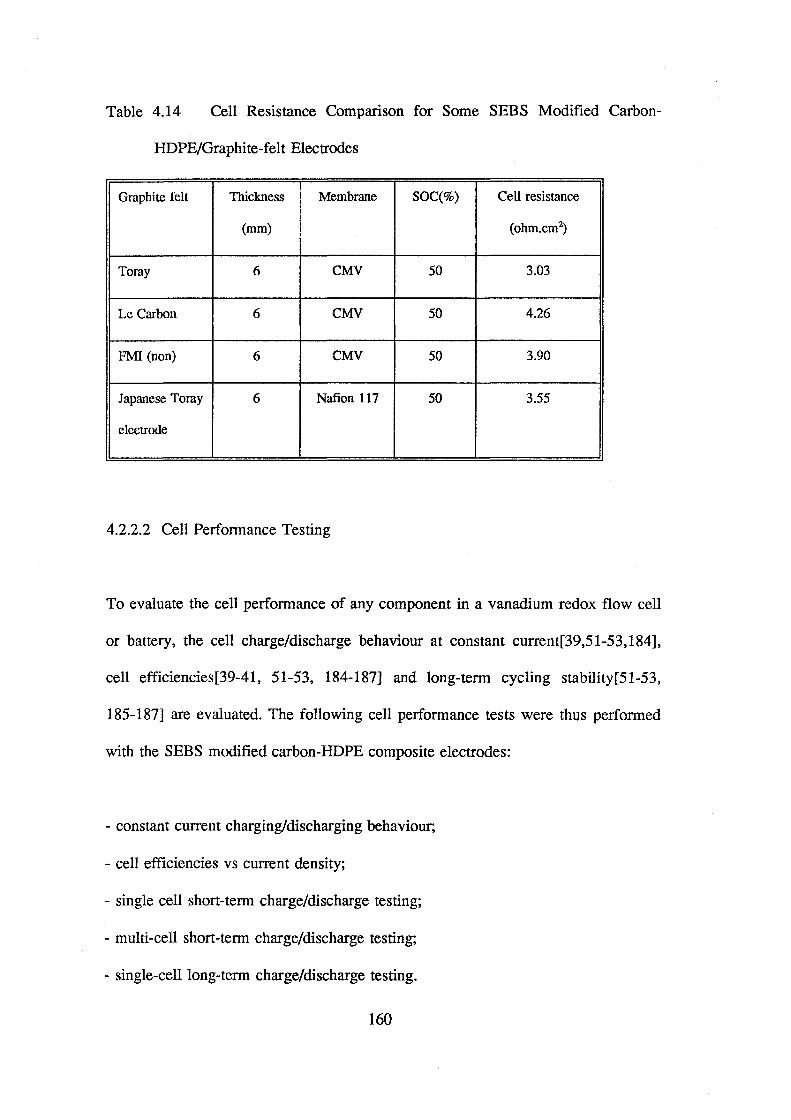
Table 4.14 Cell Resistance Comparison for Some SEBS Modified Carbon-
HDPE/Graphite-felt Electrodes
Graphite felt Thickness Membrane SOC(%) Cell resistance
(mm) (ohm.cm2)
Toray 6 CMV 50 3.03
Le Carbon 6 CMV 50 4.26
FMI (non) 6 CMV 50 3.90
Japanese Toray 6 Nafion 117 50 3.55
electrode
4.2.2.2 Cell Performance Testing
To evaluate the cell performance of any component in a vanadium redox flow cell
or battery, the cell charge/discharge behaviour at constant current[39,51-53,184],
cell efficiencies[39-41, 51-53, 184-187] and long-term cycling stability[51-53,
185-187] are evaluated. The following cell performance tests were thus performed
with the SEBS modified carbon-HDPE composite electrodes:
- constant current charging/discharging behaviour,
- cell efficiencies vs current density;
- single cell short-term charge/discharge testing;
- multi-cell short-term charge/discharge testing;
- single-cell long-term charge/discharge testing.
160
- electrode deterioration under overcharge conditions.
Constant Current Charging/Discharging Behaviour
Figure 4.16 shows the typical charge/discharge behaviour of the vanadium redox
cell with the SEBS modified carbon-plastic electrode at a charge/discharge current
density of 21.7 mA.cm-2• A piece of CMV membrane was employed as separator.
Average efficiency values were calculated from the recorded curves of the first
seven cycles. A coulombic efficiency of 96.5%, voltage efficiency of 89.4% and
energy efficiency of 86.0% were obtained respectively, indicating that the
composite electrode has good electrical conductivity and electrochemical activity.
The Effect of Current Density on Cell Efficiency
Figure 4.17 illustrates the effect of increasing charge/discharge current density on
the cell efficiencies for the composite electrodes. At the lower current densities,
the cell voltage and energy efficiency are very high with a columbic efficiency of
more than 95%. As expected, the cell voltage and energy efficiencies decrease
with increasing current density, due to increased IR losses, however, around 80%
energy efficiencies can still be obtained at a current density of 40 mNcm2• Further
optimisation of the electrode resistance and electroactivity of the felt, could
however reduce the cell resistance and further improve cell performance.
161

> 1.6 .. Cl)
0)
cd ......, 1.2 0
>
Cl)
0.8 0
Time,min
Figure 4.16 Typical charge/discharge curve of vanadium redox cell employing
SEBS modified carbon-HDPE composite electrode (matrix layer:
same as that for Fig. 4.11; active layer: Toray felt). ich. = idis. = 21.7
mNcm2; cell voltage up limit= 1.75 V, lower limit= 0.80 V.
162

110
o coulomblc b. vol tags o energ!d 105
,-., 100 N 0 ..._,.
-o-(/) 0 Q) 95 --
0 c Q)
0 90 ...,_ ...,_ Q) 85
Q)
80 A 0 0
75
70 10 20 30 40
current densith)CrrA/cm2)
Figure 4.17 Effect of current density on the cell efficiencies of a vanadium
redox flow cell employing SEBS modified carbon-HDPE composite
electrodes. Electrodes and other conditions same as that for Fig. 4.16.
163

Short-Term Cell Performance Test
Figures 4.18 and 4.19 show the short-term cell charge/discharge behaviour for the
SEBS modified carbon-HDPE composite electrode in both a single cell and in a
two-cell vanadium battery respectively. A piece of CMV membrane was used as
the separator, and a current density of 15 mA.cm-2 was applied for the single cell,
while two pieces of DMV membrane (Asahi Glass Co., Japan) were employed and
a current density of 30 mA.cm-2 was used for the two-cell battery. In both case,
fairly constant voltage efficiencies with slightly fluctuating coulombic and energy
efficiencies versus cycle number were observed. This indicates that the
electrochemical activity of the electrode and other cell components are very stable
in the vanadium redox flow battery.
It should be noted that the sharp drop in coulombic efficiency observed at cycle
number 62 in Figure 4.19 is due to the electrolytes crossing over through a
degraded membrane. This was corrected by inserting a new piece of membrane
which resulted in an increase in coulombic efficiency to around 90%.
Long-Term Stability Test
Longer-term testing of the electrochemical activity of the electrode was carried out
in a single cell by continuous charge/discharge cycling over 5780 hrs (1240
cycles) at a current density of 21.7 mA.cm-2• The results are shown in Figures
4.20(a) and (b). The voltage efficiency is relatively constant, decreasing by only
164

105~--------------------------------------------,
100
:J) (.) c Ol95 (.)
'+--'+--
Q)
-90 m (.)
85
o coulomblc t:.. vol tags o energy
0
o--o-_o--o--o--o--~ ~~0~ 0
8DL-----~----~------L-----~----~------~----~
30 40 50 60 70 80 90 100 qJC I e number
Figure 4.18 Short-term single cell performance of the composite electrodes of
Fig. 4.16. Other conditions same as that for Fig. 4.16.
165

100~------------------------------------------~
95 1:11
90 1
- 85 ~ 0 ......,
>- 80 (.) z w (.) 75 L!. L!. w 70
65
60
55 i
0 10 20 30 40 50 60 70 80 90 No. OF CYCLE
Figure 4.19 Short-tenn perfonnance of a two-cell vanadium redox battery with
the composite electrodes of Fig. 4.16. Curves 1: coulombic, 2:
voltage; 3, energy efficiencies. ich. = idis. = 30 mNcm2• Other
conditions same as that for Fig. 4.16.
166

5% over the 5780 hours of testing, showing the electrode is promising for
application in vanadium redox battery. The coulombic efficiency is seen to
fluctuate slightly, this being due to variation in the state-of-charge from cycle to
cycle caused by fluctuations in flow rate, and probably due to the temperatures
difference during day and night. A gradual decrease in the coulombic and energy
efficiencies versus cycle number is also observed and shown as region A and B in
Figure 4.20(a). This was found to be due to the degradation of the CMV
membrane used. Region A shows the first run of a piece of CMV membrane. At
the 178th cycle, a coulombic efficiency of lower than 75% was recorded,
indicating that the self-discharge of the cell was significant. After inserting a new
piece of CMV membrane, the coulombic and energy efficiencies recovered to their
original values, however, a similar trend appeared as recorded in region B. A
piece of modified Daramic membrane[l88,189] was therefore employed to replace
the CMV membrane for the subsequent cycling. Constant coulombic and energy
efficiencies were obtained with this membrane for the remaining duration of the
test. Thus, after removing the interfering effects of the membrane on the all
stability test, the Toray felt-SEBS modified composite electrode is seen to exhibit
excellent long-term activity in the vanadium redox cell.
Electrode Deterioration Test
Earlier tests with graphite positive electrodes in the vanadium redox cell have
shown that if oxygen evolution takes place in the positive half cell during
charging, mechanical degradation of the carbon can occur due to C02 formation.
167
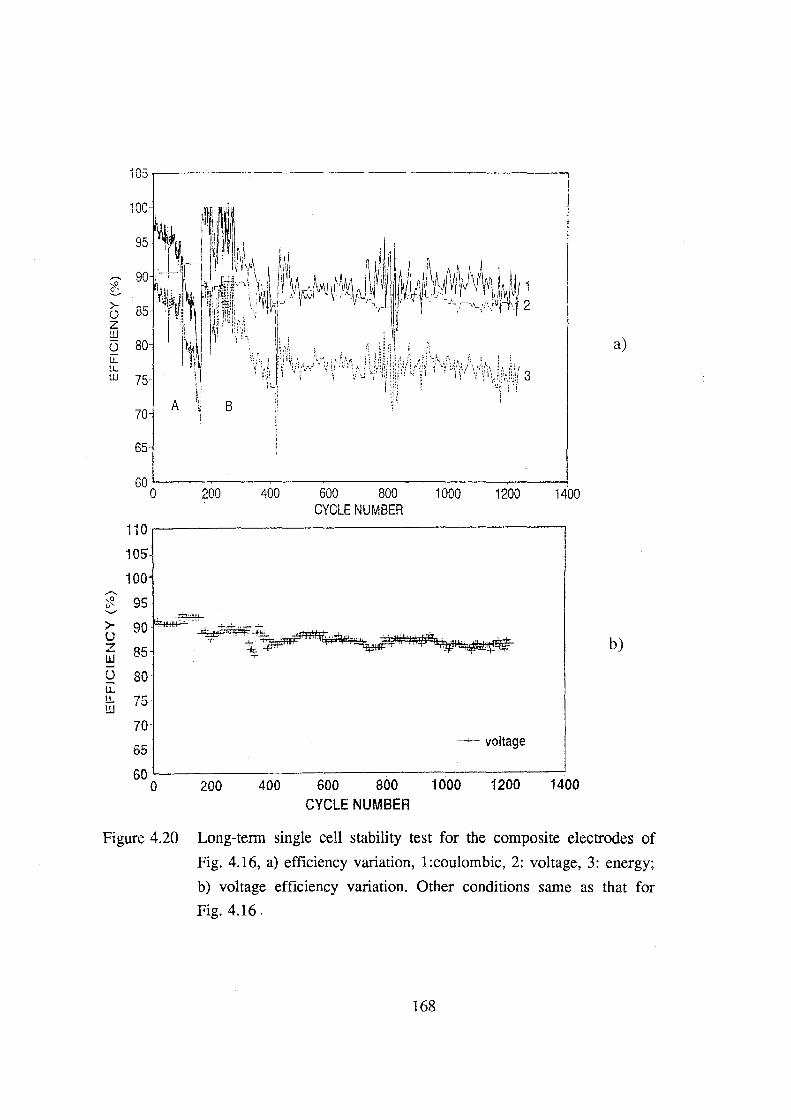
105.------------------------,
a)
65
60 0 200 400 600 800 1000 1200 1400
CYCLE NUMBER 110
105
iOO _...._ ,o o'- 95 "-"
>- 90 u b) z 85 UJ u 80 u. !.L 75 w
70
65 --~--- voltage
60 0 200 400 600 800 1000 1200 1400
CYCLE NUMBER
Figure 4.20 Long-term single cell stability test for the composite electrodes of
Fig. 4.16, a) efficiency variation, 1 :coulombic, 2: voltage, 3: energy;
b) voltage efficiency variation. Other conditions same as that for
Fig. 4.16.
168
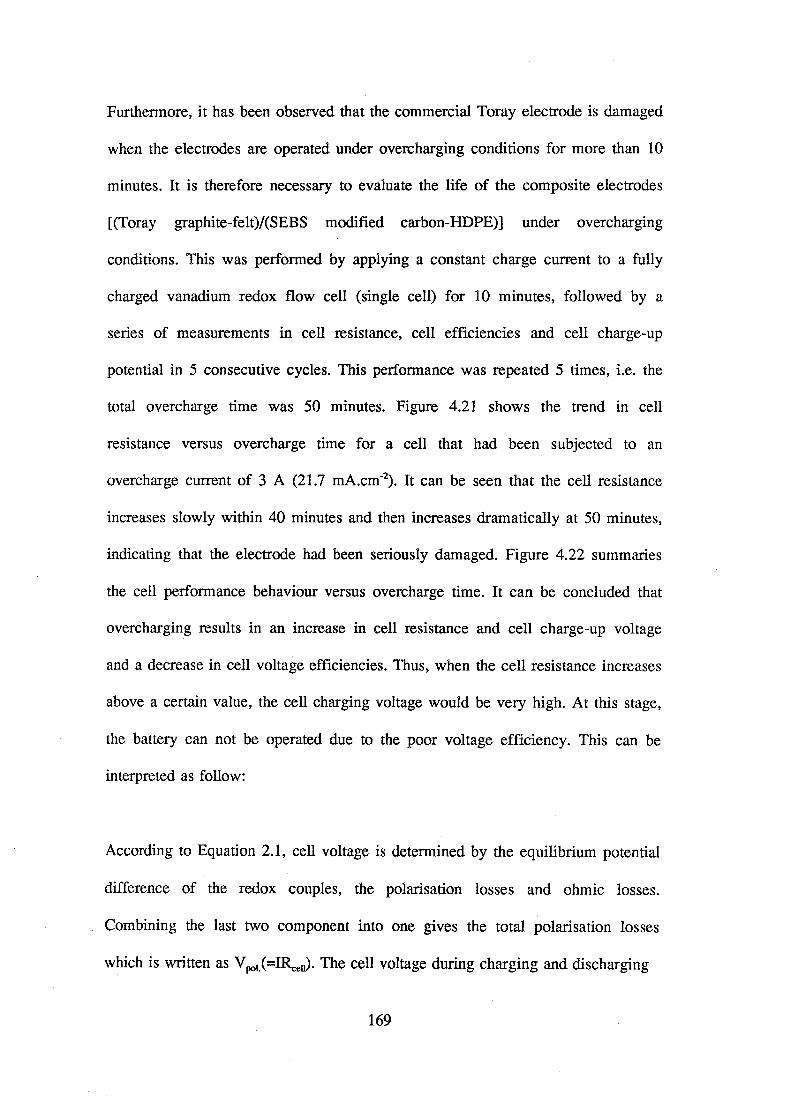
Furthermore, it has been observed that the commercial Toray electrode is damaged
when the electrodes are operated under overcharging conditions for more than 10
minutes. It is therefore necessary to evaluate the life of the composite electrodes
[(Toray graphite-felt)/(SEBS modified carbon-HDPE)] under overcharging
conditions. This was performed by applying a constant charge current to a fully
charged vanadium redox flow cell (single cell) for 10 minutes, followed by a
series of measurements in cell resistance, cell efficiencies and cell charge-up
potential in 5 consecutive cycles. This performance was repeated 5 times, i.e. the
total overcharge time was 50 minutes. Figure 4.21 shows the trend in cell
resistance versus overcharge time for a cell that had been subjected to an
overcharge current of 3 A (21.7 mA.cm-2). It can be seen that the cell resistance
increases slowly within 40 minutes and then increases dramatically at 50 minutes,
indicating that the electrode had been seriously damaged. Figure 4.22 summaries
the cell performance behaviour versus overcharge time. It can be concluded that
overcharging results in an increase in cell resistance and cell charge-up voltage
and a decrease in cell voltage efficiencies. Thus, when the cell resistance increases
above a certain value, the cell charging voltage would be very high. At this stage,
the battery can not be operated due to the poor voltage efficiency. This can be
interpreted as follow:
According to Equation 2.1, cell voltage is determined by the equilibrium potential
difference of the redox couples, the polarisation losses and ohmic losses.
Combining the last two component into one gives the total polarisation losses
which is written as V pot.(=IRce11). The cell voltage during charging and discharging
169

80
o charging D. discharging r-. 70 ru
E 0 . 60 E ..c 0 ..._.,
50 . rn 0
a 40 -1,-1
(f)
(f) 30 rn L
rn 20 0
10 0 6- o- ~'"-'
0 0 10 20 30 40 50 60
overcharging time. Cmin)
Figure 4.21 Effect of overcharging time on cell resistance of vanadium redox
flow cell with the (Toray felt)/(SEBS modified carbon-HDPE)
composite electrodes .
170
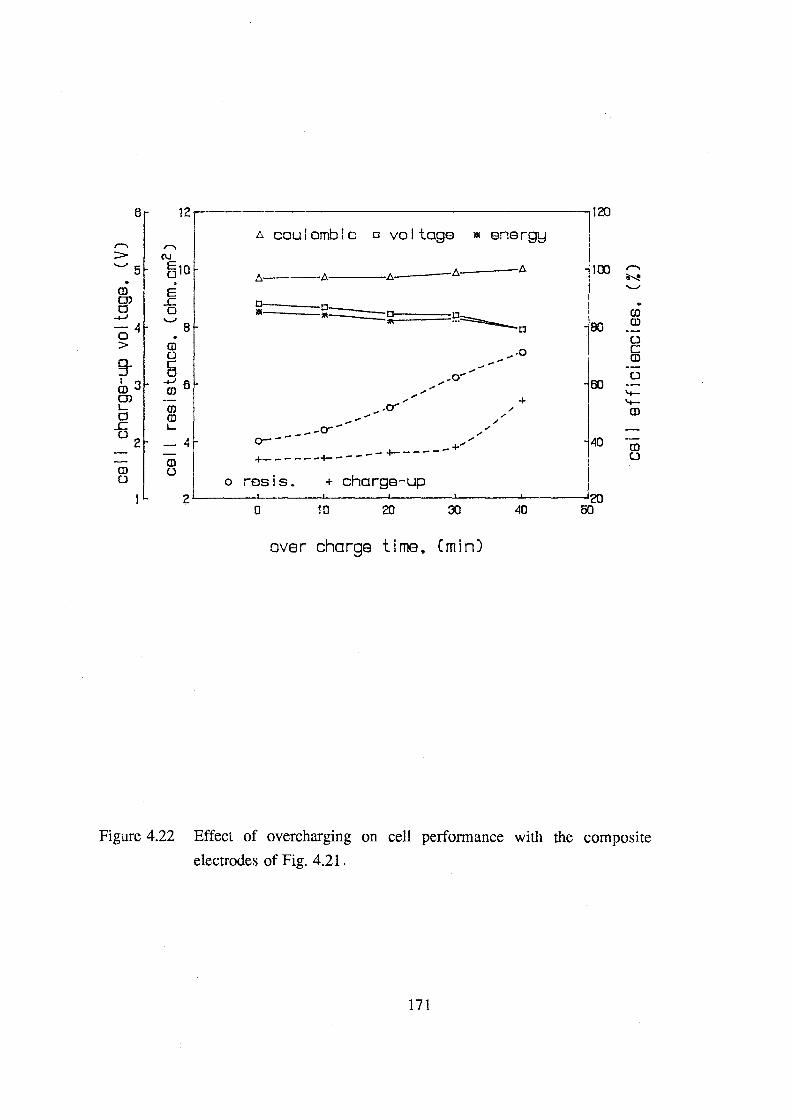
6 12 120
A coulombic D voltage liE ener9tJ ,--.. ,..... > (\J
...._,5 E10 A A 100 ,--.. 0 A A A N . . ..........
CD E 0) ..c D D- . 0 0 liE lit -o
~==----rn ...... ......... Q) -4 8 D 80 ·-0 . D > (]) ... o c
0 Q)
§- a _,. .. .o-- tJ io3 -+Jfl .. .. 60 (f) .. .. '+-0) .. + '+-L (f) _..0"" / Q) 0 (]) / .. / ..c L
o----- --0""'- /
02 /
-4 / 40 -+'" Q) +- - - - - _.._. - - - - - +- - - - - D
(]) Q) 0
charge-up 0 0 res is. + 2 20
0 10 20 30 40 50
over charge time. Cmin)
Figure 4.22 Effect of overcharging on cell performance with the composite
electrodes of Fig. 4.21.
171
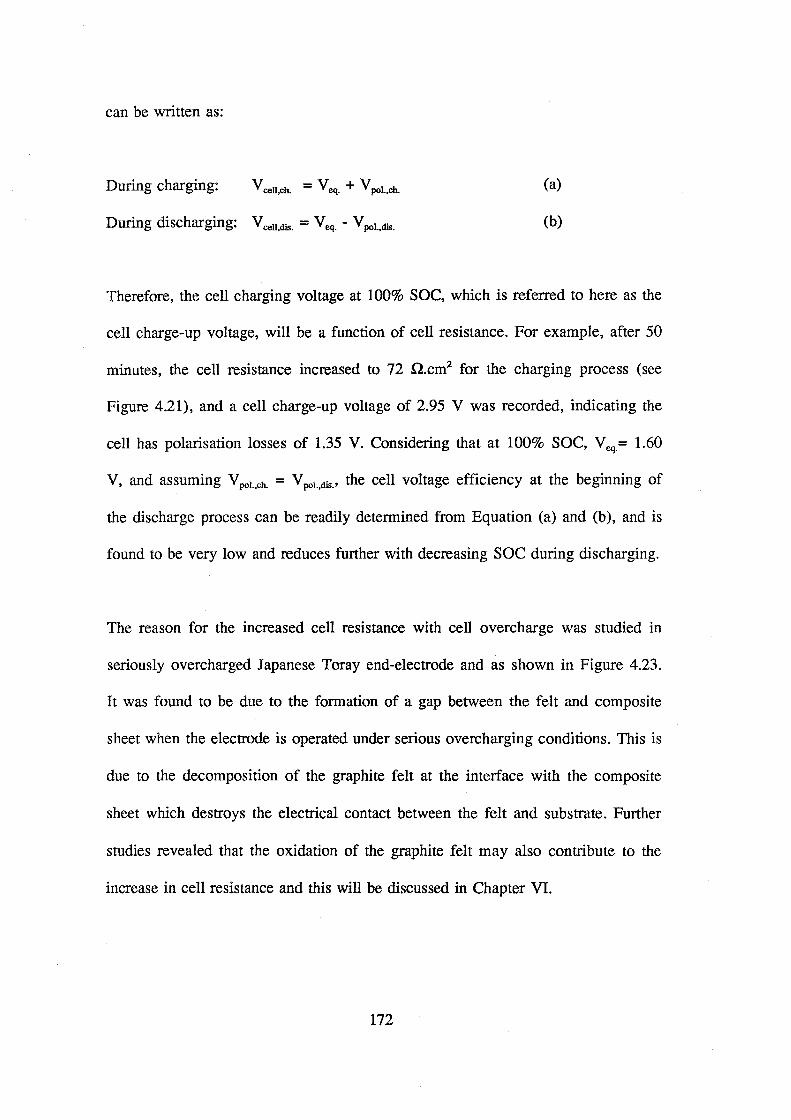
can be written as:
During charging: V =V +V cell,ch. eq. pol.,ch. (a)
During discharging: V 11 dis = V - V 1 dis ce ' . eq. po ., . (b)
Therefore, the cell charging voltage at 100% SOC, which is referred to here as the
cell charge-up voltage, will be a function of cell resistance. For example, after 50
minutes, the cell resistance increased to 72 n.cm2 for the charging process (see
Figure 4.21), and a cell charge-up voltage of 2.95 V was recorded, indicating the
cell has polarisation losses of 1.35 V. Considering that at 100% SOC, Veq.= 1.60
V, and assuming V poi.,ch. = V poi.,dis.• the cell voltage efficiency at the beginning of
the discharge process can be readily determined from Equation (a) and (b), and is
found to be very low and reduces further with decreasing SOC during discharging.
The reason for the increased cell resistance with cell overcharge was studied in
seriously overcharged Japanese Toray end-electrode and as shown in Figure 4.23.
It was found to be due to the formation of a gap between the felt and composite
sheet when the electrode is operated under serious overcharging conditions. This is
due to the decomposition of the graphite felt at the interface with the composite
sheet which destroys the electrical contact between the felt and substrate. Further
studies revealed that the oxidation of the graphite felt may also contribute to the
increase in cell resistance and this will be discussed in Chapter VI.
172
conducting ,boundary plastic layer
of
a)
b)
Figure 4.23 Cross section of Japanese Toray composite end-electrode.
Magnification: 20x. a) normal electrode; b) after seriously
overcharged
173

This problem can be readily solved by a suitable controller in which an
appropriate upper limit in cell voltage can be set and the battery system can be
operated within the safe range to eliminate any risk of electrode degradation.
The composite electrodes fabricated in this project have however been shown to
be more stable than the Japanese Toray electrodes under overcharge conditions in
the vanadium cell since the overcharge time which can be tolerated by these
electrodes is much higher than that which leads to a destruction of the Japanese
ones. These electrodes are thus superior to the commercial electrodes for
application in the vanadium redox battery.
4.3 SUMMARY
1. LDPE based carbon-plastic composite materials show promising electrical and
electrochemical properties, however, the mechanical properties are not satisfactory
as electrode matrix layer for redox flow cell applications.
2. Carbon-HDPE composite material modified with SEBS thermo-plastic rubber,
has been shown to have good electrical and mechanical properties, as well as
being impermeable to the acidic vanadium electrolyte.
3. By hot pressing a graphite felt and a metal mesh on either side, conducting
plastic electrodes can be fabricated for use in the vanadium redox cell. The
174

electrical and cell resistances values measured for these electrodes is comparable
to those of the Japanese conductive plastic felt electrodes.
4. An overall energy efficiency of 88% can be achieved with this electrode in cell
charge/discharge testing. Long-term charge/discharge testing was conducted over
more than 5780 hours (1240 cycles) and the SEBS modified carbon-HDPE
composite was shown to be stable and is thus a reliable electrode matrix material
for the vanadium redox battery.
175

CHAPTERV
ELECTRODE KINETICS AND ACTIVATION STUDIES
5.1 Electrode Kinetics of V(V)/V(IV) and V(III)/V(ll) Couples at Graphite
Electrode
Graphite felt bonded onto a carbon-plastic composite substrate has been shown to
be an excellent electrode for the vanadium redox flow battery application. In
Chapter 4, the electrochemical behaviour of this electrode was characterised by the
cell polarisation behaviour, cell resistance, cell efficiency and cycling stability.
Even though these parameters indicate the operational characteristics of the
electrode in the vanadium redox cell, they are not able to give kinetic information
on the electrode and redox couples. A better understanding of the electrochemical
behaviour of the redox system at a selected electrode would lead to a more
effective strategy for improving the electron transfer rate of the system. It is
therefore necessary to undertake further electrochemical studies of an individual
electrode rather than with the entire battery. As described previously, the carbon
plastic composite material was used as the electrode matrix layer and graphite
fibre based felt materials as the surface active layer at which the redox reactions
take place. Graphite is therefore considered as the electrode material. For the all
vanadium battery, the redox couple for the positive half cell is V(V)N(IV) while
the negative is V(ill)N(ID. The present investigation thus concentrated on the
electrode behaviour of the vanadium redox couples at graphite electrodes. In
particular, a more intensive study was first carried out on establishing the
176
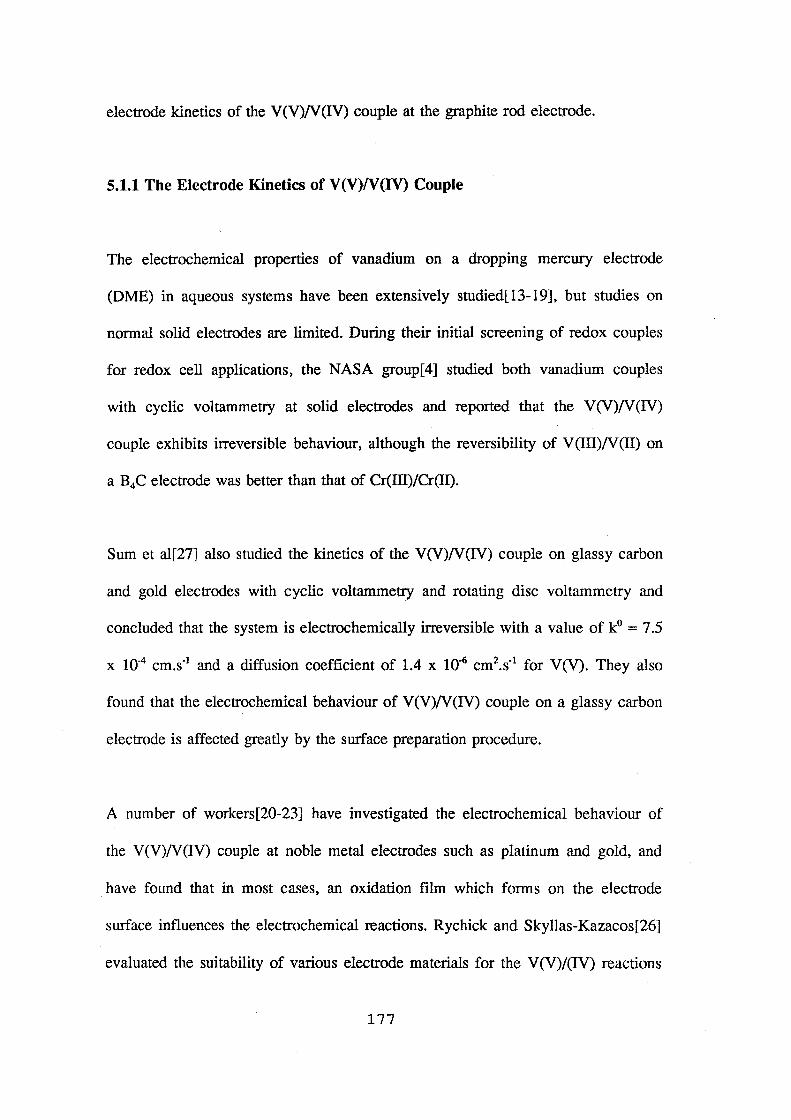
electrode kinetics of the V(V)N(IV) couple at the graphite rod electrode.
5.1.1 The Electrode Kinetics of V(V)/V(IV) Couple
The electrochemical properties of vanadium on a dropping mercury electrode
(DME) in aqueous systems have been extensively studied[13-19], but studies on
normal solid electrodes are limited. During their initial screening of redox couples
for redox cell applications, the NASA group[4] studied both vanadium couples
with cyclic voltammetry at solid electrodes and reported that the V(V)N(IV)
couple exhibits irreversible behaviour, although the reversibility of V(Ill)N(II) on
a B4C electrode was better than that of Cr(III)/Cr(II).
Sum et al[27] also studied the kinetics of the V(V)N(IV) couple on glassy carbon
and gold electrodes with cyclic voltammetry and rotating disc voltammetry and
concluded that the system is electrochemically irreversible with a value of k0 = 7.5
x 10-4 cm.s-1 and a diffusion coefficient of 1.4 x 10⁻⁶ cm2.s-1 for V(V). They also
found that the electrochemical behaviour of V(V)N(IV) couple on a glassy carbon
electrode is affected greatly by the surface preparation procedure.
A number of workers[20-23] have investigated the electrochemical behaviour of
the V (V)N (IV) couple at noble metal electrodes such as platinum and gold, and
have found that in most cases, an oxidation film which forms on the electrode
surface influences the electrochemical reactions. Rychick and Skyllas-Kazacos[26]
evaluated the suitability of various electrode materials for the V (V)/(IV) reactions
177

and indicated that on gold and glassy carbon electrodes, the redox reactions are
irreversible, while on the lead and titanium electrodes, passivating phenomena
were observed in the potential range of interest. Although platinised titanium and
DSA (Dimensional Stable Anode) electrodes have no such problem and showed
better reversibility, the high cost of these materials would be prohibitive for large
scale applications in the vanadium battery.
As pointed out by Miller and Zittle[23], at a pyrolytic graphite electrode, cathodic
voltammograms were reproducible and there was no evidence that the surface of
the electrode was oxidised by contact with V(V), which means this material is
suitable for studying the electrochemical behaviour of the V(V)N(N) redox
couple.
Since graphite felt is employed as the surface active layer of the electrode in both
the positive and negative sides of the vanadium redox battery, it is desirable to
establish the electrode kinetics of V(V)N(N) redox reactions at the graphite
electrode. Kinetic studies were thus performed here using both cyclic voltammetry
and rotating disc voltammetry. The diffusion coefficient for V(IV) and the elec
trode kinetic parameters were calculated and the equilibrium exchange current
density values for the V(V)N(N) couple were determined for graphite felt and
reticulated vitreous carbon electrodes. The experimental procedure for the
electrode kinetic study was described in detail in 3.2.1.
178

5.1.1.1 Reproducibility of Electrode Surface Preparation
Sum et al[27] previously reported that the electrode surface preparation procedure
has a critical effect on the electrode kinetics of the vanadium redox couples at a
glassy carbon electrode. The reproducibility of the surface preparation procedure
on the behaviour of the graphite electrode was thus f'rrst tested. Figure 5.l(a)
shows three anodic voltammograms obtained after successively repolishing the
graphite electrode surface using the procedure described in section 3.2.1.1. All the
curves recorded represent the f'rrst sweep after polishing and show that the
reproducibility obtained at the graphite electrode surface is much better than that
of the glassy carbon surface[27,42]. Figure 5.l(b) shows the cyclic stability of the
graphite electrode from the 1st to the lOth cycle over the potential range of 0 to
+ 1.10 V. Apart from the f'rrst cycle, only a slight variation can be observed among
the remaining voltammograms showing that the graphite electrode is a suitable
working electrode for studying the electrochemical behaviour of the V (V)N (IV)
redox couple.
5.1.1.2 Cyclic Voltammetry
A series of cyclic voltammograms corresponding to the V(V)N(IV) redox couple
at the graphite electrode at various sweep rates in 0.05 M V(IV) + 0.05 M V(V)
sulphate in 3 M H2S04 solution is shown in Figure 5.2(a) for the potential range
-0.504 V to +0.90 V. Four peaks (marked A,B,C and D) are observed in each
cyclic voltammogram indicating that besides the expected V(V)N(IV) redox
179
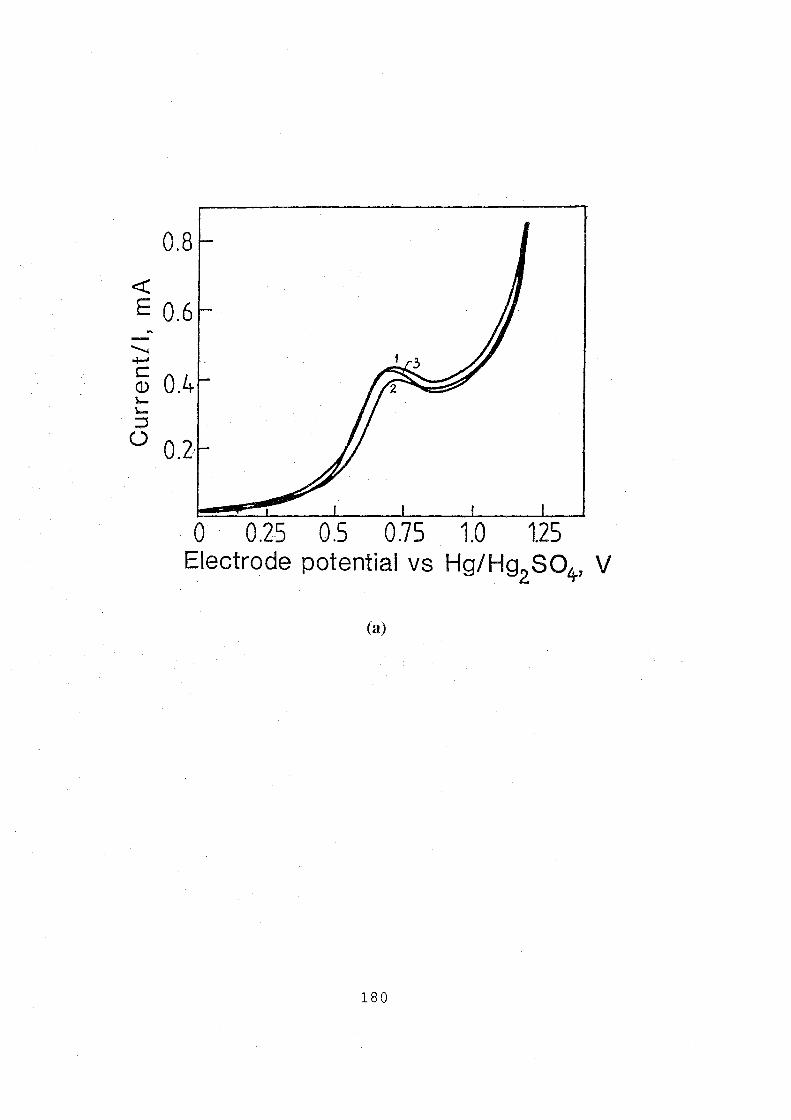
0.8
<(
E 0.6
. 0 0.25 0.5 0.75 1.0 1.25 Electrode potential vs Hg/Hg
2S04, V
(a)
180

.. -
0.6
0 0.25 0.5 075 1.0 Electrode potential vs Hg/Hgz.S04 , V
(b)
Figure 5.1 Cyclic voltammograms for graphite electrode in 0.1 M
VOSOJ3 M H2S04 solution, sweep rate: 10 mV s4 . (a) anodic
voltammograms for testing reproducibility of surface preparation;
(b) cyclic voltammograms for testing the cyclic stability, 1 st to 10 th cycles.
181

reactions, there are some other electrochemical processes taking place during
scanning. Comparing the cyclic voltammograms obtained at the same graphite
electrode in 3 M H2S04 under the same experimental conditions shown in Figure
5.2(b), it can be seen that over this potential range in the dilute vanadium solution,
several peaks associated with the carbon-oxygen surface reactions are interfering
with the vanadium reactions. When the potential is limited between 0 and 0.9 V
however, the voltammograms of Figure 5.3 were obtained, showing that
interference from carbon-oxygen surface reactions is minimised.
5.1.1.3 Rotating Disc Voltammetry
For further details of the electrode kinetics of V(V)N(IV) on the graphite disc
electrode, cathodic and anodic voltametric experiments were also performed with a
rotating graphite disc electrode in the same solution used for Figure 5.2(a) and
5.3. A potential sweep rate of 1 mV.s-1 was employed and the electrode rotation
speed was varied from 60 rpm to 2400 rpm. The current versus overpotential
curves recorded in Figure 5.4(a) and 5.4(b) show that at each rotation speed,
cathodic and anodic limiting currents are observed, the magnitude increasing with
electrode rotation speed, indicating that under these conditions, the electrode
processes become mass transfer controlled[l79].
The 11-i curves also show that the cathodic and anodic electrode processes are
quite different. Thus, in the anodic voltammograms, there is only one wave corres
ponding to V(IV) being oxidised to V(V), while the cathodic voltammograms are
182
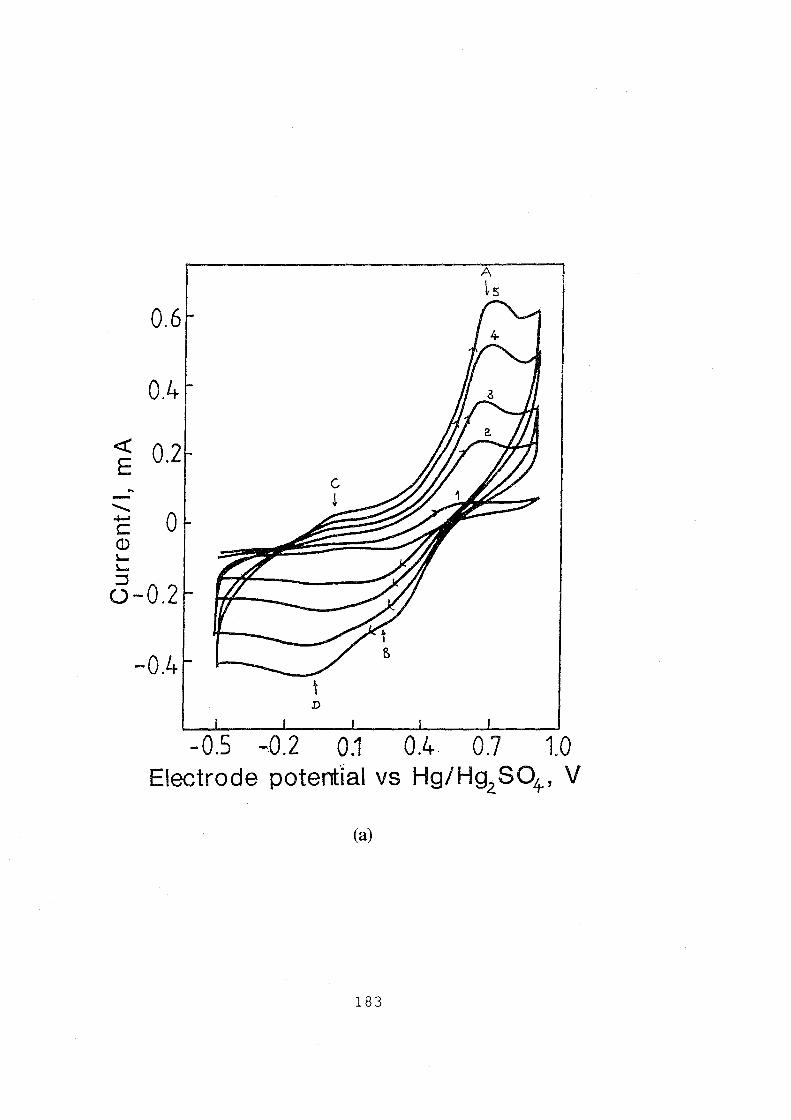
... -......... c 0 (1) lolo-
::J o-0.2
-0.4
' .D
A
~5
-0.2 0.1 0.4 0.7 1.0 Electrode potenflal vs Hg/Hg2S04-, V
(a)
183
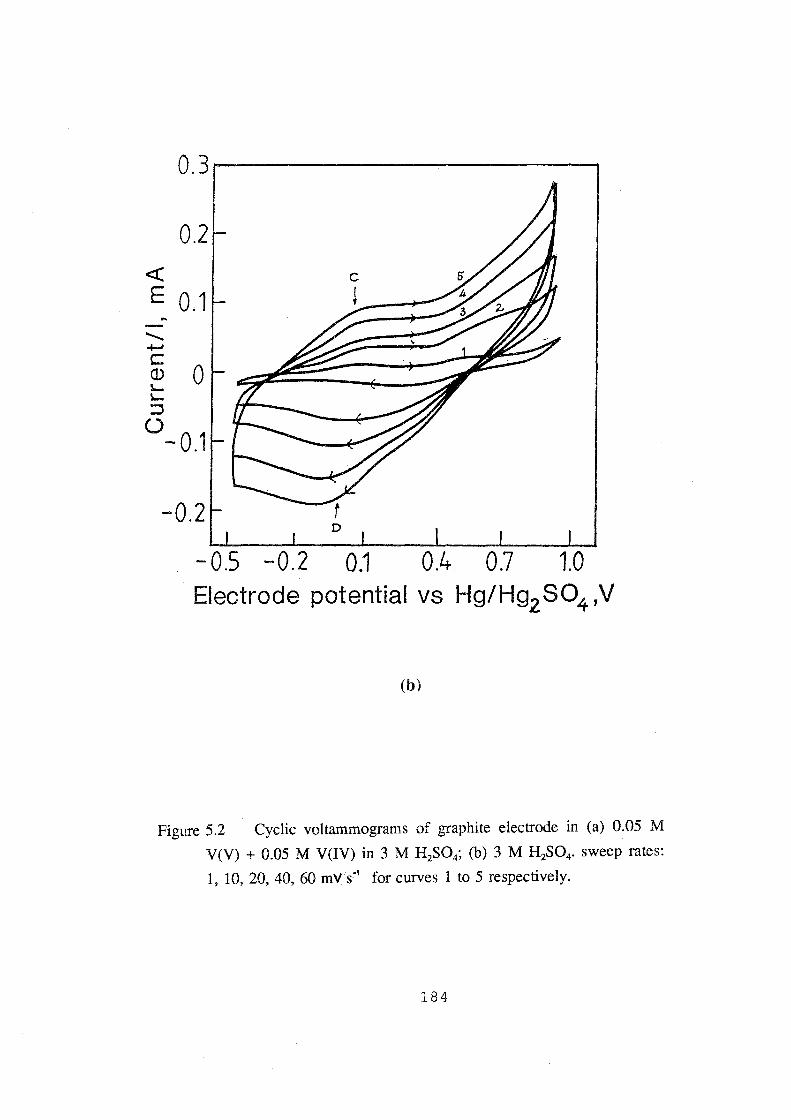
<(
E --
0.3r---------------1
0.1 0.4 0.7 1.0 Electrode potential vs Hg/Hg2S04 ,V
(b)
Figure 5.2 Cyclic voltammograms of graphite electrode in (a) 0.05 M
V(V) + 0.05 M V(IV) in 3 M H2S04; (b) 3 M H2S04• sweep rates:
1, 10, 20, 40, 60 mV. s·1 for curves 1 to 5 respectively.
184
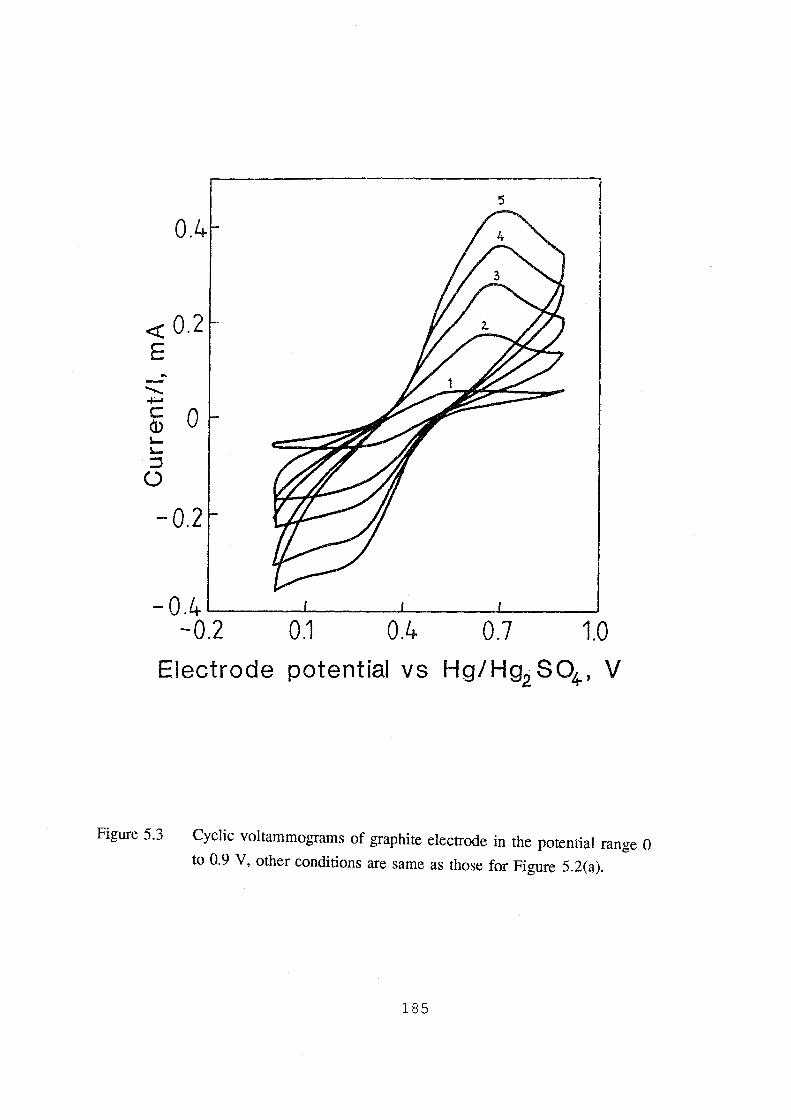
0.4
<( 0.2 E
- 0.4 L_ _ __J __ __!_ __ ---'-----J
-0.2 0.1 0.4 0.7 1.0
Electrode potential vs Hg/Hg2 804 , V
Figure 5.3 Cyclic voltammograms of graphite electrode in the potential range 0
to 0.9 V, other conditions are same as those for Figure 5.2(a).
185

more drawn out, suggesting at least two reactions are involved. This indicates that
besides the main V(V) species, other species such as V(V)-SOl- complexes[190]
or carbon-oxygen surface complexes[lOl] (see Figure 5.2(b)) are reduced within
this potential range during cathodic scanning.
Figure 5.4(b) shows the cathodic and anodic voltammograms obtained at electrode
rotation speeds ranging from 1200 rpm to 2400 rpm. Unlike the curves obtained at
the lower rotation speeds, the 3 pairs of rt-i curves are very close, particularly, in
the anodic branch, the curve obtained at 2400 rpm is almost the same as the one
at 1800 rpm, indicating that at sufficiently high rotation speeds, the electrode
process is no longer diffusion controlled but becomes kinetically complicated.
5 .1.1.4 Diffusion Coefficient
The diffusion coefficient for the V (IV) reactive species was determined from the
Levich equation:
(5-1)
where iL is limiting current density (A.cm-2); n, the number of electrons
participating in the reaction; D, the diffusivity of reactive species (cm2.s-1); v, the
186
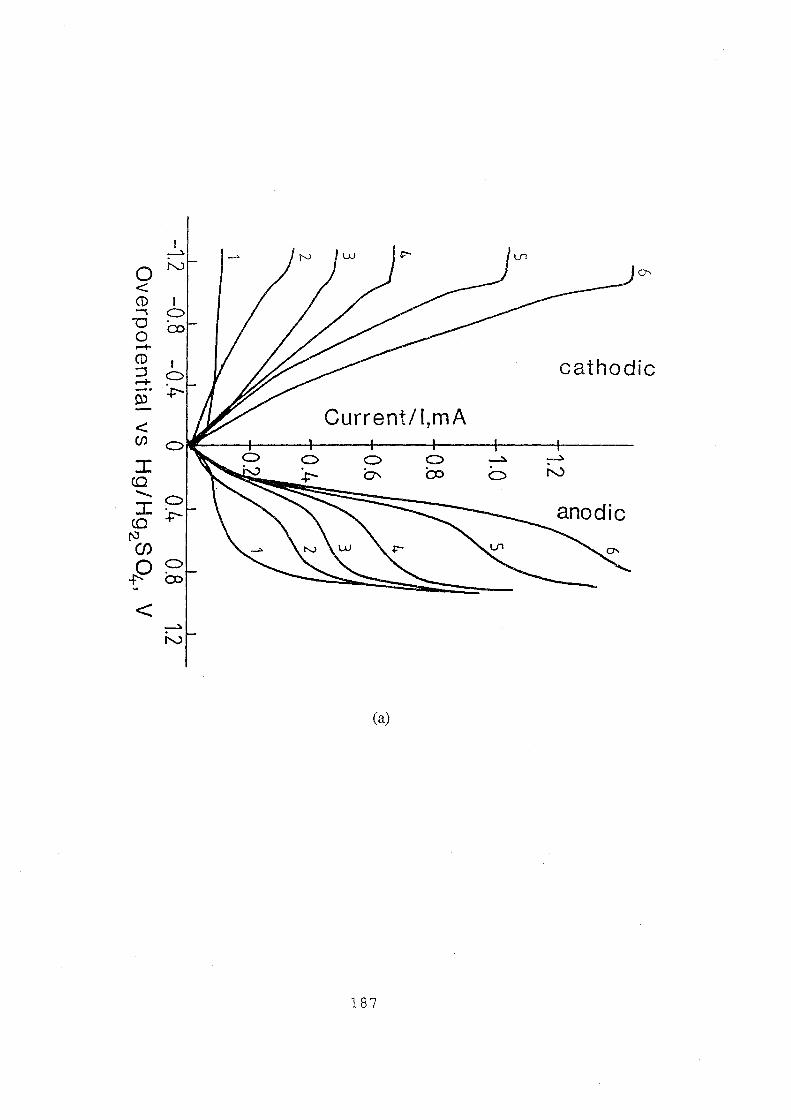
0:>
< en :c (Q
..........
:c (Q
r\J (f)
p <
cathodic
(a)
187
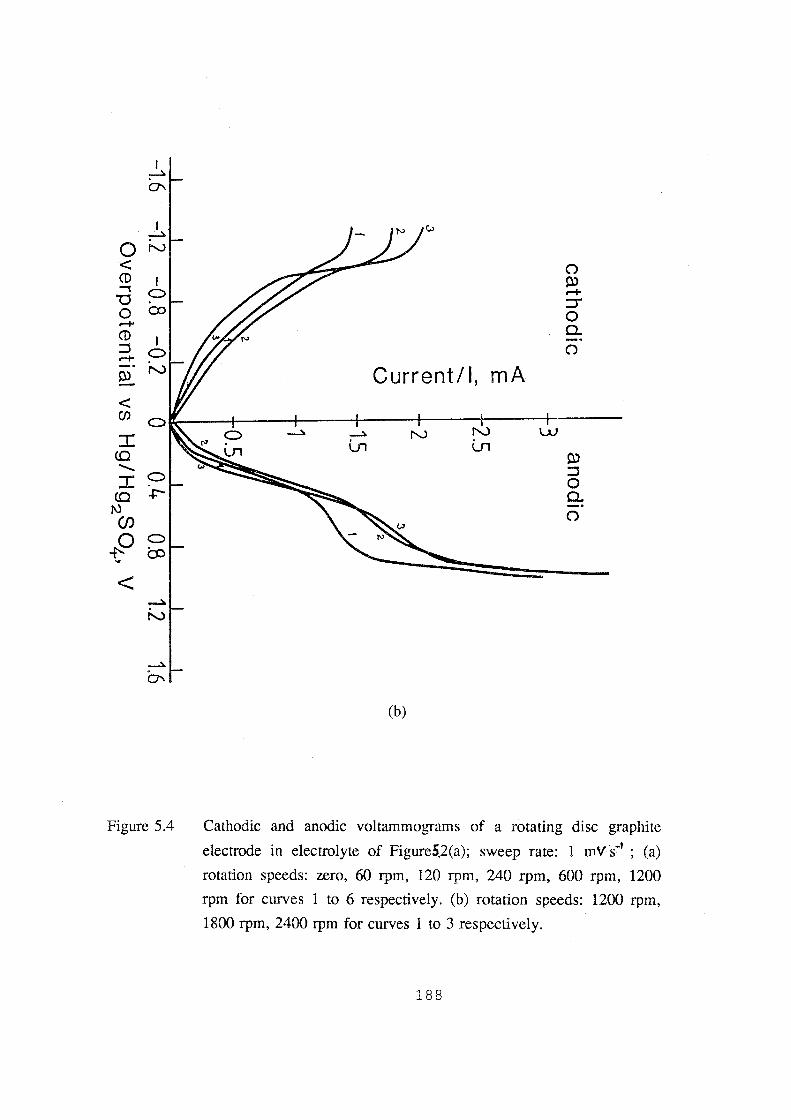
I ~
a-
I ~
0 "-' < <D ""'1
'"0 0 co ....... <D :J ....... 0:>
< (j)
I {Q ........ I
{Q 1\) (j)
~0 ~
< N
Figure 5.4
0 0:> ....... ::J"' 0 c.. 0
Current/!, rnA
LU Vl
0:> :J 0 c.. 0
(b)
Cathodic and anodic voltammograms of a rotating disc graphite
electrode in electrolyte of Figure5.2(a); sweep rate: 1 mV s:-1 ; (a)
rotation speeds: zero, 60 rpm, 120 rpm, 240 rpm, 600 rpm, 1200
rpm for curves 1 to 6 respectively. (b) rotation speeds: 1200 rpm,
1800 rpm, 2400 rpm for curves 1 to 3 respectively.
188

viscosity of electrolyte (cm2.s-1), ro, the angular velocity of rotation (s-1
) and Cb,
the concentration of reactive species in the bulk electrolyte (mol.cm-3).
A summary of limiting currents and the corresponding angular velocity obtained
directly from Figure 5.4(a) and 5.4(b) is given in Table 5.1. To avoid introducing
errors caused from the interference of other cathodic reactions discussed above,
only the anodic curves were analysed. Plotting the square root of angular speed
versus anodic limiting current density, yields the straight lines of Figure 5.5,
indicating that up to an electrode rotation speed of 1800 rpm, the V (IV) oxidation
reaction obeys the Levich equation. From the slope of the straight lines, the
diffusion coefficient for V(IV) was calculated as 2.00 x 10·6 cm2.s·1•
Table 5.1, Summary of Limiting Current Density versus Angular Velocity for the
V (IV) Oxidation Reaction
(1)112[ (s·l ))112 i1 c(A.cm-2)x 103 i18(A.cm·2)xl03
2.51 3.44 3.44
3.54 5.00 4.69
5.01 6.88 6.46
7.93 10.83 10.21
11.21 15.10 14.06
13.73 18.23 17.19
15.85 20.83 18.23
189
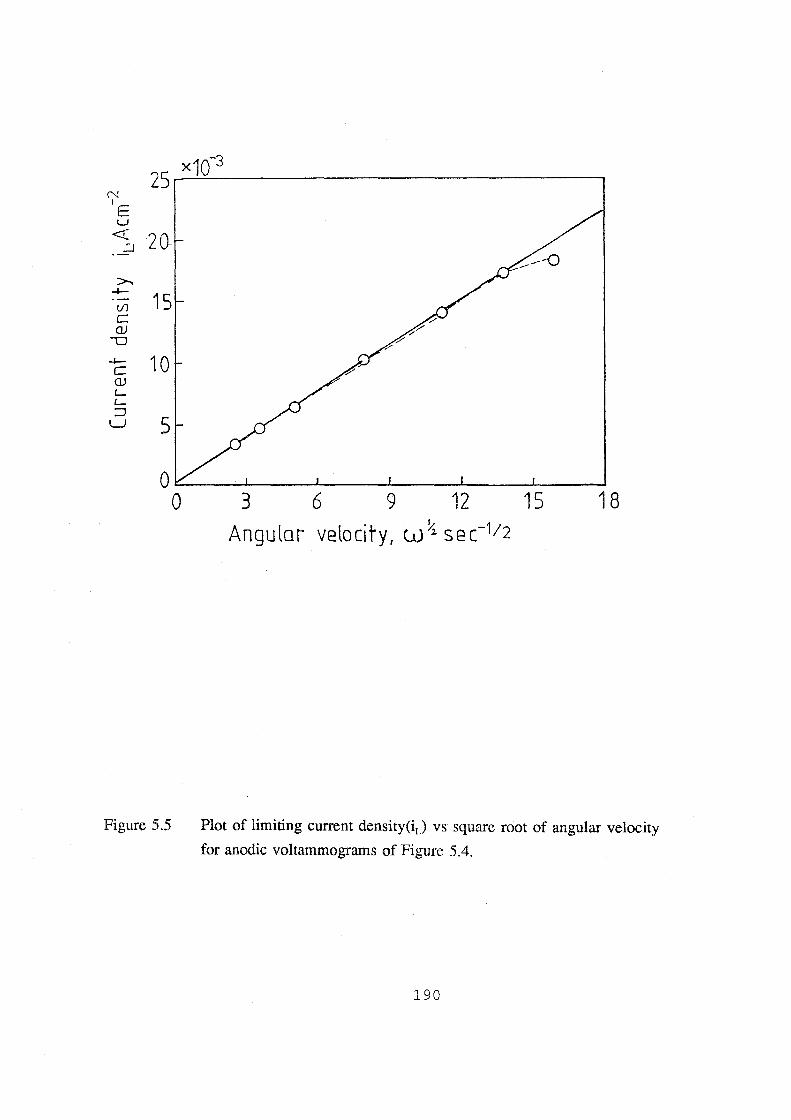
2S~x~1~0_3 __________________________ ~
>-. 4-
tn c QJ
w
c 10 QJ L.. L.. ::J
LJ 5
Angular velocity, w~ sec-112
Figure 5.5 Plot of limiting current density(iL) vs square root of angular velocity
for anodic voltammograms of Figure 5.4.
190

Rotating disc voltammograms were also obtained for a range of vanadium
concentrations. The concentration of VOS04 was varied from 0.01 to 0.5 M, and
electrode rotation speeds of 120, 360, 720 and 1080 rpm were employed. Figure
5.6 shows typical anodic voltammograms obtained in the 0.5 M VOS04 solution.
The anodic limiting current density was plotted versus the square root of angular
speed at each concentration and the results are shown in Figure 5.7(a). The anodic
limiting current density versus vanadium concentration was also plotted to yield
Figure 5.7(b). The linear relationship in both Figure 5.7(a) and 5.7(b) illustrates
that the V(IV) oxidation reaction at these concentrations obeys the Levich
equation. Plotting limiting current density over vanadium concentration versus
square root of angular velocity yields Figure 5.8. The diffusion coefficients were
determined from the slopes of the straight lines in Figure 5.8 and are shown in
Table 5.2. From the values, it can be concluded that in the concentration range
studied, the diffusion coefficient of V(IV) species is essentially constant with an
average value of D = 2.14 x 10·6 cm2.s·1•
Table 5.2, Diffusivity of V(IV) Species
Conc.of V(IV), mol.cm·3 Diffusivity, D(cm2.s-1)
0.01 X 10"3 2.46 X 10"6
0.05 X 10"3 2.00 X 10⁻⁶
0.25 X 10⁻³ 2.25 X 10"6
0.5 X 10"3 1.86 X 10"6
191

10 4
8 <(
E 6 ...
2 -.......... ~ (}.) 4 '!... '!... ::J 1 ()
2
Electrode potential vs Hg/Hg2SO~, V
Figure 5.6 Anodic rotating disc voltammograms at a graphite electrode in 0.5
M V(IV)/3 M H2S04 solution. rotation speeds: 120 rpm, 360 rpm,
720 rpm, 1080 rpm for curves 1 to 4 respectively.
192
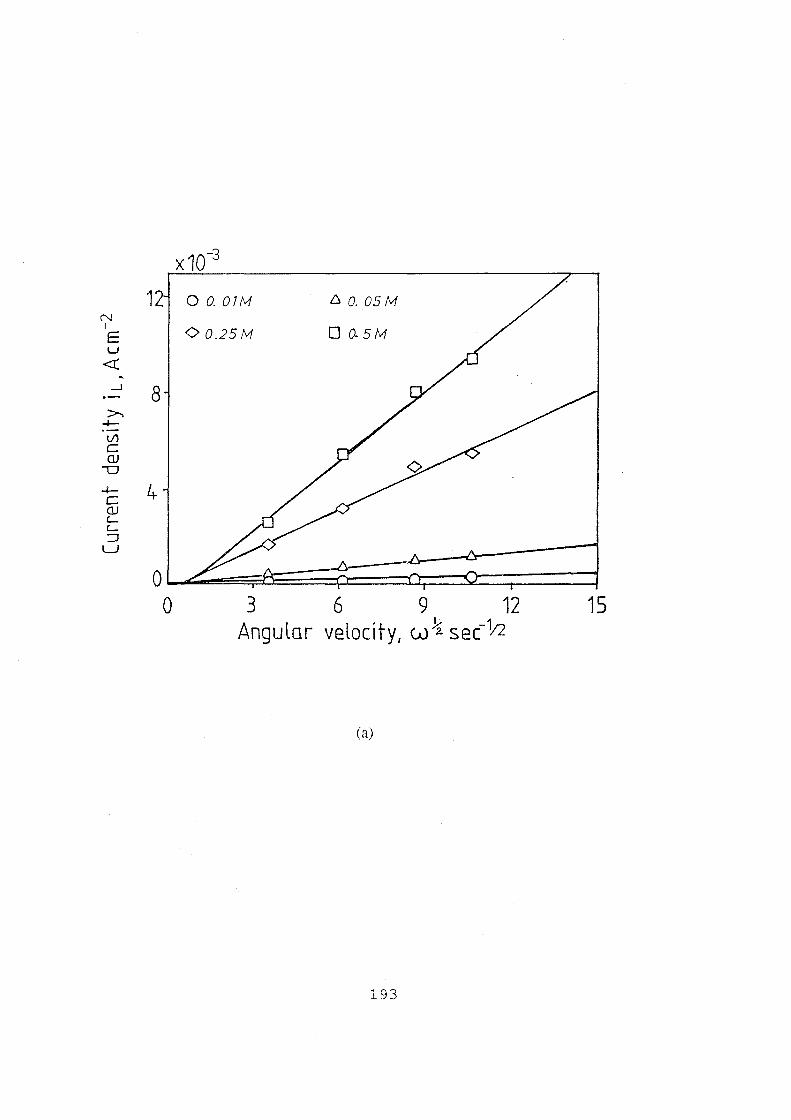
x10-3
1 00.07/Vf 6 0. 05 /Vf N I <> 0.25 /Vf 00-5/0 E u <( ..
_l
8 >..
-+-t/1 c:: OJ
"0
-+- 4 c OJ '-'-:=J
LJ
0 0 3 6 9 12 15
Angular velocity, w~ se(Y2
(a)
193

('l I
E u
<(._ ...1
>-. 4-
U")
c <lJ
-o 4-c <lJ '-'-:::J
L)
Figure 5.7
x10-3
12 rpm
6360 0 720 0 120
0 7080
8
4
0~--L---~------~------~~~ 0 0.2 0.4 0.6
Concentration V4 .. {M)
(b)
(a) Plot of limiting current density vs square root of angular
velocity at various vanadium concentrations; (b) Plot of limiting
current density vs vanadium concentration at various electrode rotation speeds.
194
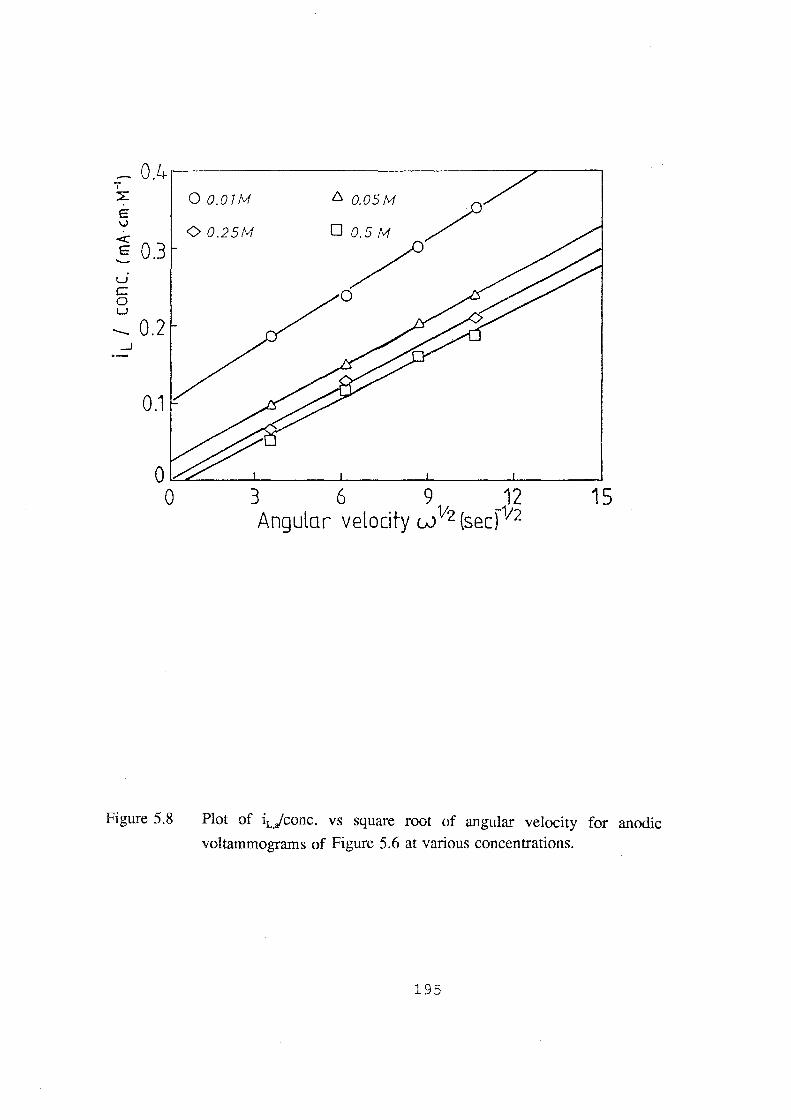
- 0.4 .----------------:;;;r------, I ~
E \)
<C E 0.3 u c: 0 u
- 0.2 _]
0.1
0 0.07/vf
<> 0.2510
6 0.0510 _/)
0 0.5/0 /
/ 0
o~~--L-----~----~----~----~ 0 3 6 9 12
Angular velocity w 112 (sec)1f2 15
Figure 5.8 Plot of iL.Jconc. vs square root of angular velocity for anodic
voltammograms of Figure 5.6 at various concentrations.
195
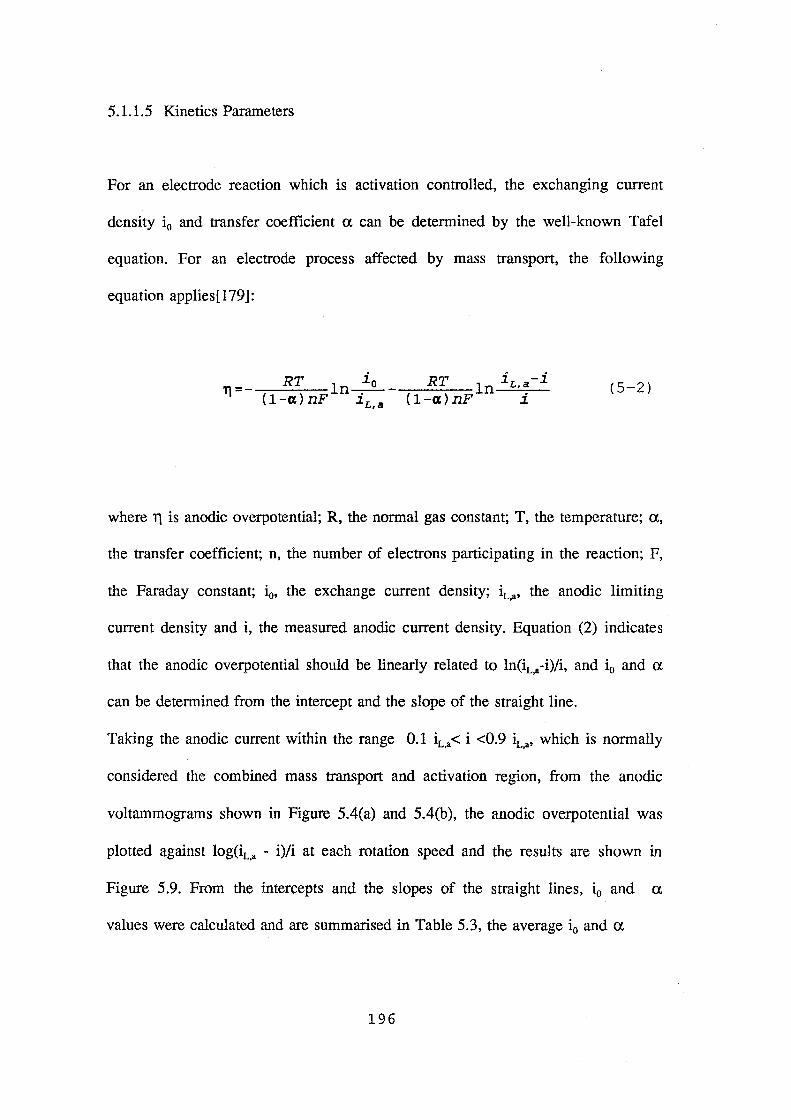
5.1.1.5 Kinetics Parameters
For an electrode reaction which is activation controlled, the exchanging current
density i0 and transfer coefficient a can be determined by the well-known Tafel
equation. For an electrode process affected by mass transport, the following
equation applies [ 179]:
T}=- RT ln .io - RT ln iL,a-i ( 1-a;) nF ~ L, a ( 1-a;) nF i
(5-2)
where 11 is anodic overpotential; R, the normal gas constant; T, the temperature; a,
the transfer coefficient; n, the number of electrons participating in the reaction; F,
the Faraday constant; i0, the exchange current density; iL,a• the anodic limiting
current density and i, the measured anodic current density. Equation (2) indicates
that the anodic overpotential should be linearly related to ln(iLa-i)1i, and i0 and a
can be determined from the intercept and the slope of the straight line.
Taking the anodic current within the range 0.1 iL,a< i <0.9 iL.a• which is normally
considered the combined mass transport and activation region, from the anodic
voltammograms shown in Figure 5.4(a) and 5.4(b), the anodic overpotential was
plotted against log(iL,a - i)/i at each rotation speed and the results are shown in
Figure 5.9. From the intercepts and the slopes of the straight lines, i0 and a
values were calculated and are summarised in Table 5.3, the average i0 and a
196

1.0
-> 0.8 d
4-c 0.6 OJ
4-0 Cl. C-
g;: 0.4 0 u
"'0 0 0.2 c
<(
0 -3
rpm * 600 + 7200
0 7800 0 2400
-2 -1 0 log(iL_a-i)/i
rpm 6 720
0240
1 2
Figure 5.9 Plot of anodic overpotential vs log(iL a - i)/i from voltammograms of
Figure 5.4
197

Table 5.3, The Kinetic Parameters of V(V)N(IV) Couple
electrode rotation transfer coefficient, exchange current
speed, rpm a density ,io(A.cm "2)
60 0.73 1.18 X 10⁻⁴
120 0.70 2.09 x 10⁻⁴
240 0.70 2.67 x 10⁻⁴
600 0.72 2.71 X 10⁻⁴
1200 0.71 2.84 x 10⁻⁴
1800 0.72 4.18 x 10⁻⁴
2400 0.71 1.61 x 10⁻⁴
values being 2.47 x 10⁻⁴ A.cm-2 and 0.71 respectively. The low value of the
exchange current density shows that the electron transfer rate of V(V)N(IV)
couple at the graphite electrode is slow, while the a value indicates the asymmetry
in the activation energy peak for this electrochemical system. The low value of i0
could also be associated with a low effective surface area for the electrode
reactions at the graphite electrode. In the practical cells and batteries, these
problems are overcome by using a high surface area graphite felt[44] to replace
the flat graphite plate.
Figure 5.10 shows the cathodic and anodic voltammograms at graphite felt and
reticulated vitreous carbon electrodes in the 1.0 M V(IV) + 1.0 M V(V) (50%
198
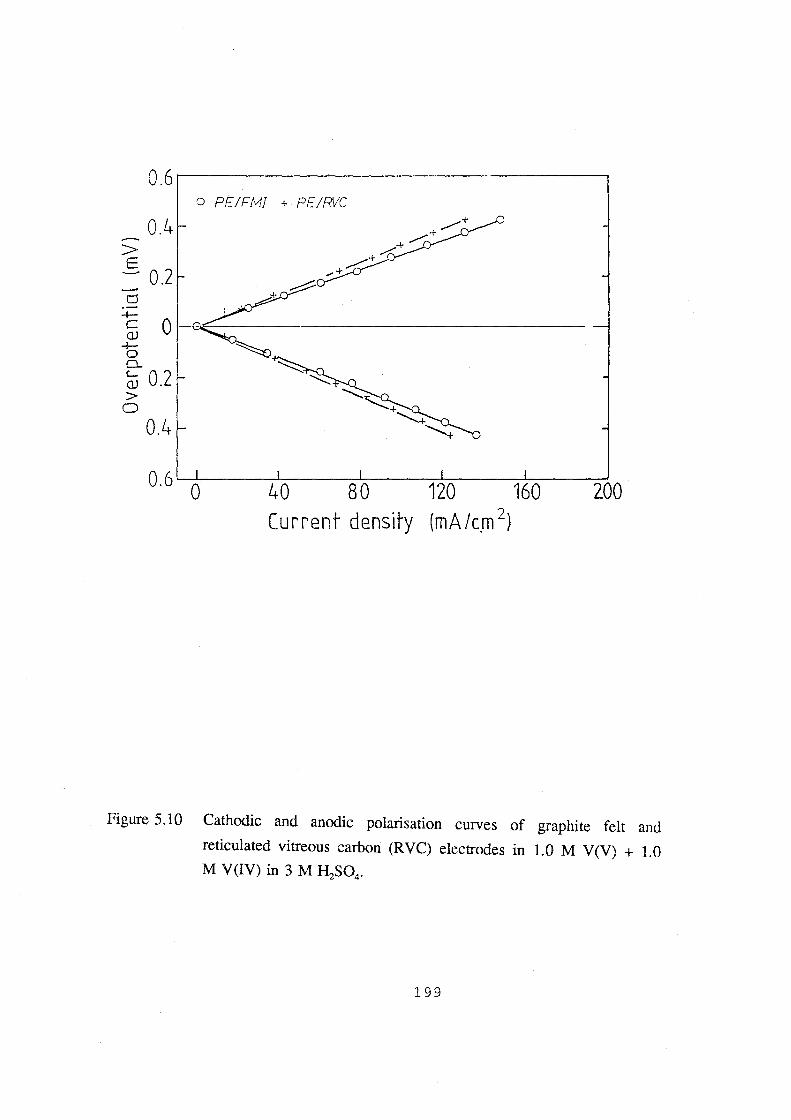
0.6
0.4 > E -0.2 d
o PEIF!vfl + PE!RIC
~ 0~~~-------------------------------QJ
""5 0..
~ 0.2 >
0
0.4
0.6 0 40 80 120 160 Current density (mA/c.m 2
)
200
Figure 5.10 Cathodic and anodic polarisation curves of graphite felt and
reticulated vitreous carbon (RVC) electrodes in 1.0 M V(V) + 1.0 M V(IV) in 3 M H2S04•
199

SOC) vanadium sulphate solution obtained under steady-state galvanostatic condi
tions. The I-V curves were recorded manually. A linear relationship is observed
between electrode overpotential and current density on the high surface area felt
and RVC electrodes. Plotting the overpotential versus current density (based on
geometric surface area) in the range of 50 mv and using the Linear Polarisation
equation[179], the i0 values for these two electrodes were determined as 0.92
X w-2 A.cm-2 for graphite felt and 0.80 X w-2 A.cm-2 for RVC electrode
respectively. These values are significantly higher than those obtained at the
graphite disc electrode and are due to the higher surface area of these electrodes.
In spite of the high surface area, however, the kinetics of the V(V)N(IV)
reactions are limited by the number of active sites on the carbon and graphite
surfaces. Further improvements in the effective surface area have been achieved
with various surface activation treatment methods which have been successfully
used to increase the number of active sites for the V(V)N(IV) redox couple
reaction on graphite felt electrodes so that energy efficiencies of up to 90% have
been achieved with these electrodes in the vanadium redox cel1[28].
5.1.2 The Electrochemical Behaviour of V(ID)/V(ll) Couple
As mentioned previously, the electrochemical behaviour of the V(III)N(II) couple
was reported by NASA group, and it was concluded that the redox reaction is
electrochemically irreversible at a carbon electrode[ 4]. Sum and Skyllas
Kazacos[ 42] studied the electrode kinetics of this redox couple at gold and glassy
200

carbon electrode and found out that at the gold electrode, the low hydrogen
overpotential masks the V(Ill) reduction peak so that it can not be observed. At
the glassy carbon electrode, the kinetics were found to be greatly influenced by
the electrode surface preparation procedure. The electrode kinetics were thus
established at a mechanically polished glassy carbon electrode surface which gave
the best reproducibility for this substrate.
The suitability of graphite for use as an electrode material to study the electrode
kinetics of vanadium species has already been discussed previously. In the present
study, the electrochemical behaviour of the V(lll)N(II) couple at the graphite
electrode was investigated using cyclic voltammetry. A 0.1 M V3+ in 3 M H2S04
solution was used as electrolyte. This solution was prepared by mixing equal
volume of 0.1 M V(IV)/3 M H2S04 solution with 0.1 M V2+/3 M H2S04 solution
(the latter was obtained from a fully charged negative electrolyte).
5.1.2.1 The Effect of Electrochemical Oxidation on Electrode Behaviour
Figure 5.11 shows the cyclic voltammograms of the V(Ill)N(II) couple at
different conditions. Curve 1 is the initial sweep obtained for a graphite electrode
surface prepared by the "standard" polishing procedure (section 3.2.1.1). The
V(Ill) reduction peak B is observed, but is close to the hydrogen evolution curve,
indicating a relatively high overpotential for V(Ill) reduction at this surface. After
scanning the electrode to a positive potential of + 1.10 V and holding at this
potential for 3 minutes, a cyclic voltammogram with a lower peak potential
201
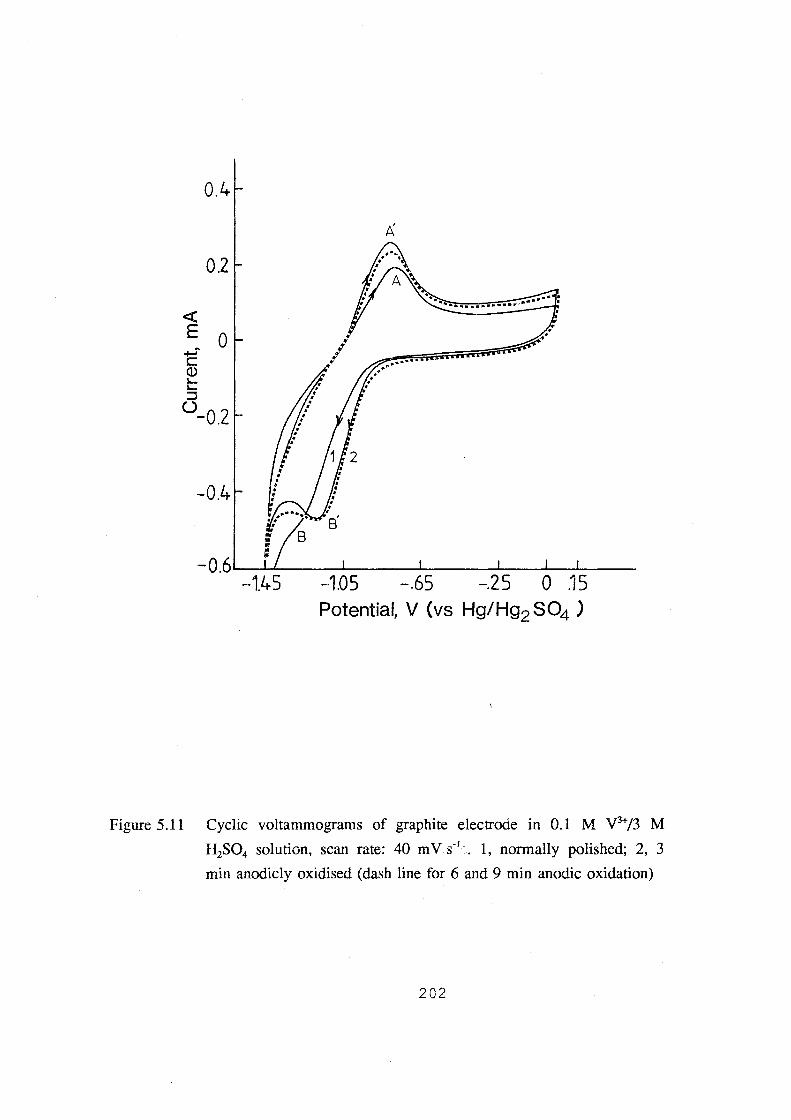
0.4
A
0.2
<{
E 0 ........ c Q) ~ ~
:::::J 0 -0.2
-0.4
-1.45 -1.05 -.65 -.25 0 .15 Potential, V (vs Hg/Hg2 804 )
Figure 5.11 Cyclic voltammograms of graphite electrode in 0.1 M V3+/3 M
H2S04 solution, scan rate: 40 mV s·' ,. 1, normally polished; 2, 3
min anodicly oxidised (dash line for 6 and 9 min anodic oxidation)
202
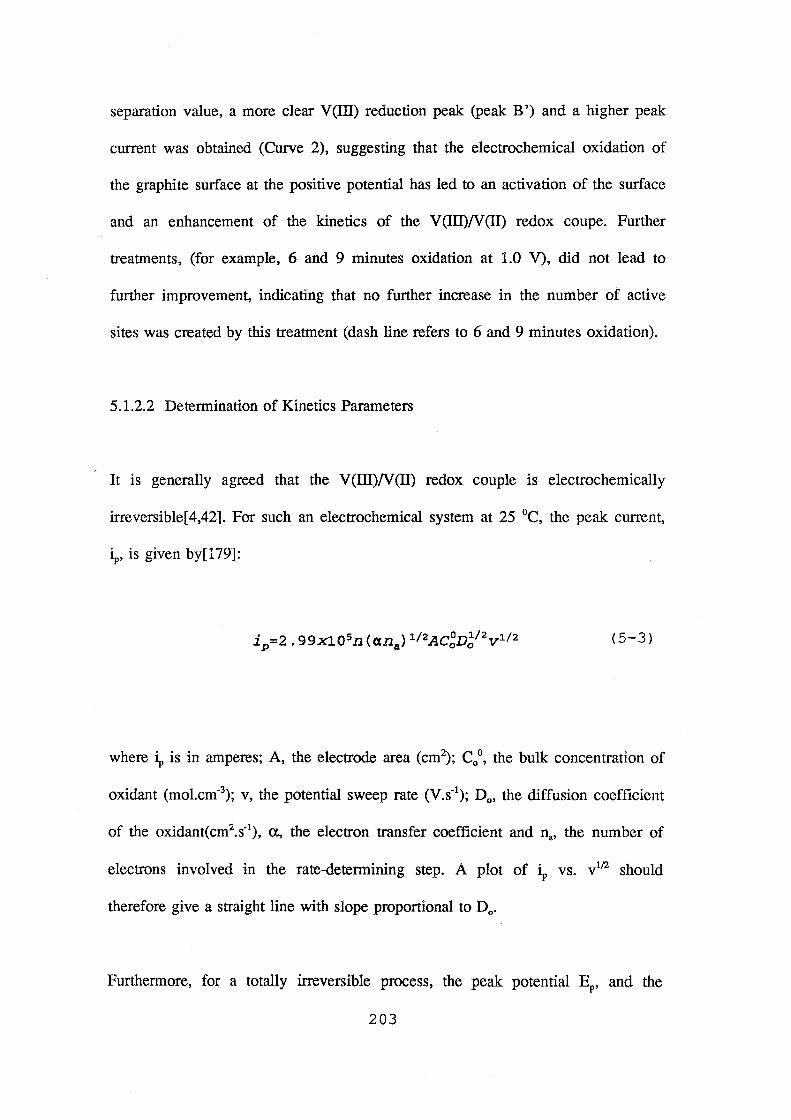
separation value, a more clear V(Ill) reduction peak (peak B ') and a higher peak
current was obtained (Curve 2), suggesting that the electrochemical oxidation of
the graphite surface at the positive potential has led to an activation of the surface
and an enhancement of the kinetics of the V (III)N (II) redox coupe. Further
treatments, (for example, 6 and 9 minutes oxidation at 1.0 V), did not lead to
further improvement, indicating that no further increase in the number of active
sites was created by this treatment (dash line refers to 6 and 9 minutes oxidation).
5.1.2.2 Determination of Kinetics Parameters
It is generally agreed that the V(Ill)N(II) redox couple is electrochemically
irreversible[ 4,42]. For such an electrochemical system at 25 °C, the peak current,
iP' is given by[ 179]:
(5-3)
where 4 is in amperes; A, the electrode area (cm2); C0°, the bulk concentration of
oxidant (mol.cm-3); v, the potential sweep rate (V.s-1
); D0
, the diffusion coefficient
of the oxidant(cm2.s-1), a., the electron transfer coefficient and na, the number of
electrons involved in the rate-determining step. A plot of 4 vs. v112 should
therefore give a straight line with slope proportional to D0
•
Furthermore, for a totally irreversible process, the peak potential EP' and the
203
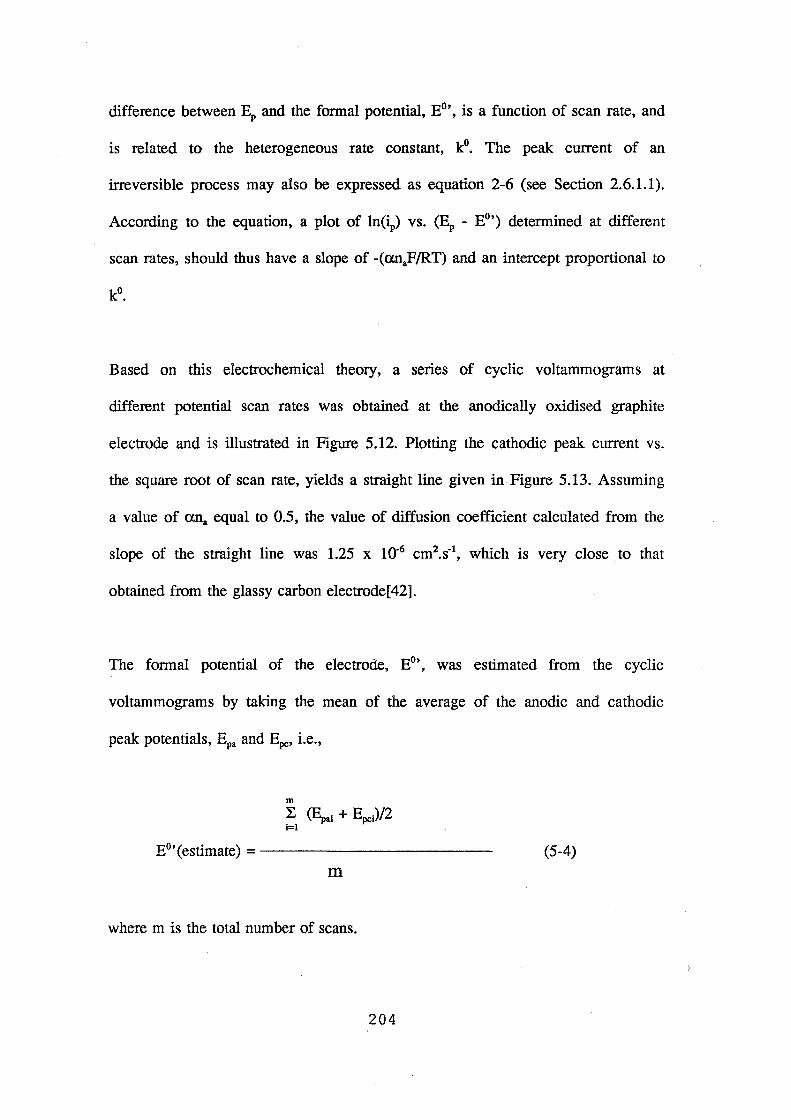
difference between ~ and the formal potential, E0', is a function of scan rate, and
is related to the heterogeneous rate constant, k0• The peak current of an
irreversible process may also be expressed as equation 2-6 (see Section 2.6.1.1).
According to the equation, a plot of 1n(~) vs. (EP - E0') determined at different
scan rates, should thus have a slope of -(<Xn8F/RT) and an intercept proportional to
Based on this electrochemical theory, a series of cyclic voltammograms at
different potential scan rates was obtained at the anodically oxidised graphite
electrode and is illustrated in Figure 5.12. Plotting the cathodic peak current vs.
the square root of scan rate, yields a straight line given in Figure 5.13. Assuming
a value of ana equal to 0.5, the value of diffusion coefficient calculated from the
slope of the straight line was 1.25 x 10·6 cm2.s·\ which is very close to that
obtained from the glassy carbon electrode[42].
The formal potential of the electrode, E0', was estimated from the cyclic
voltammograms by taking the mean of the average of the anodic and cathodic
peak potentials, Epa and Epc, i.e.,
m
L (Epai + Epci)/2 i=l
E0 '(estimate) = ------------- (5-4) m
where m is the total number of scans.
204

<!: E ~
0 c 0,) 1... 1... ::::l ()
-0.2
-0.4
-0.6
Potential,V (vs Hg/Hg2S04 )
Figure 5.12 Cyclic voltammograms of 9 mins anodicly oxidised graphite
electrode in 0.1 M V3+/3 M H2S04 • Numbers on curves
corresponding to scan rates in m V s~1 ~.
205

1.0~--------------------------------------~
,.......
~ 0.8 0/ '-'
0 Q_
0/ . 0/
-iJ 0.5 c
Q) L L :J 0
0 -a 0.4 Q) 0. 0 0 0/
l:J 0
0.2 / ..c -iJ a 0
0.0 0.0 0.1 0.2 0.3 0.4
square root of scan rate. v 1/2 c v,n)
Figure 5.13 Peak current vs. square root of scan rate for voltammograms in Fig. 5.12
206
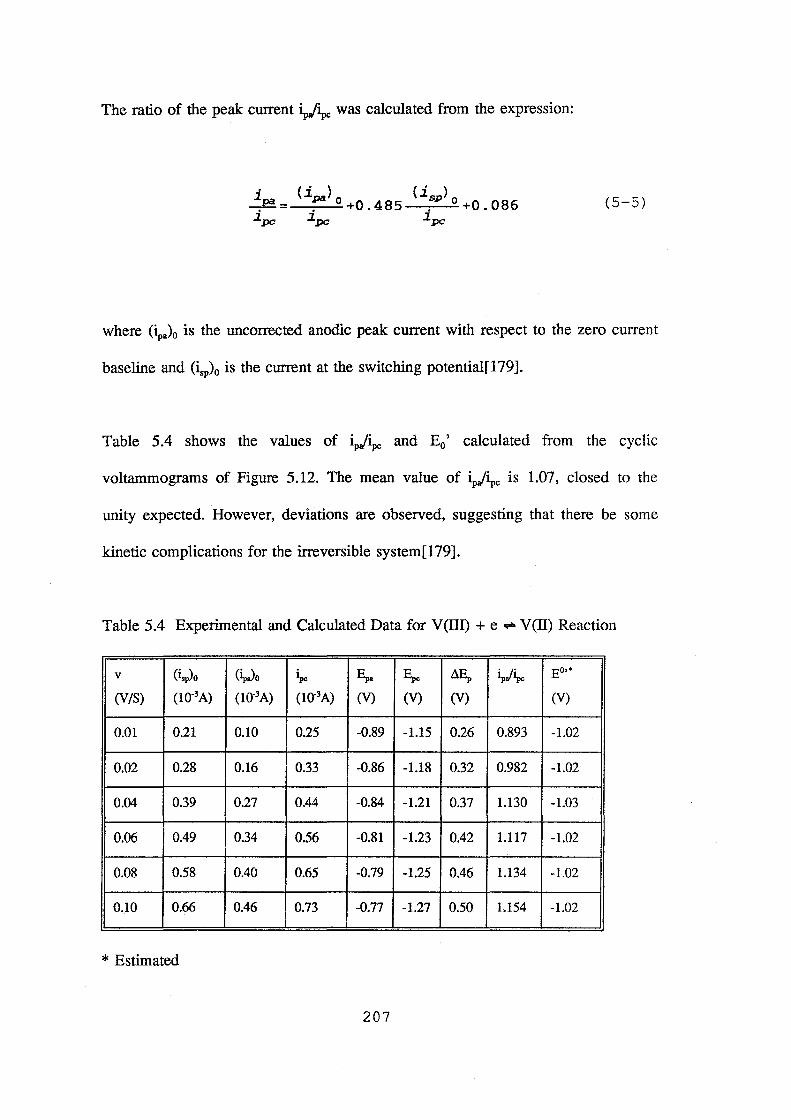
The ratio of the peak: current V4c was calculated from the expression:
(5-5)
where (~)0 is the uncorrected anodic peak current with respect to the zero current
baseline and (isp)o is the current at the switching potential[l79].
Table 5.4 shows the values of V4c and E0' calculated from the cyclic
voltammograms of Figure 5.12. The mean value of 4J4c is 1.07, closed to the
unity expected. However, deviations are observed, suggesting that there be some
kinetic complications for the irreversible system[179].
Table 5.4 Experimental and Calculated Data for V(III) + e ,... V(II) Reaction
v (isp)o C~o ~c Epa I;,., ~ ~J~c EO'*
(V/S) (10'3A) oo-3A) (10'3A) (V) (V) (V) (V)
0.01 0.21 0.10 0.25 -0.89 -1.15 0.26 0.893 -1.02
0.02 0.28 0.16 0.33 -0.86 -1.18 0.32 0.982 -1.02
0.04 0.39 0.27 0.44 -0.84 -1.21 0.37 1.130 -1.03
0.06 0.49 0.34 0.56 -0.81 -1.23 0.42 1.117 -1.02
0.08 0.58 0.40 0.65 -0.79 -1.25 0.46 1.134 -1.02
0.10 0.66 0.46 0.73 -0.77 -1.27 0.50 1.154 -1.02
*Estimated
207

The average value of -1.02 V for the formal potential of the electrode process
shown in Table 5.4, was used to plot In(~) versus (Ep -E0') for the relationship
given by equation 2.10. A straight line was obtained from the cyclic
voltammograms of Figure 5.12 and is shown in Figure 5.14, indicating that the
electrode process obeys this equation. From the slope of the straight line, the value
of a was found to be 0.24, indicating asymmetry anodic and cathodic kinetics.
Using this value, the diffusion coefficient of V(III) was determined as 2.60 x 10⁻⁶
cm2.s-1• From the intercept, the heterogeneous rate constant, k0
, was calculated as
3.63 x 10⁴ em/sec, one order of magnitude larger than that at glassy carbon
electrode[42], showing that a faster electron transfer rate can be obtained by
varying the electrode material.
5.2 Chemical Activation of the Carbon-Plastic Composite Substrates
As described in Chapter 4, the carbon-plastic composite electrode consists of a
piece of graphite felt as the surface layer to offer a high surface area for redox
reactions. High hydraulic pressures and high costs are also introduced by this felt
layer however. On the other hand, as shown in the first section of this chapter, a
flat graphite surface will not allow a high current to flow through the electrode so
as to obtain a desirable power output for the redox flow cell system. An electrode
surface having a high surface area and a high concentration of active sites with
low space occupation is therefore desirable. The present investigation examined
the possibility of obtaining such a surface from the prepared carbon-plastic
composite materials. Carbon-LDPE composite was selected for the present study.
208
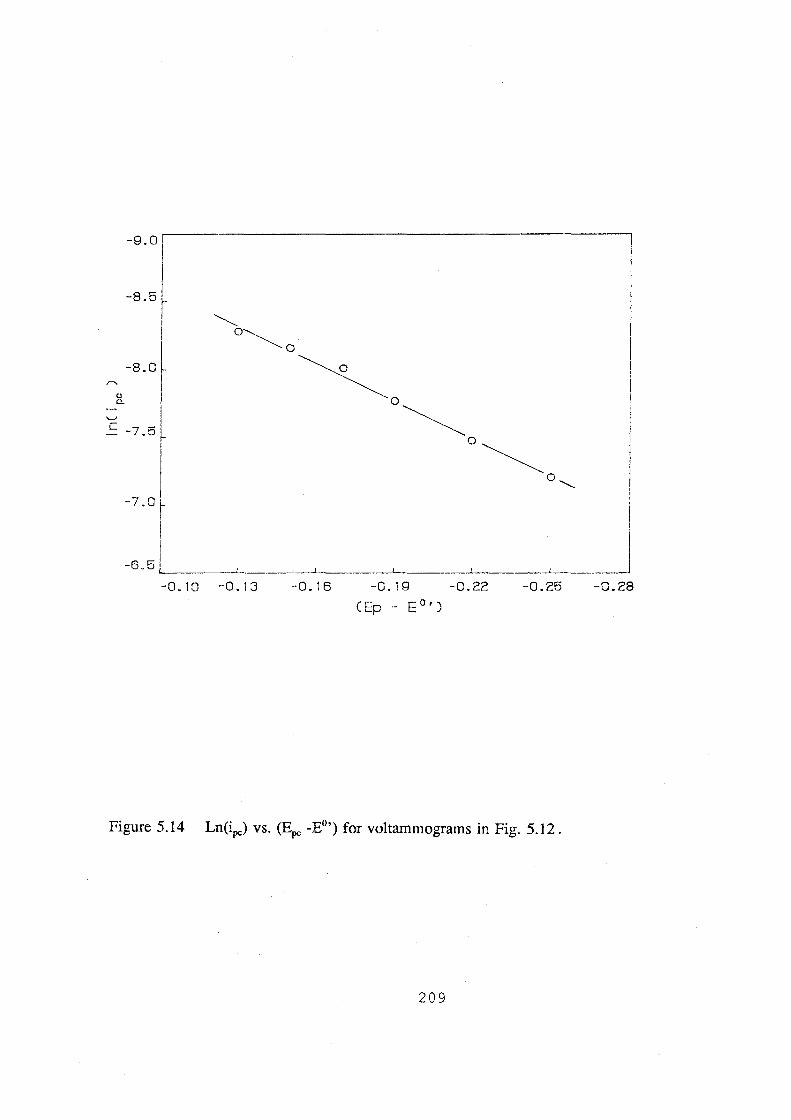
0 a_
'-"
-Q.O I
I -8.5 f
I
-8.0
~ 0~
0
~ 0~
c -7.5 r
-7.0 ~
0~ 0" I
I I
J -6.5L_ ____ ~L_ ____ ~L_ ____ _J ______ ~------~--
-0.10 -0.13 -0. 16 -0. 1 g -0.22 -0.25 -0.28
CEp- E 0')
Figure 5.14 Ln(4c) vs. (Epc -E0') for voltammograms in Fig. 5.12.
209
The details of preparation and the following experimental procedure were
described in Section 3.2.2.
The surface of the conducting composite polyethylene, although electrically
conductive, is however covered by the bonding plastic which reduces the surface
hydrophilicity and reaction area. The purpose of chemical treatment is to increase
the surface hydrophilicity, the reactive surface area and, if possible, to increase the
active sites or functional groups which can catalyse the electrochemical reactions.
Polyethylene is very stable to most chemicals and solvents and only strongly
oxidative and acidic solutions can attack its surface. The chromate-sulphuric acid
system was thus employed for the surface treatment.
5.2.1 Influence of Treatment Time
The prepared electrodes were polished with sand paper in the order of grit 120,
320, 400 (for the "e" and graphite electrodes only), cleaned with acetone and
water and then etched in the hot (65 °C) chemical treatment solution for various
time periods. A description of the electrode configuration ("e" and "s") was given
in Figure 3.11 of Section 3.2.2.2. The cyclic voltammograms for the two kinds of
composite polyethylene electrodes and for the graphite electrodes are shown in
Figures 5.15 to 5.17 respectively. Further details are given in Tables 5.5 to 5.8
and Figures 5.18 and 5.19.
In the Tables, ~1 and ~2 refer, respectively, to the peak current of the two
210
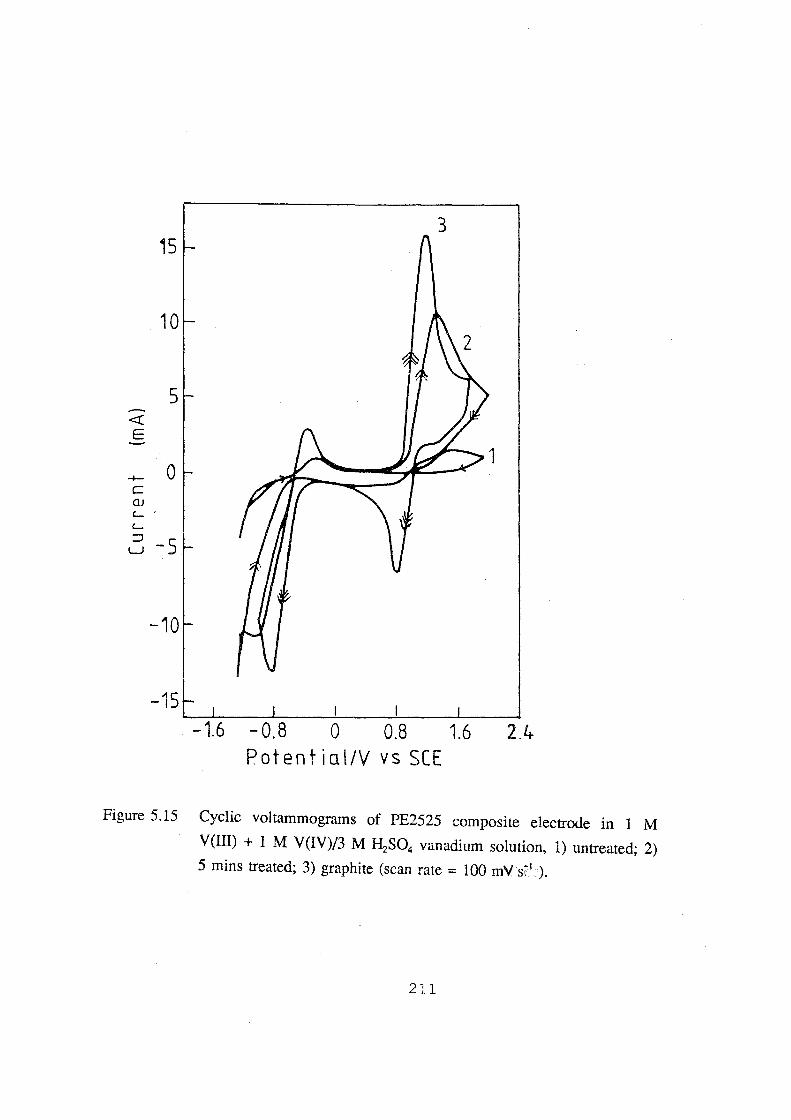
3 15
10
5 <! E
1 +- 0 c QJ
'-- '
'--c -5
-10
-15 1 I L_J_ ____ L_ __ _L ____ ~--~~--~
-1.6 -0.8 0 0.8 1.6 2.4 Potentiai/V vs SCE
Figure 5.15 Cyclic voltammograms of PE2525 composite electrode in 1 M
V(III) + 1 M V(IV)/3 M H2S04 vanadium solution, 1) untreated; 2)
5 mins treated; 3) graphite (scan rate = 100 mV s:'1 ).
211

15
10
5
<{
E
+- 0 c QJ
'-'-::::,
LJ -5
-10
-15
-1.6 -0.8 0 0.8 1.6 2.4 Potentiai/Vvs SCE
Figure 5.16 Cyclic voltammograms of PE75 composite electrode in vanadium
solution (same as mentioned in Figure 5.15), 1) untreated; 2) 5 mins
treated; 3) graphite(scan rate= 100 mV {' ).
212
electrode reactions: V(IV) - e --7 V(V) (peak A in Figure 4.8), and V(III) + e --7
V(II) (peak C in Figure 4.8), while AEP1' AEP2 refer to the peak potential
separations of the two redox couples, respectively.
The results in Figures 5.15 and 5.16 and Tables 5.5 to 5.8, show that both compo
site electrodes exhibit an increase in peak current with increasing treatment time.
This is probably due to an increase in the surface hydrophilicity as well as to
increased exposure of the conductive material, which was initially covered by
bonding polyethylene. Both effects would enhance the vanadium ion reactions.
Comparing the data in the Figures 5.15 to 5.19 and Tables 5.5 to 5.8, it is clear
that the effect of the short time treatment on the peak current is more pronounced
in the case of PE 2525 than for the PE 75 electrodes. This is probably due to the
fact that carbon black is more conductive than graphite fibre. With longer
treatment times, however, the effect on peak current is greater with the PE 75
electrodes (cf. Figures 5.18 and 5.19). An explanation for this reversal in
behaviour may lie in the fact that more of the graphite fibres are exposed so that
the surface area of the PE75 electrode becomes greater than that of the PE2525
composite. For the same composite, however, the "e" electrodes are seen to
produce a higher reacting current. This can be attributed to the graphite fibres
having a higher electrochemical activity in the cross-sectional direction compared
with their surface.
213
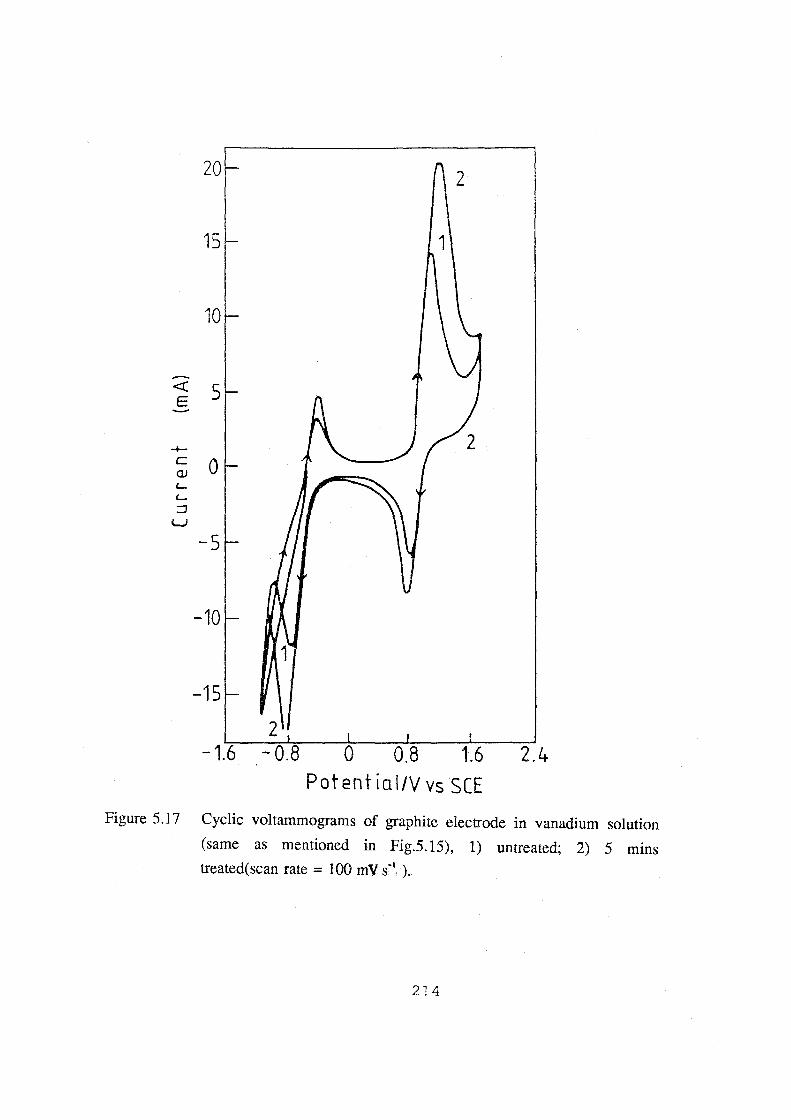
20 2
15 1
10
-<I: 5 E
-+-c 0 OJ ~
~
:J w
-5
-10
-15
-1.6 2.4
Potent iai/V vsSCE
Figure 5.17 Cyclic voltammograms of graphite electrode in vanadium solution
(same as mentioned in Fig.5.15), 1) untreated; 2) 5 mins
treated(scan rate = 100 mV s;-' ).
214
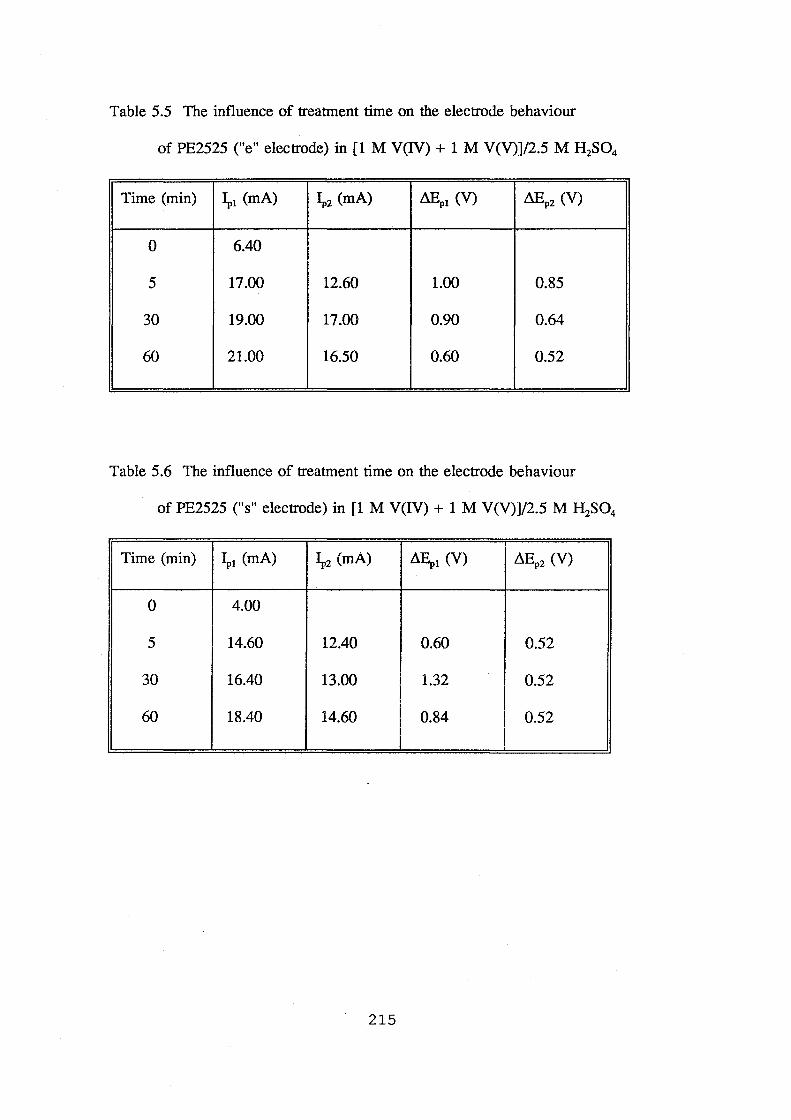
Table 5.5 The influence of treatment time on the electrode behaviour
of PE2525 ("e" electrode) in [1 M V(IV) + 1 M V(V)]/2.5 M H2S04
Time (min) ~1 (rnA) ~2 (rnA) ~1 (V) Lllipz (V)
0 6.40
5 17.00 12.60 1.00 0.85
30 19.00 17.00 0.90 0.64
60 21.00 16.50 0.60 0.52
Table 5.6 The influence of treatment time on the electrode behaviour
of PE2525 ("s" electrode) in [1 M V(IV) + 1 M V(V)]/2.5 M H2S04
Time (min) ~1 (rnA) ~2 (rnA) ~1 (V) Lllipz (V)
0 4.00
5 14.60 12.40 0.60 0.52
30 16.40 13.00 1.32 0.52
60 18.40 14.60 0.84 0.52
215

<{
E
..:r::: d QJ
(]_
o PE2525{"e ") Ip1 o PE2525 (" e ")lp2
0 PE2525 {II s ")Ip1 x PE2525{ "s ")lp2
Time (min)
Figure 5.18 The effect of treatment time on peak current for PE2525 composite
electrode.
216

Table 5.7 The influence of treatment time on the electrode behaviour
of PE75 ("s" electrode) in [1 M V(IV) + 1 M V(V)]/2.5 M H2S04
Time (min) ~1 (rnA) ~2 (rnA) ~1 (V) LlliP2 (V)
0 0.60
5 7.00 7.00 0.52 0.72
30 9.60 9.40 0.68 0.68
60 12.40 12.40 0.68 0.68
120 16.00 15.60 0.68 0.68
240 22.00 22.00 0.88 0.88
480 32.00 30.00 1.20 1.08
Table 5.8 The influence of treatment time on the electrode behaviour
of PE75 ("e" electrode) in [1 M V(IV) + 1 M V(V)]/2.5 M H2S04
Time (min) ~1 (rnA) ~2 (rnA) ~1 (V) LlliP2 (V)
0 1.60
5 10.80 10.80 0.48 0.80
30 17.00 17.00 0.60 0.68
60 22.00 23.80 0.60 0.64
120 30.00 29.20 0.60 0.68
240 38.00 37.00 0.72 0.84
480 49.60 48.80 1.00 1.00
217

<( E
..._ c Q) L-
'-:::J u
_:.:::: d Q)
o_
40
30
10
0
0 1
o PE75 ("s")Ip1 o PE75 (''s")l p2
2 3 4 Time {h)
<> PE75 ("e" }I p 1 x PE75 ("e")lp 2
Figure 5.19 The effect of treatment time on peak current for PE75 composite
electrode.
218

Table 5.9 The influence of treatment time on the electrode behaviour of graphite
in [1 M V(IV) + 1 M V(V)]/2.5 M H2S04
time (min) ~1 (rnA) ~2 (rnA) dEpt (V) dEP2 (V)
0 15.00 13.00 0.32 0.40
5 22.00 17.00 0.40 0.40
30 22.00 18.00 0.64 0.48
60 26.00 20.80 0.64 0.48
90 24.00 19.20 0.64 0.48
In the case of the graphite electrode (see Figure 5.17 and Table 5.9), a 5 minute
etch caused the peak current to increase but longer treatment yielded no further
improvement. Since the graphite electrode has a constant surface area, only the
first etch would be expected to increase the surface hydrophilicity.
The general trends in peak current versus treatment time for the two kinds of
composite plastic electrodes are summarised in Figure 5.18 and 5.19.
5.2.2 The Effect of Treatment Temperature
In order to optimise the treatment conditions, the effect of temperature on the
electrochemical behaviour of the carbon-plastic electrode was also studied. The
temperature of the treatment solution was controlled by a thermo-bath. The
prepared electrode was treated for a 30 minute time period at various
219

temperatures, and then cycled in the vanadium solution. Table 5.10 and 5.11
summarise the results, while Figure 5.20 illustrates the trend of the peak current
versus treatment temperature.
Table 5.10 The Effect of Treatment Temperature on the Electrode Behaviour of
PE2525("e") Electrode in [1 M V(IV) + 1 M V(V)]/2.5 M H2S04
temp.(lC) 4l(mA) iPimA) Lillpl(V) .!illPz(V)
30 16.4 14.0 0.60 0.80
50 20.8 16.4 0.60 0.60
65 19 17.0 0.90 0.64
80 13.2 11.2 0.80 0.72
Table 5.11 The Effect of Treatment Temperature on the Electrode Behaviour of
PE75("e") Electrode in [1 M V(IV) + 1 M V(V)]/2.5 M H2S04
temp.(°C) 4l(mA) iPz{mA) ~~(V) Lillp2(V)
30 12.0 12.0 0.40 0.72
50 15.2 14.8 0.40 0.60
65 22.0 18.0 0.64 0.48
80 15.2 14.8 0.72 0.48
220
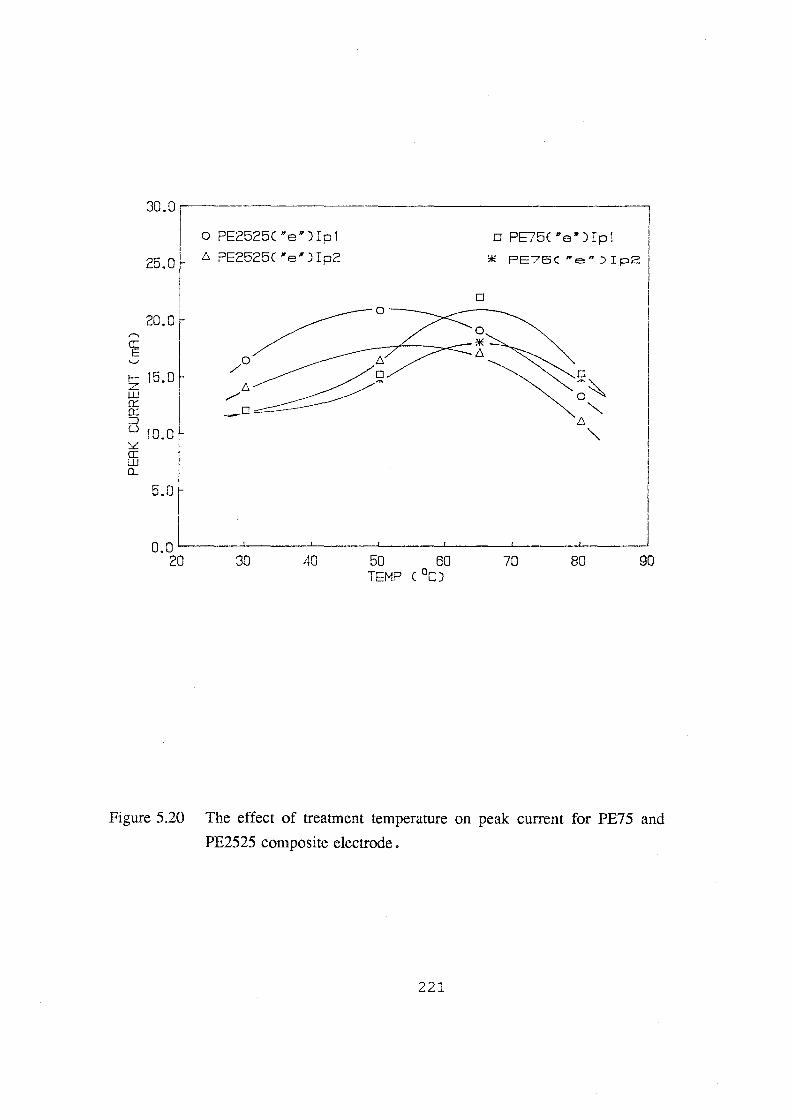
30.0.------------------------------------------------,
l o PE2525C"e 8 )Ip1
25 _0 ~ PE2525C"e•)Ip2
20.0
r- 15.0 z UJ 0::: 0::: :J u 10.0 ~ a: w Q_
5.0
0
o PE75C "e"') Ip1 j
* PE75C "e") Ip21 I
I
0.0~----~------~----~------~------~----~----~
20 30 40 50 60 70 80 90 TEMP C°C)
Figure 5.20 The effect of treatment temperature on peak current for PE75 and
PE2525 composite electrode.
221
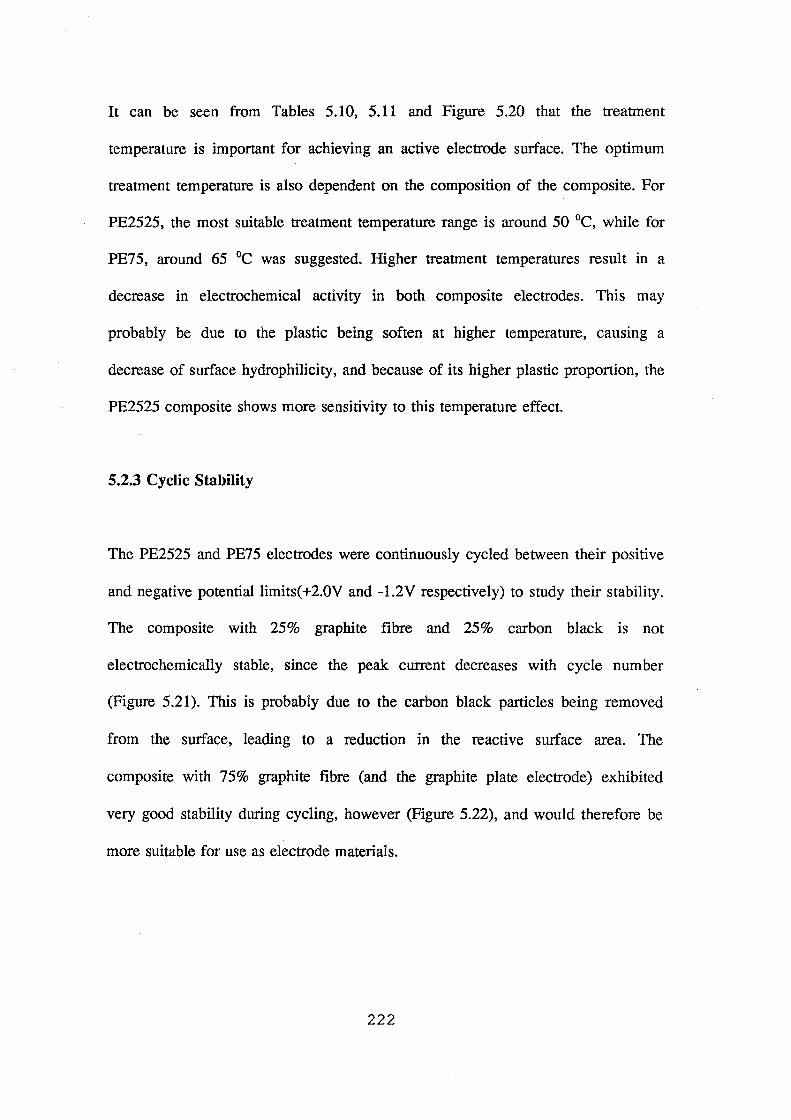
It can be seen from Tables 5.10, 5.11 and Figure 5.20 that the treatment
temperature is important for achieving an active electrode surface. The optimum
treatment temperature is also dependent on the composition of the composite. For
PE2525, the most suitable treatment temperature range is around 50 °C, while for
PE75, around 65 °C was suggested. Higher treatment temperatures result in a
decrease in electrochemical activity in both composite electrodes. This may
probably be due to the plastic being soften at higher temperature, causing a
decrease of surface hydrophilicity, and because of its higher plastic proportion, the
PE2525 composite shows more sensitivity to this temperature effect.
5.2.3 Cyclic Stability
The PE2525 and PE75 electrodes were continuously cycled between their positive
and negative potentiallimits(+2.0V and -1.2V respectively) to study their stability.
The composite with 25% graphite fibre and 25% carbon black is not
electrochemically stable, since the peak current decreases with cycle number
(Figure 5.21). This is probably due to the carbon black particles being removed
from the surface, leading to a reduction in the reactive surface area. The
composite with 75% graphite fibre (and the graphite plate electrode) exhibited
very good stability during cycling, however (Figure 5.22), and would therefore be
more suitable for use as electrode materials.
222

15
10
5 <t E
0 -+-c Q)'
c... c... ::J -5 u
-10
-15
-1.6 -0.8 0 0.8 1.6 2.4
Potentiai/V vs SCE
Figure 5.21 The cyclic stability test of treated PE 2525 composite electrode (30
mins, 65°C), scan rate = 100 mV s-1 ,.
223
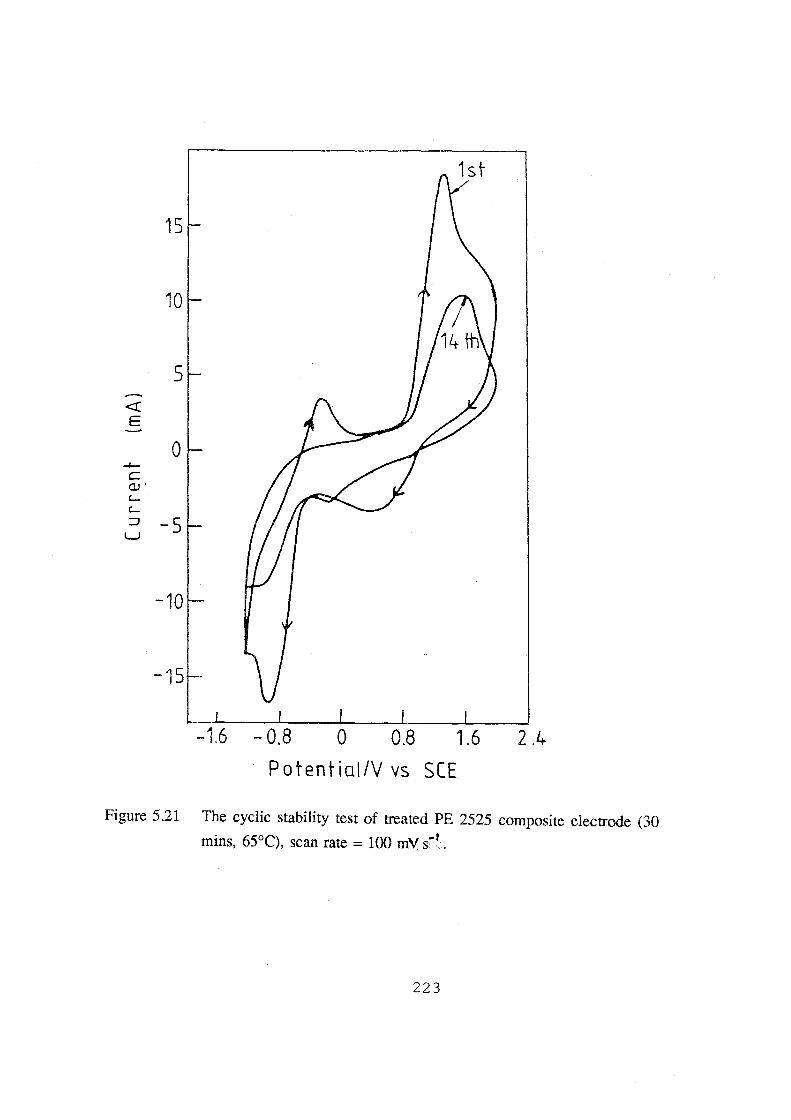
15
10
5 <l: E
0 -4--
c CJ' '--'--:::J -5 u
-10
-15
-1.6 -0.8 0 0.8 1.6 2.4
Potentia!IV vs SCE
Figure 5.21 The cyclic stability test of treated PE 2525 composite electrode (30
mins, 65°C), scan rate = 100 mV s:"'·.
223

40r-----------------~----~
30
20
<! 10 E -
+-c 0 a.J t..... t..... :J'
u
-10
-20
-30
P o t en t i o l/ V vs S C E
Figure 5.22 The cyclic stability test of treatment composite electrode: 1) 1 hr; 2)
2 hrs; 3) 4 hrs; all treated at 65°C(scan rate = 100 mV s~~ ).
224

5.2.4 Mechanism of Chemical treatment
The treatment solution employed in this study is a highly oxidisingacidic solution.
Its function could be to simply increase surface area and hydrophilicity or
alternatively create functional groups or active sites for the vanadium reactions. To
find out which is the more important effect of the treatment, a graphite felt
electrode(bonded onto a 70% PE, 15% CB, 15% GF conducting polyethylene
sheet) was subjected to the treatment process and then tested by cyclic
voltammetry. Because the felt electrode has a high and constant surface area, if
the treatment creates functional groups or active sites, the peak current should
increase significantly. The results in Figure 5.23, however, show that there is little
difference in the peak current before and after treatment. We can thus conclude
that the present treatment does not increase the number of active sites on the
electrode surface, but rather increases the surface area and surface hydrophilicity
of the composite polyethylene electrodes. Further evidence is given by the SEM
photographs in Figures 5.24, which show that after treatment, more of the graphite
fibres are exposed on the surface, only a small part of surface still being covered
by the polyethylene. This causes the peak current to increase significantly after
treatment.
5.3 Summary
The kinetics of the V(V)N(IV) redox couple reaction have been found to be elec
trochemically irreversible at the flat graphite electrode. Rotating disc voltammetry
225

300~-----------------------------,
<I: E
-4-c aJ '-'-:::J
200
100
0
L.J -100
-1.6 -0.8 0 0.8 1.6 2.4 3.2 PotentiGl/V vs SCE
Figure 5.23 Cyclic voltammograms of PE composite bonded with graphite felt:
1) untreated; 2) 5 mins at 65°C; 3) 40 mins at 65°C(scan rate = 100 mV s~' ~).
226

(a)
(b)
Figure 5.24 SEM pictures of treated (4 hrs) PE75 composite material, a) surface
direction; b) cross-section.
227

studies reveal that the diffusivity of V(IV) species is independent of vanadium
concentration and that the value of the diffusion coefficient is 2.14 x 10⁻⁶ cm2.s-1•
Although the exchange current density at a flat graphite electrode is low, it
increased by two orders of magnitude at the graphite felt electrode showing that
this material is suitable for use in the vanadium redox cell.
The electrochemical behaviour of the V(IIT)N(II) couple at the graphite electrode
was characterised by a diffusion coefficient of 2.60 x 10⁻⁶ cm2.s-1 and an electron
transfer rate constant of 3.63 x 104 cm.s-1, showing slow electrode kinetics.
Chemical treatment of the graphite fibre-based composite polyethylene substrate
can also result in a surface area enhancement and improved reactivity for the
vanadium ion redox reactions. Whilst carbon-black composite polyethylene is not
an electrochemically stable material after treatment, graphite fibre-based
conducting polyethylene is. Although significant improvements in the effective
surface area have been achieved with surface treatment of these materials, further
research on the activation of the exposed graphite fibres is required to achieve
better electrochemical activity for the vanadium reactions. Direct activation of the
conducting plastic surface will then eliminate the need for the graphite felt and
dramatically reduce the cost of the vanadium redox battery electrodes, while main
taining a high efficiency.
228

CHAPTER VI
GRAPHITE FELT AS ELECTRODE ACTIVE LAYER
As mentioned previously, the composite electrode has a matrix layer and active
layer, each performing different functions. Since the electrochemical reactions of
the redox couples in the battery take place at the active layer, particularly at the
interface between the electrolyte and the surface of the active layer material, its
physical, chemical and electrochemical properties are important factors in battery
application. Normally, the active layer of an electrode should have:
a) high electrical conductivity (to minimise the IR losses)
b) high surface area but low space occupation (to enhance power density of
battery)
c) high electrochemical activity (to minimise the polarisation overpotential'll)
d) good stability during operation
e) low cost
To meet all the requirements, the most suitable materials are carbon or graphite
felts. The results in Chapter 4 showed that the commercial Toray graphite felt is
a good electrode active layer of the composite electrodes for the vanadium redox
flow battery. Unfortunately, however, it has a high space occupation (6 mm in
thickness), and in relation to its surface area, it has a low concentration of active
sites on the surface and its cost is also high. To increase the power density of a
battery, it is necessary to increase the number of the cells per unit volume. On the
other hand, totally eliminating the felt layer, would of course reduce the space
229

occupation of the electrode, but would also lead to difficulties in obtaining a high
surface area to allow high enough current to pass through. As shown in Chapter 5,
chemical etching leads to an increased surface area and therefore peak current for
the non-felt composite electrode, however, the high proportion of graphite fibre in
the composite material results in a difficulty of processing and a high cost. The
surface treatment step would also limit the large scale application of the electrode
because of the high acidity, oxidising nature and toxicity of the solution.
Possessing a high surface area but less space occupation and less complication for
processing, thinner graphite felts were therefore considered as the alternative
surface active layer for the carbon-plastic composite electrode. With the aim of
enhancing the electrochemical activity while reducing the space occupation, the
present study included the screening of felt samples, the oxidation sensitivity of
selected felt samples and the application of catalysts onto the felt to increase the
electroactivity of the electrode for the vanadium redox reaction. In the first part of
this chapter, the electrical, structural and electrochemical properties of a few
commercially available carbon and graphite felts are evaluated. Using scanning
electron microscopy (SEM) and X-ray photoelectron spectroscopy (XPS), the
second part of this chapter compares the oxidation sensitivity of two typical
graphite felt samples treated under various oxidative conditions. Focused on
enhancing the electrochemical activity of the graphite felt, the third part of the
Chapter concentrates on the felt activation and electrocatalysis study. Cell
efficiencies and the stability of the catalysed felt electrode were also evaluated.
230

6.1 Comparison of Characteristics of Some Graphite Felts
It is well-known that depending on the precursors and the processing temperature
and techniques, the properties of graphite felt vary considerably. As the electrode
active layer material, the most important characteristics concerned are electrical
conductivity, the surface area and pore size distribution property and the
electrochemical activity.
6.1.1 Electrical Conductivity of Graphite Felt
One of the most important characteristics of an electrode material is electrical
conductivity, since a highly conductive felt can minimise the IR losses during
battery operation. The resistivity of the four kinds of commercially available thin
felts were thus tested with ASTM D-991 method. For comparison, the Toray 6
mm graphite felt was also tested, and the results are listed in Table 6.1.
Apart from the GFD 2, the resistivity values of the other 3 graphite felts are very
close, but much higher than GFD 2 and Toray felt. This might be due to the
different stage of graphitisation or in other words, the different surface
microstructure of the fibres resulting from the processing procedure and precursors
used in manufacturing the various felt samples. This would lead to a different
capability of interaction with oxygen which in turn would affect the electrical
properties of the felt. As evidence, Golden et al pointed out that the electrical
resistance of carbon increases when oxygen chemisorption on its surface takes
231

place[l01]. As reported by the manufacturers, the precursor for GFD 2 felt is
polyacrylonitrile (PAN), while FMI and RVG 1000 felts are based on rayon. The
significant difference in electrical resistivity between these two types of felt
samples are thus probably associated with the different precursors used in their
manufacture.
Table 6.1 Comparison of electrical resistivity of commercially
available graphite felts
Felt Precursor !l.V/I Thickness Resistivity
(ohm) (mm) (ohm.cm)
FMI rayon 0.192 3 0.023
Sigri GFA 2 - 0.220 3 0.026
Sigri GFD 2 PAN 0.038 2.5 0.0038
Le Carbonne rayon 0.341 1.5 0.020
RVG 1000
Toray - 0.038 6 0.0091
6.1.2. Surface Area and Pore Size of Graphite Felt Samples
Since the graphite felt would be employed as the electrode active layer for the
vanadium redox flow battery, and the electrolyte will flow through the felt during
operation, the porosity and structure of the felt will affect the flow rate of the
electrolyte and therefore influence the polarisation behaviour of the redox flow
battery as well as pumping energy loss[32]. On the other hand, the active surface
232

area of the electrode material will affect the electrochemical behaviour of the
electrode, including the current distribution and electrode overpotential[34]. It is
therefore important to know the structure and the surface area of the felt samples.
Using the mercury intrusion method, Figure 6.1 shows typical surface area
analysis curves which illustrate the structural characteristic of GFD 2 graphite
felt. The cumulative curve in Figure 6.1(a) levels off when the pore diameter is
smaller than 10 micrometer, while the incremental curve shows a dramatic pore
volume increase in the pore diameter range from 10 to 100 micrometer. This
indicates that the pore volume of the felt is attributed to the macro pores, or more
precisely, to the space between all the fibres of the felt. This type of pore is
commonly defined as the "main pore"[32]. Figure 6.1(b) shows the cumulative
surface area as a function of pore diameter. It can be seen that the high surface
area of the felt is mainly attributed to the micro pores which are around 0.01 to
0.001 micromete in diameter.
Each of the felts, including the Toray felt has similar structural properties. The
total measured specific surface area and pore volume values are listed in Table
6.2.
Table 6.2 shows the relation between the main pore volume and specific surface
area of each of the five felt samples. It can be seen that the main pore diameter
for all the felt samples ranges from 101 to 1(j J.lffi, and the main pore volume is
more than 90% of the total measured pore volume, indicating that the structure of
felt
233
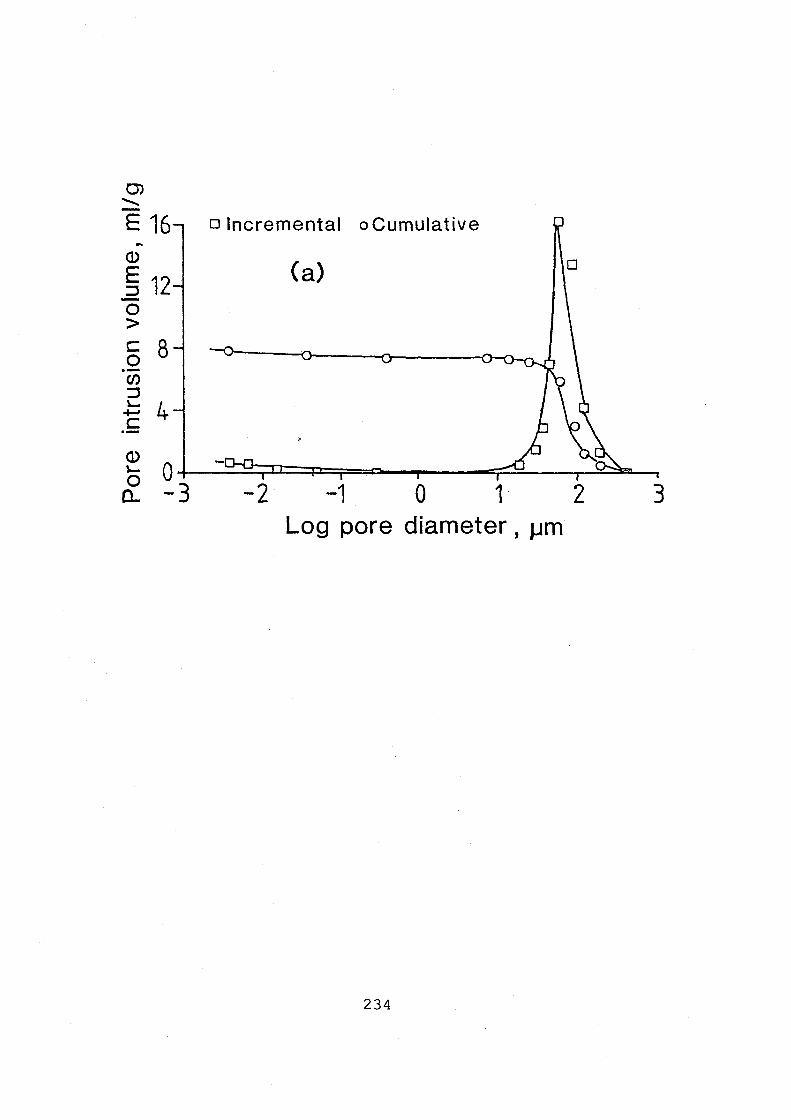
0) ..........
E 16 o Incremental o Cumulative ...
(])
{a) § 12 0 > c 8 0 (j) :::s "'"" 4 ......., c ·- %
(])
0 "'"" 0 a.. -3 -2 -1 0 1 2 3
Log pore diameter , J.lffi
234

200 (b)
-2 -1 0 1 2 3 Log pore diameter, J.Jm
Figure 6.1 Pore and surface area distribution of GFD 2 graphite felt, (a) pore
intrusion volume; (b) cumulative surface area
235

Table 6.2 Smface Area Comparison of commercial available Graphite Felts
Felt Thick- Main pore (Main pore Specific Specific surface
ness diameter volume)/ (Total surface area area for total
(mm) (p) measured pore for main pores measured pores
volume),% (mz/g) (mz/g)
FMI 3 188.5- 93.2 0.329 238.27
36.5
GFA2 3 187.4- 93.3 0.767 374.44
20.3
GFD2 2.5 188.5- 92.8 0.390 266.86
13.0
RVG 1.5 181.5- 91.5 0.485 388.38
1000 15.1
Toray 6 188.5- 91.2 0.575 508.264
13.0
samples is rather similar. However, differences in the smface area values can be
observed, showing that a different microstructure for the various felt samples. A
significant difference in specific smface area between main pores and total
measured pores for each felt sample is also noted, illustrating the unique structural
characteristics of the graphite felts, i.e., the co-existence of macro-pores (space
between fibres of the felt) and micro-pores. This phenomena was also reported by
Ashimura et al[32].
The value of main pore volume and specific smface area are of most concern in
battery applications. This is based on the following consideration: During battery
operation, the bulk electrolyte can not flow into the tiny pores of the felt so that
236
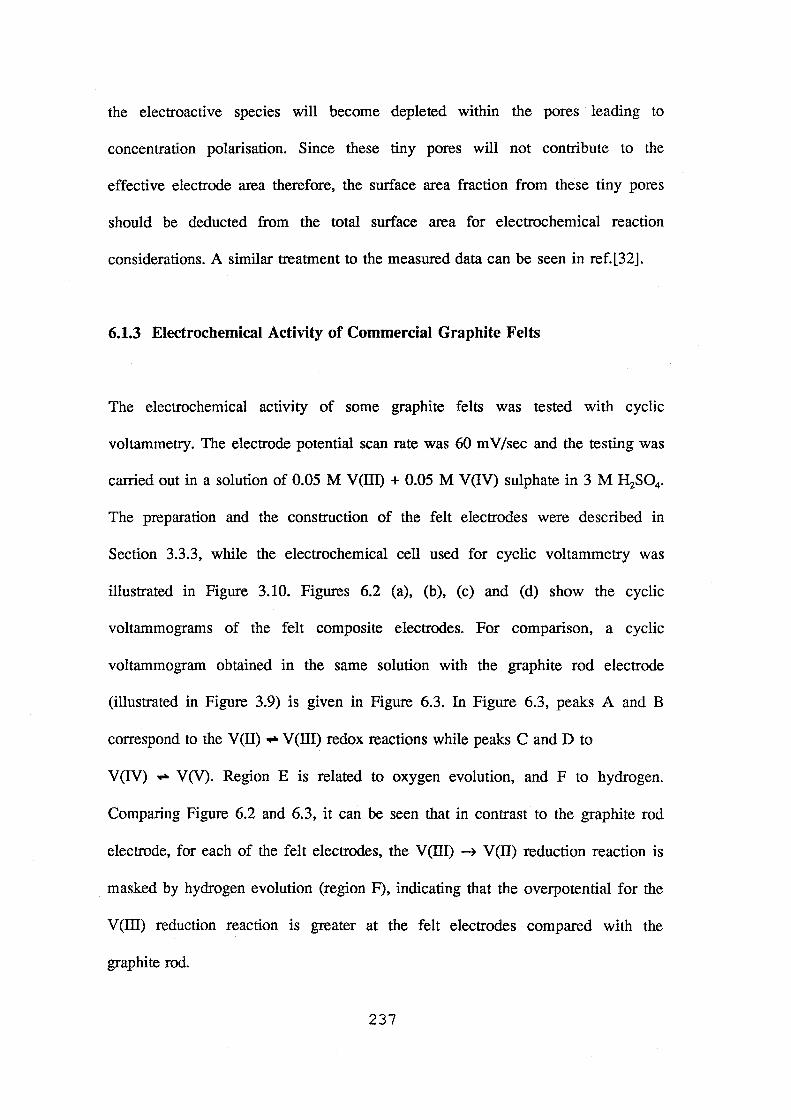
the electroactive species will become depleted within the pores leading to
concentration polarisation. Since these tiny pores will not contribute to the
effective electrode area therefore, the surface area fraction from these tiny pores
should be deducted from the total surface area for electrochemical reaction
considerations. A similar treatment to the measured data can be seen in ref.[32].
6.1.3 Electrochemical Activity of Commercial Graphite Felts
The electrochemical activity of some graphite felts was tested with cyclic
voltammetry. The electrode potential scan rate was 60 mV/sec and the testing was
carried out in a solution of 0.05 M V(III) + 0.05 M V(IV) sulphate in 3 M H2S04•
The preparation and the construction of the felt electrodes were described in
Section 3.3.3, while the electrochemical cell used for cyclic voltammetry was
illustrated in Figure 3.10. Figures 6.2 (a), (b), (c) and (d) show the cyclic
voltammograms of the felt composite electrodes. For comparison, a cyclic
voltammogram obtained in the same solution with the graphite rod electrode
(illustrated in Figure 3.9) is given in Figure 6.3. In Figure 6.3, peaks A and B
correspond to the V (II) ,.... V (III) redox reactions while peaks C and D to
V(IV) ,.... V(V). Region E is related to oxygen evolution, and F to hydrogen.
Comparing Figure 6.2 and 6.3, it can be seen that in contrast to the graphite rod
electrode, for each of the felt electrodes, the V (III) ----? V (II) reduction reaction is
masked by hydrogen evolution (region F), indicating that the overpotential for the
V(III) reduction reaction is greater at the felt electrodes compared with the
graphite rod.
237

80 c
<! 40 E ..
of-)
c: 0 (1,)
'-'-:::;,
0 -40
-80
-100
-2.0 -1.5 -1.0 -0.5 0 0.5 1.0 1.5 Potentiaf,V vsHg/Hg2S04
(a)
238

150
100
<( 50 E .. ...., ~ 0 '':::7
0 -50
-100
-150 \.-.-:-.L----L------L-----...I--L-----L.----1.-~-------2.0 ·1.5 -1.0-0.5 0 0.5 1.0 1.5 2.0
Potentiai,V vs Hg/Hg2S04
(b)
239

100
<t 50 E ..
-100
-1.0-0.5 0 0.5 1.0 1.5 Potent i a I , V v s H g I H g2S 0 4
(c)
240

<{
E .. ~ c: Cl,)
'-'-::l ()
120~----------------------~
c
40
0
-40
-80
F -120 -~~--....__---L---L---1.--_j_......L
-2.0 -1.5 -lO -0.5 0 0.5 1.0 1.5 Potentia I, V v s Hg/Hg2S04
(d)
Figure 6.2 Cyclic voltammograms of various graphite felt electrodes in 0.05 M
V(III) + 0.05 M V(IV) in 3 M H2S04 solution, sweep rate: 60
mY s:'/; (a) FMI; (b) GFA 2: (c) GFD 2 and (d) RVG 1000.
241
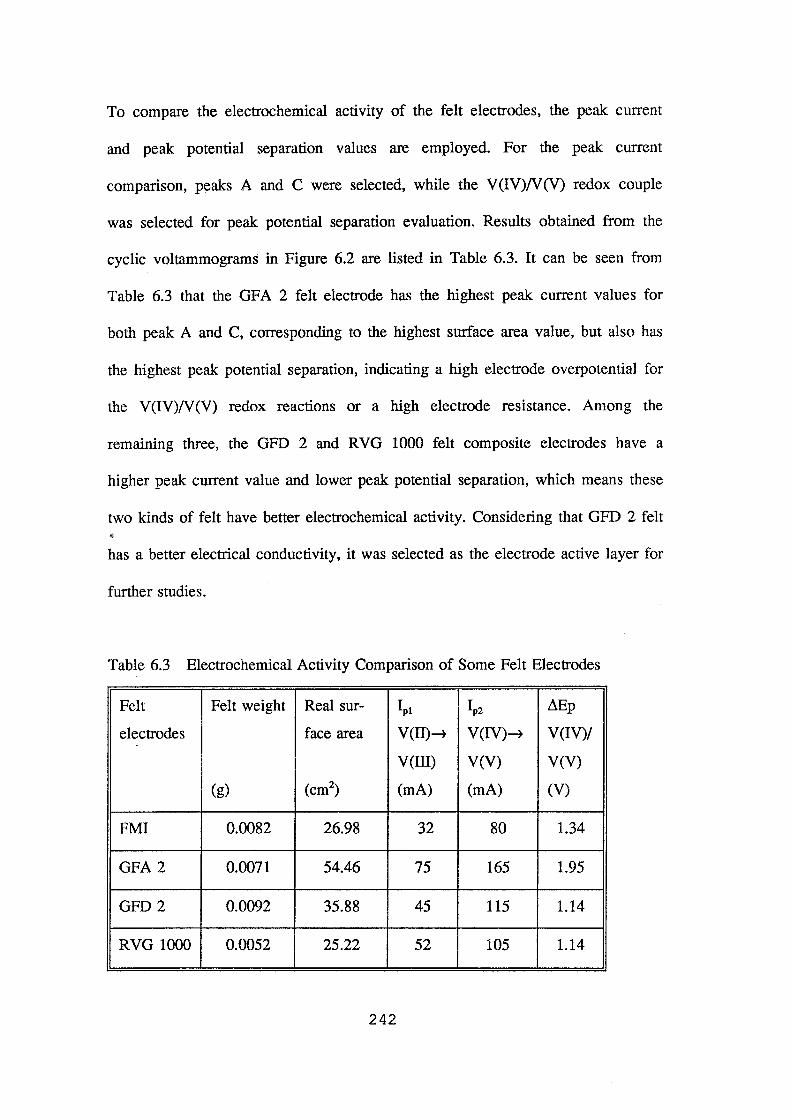
To compare the electrochemical activity of the felt electrodes, the peak current
and peak potential separation values are employed. For the peak current
comparison, peaks A and C were selected, while the V (IV)N (V) redox couple
was selected for peak potential separation evaluation. Results obtained from the
cyclic voltammograms in Figure 6.2 are listed in Table 6.3. It can be seen from
Table 6.3 that the GFA 2 felt electrode has the highest peak current values for
both peak A and C, corresponding to the highest surface area value, but also has
the highest peak potential separation, indicating a high electrode overpotential for
the V(IV)N(V) redox reactions or a high electrode resistance. Among the
remaining three, the GFD 2 and RVG 1000 felt composite electrodes have a
higher peak current value and lower peak potential separation, which means these
two kinds of felt have better electrochemical activity. Considering that GFD 2 felt
has a better electrical conductivity, it was selected as the electrode active layer for
further studies.
Table 6.3 Electrochemical Activity Comparison of Some Felt Electrodes
Felt Felt weight Real sur- ~1 ~2 Lffip
electrodes face area V(ID-? V(IV)--7 V(IV)/
V(III) V(V) V(V)
(g) (cm2) (rnA) (rnA) (V)
FMI 0.0082 26.98 32 80 1.34
GFA2 0.0071 54.46 75 165 1.95
GFD2 0.0092 35.88 45 115 1.14
RVG1000 0.0052 25.22 52 105 1.14
242
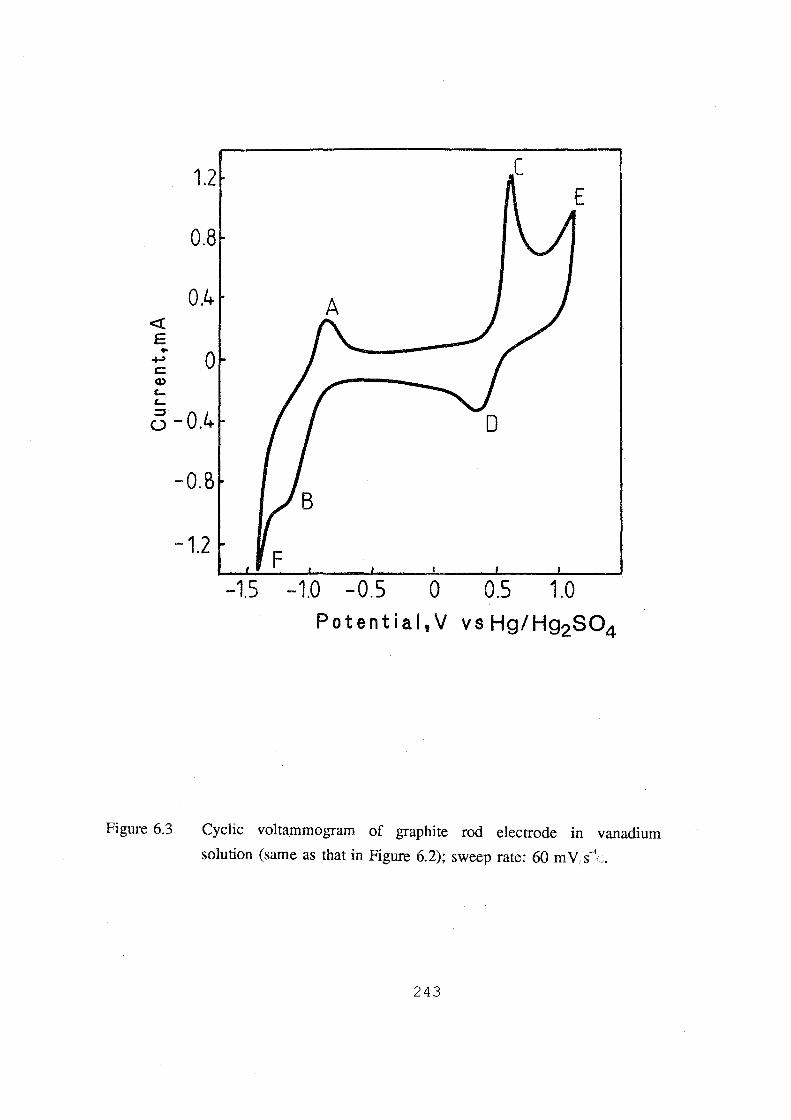
<( E ..
.f-)
c::: Q) c... c...
1.2
0.8
0.4
0-0.4
-O.B
-1.2
A
0
-1.5 -0.5 0 0.5 1.0
Figure 6.3 Cyclic voltammogram of graphite rod electrode in vanadium
solution (same as that in Figure 6.2); sweep rate: 60 mV s-' ,,
243
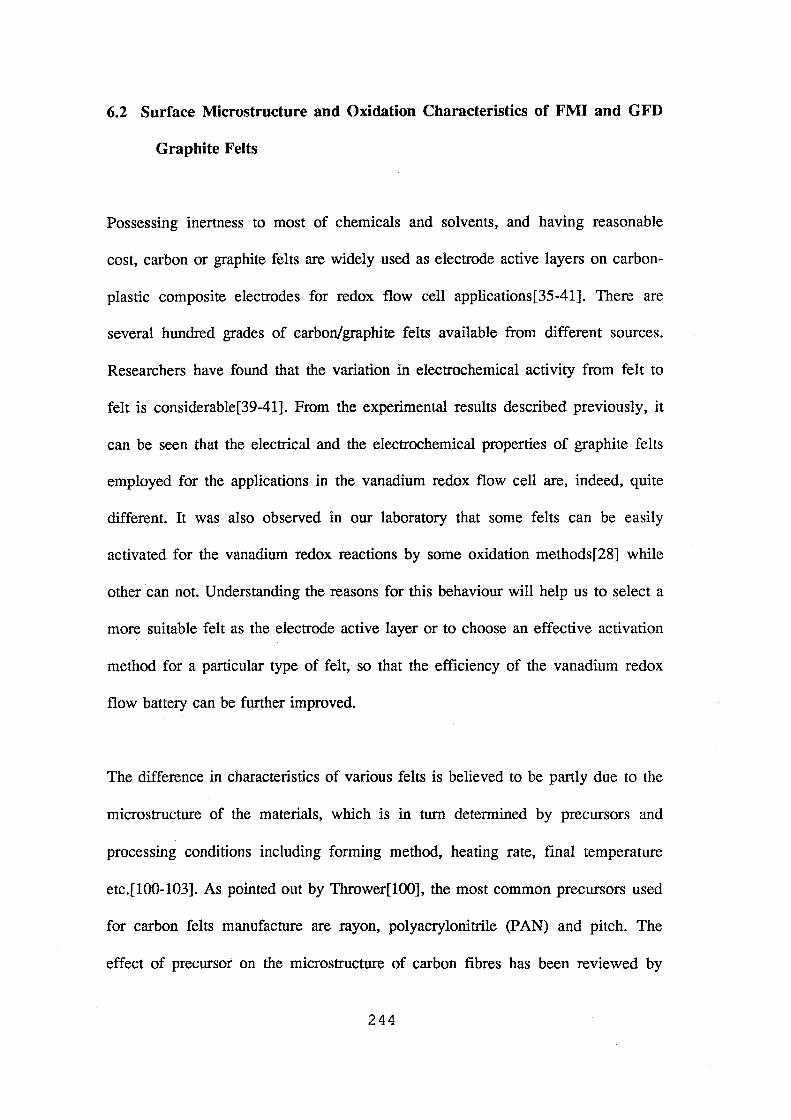
6.2 Surface Microstructure and Oxidation Characteristics of FMI and GFD
Graphite Felts
Possessing inertness to most of chemicals and solvents, and having reasonable
cost, carbon or graphite felts are widely used as electrode active layers on carbon
plastic composite electrodes for redox flow cell applications[35-41]. There are
several hundred grades of carbon/graphite felts available from different sources.
Researchers have found that the variation in electrochemical activity from felt to
felt is considerable[39-41]. From the experimental results described previously, it
can be seen that the electrical and the electrochemical properties of graphite felts
employed for the applications in the vanadium redox flow cell are, indeed, quite
different. It was also observed in our laboratory that some felts can be easily
activated for the vanadium redox reactions by some oxidation methods[28] while
other can not. Understanding the reasons for this behaviour will help us to select a
more suitable felt as the electrode active layer or to choose an effective activation
method for a particular type of felt, so that the efficiency of the vanadium redox
flow battery can be further improved.
The difference in characteristics of various felts is believed to be partly due to the
microstructure of the materials, which is in turn determined by precursors and
processing conditions including forming method, heating rate, final temperature
etc.[l00-103]. As pointed out by Thrower[lOO], the most common precursors used
for carbon felts manufacture are rayon, polyacrylonitrile (PAN) and pitch. The
effect of precursor on the microstructure of carbon fibres has been reviewed by
244

Johnson[l04], and it was revealed that fibre made from different precursors has its
own specific microstructure. For example, high modulus (type I) PAN fibre
exhibits an outer sheath with centre core structure. It was also found that the
turbostratic layer planes and crystallites are more highly oriented than that in the
core, and also considerably larger[105]. Differing from the PAN based fibres, a
specific structural characteristic, i.e., an almost perfectly circular cross section,
was observed and reported for pitch based fibres[106].
Though the microstructure of the fibre affects a number of characteristics of fibre
or felt materials, its effect on the formation of carbon-oxygen surface functional
groups, which links directly to the electroactivity of the felt electrode, is probably
the most important aspect for redox cell applications. The strong interaction of
graphite felt materials with oxygen could lead to a enhancement in electroactivity
obtained by some suitable activation treatments[28,166,167]. However, it might
also result in a high possibility of electrode deterioration caused by surface
oxidation during charging[l68-172]. Thus the positive graphite felt electrode of
the vanadium redox flow battery operated under chemically and electrochemically
oxidising conditions during the charging process because of the anodic potentials
applied the existence of the oxidising V(V) ions in the charged electrolyte.
Furthermore, during cell over-charge, the electrode is operated under severe
oxidising conditions since oxygen evolution takes place and the electrode is in
contact with the highly oxidising fully charged electrolyte. The behaviour of the
graphite felt electrodes under these conditions is therefore a key issue, as a long
cycle life performance of the vanadium redox flow battery is dependent greatly on
245

the oxidation stability of the graphite felt.
In the present study, the oxidation behaviour of two type of graphite felts, FMI
and GFD 2 which are based on rayon and PAN respectively, were evaluated with
various oxidation treatments. Firstly, the two felts were anodically oxidised at a
positive electrode potential to compare the effect of anodic oxidation on the
electroactivity of the felt in the vanadium solution. Cyclic voltammogram was
used for the electroactivity evaluation. A gas oxidation experiment was also
performed on the two felt samples, and the change in the concentration of surface
carbon-oxygen functional groups was analysed using X-ray photoelectron
spectroscopy (XPS). Scanning electron microscopy (SEM) was then used to
compare the microstructure and orientation of the two felts. Finally, the felt
samples were fabricated into composite electrodes by bonding onto conducting
plastic substrate and tested in a vanadium redox cell under normal cell operation
and overcharge conditions. The surface characteristics of these two felts after
anodic oxidation in the vanadium redox flow cell were analysed and compared by
XPS analysis.
6.2.1 The Effect of Anodic Oxidation on Electroactivity of Felt Electrodes in
Vanadium Solution
The small FMI and GFD 2 felt composite electrodes (geometric surface area =
0.028 cm2) for cyclic voltammetry were prepared by the procedure described in
Section 3.3.3. The experimental apparatus and method were also shown in the
246

same section. The supporting electrolyte of the vanadium redox flow cell, 3 M
H2S04• was used for the anodic oxidation experiments, while a solution of 0.1 M
VOS04 in 3 M H2S04 was employed to evaluate the electroactivity of the
composite felt electrode before and after anodic oxidation. The anodic oxidation
was performed by holding the electrode at a positive potential of + 1.5 V versus
Hg!Hg2S04 reference electrode for 15 minutes. In order to avoid the accumulation
of gas bubbles inside the felt, the electrode was rotated with a rotation speed of
500 rpm during anodic oxidation.
Figure 6.4 shows the cyclic voltammograms for the FMI and GFD felt composite
electrodes in 3 M H2S04• The potential range was from -1.6 V to + 2.05 V. In
both Figures 6.4(a) and (b), curves 1 and 2 refer to the voltammograms obtained
before and after anodic oxidation respectively. Similar cyclic voltammograms for
both FMI and GFD 2 felt electrodes were observed before anodic oxidation: in
addition to the hydrogen and oxygen evolution, a reducing peak around -0.5 V
(peak B in both Figures) appears, indicating that some carbon-oxygen functional
groups exist and reduced at that potential. After anodic oxidation, a more clear
oxidation peak around + 1.3 V (peak A in both cases) is observed, showing that a
change of surface carbon-oxygen complexes takes place at the electrode surface. It
was also observed that for GFD 2 felt electrode, an extra reduction peak, peak C,
appeared at the electrode potential of -1.10 V, exhibiting a more complicated
electrode process after electro-oxidation.
Figure 6.5 shows the effect of anodic oxidation on the electroactivity of the felt
247

A
<( ~ E 25 ~~
c: (l) I-I-:::3 ()
0
i 8
-so~~~~--~--~--~--~~--~--~~ -1.5 -1.0 -05 0 0.5 1.0 15. 2.0
(a)
248
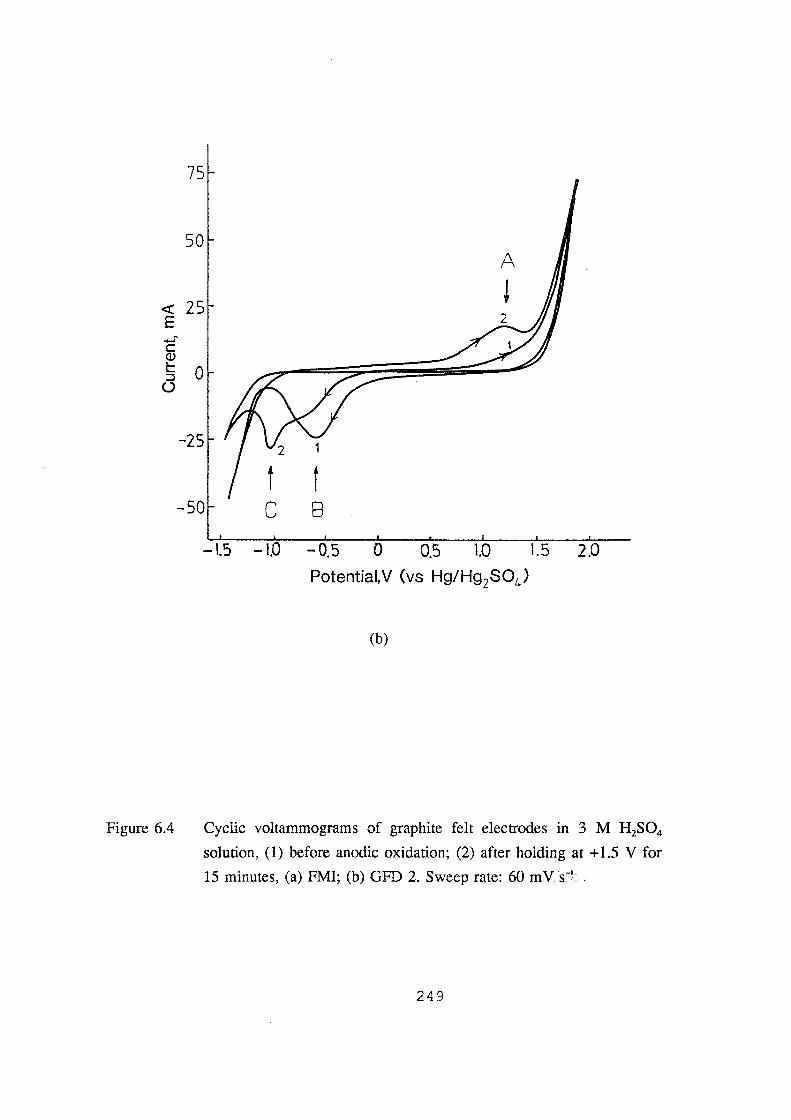
75
50 A
<( 25 l E -~ c Q) lo....
0 lo.... :::J ()
-25
-50 c B
-1.5 -1.0 -0.5 0 0.5 1.0 1.5 2.0
(b)
Figure 6.4 Cyclic voltammograms of graphite felt electrodes in 3 M H2S04
solution, (1) before anodic oxidation; (2) after holding at +1.5 V for
15 minutes, (a) FMI; (b) GFD 2. Sweep rate: 60 mVs"''~.
249
electrode in the vanadium solution. Mter holding for 15 minutes at a potential of
+ 1.5 V at which oxygen evolution starts to take place, both FMI and GFD 2 felt
electrodes showed considerable electrode deterioration, indicating that anodic
electrolysis of the felt in sulphuric acid at this condition results in a serious
oxidation of the felt electrodes. This result is consistent with that observed by
other authors [ 168-172], however, others have claimed that anodic oxidation could
enhance the electroactivity of graphite fibre electrodes for some electrochemical
systems[28,166,167]. A difference between the two felt electrodes can also be
observed. At the recording sensitivity, the GFD 2 felt electrode seems to maintain
some electroactivity for the vanadium redox reaction after anodic oxidation (curve
2 in Figure 6.5(b)), while for the FMI felt electrode (Figure 6.5(a)), a flat cyclic
voltammogram was obtained. This could be due to a superior oxidation stability
for the PAN based fibre compared with the rayon based fibre.
6.2.2 The Effect of Gas Oxidation on the Formation of Surface Carbon
Oxygen Complex
To understand more about the surface oxygen-interaction characteristics of the
FMI and GFD 2 felt samples which are currently used in the vanadium redox cell
development, samples were thermal treated in both nitrogen and air environments.
As reported by Golden et al[l01] and supported by experimental results obtained
previously in this lab[28], thermal treatment at a temperature of 400 °C and a
period of 30 hours produced the maximum carbon-oxygen interaction. The surface
250

50
-0.5 0 05 1.0 1.5 2.0 Potentiai,V (vs Hg/Hg2 S04 )
(a)
251
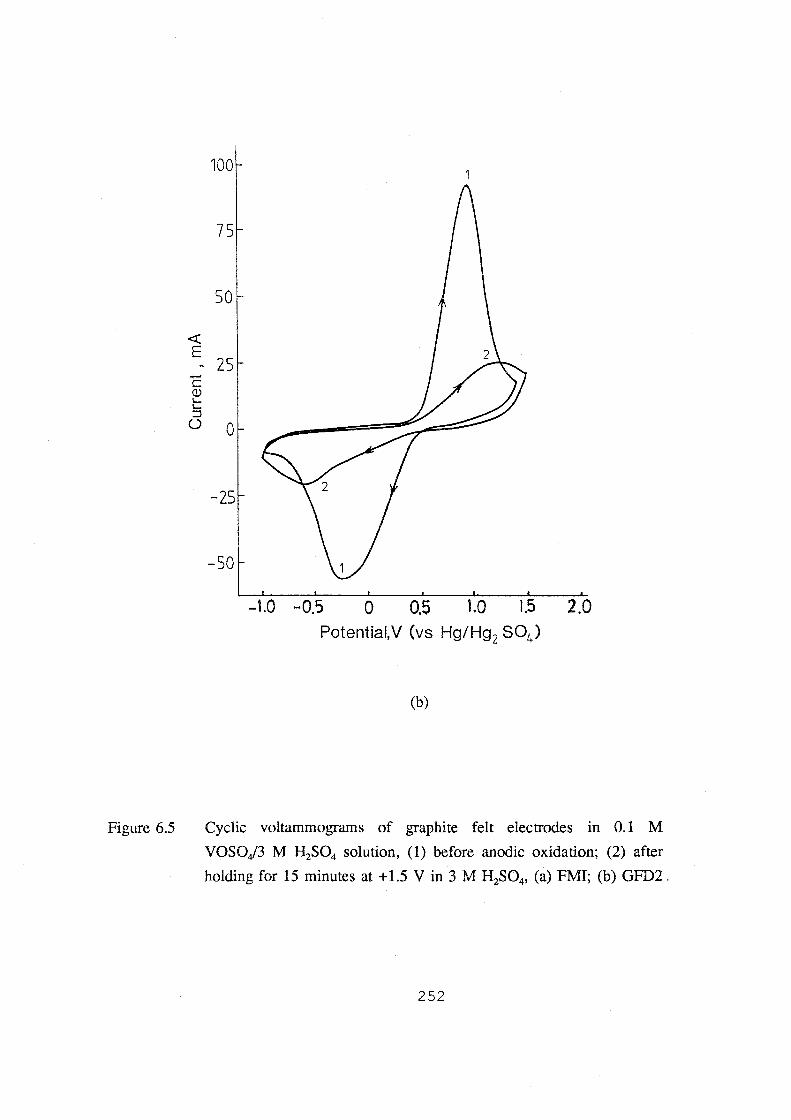
<(
E
100
50
~ 25
0
-50
-1.0 -0.5 0 0.5 1.0 1.5 2.0 Potentiai,V (vs Hg/Hg2 804)
(b)
Figure 6.5 Cyclic voltammograms of graphite felt electrodes in 0.1 M
VOSOJ3 M H2S04 solution, (1) before anodic oxidation; (2) after
holding for 15 minutes at +1.5 V in 3M H2S04, (a) FMI; (b) GFD2.
252
of the samples treated under these conditions was analysed with XPS (X-ray
photoelectron spectroscopy) and the results are shown in Figures 6.6 to 6.10 and
summarised in Table 6.4.
Figure 6.6 shows the overall XPS spectra for the thermally treated (labelled as
"T") and untreated (labelled as "N") GFD 2 felt. For both felt samples, an intense
Cls peak, an Ols peak and a weak O(KLL) Auger peak are observed. Signals
from other elements were not detected, indicating that their contents are very low.
Similar overall spectra were obtained in a previous study[28]. Figure 6.7 shows
the Cls region spectra for both the FMI and GFD 2 felt samples treated in N2 and
air environments respectively. No visible differences can be seen neither between
different samples nor between different treatment conditions, and both samples
show very narrow Cls "graphitic" peaks, indicating that both of the felts are
probably graphitised.
Since the samples treated in N2 and in air all show very similar Cls spectra, only
the Ols spectra, which show a relatively poor signal to noise ratio due to the low
amount of oxygen in the samples, could be used to work out changes in the
surface functional groups.
Some differences in the O(ls) region spectra between the two felt samples can be
seen in Figure 6.8. For the GFD 2 felt (Figure 6.8(a)), the O(ls) peak does not
shift under different oxidation treatment conditions, while for the FMI felt (Figure
6.8(b)), the sample treated in air has its peak shifted about 0.5 eV compared with
253

Title: C-felt GFD (T
~
""0 c 0 (J QJ lA
' lA .. c :::s 0 (J
:n .. .... lA c QJ .. c .....
1000
Figure 6.6
c: "" "" .. _.,_._c. <·i.:< '· : ... :::'5:::::· "T Scan: 1 Base Cps:297.486 Scale: 2.47905 N
800 600 400 200 Binding Ene~g~ (eU)
Overall XPS spectra of GFD 2 graphite felt, (N) untreated; (T)
treated in air at 400 °C for 30 hours.
254
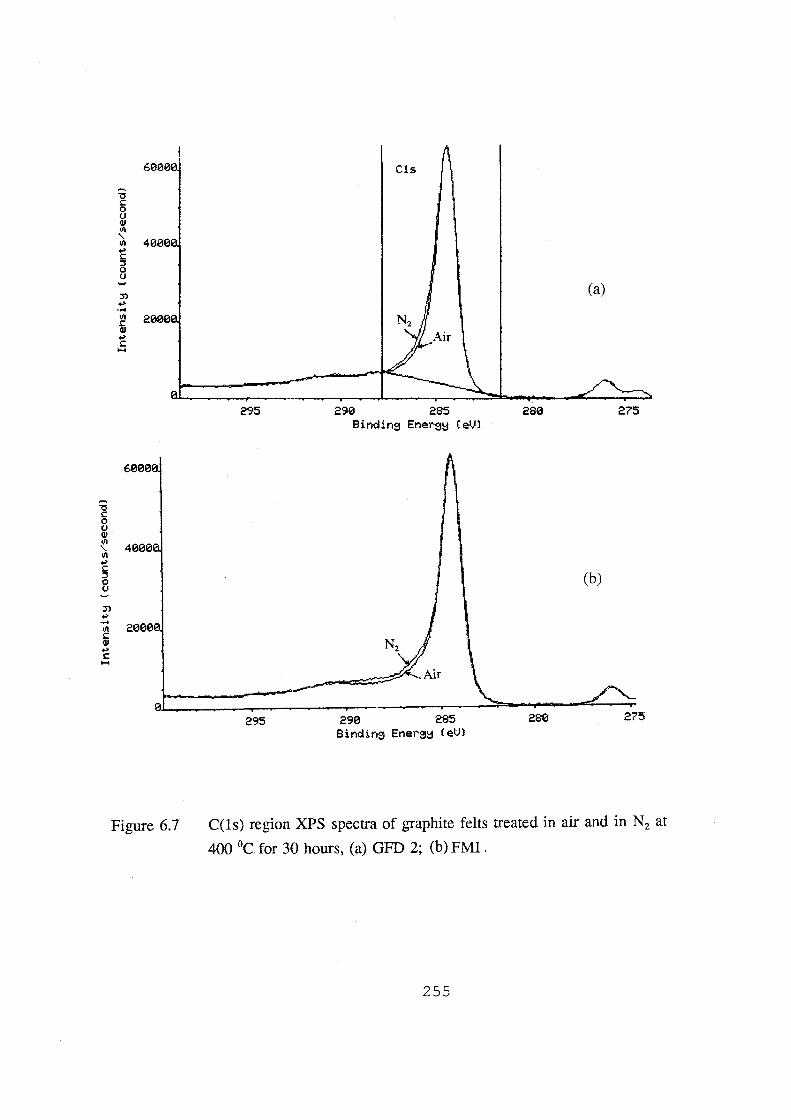
<:I c 0 () <II Ill
' Ill ... c ;:, 0 ()
j) ... ... Ill c <II ... c
<:I c 0 () <II Ill
' Ill ... § 0 ()
j) ... ... Ill c <II ... c ....
Figure 6.7
Cls
(a)
295 290 285 280 275 Bindin9 Ener9~ (eVl
(b)
295 290 285 280 275
C(ls) region XPS spectra of graphite felts treated in air and in N2 at
400 °C for 30 hours, (a) GFD 2; (b) FMI.
255
the one in N2• More detailed analysis revealed that these two felts samples show
different behaviour towards oxidation. Figure 6.9 and 6.10 illustrate the O(ls)
curve fitting spectra for the FMI and GFD 2 felt samples with different treatments.
It can be seen that for both of the felt samples, curve fitting reveals three peaks.
Peak 1 (ca. 535.4 eV for FMI and 535.6 eV for GFD respectively), has a low
intensity, and it probably due to the adsorbed water and some chemisorbed oxygen
[159]. Peak 2 (ca. 533.0 Ev for both FMI and GFD) and peak 3 (ca. 531.1 Ev for
both FMI and GFD) are the 0(1s) signals from C-OH and C=O (and/or C-0-C)
functional groups, respectively[159]. The most significant difference between these
two felts is the sensitivity to oxidation. Treatment of GFD 2 felt under oxidising
conditions (in air) results in a slight decrease in the intensity and relative peak
area of peak 3 which corresponds to the C=O functional groups decreased with no
significant effect on peak 2 (see Figure 6.9). A similar phenomenon was also
observed and reported by Proctor and Sherwood who studied the effect of heat
treatment on the surface characteristics of PAN based carbon fibres[151]. For the
FMI felt, however, the intensity and relative peak area of peak 2 decreased and
that of peak 3 increased significantly, indicating that when treated under identical
conditions in air, the C-OH surface functional groups on the FMI felt are oxidised
or converted to C=O or C-0-C functional groups.
It was also observed that for the FMI felt, the surface oxygen atomic
concentration is much higher for the sample treated in air than for that treated in
N2, but for the GFD 2 felt, not much difference is observed. Therefore, we can
conclude that the GFD 2 felt is more graphitic than the FMI, and would be less
256

Title: C-felt GFD (Tl Run:CPCC06 Re~: 1 (01s CoA:cpcc08 Re~: 1 (01s
540
Scan: 1 Base Cps: 8221 Max Cps: 10914 Scan: 1 Base Cps:11418.6 Scale: 2.95588
535 530 525 Bindin~ Ener~~ (eV)
(a)
257

Title: carbon-felt FMI (T) Run:CPCC12 Reg: 1 (01s l Scan: CoM:cpcc10 Reg: 1 (01s ) Scan:
~ s:: 0 (J Q.l 11'1
' 11'1 ...,. § 0 (J
~ ...,. ... 11'1 c Q.l ...,. s::
540
1 Base Cps: 9032 Max Cps: 15879 1 Base Cps:13035.2 Scale: 2.20973
535 530 Binding Energ~ (eVl
(b)
525
Figure 6.8 O(ls) XPS region spectra of graphite felts treated in air and in N2 at
400 °C for 30 hours, (a) GFD 2; (b) FMI .
258

Run: CPCC10 Reg: Scan: 1 Chans:
1 107
Start eV: 538.45 End eV: 527.80
Fit: 1.2
100% lntensit!::t: 100% Area
Line Ell'lt. Energ!::t
GAUSS 01s 531.08 GAUSS 01s 533.02 GAUSS 01::. 535 .4~:
3274. 133241.
Int.
50.03 87.88 13.2:::
538 536 534 532 530 528
FWHM Area
2.64 34.08 2.47 56.17 .-. ...,,-, C.( 0 '? .47
538 536 534 532 530 528 Binding Energ!::t
(a)
259
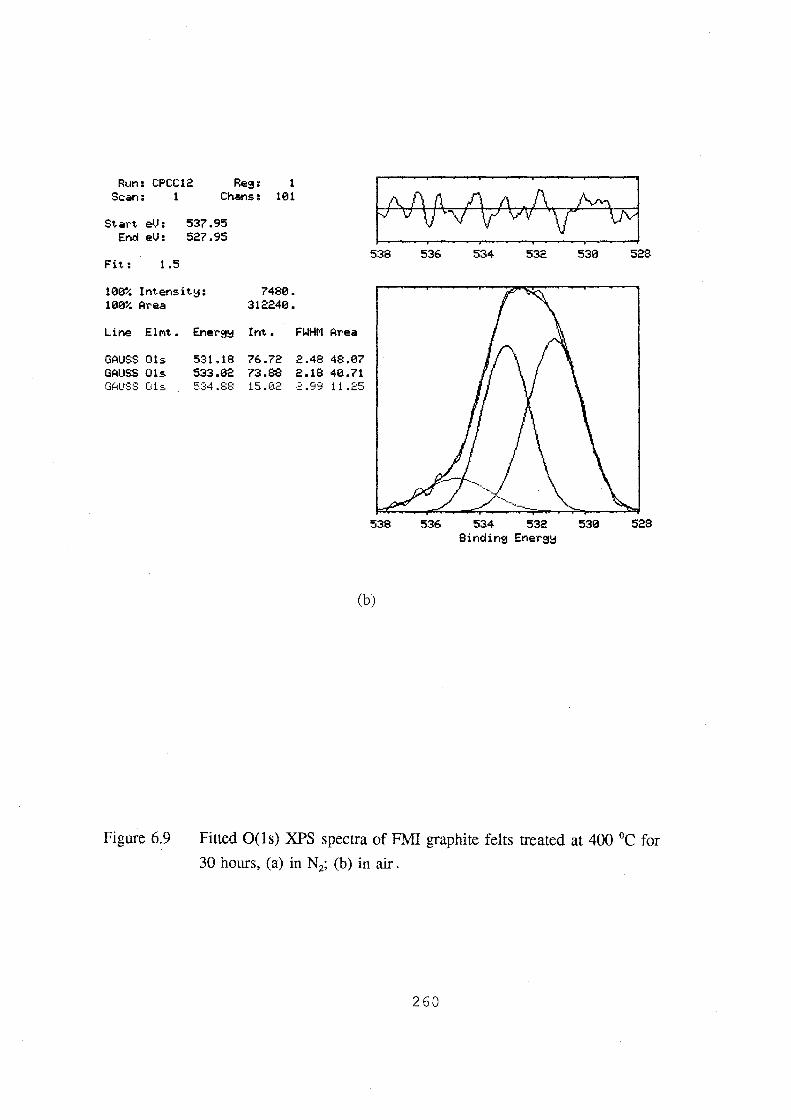
Run: CPCC12 Reg: Scan: 1 Chans:
1 101
Start eV: 537.95 End eV: 527.95
Fit: 1.5
100% Intensit~: 100% Area
Line ElMt. Energ~
GAUSS Ols 531.18 GAUSS Ols 533.02 GAUSS Ois 534.88
7480. 312240.
Int.
76.72 73.88 15.02
538 536 534 532 530 528
FWHM Area
2.48 48.07 2.18 40.71 2.9·~ 11 .25
538 536 534 532 530 528 Binding Energ~
(b)
Figure 6.9 Fitted O(ls) XPS spectra of FMI graphite felts treated at 400 °C for
30 hours, (a) in N2; (b) in air.
260

Run: CPCC08 Reg: Scan: 1 Chans:
1 106
Start eV: 539.20 End eV: 528.70
Fit: 3.0
100% Intensit~: 100% Area
Line Ell"'t. En erg~
GAUSS 01s 531.12 GAUSS 01s 532.95 C:iAU:::S 01::. 535.5:3
1001. 42707.
Int.
51.89 84.29 2B.22
538 536 534 532 530
FWHM Area
2.15 27.43 2.47 51.49 3.00 2[1.85
538 536 534 532 530 Binding Energ~
(a)
2 61
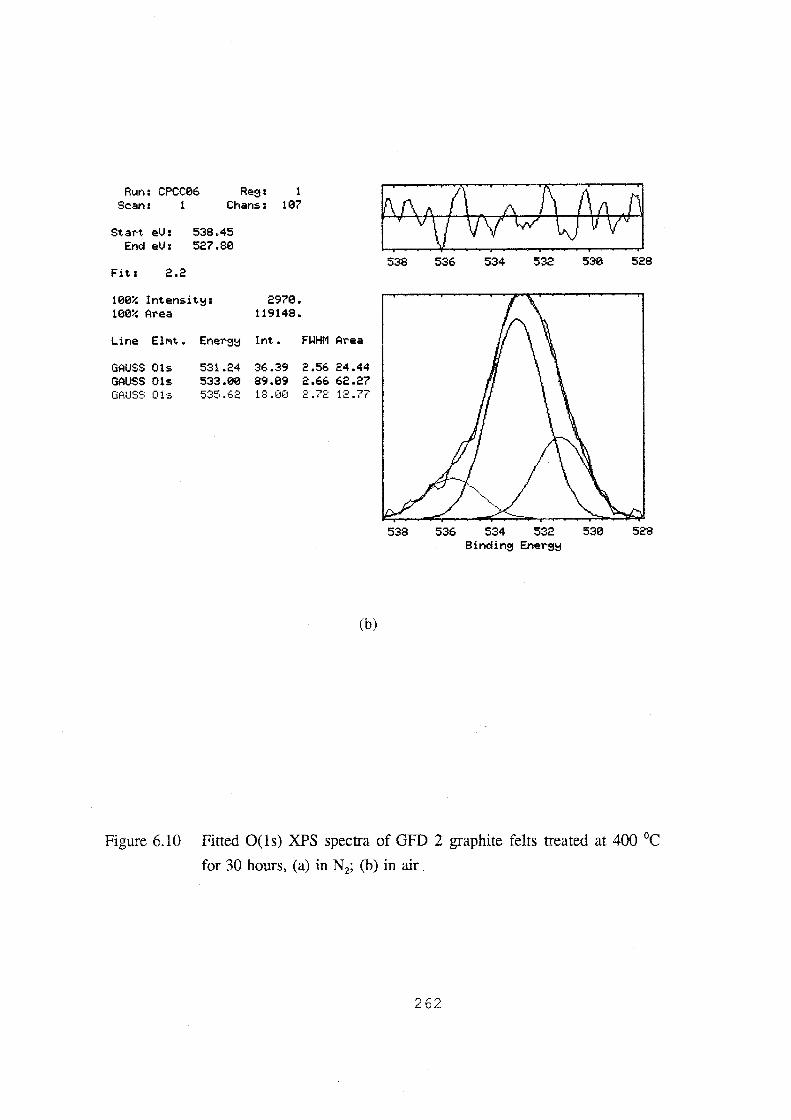
Run: CPCC06 Reg: Sc:an: 1 Chans:
1 107
Sta~t eV: 538.45 End eV: 527.80
Fit: 2.2
100% Intensit\::1: 100% A~ea
Line Ell"lt. Ene~g\::1
GAUSS 01s 531.24 GAUSS 01s 533.00 GAUSS Ois 535.62
2970. 119148.
Int.
36.39 89.09 18.00
538 536 534 532 530 528
FWHM A~ea
2.56 24.44 2.66 62.27 ... , -,.-, c. • ' c. 12.77
538 536 534 532 530 528 Binding Ene~g\::1
(b)
Figure 6.10 Fitted O(ls) XPS spectra of GFD 2 graphite felts treated at 400 °C
for 30 hours, (a) in N2; (b) in air.
262

prone to form carbon-oxygen surface functional groups, such as C=O or C-0-C.
It should be noted that the treatment of the FMI felt in air at 400 °C for 30 hours
was found to produce an enhancement in the electroactivity for the vanadium
redox flow cell applications[28]. This was believed to be due to the
electrocatalysing effect of increased C=O and C-OH functional groups[28].
Table 6.4 XPS Results Comparison on FMI and GFD 2 Felt
GFD FMI Characteristics
N2, 400 °C, Air, 400 °C, N2, 400 °C, Air, 400 °C, 30 hrs 30 hrs 30 hrs 30 hrs
ch peak, b.e., e v 284.3 284.3 284.3 284.3
ols peak 1, b.e., 535.58 535.62 535.43 (9.47) 534.88 (11.25) eV (area,%) (20.85) (12.77)
ols peak 2, b.e., 532.95 533.00 533.02 533.02 (40.71) eV (area,%) (51.49) (62.27) (56.17)
ols peak 3, b.e., 531.12 531.24 531.08 531.18 (48.07) eV (area,%) (27.43) (24.44) (34.08)
C=O/C-0 area 0.533 0.392 0.607 1.181 ratio
Atomic cone. of 2.9 3.6 5.7 10.1 oxygen(%)
6.2.3 Surface Microstructure of Fibres in FMI and GFD 2 Felts
As explained by Singer[102], depending on the precursors and processing
conditions, the behaviour of carbon products can vary from that of carbon which
has a microcrystalline structure and more readily reacts with oxygen, to that of
263

graphite which exhibits a highly ordered crystalline orientation and less
susceptible to oxygen. The experimental results shown above indicate that the FMI
and GFD 2 felts exhibit a considerable difference in interaction with oxygen. This
must be attributed to their differences in surface microstructure.
To prove this, the two types of felt were examined under the scanning electron
microscope (SEM). The morphology of fibres from FMI and GFD 2 felt are
shown in Figure 6.11 and 6.12. A totally different appearance of the individual
fibres between the two felts can be observed. The fibre from the FMI felt, shown
in Figure 6.11(a), has an uneven and dusty surface, while Figure 6.11(b) for the
GFD 2 fibre shows a clean and flat surface. Figure 6.12(a) and (b) give a
comparison in the microstructure of the cross-section for the FMI and GFD 2
fibres respectively. It is clear that the construction for an individual GFD 2 fibre is
uniform and solid, while in the case of FMI sample, the individual fibre looks like
a bundle of a several fibres. As the FMI fibre is less graphitic, its structural
characteristics should give rise to more edge planes and a high defect
concentration which can more readily react with oxygen[100]. This explains why
the FMI felt is more sensitive to air oxidation and anodic electrolysis than the
GFD 2 felt.
6.2.4. The Effect of Charging and Overcharging on the Surface
Characteristics of Graphite Felt Electrodes
It was shown in Sections 6.2.1 and 6.2.2 that rayon based and PAN based graphite
264
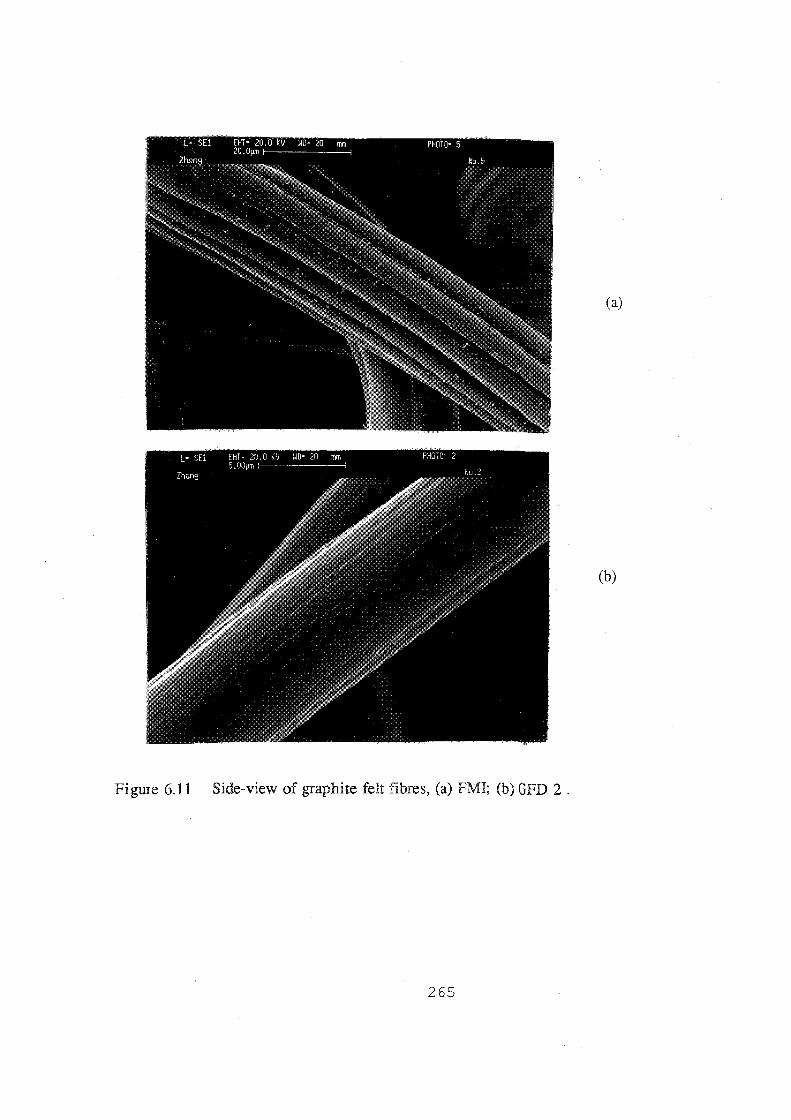
(a)
(b)
Figure 6.11 Side-view of graphite felt fibres, (a) FMI; (b) GFD 2.
265

(a)
(b)
Figure 6.12 Cross-section of graphite felt fibres, (a) FMI; (b) GFD 2.
266
felts display different interactions with oxygen under anodic and gas oxidation
conditions. In the vanadium redox flow battery, the felt active layer on the
positive electrode of the battery works as an anode and contacts an oxidising
electrolyte during cell charging. Furthermore, at high states-of-charge, oxygen
evolution takes place. If the cell is overcharged, oxygen evolution becomes the
predominant reaction in the positive half of the vanadium redox flow battery. The
change in the surface chemical characteristics of the graphite felt electrodes under
these operating conditions is important, since it will directly affect the
electroactivity and cycle life of the electrode in the vanadium redox flow cell.
FMI and GFD 2 felt samples were bonded onto the carbon-plastic composite sheet
to form the composite electrodes for the laboratory scale test cell with the
procedure described in Section 3.2.2.2. The electrodes were subjected to normal
charge/discharge and overcharging conditions. After operation in the test cell, the
felt specimens were prepared with the procedure described in section 3.3.4.3 for
XPS analysis.
6.2.4.1 General Analysis
XPS analysis of the carbon felt samples were performed and interpreted by Dr.
Celestino Padeste and the results obtained are presented in Tables 6.5 and 6.6.
In the survey spectra of all samples only carbon and oxygen peaks were found,
indicating that the surface concentrations of any other contaminants were below
267
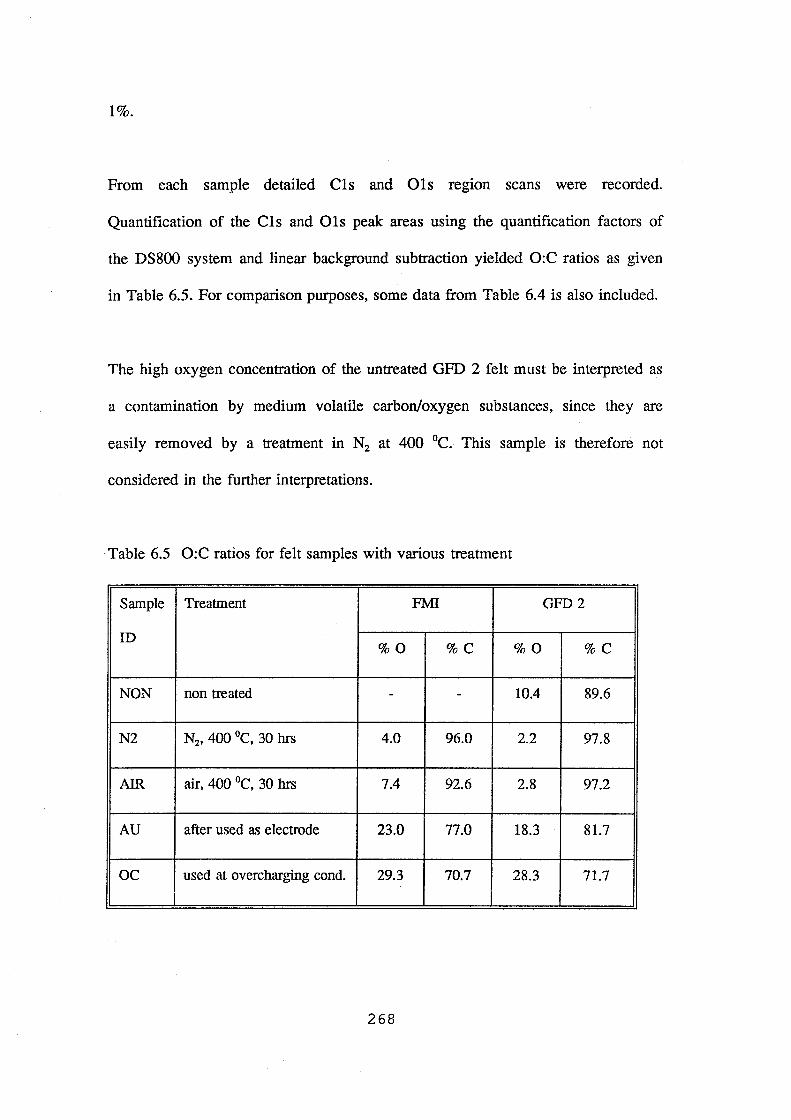
1%.
From each sample detailed Cls and Ols region scans were recorded.
Quantification of the Cls and Ols peak areas using the quantification factors of
the DS800 system and linear background subtraction yielded O:C ratios as given
in Table 6.5. For comparison purposes, some data from Table 6.4 is also included.
The high oxygen concentration of the untreated GFD 2 felt must be interpreted as
a contamination by medium volatile carbon/oxygen substances, since they are
easily removed by a treatment in N2 at 400 °C. This sample is therefore not
considered in the further interpretations.
Table 6.5 O:C ratios for felt samples with various treatment
Sample Treatment FMI GFD2
ID %0 %C %0 %C
NON non treated - - 10.4 89.6
N2 N2, 400 °C, 30 hrs 4.0 96.0 2.2 97.8
AIR air, 400 °C, 30 hrs 7.4 92.6 2.8 97.2
AU after used as electrode 23.0 77.0 18.3 81.7
oc used at overcharging cond. 29.3 70.7 28.3 71.7
268
Treatment of the felts in air causes a slight oxidation whereas the oxidation under
normal cell working conditions and especially under overcharging conditions is
quite pronounced.
Detailed peak analysis was performed on Cis peaks of the felts after they had
been used as positive electrodes in the vanadium redox flow battery under normal
and overcharging conditions.
6.2.4.2 Samples Used as Electrodes at Normal and Overcharging Cell Operating
Conditions
In the aforementioned series of papers [151,154,155,159-161], the C1s line is
fitted by 5 peaks: the main peak ("graphitic carbon") and four peaks in the higher
binding energy region arising from carbon bound to oxygen ("oxides 1,2,3 and
4"). Oxide 1 (b.e. shift ""' 1.5 e V) was assigned to carbon with bounds to one
oxygen atom such as alcohols (C-OH) or ethers (C-0-C). Oxide 2 (b.e. shift ""' 3
eV) is the peak of carbonyl (C=O) type groups, and oxide 3 (b.e. shift ""' 4.5 eV)
corresponds to carboxyl (COOH) or ester (COOR) groups. Oxide 4 (b.e. shift ""' 6
eV) is most probably a superimposition of -C03- type groups and the n-n* shake
up satellite typical for carbon compounds with extended aromatic systems. This
assignment of the peaks and their relative positions is in agreement with data
published by other authors[191].
The curve fittings for both felts at various oxidation conditions are shown m
269
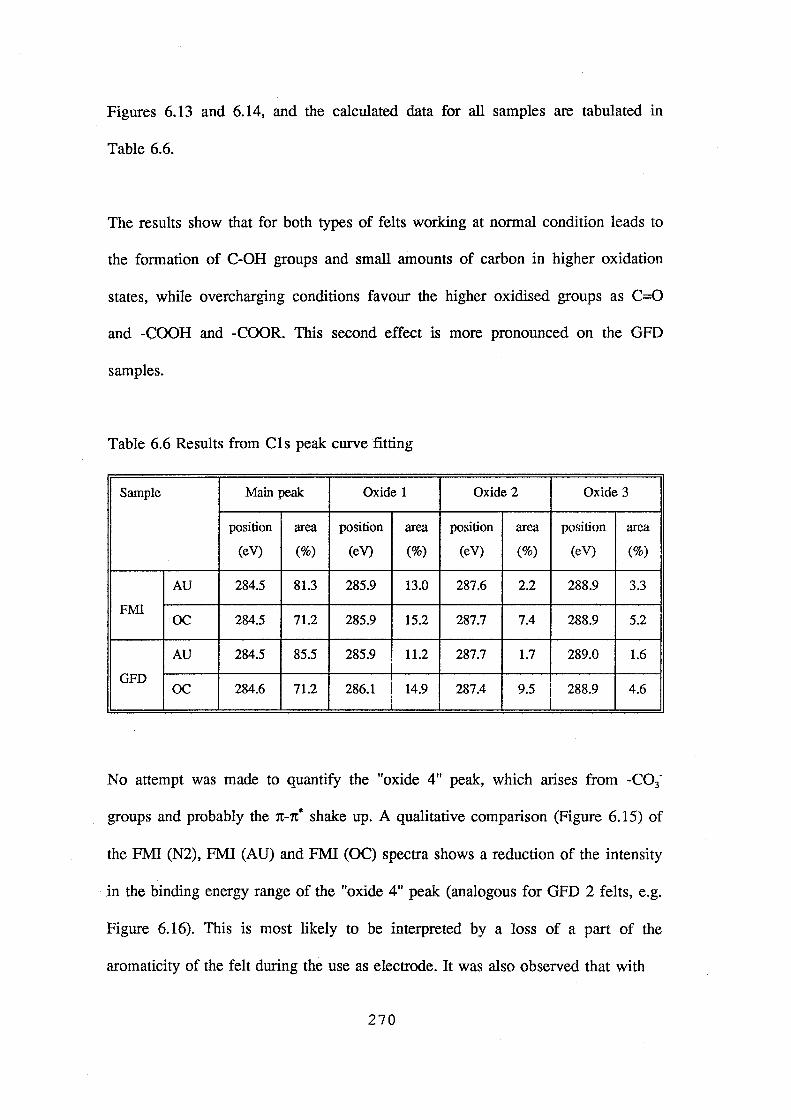
Figures 6.13 and 6.14, and the calculated data for all samples are tabulated in
Table 6.6.
The results show that for both types of felts working at normal condition leads to
the formation of C-OH groups and small amounts of carbon in higher oxidation
states, while overcharging conditions favour the higher oxidised groups as C=O
and -COOH and -COOR. This second effect is more pronounced on the GFD
samples.
Table 6.6 Results from C1s peak curve fitting
Sample Main peak Oxide 1 Oxide 2 Oxide 3
position area position area position area position area
(eV) (%) (eV) (%) (eV) (%) (eV) (%)
AU 284.5 81.3 285.9 13.0 287.6 2.2 288.9 3.3
FMI oc 284.5 71.2 285.9 15.2 287.7 7.4 288.9 5.2
AU 284.5 85.5 285.9 11.2 287.7 1.7 289.0 1.6
GFD oc 284.6 71.2 286.1 14.9 287.4 9.5 288.9 4.6
No attempt was made to quantify the "oxide 4" peak, which arises from -C03-
groups and probably the 1t-1t* shake up. A qualitative comparison (Figure 6.15) of
the FMI (N2), FMI (AU) and FMI (OC) spectra shows a reduction of the intensity
in the binding energy range of the "oxide 4" peak (analogous for GFD 2 felts, e.g.
Figure 6.16). This is most likely to be interpreted by a loss of a part of the
aromaticity of the felt during the use as electrode. It was also observed that with
270

Run: CPCC10 Seem:
Start eV: 290.98 End eV: 282.08
Fit: 33.1
2 90
100% lntensit~: 49376. 100% Area 817106.
Line Elmt. Energ~ Int. FWHM Area
CCi0 Cis 284.6i 0.00 GAUSS Cis 284.96 0.00 GAUS:':; Cls 2:::6.40 0.00 GAUSS (:1:;;. 288 .. 7'3 0.(1(1
(a)
Run: CPCCi6 Scan: 1
Start eV: 290.98 End eV: 282.08
Fit: 1.5
100% lntensit\:1: 100% Area
2 90
i5288. 3582i0.
i .25 1.25 1 .23 1 .2(1
Line Elmt. Energy Int. FWHM
CCifJ Cis 284.54 99.94 i.53 GAUSS Cls 285.9(1 18.42 1.58 GAU~:;::; Cl:=. 2:::7 .. t.~: 4.14 1.19 GAUS~:; Ci:=. 2::::::.92 4.90 1.51
(b)
0.00 0.00 0.(1(1 0.(1(1
Area
8i.32 13.05 2.19 :3.29
271
1~:.: :~-1 290 288 286
•'
/' I
/ l
.~·--__ , ~------------
290 288 286
290 288 286
290 288
284
'\
284
284

Run: CPCC14 Reg: 2 Scan: 1 Chans: 90
Start eV: 290.98 End eV: 282.08
Fit: 1.7
100% Intensi t~: 100% Area
Line Elmt. Ener9~
CC10 C1s 284.51 GAUSS Cls 285.90 GAUS:3 C1:s. 287.67 GAU:::::: Cl:s. 2SE:.90
(c)
7156. 187516.
Int.
94.84 21.69 10.7:::
t: .26
FWHM
1.58 1.75 1 • 7::: 1 "'"" • • _1(
290 288 286 284
Area
71.42 15.23 7 .4:1 5.17
290 288 286 284 Binding Energ~
Figure 6.13 Fitted C(ls) spectra of FMI graphite felt, (a) treated in N2 at 400 °C
for 30 hours; (b) after normal use as electrode; (c) after overcharge
for 50 minutes at 21.7 mNcm2.
272
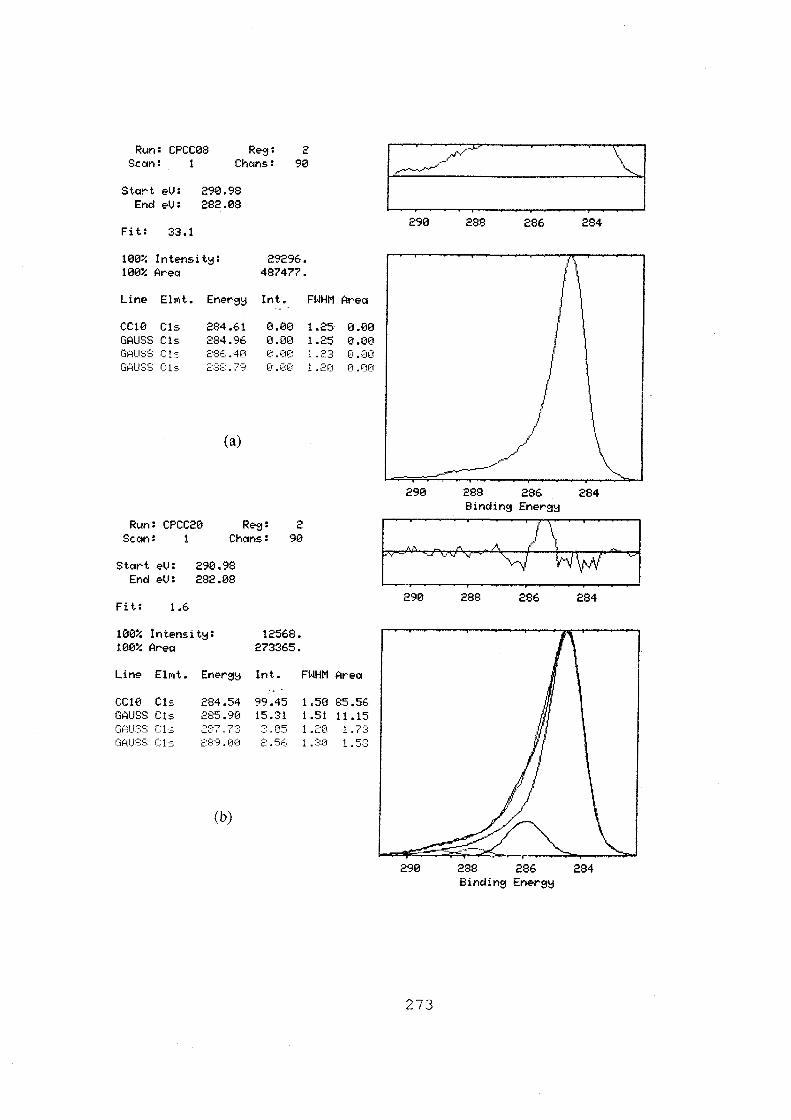
Run: CPCC08 Scan: 1
Start eV: 290.98 End eV: 282.08
Fit: 33.1
2 90
100% Intensit~: 29296. 100% Area 487477.
Line Elmt. Ener~~ Int. FWHM Area
CC10 C1s 284.61 GAUSS C1s 284.96 GAU::;:;:; Cl::. 2:::6.40 GAUSS Cl::. 2::::::.79
(a)
Run: CPCC20 Scan:
Start e~J: 290.98 End ev: 282.08
Fit: 1.6
100% Intensit~:
100% Area
Line Elmt. Ener~~
CC10 Cis 284.54 GAUSS Cls 285.90 GAUSS CL 287 . 7:~: GAU::;:::; Cis. 2::::9.00
(b)
0.00 1.25 0.00 1.25 o .o~:::1 1 .2:::: 0.00 1 .2~:1
2 90
12568. 273365.
Int.
99.45 15.31
~: .. 05 2.56
FWHM
1.50 1.51 1.20 1 .::::o
0.00 0.00 0.00 0.00
Area
85.56 11.15
1.73 1.5:::
290 288 286 284
290 288 286 284 Binding Energl:f
290 288 286 284
290 288 286 284
273

Run: CPCC18 Reg: 2 Seem: 1 Chcms: 90
Start eU: 290.98 End eU: 282.08
Fit: 1.6
100% Intensit!;l: 100% Area
Line Elmt. Energ!:J
CC10 C1s 284.58 GAUSS Cis 286.09 GAUS::O: CL;. 2:::7.40 GAUSS Cls 2:::::: .'j2
(c)
5096. 148950.
In~._
95.78 23.66 17.20 9.15
FWHM
1.75 1.75 1.54 1 .:C:9
Area
71 .21 14.90 9.51 4.56
290 288 286 284
290 288 286 284 Binding Energ!:J
Figure 6.14 Fitted C(ls) spectra of GFD 2 graphite felt, (a) treated in N2
at 400
°C for 30 hours; (b) after normal use as electrode; (c) after
overcharge for 50 minutes at 21.7 mNcm2 •
274
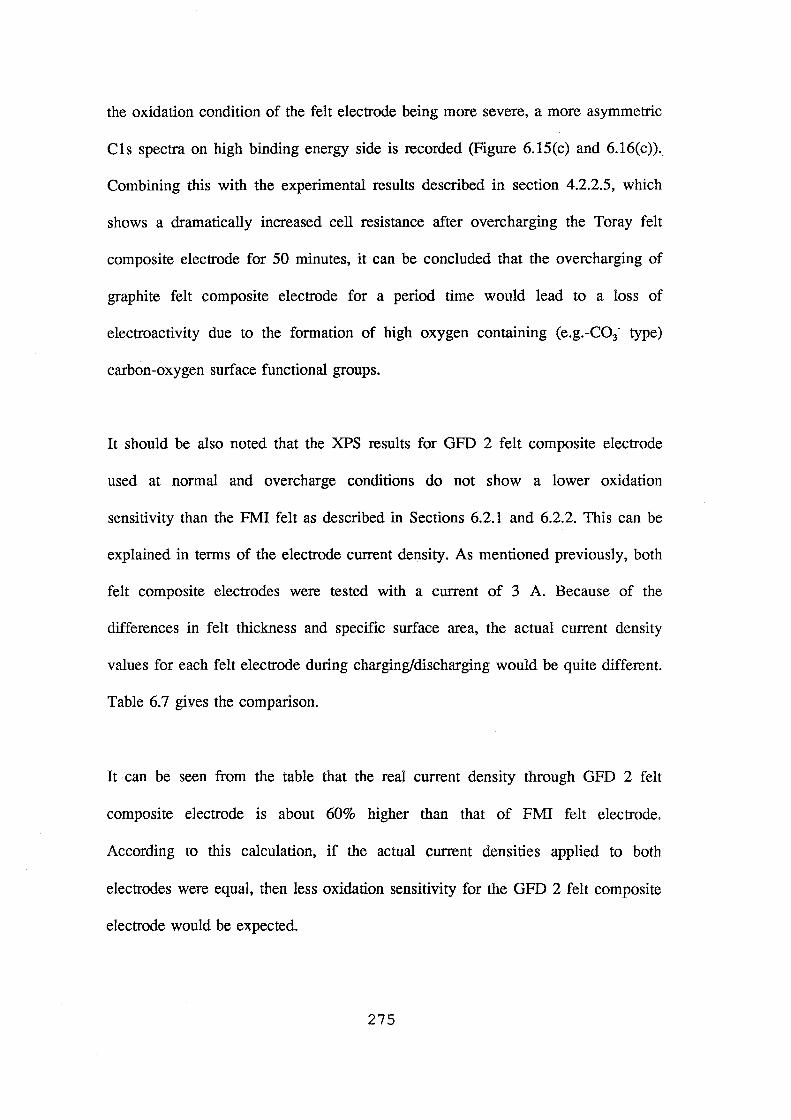
the oxidation condition of the felt electrode being more severe, a more asymmetric
Cls spectra on high binding energy side is recorded (Figure 6.15(c) and 6.16(c)).
Combining this with the experimental results described in section 4.2.2.5, which
shows a dramatically increased cell resistance after overcharging the Toray felt
composite electrode for 50 minutes, it can be concluded that the overcharging of
graphite felt composite electrode for a period time would lead to a loss of
electroactivity due to the formation of high oxygen containing (e.g.-C03- type)
carbon-oxygen surface functional groups.
It should be also noted that the XPS results for GFD 2 felt composite electrode
used at normal and overcharge conditions do not show a lower oxidation
sensitivity than the FMI felt as described in Sections 6.2.1 and 6.2.2. This can be
explained in terms of the electrode current density. As mentioned previously, both
felt composite electrodes were tested with a current of 3 A. Because of the
differences in felt thickness and specific surface area, the actual current density
values for each felt electrode during charging/discharging would be quite different.
Table 6.7 gives the comparison.
It can be seen from the table that the real current density through GFD 2 felt
composite electrode is about 60% higher than that of FMI felt electrode.
According to this calculation, if the actual current densities applied to both
electrodes were equal, then less oxidation sensitivity for the GFD 2 felt composite
electrode would be expected.
275

"t '-<f~
Title:-~ (N2J Rtm:CPCC10 Re:;,: 2 (C1s
'U s:: 0 u Ql oil
' oil ... s:: ~ 0 u
j) ... ... oil s:: Ql ... s:: ....
Scan: Base Cps: 2512 ~l•:1x Cps: 55889
/ __,/
~-~---_ .... _______ .-... -----------295
Title: FMI after reaction Run:CPCC16 Re:;,: 2 (Cls ) Scan:
j) ... .... oil s:: Ql ... s::
290
295 290
285 Binding Energ~ (eVJ
Base Cps: 1132 11ax Cps: 12070
285
276
(a)
(b)
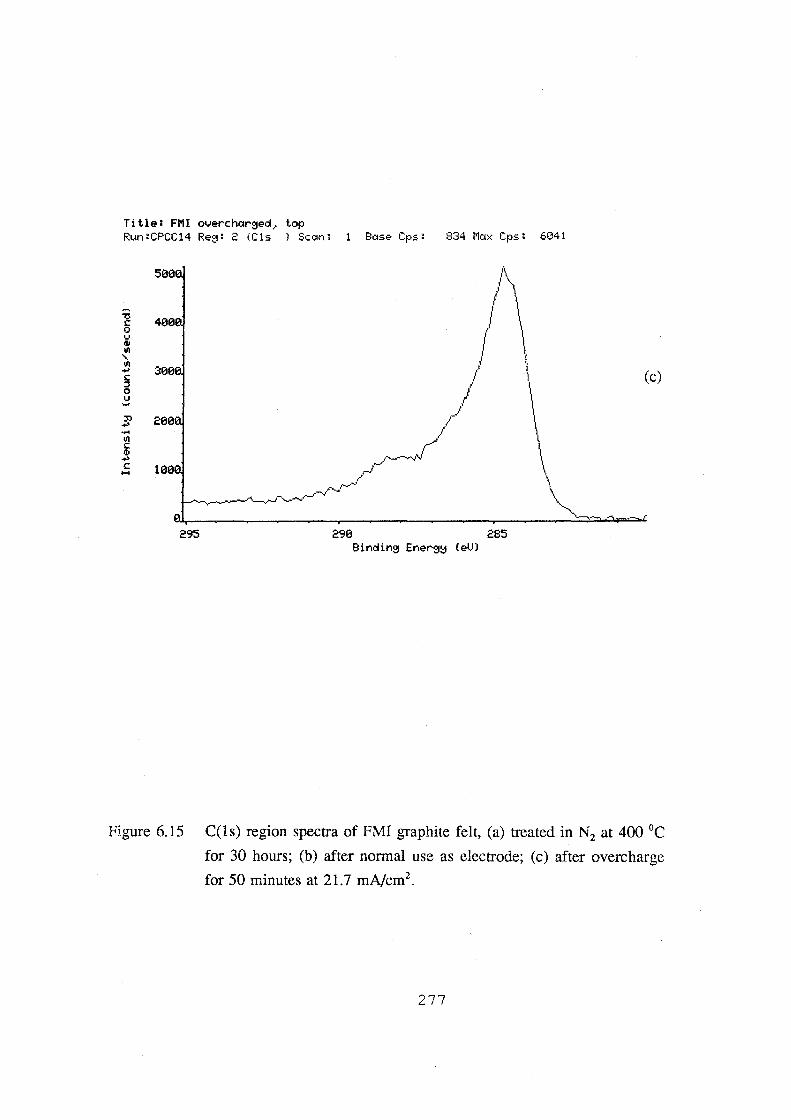
Title: FMI overchar~ed~ top Run:CPCC14 Re~: 2 (C1s ) Scan: 1 Base Cps: 834 Max Cps: 6041
(c)
~--295 290 285
Bindin~ Ener~~ (eV)
Figure 6.15 C(ls) region spectra of FMI graphite felt, (a) treated in N2 at 400 °C
for 30 hours; (b) after normal use as electrode; (c) after overcharge
for 50 minutes at 21.7 mNcm2.
277
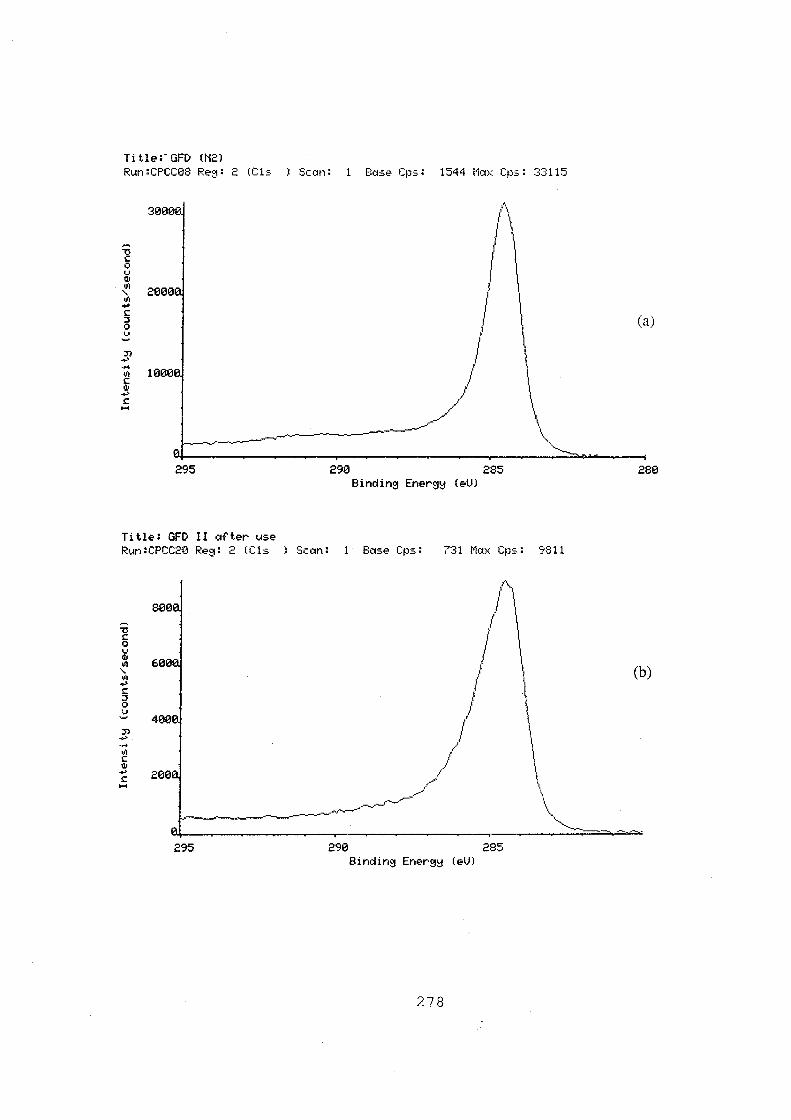
Title:-GFD (N2J Run:CPCC08 Re::_1: 2 (Cls ) Scan: Base Cps: 1544 Max Cps: 33115
"'0 c 0 u Ill
3000
~ 2000 JJl ~
c :::; 0 u
295
Title: GFD II after use Run:CPCC20 Re::_1: 2 (Cis
"'0 c 0 u Ill JJl
" oJI ~
c :::; 0 u
295
290 285 Bindin9 Ener9~ (eVl
Seem: Base Cps: 731 Nax Cps: 9811
290 285 Bindin9 Ener9~ (eVl
278
(a)
280
(b)
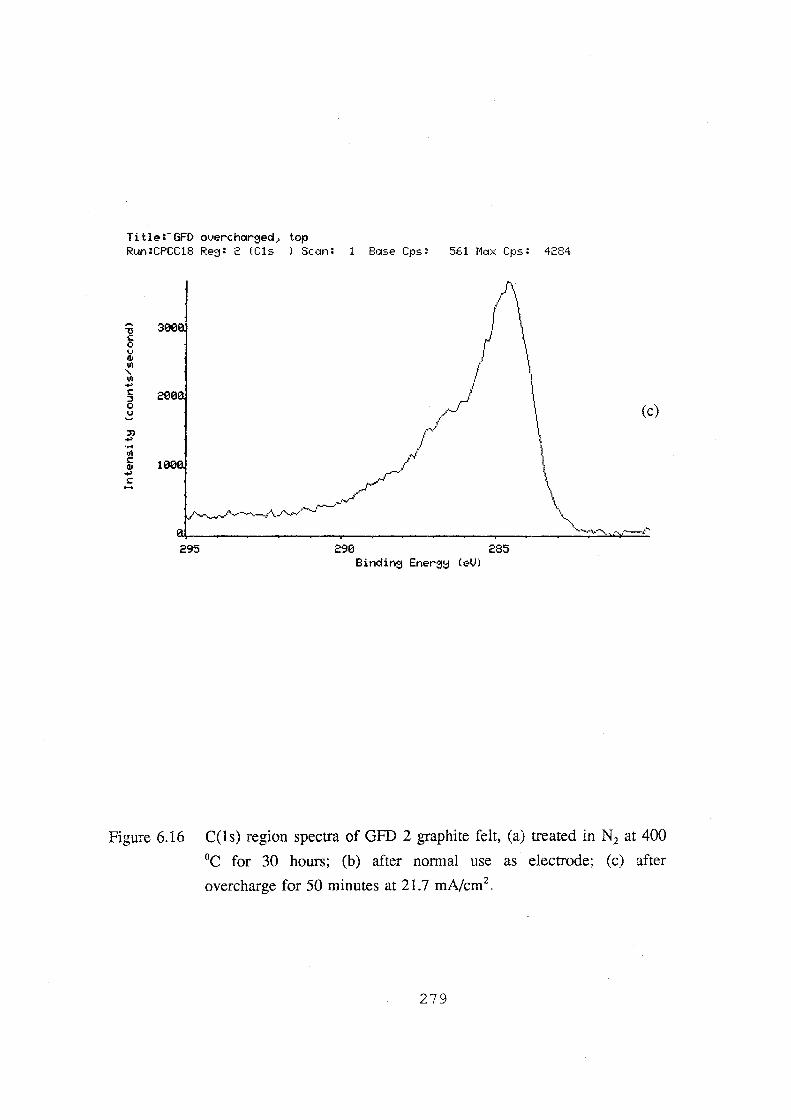
Title:-GFD overcharged~ top Run :CPCC18 Re3: 2 (Cls ) Scan: 1 Base Cps: 561 t1ax Cps: 4284
::n .... ... rJl c q, .... c
295 290 285
Figure 6.16 C(ls) region spectra of GFD 2 graphite felt, (a) treated in N2 at 400
°C for 30 hours; (b) after normal use as electrode; (c) after
overcharge for 50 minutes at 21.7 mA/cm2.
279
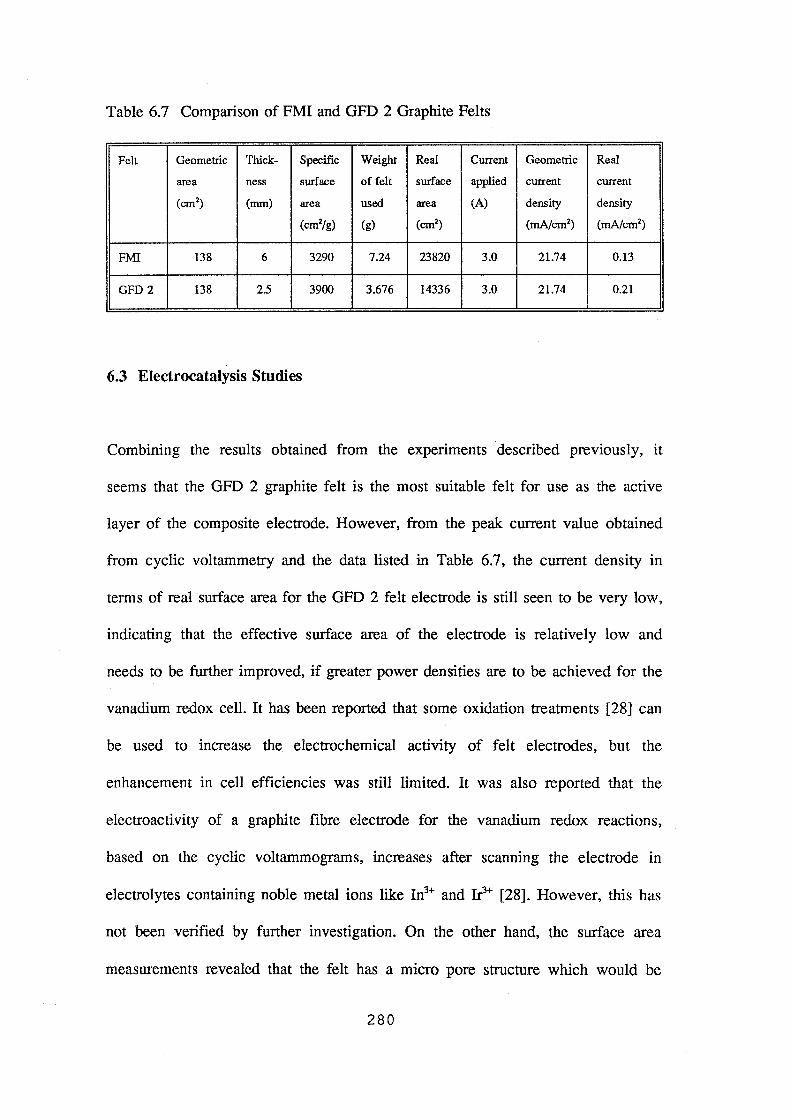
Table 6.7 Comparison of FMI and GFD 2 Graphite Felts
Felt Geometric Thick- Specific Weight Real Current Geometric Real
area ness surface of felt surface applied current current
(cm2) (nun) area used area (A) density density
(cm2/g) (g) (cm2) (mA/cm2) (mA/cm2)
FMI 138 6 3290 7.24 23820 3.0 21.74 0.13
GFD2 138 2.5 3900 3.676 14336 3.0 21.74 0.21
6.3 Electrocatalysis Studies
Combining the results obtained from the experiments described previously, it
seems that the GFD 2 graphite felt is the most suitable felt for use as the active
layer of the composite electrode. However, from the peak current value obtained
from cyclic voltammetry and the data listed in Table 6.7, the current density in
terms of real surface area for the GFD 2 felt electrode is still seen to be very low,
indicating that the effective surface area of the electrode is relatively low and
needs to be further improved, if greater power densities are to be achieved for the
vanadium redox cell. It has been reported that some oxidation treatments [28] can
be used to increase the electrochemical activity of felt electrodes, but the
enhancement in cell efficiencies was still limited. It was also reported that the
electroactivity of a graphite fibre electrode for the vanadium redox reactions,
based on the cyclic voltammograms, increases after scanning the electrode in
electrolytes containing noble metal ions like In3+ and Ir+ [28]. However, this has
not been verified by further investigation. On the other hand, the surface area
measurements revealed that the felt has a micro pore structure which would be
280

suitable as an electrocatalyst support. As evidence, the NASA group has already
reported the successful application of a gold-lead electrocatalyst system on the
graphite felt electrode surface to increase the cell efficiencies of the iron
chromium redox flow cell battery[36-38]. In order to obtain higher efficiencies for
the new all vanadium redox flow cell system, it is appropriate to investigate a new
activation method employing electrocatalysts and study its effect on the
electrochemical activity.
6.3.1 Activation Evaluation of Treated Felt Samples With Cyclic
Voltammetry
Figures 6.17 to 6.20 show cyclic voltammograms of the GFD 2 graphite felt
electrodes with different treatments, and the effect of the treatments is summarised
in Table 6.8. As suggested by Pletcher[30], a few transition metal elements were
selected as electrocatalysts. Solutions containing Ag+, Nf+ and Mn2+ were prepared
and the felt samples were treated with the procedure described in Section 3.3.5.1.
The treated felts were fabricated into small felt composite electrodes for cyclic
voltammetry and tested in the vanadium solution. Details for this test are
described in Section 3.3.3.
For the felt treated with Ni2+ and Mn2+, no significant improvement is observed
from the cyclic voltammograms (Fig. 6.18 and 6.19 respectively), indicating that
the existence of these ions neither increases the electron transfer rate nor enhances
the concentration of active sites for the vanadium redox reactions.
281
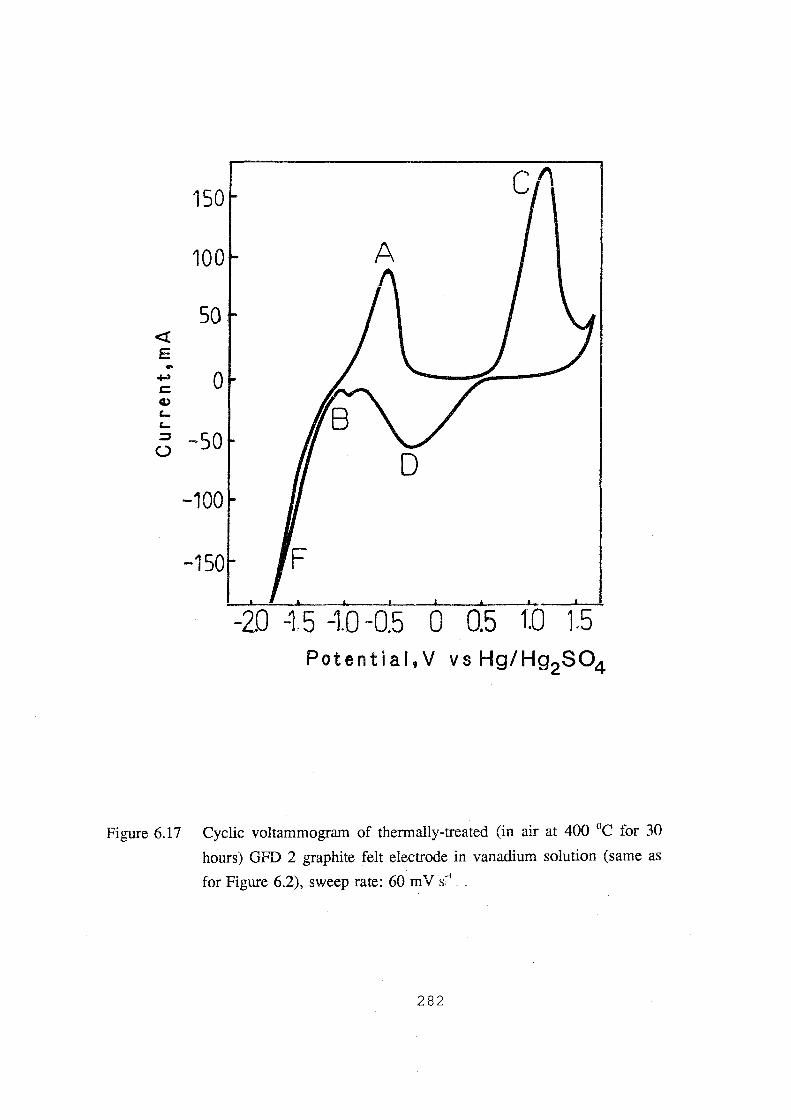
50 <(
E .. ......, 0 c: G)
'-'-:;:, -50 ()
-100
-20 -15 -10 -0.5 0 0.5 1.0 1.5 Potentiai,V vs Hg/Hg2S04
Figure 6.17 Cyclic voltammogram of thermally-treated (in air at 400 °C for 30
hours) GFD 2 graphite felt electrode in vanadium solution (same as
for Figure 6.2), sweep rate: 60 m V s·' ~ .
282

<! E
150------------------------~
100
50
0
-50
-100
F 150~~~~--~~--~~--~
-2.0 -1.5 -1.0-0.5 0 0.5 1.0 1.5 Potential, V vs Hg/Hg2S04
Figure 6.18 Cyclic voltammogram of GFD 2 graphite felt electrode treated with
0.1 M NiS04 solution (conditions same as that for Figure 6.17).
283

<(
E
150
100
.. ..f-)
~ 0 ''::J
() -50
-100
-150
-2.0 -1.5 -1.0-0.5 0 0,5 tO 1.5 Potential, V vs Hg/Hg2S04
Figure 6.19 Cyclic voltammogram of GFD 2 graphite felt electrode treated with
0.1 M MnS04 solution (conditions same as that for Figure 6.17).
284

An improvement in the electrochemical activity is however observed in Figure
6.17 for the felt which had been subjected to thermal treatment, as evidenced by
the increase in the peak current for peaks A and C. This is consistent with that
reported in reference [28]. An interesting cyclic voltammogram was obtained, with
the electrode treated with AgN03 solution as shown in Figure 6.20(a): peaks A
and B are sharper and more clear and the two peaks are closer than for the other
treatment. Furthermore, the peak currents for peaks A and C increase, indicating
that the existence of silver can catalyse the vanadium reactions, particularly, for
the V(II)N(III) redox couple. In addition, two extra peaks are observed in the
cyclic voltammogram, probably, due to the redox reactions of silver on the
electrode surface. To confrrm this, the electrode was removed from the vanadium
solution, rinsed with distilled water several times, and then immersed in a solution
which only contained 3 M H2S04 and scanned under the same conditions. The
cyclic voltammogram in Figure 6.20(b) shows that only two peaks exist within the
potential range for oxygen and hydrogen evolution, the peak potentials of which
confrrm that the peaks correspond to the Ag/ Ag(l) redox couple reactions, since
the recorded peak potential of +0.08 V (versus saturated Hg/Hg2S04 reference
electrode) for silver oxidation reaction is very close the standard potential value,
(i.e. +0.03 V versus the same reference electrode). Narrowing the sweep potential
range and continuing to sweep the electrode for 50 cycles, the clear and
reproducible cyclic voltammograms of Figure 6.20(c) were obtained, indicating
that the silver catalyst has in fact been loaded on the felt electrode and is not
being leached out during cycling. This result is in agreement with that reported by
Dekansk:i et al [176], who found that after immersion in AgN03 solution for a
285

<:( E
150
100
50
0
-150
0 0.5 1.0 1. 5 Potentiar,v vs Hg/Hg2S04
a)
286

<t E ..
100~--------------------.
50
...., 0 c:: Q)
''-
~ -50
-100
-150 F
-20 -1.5 -1.0-0.5 0 0.5 1.0 1.5 Potentiai,V vs Hg/Hg2S04
b)
287
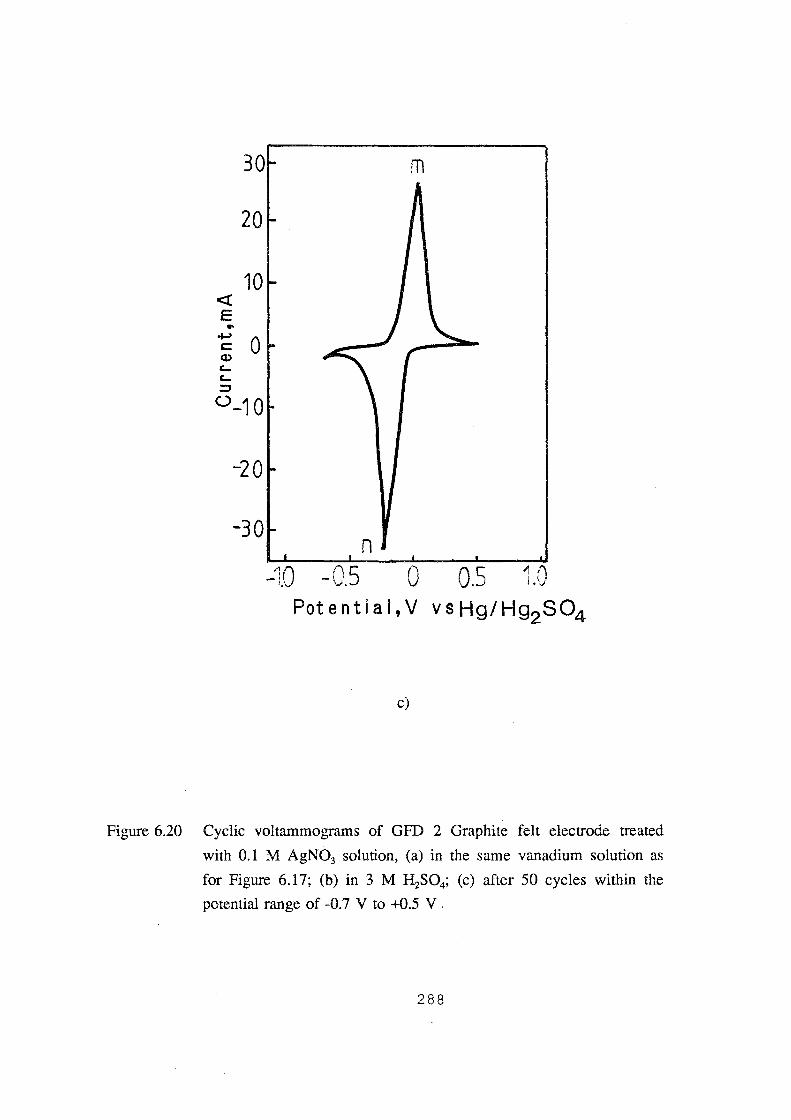
<( E
20
10
..
-20
-30
m
n -1.0 -0.5 0 0.5 1.0
Potentiai,V vsHg/Hg2S04
c)
Figure 6.20 Cyclic voltammograms of GFD 2 Graphite felt electrode treated
with 0.1 M AgN03 solution, (a) in the same vanadium solution as
for Figure 6.17; (b) in 3 M H2S04; (c) after 50 cycles within the
potential range of -0.7 V to +0.5 V.
288
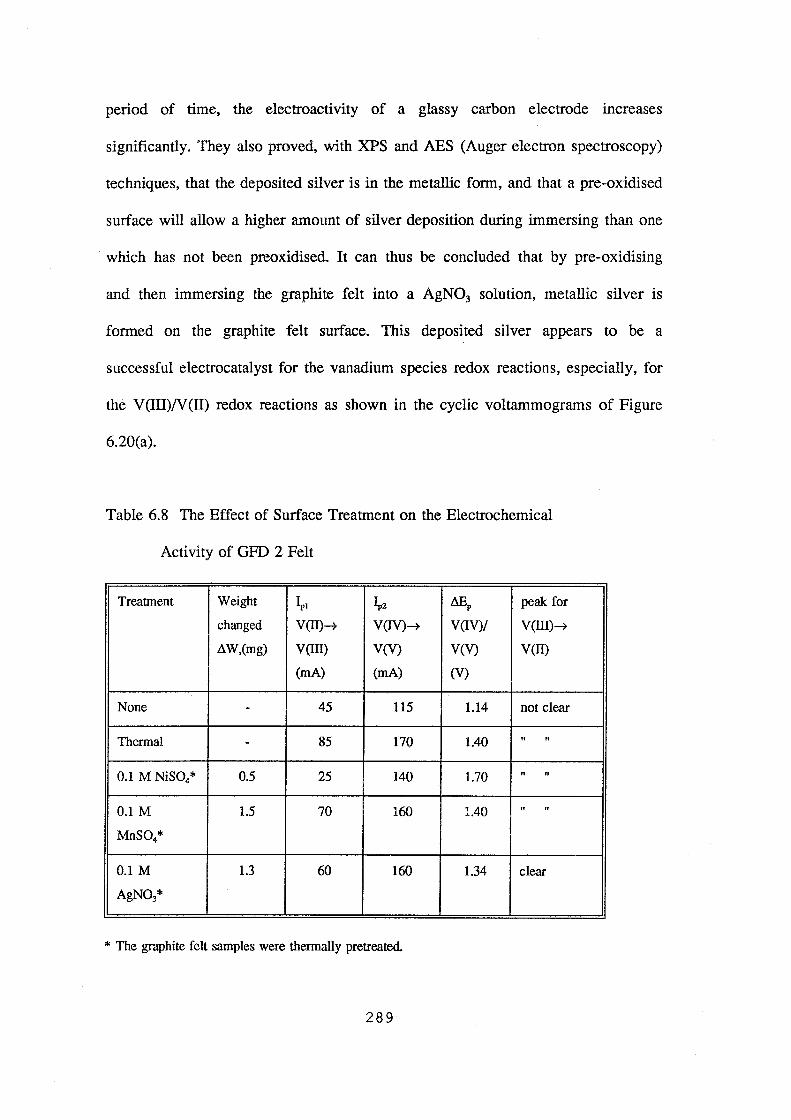
period of time, the electroactivity of a glassy carbon electrode increases
significantly. They also proved, with XPS and AES (Auger electron spectroscopy)
techniques, that the deposited silver is in the metallic form, and that a pre-oxidised
surface will allow a higher amount of silver deposition during immersing than one
which has not been preoxidised. It can thus be concluded that by pre-oxidising
and then immersing the graphite felt into a AgN03 solution, metallic silver is
formed on the graphite felt surface. This deposited silver appears to be a
successful electrocatalyst for the vanadium species redox reactions, especially, for
the V(III)N(ll) redox reactions as shown in the cyclic voltammograms of Figure
6.20(a).
Table 6.8 The Effect of Surface Treatment on the Electrochemical
Activity of GFD 2 Felt
Treatment Weight ~I ~2 t.Ep peak for
changed V(ll)~ V(IV)~ V(IV)/ V(III)~
AW,(rng) V(III) V(V) V(V) V(II)
(rnA) (rnA) (V)
None - 45 115 1.14 not clear
Thermal - 85 170 1.40 " "
0.1 M NiS04* 0.5 25 140 1.70 " "
0.1 M 1.5 70 160 1.40 " "
MnSO/
0.1 M 1.3 60 160 1.34 clear
AgN03*
* The graphite felt samples were thermally pretreated.
289
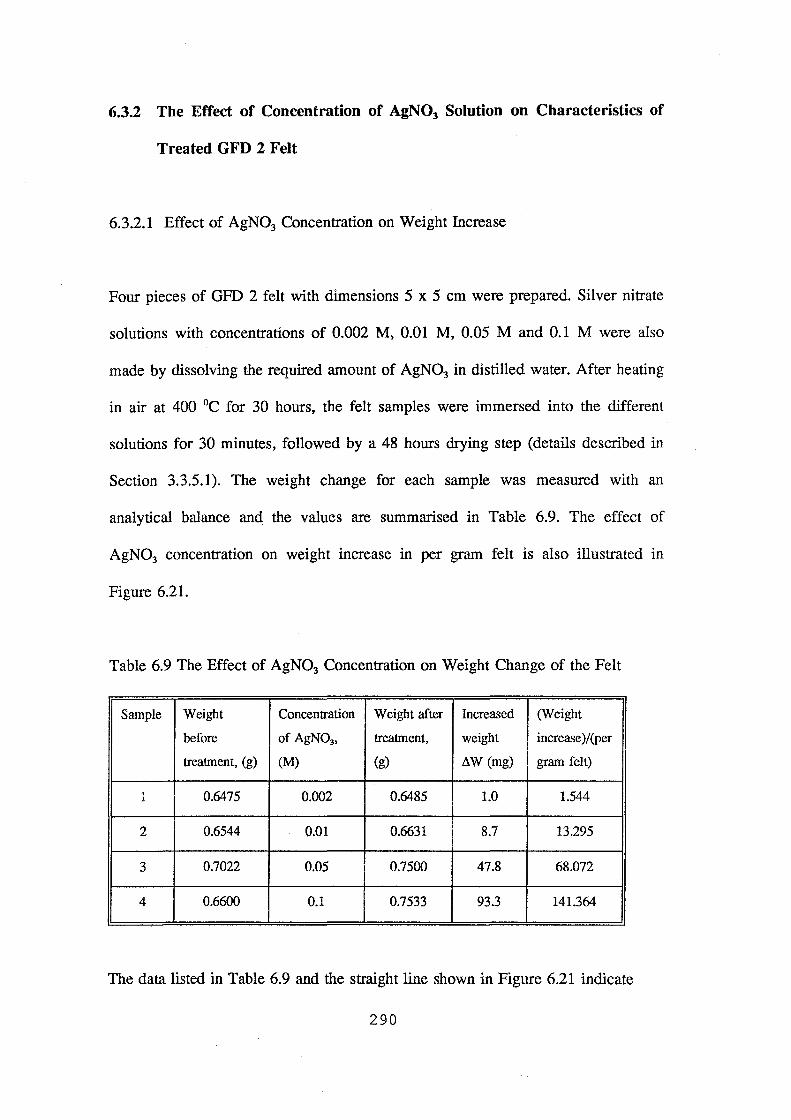
6.3.2 The Effect of Concentration of AgN03 Solution on Characteristics of
Treated GFD 2 Felt
6.3.2.1 Effect of AgN03 Concentration on Weight Increase
Four pieces of GFD 2 felt with dimensions 5 x 5 em were prepared. Silver nitrate
solutions with concentrations of 0.002 M, 0.01 M, 0.05 M and 0.1 M were also
made by dissolving the required amount of AgN03 in distilled water. After heating
in air at 400 °C for 30 hours, the felt samples were immersed into the different
solutions for 30 minutes, followed by a 48 hours drying step (details described in
Section 3.3.5.1). The weight change for each sample was measured with an
analytical balance and the values are summarised in Table 6.9. The effect of
AgN03 concentration on weight increase in per gram felt is also illustrated in
Figure 6.21.
Table 6.9 The Effect of AgN03 Concentration on Weight Change of the Felt
Sample Weight Concentration Weight after Increased (Weight
before of AgN03, treatment, weight increase )/(per
treatment, (g) (M) (g) llW (mg) gram felt)
1 0.6475 0.002 0.6485 1.0 1.544
2 0.6544 0.01 0.6631 8.7 13.295
3 0.7022 0.05 0.7500 47.8 68.072
4 0.6600 0.1 0.7533 93.3 141.364
The data listed in Table 6.9 and the straight line shown in Figure 6.21 indicate
290

,-., i50 r------- ·------••. J '
. 'U ID mOO 0 ID L 0 c
30~ '
0.02 0.04 0.06 0.08 Cone. of si iver nitrate, U~)
0.10 o. !2
Figure 6.21 The effect of AgN03 concentration on the increased weight of
treated GFD 2 graphite felt
291

that within the AgN03 concentration range studied, the amount of deposited silver
is linearly related to the concentration of the AgN03 solution used.
6.3.2.2 The Effect of Deposited Silver on Felt Electrical Resistivity
The resistivity values of the treated felts were determined by the ASTM D-991
method and Table 6.10 gives the results. It can be seen that the treatment does not
lead to a considerable change in electrical conductivity, although a slight decrease
in resistivity with increasing amount of loaded silver is observed.
Table 6.10 The Effect of Deposited Silver on Resistivity
Sample Treatment 1:1 W /(gram felt), Resistivity,
mg/g p(.Q.cm)
0 thermal, 400 °C, - 0.038
30 hours (in air)
1 0.002 M AgN03 1.544 0.038
2 0.01 M AgN03 13.295 0.036
3 0.05 M AgN03 68.072 0.036
4 0.1 M AgN03 141.364 0.035
6.3.2.3 Effect of Deposited Silver on Cell Resistance and polarisation behaviour
The effect of deposited silver catalyst on the electrochemical properties of the
292

graphite felt electrode was also evaluated in terms of cell resistance. This test was
carried out with a modified NASA cavity-fill-in single cell (see Section 3.3.5.2)
In this test, the AgN03 treated GFD 2 graphite felt was used as the negative
electrode. As has already been proved that thermal treatment enhances the
electroactivity of graphite felt for the V(V)N(IV) redox reaction, GFD 2 felt was
subjected to treatment at 400 °C for 30 hours in air before being employed as a
positive electrode for the vanadium redox flow cell. A piece of CMV membrane
was employed as separator and 50% SOC vanadium redox electrolytes were
utilised. Cell resistance values for electrodes treated under various conditions are
summarised in Table 6.11, while cell polarisation curves corresponding to different
electrode treatments are illustrated in Figure 6.22.
Table 6.11 Cell Resistance of GFD 2 Felt in 25 cm2 Cell (CMV membrane)
Cell resistance (Q.cm2)
Electrode Reb. R.n.. Raver.
Untreated on both sides 2.99 3.07 3.03
Positive thermally treated 2.34 2.65 2.50
Both sides thermally treated 2.26 2.17 2.22
0.002 M 2.03 2.04 2.04
0.01 M 1.89 1.91 1.90 Positive thermal,
negative AgN03 0.05 M 1.47 1.47 1.47
0.1 M 1.48 1.37 1.43
Untreated FMI (3 mm)[28] 4.09 4.22 4.16
293

1.60 ..... 1 --
l i o non-treat. A post. treated o both treated I
" !.ref ! ~ I o-~1.00~ ~g~-~ ~~--- -~~ "---"-ai 1.466~ -----~~ rno ~---- A---- -o------c __ ~ ~0--0 1.40~ -----A--- --o--> I ~~ ~~
I --1:!.-- -..a.. __ ...._........ ---.. --A -I --- --o-.._
1.35r ---A-_ I
1.:rl L--__ .__ __ ...__ __ ..__ __ ..__ __ ..___ __ ~ _ ____.
o.o 0.1 0.2 0.3 0.4 0.6 0.6 0.7 a..&rrent. I (A)
Figure 6.22 Polarisation behaviour of a vanadium redox flow cell employing
GFD 2 graphite felt electrode treated under various conditions.
Electrolyte: 2 M vanadium sulphate in 2.5 M H2S04; Membrane:
CMV. Solid line: charging; dashed line: discharging.
294

Figure 6.22 shows three pairs of cell polarisation curves corresponding to the
untreated, positive thermally treated and both sides treated (positive thermal,
negative treated with 0.1 M AgS04) electrodes. In all cases, linear relationship
between cell current and cell voltage was recorded for both charge (solid line) and
discharge (dashed line) processes. Comparing the slope of I-V curves which
related directly to the electrode polarisation behaviour, it is clear that the treatment
of felt electrode, in particular, treatment with AgN03 solution, leads to a
considerable decrease in cell polarisation rate.
It can be seen from Table 6.11 that both thermal and AgN03 treatments improved
the electroactivity of the GFD 2 felt significantly, since a considerable decrease in
cell resistance is recorded for the treated electrodes. It was also seen that a lower
cell resistance can be obtained by increasing the concentration of AgN03 solution,
which probably in turn increases the amount of silver deposited on the surface of
the graphite fibre. However, the influence of AgN03 concentration on the cell
resistance becomes less marked when the concentration is higher than 0.05 M.
Considering that the higher silver deposition would result in a higher hydrogen
evolution rate, and also less cost effectiveness, 0.05 M AgN03 solution was
selected as the GFD 2 felt activation treatment solution for further study.
6.3.3 Cell Performance Test
The GFD 2 felt subjected to treated with 0.05 M AgN03 solution was used as the
negative electrode while the thermally treated felt was employed as the positive
295
electrode in a vanadium redox flow cell and the effect of treatment on cell
efficiencies, the influence of current density on cell efficiency, and the cell
discharging behaviour was evaluated. Long-term stability tests were also
performed with the treated felt electrodes. ·
6.3.3.1 The Influence of Treatment on Cell Efficiencies
Table 6.12 gives the comparison of cell efficiencies for the vanadium redox cell
employing electrodes subjected to various treatments. With the untreated felt
electrode, a 80.9% voltage efficiency at the charge/discharge current density of 40
mA.cm·2 indicates that the polarisation losses associated with the inactivated
electrode material are high. Replacing the positive electrode with a thermally
· treated sample, resulted in an increase in cell voltage efficiency, showing an
improvement in the electroactivity of the felt electrode for the vanadium redox
reactions. Further enhancement in cell voltage and energy efficiencies were
obtained when a silver loaded GFD 2 felt was substituted for the untreated
negative felt electrode, confirming that the electron transfer rate for the
V(III)N(II) couple is catalysed by the deposited silver catalyst.
Figure 6.23 shows a typical charge/discharge curve of a vanadium redox cell
employing treated felt electrode at a constant charge/discharge current density of
40 mNcm2• The nearly symmetrical charge/discharge curve indicates that highly
electroactive electrodes are obtained and the cell polarisation losses are minimised.
296
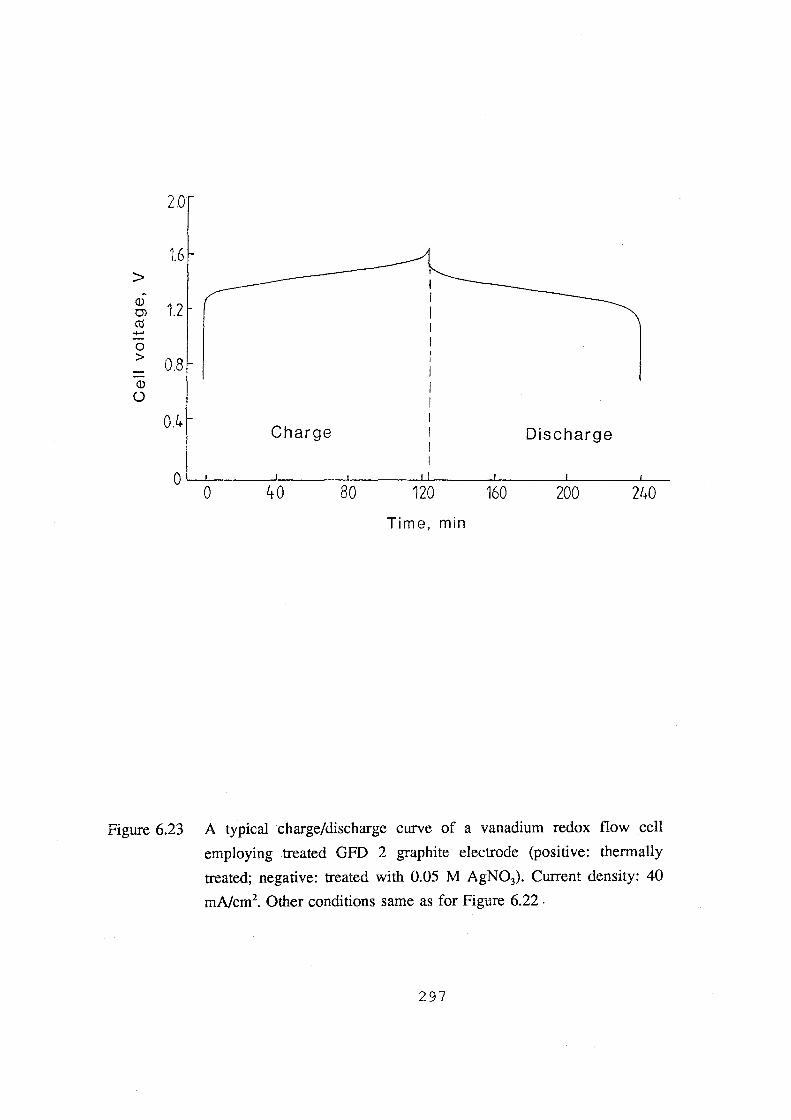
2.01
> l6t (J) Q) 1.2 ell -0 > 0.8 Q)
()
0.4 Charge Discharge
0 0 40 80 120 160 200 240
Time, min
Figure 6.23 A typical charge/discharge curve of a vanadium redox flow cell
employing treated GFD 2 graphite electrode (positive: thermally
treated; negative: treated with 0.05 M AgN03). Current density: 40
mNcm2• Other conditions same as for Figure 6.22 .
297

Table 6.12 Cell performance of GFD 2 felt in 25 cm2 cell (CMV membrane)
electrode cell efficiency at 40 mA.cm-2, (%)
coulombic voltage energy
non-treat. on both sides 93.94 80.92 76.02
positive thermal treated 92.75 86.49 80.22
positive thermal 94.03 93.10 87.51
negative AgN03 (0.05 M)
6.3.3.2 The Effect of Current Density
Figure 6.24 illustrates the effect of constant charge/discharge current density on
the cell efficiencies for the treated GFD 2 electrode. Comparing the cell
efficiencies obtained using the electrodes with the 6 mm thick commercial Toray
felt (see Section 4.2.2.2 and Figure 4.17), similar trends in cell efficiencies versus
current density are observed. However, a few considerable improvements can be
noted. Firstly, the charge/discharge current density for obtaining an 80% overall
energy efficiency was enhanced from 40 mA.cm-2 (Figure 4.17) to 100 mA.cm-2,
again showing the electroactivity of the treated felt electrode is much higher than
that without treatment. Secondly, at the lower current density of 20 mA.cm-2, more
than 96% voltage efficiency can be achieved, at least 6% higher than that with the
6 mm Toray felt, indicating that electrode polarisation losses are minimised by the
298

'-'
:Jj 0
~ 10
Eoo 0 .__
\t--
ID 00 }-
o coulombic h. voltage
oo~------L------~------~------~----___j-
0 ~ 40 60 so !00 cJJr rent de'ls i ty. ( rrfl/ ern c )
120
Figure 6.24 The effect of current density on cell efficiencies of a vanadium
redox flow cell with thermally and AgN03 treated GFD 2 graphite
felt electrodes. Other conditions same as for Figure 6.22 -
299
graphite felt electrodes activated with thermal treatment and silver catalyst.
Another significant improvement in cell performance which is also observed is
that at a charge/discharge current density as high as 100 mA.cm-2, 82% overall
energy efficiency can still be obtained. It should be also noted that the felt is less
than half the thickness and the weight of the 6 mm Toray felt, which means half
of the space and the material can be saved.
6.3.3.3 The Cell Discharge Behaviour
Charging the cell at a current density of 40 mA.cm-2, and discharging with various
current density, 20, 40, 60, 80 and 100 mA.cm-2, yields Figure 6.25 which shows
the discharging behaviour of the cell with the activated electrodes. The cell
capacity at various discharging current density is also summarised in Table 6.13.
From Figure 6.25 and Table 6.13, it is clear that the cell with the activated
electrode can be operated over a wide range of current densities, although the cell
capacity seems to increase with increasing discharge current density up to 100
mA.cm-2, due to lower self-discharge rate across the membrane at the short
discharge times.
300
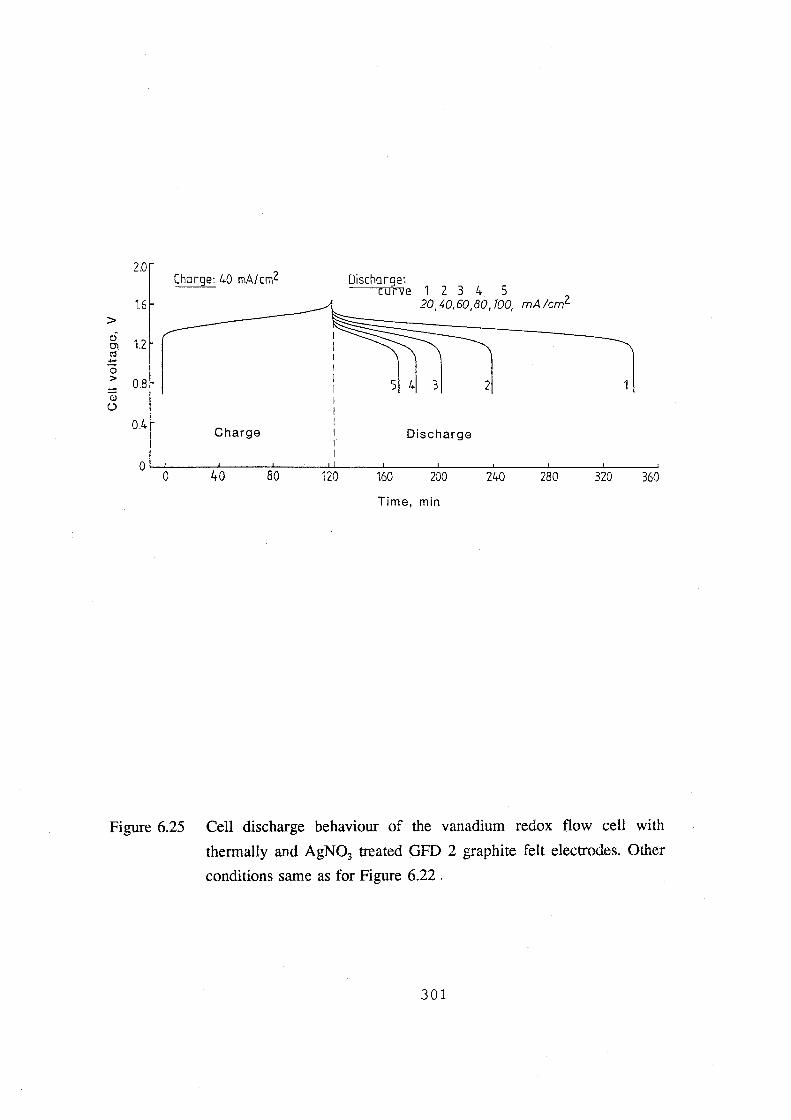
2.0 Charge: 40 mA/cmZ Discharge:
1 2 3 4 5 curve 16 20, 40,60,80, 700, mA!cmZ
> (l)
1.2 OJ ~
::::: 0 > = 0.8 5 4 3 2 Q)
()
0.4 Charge Discharge
0 0 40 80 120 160 200 240 280 320 360
Time, min
Figure 6.25 Cell discharge behaviour of the vanadium redox flow cell with
thermally and AgN03 treated GFD 2 graphite felt electrodes. Other
conditions same as for Figure 6.22 .
301
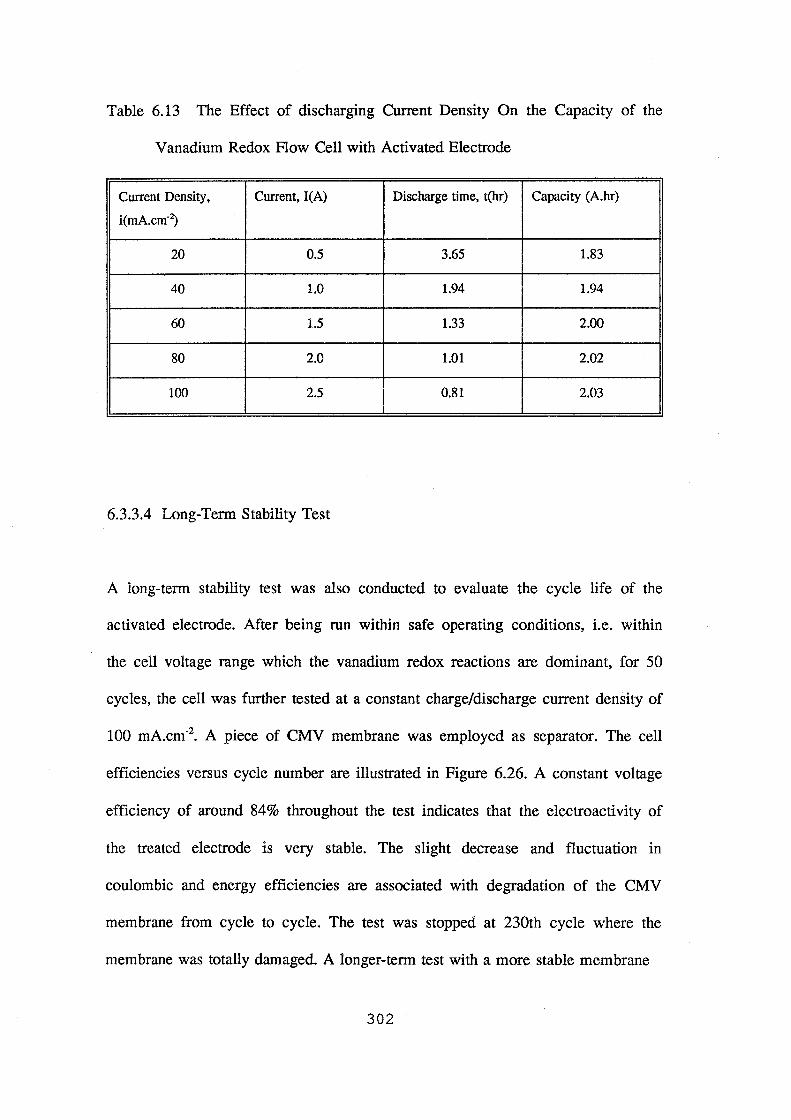
Table 6.13 The Effect of discharging Current Density On the Capacity of the
Vanadium Redox Flow Cell with Activated Electrode
Current Density, Current, I(A) Discharge time, t(hr) Capacity (A.hr)
i(mA.cm·~
20 0.5 3.65 1.83
40 1.0 1.94 1.94
60 1.5 1.33 2.00
80 2.0 1.01 2.02
100 2.5 0.81 2.03
6.3.3.4 Long-Term Stability Test
A long-term stability test was also conducted to evaluate the cycle life of the
activated electrode. After being run within safe operating conditions, i.e. within
the cell voltage range which the vanadium redox reactions are dominant, for 50
cycles, the cell was further tested at a constant charge/discharge current density of
100 mA.cm-2• A piece of CMV membrane was employed as separator. The cell
efficiencies versus cycle number are illustrated in Figure 6.26. A constant voltage
efficiency of around 84% throughout the test indicates that the electroactivity of
the treated electrode is very stable. The slight decrease and fluctuation in
coulombic and energy efficiencies are associated with degradation of the CMV
membrane from cycle to cycle. The test was stopped at 230th cycle where the
membrane was totally damaged. A longer-term test with a more stable membrane
302

110
105
100
- 95 t. - 90 ~ () c 85 <1)
'(3 80 ;: '+-w 75
70 ---- Coulombic -+- Voltage __,..,._ Energy
65
60 40 60 80 100 120 140 160 180 200 220 240
Cycle number
Figure 6.26 Long-term stability test on the vanadium redox flow cell with
thermal and AgN03 treated GFD 2 graphite felt electrodes.
Charge/discharge current density: 100 mNcm2; upper and lower
voltage limits are 1.75 V and 0.8 V respectively. Other conditions
same as for Figure 6.22 .
303

would give further information on the stability of the electrode, however, the
results obtained do indicate that the silver catalyst is a successful electrocatalyst
for the vanadium redox cell applications. A more stable membrane which has
shown excellent performance in the vanadium redox cell has been developed in
the laboratory[188,189], however, more extensive long-tern tests on the catalysed
electrode are beyond the scope of the present project.
6.4 Summary
Depending on precursors and processing conditions, the characteristics of different
graphite felts vary considerably. PAN based felt exhibited better electrical
conductivity and electrochemical activity compared with rayon based graphite felt.
The PAN based GFD 2 graphite fibres have clean and flat surfaces, and also have
a uniform structure in the cross-section of the individual fibre, while the rayon
based FMI felt shows a dusty and uneven surface. In addition, the cross-section of
individual FMI felt fibres exhibited a bundle structure. The latter is believed to be
less graphitised and thus have more edge planes and higher defect sites which
result in a higher capability to interact with oxygen.
It was discovered from cyclic voltammetric studies that the FMI graphite felt is
more readily oxidised during anodic electrolysis than the GFD 2 felt, resulting in
deactivation of the felt for vanadium redox cell. XPS analysis revealed that the
304

FMI felt readily forms carbonyl (C=O) functional groups during thermal treatment
in air while the GFD 2 felt favoured the formation of alcohol (C-OH) groups.
When operated as positive electrodes under normal cell charge/discharge
conditions, both felts exhibited a significant increase in oxygen content on surface.
Cls curve fitting indicates that there are four types of carbon-oxygen groups
formed on the graphite felt surface. The overcharged samples show a high surface
concentration of -CQ3• groups which is believed to be the reason for electrode
deterioration.
Excellent cell performance can be achieved by using silver as the electrocatalyst
for the negative electrode and a thermal treated GFD 2 felt as the positive
electrode. The cell resistance decrease from 3.0 Q.cm2 for the untreated electrodes
to less than 1.5 Q.cm2 for the activated electrodes. The cell voltage efficiency at
40 mA.cm·2 increased by 12% after the successful treatment. A significant
enhancement in the maximum charge/discharge current density which will allow at
least 80% overall energy efficiency was also recorded (40 mA.cm·2 for untreated
compared with 100 mA.cm·2 for activated electrodes). Long-term test showed that
the silver electrocatalyst and thermally treated electrodes are very stable for the
vanadium redox flow battery application.
305

CHAPTER VII
CONCLUSIONS
With the aims of developing a novel carbon-plastic composite electrode for redox
flow cell applications, the present project covers the study of electrode fabrication
and evaluation, electrode kinetics and activation, and intensive investigations in
the physical and chemical properties as well as the electrocatalysis of the electrode
surfaces.
In the section of electrode fabrication and evaluation, the following conclusions
are drawn:
According to two-phase conduction theory, the electrical conductivity of a carbon
plastic composite material depends on the nature, content and particle size of the
conducting fillers. Extensive investigations have shown that a composite with a
combination of carbon black and graphite fibre gives rise to a satisfactory
electrical conductivity (around 0.5 n.cm) for electrode matrix layer applications.
LDPE based carbon-plastic composite materials with a composition of 60% LDPE,
20% graphite fibre, 20% carbon black exhibit promising electrical and
electrochemical properties, however, the mechanical properties are not satisfactory
for an electrode matrix layer for redox flow cell applications.
Carbon-HDPE composite material modified with SEBS thermo-plastic rubber, at
the same loading of conducting fillers, has been shown to have good electrical and
306

mechanical properties, as well as being impermeable.
By hot pressing a graphite felt and a metal mesh on either side, conducting plastic
electrodes can be fabricated for use in the vanadium redox cell. The electrical and
cell resistances values measured for these electrodes are comparable to those of
the commercially acquired conductive plastic/felt electrodes, i.e., Japanese Toray
electrode. Unlike the Japanese electrodes, however, these materials possess
excellent mechanical properties and are impermeable to the electrolyte.
An overall energy efficiency of 88% can be achieved with these electrodes in cell
charge/discharge testing at a charge/discharge current density of 21.7 mA.cm-2•
Long-term cyclic charge/discharge testing has been conducted over more than
5780 hours (1240 cycles) and the SEBS modified carbon-HDPE composite was
shown to be stable and is thus a reliable electrode matrix material for the
vanadium redox battery.
In the section of electrode kinetics and activation studies, it can be summarised
that:
The kinetics of the V (V)N (IV) redox couple reaction have been found to be elec
trochemically irreversible at the flat graphite electrode. Rotating disc voltammetric
studies revealed that the diffusivity of V(IV) species is independent of vanadium
concentration and the value of the diffusion coefficient is 2.14 x 10⁻⁶ cm2.s-1•
Although the exchange current density at the flat graphite electrode is low (i0 =
307
2.47 x 10·4 A.cm-2), it increased by two orders of magnitude at a graphite felt
electrode with a geometric area of 1 cm2, showing that carbon/graphite is a
suitable material for use in the vanadium redox cell.
The electrochemical behaviour of the V(III)N(II) couple at graphite electrode was
also found to be an electrochemically irreversible process and characterised by a
diffusion coefficient of 2.60 x 10·6 cm2.s-1 and a electron transfer rate constant of
3.63 x 10·4 cm.s·I, showing slow electrode kinetics at the flat graphite electrode.
Chemical treatment of graphite fibre-based composite polyethylene can result in a
surface area enhancement and improved reactivity for the vanadium ion redox
reactions. This is believed to be due to the enhancement in electrode surface area
and surface hydrophilicity.
Whilst carbon-black composite polyethylene is not an electrochemically stable
material after treatment, graphite fibre-based conducting polyethylene is. Although
significant improvements in the effective surface area have been achieved with
surface treatment of these materials, further research in seeking an alternative
activation method to obtain better electrochemical activity for the vanadium
reactions is required, since the treated carbon-plastic surface does not show
sufficient surface area for redox flow cell application.
The intensive investigation to the graphite felt as a electroactive layer for the
carbon-plastic composite electrode gives rise to the conclusions as follows:
308

Depending on precursors and processing conditions, the characteristics of different
graphite felts vary considerably. PAN based felt exhibited better electrical
conductivity and electrochemical activity compared with rayon based graphite felt.
The PAN based GFD 2 graphite fibres have clean and flat surfaces, and also have
a uniform structure in the cross-section of the individual fibre, while the rayon
based FMI felt shows a dusty and uneven surface. In addition, the cross-section of
individual FMI felt fibres exhibited a bundle structure. The latter is believed to be
less graphitised and thus have more edge planes and higher defect sites which
result in a higher capability to interact with oxygen.
It was discovered from cyclic voltammetric studies that the FMI graphite felt is
more readily oxidised during anodic electrolysis than the GFD 2 felt, resulting in
deactivation of the felt for vanadium redox cell. XPS analysis revealed that the
FMI felt readily forms carbonyl (C=O) functional groups during thermal treatment
in air while the GFD 2 felt favoured the formation of alcohol (C-OH) groups.
When operated as positive electrodes under normal cell charge/discharge
conditions, both felts exhibited a significant increase in oxygen content on surface.
Cls curve fitting indicates that there are four types of carbon-oxygen groups
formed on the graphite felt surface. The overcharged samples show a high surface
concentration of -C03- groups which is believed to be the reason for electrode
deterioration.
Excellent cell performance can be achieved by using silver as the electrocatalyst
309

for the negative electrode and a thermally treated GFD 2 felt as the positive
electrode. The cell resistance decrease from 3.0 n.cm2 for the untreatment
electrodes to less than 1.5 n.cm2 for the activated electrodes. The cell voltage
efficiency at 40 mA.cm-2 increased by 12% after the successful treatment. A
significant enhancement in the maximum charge/discharge current density which
allow at least 80% overall energy efficiency was also recorded (40 mA.cm-2 for
untreated compared with 100 mA.cm-2 for activated electrodes). Long-term test
showed that the silver electrocatalyst and thermally treated electrodes are very
stable for the vanadium redox flow battery application.
Further research work is recommended on the following aspects:
i) A study of plastic additives such as lubricants for the SEBS modified carbon
HOPE composite materials to facilitate the processing;
ii) Electrode kinetics study for porous graphite felt electrodes used in the redox
flow battery
iii) Improvement in the silver electrocatalyst to reduce the hydrogen evolution at
the negative side of the vanadium battery during the charging process.
iv) Electrocatalysis to inhibit graphite felt electrode deactivation processes during
overcharge.
310

REFERENCES
1. M. Bartolozzi, J. Power Sources, 27 (1989) 219
2. J. B. Morrill, U. S. Patent 3,553,017 (1971)
3. L. H. Thaller, U. S. Patent 3,996,064 (1976)
4. J. Giner, L. Swette and K. Cahill, Screening of redox couples and electrode
materials, NASA CR - 134705, National Aeronautics and Space
Administration, U.S. Dept. of Energy, 1976
5. L. H. Thaller, 9th Intersoc. Energy Conv. Eng. Conf., San Francisco, CA,
August(1974) 924 (NASA TM X- 71540)
6. M.A. Reid and R. F. Gahn, Symp. on Electrode Materials and Processes for
Energy Conversion and Storage, The electrochemical Society, Inc.,
Philadelphia, PA, May(1977), (ERDA/NASA- 1022!77110, NASA TM X-
73669, 1977)
7. L. H. Thaller, Proc. Symp. Load Leveling, Electrochem. Soc. Proc. Vol. 77-
4, (1977)353
8. R. F. Gahn, J. Charleston, J. S. Ling and M. A. Reid, DOE!NASA/12726 -
15, NASA TM - 82724 (1981)
9. D. A. Johnson and M.A. Reid, DOE!NASA/12726- 17, NASA TM- 82913
(1982)
10. D. K. Stalnaker, DOE/NASA/12726 - 20, NASA TM- 83363 (1983)
11. R. F. Gahn, N. H. Hagedorm and J. A. Johnson, DOE!NASA/12726 - 25,
NASA TM- 87034 (1985)
12. K. D. Beccu, Chem. lng. Tech., 46 (1974) 95
311
13. R. J. H. Clark, The Chemistry of Titanium and Vanadium, Elsevier,
Amsterdam, (1968)
14. Kirt-Othmer, Encyclopaedia of Chemical Technology, Vol. 23, 3rd edition,
Wiley Interscience, New York, (1983)
15. F. A. Cotton and G. Wilkinson, Basic Inorganic Chemistry, Wiley, New
York, (1976)
16. A. J. Bard, Encyclopaedia of Electrochemistry of the Elements, Vol. VII.,
Marcel Dekker, New York, (1976)
17. F. J. C. Rossotti, and H. S. Rossotti, Acta Chemica Scandinavia, 9 (1955)
1177
18. J. 0. Hill, I. G. Worsley and L. G. Hepler, Chemical Reviews, 71 (1971)
127
19. J. N. Cooper, H. L. Hoyt, C. W. Buffington and C. A. Holmes, J. of
Physical Chern., 75 (1971) 891
20. J. T. Hupp and M. J. Weaver, Inorg. Chern. 22 (1983) 18
21. F. C. Anson and D. M. King, Anal. Chern., 34 (1962) 362
22. F. Z. Dzhavarov and S. V. Gorbachev, Russ. J. Phys. Chern., 38 (1964)
23. F. J. Miller and H. E. Zittel, J. Electroanal. Chern., 7 (1964) 116
24. H. F. Schaefer and K. V. Kordesch, U.S. Patent 3,279,949 (1966)
25. M. Skyllas-Kazacos and R. Robins, U.S. Patent, App. 849,094 (1986)
26. M. Rychcik and M. Skyllas- Kazacos, J. power sources, .12. (1987) 45
27. E. Sum, M. Rychcik and M. Skyllas-Kazacos, J. Power Sources, 1§. (1985)
85
312

28. B. Sun, PhD Thesis, University of New South Wales, Australia, (1991)
29. K. Kordesch, J. Gsellmann, S. Jahangir and M. Schautz, Symp. Porous
Electrodes: Theory and Practice, Destroit, MI, 1984, Vol. 84-8,
Electrochemical Society, Pennington, NJ, 163
30. D. Pletcher, J. Appl. Electrochem., 14 (1984) 403
31. C. A. Vincent, F. Bonino, M. Lazzari and B. Scrosati, Morden Batteries, An
Introduction to Electrochemical Power sources, Edward Arnold, 1984
32. S. Ashimura andY. Miyake, Denki Kagaku(in Japanese), J2, 12 (1971) 944
33. F. P. Bowden and E. K. Rideal, Proc. R. London Ser., A120 (1928) 59
34. D. N. Bennion, Proceedings of the Symposium on Porous Electrodes: Theory
and Practice, Destriot, MI, I984, Vol. 84-8, Electrochemical Society,
Pennington, NJ, p 1
35. Redox Flow Cell Development and Demonstration project, NASA TM-79067,
U.S. Dept. of Energy, (1979) 31
36. NASA Redox Storage System Development Project, Calendar Year 1980,
DOEINASA/12726-18, NASA TM-82940, (1982) 19
37. NASA Redox Storage System Development Project, Calendar Year 1981,
DOE/NASA/12726-19, NASA TM-83087, (1983) 19
38. NASA Redox Storage System Development Project, Calender year 1982,
DOE!NASA/12726-23, NASA TM-83469, (1983)4
39. K. Nozaki, H. Kaneko, A. Negishi and T. Ozawa, Proceedings of the
Symposium on Advances in Battery Materials and Processes, Washington,
DC., 1983, vol.84-4, The Electrochemical Society, (1984) 143
40. K. Nozaki and T. Ozawa, Proc. 17th Int. Energy Cov. Eng. Conf, (1982)
610
313
41. K. Nozaki, 0. Hamamoto, K. Mine and T. Ozawa, Denki Kagaku(in
Japanese), 55, 12 (1987) 229
42. E. Sum and M. Skyllas-Kazacos, J. Power Sources, 15 (1985) 179
43. M. Skyllas-Kazacos and F. Grossmith, J. Electrochem. Soc., 134 (1987)
2950
44. M. Kazacos and M. Skyllas-Kazacos, J. Electrochem. Soc., 136 (1989) 2759
45. M. Skyllas-Kazacos, D. Kashennen, D. R. Hong and M. Kazacos,
Proceedings of Solar 89 Conference, Australian and New Zealand Solar
Energy Society, Nov.30 -Dec2, (1989), Brisbane, Australia. p.40
46. A. McDougall, Fuel Cells, The Macmillan Press Ltd, 1976
47. S. Ashimura andY. Miyake, Denki Kagaku (in Japanese), ,11 4 (1975) 214
48. S. Ashimura andY. Miyake, Denki Kagaku (in Japanese), 44, 1 (1976) 46
49. 3. Ashimura andY. Miyake, Denki Kagaku (in Japanese), 37, (1969) 119
50. S. Ashimura andY. Miyake, Denki Kagaku (in Japanese), 37, (1969) 54
51. T. Fujii, M. Igarashi, K. Fushimi, T. Hashimoto, Y. Kumai, A. Hirota, H.
ltoh, K. Jin-nai and M. Kanazashi, Proceedings of The 22rd Intersociety
Energy Conversion Engineering Conference (IECEC), 879265
52. T. Fujii, M. Igarashi, K. Fushimi, T. Hashimoto, Y. Kumai, A. Hirota, H.
ltoh, K. Jin-nai and M. Kanazashi, Proceedings of 23rd IECEC, 889305
53. T. Fujii, M. Igarashi, K. Fushimi, T. Hashimoto, Y. Kumai, A. Hirota, H.
Itoh, K. Jin-nai and M. Kanazashi, Proceedings of 24th IECEC, 899125
54. R. Bellows, H. Einstein, P. Grimes, E. Kantner, P. Malachesky, K. Newby
and H. Tsien, Development of a Circulating Zinc-Bromine Battery, Phase
I - Final Report, Contractor Repon SAND 82-7022, (1983),52
314

55. A. J. DeCasperis, R. J. Rosthlein and R. D. Bresult, U.S. Patent 4,365,008
(1982)
56. A. R. Blythe, Electrical properties of polymers, Cambridge University Press,
1979
57. Molecular Metals, ed. W. E. Hatfield, Plenum Press, 1979
58. Advances in Polymer Science, Vol. 33, ed. H.-J. Cantow et al, Springer
Verleg, Heidelberg, 1979
59. G. K. Chandler and D. Pletcher, Electrochemistry, Vol 10, The Royal
Society of Chemistry, (1980) 117
60. B. S. Baker and M. G. Klein, U.S. Patent 3,898,099 (1975)
61. B. S. Baker and M. G. Klein, U.S. Patent 3,935,029 (1976)
62. G. B. Ellis, U.S. Patent 3,184,339 (1965)
63. G. B. Ellis, U.S. Patent 588,707 (1956)
64. G. B. Ellis, U.S. Patent 831,776 (1959)
65. F. Solomon, U.S. Patent 3,536,537 (1970)
66. Chia-tsun Liu, Proc. Symp. Porous Electrodes: Theory and Practice, Destroit,
MI, 1984, Vol. 84-8, Electrochem. Soc., p.191
67. E. Yeager, Case Western Reserve University/US-Office of Naval Research
Contract, Electrochem. Soc., 106 (1959) 561
68. H. C. Tsien, U.S. Patent 4,169,816 (1979)
69. J. V. Meyer, U.S. Patent 3,673,121 (1972)
70. J. Kawashima and H. Kitamura, U.S. Patent 3,591,526 (1971)
315

71. B. Warszawski and B. Verger, U.S. Patent 3,530,003 (1970)
72. B. Warszawski, B. Verger and P. Demange, U.S. Patent 3,814,631 (1974)
73. H. Ogawa and A. Kishi, Japan Kokai Tokkyo Koho JP 63/40267 (1988)
74. H. Ogawa and K. Shimazaki, JP 63/2261 (1988)
75. K. Jinnai, JP 01,134,879 (1989)
76. M. Kitamura, JP 01,187,772 (1989)
77. M. Kitanaka, K. Miwa and K. Shimizu, JP 621287572 (1987)
78. M. Kitanaka, K. Miwa and K. Shimizu, JP 621276761 (1987)
79. K. Fushimi, JP 01,132,058 (1989)
80. H. Ogawa and A. Kishi, JP 63/40268 (1988)
81. H. Ogawa and A. Kishi, JP 63/40261 (1988)
82. C. Herscovici, A. Leo and A. Charkey, U.S. Patent 4,758,473 (1988)
83. J. Park and B. R. Shaw, Anal. Chem., 61 (1989) 848
84. R. B. Grekila and T. Y. Tien, J. Amer. Ceram. Soc., 48 (1965) 22
85. . S. M. Aharoni, J. Appl. Phys. 43, 5 (1972) 2463
86. F. Bueche, J. Appl. Phys., 43, 11 (1972) 4837
87. F. Bueche, J. Appl. Phys., 44, 1 (1973) 532
88. K. Miyasaka, K. Watanabe, E. Jojima, H. Aida, M. Sumita and K. Ishkawa,
J. Mater. Sci. 17 (1982) 1610
316

89. W. F. Verhelst, K. G. Wolthus, A. Voet, P. Ehrburger and J.B. Donnet,
Rubber Chern. Techno/., 50 (1977) 735
90. A. K. Sircar and T. G. Lamond, Rubber Chern. Techno/., 51 (1978) 126
91. R. P. Kusy and D.T. Turner, J. Appl. Polymer Sci., 1I (1973)
92. R. Mukhopadhyay, S. K. De and S. Basu, J. Appl. Polymer Sci., 20 (1976)
93. A. Malliaris and D. T. Turner, J. Appl. Phys. 42 (1971) 614
94. R. Matsushima, M. Senna and H. Kuno, J. Mater. Sci., 12 (1977) 509
95. R. M. Scarisbrick, J. Appl. Phys., .Q (1973) 2098
96. Tech. Bull. Pigments No. 69, Degussa Pigments Division, 6000 Frankfurt 1,
P.O. Box 2644.
97. Tech. Bull. Pigments No. 40, ibid
98. Tech. Bull. Pigments No. 62, ibid
99. Tech. Bull. Pigments No. 59, ibid
100. P. A. Thrower, Proceeding of The Workshop on The Electrochemistry of
Carbon, Cleveland, Ohio, August, 1983, The Electrochem. Soc., Proceedinds
volume 84-5, p.40
101. T. C. Golden, R. G. Jenkins, Y. Otake and A. W. Scaroni, Proceeding of
The Workshop on The Electrochemistry of Carbon, Cleveland, Ohio,
August, 1983, The Electrochem. Soc., Proceedinds volume 84-5, p.61
102. L. S. Singer, Proceeding of The Workshop on The Electrochemistry of
Carbon, Cleveland, Ohio, August, 1983, The Electrochem. Soc., Proceedinds
volume 84-5, p.26
103. L. S. Singer and I. C. Lewis, Appl. Spectros., 36 (1982) 52
317

104. D. J. Johnson, Chemistry and Industry, Sept. 18, 1982, p. 692
105. S.C. Bennett and D. J. Johnson, Carbon, 17 (1979) 25
106. J.D. Brooks and G. H. Tayler, Chemistry and Physics of Carbon, Vol. 4 (P.
L. Walker, Jr., Ed.), Dekker, New York, 1986, P.243
107. P. A. Thrower And L. E. Jones, 16th Biennial Conf. on Carbon, San Diego,
California, July 18 - 22, 1983; Amer. Carbon Soc. (1983), p.503
108. A. Smith, Proc. Rog. Soc., A12 (1863) 424
109. H. H. Lowry and G. A. Hulett, J. Amer. Chern. Soc., 42 (1920) 1408
110. A. F. C. H. Ward and E. K. Rideal, J. Chern. Soc., (1927) 3117
111. P. L. Hart, F. J. Vastola and P. L. Walker, Jr, Carbon, .2. (1967) 363
112. R. 0. Lussow, F. J. Vastola and P. L. Walker, Jr, Carbon, .2. (1967) 591
113. N. R. Laine, F. J. Vastola and P.L. Walker, Jr, J. Phys. Chern. , 67 (1963)
2030
114. N. R. Laine, F. J. Vastola and P.L. Walker, Jr, Proceedings of the Fifth
Conference on Carbon, Penn State, 1961, Vol. 11, Pergaman Press, New
York
115. I. Ogawa, Biochem. Z., 172 (1926) 249
116. H. R. Kruyt and G. S. de Kadt, Kolloid-Z, 47 (1929) 44
117. H. P. Boehm, Advances in Catalysis, Vol. 16 (Eds. D. D. Eley, H. Pires and
P. B. Weisz) New York, Academic Press, (1966) 175
118. A. J. King, J. Chern. Soc., (1937) 1489
119. H. P. Boehm, E. Diehl, W. Heck, and R. Sappok, Angew. Chern., l, 10
318
(1964) 669
120. R. N. Smith. G. Pierce and C. D. Joel, J. Phys. Chem., 58 (1954) 298
121. A. E. Rei£, J. Phys. Chem., 56 (1952) 785
122. R.N. Smith, D. Lessini and J Mooi, J. Phys. Chem. 61 (1957) 81
123. P. B. Puri, S. Singh and 0. P. Mahajan, J. Indian Chem. Soc., 42 (1965) 427
124. A. S. Behrman and H. Gustafson, Ind. Eng. Chem., 27 (1935) 426
125. P. B. Purl, O.P. Mahajan and D. D. Singh, J. Indian. Chem. Soc. 37 (1962)
171
126. P. B. Puri, D. D. Singh L. R. Sharina and J. Chander, ibid, 35 (1958) 130
127. V. A. Garten and D. E. Weiss, Rev. Pure Appl. Chem., 1 (1957) 69
128. D. Laser and M. Ariel, J. Electroanal. Chem., 52 (1974) 291
129. B. D. Epstein, E. Dolle-Malle and J. S. Mattson, Carbon, 2. (1971) 609
130. L. Dunsch and R. Naumann, Z. Chem., 14 (1974) 31
131. G. E. Cabaniss, A. A. Diamantis, W. R. Murphy, Jr., R. W. Linton and T. J.
Meyer, J. Amer. Chem. Soc., 107 (1985) 1845
132. J. M. Thomas, E. L. Evans, M. Barber and P. Swift, 3rd Int. Conf on
Industrial Carbon and Graphite, Society of Chemical Industry, London,
(1970) 411
133. J. M. Thomas, E. L. Evans, M. Barber and P. Swift, Trans. Faraday Soc., 67
(1971) 1815
134. M. Barber, P. Swift, E. L. Evans and J. M. Thomas, Nature, 227 (1970)
1131
319
135. E. L. Evans, J. M. Thomas, H. P. Soehn and H. Marsh, Int. Carbon Conf,
Baden-Baden, (1972) 72
136. J. M. Donnet, E. Papirer and H. Dauksch, Pap. No. 9, Int. Conf on Carbon
Fibres, Their Place in modern Technology, London, (1974)
137. J. B. Donnet, H. Dauksch, J. Escard and C. Winter, C.R. Acad. Sci., Ser. C,
275 (1972) 1219
138. J. B. Donnet and P. Ehrberger, Carbon, 15 (1977) 143
139. P. Ehrberger, H. Dauksch, J. Escard and J. B. Donnet, Silicates Ind., l (1975) 55
140. H. Heiraoka and W. Lee, Macromolecules, 1! (1978) 622
141. F. Hopfgarten, Ext. Abstr., Program Bienn. Conf. Carbon, li (1977) 288
142. W. Chen and J.P. Wightman, ibid, 14 (1979) 107
143. I. L. Kalnin, ibid, 12 (1975) A1
144. F. Hopfgarten, Fibre Sci. Technol.ll (1978) 67
145. F. Hopfgarten, Fibre Sci. Techno/., 12 (1979) 283
146. D. M. Brewis, J. Comyn, J. R. Fowler, D. Briggs and V. A. Gibson, ibid, 12
(1979) 41
147. M. L. Liebennan and G. T. Noles, J. Mater. Sci., 1 (1972) 654
148. C. E. Hammer and L. T. Drzal, Appl. Surf Sci., .1 (1980) 340
149. C. R. Thomas and E. J. Walker, Proc. 5th Int. Carbon Graphite Conf,
London, (1978) 520
150. A. Ishitani, Carbon, 19 (1981) 269
320
151. A. Proctor and P. M. A. Sherwood, J. Electron. Spectrosc. Related Phon., 28
(1982) 39
152. A. Proctor and P. M. A. Sherwood, Carbon, 21 (1983) 52
153. C. Kozloeski and P. M. A. Sherwood, J. Chern. Soc., Faraday Trans. 1, 80
(1984) 2099
154. C. Kozloeski and P. M. A. Sherwood, J. Chern. Soc., Faraday Trans. 1, ..[1
(1985) 2745
155. C. Kozloeski and P. M. A. Sherwood, Carbon, 24 (1986) 357
156. C. Kozloeski and P.M. A. Sherwood, Carbon, 25 (1987) 751
157. J. Harvey, C. Kozlowski and P. M. A. Sherwood, J. Mater. Sci., 22 (1987)
1585
158. Y. Xie and P. M. A. Sherwood, Appl. Spectrosc., 43 (1989) 1153
159. Y. Xie and P. M. A. Sherwood, Chern. Mater., 1 (1989) 427
160. Y. Xie and P.M. A. Sherwood, Appl. Spectrosc., 44 (1990) 797
161. Y. Xie and P. M. A. Sherwood, Appl. Spectrosc., 44 (1990) 1621
162. E. Yeager, J. A. Molla and S. Gupta, Proceedings of the Workshop on The
Electrochemistry of Carbon, August, 1983, Cleveland, OH, The Electrochem.
Soc., Proceeding Vol. 84-5, p. 123
163. G. N. Kamau, W. S. Willis and J. F. Rusting, Anal. Chern., 57 (1985) 545
164. K. M. Sundberg, W. H. Smyrl, L. J. Atanasoska and R. Atanasaski, J.
Electrochem. Soc., 136 (1989) 434
165. R. J. Bowling, R. T. Packard and R. L. McCreery, J. Amer. Chern. Soc., 111
(1989) 1217
321
166. R. M. Wightman, M. R. Deakin, P, M. Kovach, W. G. Kuhr and K. J. Stutts,
J. Electrochern. Soc., 131 (1984) 1578
167. A. D. Jannakoudakis, Synthetic Metal, 39 (1991) 303
168. M. Poon and R. L. McCreery, Anal. Chern., 60 (1988) 1725
169. Z. Lausevic and G. M. Jenkins, Carbon, 24 (1986) 651
170. G. Mamantov and D. B. Freeman, J. Electroanal. Chern., .2. (1965) 305
171. S. M. Lipka, G. L. Cahen, Jr., G. E. Stoner and L. L. Scrbner, Jr., J.
Electrochern. Soc., 135 (1988) 368
172. S. Neffe, Carbon, 25 (1987) 761
173. J. O'M Bockris, Proceedings of The Second Symposium on Electrode
Materials and Processes for Energy Conversion and Storage, Proceedings
Vol. 87-12 (Eds: S. Srinivasan, S, Wagner and H. Wroblowa), The
Electrochem. Soc., p.1
174. S. Dong and T. Kuwana, J. Electrochem. Soc., 131 (1984) 813
175. D. Sh. Cheng and E. Hollax, ibid, 132 (1985) 269
176. A. Dekanski, N. S. Marinkovic, J. Stevanovic, V. M. Jovanviv, Z. Lausevic
and M. Lausevic, Vacuum, 41, 7-9, Pt3 (1990) 1772
177. E. S. Takeuchi and W. C. Thiebolt, J. Electrochem. Soc., 135 (1988) 2691
178. R. F. Gahn and N. H. Hagedorn, U. S. Patent 4,543,302 (1985)
179. A. J. Bard and L. R. Faulkner, Electrochemical Method.., Fundamental and
application, Wiley, New York (1980)
180. R.N. Adams, Electrochemistry at Solid Electrodes, Marcel Dekker Pub.,
(1969)
322
181. D. H. Evans, K. M. O'Connell, R. A. Peterson and M. J. Kelly, J. Chern.
Edu., 60 (1983) 290
182. G. A. Mabbott, ibid, 60 (1983) 697
183. D. Linden (editor in Chief), Handbook of Batteries and Fuel cells, McGraw
Hill Book Company, (1984)
184. R.F. Gahn, N.H. Hagedorn and J.S. Ling, Proceedings ofThe 18th
Intersociety Energy Conversion Engineering Conference, Volume 4, (1983)
paper No. 839269.
185. K. Nozaki, H. Kaneko, A. Negishi, ibid., paper No. 839268
186. P. C. Butler and D. W. Miller, ibid., paper No. 839270
187. P. C. Butler, D. W. Miller and A. E. Verardo, The proceedings of the 17th
IECEC, Volume 2, (1982), paper No. 829113
188. S.C. Chieng, H. Chau and M. Skyllas-Kazacos, CHEMECA 91, Aug. 1991,
Newcastle, Australia, p.414
189. S. C. Chieng, M. Kazacos and M. Skyllas-Kazacos, J. Power Sources, in
press, 1991
190. M. Kazacos, Msc thesis, The University of New South Wales, Australia,
1989
191. U. Gelius, P. F. Heden, J. Hedman, R. Manne, R. Nordberg, C. Nordling,
and K. Siegbahn, Physica Scripta, l (1970) 70
192. M. Skyllas-Kazacos et al, NERDDC report, 1990
193. "Shell Kraton Rubber for Modification of Thermoplastics", Technical
Bulletin SC: 165-77, Shell Chemical Company, 1985
323