
STUDIES OH ELECTRODE POTENTIALS. and THE IONIC ...
220
STUDIES OH ELECTRODE POTENTIALS. and THE IONIC PROPERTIES OF MIXED ACIDS. fcy H. F. Brown
-
Upload
khangminh22 -
Category
Documents
-
view
1 -
download
0
Transcript of STUDIES OH ELECTRODE POTENTIALS. and THE IONIC ...

STUDIES OH ELECTRODE POTENTIALS.
and
THE IONIC PROPERTIES OF MIXED ACIDS.
fcy
H. F. Brown

ProQuest Number: 13905584
All rights reserved
INFORMATION TO ALL USERS The quality of this reproduction is dependent upon the quality of the copy submitted.
In the unlikely event that the author did not send a com p le te manuscript and there are missing pages, these will be noted. Also, if material had to be removed,
a note will indicate the deletion.
uest.ProQuest 13905584
Published by ProQuest LLC(2019). Copyright of the Dissertation is held by the Author.
All rights reserved.This work is protected against unauthorized copying under Title 17, United States C ode
Microform Edition © ProQuest LLC.
ProQuest LLC.789 East Eisenhower Parkway
P.O. Box 1346 Ann Arbor, Ml 48106- 1346

PREFACE.
The work described in this thesis was performed by myself during the period September 1934 - June 1937, in the research and physical chemistry laboratories of The Royal Technical College, Glasgow.
I was appointed research assistant to the late Professor Caven in June of 1934, and intended to continue his work on double salts. Professor Caven died prior to
the beginning of the academic year in September 1934,
however, and I requested to be placed in the Physical Chemistry Department of the College, under the supervision of Dr. J.A. Cranston. A new research problem had to be chosen at short notice. An investigation of the hydrogen ion concentrations of mixed acids, suggested itself as a logical sequel to results already published by Dr. Cranston on the conductivities of such solutions. The results of my work are published in the Journal of The Royal Technical College under the title, "The Chemical Union of Acids with
One Another." (Vol. 3. Part 4. 1936.)The work on mixed acids was extended by examining the
volume changes that occur on mixing, using a float capable of detecting changes in density of one part in a million with ease. Owing to the number of unknown factors

influencing volume changes in mixed solutions, it was decided not to devote the whole period of research to this
subject. Sufficient was done to show that application of the float method to this work offers scope for extensive research. The work on mixed acids is described in the
latter part of this report under the title,"The Ionic
Properties of Mixed Acids".A new MeFarlane-Pye valve potentiometer being available,
the study of acid solutions was continued from the more practical aspect of hydrogen ion concentration. This involved acquiring the technique of the hydrogen and particularly the glass electrode, which had not been previously studied in this College. The potentials of these electrodes were measured in a number of acid solutions, varying over a wide range in concentration. This work and application of the results is described in the Journal of The Royal Technical College, (Vol. 4. Part. 1937), under
the title,"The Potential Developed by the Hydrogen Electrode and by the Glass Electrode in Concentrated Acid Solutions."
Having gained experience with the glass electrode, and realising its possibilities for use in unbuffered solutions, it was applied to measurement of the hydrolysis of a number of salt solutions. A fair amount of work had been done by others with organic salts where hydrolysis is considerable and therefore easy to measure, but there was a

conspicuous absence of data on the hydrolysis of common inorganic salts. Determination of pH in such poorly
buffered solutions demands refined methods. The results of part of my work on hydrolysis are published under the
title, "The Hydrolysis of Salts", Parts 1. and 11., in the Journal of the Hoyal Technical College, Vol. 4. Part 1.1937.
Finally, the more ambitious task of pH measurement in pure water, and in salt solutions which are only very slightly hydrolysed was undertaken. A paper entitled, "The pH of Distilled Water and the Measurement of the Hydrolysis of Ammonium Sulphate, Nitrate, Chloride, and Acetate'J has recently been submitted to the Faraday Society for public
ation. The subject of the measurement of electrode potentials in aqueous solutions occupies the main portion of this thesis under the title, "Studies on Electrode Potentials".
The thesis has been composed by myself, and is original except where reference is made to the work of others.
I wish to record my profound gratitude for the advice and encouragement freely accorded me at all times by Dr. Cranston.

CONTENTS.
STUDIES ON ELECTRODE POTENTIALS.
Section I.
Section II.
Section III. The pH of Water. 112
THE IONIC PROPERTIES OF MIXED ACIDS.
Section IV. The Chemical Union of Acids with OneAnother. 120
Section V. Volume Changes in Mixed Acids. 136
Summary. 154
Literature. 156
The Glass Electrode. T *The Calculation of pH from Electrode Potential. 6The Potential Developed by the Hydrogen Electrode and by the Glass Electrode in Concentrated Acid Solutions. 9
36Measurement of Salt Hydrolysis by Means of the Glass Electrode. 38

STUDIES ON EiaCTRODE POTENTIALS.

SECTION 1
The major portion of the work described in this section is concerned with the glass electrode, and the measurement of hydrogen ion activity. Before proceeding to an account of the actual work, it is appropriate to give a brief description of this electrode, the measurement of its potential, and the calculation of pH value.
The Glass Electrode.- A potential is produced at the phase boundary between an aqueous solution and a glass wall. This potential is a function of the hydrogen ion concentration of
ithe aqueous solution, and was discovered by Cremer in 1906.a.Haber and Klemensiewicz developed the glass electrode from
this observation, and showed that the potential across a very thin glass membrane is proportional to the pH difference between the aqueous solutions on either side of it. If the pH of one of the solutions is kept constant, that of the other can be calculated from the observed E.M.F. given by
joining the electrode to a standard electrode. The glass electrode had not received any great attention until recent years, but now that its immense possibilities are realised it is being studied and used extensively. The rapid improvement in the technique of this electrode, and the enlargement

of its scope will undoubtedly continue, probably until it completely displaces the hydrogen electrode except for use as
an ultimate standard. The advantages the glass electrode
possesses over the hydrogen and similar electrodes are dealt with later in Section 11.
The behaviour of a glass electrode depends largely on the type of glass used in its construction. Theoretically both sides of the glass membrane act as hydrogen electrodes, but in practice, there is a small variable potential difference when both sides of the membrane are in contact with the same solution. The size of this asymmetry potential, the resistance of the glass electrode, and the magnitude of the deviation from the behaviour of a reversible hydrogen electrode depend on the glass used. The most satisfactory glass electrodes have a very small asymmetry potential, a comparatively low resist
ance, and function as a hydrogen electrode over a wide pH range. Since the asymmetry potential of the glass electrode varies slightly from day to day, and is specific to any particular electrode, it is necessary to calibrate before a measurement, by determining the potential of the electrode in solutions of known pH value. The commonest type of glass electrode, and the one used by the writer, consists of a thin bulb of glass blown on the end of a piece of glass tubing. A calomel, quinhydrone or other type of electrode, dips into the solution inside the electrode, while a calomel or equivalent electrode

is connected to the solution under examination, into which the glass electrode dips. The observed E.M.F. of the chain formed is measured, and the pH of the unknown solution found from the calibration data. The type of circuit used in the present work is represented by the chain:-
buffer solution glass unknown N/10 KCI-quinhydrone membrane solution Hg2C]^
Measurement of the E.M.F. of the Glass Electrode- An ordinary galvanometer cannot be used to measure the E.M.F. across a glass membrane, since the resistance of this electrode is of the order of megohms. The current required to deflect a sensitive galvanometer would give a considerable potential fall across the high resistance of the glass membrane, a potential which would not be accurately assessable, and whichwould be measured along with the one of electrochemical origin.
-8In addition, the passage of such a current - say 10 amp. -
would probably polarise the glass electrode. Hence it is necessary to measure the potential by a method which recuires a negligible current flow, such as by the use of a condenser and ballistic galvanometer, a quadrant electrometer, or by connecting the cell chain between the grid and the filament of a thermonic valve. The latter method which is the most convenient, and probably the most accurate with an efficient instrument, was used in the present work. This method utilises

4the large current changes that occur in the anode circuit, when the potential of the grid changes slightly, the changes
in anode current being detected by an ordinary galvanometer.
It is not proposed to describe the circuit of the fcicFarlane- Pye valve potentiometer which was used, as this is done by
3the designer in a series of papers. It will suffice to say that it incorporates two normal type triode valves in a Wheatstone bridge circuit. The grid of one of the valves is connected to the chain to be measured. It is of course essential that no appreciable grid current should flow.Some valve potentiometers, such as the Harrison, achieve this object by using special valves having a very high grid resistance. The mutual conductivity of such valves - called electrometer valves - is very low, hov/ever, so that the
sensivity to a change in grid potential is poor. The IdcFarlane circuit incorporates normal valves of high mutual conductivity, with the grid of the working valve biased to the point of floating grid potential - the point at which no grid current flows. In addition, the circuit is compensated, so that small changes in the E.IC.F. of the high and low tension batteries have no effect on the galvanometer zero. Before a reading, the instrument is adjusted so that the 'working valve' is at the floating grid potential, by altering its grid bias until no grid current flows. This is done by temporarily switching a high resistance into the grid circuit. If a grid current

5
is passing, the fall in potential across the high resistance will alter the anode current, and deflect the galvanometer.
The grid bias is adjusted until introduction of the high
resistance in the grid circuit causes no change in anode
current. The instrument adjusted, the chain to be measured is inserted in the grid circuit, and a built in potentiometer adjusted to balance the applied potential, and so bring
the anode current back to the original value at the floating grid potential. The valves have a high grid impedance, so that negligible grid current passes when the applied potential is not exactly balanced (the potentiometer can be adjusted
to 1 millivolt.) A difference of 0-1 to 0-2 millivolts can be estimated by noting the galvanometer deflection for 1
millivolt change. A difference of 0*1 of a millivolt is equal to a change of about 0-002 in the pH value. The potentiometer circuit is adjusted the usual way, using a standard cell in the grid circuit.
In a valve potentiometer circuit, it is necessary to insulate the grid lead very carefully, and to screen the circuit and chain from electrical disturbances and capacity effects. The lower the resistance of a glass electrode the less necessary is it to use careful screening.

6The Calculation of pH from Electrode Potential.- The most
accurate method of determining pH value, but the one of least
general application, is by the use of the hydrogen electrode, which consists of a small sheet of platinized platinum, partially immersed in a liquid through which hydrogen gas is bubbling. The electrode surface adsorbs hydrogen, and behaves as if it were a solid electrode of the gas. The electrode is truly reversible, and the potential depends only on the pressure of the gas, and the activity of the hydrogen ions in the solution. Application of the Nernst formula to the
equilibrium 2H + 2 e , gives the potential difference S between the electrode and the solution. .
E = E0 -f- RT. In. a~r------------- (1)F
E0 called the standard electrode potential, is independent of the hydrogen ion activity. In Europe the sign of the electrode is considered with respect to the solution. The formula as written above complies with the theory of solution pressure so that the greater a^, the more positive the potential.
The E.M.F. of a hydrogen or other electrode is estimated by measuring the observed E.M.F. of a chain combining it with another single electrode, such as the calomel electrode.
If Ec is the absolute potential of the calomel electrode, and Eol3S the E.M.F. of the chain, then
Eobs = ®c~ 20—RT.in.a^------------- (2)FSince differences in potential between two single electrodes

7
are measured, it is necessary to fix some arbitrary potentialstandard, so that a scale of potentials for single electrodes
can be compiled. The standard used in electrochemistry is
the potential of the normal hydrogen electrode, which is a
hydrogen electrode with gas at one atmosphere pressure,immersed in a solution containing hydrogen ions at unit
activity. The potential difference between this electrodeand the solution is considered to be zero at all temperatures.From expression (l).it is seen that E0 is equal to zero onthis standard, called the 'hydrogen scale'. (The gas pressureis, in general, approximately equal to one atmosphere.) Ifthe hydrogen ion activity of a solution is known, it is seenfrom expression (2) that Ec-E0 can be calculated from theobserved potential. EC~E0 is the difference between theabsolute potentials of the calomel electrode and the normal
hydrogen electrode, and so represents the potential of thecalomel electrode on the 'hydrogen scale'. The value E — Ec ohas been measured at different temperatures, and is obtained from tables. Calling it Ecal expression (2) becomes
(3)
which is the equation used for calculating a .. By definition pH= —log a - so that
(4)

8The values of Eca- andare listed below.
Temperature (° C.)
151617181920 21 22
2*303-RTused in the present work
£ i •N/10?Volts)
0-338210-338140-338070-33800-337930-337860-337790 • 33-772
2-303 RT F.
0-0571 0-0573 0- 0575 0-0577 0-0579 0-0531 0-0583 0-0585
The formula connecting pH and the E.M.F. of a glass -
calomel electrode chain is obtained by adding a factor to the right hand side of equation (4). The value of this factor, which changes slightly from day to day, depends on the solution inside the glass electrode, and on the asymmetry potential. The pH is found with this electrode by calibrating it in solutions of known pH before a series of measurements.
Until recent years it was customary to speak of hydrogen ion concentration, and the arbitrary zero was the potential of a hydrogen electrode in a solution containing one gram
equivalent of hydrogen ions, as determined by conductance measurements. Since' the introduction of the activity concept,
it is realised that the hydrogen or equivalent electrode measures activities and not concentrations. In dilute solution the distinction is probably negligible, and the terms are often used synonymously.

9
POTENTIAL DEVELOPED BY THE HYDUOO w' ELECTRODE A??D BY THE GLASS ELECTRODE IN CONCENTRATED ACID SOLUTIONS.
The measurement of hydrogen ion activity by means of an electrode is limited to dilute solutions, as are all measurements which involve an application of the gas laws for their interpretation. In addition, Ostwald's dilution law, by which hydrogen ion concentrations may be calculated from conductivity results, holds only for very dilute solutions of weak electrolytes, and even for such solutions, it is
snecessary to use a modified conductance ratio for calculating degree of ionization. This is because ionic mobilities decrease as the concentration of a solution increases instead of remaining constant as Ahhrenius supposed. It is probable that little theoretical value can be attached to conductivity measurements in strong electrolytes, since in the expression A=°<F(u + v), both<< and (u + v) are unknown. For very dilute solutions of weak electrolytes it is assumed, probably correctly, that (u+v) is constant, and so the 'degree of dissociation' is calculated. With strong electrolytes, however, (u + v) varies, and so the concentration of the ions cannot be measured. Debye assumes that* is unity, and that variation inAis due solely to change in (u+v), i.e. mobility of the ions, due to interionic attraction. Evidence exists, however, that strong electrolytes do contain some

10
unionized molecules.Ostwald's dilution law is not obeyed exactly, even
by dilute solutions of weak electrolytes, and using themodified conductance ratio, if stoichiometric concentrationsare used. G. N. Lev/is introduced the conception of activities
to replace concentration in the mass action equations.
Activities may be defined by stating that the classical
formulae are obeyed, when activities are used in place ofconcentrations. The activity coefficient, which is the ratioof the activity to the total concentration of a species, isthus in the nature of a corrected degree of ionization. Theactivity of a species differs from the concentration, becauseof the mutual effect of ions and molecules in nonidealsolutions. The agreement for experimental activities foundby different workers is not good, except for very diluteuniunivalent salt solutions. In concentrated solutions ofstrong electrolytes, the activity coefficient, as determined
by various agreeing methods, loses its significance as acorrected degree of dissociation. For example, the activity
6coefficient for hydrochloric acid has a value 0*99 at molality 00005, decreases to 0-76 at 0-5 molality, but rises to 43-2 at a molality of 16 . A degree of dissociation of 4320% is of course meaningless, and at present there is no general theory, on the dissociation of electrolytes, that can be quantitatively confirmed in any but dilute solutions.
11
It is jjrobably for this reason that the present tendency
in physical chemistry is to deal with more and more dilute solutions. As Professor Bancroft of Cornell University has
7stated, in reviewing fifty years of physical chemistry, the idea that a O-OBI solution is moderately concentrated is artificial, and the physical chemistry of the future must deal with actual solutions, and not limit itself to the study
of 'slightly polluted water'. There is a lack of experimental data dealing with any but dilute solutions.
The present work provides some data on the potential of the hydrogen electrode in solutions of concentrated acids.
The potentiometric estimation of electrode potentials is neat and exact, and has the advantage that a truly reversible process is measured. The measurements were made in solutions varying in concentration whenever possible from 0 to 100%.It was thought that a comparison of the hydrogen electrode potential in different acids might prove of theoretical interest.
Data on the extent to which the glass electrode departs from the behaviour of a hydrogen electrode in concentrated acids did not appear to exist. The apparatus was designed to be available for normal pH measurement with the glass and hydrogen electrodes (see section 2), so that opportunity v/as taken of recording the behaviour of the glass electrode in the solutions used in the present work.

12
EXPERIMENTAL METHOD.
It was necessary to employ apparatus that would enable
formation of a clear cut, reproducible liquid junction between
saturated potassium chloride solution and the acid solutions,
since the liquid junction potential was likely to be large.It has been shown that the most stable and reproduciblejunctions are formed when saturated potassium chloridesolution is used as the lower liquid in a vertical tube having
8a bore of 3 - 7 mm. In addition it was desirable to guard against the poisoning of the hydrogen electrode by mercuric ions from the calomel cell, and to protect the calomel electrode from contamination by the concentrated acids. The increase in resistance caused by the introduction of several
ungreased stop-cocks did not matter, since all the potentials
were measured by the valve potentiometer.The E.M.F. of the hydrogen electrode was found from the
observed E.M.F. of the cell.
Hg N/10 KC1 Hgg-Clg acid solution ILsat. KC1The behaviour of the glass electrode was studied by direct comparison with the hydrogen electrode using the cell.
chain 1.
approx. N/5 HC1 glass acid solution H2 -----quinhydrone10
Au
As Maclnnes and Dole describe, the above chain should give a constant potential irrespective of the hydrogen ion concentrat-

13
ion of the acid solution, providing the glass electrode behaves as a hydrogen electrode. This is so because a glass
electrode normally behaves as if both sides of the membrane were hydrogen electrodes, so that the above chain is represented by the combination of the two cells,
Au approx. N/5 HC1, quinhydrone Hg and Hg acid solutions H2
Since the right hand cell has an E.M.F. of zero whatever the pH of the acid solution, it is seen that chain (2) is
equivalent to the cell.
Au approx. N/5 HC1, quinhydrone H2
which does not vary. The extent to which the E.M.F. of chain (2) departs from a constant is a measure of the departure of the glass electrode from its function as a hydrogen electrode.
The apparatus in Figure 1. was designed to fulfil the above requirements. Figures la. and lb., respectively, show the arrangement for solutions which are less and more dense than saturated potassium chloride. The bridge in Figure lb., drawn on a reduced scale, replaces tube C. in Figure la., and when it is used vessel 3. is replaced by a shorter vessel of similar shape, so that the surface of the saturated potassium chloride solution in it comes below that of the solution in D. Vessel A., iato which the arm of the N/10 calomel electrode dipped contained N/10 potassium chloride saturated with calomel

Electrode apparatus for measuring pH values by the glass electrode and for comparing this electrode with the hydrogen electrode.

14and prevented contamination of the electrode by back diffusion of the sa.lt bridge. Vessel B. contained saturated potassium chloride solution, and the solution under examination was placed in vessel D. of total capacity about 300 c.c. The lid of the vessel was of a substance of high electrical resistance. A gas tight fit was provided by a flange and rubber washer,
the lid being held firmly in position by three springs fastened to an ebonite base. Some of the acids used evolved corrosive vapours (formic acid in particular), and it was found necessary
to protect the underside of the lid with a lining of paraffin wax. Fitted into six holes in the lid, by means of rubber stoppers 3-lso coated with paraffin wax, were two hydrogen electrodes, two glass electrodes, a mercury trap through which the hydrogen escaped, and the connecting tube C. The calomel electrode and the apparatus marked A., B., and C., were supported by a frame standing on a wax block. Vessel D. was also
supported on a wax block.The procedure followed in forming the liquid junctions
will be described in detail, since it applies to all the work done with this apparatus, and since reproducible results with concentrated acids depend on the formation of a clean cut junction. The two junctions, one between the 11/10 and the saturated potassium chloride solution, the other between the saturated salt solution and the solution in vessel D., were formed in tubes A. and C. respectively, in Figure la. Tubes A. & C. were filled with N/10 potassium chloride solution
15and the acid solution from D. respectively, a few c.c. being allowed to run out through X and Y. The pressure of the
hydrogen, bubbling through the solution in D., was utilised in filling C. by closing the. mercury trap momentarily with the finger. The horizontal tube XY was now filled with saturated potassium chloride solution by manipulating stopcock 2. The stop-cocks 1, 3 and 2 used in the above procedure were now back in the normal position as shown in Figure la.To form the junction in A., stop-cock 2. was turned so that •
the saturated potassium chloride solution dripped slowly from X. A clean cut junction, which rose slowly in tube A. was formed by turning stop-cock 1. through 90° in an anticlockwise direction. The junction was arrested about 2 cm. above the stop-cock (see arrow, Figure 1.), by returning the latter to its 'normal' position. The junction in tube C. was made in a similar way by manipulation of stop-cocks 2. and 3. When using the second set-up for solutions denser than saturated potassium chloride, tubes E. and F. were filled with saturated potassium chloride and the acid solutions respectively, by manipulation of stop-cocks 3. and 4., the excess liquid being run off through Z. Tubes E. and F. were then joined by turning stop-cock 4. The junction was. formed above stop-cock 4. on opening stop-cock 3. for a few seconds and then returning to the 'normal'position. With the lower position of vessel B. it was necessary to force the saturated potassium chloride

16solution into tubes A. and E., by blowing through a piece of tubing fitted temporarily to the mouth of vessel B.
The E.M.F. of chain 1. gave steady reproducible values with junctions formed in the above fashion. It was noticed that if no definite junction were formed, so that contact
between acid and salt solutions occurred within the stop-cock, the potential was variable, and 4 - 3 0 millivolts higher than
the reproducible potential occurring with a clean cut junction. The junctions were formed about fifteen minutes after commencing to pass hydrogen, by which time usually the hydrogen electrodes had attained equilibrium and the final potential been developed.
The level of the end of tube C. in vessel D. was fixed
just above the glass electrode bulbs, in order to prevent their drying due to accidental siphoning of all the liquid from the vessel, and to avoid risk of touching them.
Hydrogen Electrodes.- The hydrogen electrodes, four of whichwere made, were prepared by welding a length of doubled 0*1 mm.platinum wire to a rectangular plate about 0*5 cm. x 1 cm,,made by folding a piece of platinum foil so as to give fourlayers. The wire was then sealed into a glass tube, a littleglass being allowed to fuse over the platinum foil in order to
ngive rigidity as recommended by Clark. Preliminary attempts to make electrodes with thicker platinum wire, which has the advantage of being more rigid, gave rise to erratic non-

17
reproducible potentials. Agreement between two electrodes
could not be obtained although they were replatinised many times. The cause of the trouble was finally traced to minute,
almost invisible cracks in the glass seal,.which allowed the
mercury to contaminate the platinised electrode. The following procedure was used in coating the electrodes with platinum black. The electrodes were prepared by first polishing with fine emery paper and with a glass rod, then made the anode in fairly concentrated hydrochloric acid solution, the cathode in dilute sulphuric acid, washed in distilled water, and platinised two at a time for five minutes, the current being- reversed every half minute. They were then made the cathode
in dilute sulphuric acid for fifteen minutes, washed, and
stored in test tubes of distilled water. Electrodes differing by one millivolt in the same solution were replatinised. The flow-of hydrogen was momentarily stopped while taking a reading, (with the gas bubbling readings were about 1 millivolt lower than the true reading.) The electrodes were frequently tested with a phthalate buffer solution of pH 3*97.
The outer jacket was made from tubing of uniform diameter to facilitate fitting a rubber stopper, which is necessary for an air-tight fit. A ring of small holes at the level of the electrode plate allowed a steady stream of hydrogen to escape.

18Calomel Electrodes.- The decinormal calomel electrodes used were prepared in the usual way using ’AnalaR' reagents. The mercury was purified by bubbling air through the liquid,
heated to just below its boiling point, for a day. The clean mercury was then decanted off, washed many times with distill
ed water, and repeatedly filtered through a BCtchner funnel, the filter papers being punctured with tiny holes. Drying
was effected by this filtering process, and then in a vacuum oven at 105° C. The calomel cell used was checked periodically against another made at the same time. The excess paste of calomel, mercury and N/10 potassium chloride solution used in preparing the calomels, was poured into a stock bottle of N/10 potassium chloride. This solution was then used for the
occasional replenishment of the cell, necessitated by the daily flushing out of the side arm. Six calomel cells were prepared at different stages in the work on electrode
potentials.G1 iss Electrodes.- The material used in the preparation ofthe glass electrodes was Corning 015 glass which is recommend-ed by numerous workers for the low asymmetry potential, lowelectrical resistance, and small error in alkaline solutionof electrodes prepared from it. The bulb type of electrode
-fpreferred by Harrison, and Glasstone was used. Two sizes of 015 glass tubing were employed, one of 0*1 mm. bore, the other of 5-0 mm. bore. With the wide bore tubing, the method of preparing an electrode was to close the end of the tube in a

19
small blowpipe flame, remove most of the resulting blob of glass, and then to blow the bulb. A preferable method from
the point of view of the small amount of special glass used, and ease of preparation, waa to seal a small amount of the
narrow section 015 tubing on to the end of a 10 - 12 cm. length of ordinary 5 mm. tubing, and then to blow the electrode. The shorter heating required with this method is an added advantage since devitrification of the glass is to
be avoided. The average diameter of the bulb of the electrodes was about 1*5 cm. With a little experience it was possible to know whether an electrode would be successful by lightly
touching the bulb with the side of a file. A sufficiently thin electrode yields to the slightest pressure without breaking. Too thin electrodes broke on washing or filling, and the necessity for excessively thin membranes was never experienced with the valve potentiometer used.
The glass electrodes were filled with approximately N/5 hydrochloric acid solution saturated with quinhydrone, and a gold wire carrying a terminal connection dipped into the electrode arm, the joint being sealed with paraffin wax. The four or five centimetres of the electrode arm protruding above the rubber stopper, (Figure 1.), were coated with a varnish of shellac in absolute alcohol to give a surface of high electrical resistance. Considerable trouble was experienced at the beginning of this research due to an electrical leak

20
between the solutions on the inside and outside of the electrode. A note at the end of this section describes the preliminary difficulties due to this cause. There seems
little doubt, if the two solutions are not very well insulated from each other, that the potential given by a glass electrode in the same buffer solution from day to day will show a. lai*ge variation, and be an unassessable source of error. It is possible that such changes, which some workers attribute to a variable asymmetry potential, is due actually to poor
insulation at this point. The electrodes in the present work
always gave the same potential to within 2 - 3 millivolts at the same pH value over a period of months. It was customary to prepare a batch of 20 - 30 of these electrodes at a time, and to store them in a large dish of water lined with cotton wool. The tops of the electrode arms were sealed with paraffin wax during storage in order to prevent change of the liquid inside the electrodes.
Screening.- The valve potentiometer and electrode apparatus in Figure 1. were contained in a wooden cabinet made for the purpose, incorporating a glass top for observation and a sliding front. The half of the cabinet containing the
electrode apparatus was electrically screened by a metal lining connected to earth. The average temperature of the experiments in this section was 17° C., with a fluctuation- of ± 1°, recorded by a thermometer inside the cabinet.
21Weston Cadmium Cell.- The standard cell was made in the usual way, and tested from time to time against a cell bearing an N.P.L. certificate. Its E.M.F. varied by only 1-5 millivolts in two years.
EXPEitll.iENTAL.
Preliminary Test.- The E.M.F. of chain 2. was measured using
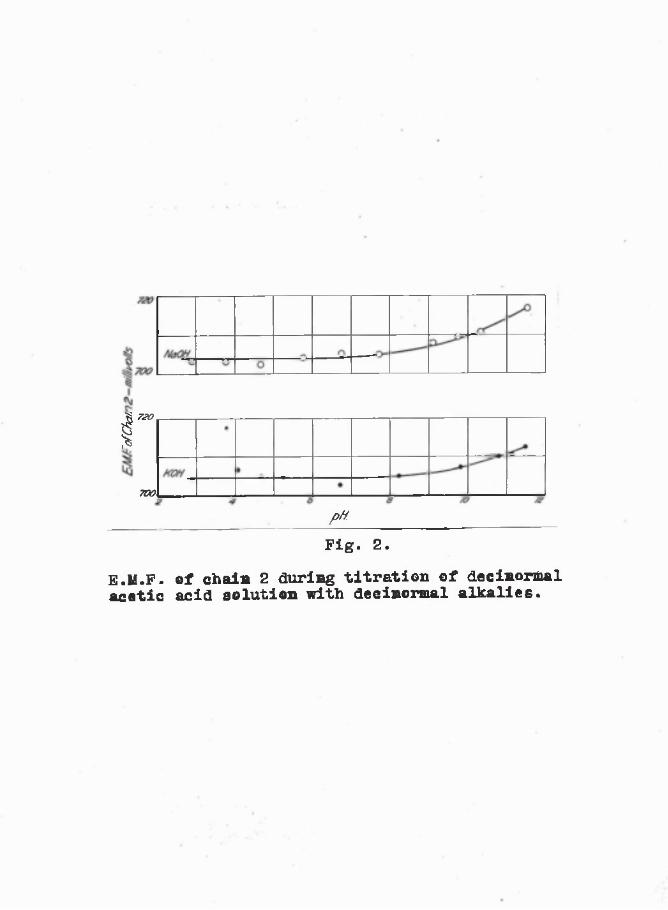
dilute solutions, to see how constant it would be in solutions in which the glass electrode functions approximately as a reversible hydrogen electrode. The pH range 2*83 - 11*6, as measured by chain 1., was obtained by titrating approximately N/10 acetic acid with (a) approximately 11/10 caustic potash, and (b) approximately N/10 caustic soda solutions. Headings were taken with each of the two hydrogen electrodes in turn,
the difference between the two readings being less than 0*5 of a millivolt. The mean E.M.F. of chain (2) for the two glass electrodes used is graphed against the pH measured by
the hydrogen electrodes; see Figure 2. It will be seen that the hydrogen-glass combination gives an almost steady E.M.F. from pH 2-9 (the lowest pH recorded in this trial), to pH 3-9. Beyond this value the glass electrode becomes more positive than would a reversible hydrogen electrode, i.e. the slope of the E.M.F. : pH graph for the glass electrode becomes more than the theoretical 57*1 millivolts per pH at 15° C.
ft 720I700
P ”
Fig. 2.E.M.F. of chain 2 during titration of decinortoal acetic acid solution with decinormal alkalies.

22
headings were taken to the nearest 0• -5 millivolt, and were not recorded until they had remained constant for ten minutes or so. Liquid junctions were renewed before accept
ing a reading.
Hydrogen Electrode Potentials.- The number of acids, liquid
at room temperature in the pure state, and completely miscible with water is limited. The five used were sulphuric, ortho- phosphoric, formic, acetic and propionic acids, the concentration of the solutions varying over the range 0*1% to 100% when possible. The formic acid was an AnalaR reagent and was crystallized once. The glacial acetic acid was recrystallized three times, while the propionic "acid was distilled, the middle fraction being the one used (99*5% acid by volumetric analysis). The solid 100% orthophosphoric and the sulphuric acid, (C.P. 'pure for analysis'), were used without further purification.
All dilutions were made with conductivity water prepared in a Bousfield still. The average value of the specific conductivity which was measured from time to time was 1-5 reciprocal megohms. The concentration of each acid solution was estimated, immediately after obtaining the E.M.F. readings for the sample, by titrating weighed amounts made up to convenient volume against standard caustic soda solution.Sodium chloride was added to the solution in the analysis of phosphoric acid in order to drive back the secondary ionization, methyl orange being used as indicator. Any change in

1 /oo
Is
/y
0 /r
2^ y >x\ ' \t% 1«A
,a? oo 60P ercentage com position
Fig. 3.E.M.F. of the hydrogen electrode in solutions of
1. Sulphuric acid. 2. Phosphoric acid3. Formic acid 4. Acetic acid
5 Propionic acid

TABLE I.
Hydrogen electrode potentials in acid solutions.
Composition Potential in millivolts.byrwe5£t. H2S04 HJP04 H -°°2H OHj .C02H C ^ . C O jH
1 -57 -855 -16 -55
10 + 4 -3820 +24 -1930 +42 - 240 +58 +1150 +75 +2460 +98 +3870 +130 +4980 - +6190 - +69
100 - +70
-120 -155 -160- 92 -136 -143- 76 -124 -134- 61 -106 -120- 45 - 95 -109- 27 - 85 -100- 6 - 72 - 92+ 20 - 55 - 80+ 53 - -+ 92 - -+144

concentrations due to bubbling hydrogen through the solution during the E.M.F. measurement did not affect the accuracy of
the result, since the analysis was performed afterwards.The E.M.Fs. of chains 1. and 2. were obtained for each
acid, and the E.M.F. of the hydrogen electrodes, calculated by subtracting the observed value of the chain from that of the calomel electrode, is graphed against percentage composition by weight in Figure 3. The values for the hydrogen electrode obtained in this way include of course the unknown liquid junction potential between the acid solution and saturated potassium chloride solution. This potential is discussed later.
The liquid junction potential between N/10 potassium chloride and the saturated salt solution is negligible. The E.M.F. of a hydrogen electrode in dilute solution is given by the expression E **-*058 pH. Nernst's expression, based on the theories of dilute solutions, is not valid for the acid solutions used here- above about 10% concentration. The pH of the weaker solutions is therefore given by dividing the hydrogen electrode potential graphed by -58. Values for the potential of the hydrogen electrode, interpolated from the experimental graph at convenient concentrations, are given in Table 1. The relative position of the graphs agrees with the order of the ’strengths' of the acids used, sulphuric acid being the strongest, end therefore containing the highest concentration of hydrogen ions, gives the highest potential, while propionic acid being the weakest gives the lowest

24
potential.
The potentials obtained with sulphuric acid were steady and reproducible up to about 65% concentration. Above this point the two hydrogen electrodes ceased to register agreeing potentials, the last point graphed, (70%), representing
the mean value for the two electrodes which differed by 7 millivolts. This lack of agreement increased rapidly at higher concentrations, reaching about 100 millivolts at a concentration of 34%, and in addition the readings were erratic. On diluting the acid below 70%, however, the electrodes behaved normally, and once again gave points situated on a smooth curve, thus demonstrating that the erratic potentials were not caused by a permanent injury to the electrodes. Furthermore, with concentrations of sulphuric acid above approximately 85%, it is no longer possible to form a junction with saturated potassium chloride solution. At this concentration there is vigorous evolution of hydrogen chloride gas where the salt and acid solutions meet, and, as the tube E. (Figure lb) quickly fills with the gas, the contents of vessel D. are contaminated. ',Vith weaker solutions of the acid no such reaction was observed and a definite junction was readily obtained. The inability to form a junction does not, of course, limit the range for chain 2. in this way.
Phosphoric acid gave steady reproducible potentials over the range in concentration 0 to 100%. Longer time was required

25
for equilibrium to be established with this acid, owing to
its viscous nature which retarded the process of saturation with hydrogen.
The undiluted sample of formic acid, (93% by analysis), did not give a steady potential with the hydrogen electrode, the observed potential fluctuating over about 10 millivolts. Steady reproducible readings were obtained for the remaining concentrations.
The potential of the hydrogen electrodes in acetic acid solutions was steady and reproducible up to a concentration of 75%. Beyond this point the readings became slightly erratic, and the observed potential of the chain began to
rise rapidly, so that it appeared that the potential of the hydrogen electrode had started to fall. A few points above 30%- are graphed on the dotted portion of the curve to show this effect. The observed potential quickly rose to a value beyond the range of the potentiometer, which reads up to 1100 millivolts. It seemed very improbable that the potential of the hydrogen electrode could fall to such a low negative value as to cause this. While investigating this unexpected behaviour, it was discovered that totally different readings were obtained using another calomel cell and hydrogen electrode dipping into a beaker of the acid in..question. It appeared that the high resistance of the column of acid in tube C.Figure 1., was affecting the normal functioning of the valve

26potentiometer, or that an electrical leak was occurring.In support of this view it was noted that even if the acid
in vessel D. were diluted to below 30%, the observed potential could not be balanced until the diluted acid was introduced into tube C. also. It was also found that earthing the .grid
lead attached to the calomel electrode, when using a high resistance chain containing a glass electrode, caused the
galvanometer to indicate a reading beyond the range of the potentiometer system as before. With a normal low resistance circuit, however, earthing the grid lead had little or no effect on the recorded potential. With an abnormally high resistance, it would thus appear that the insulation of the chain v/as not sufficiently high to prevent a leak to earth, or alternatively, that the combined resistance of four stopcocks, and the acetic acid in tube C. and vessel D. reached a value at which the valve circuit ceases to function satisfactorily. These conclusions were supported by placing two platinum electrodes in beakers containing over 80% acetic acid, and connected by tube C. also containing this acid.With acid about 35% pure, the apparent potential between the two electrodes, one in each beaker, was consid.era.bly higher than that recorded when the electrodes were in the same beaker. With more concentrated acid, the former arrangement resulted in an observed potential too high to be balanced by the potentiometer battery, although with the electrodes in

27
the same beaker the potential was still low and measurable. ’.Then the acetic acid was diluted to less than 30%, the
potential was unchanged by altering the position of the electrodes in this way. It is apparent that the valve potentiometer registered the true potential for solutions of acetic acid up to concentrations of about 80%-, but that above this figure, the instrument failed to record true potential differences owing to the abnormally high resistance of the
column of acid in tube C. Unexpectedly high and erratic/S'
potentials have also been recorded by Hall and Conant with solutions of acids in glacial acetic acid as solvent. Without a detailed knowledge of the technique employed it is not possible to say whether or not the high resistance was responsible in their case as well.
Propionic acid behaved similarly to acetic acid. The resistance of both acetic and propionic acids at 80 - 90% is much greater than that of the other acids used, and at about 30% their resistance begins to rise quickly with increase in concentration. The resistance of a column of acetic acid in
tube C. was calculated from the dimensions of the tube and the specific resistance of the acid solution. The value
6 9obtained for 80% acid is about 2«3 x 10 ohms, and 4*6 x 10 ohms for 99-7% acid. The total resistance of the chain would be higher than these figures.
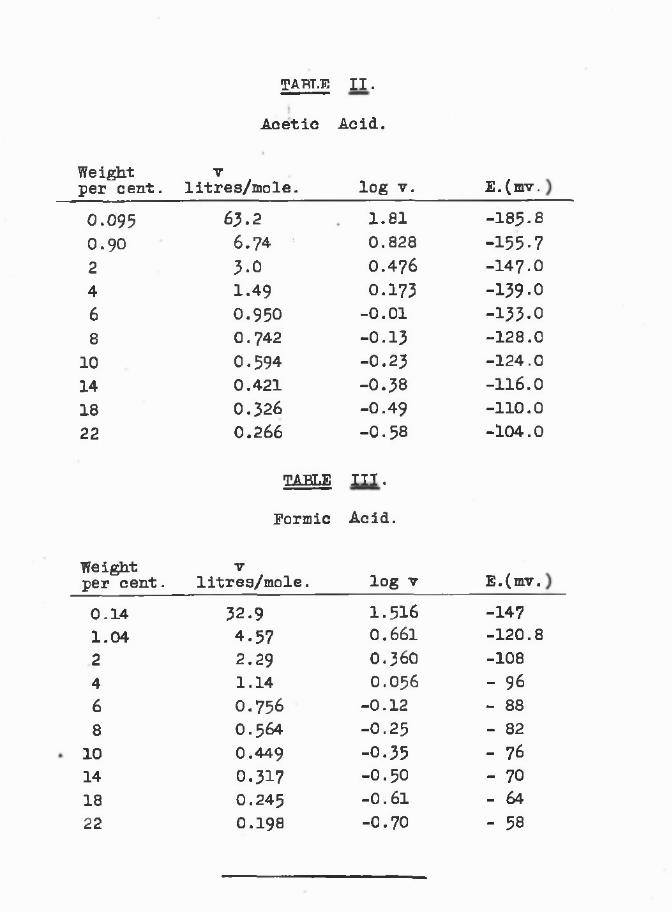
TART.E II.
Acetic Acid.
Weight per cent.
Vlitres/mole. log V. E.(mv.
0.095 63 .2 1.81 -185-8
0 .9 0 6.74 •• 0.828 -155.72 3.0 0.476 -147-04 1.49 0.173 -139-06 0.950 - 0.01 -133.08 0.742 -0.13 -128.0
10 0.594 -0.23 -124.014 0.421 -0 .3 8 -116 .0
18 0.326 -0.49 -110 .0
22 0 .26 6 -0 .5 8 -104.0
TABLE III.
Formic Acid.
Weight Vper cent. litres/mole. log V E .(mv.0.14 32.9 1.516 -1471.04 4.57 0 .6 6 1 -120 .8
2 2.29 0 .3 6 0 -1084 1.14 O.O56 - 966 0.756 -0 .12 - 888 0.564 -0.25 - 82
10 0.449 -0.35 - 7614 0.317 -0.50 - 7018 0.245 -0 .6 1 - 6422 0.198 -0.70 - 58

TABLE IV.
Orthophosphoric Acid.
Weight per cent.
Vlitres/mole log V. E .(mv.)
0 .13 75-4 1.876 -123.31 9.8 0.992 - 852 4.85 0.686 - 724 2.40 0.380 - 596 1.59 0.200 - 518 1.17 0.068 - 44
10 0.930 -0 .0 32 - 3814 0.650 -0.187 - 3018 0.495 -0.316 - 2222 0.396 -0.402 - 15
TABLE V.
Sulphuric Acid.
Weight Vper cent. litres/mole log V. E.(mv.)
0.17 57.7 1.761 - 911.07 9-13 O.96O - 522 4.86 0.686 - 394 2.39 0.378 - 226 1.58 0.198 - 118 1.16 0.063 - 2
10 0 .921 -0.036 + 514 0.64 -0.194 + 1418 0.485 -0.314 + 2222 0.386 -0.413 + 27

28
All concentrations of acetic and propionic acid are less dense than saturated potassium chloride solution. The
remaining acids used become denser than the saturated salt
solution with increasing concentration, and require the use
of the modified bridge shown in Figure lb. at the following approximate concentrations, sulphuric acid at 23%, formic acid at 69% and orthophosphoric acid at 28%.
A simple relationship was found to exist, at the lower concentrations of the acids used, between the potential of
!bthe hydrogen electrode and the concentration. "ATalpole carried out a very careful examination of the potential of the hydrogen electrode in acetic acid solutions varying in concentration from i;/4 to L/1000. He found that a graph of log v. against potential gave a straight line, the equation being of the
typeL o ^ ' V . - A . _ £
S. - B.where A. JB. and C. are constants, S. is the potential of the hydrogen electrode, and v is the dilution in litres per mole. The values for log v. and S. at the lower concentrations for the acids used in the present work are tabulated in Tables.11. 111. IV. and V., and graphed in Figure 4. It will be seen that the graph for acetic acid is a perfectly straight line up to a concentration of M/1 which represents an extension
1 to the range tested by 7/alpole.- The potential then becomes

-u
-m
-nu
-OS 0-7
Fig. 4E.M.F. ef the hydrogen electrode against log v.
;V••■fiip.%

29too large for this relationship to hold and a curve results.The shape of the graphs for the other acids is similar, astraight line resulting at the lower concentrations. It isnot difficult to find an explanation of this result for a
weak acid. We have Ka=[H']v/( 1 - Hy) =[H]v neglecting [h]vcompared with unity, so that v=Ka/[H] and log v = Kj- 2.1og[H].Now the 3.L.F. of the hydrogen electrode is given by*053 log[H^
and so it follows that log v=Kq+Kg3 where K- and Kg are
constants. Hence log v graphed against E. should give aa
straight line so long as K =[H'J .v holds. The reason why3.
sulphuric acid also gives a straight line up to a concentration of 1.1/4 is not, however, provided by the above explanation. The E.Ivl.F. results for the two highest values of v for each acid are actual experimental figures. The remainder were taken from the experimental graph for chain 1. at chosen values of v.
Licuid .junction potential.- The magnitude of the liquid junction potential of cells of the type illustrated in chain
1. is always an uncertain factor. In very dilute solutions of electrolytes it is probable that the use of a saturated salt bridge almost completely eliminates the junction potential, but with moderately concentrated solutions, especially acid solutions, this is certainly not true. The .success of a salt bridge depends on the concentration of the other solution being small compared with that of the bridge solution, and

30
on the mobilities of the anion and cation of the. bridge solution being almost equal. Concentrated acid, solutions may be expected to give an especially large junction potential, due to the high mobility of the proton compared with that of
the anion of the acid. It is hardly to be expected that the Bjerrum method of estimating liquid junction potential could
be used here. This method assumes that 3-5K KC1 eliminates
twice as much of the junction potential as does 1*75F KC1.In a trial of this method with 60% acetic acid, it was found that the two concentrations of salt solution gave a difference of only 3 millivolts, showing that the salt bridge eliminated very little of the junction potential as expected. Hall and
is-Conant have estimated junction potentials as high as 150millivolts for solutions of various acids in glacial acetic
nacid, but this is considered unreasonably high by Hammett.
However, in the case of sulphuric acid it is possible toestimate the value of this potential, by comparison of theresults for chain 1. with results for a similar cell contain-
/*ing no liquid junction. Randall and Cushman have measured the E.Iu.F. of the cell K2J SO^HggSO^ Hg, in concentrations of sulphuric acid ranging from 0*5 to 53%. By a simple calculation it was possible to obtain values proportional to the potential of the hydrogen electrode from their figures.

200
/OO
GO20P ercentage compos/Zion ofPP5Q
Measurement of Liquid Junction Potential between Sulphuric acid and saturated Potassium Chloride
solution.Curve 1— E.M.F. with no liquid junction potential
(Randall and Cushman).Curve 2— E.M.F. including liquid junction potential.

TABLE VI.
Junction Potential between Saturated Potassium Chloride and Sulphuric Acid Solutions.
Percentage acid. Junction Potential.
58 90 milli-volts.

31
These values are graphed in Figure 5. along with the values obtained from chain 1. (as in Figure 3.) The graph constructed from Randall and Cushman’s results is made to coincide with the writer’s graph at 2% acid, since it is reasonable to suppose that at this low concentration (about 0 4 N ) , the junction potential of chain 1. would be negligible. This view is confirmed by the fact that the graphs coincide at lower
concentrations. A little above the 2% point the graphs commence to diverge due to the liquid, junction potential of chain 1. acting in the opposite direction to the potential of the hydrogen electrode. A selection of values for the junction potential obtained from this graph are tabulated in Table VI. Of the five acids examined sulphuric is the ’strongest', end so likely to give the highest value for liquid junction potentials.Behaviour of the Glass Electrode.- As explained at the beginning of this section, the E.M.F. of chain 2. remains constant providing the glass electrode functions as a reversible hydrogen electrode. In the concentrated acid
solutions used, the E.M.F. of this chain was very irregular for the different concentrations (Table Vll). No definite
order was maintained in the sequence of concentrations used. This random choice emphasizes the unreliability of the glass electrode in such solutions. A few factors likely to cause erratic potentials in concentrated acid solutions may be

32mentioned. These solutions may have a dehydrating action on the glass membrane, and are certain to dissolve alkali
from the glass, and so cause permanent changes in asymmetry
potential. Apart from permanent change in the asymmetry
potential of the glass electrode due to the action of concentrated acids, there is a reason, peculiar to the glass electrode, why it should deviate from the hydrogen electrode in any concentrated solution. It is believed that the 1oxonium ion1, and not the free proton passes through the glass electrode membrane. Hence if there is an appreciable difference in the concentration of the water in the solutions on either side of the membrane, there will be a change in free energy of the water as it passes, with a resultant potential differenceaccompanying that due to the difference in hydrogen ion
/?activity, bole has shown that the departure of the glass electrode from normal behaviour in solutions containing alcohol and high concentrations of salts can be ascribed to this effect. The hydrogen electrode which depends on quite a different mechanism for its potential, viz. the reaction between hydrogen atoms and ions, is not affected by a lowering of the activity of the water. The length of time the glass electrode is immersed in concentrated acid solutions will obviously be a factor determining its behaviour. As Table Vll. shows, the more concentrated acid solutions, especially sulphuric and phosphoric acids, cause a change which remains when the electrode is immersed in dilute solutions again. Kaclnnes

Potential
of the
Glass-hydrogen
Electrode
Combination
Chain
2.tt=
E.M.F. in
mill
i-vo
lts.
CM
W£0>Q>(0
sc*-co
srHOro0)■£iH3d•H
o
d13»>
poi2S
•rl ■
O•HP
IPi (QQ Cl CD O•aPO
>d•H
o
pQ)PM
i r \ tfN UN
8 8 * ! CO Pi
TJ 1=o<5o•Hdo•HPiOio
pCDPi
■d l•H P o <}O +3
•h d+5 II)a) o
i j P
•d•Ho< Io
pQ>Pi
nO fr -U N id - 0 \0 \ f - » v 0 I f t l T l i f i fCM CM CM I fM i- 5*-\O'OM)vO'O'0'0'O'O'Ov0'O
i—I ONO NrH U N U N O -O N ^ rH rH
O OnnO t > - i r \ 0 cm 't v O ( M H O O ON CO Cv-nO ‘O 'N l- CM rH rH H
UN UN UNn$-• • • I
KNCM K N O CM O -C O C " - 0 UNUN nO nO nO N r H - C -nO UNvO vO nO nO nO nO nO N N U Y O
M - O H O UNnO O nJ-sO On CM • • « • • • • • • • •CO O N H O M - KN U N O nOO o o rH O N O UNM - cm C -C ^
UNUN UNrH O ON CM O n O n o n UNnO nO UN nO U V O C -nO nO nO t - C '- C '- O - nO vO nO vO vO nO vO nO NO nO vO
O-ONONNNONCO UN UN CO rH rH • • • • • • • • • • •
KNCn-U N O f 'N 't M -nO nJ- rH O O n CO CO (X) O -nO M- KNCM
LfNCO U N O O O 00 O UNM" CM U N U \U N O U N O • « • • • • • • • • # • • • • • •N t MNKNCX) 0 - 0 O n O K \C 0 CO CM K \ nO O -nO O n ON ON CO CO CO C'-CO COCOCOCOCOCOCOCOCOCOnO nO nO nO nO nO nO nO nO nO nO nO nO nO nO nO nO nO
ONrH ON CM O n O n O nJ- NNnJ- O n CM O n O n J - kn n J- UNKN • • • • • • • • • • • • • • • • * •
O O U N O U N O -C ^M W O rH 00 H CO NO KNCO O CM ON 00 O -nO n*- K N H ON CO CO CO CO CO
H - CM CM CM CO rH rH 0 - 0 NO NO NO nO NO NO nO UN UN nO nO NO NO nO NO nO nO NO
U N r<N O N O CO rH UNn* CM • • • • * • • • •
CM O C '-U N C -C -riN O N H - C nO Nfr N N K N iH CO O -nO O n

33isand Belcher have shown that even in dilute acid solutions,
having a pli less than 1, the same potentials are not obtained on diluting as previously given when the concentrations were
being increased.Sulphuric acid gave the most variable results with
chain 2. as is to be expected. The values above 65% are not however a true indication of glass electrode behaviour, since the hydrogen electrodes did not then give reliable results. Any falling off in behaviour of either electrodes is of course included in chain 2.
The fairly constant E.M.F.s in Table Vll. for concentrated solutions of acetic and propionic acids, showed that both the
glass and hydrogen electrodes were behaving normally, and suggested at first that the sudden increase in observed potential, experienced above 30% with chain 1., represented an actual fall in E.M.F. of the hydrogen electrode. The explanation is of course that chain 2.. eliminates the high resistance of the column of acetic acid in tube C., while in addition, for this chain the grid lead of the valve circuit was attached to the highly insulated glass electrode (positive end of chain), instead of to the calomel electrode (which
was the positive end of chain 1.)It will be noted that while the glass electrode gives a
greater difference than 57 mv. per pH in alkaline solutions, the difference is .less than 57 mv. per pH in acid solutions.

34N o t e At the commencement of this research the writer had no previous experience of the glass electrode or pH technique in general. As considerable delay was caused, due to the erroneous impression that the difficulties encountered were due to inexperience in blowing glass electrodes, it is appropriate to give a brief account of these difficulties and their remedy. In a fairly wide study of glass electrode literature, the writer has never found information on the important practical details of most service to a recruit to the subject.
The electrode chain recommended and supplied by the makers of the valve potentiometer included two calomel electrodes, one 3• 5H, the other IT/10. The arm of the latter electrode was intended to dip into the inside solution of the glass electrode through a rubber stopper connection. The special glass for the preparation of the glass electrodes (supplied by Messrs. Dixon, London), was of 0*7 cm. bore, however, and so did not allow of a rubber stopper being inserted. Instead, the glass electrode arm which was only about 3 cm. long, owing; to the confined space of the earthed chamber enclosing the cells, was wedged against the arm of the calomel electrode by means of a small wooden strip.
Using this system it was found impossible to obtain results of any value with the glass electrode immersed in solutions of known pH value. The S.K.F. drifted continuously over a very wide range, and the values obtained with buffer/ solutions of pH 3-97 and 9-2 respectively, varied from 30 to 360 millivolts. In addition, opening the door of the cell chamber caused violent deflection of the galvanometer needle. Many dozens of electrodes were blown and tested at various intervals with no better results. The valve potentiometer was proved to be satisfactory with low resist once circuits. The calomel electrodes were also tested and found to give the theoretical A .I.F. with hydrogen electrodes. The glass electrodes were tested dipping into a solution of the same composition as that inside the bulb, and the E.M.F. of the chain found to be much steadier than before. The reading began at the correct value, obtained with the two calomel electrodes dipping into the solution with the glass electrode removed, and rose slowly. This behaviour with the same solution on both sides of the glass membrane gave the first clue that an electrical leak between the two sides of the electrode might be responsible for the trouble, a view that was supported by the fact that immersion of the electrode to different levels altered the reading considerably. This possibility was suggested in communications to Dr. McFarlane,

35the designer of the apparatus, but he was of the opinion that the trouble was caused by too thick glass membranes. a number of electrodes were next blown of such thinness that interference colours were visible, with no better results. Insulation of the batteries and calomel electrodes on wax blocks also effected no improvement, while the chain gave similar erratic potentials with a Harrison valve electrometer.
The writer still inclined to the view that an electrical leak might be responsible, a leak which would be favoured by the short electrode arm in direct contact with the arm of calomel electrode. Consequently the cell was modified to the type described in this section, using a long armed glass electrode, and substituting a quinhydrone electrode for the calomel electrode dipping inside. These electrodes immediately gave good results. That an electrical leak can cause results similar to thosedescribed was proved, by damping the long electrode arm with a moistened finger and then drying with a cloth. Actual potentials recorded in a test were -230 mv. with dry electrode arm, damp arm about 0 to -10 mv. erratic, dry -220, damp +83, dry -210. These figures show how necessary it is to prevent a film of moisture collecting on the electrode arm. The most satisfactory method was found to be thorough drying, followed by application of a coat of varnish consisting of shellac dissolved in absolute alcohol. This gives a hard surface of high electrical resistance, and with its use the daily variation in the potential of an electrode over a period of months is only a few millivolts at a fixed pH value, due to change in asymmetry potential.
Considering that the resistance of an electrode is of the order of 20 megohms, it is easily understood that precautions against surface leakage are necessary. The fitting of the short small diameter electrode arm to the arm of a calomel electrode could not fail but leave a damp surface, both inside and outside the glass electrode arm. The writer found it convenient to mount a number of electrodes in rubber stoppers, with the arm above the stopper shellaced ready for use, since a slow change in potential took place for several hours after this treatment. The most probable reason for erratic and drifting potentials with the glass electrode were found to be due to (1) the type of electricalleak described, (2) a too high resistance - an air bubble inthe cell chain will cause this, (3) damp inside the valve potentiometer cabinet, (4) failing batteries - potential too low, or high internal resistance, (5) bad contacts in thegrid circuit giving a variable grid bias.

SECTION II.
In this section the measurement of salt hydrolysis is discussed, and a number of ’hydrolysis constants’ calculated from pH measurements with the glass electrode. The subject of hydrolysis is dealt with at some length in most physical chemistry text-books, but there is a surprising lack of experimental evidence that can be quoted in support of the theory. Reference books when referring to hydrolysis, generally confine themselves to vague statements about the reaction of the salt being acid or alkaline, and in cases where experimental figures are quoted, the ’degree of hydrolysis’ is stated for one or two concentrations only, and the value for the ’hydrolysis constant’ is not calculated. Comparison of the results of different workers shows that large experimental errors exist in the methods used.
In seeking an explanation for the paucity of data, apart from the experimental difficulties, it is necessary to consider the theoretical basis underlying the conception of a hydrolysis constant. A number of reasons why the simple mass action law cannot be expected to be exactly obeyed are given below.

1. The law of mass action is founded on purely mechanical conceptions, and ignores the attractions and repulsions of electric charges.
2. The dissolved salt, "being a strong electrolyte, cannot be expected to obey the law of mass action, and in addition, its presence will affect the ’degree of dissociation’ of the other electrolytes present.
3 . The assumption that salts in general are completely ionized in solution is not true.
4. To apply the mass action law it is necessary to know the units present in solution. Degree of association, formation of complexes, and the different reactions that may occur with multi basic or acidic salts, are all unknown factors confusing the result.The theory of activities has been evolved to make
experimental results obey the established formulae, and it is now realised that activities, rather than stoichiometric concentrations are the ’active masses’ of G-uldberg and Waage. In very few cases however do data on the activities of salts exist which could be applied to the calculation of a hydrolysis constant. In the present work, an attempt has been made to obtain accurate pH values for a number ofsalt solutions varying in concentration over a wide range. Where possible the values for the hydrolysis constant have been evaluated using the simple formula. The results obtained

38
indicate that the glass electrode is eminently suitable for the measurement of pH in pure salt solutions. This electrode was also used to measure the pH value of pure water.
MEASUREMENT OF SALT HYDBQLYSIS BY MEANS OF THE GLASS ELECTRODE.
The great majority of salts react with water, owing to the presence of hydrogen and hydroxyl ions generated by the dissociation
H20 H* + OH"
Salts in general are almost completely ionized in aqueous solution, and reaction with water, or hydrolysis, is caused by combination of their ions with the oppositely charged ions from the water, according to the requirements of the appropriate mass action law. The extent of this reaction, which represents reversed neutralization, depends on the degree of dissociation of the acid HA and the base BOH, which may be formed by the salt BA in the general reaction
BA + H20 ^ BOH + HA.
Hydrolysis, which would of course not occur if water were completely undissociated, is usually accompanied by a change in pH value. If the base is ionized to a greater extent than the acid the solution reacts alkaline, owing to the removal of more hydrogen ions than hydroxyl ions from the

39
water, and the subsequent farther dissociation of water to maintain the ionic product. Conversely, an acid reaction is obtained, when there is a preponderance of hydrogen ions due to the base being less ionized or 'weaker' than the acid. If the acid and base are of equal strength, i.e. ionized to the same extent, the corresponding salt solution reacts neutral. If they are completely ionized hydrolysis will not occur, whereas if they are 'weak electrolytes' hydrolysis will take place, the neutral reaction being due to the removal of equivalent quantities of hydrogen and hydroxyl ions, in the formation of equivalent quantities of undissociated acid and alkali.
The extent of hydrolysis varies greatly for different salts. A salt of a strong acid and strong alkali such as potassium chloride should theoretically undergo no hydrolysis, and so from this aspect at least, should give a neutral solution in pure water (see later). At the other end of the scale, salts of weak organic bases are almost completely hydrolysed. It is thus apparent that although the term hydrolysis is generally used in connection with salts formed from a weak acid, a weak base, or from both, in actual fact all salts hydrolyse when dissolved in water, with the possible exception of those formed from acids and bases which are completely ionized in dilute solution. The chlorides and nitrates of the alkali metals belong to the latter category. There are three classes of normal salts to be considered,

40
depending on whether one or both of the radicles are weak, and a brief account of the equilibria involved is detailed below.1. Salt of a strong; acid and a weak base. - Such a salt has an acid reaction, due to removal of hydroxyl ions by the cations of the salt according to the equilibrium
B + A + H - O H BOH+H'+A'.................. (1)Appreciable amounts of B and OH ions cannot co-exist since the dissociation constant 1^= [B ][orf] / [BOH] of the base is very small. As the concentration of B* ions from the salt is large, B’and OH ions will combine to give undissociated BOH, in order that the dissociation constant of the base shall be obeyed. It is seen that [BOH] = [li] , ignoring the minute and unknown concentration of hydrogen ions contributed by the water itself. The relationship expressed in equation (1) yields a constant according to the law of massaction. This hydrolysis constant may be written
v _ aBOH * ®H*% - ^
The concentration of BOH is very small, usually of the order of one hundredth that of the salt, so that the activity coefficient may be taken as approximately unity (the activity of an undissociated molecule is probably unaffected by interionic attractions), a - is measured experimentally by the electrode method, but the activity coefficient of the

41
salt ions B and A* are usually unknown. The hydrolysis constant can then be written
The assumptions made in deriving this expression are that aBOH = K* "that the strong acid HA, being present in only minute concentration, is completely dissociated, and that the concentration of the water is constant. The mean activity of the salt ions cannot be assumed to be unity as is done in textbooks, for recent work has shown that the variation is considerable at ordinary concentrations.
If one mole of salt is present in v litres of solution, and x gram ions of hydrogen are produced by hydrolysis, x is the degree of hydrolysis, i.e. the fraction of salt hydrolysed. The hydrolysis constant may be written
which gives an approximate relationship between degree of hydrolysis and dilution. If c is the molar concentration of the salt c = 1/v.
Measurement of hydrolysis consists in evaluation of x and Kg. The theoretical value of Kg, ignoring activity coefficients, can be calculated if the dissociation constant
^ O H • aH* _ *R'= - W * 5 F " - p p j :
where aH-= aBQH = , and [B] =
Since x is usually smalla

42
of the weak electrolyte formed by hydrolysis is known.The following three equilibria exist in the salt solution
= M M .....................1\ = [B'l [OH] ................. 2iBOHja% = [Bog Cal. . . . . . . . . . . . 3
From 2 and 3 Kg = [qb|[h 1 = ^w
The theoretical pH value of the solution may be calculated from this relationship.
Since x = JvKgfj.
and [H] = xc - / 5 ^ r
. *. pH = i P \ - i pK^ - i log c - £ log fB-.
It is seen that Kg and the reaction of the solution are independent of the nature of the strong constituent of the salt, and that pH increases (i.e. approaches 7) with dilution. The formulae connecting different equilibria necessarily ignore the varying activities, as compared with concentrations, in the various solutions used for measuring K^, K^, Kg etc.
The above expression for pH ignores the dissociation of the base BOH and the altered concentration of the saltdue to hydrolysis. The extent of the hydrolysis and the hydrogen ion concentration of the solution determine whether

43
it is permissible to ignore one or both of these factors.20Bjerrum distinguished, three classes of hydrolysis and used
the following equilibria in calculating [h ] (fg« assumed equal to one).
K* = [h] [oh] '........... 1
[h] = [boh] + [oh]............. 2
LUXiJtr _ L t J J L V X J - j -zb “ [BOH]................... ■>c = [b ] + ‘[boh]'................ 4
a. For very small hydrolysis when x<0.01 and [h ] < 10 we can neglect [b o h] in 4 so that c = [b] . Substitutingc in equation 2
[h] = feu®] + ** =f f77b. For medium hydrolysis when x<0.01 but [h *] >10[boh] in 4 and (o h] in 2 can be neglected, and the expression for [h ] is the usual one developed previously, viz.
V "H -/Kbc. For appreciable hydrolysis where x>0.01 and [ff] >10 [oh] in 2 is neglected ,----- =-=—
fril _ bl [qh] (c - IborIxIohI) / ^ ( c - [h'J )
lHJ = \ «b / %
By a similar treatment a more exact expression for [h] can beobtained than those given in B. and C. below for medium hydrolysis.

44
B. Salt of a strong base and weak acid. - Here the reaction is alkaline due to the equilibrium.
B’ + A' + H-OH * HA + B* + OH'x v _ aHA • a0H x‘OH - *ba. = v and kh - [A ] rA- - tl-x)vfA<
The theoretical value for Kg is obtained from K^, K& and Kgin a similar manner to the previous case
Kh = .H Ka
The pH value of the solution follows from this expression;
. • . [h ] =
and pH = jt + £pKa + £ log c + £ log fA'
It will be seen that pH decreases (i.e. approaches 7) with dilution.
C. Salt of a weak acid and a weak base. Salts of thistype may be acidic, alkaline or neutral in aqueous solution,depending on whether Ka is greater than, less than or equal to Kb. The hydrolysis equilibrium is
B* + A' + H-OH = BOH + HA.Whence
v _ ^ O H • *HA x* TH P H W a - = U - x M ju, Where °BOH = aHA “ v

45
It is seen by analogy with case A that
Since' v does not occur in the expression for Kg the degree of hydrolysis should be independent of dilution. Also from the dissociation constant of the acid it follows that
. . v ThaI \a[h] =h a ] K x/v r— -■7-3 = = M * *
Hence [H] = / - ■ and pH = £ pK^ + £ pK& - £ pK^
The pH is unaltered by change in concentration or activitycoefficient of the salt in this case.
The value of the hydrolysis constant obtained aboveassumes that aBQg * * 5 4 which is true in very dilute solutiononly if Kfi = Kfe.
Griffith has suggested a method of calculating thetheoretical pH exactly for this class of salt, but thecalculation is tedious and the departure from the constantpH value given by the approximate expression is negligible.For example for aniline acetate where K anA K axe widelya d-s -,odifferent, Kft = 1.8X10 , K^ = 4.6x10 , the modified calculation gives the pH at v = 50 as 4.66 and at v =5000 as 4.74. It is doubtful if this small change could be proved experimentally in such an unbuffered liquid as an M/5000

46
solution of a pure salt. At such small concentrations each ion of the salt is hydrolysed to a different extent, and so the definition of degree of hydrolysis must be modified to that of, 'The fraction of an ion converted into undissociatedacid or base'. For aniline acetate at v = 5000 Griffithcalculates that [BOH] = 2[b a ] , and the degree of hydrolysis of the aniline ion is 0.594* and of the acetate ion 0.498.At v = 50 the value for each ion is the same as that for xin the simple expression given above.
The effect of temperature change on Kg for the three classes of salt described in A, B and C is similar, since K a and K^ generally vary very little with temperature. From the expression connecting K^ and Kg it will be seen that Kg varies approximately as K,,- The pH of a salt solution decreases with rise in temperature.
D. Acid Salts: When the acid constituent is weak the hydrogenion concentration of the solution of an acid salt is hardly affected by change in salt concentration.
ZJUoyes gives the following analysis for the salt of a weak dibasic acid. The reactions involved are
BHA B* + HA'..................... (1)HA' H' + A" ..................... (2)
HA'+ H ^ H2A ..................... (3 )
From (2) and (3 )

47
- 68 + [ty]
and since [a ] = “fffi— and [ H ^ = M
it follows that [h] ■ / =?/ &iK2 if % is sma11 compared
with C, as for sodium bicarbonate (see later), where- 7
^ = 3 x 10
If the acid constituent is strong, the salt solution behaves similarly to a strong acid, as is shown in the experimental results, where the Rudolph! modification of Ostwald's dilution law is applied to solutions of sodium bisulphate. It is seen that the acid reaction of salts of this type is not due to hydrolysis in the ordinary sense of the term.
The equilibria described for the three types of normal salt in A, B and C were for univalent salts. A salt formed from multivalent weak electrolytes may hydrolyse in a number of stages, and if basic salts and complexes are formed the process is further complicated. The valency of the weak radicle indicates the number of possible stages of normal hydrolysis that may occur. Experimental results will show which stage predominates. Thus for a salt BA^ where B is weak, there are three stages
B" + 3H20 B(0H) 3 + 3H'B" + 2H20 B(0H) 2 + 2H‘B"' + H20 B(0H)*’ + H*

48
Having dealt with the types of reaction that occur when a salt is dissolved in water, a description of the practical methods of measuring hydrolysis will be given.The primary essential of such a measurement is that equilibrium must not be disturbed in the process, otherwise progressive hydrolysis will occur. Thus the free alkali in a solution of sodium carbonate cannot be found by a chemical method such as titration with an acid, since as the alkali is removed more is instantaneously produced in order to maintain hydrolytic equilibrium. Some salt solutions show abnormal hydrolysis due to the occurrence of a secondary reaction which disturbs the equilibrium. Thus ferric chloride gives a very acid reaction because colloidal ferric hydroxide is formed before hydrolytic equilibrium is attained, and as the hydroxide is removed from the solution more is automatically generated.
The degree of hydrolysis is increased in a similar way if one of the products of hydrolysis is volatilized off, as for example occurs on heating solutions of salts of acetic acid or ammonia. Conversely addition of one of the products of hydrolysis will of course repress the reaction.
The measurement of hydrolysis: The most important methodsof measuring hydrolysis are summarised below.
49
Conductivity; In this method the increase in conductivity due to hydrolysis is used to calculate the degree of hydrolysis. The method is accurate only when hydrolysis is considerable.
Catalysis: Hydrogen and hydroxyl ions ’catalyse’ certain reactions, and unlike true catalysis the effect is proportional to the concentration of the ’catalysing’ ion. The method is thus actually a rather crude determination of hydrogen or hydroxyl ion concentrations and has two disadvantages. Hydrogen and hydroxyl ions are not alone in their catalytic effect, since the salt molecules are also known to ’catalyse' certain reactions. In addition the saponification of an ester, which is the reaction used, produces free acid or alkali itself.
Distribution: If a solvent immiscible with water can befound which dissolves the weak constituent of a salt solution, but which will not dissolve the salt or the strong product of hydrolysis, the total concentration of the weak constituent, present in a solution of the solvent and water in contact, can be found from the distribution ratio and analysis of the solvent layer. The method is obviously of limited application.

50
Osmotic Pressure: Hydrolysis gives rise to an increasein the number of particles present in solution, and a measure of this increase can be found by the depression of the freezing point or elevation of the boiling point of a suitable solvent. The method can only be used when hydrolysis is considerable, and has certain theoretical objections.
The pH Method; The hydrogen ion activity of a saltsolution is measured directly by means of indicators or anelectrode. The method, with careful technique, is muchmore accurate than the others described, especially whenthe hydrolysis is very small, and in addition is ofuniversal application whereas the number of salts to whichany of the other methods could be applied is very limited.The electrode method of measuring pH value, especially inpoorly buffered salt solutions, is the most accurate one.The use of indicators requires great care in the preparationof pure dyes, and the technique required for accurate workin poorly buffered solutions is involved, since the pH ofthe indicator has to be the same as that of the salt
absolution. In addition the salt molecules themselves affectthe colour of indicators, and tend to shift the pH recordednearer to 7# while they naturally cannot be used withaccuracy in coloured solutions.

51
Before considering the measurement of the pH of salt solutions by means of electrodes, it is appropriate to discuss the question of buffer action with relation to salt solutions.
Buffer action and salt solutions: A solution possessingthe capacity to resist changes in pH is said to be buffered. A picture of the buffering power of a salt solution can be obtained by drawing the neutralization curve of the constituent acid and base. These graphs are given in most text-books on physical chemistry and need not be reproduced here. For a salt of a 3trong acid and a strong base, e.g. potassium chloride, the change in hydrogen ion activity at the equivalence point is enormous, the pH changing from 11 to 3 for the addition of hydrochloric acid to caustic potash (deci-normal solutions). Such a salt may then be said to be completely unbuffered, since the addition of an incalculably small amount of acid or base to the pure salt solution causes a change in reaction. For a salt containing a weak constituent the change in pH at the equivalence point is much less but still considerable. The addition of deci- normal caustic soda to decinormal acetic acid gives a change from pH 7 to pH 11 at the equivalence point. Further addition of caustic soda gives a curve almost identical with that for the neutralisation of a strong acid. Addition of a

52
strong acid to pure sodium acetate, however, only results in the formation of almost undissociated acetic acid, and as thd neutralization curve for sodium acetate shows, the change in pH diminishes rapidly. It is for this reason that the neutralization curve for a salt containing a weak constituent shows very closely what happens on the addition of a strong acid or base. If both constituents of the salt are weak inflexion at the equivalence point is smaller and less steep, so that a trace of acid or alkali will cause a pH change of 1 or so only.
It is obvious that salts solutions in general are very poorly buffered. The exceptionato this rule are salts of double sided weakness, and even in this case a trace of acid or alkaline impurity will cause quite an appreciable change in pH. Pure water itself, like a salt of double sided strength, is completely unbuffered, since added hydrogen or hydroxyl ions remain unaffected, and the pH depends only on the amount added and the volume of the water. The neutralization curve for a salt like potassium chloride coincides almost exactly with a curve showing the relationship between pH and [h]
The foregoing shows how essential it is to avoid the presence of acid or basic impurities when measuring the reaction of a pure salt solution. The buffering action of a solution may be regarded as due to a reserve supply

53
of neutralizing agent, but there is a further consideration, depending on the pH of the salt solution, when deciding what amounts of impurities can be ignored. Solutions having a pH value near to 7 are most susceptible to pH change from mathematical considerations alone. If 10 * gm. of hydrogen ion are added to a solution of pH 7 in which buffer action is assumed absent, the reaction will change to about 6.If 10 ^gm. of hydrogen ion are added to a solution of pH 10 orgreater however, most of the added hydrogen will be removed by combination with the hydroxyl ions present; and the removal of 10 gram ions of hydroxyl, from a solution
—•tf-containing 10 gram ions, will cause little change in the reaction. Again if this amount of alkali is added the pH of the solution would be hardly affected, since the addition of 10 gram ions of hydroxyl ion would be negligible compared with the amount present already. Analogous reasoning shows that such small amounts of hydrogen or hydroxyl ions are unimportant in solutions having a reaction of 4 or lower
As is described later, the chief impurity affecting the accuracy of pH measurements in salt solutions is carbon dioxide from the atmosphere. Pure water when exposed to the atmosphere dissolves carbon dioxide to give a reaction of about 5-7. From the above discussion it is clear that the pH of a salt solution having a reaction of more than two pH units away from 7» will not be seriously affected by dissolved carbon dioxide. (This was readily confirmed by

54
blowing on to a solution of potassium dichromate having a pH of }.Q. The potential of the glass electrode was unaffected, whereas treating a solution of ammonium nitrate of pH 5*5 i*1 this way caused a rapid increase in acidity, represented by a change in potential of the glass electrode of 28 millivolts). It is necessary to state, however, that although a trace of carbon dioxide does not appreciably alter the pH of alkaline solutions, such as one of potassium cyanide, it is obvious that suah solutions, if permitted, will dissolve large amounts of this gas which would of course alter the reaction. It is therefore necessary to expose such solutions to the atmosphere for as, short a time as possible during preparation and measurement of their pH.The procedure described later was adopted with this object.
The electrode measurement of pH in salt solutions: The glasselectrode has many advantages for use in the study of salt hydrolysis, as will be seen from the following description of the three electrodes commonly used in the determination of pH. Although the glass electrode was used in the salt solutions, a measurement involved the indirect use of the hydrogen and quinhydrone electrodes.
Part of the discussion on the hydrogen and quinhydrone electrodes has been gathered from general reading part from personal experience. The comments on the glass electrode are original unless otherwise stated.

55
The hydrogen electrode: This electrode is of rather limited application, tut provides the ultimate standard of pH values to which all other methods are referred. It is not suitable for hydrolysis work, but was used in the present work to calibrate the glass electrode. It cannot be used in solutions containing the following:-1. Reducible anions, e.g. NO^.2. Cations capable of reduction to a lower valency, e.g. Fe.
This limitation is probably more general than would first appear, as some workers have claimed that ions such as Zn, Cdand Pb" are reduced at the platinized surface.
3. Cations more electro-positive than hydrogen.Note: There is considerable lack of unanimity as to which end of the electro-chemical series of elements is to be called the electro-positive one. The classical view, probably influenced by electrolysis, regards the strongly metallic elements as electro-positive, and the non- metallic ones as electro-negative. However the standard electrode potentials of the alkali metals are negative, and of the ’noble' metals and non-metallic elements positive; so that in work dealing with electrode potentials it is preferable to consider the noble metals as electropositive, and the alkali metals as electro-negative.It may be pointed out that the hydrogen electrode cannot be used indiscriminately in all concentrations of solutions containing ions slightly electro negative to hydrogen in the electro-chemical series of elements. This series is compiled for solutions of normal concentration, and the order of electrode potentials of adjacent members may be reversed if equivalent quantities are not present in solution. Thus although lead is negative to hydrogen in the series, it can be made positive to it if the concentration of lead ions is increased, or that of the hydrogen ions decreased,sufficiently. The pH of solutions of lead, tin and nickel salts in dilute solution is about

56
4 - 5 ' A simple calculation reveals the concentration of these ions that can he present before deposition on the hydrogen electrode occurs.Let the concentration of lead ions (in gm. ions) « x.The standard electrode potential of lead s - 0.12v at 25°C. Equating the potentials of the lead and hydrogen electrodes we have
- 0 .1 2 + log x m 0>058 log lO' 4
whence i B 1 .1 5 x 1 0 * and if the concentration of lead ions exceeds this value, the lead electrode becomes positive to the hydrogen electrode and lead deposits.The values for the other adjacent elements are Tin x m 4.1 x 10" , Nickel x ■ 6 .8 x 10"' and Cobalt x ■ 6 8. If the solution is of pH5 the corresponding values of x are obtained by dividing these values by 100.
4. Colloidal material, ammonium salts, and many substancesthat poison the electrode, e.g. As2 0^ H2S etc.
To the above general limitations of the hydrogen electrode, must be added, when dealing with poorly buffered solutions, the disturbing effect of bubbling a gas through the solution, (which often contains a volatile substance produced by hydrolysis, e.g. HC1 or NH40H), and thedisadvantage of introducing a large platinum black surface.
*4Beans and Hammett have shown that it is very difficult to free this surface from adsorbed acid which is slowly evolved in solution. In addition the hydrogen electrode is very readily poisoned in unbuffered solutions, and well tested electrodes give widely different results. Kolthoff and
3.CKameda state that platinized platinum adsorbs the cation of a salt solution, and so causes an increase in acidity if

57
the solution is poorly buffered.
The Quinhydrone Electrode: This electrode, which consists of an inert metal such as gold or platinum in a saturated solution of quinhydrone, was used inside the glass electrode, as it gives a steady potential depending on the pH of the inner solution; - without the addition of quin- hydrone the potential would be indefinite and erratic. It is less readily incapacitated than the hydrogen electrode, and can be used in the presence of many reducible substances such as nitrates, and cations such as copper, with alkaloids and unsaturated acids, and with all but the most electro positive metals mercury, silver and gold. In addition it is not readily poisoned. It has however other limitations as follows:-1. The pH limits for which it functions as a hydrogen
electrode are narrow, and it fails completely above pH 8 .
2. It is affected by the presence of proteins and •neutral salts’.
3. It cannot be used with ammonium salts or in solutions which upset the ratio quinhydrone to hydroquinone.When dealing with poorly buffered solutions
it is of course undesirable to add a foreign substance like quinhydrone with its potential source of hydrogen ions, (the dissociation
58
of hydroquinone becomes appreciable at pH6 ).
The Glass Electrode: This electrode suffers from none of the disadvantages mentioned in connection with the previous two electrodes, and is particularly suitable for use in poorly buffered solutions since no foreign substance or surface capable of adsorption is involved. In addition it is easily washed and quickly attains its equilibrium potential. As will be shown the glass electrode is free from ’salt error’ i.e. it continues to function as a reversible hydrogen electrode in the presence of appreciable quantities of salts. This is of course an essential property for an electrode to be used for the measurement of salt hydrolysis. While it is recognized that the glass electrode behaves essentially as a hydrogen electrode from pH 1 to 9, as was tested in Section I by titrating an acid with an alkali, no data appeared to exist on the effect of adding appreciable quantities of salts to a solution held within these pH limits.
It is supposed that the reason for the failure of the glass electrode to behave as a hydrogen electrode in alkaline solutions, where the hydrogen ion concentration is very small, is due to its functioning partly as an electrode composed of the cation of the alkali e.g. as a sodium or barium electrode. At pH values within the working range of the electrode the hydrogen ion concentration is very much greater, and the glass electrode is assumed to answer to

59
change in hydrogen ion concentration only, but for the present work it was necessary to be certain that this was true in the presence of appreciable quantities of salts. Experiment showed that eight salts in molar concentration have no effect on the behaviour of the glass electrode, so that it is permissible to assume that the electrodes used were unaffected by any ’neutral salt effect’.
Apparatus: The general apparatus has been fully described in Section I. Several modifications were necessary for different classes of hydrolysis work, and will be described in the appropriate place. The two following alterations, however, apply to all the hydrolytic experiments. The gold wire and terminal making contact with the solution inside the glass electrode were replaced by a platinum wire and mercury contact. An 8 cm. length of fine platinum wire was sealed into a short length of small diameter glass tubing, which would fit into the top of the glass electrode arm. The cup was filled with mercury and kept in place by a sleeve of rubber tubing, an air-tight joint being made with the aid of paraffin wax. The amalgamated tip of the ’grid lead’ of the potentiometer dipped into the cup. This type of contact was a great improvement over the previous terminal connection, as the act of touching the latter generated a potential which persisted for a minute or so. The mercury contact eliminated this trouble completely, and also errors due to bad contacts

60
which were experienced occasionally with the terminal connection. The second modification was to replace the U/5 HC1 solution inside the glass electrode hy an acetate "buffer of pH 3.97. Three glass electrodes were used in this section.
Recrystallization of salts: The purification of salts for the purpose of hydrolysis determination presents certain novel features. As has "been indicated in the discussion on the "buffering action of salts, the primary consideration is to use a salt free from traces of acid or alkali impurity, the presence of small amounts o:f other salts "being of much less importance. The necessity for guarding against acidic or basic impurities can be gathered from the fact that the hydrogen or hydroxyl ion concentration resulting from hydro- lysis may be of the order of 10 gram ions, and so such impurities present to this slight extent would vitiate the measurement of hydrogen ion concentration.
Many inorganic salts in water give rise to sparingly soluble hydroxides which may even be precipitated as is the case with ferric salts, while others e.g. copper sulphate deposit basic salts on heating. In such cases it is obvious that the pure normal salts will not be obtained by crystallization from water. If the solutions were filtered before crystallizing the solution would be too acid. Precipitation of basic substances can be prevented by crystallizing from

61
acid solution, but this raises the problem of freeing the crystals from acid mother liquor since washing with water would cause hydrolysis on the surface of the crystals. As anexample of the uncertainty introduced in this connexion the
zb.results of Kolthoff and Kameda, who studied the hydrolysis of zinc sulphate, may be mentioned. They recrystallized their sample a number of times by cooling a concentrated solution from 70°C.apparently without preliminary filtering, and obtained more alkaline pH values than previous workers, due they claim to their superior method of recrystallizing. Their results in turn have been criticised by Britton and
Z7.Robinson, on the grounds that crystallizing at this temperature leaves a basic residue mixed with the crystals. The subject of recrystallization was also raised in a discussionfollowing a paper read to the Faraday Society on the pH
2 8
value of N/10 copper sulphate, and it was suggested that it might be advisable to crystallize the salt from solutions of varying acidity, and then to determine the reaction of solutions prepared from each sample. Only if a number of specimens gave the same results could the purification be assumed satisfactory. In the writers opinion even such a result would not guarantee purity, since a constant amount of acid might be occluded each time. If, however, the hot concentrated solution of salt is always filtered before crystallizing, any basic precipitate would be removed. The problem is then

62
reduced to one of ridding the resultant crystals of the too acid mother liquor. This could "be done "by thorough draining, followed by washing with purified ethyl alcohol, which in turn could be removed with dry ether.
The procedure adopted with such salts in the present work was to drive back the hydrolysis, by addition of about one hundred times the amount of acid normally produced by hydrolysis. Thus if a salt solution gave a reaction of 5 it was customary to make the solution about N/1000 with respect to the acid formed, before crystallizing. The saturated solution was then filtered through a Buchner funnel and the solution gradually cooled with shaking. In order to avoid contamination by dust during draining, the following apparatus was employed. The edges of a 6 cm. filter funnel and a Buchner funnel were ground, so that a gas tight fit was made on fitting the inverted filterfunnel over the Buchner funnel. A bent tube filled withcotton wool and attached to a soda lime tube was fitted tothe neck of the inverted filter funnel. The need for sucha device was evinced by the rapid darkening of the cotton wool plugs through which the air passed, an air tight joint between the ground rims of the two funnels being maintained by the fall in pressure produced by the filter pump. The crystals after thorough draining on the Buchner funnel were washed with alcohol, and ether which had been distilled over sodium. The thoroughly dried crystals were then transferred

63
to a desiccator, containing some of the partly effloresced salt, for a week or so in order to ensure that they contained the correct amount of water of hydration. Anhydrous crystals were allowed to stand over a drying agent. In this way traces of acid mother liquor were removed from the crystals, while the practice of always filtering before crystallizing a solution obviated any chance of a solid basic residue being left.
Preparation of solutions: The reagents used were of ’Analar’ quality; the above method is implied when reference is made to a salt having been recrystallized. The solutions were prepared with conductivity water from a Bousfield still.The conductivity of the water was measured at intervals and varied from 0.9 to-1.5x10 r.o. The water which was stored in a three litre Pyrex storage flask fitted with a siphon tube, tap, and soda lime tube, (all joints of ground glass), was collected either the day before, or on the same day that the solutions were prepared and their pH measured. The highest concentration of a salt solution used, generally M/10, was prepared by weighing the salt; the remaining concentrations were prepared by diluting the decimolar sample. All solutions were prepared in the cold, and the following procedure was used to minimise the time they were exposed to the atmosphere. Conductivity water was siphoned on to a

64
weighed amount of salt on a watch glass which was held over a large filter funnel inserted in the neck of a standard flask. In this way the salt was introduced directly into the standard flask and there dissolved.
All the apparatus coming in contact with the salt solutions, with the exception of the glass electrodes, was thoroughly cleaned at intervals with (a) caustic soda solution, (b) sulphuric acid-potassium dichromate mixture,(c) running water, and then finally steamed for several hours. Before a measurement the apparatus was inverted over a fountain of running water, and washed several times with conductivity water and then the solution itself. The glass vessels were frequently steamed out during the course of the work, using a three litre glass flask for generating the steam and a trap to prevent entrained water from being carried over.
The lid of the electrode chamber, during a measurement, carried three glass electrodes, the bridge C, considerably shortened from that shown in Fig. I section I, an inlet tube for hydrogen and a mercury trap outlet. The unoccupied holes in the lid were closed with rubber stoppers and the whole underside of the lid coated Vith pure paraffin wax as previously. The salt solution was introduced into the chamber, the lid immediately fitted, and a slow stream of hydrogen passed over the surface of the solution for a few minutes to expel the air. The potential of the three glass electrodes was then recorded.

65
Calibration of the Glass Electrodes: For accurate work it is necessary to calibrate glass electrodes before or after use. The usual method of doing this is to measure their potential in two buffer solutions of known pH. This requires the frequent preparation of buffer solutions using pure reagents, and errors may occur at several stages of the process. In any case it is advisable to verify the expected pH of the buffer by measurement with the hydrogen electrode. Because of these disadvantages the writer adopted the following method of direct calibration against the hydrogen electrode.
After completing a set of measurements the apparatus was washed and two hydrogen electrodes fitted to the lid. A number of concentrated stock solutions of buffer reagents were kept e.g. boric acid, citric acid, borax, sodium dihydrogen phosphate. A suitable combination of two or more of these stock solutions was chosen so that after dilution a well buffered solution would result at the pH desired.The relative proportion of the stock solutions employed was adjusted until the potential of the glass-calomel electrode chain, with this solution in the electrode chamber, was just beyond one end of the range in potential recorded in the measurements with a set of salt solutions. Hydrogen was then passed, and when the hydrogen electrodes had attained their equilibrium potentials the potentials of the five electrodes, joined in turn to the calomel electrode, were

66
recorded and checked. The pH of the buffer solution in the chamber was then adjusted so that the potential of the glass- calomel electrode chain was just beyond the other end of the range covered by the salt solutions, and the equilibrium potentials again recorded. The pH of the two buffer solutions was calculated from the potential of the hydrogen- calomel electrode chain and the temperature inside the metal lined box containing the apparatus. The potential of each glass electrode, in the two buffer solutions,was then graphed against the corresponding pH values of these solutions, and the two points joined by a straight line. The lines obtained for the three glass electrodes were generally very close together, and invariably had the same slope, which was equal to or at most only 1 millivolt per pH different from that of the value for the hydrogen electrode. Occasionally an electrode was prepared which gave readings 10 millivolts or so different from the other two, but such electrodes were quite satisfactory and gave a calibration graph with the usual slope. The relative position of the lines obtained on different days varied only slightly. The pH of the salt solutions was then read off from the graph. The differences in results given by the three electrodes were seldom more than 0.01 of a pH; the mean value for the three electrodes was taken. This procedure of calibrating over the same range of pH covered in the measurements could not be done by the usual method without the use of a large number of carefully

67
prepared buffer solutions.The hydrogen electrodes were tested at intervals with
an M/20 solution of potassium hydrogen phthalate having areaction of 3.97. They were stored in water when not inuse and showed no falling off in performance over anextended period, due no doubt to their being used only indilute buffer solutions. The use of two hydrogen electrodesis desirable, as by this means failure to function correctlyis detected by lack of agreement; - no two hydrogenelectrodes are affected similarly when any disturbing factor
-24 . .is present, so that if two electrodes record agreeingpotentials in different solutions there is no doubt but thatthey are functioning as reversible hydrogen electrodes.
As a test of this method of calibration where a straight line is drawn between two points, a number of glass electrode potentials were graphed against hydrogen electrode potentials. The range in pH covered was 2.21 to 8.99, obtained by titrating approximately twice molar di-sodium hydrogen phosphate into approximately molar citric acid, a little caustic soda being added for the final most alkaline value. The points obtained for each electrode lie on a perfectly straight line, as shown in Fig. I, which justifies the method. Even if the lines had .been slightly curved no serious error would have been introduced, - providing the points had fitted on to a smooth curve, - since the range of pH covered in an actual calibration seldom extended over

VNS
\ 800 i
\ i
\ 7001
\ I6 00 f \
X\
5 0 0\
%
\-8 0 0 -ZOO o zoo
Gtass e /e c /ro d e p o /e n /id /— /m /it'o //s
Fig. 1.Relationship between the potentials of the glass and hydrogen electrodes. The 45° slope of the lines shows that the glass electrodes behaved as reversible hydrogen electrodes over the pH range of the trial

68
more than one pH. In this way it was possible to study the hydrolysis of potassium cyanide, although the reaction of this salt is considerably outside the range for which it is usually assumed that the glass electrode is satisfactory. By calibrating the electrodes in the above fashion it was possible to obtain reproducible results and to calculate a hydrolysis constant for this salt, which incidentally cannot be examined with either the hydrogen or the quin- hydrone electrodes.
At the beginning of this work the electrodes were calibrated both before and after a set of measurements.This was found to be unnecessary, however, and in most cases the calibration was performed after an experiment only.
The Effect of Neutral Salts on the Glass Electrode: Asalready mentioned little evidence existed on the behaviour of the glass electrode in the presence of salt solutions.The quinhydrone electrode is affected by salt molecules and so are indicators. The hydrogen electrode measure true hydrogen ion activity providing disturbing influences are absent, as for example an oxidation reduction system, so that the logical way of testing the behaviour of the glass electrode in any solution is to combine it with a hydrogen electrode (as in chain 2, section I). The chain used may be represented thus

69
acetate buffer Salt SolutionPt. quinhydrone glass A
The amount by which this cell departs from a constant shows the deviation of the glass electrode from behaving as a true hydrogen electrode. The pH of the salt solution was kept within the working range of the glass electrode (1-9)# by the presence of a buffer. The actual change in hydrogen ion activity on adding various salts - due to the effect of the salt molecules and to hydrolysis - was of no importance in this test.
In order to show the variation to be expected with the above cell chain due to small fluctuations inseparable from the glass electrode, 0.2M acetic acid was titrated into 0.2M di-sodium hydrogen phosphate, see Table la. Pour litres of buffer solution A - a solution 0.08M with respect to acetic acid, and 0.12M with respect to sodium acetate,-were prepared giving a reaction of 4.8. Solutions normal with respect to the salt in question were then prepared using solution A as solvent. The E.M.P. of the above cell chain was recorded for each salt solution and also for solution A each day, in order to show the changes inherent to the glass electrode and not to be attributed to ’neutral salt effect’.
Examination of Table lb shows that the salts chosen- had no effect on the functioning of the glass electrode, when the fluctuations due to asymmetry potential, as shown

Table I.The effect of neutral salts on the glass electrode.
a. Titration over pH range 5-15 to 3*75.b. Salt effect.
E.M.F. of chain 2 in millivolts. Solution. Day. Glass Electrode.No. 11 No. 12 No. 13
Buffer pH 5*15 1st. 639-8 636-0 642-3ii 639-8 637- 0 642-0ii 639-5 637- 0 642-0it 639-5 637-6 642-5pH 3*75 it 639-0 637*8 641-8
pH 4*78 1st. 639-8 638-9 642-5A. NaCl ii 639-5 638-1 641-4A. KC1 ti 638-2 636-8 640-5A. MgClg i i 638-8 635-3 641-1A. CaClp i i 638-8 635-0 640-9A. MnClg ti 638-8 634-7 640-9A. it 638-7No. 141646-4
640-7A. 2nd. 642-0 643-0A. ZnClo it 641-0 644-0 643-0A. Li2S04 ii 642-0 646-3 642-7A. FeCl3 ii (erratic:- about -255)A. i i 644-9 v 647-9 645-2A. 3rd. 643*6 645-1 642-0A. ZnS04 i i 639-8 642-7 640-8A. BaC 1p
MgAc|Hii 643*0 646-8 643-0
A. i i 641-5 645-7 640-7A. ii 641-2 645*8 640-9
t Electrode No. 12 broken and replaced by No. 14.•*. Solutions of molar concentration with respect to the salts
used.K Ac = acetate ion.

70
by the change of 3-4 millivolts for solution A over the three days of the experiment, are taken into account. The potential for a salt should be compared with the nearest values for solution A in order to allow for the changes peculiar to the glass electrode. The choice of salts for the above test was limited by reasons of solubility and because only ions which may be used with the hydrogen electrode could be chosen.
Ferric chloride was included in the salts chosen although the hydrogen electrode cannot be used with this salt, in order to establish definitely the mechanism preventing the use of the hydrogen electrode with multivalent cations capable of reduction. The most probable reason seemed to be the establishment of an oxidation-reduction potential after some reduction had occurred at the platinum black surface. Denham
23.and Marris attribute their failure to obtain constant results with the hydrogen electrode in solutions of zinc sulphate to be due to the reduction Zn*+ H — ►Zn + H', which increases the hydrogen ion concentration of the solution. (Incidentally other workers record perfectly satisfactory results with the hydrogen electrode in zinc sulphate solutions).A more probable explanation if this reduction does occur, and the value of the potential for zinc sulphate in Table lb gives no indication that it does, would seem to be the resulting oxidation-reduc- tion potential at a metallic surface. The test with ferric ions, which are known to be reduced by the hydrogen electrode confirmed this opinion. If the increased hydrogen ion

71
concentration t>rought about by the reaction Fe + H-»Fe' -t E were the only effect, then the potential of the glass-hydrogen electrode chain would be unaffected. Actually the potential of this chain fell enormously from the 'constant* value of about 640 millivolts given with the other salts to a very erratic value of about -255 millivolts. The rise of 900 millivolts in the hydrogen electrode potential shows that the electrode was answering to a new stimulus. (The glass calomel electrode chain showed a fall in pH of about 1.2 which is a feasible change owing to the marked hydrolysis of ferric chloride). The magnitude of the change in potential of the hydrogen electrode is of the order of that to be expected on the view that the electrode is responding to a ferric-ferrous oxidation system. Thus the hydrogen electrode which normally answers to the reaction E = ^ H ‘+ e is affected by the oxidation- reduction reaction Fe F e + e. The potential of the glass electrode is created by the passage of hydrogen ions through the membrane, and no reaction between ions and atoms is involved. It is for this reason that the glass electrode is unaffected by oxidation-reduction potentials.
The conclusion to be gathered from Table 1 is that the presence of salts in concentrations up to normal does not affect the power of the glass electrode to function as a reversible hydrogen electrode. (Note. Since this work was
2 9completed other workers have recently shown, using a similar electrode chain, that the presence of magnesium ions up to a

72
concentration of two gram ions per litre has no effect on the behaviour of the glass electrode.)
The suitability of the glass electrode for the measurement of hydrolysis having been proved, and the method of calibration justified, the pH values of a number of salt solutions were measured over a wide range in concentration. The salts for which a hydrolysis constant could be calculated are given first, followed by a summary of results for salts not yielding a constant by the experimental procedure described. The values for Kg, calculated from the simple mass action expression, while not constant do justify the glass electrode method of studying the subject, and are generally either the only values that exist or are considerably more constant than previous ones by other workers.
POTASSIUM CYANIDE.
The hydrolysis of potassium cyanide was studied by30
Shields in 1893 over a narrow range in concentration.Shields used the catalytic method, and his value for Kg is widely quoted in text-books. The salt has been studied more
3/
recently by Harman and Worley using a vapour pressure method. In a discussion following the reading of the above paper it was suggested that an electrode method would be ideal for studying hydrolysis. Solutions of potassium cyanide are said to poison the hydrogen electrode while the quinhydrone

TABLE II.
The pH of solutions of potassium cyanide recorded by three glass eleotrodes.
Temp. 16.2°G . approx.
PHvLitres/mole No. 16 No. 17 No. 18 Mean.
10 11 .37 11.36 11.36 11.3650 11.01 11.02 11.02 11.02
100 10.84 10.84 10.84 10.84250 10.62 10.63 10.63 10.63500 10.45 10.44 10.45 10.45
1000 10.29 1 0 .3 0 10.29 10.29

73
electrode cannot be -used owing to the alkaline reaction. The author was doubtful whether the glass electrode would give reproducible results at the high pH values of the solutions of this salt. However a number of tests showed that reproducible results could be obtained using the calibration method described immediately after an experiment. Table II shows the pH results for the three glass electrodes used in this work, and is included to show the good agreement obtained; with the salts that follow the average value for the three electrodes is recorded.
The equilibrium existing in a solution of potassium cyanide may be written
CN + B^O HCN + OH(l - x)/v x/v x/v
where x is the degree of hydrolysis.
Now a w _ 'Kw so that x = . v , and Krr = x*0 I f * 5 - ~
The pH results for two trials one at 15°C, the other at 16°C, are given in columns 2 and 5 respectively of Table III.During an interval of several days between the trials the electrodes were used for work on salts giving an acid reaction. The values of Kg are given in columns 4 and 6, and are reasonably constant though in each case the values rise to a maximum at v = 50.lt may be mentioned here that a difference of one millivolt corresponds to a pH difference of almost 0.02,
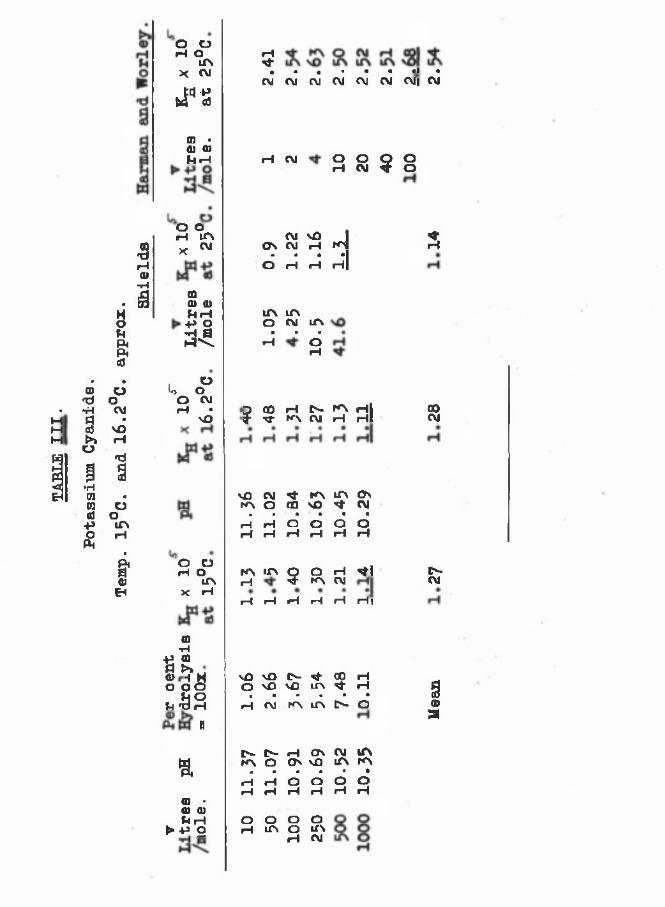
TABLE
III.
Potassium
Cyanide.
Temp.
15°C.
and
16.2°C.
approx.
-3rH0>•Ha
o oH OLfN X CM
"8d"
CQ • <U Q>h H
o orH ITS X ™
a>D Q) h r )34
lo 0°O CM H •vO
o orH O lP» X iH
CO •H +3 (0
S ’?*o oo* 3 3
n
R01 • a> a> h H
>+* 2
3• • • . • • • ! •
CM CM CM CM CM CM CM| CM
H CM O O Q O H N ? O
QvO
CM vO I N CM rH NN . . . .1) H r l r l |
UN IT\o CM LTV• • •rH OrH
?C0 H IS K\ Hi ■qr K\ CM «H Hi
vO CM K\ iT\ OvK\ O CO vO •'t CM• • • * • • •
H H O O O OH rH rl H H H
KV Lf\ Q rH ^ O KN CM
rH vfl
H rl rl rl rl rH|
vO v O tS - v f CO rH O v£> vO ir v v j- rH
# • • • • • iH CM K S ITN I S O
C '- IS - rH O v CM l£sK\ O (Tv vO lf\ KN« • • • • • rH h o o o o
rH rH rH rH rH H
O O O O H tf\ O ICN H CM
a
ooCM
Cv-CM
9<D3

74
irrespective of the position in the pH scale, which causes a difference in Kg of about 10fo using the above formula. The calculation of a hydrolysis constant from pH in alkaline solutions involves squaring K^, so that the value of K^which is chosen affects the magnitude of Kg considerably.
/r' /t-2° -''4The values used were K^ = 0.45x10 and E . - 0.51 •* 10obtained by interpolation from data published in InternationalCritical Tables.
The results obtained by Shields and by Harman and Worleyare given for comparison in columns 8 and 10 respectively ofTable III. The values for the three methods may be comparedwith the theoretical value which equals 0.64 x 10 at15°C and 1.4 x 10^ at 25°C. .
A trial performed with a stopper removed from the lidof the electrode chamber, so that the solution was exposedto the atmosphere, gave pH results about 0.2 below those in
-S'Table III and a mean value for Eg of 2.1 x 10. This test showed that the absorption of carbon dioxide during the time taken for a measurement does not greatly affect the reaction of such an alkaline solution. This was predicted when discussing the buffering capacity of salt solutions.
COPPER SULPHATE.
The hydrogen electrode cannot be used in solutions of copper sulphate since the standard electrode potential of

7528
copper is positive. O ’Sullivan measured the pH of M/20copper sulphate using the quinhydrone electrode and obtained
32a value of 4.14 at 18 C. Hughes using the glass electrode found an M/20 solution of copper sulphate had a reaction of 4.24 at 25°C.
The hydrolysis of copper sulphate may be represented by the equation
Cu + ^ 0 ^ Cu-OH + (a)a.giving x = a„T and E- = x
n n (1 - x ) v
or by the equationCu*+ H20 Cu(0H)2 + 2H .................. (b)
giving x = aH'V and Krr = 4x“2“ M (I - i/vlWhich reaction predominates can be found only by experiment. A number of trials with Analar copper sulphate gave closely agreeing results. One set of pH values,(in brackets) given in column 2 of Table IV were obtained at 20.2°C. The unbracketed values in column 2 were obtained at 15°C. with salt that had been crystallized. (Found 25.39# Cu by electroanalysis: calculated 25-45#). The value of 4.25 for the untreated salt may be compared with the value of 4.27 at 25°C given by Hughes.
Column 5 of Table IV shows K0 calculated from the pH values of the recrystallized salt using equation (a). The value is fairly constant and so it follows that reaction (a)
/

TABLE 17.
Copper SulphateTemp. 15°C. and 20.2°C. approx.
Vlitres/mole. PH *H * ^
Per cent Hydrolysis 0 lOOx. % x
10 4.52 (4.23) 4.79 0.048 2.350 4.82 (4.70) 1.51 0.075 1.1
100 4.99 (4.82) 1.02 0.102 1.0250 5-20 (4.94) 0.631 0.158 1.0500 5.33 (5.17) 0.468 0.234 1.1
1000 5.45 (5.25) 0.355 0.355 1.6
Mean 1.2

76
predominates. When a salt is formed from a sparingly soluble weak hydroxide, there is reason to believe that hydrolytic equilibrium is not attained immediately the salt is dissolved
33 32in water. Denham, O ’Sullivan and Hughes have shown that the hydrolysis of salts such as copper sulphate, aluminium sulphate, and zinc sulphate increases for a day or so after preparation of the solution, the reaction becoming slightly more acid. O’Sullivan attributes the change to the slow coagulation of the colloidal hydroxide with consequent liberation of adsorbed acid, while Hughes suggests that the hydrolysis reaction is a slow one. The former explanation would seem the more probable one, since hydrolysis being an ionic reaction should be instantaneous. In the present work the M/10 copper sulphate solution was prepared two days previous to the measurements so that the pH obtained could be compared with the values of other workers. For this reason the reaction for the M/10 sample is slightly more acid than would have been obtained if it had been measured at once, (Hughes finds the change on standing of the order 0.1 pH), and the value of Kg is consequently greater than for the other solutions the pH values of which were measuredimmediately after preparing. The mean value for Kg excluding
- 8the M/10 figure is 1.2 x 10
It will be seen that since it is not possible to judge what the hydrolysis equation is until a value for Kg has been calculated there is no point in stating a degree of hydrolysis

TABLE V.
Aluminium Sulphate.Temp. 16°C. approx.
v 4. Per cent „Litres pH a— x 10 Hydrolysis L, X 10/gm.equivalent. r lOOx
5 3.53 2 .9 6 0.07 6.625 3.76 1.74 0.22 6.650 3.87 1.35 0.34 6.0
125 4 .05 0.93 0.58 5-0250 4.14 0.72 0 .90 4.9500 4.24 0-57 1.4 4 .9
Mean 5.7

772 8
from the reaction of a single solution. Thus O'Sullivan-4
calculates a degree of hydrolysis of 7.2 a 10 from a reaction of 4.14 for M/20 copper sulphate using reasoning based on equation (b), which the present results show is not applicable O'Sullivan's degree of hydrolysis should be doubled.
ALUMINIUM SULPHATE.
33This salt was studied by Denham using the hydrogen
electrode. Of a number of possible equations he finds that his experimental results indicate the following reaction
A12(S04) + 2R2 ° ^ M 2 S04^2> + 2H’ + S04aH' •v 4x*hence x = — ^ x~Jva
The writer's results using recrystallized aluminium sulphate confirm this view. The results are given in Table V and
nindicate a mean hydrolysis constant of 5*7 * 10
LEAD NITRATE.
The hydrogen electrode cannot be used with lead nitrate solutions because of the position of lead in the electrochemical series (see previous discussion); and also because of the reducible nature of the NO^ group, and, according to
34Denham and Allmand, of the lead ions which go to a lower valency.

78
As with copper sulphate the hydrolysis equation is a first stage reaction and may be written
Pb* + HgO PbOH + H*where x = a^v and Krr = x*
(1 - xjvThe bridge solution used with this salt was saturated ammonium nitrate since potassium chloride of course gives a precipitate. Two separate trials at 15°C performed several weeks apart, and with a different set of electrodes, are recorded in column 2 and of Table VI. The value for Kg for one set of results is shown in column 6. Here as with copper sulphate the M/10 solution was prepared two days before use, and so the value for Kg at this concentration is higherthan the remaining figures. The mean value of Kg not
- 8including the M/10 value is 1.7 X 1035-
Dehham and Marris have measured the pH values of solutions of lead nitrate varying in concentration from v = 16 to 256 using the quinhydrone electrode. The writer has calculated Kg from their results and they are given in column 9 for comparison. The degrees of hydrolysis recorded by Denham and Marris were calculated from^§^2 and so are half the actual value indicated by the above equation.
36Tansley studied the hydrolysis of oxime hydrochlorides with the polarimeter. These salts are considerably hydrolysed and Tansley was unable to obtain a constant from the simple Ostwald Kgj the variation was great and analogous to

£1
aIp•HS3a)4)*-»
8I&•ooLf\
IEH
a S
1 *
*oH H 0)«*SrP
,P
to•H p CO
II
as0)aa>fHO1CD
-£P
00 N ^ 'ON CO• • • • •
rH CO vO ■'t •*!-
VO CM fH K \ cs CO vO
CM ifN H CM
n u ? 8 • • • • • • 'tK\*KN K\ K\ KN
•*• *
vOvO $ &* O l
iH
rH rH rH rH CM
o-fH
oa$ rH O
CT\ CM O O rH
■M" 00O v 00 rH CM
C*-U\vf
vO i r \vO CM o o - C» LTV
00 CM Lf\• • • • • •
vO rH fH o o o
00 CMC*- 8•
M-
s•
l f \
K \CM
u v
IfNK \
•IfN
CMO v
•M-
iHrH
•i r \
CM•
ITv
■M-KN
•l f \
O O O OrH LTV O LTVH CM IT \
8 ooo
Denham and Marris

79
that shown in the electrolytic dissociation of strong electrolytes. The experimental values did however give a good constant for an expression evolved by Goebel, which was designed to take into account the interionic and inter- molecular attractions in solution. The formula is
K a C2 J01 + W2 *1
where and C2 are the concentrations of the unhydrolysed and hydrolysed parts of the molecule respectively. A and B are arbitrary constants and are evaluated by inserting three experimental values of and C2 in the formula. The values for the Goebel expression for the lead nitrate results are given in column 7 -of Table VI. The figures marked with an asterisk indicate the three experimental values used in evaluating constants A and B. The results obtained in this way are more constant than those found using the usual expression, but the writer doubts whether much significance can be attached to results obtained by making alternate experimental values fit a formula in this way.
BERYLLIUM SULPHATE.
The hydrolysis of beryllium sulphate has been shown to17possess exceptional features by Prytz, who investigated the
reaction of solutions of this salt varying in concentration
80
from v = 1 to v = 23 "by means of the hydrogen electrode.Prytz found that the 'degree of hydrolysis' x = a . v/2 falls as the concentration increases from t = 23 to 2 which is of course the normal "behaviour, but that beyond v = 2 the 'degree of hydrolysis' commences to rise. This is of course highly improbable, and is caused in Prytz's opinion by an increase in the activity of the hydrogen ions due to the effect of the molecules of beryllium sulphate. Prytz endeavoured to overcome the difficulty, by adding sufficient sulphuric acid to solutions of magnesium sulphate to give the same pH value as shown by beryllium sulphate solutions of the same concentration. If it can be assumed that magnesium sulphate solutions are unhydrolysed (which seems doubtful), and that they affect the activity of the hydrogen ion in the same way as does beryllium sulphate, then the amount of sulphuric acid formed by hydrolysis of the latter salt could be found from the amount of the acid added to magnesium sulphate. In this way a 'degree of hydrolysis* is calculated by a method which is not affected by the influence of ’neutral salts' on the activity of the hydrogen ion. Its value showed a minimum similar to the values obtained from pH results, however, and as Prytz said some of the underlying assumptions must be erroneous.
The pH results at l6.5°C obtained by the writer over the usual range in concentration are shown in Table VII, and do not allow of the calculation of a hydrolysis constant. The value

TABLE VII.
Beryllium Sulphate. Temp. l6.5°C, approx.
v GlassLitres/mole 16
10 2 .92
50 3 .4 6
100 3 .6 8
250 3 .9 6
500 4 .1 7
1000 4 .3 5
pHElectrode 0 W o „ -in'3 17 18 x 10
2 .9 1 2.92 6.03 .46 3.46 8 .7
3 .68 3.68 10.53 .97 3.96 13.74.18 4.17 16.94.36 4.36 21.8

81
for x = ag- . v/2 is given to indicate how slowly the degree of hydrolysis falls with increase in concentration. The fact that it is possible to calculate hydrolysis constants for other salts indicates that in general the effect of salt molecules on hydrogen ion activity is not appreciable, and so there would seem reason to doubt whether this is the reason for the failure with beryllium sulphate. In the writer’s opinion the excessively rapid decrease in pH with increasing concentration of beryllium sulphate, (contrast with aluminium sulphate) may be connected with the marked tendency that beryllium salts show to form basic complexes.
The salt was not available in ’Analar’ quality. The sample used, marked ’pure', was recrystallized twice by the usual method and allowed to stand over effloresced beryllium sulphate crystals for several weeks. The sulphate present was analysed (Found 14.06%, calculated value for Be-SOv 4H20 = 14.12)
SODIUM BISULPHATE.
Hydrolysis defined as reversed neutralization does not occur with a salt of two sided strength. The acid reaction of sodium bisulphate is due to the ionization of the anion HSO^
HS04 h ' + S04 (l -«)/v «/▼

TABLE VIII.
Sodium Bisulphate. Temp. 19°C.approx.
v x Ostwald BudolphiLitres/mole pH X 10 c< formula formula
1 0 .5 0
10' 1 .3 1
50 1 .9 1
100 2 .17
250 2 .52
500 2.811000 3.07
31 .6 0.3164.92 0.4921.23 0.615
O .676 O .676
0.302 0.7550.155 0.7750.085 0.851
0.146 0.1460.047 0.1480.0196 0 .138
0.0142 0.1420.0093 0.1470.00535 0.1340.00485 0.153

82
HS04 is a comparatively strong acid and the simple Ostwald dilution law does not give a constant when stoichiometric
38
concentrations are used (see Sherrill and Noyes). The value for «V(1 )v where »<=aHv is given in column 5 of Table VIIIand is seen to vary enormously. The purely empirical formula
2 ^K = °<y(1 — °< )J~v7 suggested by Rudolphi to connect the 'degree of ionization1 of a strong electrolyte with the concentration, does give an almost constant value as is seen in column 6.It may be remarked that a change of 1 millivolt, i.e. 0.02 of a pH, changes the value of K by over 10% due to appreciable change in the value of 1—°< when °< is not insignificant. In view of this the constancy of K is rather surprising.
CADMIUM SULPHATE.
This salt is known to form complexes and for this reason will probably not give a hydrolysis constant according to the dilution law. The pH values and 'percentage hydrolysis' are given in Table IX.
AMMONIUM SALTS.
Considerable pains were taken to obtain a hydrolysis constant for solutions of ammonium sulphate, chloride, and nitrate, as no record could be found of previous work on this subject apart from widely differing values for the 'degree of

TABLE IX.
Cadmium Sulphate.Temp. l6°C.approx.
Per centv hydrolysis
Litres/mole Mean pH = 100 a^v.
10 4.04 0.0350 4.66 0 .3 6
100 4.91 0.41250 5.22 0.05500 5-37 0 .0 7
1000 5.42 0.13
where 3CdS04 .8H20 is taken as the 'molar* unit.

83
hydrolysis' at various isolated concentrations. IShen it was found that the results obtained were not giving a constant especial care was taken to obtain pure specimens by repeated recrystallizations, while the time the solutions were exposed to the atmosphere was reduced to a fraction of a minute. The value for Kg varied about twenty fold notwithstanding all precautions, while it was not possible to obtain pH values for separate trials agreeing to closer than about 0.1. The possibility of a modified expression for Kg was considered but no general function could be found connecting v and ag. Experiments to be described later on the rapid change in pH of conductivity water when exposed to the atmosphere for a very short time provide an explanation of these results, and a new technique is described which allowed the calculation of a hydrolysis constant. In the discussion on the lack of buffering capacity of most salt solutions attention was drawn to the effect that a trace of acidic or alkaline impurity would have on the pH of a salt whose reaction was between 5 and 9 . The reaction of salts of ammonia and a strong acid are well within this range and so are particularly difficult to work with. A selection of experimental pH values for separate trials with ammonium salts are recorded in Table X to illustrate the lack of agreement, due, it will be shown later, to the presence of carbon dioxide in the water used.It was the acid reaction of dilute solutions of ammonium salts

Ml
SP•H>•HP
•xf§o
•Hs3
to o p p .■a ato
O
O•Od>►rHO,CO03
«Ho
3 J5o o
a3rHOto
•♦Ho
rt0•HP
SfflfH1
0)fH
<2®&
U<0
►
o■v
8CM■>*?*■
KN
B
O
.i► 8
p
N K N (O E -- s * rHo o o n co e *- vO
KN O KN UN
O s iT t vO lA vO vO
KN sO KN * •
CMlf\ITS lA l f \
SOOJ•
UN
OCM
?UN UN
UN
UN CO KN K \
UN UN UN
KNCM
UN sO s fr UN
UN UN UN
KN vO CM KN
UN UN UN
M- O s UN KN s t UN • . •UN UN UN
CO rH UNCM sO SO• • •lA tA lf\
CM• • •
UN UN UN
O O O O H UN O UN
CO CMto
8UN
O -CM
O - vO sO sO SO sO
UN UN UN UN UN UN
+ 00UN UN • •
UN UN
CO rHUN s o
♦ • UN UN
ON
UN
UNO -
UN UN
UN UN
ON KN UN SO • •UN UN
oUN
OUN•
UN
8 • •
UN UN
sO
I I
I I
I I
UN
I 1

84
that first suggested, the presence of this impurity, and lead to attempts to measure the pH of the water itself, which is difficult because of the high electrical resistance and complete lack of buffer action. Unfortunately it is not possible to allow for the carbon dioxide present in the water for the results in Table X, (even if the amount present were constant), as there are too many unknowns in the three equilibria involved viz: K^, Kg-and q q ^
THE REACTION OF CERTAIN SALTS IN WATER.
Until the method of measuring the pH of the conductivity water had been devised the impossibility of preventing ingress of carbon dioxide had not been realised. The importance of using carbon dioxide free water for salts having a reaction near to ’neutrality’ was, of course, obvious, but it was thought that conductivity water prepared with a copious evolution of uncondensed steam, and stored in a Pyrex flask bearing a soda lime guard tube would not be contaminated. As described, the method of preparing the solutions and measuring their pH value exposed them to the atmosphere for a minute or so at the most and it seemed that there was little chance of appreciable atmospheric contamination. Both of these views are incorrect however. A number of results will now be given for salts whose reaction is seriously affected by dissolved

85
carbon dioxide, since considerable time was spent in a -vain attempt to obtain reproducible results, and to calculate a hydrolysis constant, before the presence of this impurity had been established. They are included as a record of work done, and for comparison with later results. Table XI shows the reactions of -various salts dissolved in ordinary conductivity water. Some of the salts are dealt with later and a hydrolysis constant obtained by the use of carbon dioxide free solution.
It will be noticed that potassium permanganate gives a slightly alkaline reaction at the higher concentrations, but that the reaction passes through the neutral point with dilution. Potassium chromate reacts alkaline owing to the weakness of chromic acid. With silver nitrate an ammonium nitrate bridge was used but a precipitate was formed at the junction of the two solutions as in the case of a.potassium chloride bridge, so that the existence of a junction potential is probable. Potassium chlorate being a salt of double sided strength gives an almost constant reaction for different concentrations (depending on the amount of carbon dioxide present in each sample). The pH value of M/10 sodium thio- sulphate when freshly prepared was 6.8, but the solution became more acid with standing and the reaction had fallen to6.4 in about two hours time. This is in agreement with the slow change in normality which occurs with dilute solutions

The
pH of
a number
of salts
dissolved
in conductivity
wate
rat
room
temp
erat
ure.
O- CNJ vO vOC— UN K N CO IfN vO vO UN
LfN LfN IfN LfN LfN LfN
KNsaKN
NOON
•*
•
KNrH
•
NO00•
rHCn .
.
KNUN
*C“- O - NO NO NO
CNJ CNJ C "- CM Cn-IfN NO UN Nt- W
• • • • • •IfN UN UN UN UN UN
00co ONKN
CNJUN 1
C"-NO 1• .
UN•
UN•
UN
OCN-CNJ•
CNJON•UNCN-•
oUN•rHKN• s•
ON CO c0 00 CO CO
.egI ON VO O CNJ CNJKN
00CNJ KNCNJ\0 'O 'O nO NO
NOCO
rH - nO KN ON00 P- nO
O CO KN rH
• • vO NO
0)rHjaa+>a
orH
Q O OIfN O IfNCNJOOO

86
of this salt, due it is considered to the liberation of thiosulphuric acid by dissolved carbon dioxide.
A number of trials were made with sodium acetate,-a typical set is given in Table XI, - in an endeavour to discover the reason for the inability to obtain a hydrolysis constant with the salts listed in Table XI. The theoretical value for Eg is of course known for sodium acetate from the expression Ey/E^. At this stage it was not certain whether failure to obtain a constant was due to experimental error, to the 'salt effect’ on the activity of the hydrogen ion, or to the fact that such constants did not exist in the majority of cases owing to the theoretical limitations of the simple mass action expression. Because of this doubt many attempts were made using sodium acetate from different sources and using different methods of recrystallizing, but of course none of the trials gave even approximately constant values for Kg. It was noted that the change in reaction with dilution for this salt was too great to give a constant Eg, while with salts of weak bases like zinc sulphate or silver nitrate the reaction did not change sufficiently. That these results were in no way connected with faulty glass electrodes was shown by checking with the quinhydrone electrode. Subsequent proof that the pH of the water used was about 5*7 showed the reason for these results. A reasonably constant value for Eg is given later using carbon dioxide free water.
A number of trials with zinc sulphate g.ave pH values

87
which varied but slightly with dilution, and in some cases the solutions actually became more acid on dilution. Denham and
53.Marris studied this salt using the quinhydrone electrode.Their results show an increased acidity with dilution but they make no comment on this remarkable result, which the writer ha& proved to be due to the presence of carbon dioxide.Trials to be described later using carbon dioxide free water give normal results and allow of the calculation of a hydrolysis constant.
The measurement of the reaction of the water used, and the removal of dissolved carbon dioxide will now be discussed, followed by the determination of hydrolysis in carbon dioxide- free solutions.
An attempt was made to measure the pH of the conductivity water from the Boasfield still by means of the glass-calomel electrode chain used with salt solutions. The pH indicated was approximately 5.9, but the E.M.F. was too erratic for the result to be relied upon. This was to be expected since a valve potentiometer usually only gives steady readings with circuits whose resistance is not greater than about 50 megohms, while the resistance of the present chain was calculated to be of the order 100 megohms.

88
(Note:- In this chain the grid lead was connected to the highly insulated glass electrode (positive). If connected to the calomel electrode the E.M.F. indicated was beyond the scale of the potentiometer, for reasons discussed in Section I in connection with concentrated solutions of acetic acid.)
It was obvious that to obtain reliable potentials the resistance of the chain required to be considerably reduced. This could be done by the use of a low resistance bridge instead of one of water, but the necessity for avoiding contamination of the water in the electrode chamber prevented the use of a liquid bridge other than water. Numerous devices were tried and discarded as unsatisfactory, including a collodion membrane at the inner end of tube C, (Fig. I,Section I), which was filled with an electrolyte. An agar
uobridge as described by Michaelis and Fujita was finally adopted. 3 agar were dissolved in 100 gm. of water (heated on a water bath); 40 gm. of potassium chloride were added and a homogeneous solution made. A narrow bore U shaped tube with a constricted opening at one end was then filled with the hot agar solution by suction. The bridge so formed was fitted to a wide section mercury seal so that it could be raised and lowered without allowing air to enter the chamber. In this way the agar bridge only required to be dipped into the water in the electrode chamber for the few moments needed to take a reading. The outer end of the bridge fitted loosely into a piece of rubber tubing connected to stop-cock 3 and filled with

89
saturated potassium chloride solution. As expected the watergave no indication of chloride "being present after a trialwith this bridge. The potential was quite steady with thislow resistance connection, and represented an average reactionof 5.7 for different samples. Evidence that this low pH wasdue to dissolved carbon dioxide was obtained by calculatingwhat the pH of the water would be, assuming that the differencein conductivity between the water used, (1 0 *r.o.), and that
-6of Kohlrausch’s absolutely pure water, (0.04 X 10 r.o.),was caused by this impurity:-
The degree of dissociation o< of the carbonic acid present is given by the hydrogen ion concentration of the solution and the dissociation constant of the acid. Thus,
The specific conductivity due to carbonic acid is assumed -{, -7
to be (1 - 0.04)10 = 9 .6 x 10 . The equivalent conductivity
[h c o'3]so that at pH 6, m—IL>COjj 3 x 10
- /
A of H2C0 at the concentration present can be found from Aoo = 375 for HgCO^ and °< =0.23. Thus,
Hence the number of gram equivalents of H2C0j per litre of solution is given by

90
the hydrogen ion concentration due to the dissociation of HoCO-z is then given by
P - 5 -i0.23 x 1.1 X 10 = 2.56 x 10
Adding the hydrogen ion concentration due to the dissociation of water (assuming as an approximation that it is unchanged by the presence of E^CO^), gives the total hydrogen ion concentration of the water as (25-6 + 1)10 and a pH of 5* 58- That this value, which involves a number of approximations for its derivation, is so near to the experimental one supports the view that dissolved carbon dioxide was responsible for the acid reaction. The next step was the removal of this impurity.
Accordingly the effect of bubbling pure air through the water in the Pyrex storage flask was observed. The air was drawn through caustic soda solution and a train of soda-lime towers, by means of a filter pump connected to the siphon tube of the flask. The reaction of the water on transferring to the electrode chamber differed for each sample tried, the highest value obtained being 6.6, the lowest 6.1. Water treated in this way and left in the storage flask overnight gave the usual reaction of 5«7« It tilus appeared that transference from the storage vessel to the electrode chamber allowed a variable quantity of carbon dioxide to dissolve,and also that atmospheric contamination occurred in the storage flask in spite of the soda lime guard tube. Accordingly carbon dioxide-free air was bubbled through water actually in the electrode chamber by means of a tube containing a rose of half

91
a dozen tiny holes along the bottom end which was bent into a horizontal position. The tube was fitted into the lid and connected to the purification train. Considerably better results were obtained, but the reaction still varied due no doubt to ingress of unpurified air due to the partial vacuum in the electrode chamber. An air compressing device was then fitted up consisting of a filter pump discharging into an aspirator bottle. With this arrangement air from outside was drawn through a wash bottle of acid permanganate and one of caustic soda solution into the compressor. The resulting compressed air was then passed through dilute sulphuric acid and three large soda lime towers followed by four wash bottles, the first reversed as a trap, the remainder containing about 80% sulphuric acid, 100% orthophosphoric acid and conductivity water respectively. The pure air stream then passed to the rose distributor in the electrode chamber, and after bubbling through the water, escaped to the atmosphere via a wash bottle of dilute caustic soda and a soda-lime tube.
Steady reproducible potentials were obtained with this arrangement. The reaction of the conductivity water rose steadily from about 5.7 to about 7 after passing air for an hour. If the water were exposed to the atmosphere for a minute or so the pH fell to about 6. This accounts for the low pH of the conductivity water in spite of the care taken to avoid atmospheric contamination. The problem that now presented itself was to devise a method of adding salts to the carbon

92
dioxide-free water so that their reaction could be studied in the absence of this impurity. The writer was particularly interested in the hydrolysis of ammonium salts as no direct information existed on the subject. The method adopted for these salts, and for a number of other salts for which a hydrolysis constant could not be obtained previously, will now be described.
THE HYDROLYSIS OF AMMONIUM SALTS.
Reference has already been made to the low pH valueshown by dilute solutions of salts of ammonia with a strongacid, and Table X shows that the reaction of M/1000 solutionswas never higher than 5.6 to 5.8. Now that it has been foundthat the water used had a reaction of about 5.7, there is nodifficulty In explaining these results and the failure toobtain a hydrolysis constant. A study of the hydrolysis ofsalts In carbon dioxide free solution involves the preparationof carbon dioxide free water, the addition of the dry salt ora solution of It in carbon dioxide free water, and a methodof stirring the resulting solution In the electrode chamber,all without exposure to the atmosphere. It Is of courseimpossible to rid a solution of an ammonium salt of carbondioxide by bubbling a gas through it without removing ammonia
3 3 . V-as well. (c.f. Denham and Hill. Denham measured the reaction of solutions of ammonium chloride from v— 2 to v=32 with the

93
hydrogen electrode, but stated that the results were not accurate owing both to the loss of ammonia and to the equilibrium at the electrode surface being disturbed by this gas). The following arrangement was finally adopted. A glass tube bearing a ground glass stopper - which communicated with a side tube in one position - was sealed on to a 50 c.c. burette Fig. 2. The water for preparing a solution of the salt was placed in this burette and a stream of bubbles of purified air made to ascend through it by fitting the adaptor, shown in Fig. 2, which was fitted to the compressed air supply. The adaptor prevented the chance of water falling into the tube supplying the air stream, should the stop-cock of the burette be opened with insufficient air pressure existing to overcome the column of water in the burette. The air escaped through the side arm of the burette to a soda lime tube. The air passing through the burette was commenced at the same time as that bubbling through the water in the electrode chamber. It was proved that the water in the burette was freed of carbon dioxide at least as quickly as that in the electrode chamber, since when the reaction of the water in the chamber had reached a pH of 7 no change was caused by adding the water in the burette.
The lid of the electrode chamber carried two glass electrodes, the adjustable agar bridge, a stirrer with mercury seal, an air inlet for passing air over the surface of the liquid and the inlet for bubbling air through the water, an

>-r
S o d a L i m e .
j A d a p t o r
t C o m p r e s s e d A i r .
Pig. 2.Burette used fer preparing solutions of salts in carbon dioxide free water.

94
air outlet passing to a soda-lime tube, and a small rubber stopper in the position the burette was later to occupy.As usual the whole inner surface of the lid and rubber stoppers was freshly covered with pure paraffin wax. (The greatest precautions were of course taken in cleaning the apparatus, which was exposed to running water for half an hour or so and thoroughly washed with conductivity water before an experiment). 200 o.c. of freshly prepared conductivity water, - measured in a graduated flask used only for this purpose, - were transferred to the drained electrode chamber. The lid of the chamber was quickly fitted and air commenced bubbling through the water. Conductivity water was then placed in the burette to about the 5 c-c* mark, the stopper replaced in the position giving connection to the side tube and air started bubbling through the water. The one compressor served both supplies, the relative amounts passing being regulated by screw clips at rubber connections. When the reaction of the water in the electrode chamber had reached 7, a quantity of salt was placed in a glass stoppered weighing bottle,and the whole weighed. The weighing bottle was narrow enough to fit inside the top of the burette, and the contents were quickly emptied in, which operation necessitated the removal of the burette stopper for a few seconds only. The air stream to the burette was immediately stopped, the stopper twisted to the closed position and the adaptor disconnected. The burette was then unclamped and vigorously shaken lengthwise to give a

95
homogeneous solution. The weighing bottle was then reweighed. The volume reading on the burette was recorded and a few c.c. run out in order to fill the tip with solution. The solid stop cock was removed from the lid of the electrode chamber and the burette quickly fitted. It will be noted that the water was exposed for a fraction of a minute only, and that pure air was escaping through the opening and so prevented atmospheric contamination. The bubbling was then stopped but a slow stream of air started over the surface of the water in the electrode chamber. Measured volumes of the salt solution were then added to the electrode chamber, and the resulting solution stirred. Stirring caused a temporary rise of a few millivolts in the observed potential and so readings were taken a minute after stirring. This procedure was repeated, the third and fourth reading being generally the same showing that the mixing was complete. The temporary rise in potential with stirring became less as the concentration of the solution increased and usually vanished at the higher concentrations. The concentrations of the solutions in the electrode chamber were calculated from the molarity M of the solution in the burette, which was calibrated so that the total volume including the space below the 50 c.c. mark was known.The dilution v, in litres per mole, of the solution in the electrode chamber after addition of w c.c. of solution from the burette was calculated from the expression v=(200+ wttr.M.

96
The Analax ammonium chloride, nitrate, and sulphate were recrystallized from conductivity water at 80°C. without the addition of acid, and washed in the usual way. They were then stored over fused caustic potash for a month before use. The ammonium acetate was recrystallized from a hot solution of methyl alcohol to which a few c.c. of water were added to increase the solubility; this salt is too soluble to crystallize from water. Owing to the deliquescent nature of ammonium acetate the air drawn through the crystals during washing was dried by bubbling through concentrated sulphuric acid and • of course the usual soda-lime tube. Ammonium nitrate is often deliquescent due to traces of impurity, but the purified sample of this salt showed no signs of deliquescence after a portion had been purposely exposed to the atmosphere for several weeks.Note:-A collodion membrane was tried as well as the agar
method of obtaining a low resistance bridge. The membrane was formed at the inner end of tube C by dipping the end into a solution of collodion, and allowing to dry. Such a membrane should be satisfactory with electrolytes where the anion and cation have nearly the same mobilities. If the mobilities are appreciably different, however, the membrane acts partly as a semi-permeable membrane, and a potential is set up across it, due to the slower ion being impeded to a greater extent than the faster moving ion. Since the mobilities of the ions of the ammonium salts concerned are NH4 = 64, Cl = 65.5*NOj= 61.7, £S04 = 68 and Ac= 35> ft is to be expectedthat NH4C1 would give the best results, and NH^Acthe least accurate when using a membrane. This was confirmed by a test with these salts. With NH^Clon both sides of the membrane the potential was the

97
same as that when the usual solution-saturated KC1 junction*were used, and changing the concentrations of the solutions on either side of the membrane did not alter this result. (NH^^SO^ and NH^Ac, on theother hand gave a membrane potential unless the solutions on either side of the membrane were of the same concentration.
The hydrolysis of ammonium salts of strong acids maybe represented by the equation
NH^ + H2O NH^- 0H+ Hz
giving x = ajj. v and % = ( ! _\ji
Since the hydrolysis is very small z is negligible compared with 1 and Kg may be written a . v.
AMMONIUM CHLORIDE.
The results are given in Table XII. A trial is shown using a bridge consisting of a solution of ammonium chloride with a collodion membrane at the inner end. A few results are also given for a trial using tube G in the ordinary way, and allowing some solution to sweep out the conductivity water in the bridge. Once the resistance of the bridge had been lowered in this way by the entrance of the salt solution there was of course no difficulty in obtaining steady readings. The amount of solution swept out was collected and weighed in order to calculate the concentration of the solution in the electrode chamber. It may be recorded that

TABLE XII.Ammonrum Chloride.Temp. 15°C. approx.
Bridge filled with dilute NH4CI Solution;collodion membrane.
VLitres/mole.
PH *R * 10? Kg x .
CO 7.0 1.0 -
1078 6.52 3.02 O .96
595 6.36 4.36 1.14
321.5 6.18 6.61 1.40
127.9 5-98 10.05 1.4062.6 5.80 15.8 1.5631.82 5.66 21.9 1-5322.65 5-59 25.7 1 .50
13.21 5.49 32.4 L i 2Mean 1 .4
Bridge same composition as solution in chamber
130.1 6.01 9-77 1.24
47.1 5.76 17.4 1.4318.2 5.55 28.2 1.45
11.5 5.45 35.5 1.46
10.0 5.42 38.0 1.44Mean 1.4

98
the special bridges made with agar, or formed with the aid. of a collodion membrane, were always tested before and after a series of measurements against a normal type solution - saturated potassium chloride bridge, to make certain that they were behaving satisfactorily. The different types always agreed to within a millivolt. It is generally considered that membranes, agar bridges etc. are not suitable for very accurate pH work, but in the present investigation of unbuffered solutions an error of 1-2 millivolts was entirely negligible compared with that caused by a trace of acidic or alkaline impurity.
~/0The average value of Kg for both trials is 1.4 x 10 and may be compared with the theoretical one of whichat 15°C equals 0.46 x 10"'4/1.8 X 10~ =2. 5 x 1 0
AMMONIUM NITRATE.
. The results for ammonium nitrate are given in Table XIII. A trial with a collodion membrane bridge gave slightly lower pH values with the higher dilutions but almost identicalvalues with the more concentrated solutions. Taking the mean
-1 0
value of Kg given by both trials gives 1.4x10 as found for ammonium chloride.
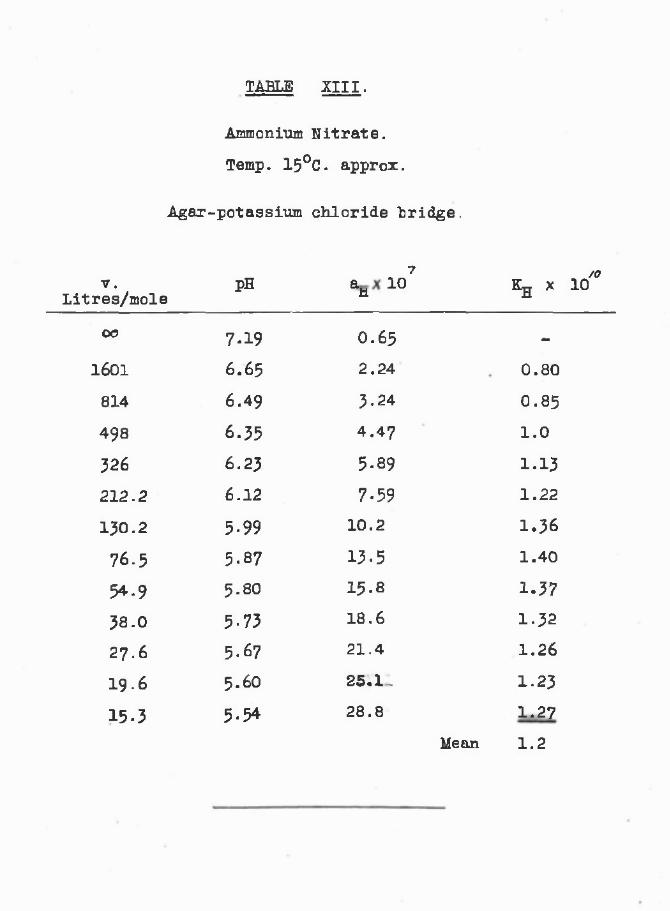
TABLE XIII.
Ammonium Nitrate.Temp. 15°C. approx.
Agar-potassium chloride bridge.
7 /<? v. pH a 10 Ktt x 10Litres/mole M *■
oo 7.19 O .65 -1601 6.65 2.24 0.80814 6.49 3-24 0.85498 6.35 4.47 1.0326 6.23 5.89 1.13212.2 6.12 7.59 1.22130.2 5-99 10.2 1.3676.5 5-87 13.5 1.4054.9 5 .80 15 .8 1.3738.0 5-73 18.6 1-322 7 .6 5-6 7 21.4 1.261 9 .6 5.60 25.1, 1.2315.3 5.54 28.8 1.27
Mean 1.2

99
■AMMONIUM SULPHATE.
Three trials with an agar "bridge gave similar values for Kg. The results for the third trial are given in Table XIV. The average value for Kg of 0.85 X 10 is lower than for the chloride and nitrate, and may "be accounted for by the smaller degree of dissociation of a uni-bivalent salt at corresponding dilutions of the uni-univalent salts. Since a more accurate expression for Kg is given by the expression agv/f^ (see theoretical discussion), it is clear that the more the activity coefficient of the salt ions is removed from 1 the less will be Kg- a . v.
AMMONIUM ACETATE.
A hydrolysis constant cannot be calculated from pH results for a salt of two sided weakness, since the term a . does not enter into the expression, so that the reaction of the solution should be unaffected by dilution. The equilibrium for ammonium acetate is
NH^ + Ac + H20 ^ NH40H + HAc
Since the dissociation constants of ammonia and acetic acid are equal the pH for ammonium acetate solutions should be exactly from the simple expression
pH = -h>Kw + " -h>K£

TABLE XIV.
Ammonium Sulphate.Temp. 15°C. approx.
Agar-potassium chloride bridge.
7v pH a_ x 10Litres /gm equivalent .
00 7.16 0 .6 9
1078 6.55 2.82518 6.35 4.47295 6.23 5.89209.2 6.15 7.08
155 .8 6.09 8.13117 .0 6.04 9.1286 .7 5-98 10.56O .5 5.92 12.042.9 5.86 13 .8
33.5 5-83 14.82 5.O 5-78 16.619.3 5-76 17.41 3 .6 5.72 19 .0
Mean
Kg X 10
0.861.03 1.02 1.051.03 0.97 O .96
0.88 0.82 0.73O .69
0.580.490.85

100
The reaction found experimentally is given in Table XV and is almost constant, indicating that the salt molecules have only a slight effect on the activity of the hydrogen ion. Table XVI may be compared with Table X showing the effect of carbon dioxide, which effect incidentally will be less with ammonium acetate than with salts of strong acids where the buffer action is even less.
For convenience of comparison interpolated values from the smooth graphs of v: pH are given in Table XVT for the four ammonium salts.
The only other work that appears to have been done in establishing a hydrolysis constant for ammonium salts is by
33. a / A 3.
Denham, Hill, and Job. Denham used the hydrogen electrode which as mentioned previously did not give reliable results.
—/OHe found a mean value of 3*1x10 for four concentrations of ammonium chloride over the range v = 2 to v = 32. Hill calculated Kg by passing air through solutions of ammonium salts *at nearly 100°C', and estimating the amount of ammonia evolved by the increase in conductivity of water through which the issuing air passed. The mean value of Kg for the
gthree concentrations used (v ® 1, 5 and 25) was 6.7 x 10
~8for ammonium chloride, and 6.2 x 10 for ammonium nitrate. The method of bubbling air through an ammonium solution can be criticised on the grounds that progressive hydrolysis would be induced, and also that a volatile acid would be

TABLE XV.
Ammonium Ac et at e .Temp. 15°C. approx.
Agar-potassium-chloride bridge.
VLitres/mole. pH
OO 7.042118 7-041280 7.04767 7.04569 7.05
• 476 7-06135 7.08
66.5 7.1241.0 7.1529-9 7.1524.3 7.15

TABLE XVI.
Temp. 15°C. approx.
pH values of ammonium salts at various dilutions in carbon dioxide-free solution.
vLitres /gm.equivalent .
NH4NO-5 n h4ci
10 5.43 5.4220 5-56 5-5650 5-74 5-75
100 5-89 5.92200 6.04 6.07400 6.22 6.24600 6.35 6.36
1000 6.45 6.51©o 7.05 7.0
(nh4 )2so4 c h^.c o2n h4
5-63 7.165-75 7.155-88 7.146.01 7 . H6.14 7.086 .32 7.076.37 7.056.55 7.047.16 7-04

101
evolved as well as ammonia. Job discusses a method whereby the dissociation constant of ammonium hydroxide can be obtained from measurement of the hydrogen ion concentration of solutions of ammonium salts during titration with hydrochloric acid. The hydrolysis constant may then be calculated,
~/0and he obtained the value of 3*7 x 10 for 'various ammonium salts' without specifying the salts or giving any experimental details.
The study of the hydrolysis of ammonium salts isparticularly interesting for the evidence it provides on thestrength of the ammonium radicle. This subject was discussedin a series of controversial articles by different writers
44in the Journal of the Society of Chemical Industry in 1923.The view was expressed by the late Professor Caven that NH40H is an intrinsically strong base in spite of the basic weakness of solutions of ammonia. He considered that ammonium salts are analogous to the salts of the alkali metals, and that the apparent weakness of HH^OH is due to the instability of the NH^ ion in solution. He questioned the existence of undissociated NH^OH and stated that the alkalinity of solutions of ammonia is due to direct action with water, thus
NH + H20 ^ H H 4 + o £ ............... (1)If this is true then the acidity of ammonium salts of strong acids must be due to the reaction
HH4 + H20 HH^ + H^O*..................(2)

102
and. not to the usual schemenh4 + 2h2o ^ nh4oh + h^o*.........................(3)
Unfortunately physico-chemical measurements will not serve to differentiate "between these two reactions.
The hydrolysis results described, however, are consistent with the view that NH4OH is a weak base. If NH4 were a strong basic radicle but unstable in aqueous solution, thealkalinity of solutions of ammonia could be caused by a
, 'small concentration of NH4 and OH ions according to equation (1). In a solution of an ammonium salt, however, where the intrinsic concentration of HH4 ions is enormously greater, one would expect very acid solutions from equation 2.Actually as has been shown the pH value of solutions of ammonium salts permits the calculation of a constant derived on the usual assumption that NH^OH is a weak base as in equation 3- There thus seems little doubt but that NH4OH does exist and that the equilibria in an aqueous solution of ammonia are
+ h 2o ^ n h4o h ^ h h4 + o h '
The method' of treatment described for ammonium salts was used with a number of other salts, the reactions of which are affected by atmospheric contamination. The agar type bridge was used in every case.
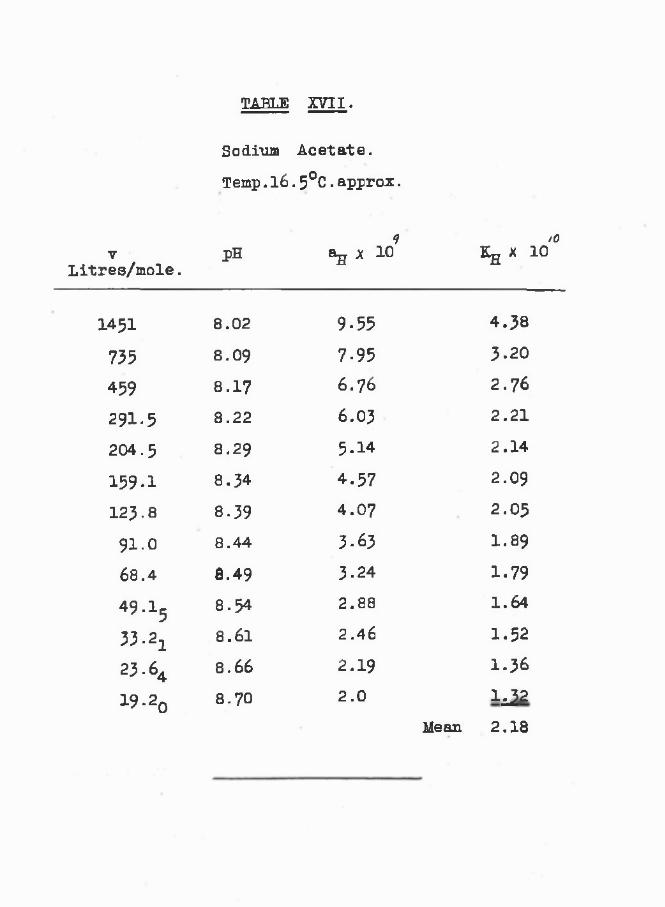
TABLE XVII.
Sodium Acetate.Temp.16.5°C.approx.
7 /0v pH a . x 10 Kg x 10
Litres/mole.
1451 8.02 9-55 4.38
735 8.09 7-95 3 .2 0
459 8.17 6 .76 2 .7 6
291.5 8 .22 6.03 2 .2 1
204.5 8.29 5.14 2.14
159.1 8.34 4.57 2.09123.8 8.39 4.07 2.05
91 .0 8.44 3.63 1 .89
68.4 8.49 3-24 1.7949.15 8.54 2.88 1.6433-2! 8.61 2.46 1.5223.64 8 .66 2.19 1 .3 6
19.20 8.70 2 .0 1 2 Mean 2.18

103
SODIUM ACETATE.
The results for recrystallized sodium acetate are given in Table XVII. Eg is calculated from the expression x /(l-x)v, where x* Since x is very small Kg becomes
Z 2equal to K^ .v/a^. The values for Kjj are probably as constant as can be obtained without knowledge of the activity of the salt. Previous results obtained without removing carbon dioxide from the water gave variable results for Kg ranging from 100 to 1000 times less than the values in Table XVII.The value of at l6.5°C equals 2.8 X 10
ZINC SULPHATE.
The hydrolysis of zinc sulphate has been studied bya. b
several workers. Kolthoff and Kameda using a brightplatinum hydrogen electrode,prepared specially for use inunbuffered solutions, found that the first stage hydrolysispredominates according to the equation
Zn’+ H20 Zn • OH + H'Their Kg is calculated from the expression a^/a^..
45-using values obtained by Bray for the activity of the Zn" ion in solutions of zinc sulphate. The activities found by Bray and later by Cowperthwaite and La Mer are shown in Table XVIII

TABLE XVIII.(a) The activity coefficient of zinc sulphate.
m. Mean activity coefficientMoles/litre. Bray La Mer.
0.0001 0.907 -0.0005 0.803 0.7800.001 0.734 0.7000.002 0.650 0.6080.005 0.519 0.4770.01 0.421 0.3870.02 0.324 -
0 .05 0.220 -0.08 0.176 -0.1 0.161 —
(b) The reactions of solutions of zinc sulphate.
v. pHLitres/ -------------------------- , « , ,mole. K and K. Q D and M. a ^ v x 10 ^ /aZn x
100 6.00 5-52 5-09 10 2.4050 5-89 5-30 5.21 8 2.6020 5.76 5-03 5.30 5-8 2.7610 5.67 4.80 - 4.6 2.844 5-26 - 1.2 -2 5-08 4.28 - 1.4
K and K Kolthoff and Kameda.Q Quintin.D and M Denham and Marris.

104
to show how greatly the activities of the ion differs from the concentration of the salt. The agreement between the values found by different workers and the latest calculated values is not good, and there is still considerable doubt about the accuracy of experimental activity coefficients, especially for other than uniunivalent salts.
Table XVTIIb is taken from Kolthoff and Kameda’s paperand shows the experimental pH values obtained by different
4*7workers. Quintin’s solutions, using a quinhydrone electrode, are more acid than those of Kolthoff and Kameda, due the latter workers suggest, to a trace of acid in his salt. The
2 3pH values obtained by Denham and Marris fall with dilution, due undoubtedly to the presence of carbon dioxide whichcaused the haphazard results obtained by the writer (Table XI).
2.The values of a^v obtained in the present work for the recrystallized salt are given in Table XIX. It will be noticed that the solutions were more alkaline than those of other workers due probably to the complete removal of carbon
a.dioxide. The values of a^.v for Kolthoff and Kameda’s results are given in column 5 of Table XVIIIb and their value for Kg using the activity results of Bray in column 6.

T A B L E XIX.
Zinc Sulphate. Temp. 16.5°C. approx.
v. pHLitres/mole.
1820 6.921052 6.80528 6.65
356 6.55203.9 6.41134.3 6.32
97.3 6.25
73.2 6.16
48.5 6.06
34.6 5.97
25.5 5.90
21.5 5.86
18.1 5.82
ag x 107 Kg x 10
1.20 2.641-59 2.652.19 2.652.82 2.933.89 3-094.79 3.075-62 3.086.92 3.518.71 3.68
10.7 3.9512.6 4.0513 .8 4.1015.1 4.10
Mean 3 • 3

105
POTASSIUM CHROMATE.
Potassium chromate reacts alkaline owing to weakness of chromic acid. The experimental results show that of the two following reactions the second is predominant.
Cr 0^ + H20 ^ H Cr O4 + Oh!.................. (1)
Cr O4 + 2H20 ^ H2Cr 04 + 20H.................. (2)
Equation (2) gives x = aQHy/2 = \v/2ag, so that Kg equals3 3. 3 34x / (l-x)v which becomes K^.v/2ag as x is so small.
A number of different values have been given for thefirst and second ionization constant of chromic acid. The
- /most recent and probably the most accurate are 1 .8 x 10-7 vsand 3 .2 x 10 obtained by Neuss and Rieman using the glass
electrode. Hence K^/Ka= 0.5x10 /0.18 = 2.78 x 1(J at 16°C.~ /4The mean value for Kg found by experiment is 3 .9 x 10 as
shown in Table XXa. The values of Kg found previously inthe presence of a trace of dissolved carbon dioxide varied
- / $ ■from 10 to 10 .
POTASSIUM DICHROMATE.
Potassium dichromate gives a distinctly acid reaction in aqueous solution so that the presence of atmospheric carbon dioxide does not affect the reaction. This salt was therefore

TABLE XX.
(a) Potassium Chromate.Temp. 16°C. approx.
_ . ▼> , PH a_ * 10 ° * lo'*Litres/mole. iL
2710 8 .6 5 79.4
1218 8 .81 1 5 .5 2 .03
600 8.95 1 1 .2 2 .6 7
302 .1 9 .0 8 8 .32 3 .2 7
160.0 9 .19 6.46 3 .7 0
91.0 9.30 5.01 4.5155-8 9-38 4.17 4.7935.4 9.45 3-55 4.9414.2 9-58 2.63 4.8910.6 9.62 2.40 4 .7 8
Mean 3 .9
(b) The reaction of potassium dichromate solutions.v. 10 50 100 250 500 1000
pH 3 .8 6 4.10 4.22 4.37 4 .5O 4.63.

106
examined by the original method without first removing carbon dioxide from the water. It is dealt with here toallow of comparison with potassium chromate.
so,s/.Numerous workers have found evidence of the presence of Cr04 ions in dichromate solutions which are formed in the reaction:
Cr207'+ H20 2H Cr 04 .................... (1). -aThe constant for this reaction is given as 1.6 x 10 by
It? - xSherril and 2.3*10 by Neuss and Rieman. The acid reaction of potassium dichromate is due then to the dissociation of the H Cr 04 ion which dissociates thus, -
H Cr 04^ H ' + Cr 04 ........................ (2)
From equations 1 and 2 it can readily be shown that an M/10 solution of potassium dichromate has a reaction of approximately 3-9 ^y assuming that the concentration of the Cr20y ions is approximately 0.1. The experimental pH values are given in Table XXb. No difficulty was experienced, as was expected, in obtaining reproducible results at these low pH values. The glass electrode is the only electrode suitable for examining this salt.
rqnniDM OXALATE.
The experimental results show that the first stage hydrolysis predominates in solutions of sodium oxalate, the

TABLE XXI.
Sodium Oxalate.
Temp. 16°C.approx.
v. pH aj, Kp x 10/0Litres/mole. M &■
482' 8.25 5.63 3.81248 8.40 3-98 3.92144 8.52 3.02 3.9693.5 8.63 2.34 4.2567-7 8.72 1.91 4.6427 .8 8.92 1.20 4.83
Mean 4.2

107
* aexpression Kg = K^ .v/ag where x = ftgg'V giving an average- / ovalue of 4.2x10 , see Table XXI. The second dissociation
-e -/oconstant of oxalic acid is 4.9x10 so that K ^ ^ ■ 1.0x10.
SODIUM BICARBONATE.
It has been shown in the theoretical section that according to the laws of hydrolysis the reaction of an acid salt of a weak acid should remain practically constant for different concentrations, providing the first ionization constant of the weak acid is small. Sodium bicarbonate was examined in the way adopted with other salts having a reaction near to neutrality, although the effect of dissolved carbon dioxide should be less for this salt as the inflexion at the first equivalence point of carbonic acid is not very marked; in other words this salt is better buffered than the others treated which give a pH near to 7- Normal hydrolysis does not occur with this salt. The pH results are given in Table XXIIa and graphed against v in Pig. 3. The graph shows that the pH rises rapidly as v increases to about 100 and thereafter is constant at 8.62. A second trial gave a curve of exactly similar shape. The rise in hydrogen ion activity at the higher concentrations is very probably due to the effect of the salt molecules. According to the expression [H-]* /^K^given previously, where K -j and K2 are

800 mtootootoo
Fig. 3.Curves of pH against v for solutions of sodium bicarbonate and potassium chloride.

TABLE XXII.
Temp. 18°C.approx.
(a) The reaction of solutions of sodium bicarbonate.
(b) The reaction of solutions of potassium chloride.
la) (b)V
Litres/mole pHV
Litres/mole PH
955 8.62 1149 7.05463 8.62 468 6.96
252.5 8.62 162.3 6.83175 8.60 96 .1 6.81116 8.59 62.8 6.7473.0 8 .56 38.0 6.69
53.0 8.54 21.75 6.6134.2 8.51 15.51 6-5521.6 8.46 10.50 6.47
13.98 8.43 6.45 6.3710.28 8.40 4.61 6.31
7-95 8.37 4.0 6.263.26 6.20
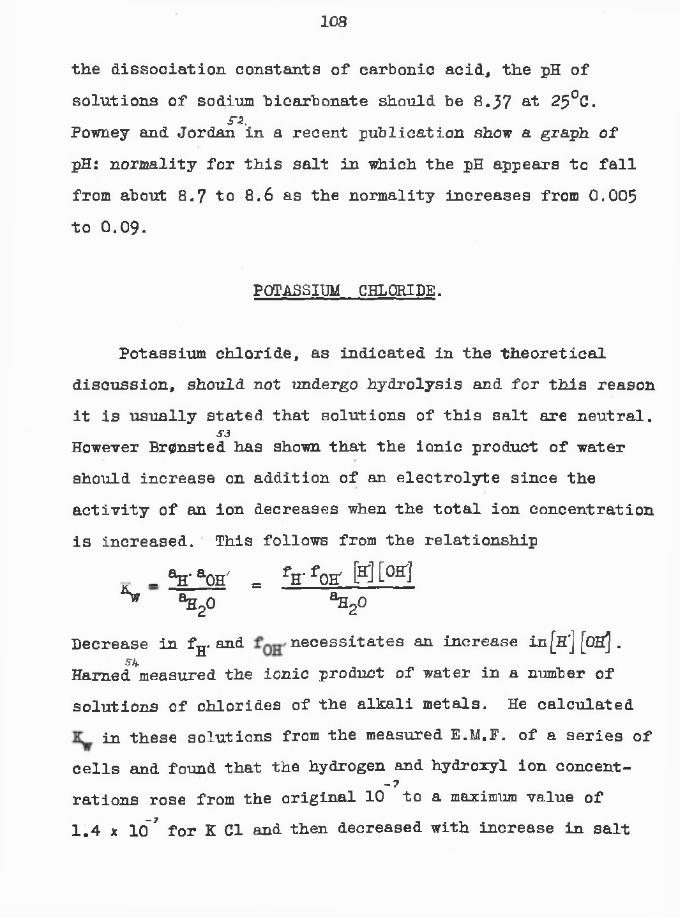
108
the dissociation constants of carbonic acid, the pH of solutions of sodium bicarbonate should be 8.37 at 25°C.
S'*.Powney and Jordan in a recent publication show a graph of pH: normality for this salt in which the pH appears to fall from about 8.7 to 8.6 as the normality increases from 0.005
to 0 .09.
POTASSIUM CHLORIDE.
Potassium chloride, as indicated in the theoretical discussion, should not undergo hydrolysis and for this reason it is usually stated that solutions of this salt are neutral.
S3However Br0nsted has shown that the ionic product of water should increase on addition of an electrolyte since the activity of an ion decreases when the total ion concentration is increased. This follows from the relationship
. °H- a0H' = fH- fosr M [°g ]^ ®H20 ^ 2 °
Decrease in f0. and necessitates an increase in[H'] [OH] .5'h.Hamed measured the ionic product of water in a number of
solutions of chlorides of the alkali metals. He calculated in these solutions from the measured E.M.P. of a series of
cells and found that the hydrogen and hydroxyl ion concent-- 7
rations rose from the original 10 to a maximum value of1.4 x 10™7 for K Cl and then decreased with increase in salt

109
concentration. The maximum for K Cl occurs at a salt concentration of about 0.4. This represents a pH of about6 .9 .
A study of the reaction of solutions of potassium chloride is of course an even more delicate operation than with any of the salts already dealt with because it is devoid of all buffer action. The usual procedure was followed.The AnalaR salt was recrystallized twice from conductivity water and carefully drained free of mother liquor in the usual fashion, but of course neither acid nor alkali were added in this case, nor were the crystals washed with alcohol and ether - since hydrolysis is absent this precaution is unnecessary, and it was desired to allow as few reagents as possible to come into contact with this salt. The dry crystals were transferred to a petri dish inside a desiccator containing fused caustic potash (AnalaR.). The salt was heated for several hours at 110°C before use.
The results are recorded in Table XXIIb and graphed inPig. 3 . It is seen that the pH falls rapidly at higher
ssconcentrations than N/100. Ellis and Kiehl recorded similar results using a special glass electrode referred to later.
S 6Kolthoff and Kameda obtained erratic results with a 0.05 M solution of this salt using hydrogen electrodes bearing a very thin coating of bright platinum for use in unbuffered solutions - the work was very tedious incidentally as the electrodes had to be cleaned and replated for each set of

110
measurements.It is uncertain whether the rapid fall in pH at the
higher concentrations is real or due to impurities present in the salt after ordinary careful recrystallization. The question could only be settled by preparing absolutely pure salt and water and taking every precaution against contamination from the vessels, electrodes, and atmosphere. The care to be devoted to such an experiment would require to be as great as, or probably greater than that given to an atomic weight determination. If the reaction of such a salt is ever exhaustively studied there is little doubt that the glass electrode will be the medium.
The values of Kg measured in this section for a number of salts are not constant - without a knowledge of activity coefficients this could not be expected. The average value obtained for a number of concentrations of a salt is alwaysclose to the value of K,/Ka or as the case may behowever. In the case of di-acid or di-basic salts Kg showsvery clearly whether the hydrolysis is a first or secondstage one. In cases where is not known the results permit its calculation from the approximate relationship ^ “ K^/Kg see Table XXIII. The values for Kg obtained show that the
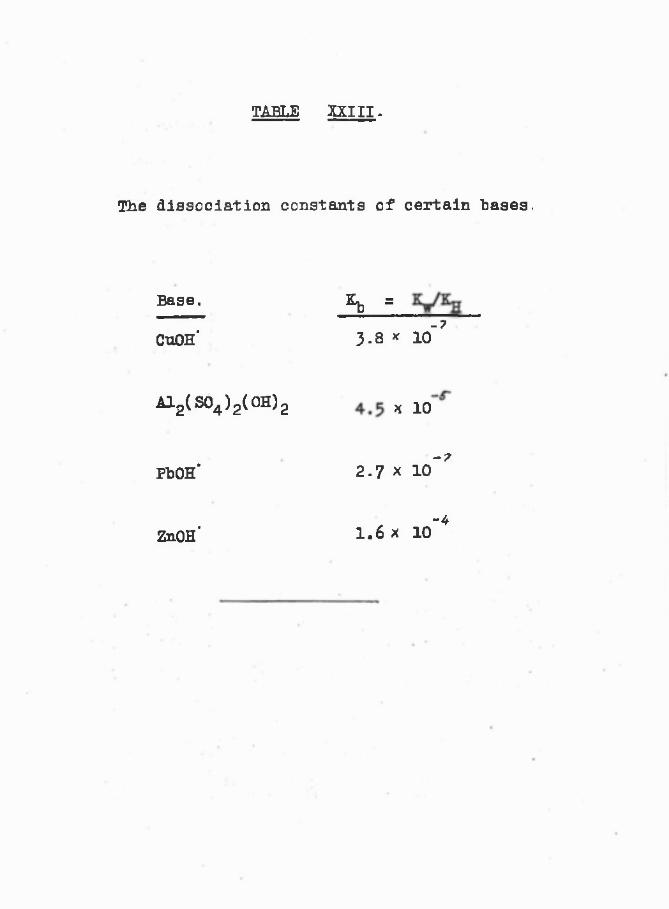
TABLE XXIII.
The dissociation constants of certain bases.
Base. Kjj a- 7
CnOH* 3-8 * 10
A12(S04 )2(0H)2 x 10
— 7
PbOH' 2.7 x 10
-4ZnOH* 1.6 x 10

Ill
theoretical hydrolysis laws are obeyed in practice, and that the disturbing influence of secondary reactions, and the formation of colloidal 'pseudo-solutions’ is negligible in most cases. The glass electrode has proved very suitable for use in poorly buffered solutions, and in many cases was the only electrode that could have been used with accuracy.
The pH of pure water has been the subject of some discussion of recent years and it seemed appropriate to carry out an investigation of this subject as a final experiment to the work on hydrolysis.
SECTION III.
THE -pH OF WATER.
The ionic product of water has been found to be of the order of 10 'h at room temperature by a variety of indirect experimental methods, the great majority of workers having derived from experiments with solutions of electrolytes. Until 1920 the classical experiment of Kohlrausch and Heydweiller on the conductivity of water constituted the only experiment performed on pure water itself. In calculating K . from their conductivity results however they made use of the ionic mobilities of H' and OH', and there seems no a priori reason for supposing that mobilities measured in the presence of electrolytes will hold in pure water. The obvious method of measuring the hydrogen ion concentration of pure water by means of an electrode presents certain difficulties, due notably to its complete lack of buffer action and its high electrical resistance which renders the use of an ordinary potentiometer impossible.
S'SBeans and Oakes were the first workers to experiment on pure water itself. They measured its pH value with a hydrogen electrode and overcame the resistance difficulty by allowing the E.M.F. of the cell when out of balance to charge up a calibrated condenser, which could be discharged

113
through a ballistic galvanometer. The water used was distilled from alkaline permanganate solution which method they claim gave reproducible results, whilst distillation from phosphoric acid did not. It was found essential to work in a room free from acid fumes. A reaction of 7-91 at 25°C was obtained, and Beans and Oakes claim that this value ismore accurate than previous results obtained indirectly.
2.Z.Kolthoff and Kameda using refined technique found by means of indicators that water has a pH value of 7, but of course this value was necessarily obtained in the presence of electrolytes.
The glass electrode possesses obvious advantages for an investigation of the reaction of pure water. A description has been given of how the pH value of water rises to about 7 after bubbling carbon dioxide-free air through it for an hour. If the stream of air were continued, however, the pH continued to rise very slowly. After passing the air for a further 4-5 hours the pH attained a steady value which was unaffected by the passage of more air. The final pH varied from 7.9 to 8.1 for many trials. These limits were not exceeded even if the stream of air were continued for a further 8 hours. It was customary to follow the course of the purification by taking readings at intervals. In order to ascertain whether contamination from the agar bridge was occurring during the few moments it was in contact with the water this procedure was occasionally deferred, and a reading

114
was not taken until it was judged that the final pH had been attained. The pH recorded immediately on lowering the bridge agreed with the previous results and showed that the high pH value was not due to impurity from the bridge. It was also desirable to test whether water distilled in glass apparatus would give the same result. Accordingly the conductivity water was distilled in an all Pyrex apparatus, a small amount of AnalaR caustic potash and potassium permanganate being added to the distilling flask. The first and last fractions of distillate were not collected and a copious escape of uncondensed steam was maintained. The final reaction of this sample of water after removal of carbon dioxide was within the limits obtained for the ordinary conductivity water from the Boaasfield still.
Identical results were obtained by bubbling purified nitrogen instead of air through the water, showing that the results were in no way connected with the use of the latter gas as the means of removing carbon dioxide. The final result was thus in agreement with that obtained by Beans and Oakes, who, by using hydrogen electrodes, would automatically have removed any carbon dioxide present. It may be remarked that there is no theoretical objection to the ionic product of pure water being different from that
S3of water containing an electrolyte. Indeed Brjztasted has predicted that such would be the case due to the decrease in

115activity of an ion on increasing the total ionic concentration.Again the possibility that the alkaline reaction was due toalkali dissolving from the glass of the containing vesselor electrodes seems to be excluded by the fact that the finalreaction was only 0.1 of a pH higher after standing in theelectrode chamber for three days. That a trace of ammoniamight be responsible for the alkalinity was consideredunlikely since it seemed probable that this gas would beremoved together with the carbon dioxide. This assumption
sswas wrong however as has been shown by Ellis and Kiehl in a paper recently brought to the writer's notice. They have studied the reaction of water by means of the glass electrode and find a similar rise in pH on bubbling pure air through water. The glass electrode used by these workers consisted of a tube down which the distillate ran from a special still - pure air was kept passing through the water in the distilling flask, and up the vertical condenser connected to the glass electrode unit. A calomel electrode dipping into the water running through the glass electrode, and one connected to a solution on the outside of the electrode completed the cell chain. It is not stated whether the calomel electrode arm in contact with the flowing distillate would introduce impurity or not. Ellis and Kiehl claim that ordinary conductivity water contains a trace of ammonia which is not removed by the passage of air. A systematic examination of the various reagents used in the prepartion of conductivity

116
water, showed that phosphoric acid was the only one to retain this impurity and to give reproducible results (in contrast to Beans and Oakes who did not get good results using this reagent). They record a pH value of 6.94 -7.14 at about 28°C. using ordinary soft glass for their electrodes, - they state that Coming 015 glass dissolves and gives a rise in the pH of distilled water of 1 unit per hour; they do not state the behaviour of the glass they finally use however. No such rise has ever been observed with the sample of glass used in the present work.
The writer decided to measure the reaction of the water, after precautions had been taken to remove ammonia, to see if the values found by Ellis and Kiehl could be obtained with normal type glass electrodes. Conductivity water, to which about a gram of pure orthophosphoric acid had been added, was distilled in the Pyrex apparatus shown in Pig. I. (the acid was first heated toabout 150°C for several hours to drive off any volatile impurities). The solution was boiled in flask A, and steam allowed to escape from the end of the condenser for some time, before fitting flask B, in order to drive all the air from this unit. A copious stream of pure air was passed through flask B before connecting up and subsequently,the air stream entering by means of the adaptor and siphon tube. When it was desired to run off some distillate the cooling water in the condenser was shut off, and the steam pressure allowed to force the

Pig. 1.Apparatus for distil H a g and collecting vater without contamination from the atmosphere.

117
distillate through, the siphon tube, the tapered air outlet being temporarily closed. Meanwhile purified air was passed through the electrode chamber to which an adaptor similar to that in Fig. 1. had been fitted. When ready this adaptor was unstoppered and connected to the end of the siphon tube. In this way the ammonia free distillate was added to the electrode chamber without ever coming into contact with the atmosphere. A siphon tube fitted to the electrode chamber permitted this vessel to be emptied without removing the lid or discontinuing the flow of pure air. Both the electrode chamber and the receiving flask B were emptied several times by this method before a sample of water was used for a measurement. Note:- Entrainement of water particles during distillation was prevented by inserting a disc of pure tin in the neck of the distilling flask. The disc bearing four prongs was cut from a piece of thick metal. A large number of very small holes were made obliquely in the disc which was held in place by spreading the prongs after fitting in position. This device was completely satisfactory. A test with glass wool - which might have been used for this purpose - showed that hot water in contact with it soon became alkaline (pH 10).
Water obtained in this way attained its approximately final pH ten minutes or so after introduction to the chamber, though bubbling was continued for an hour or so to make certain that the temperature of the water had attained that

TABLE XXIV.
The pH of conductivity water from which ammonia and carbon dioxide have been removed.
Temperature °C .
17-517.518 .5
18 .5
18 .5
18 .5
19.019.019.020 .0
Theoretical pH
7-127.127.107.107.107.107.09 7-097.09 7.08
Measured pH
6.976.977.04 6.916.946.947.107.15 6.70
Mean 7.0

118
of the room. A number of results are given in Table XXIV.The theoretical pH values were obtained from International Critical Tables and represent the best published results obtained by indirect methods. It will be seen that out of ten experiments seven distillations gave water with a reaction between 6.9 and 7 -1-
It thus appears that distillation from phosphoric acid does give the purest water from the aspect of possessing a reaction near to 7, that the alkaline reaction of 8, obtained by Beans and Oakes and formerly by the writer, was due to the presence of ammonia. The almost constant results - considering the difficulties of dealing with such an unbuffered liquid - which were obtained, seem to indicate that ammonia is held back by distilling from phosphoric acid, though it seems rather surprising that the traces of ammonia are not present as salts of organic acids or volatile mineral acids; in which case the acid would of course be evolved on distillation.
No indication of the rapid solution of Corning 015 glass alleged by Ellis and Eiehl was observed, and further, it is apparent the normal bulb type of electrode can be used successfully in unbuffered solutions. It is possible that the long seasoning in water before -use accounts for this fact - the electrodes were kept in water for several months before use, and those used in the above measurements had been in use for three months in general hydrolysis work previous to

119
the experiments with water.The work on the pH of water provides evidence that
glass does not dissolve appreciably in water as is often23assumed - both Denham and Marris, and Kolthoff and Kameda,
the latter using Pyrex glass, found no increase in alkalinity in solutions of zinc sulphate on standing in glass for long periods. The writer suggests that evidence apparently pointing to the solution of glass may have been wrongly interpreted. Thus a number of substances cannot be kept in glass vessels without undergoing change. Benzoin for example is racemised by alkali, and since it is racemised in glass vessels it is concluded that the glass dissolves. It seems quite possible, however, that this is due to the catalytic effect of the undissolved alkali at the
glass surface.

■mre IONIC PROPERTIES OF MIXED ACIDS.

SECTION IV.
THE CHEMICAL UNION OF ACIDS WITH ONE ANOTHER.
The modern conception of an acid as a substance which will yield a proton to an acceptor called a base, has enormously increased the range of substances included in the terms acid and base. It is now recognised that only the hydrogen ion or proton is unique in acid - base
equilibria, and that basic properties are possessed by many substances other than the hydroxyl ion. Whetner a substance, molecule or ion is to be regarded as an acid, depends on whether a base is present to accept the proton. Since HAc, NH4 , H2O, H3O* and HSO4 are all potential proton donors, they can act as acids from Br^nsted's definition, while H20, Ac^ HH3 and S04* being proton acceptors, can act as bases. Water acts as an acid on dissociating but as a base when it forms the 1oxonium ion’. The presence and production of water is only incidental to neutralization. Hall and
Conant have shown that dry hydrogen chloride gas is neutralised by dry sodium acetate, just as aqueous solutions of hydrochloric acid and caustic soda neutralize each other.
Revision of the terms acid and base shows that given a suitable environment, a substance formerly considered an
acid may act as a base, and vice-versa.
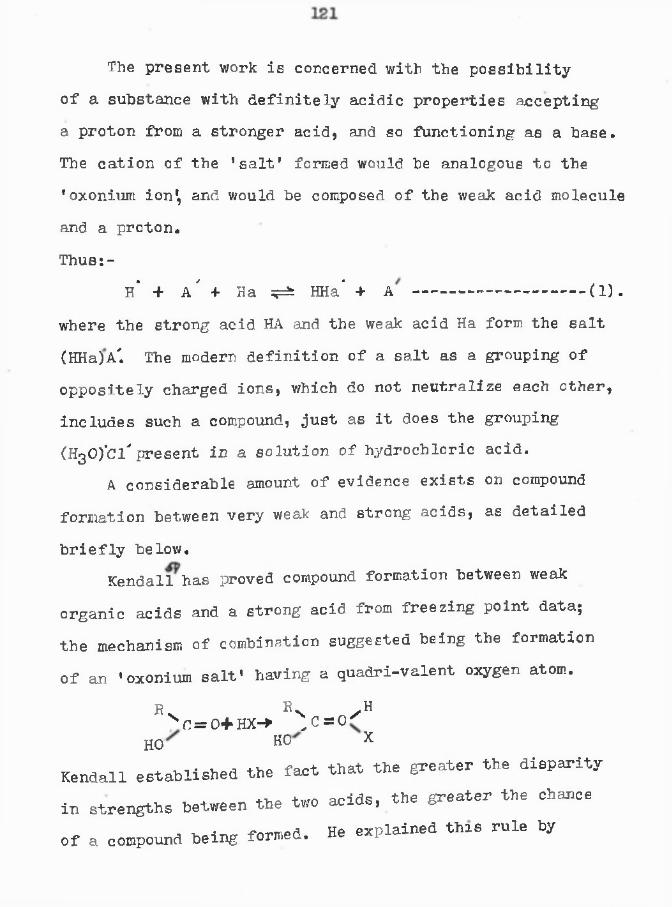
The present work is concerned with the possibility of a substance with definitely acidic properties accepting a proton from a stronger acid, and so functioning as a base. The cation of the ’salt* formed would be analogous to the 'oxonium ion', and would be composed of the weak acid molecule and a proton.
Thus:-H* + k' + Ha ^ HHa' + k ------ (1).
where the strong acid HA and the weak acid Ha form the salt (HHa)A’l The modern definition of a salt as a grouping of oppositely charged ions, which do not neutralize each other, includes such a compound, just as it does the grouping (HgO/ci*present in a solution of hydrochloric acid.
A considerable amount of evidence exists on compound formation between very weak and strong acids, as detailed
briefly below.Kendall has proved compound formation between weak
organic acids and a strong acid from freezing point data;the mechanism of combination suggested being the formation
of an 'oxonium salt' having a quadri-valent oxygen atom.
Rv RN .HV = 0+HX-> ,C=0'
HO HO XKendall established the fact that the greater the disparity in strengths between the two acids, the greater the chance of a compound being formed. He explained this rule by

122assuming that the oxygen atom of the weak organic acid
has basic properties, which are revealed only when a. strong
acid is added to reduce the acidic properties of the weak6,0.
acid. King and Walton, also using the freezing point method,have shown that orthophosphoric and sulphuric acids formequi-molar 'oxOnium' compounds with many organic substances;sulphuric acid the more readily owing to its greater strength.
61.Knox and Richards used a solubility method to show
compound formation between weak organic a.cids and a strongacid. This method has been further studied by Kendall and
62Andrews, who also describe conductivity measurements, confirming in the main the solubility results, and by Walton and Kepfer, who used, phosphoric acid as the strong acid. In this method, the solubility of the weak acid in solutions of
increasing concentrations of the strong acid is measured.The initial decrease in solubility, due to addition of a common ion, stops at high concentrations of the strong acid, and thereafter the solubility increases, due it is claimed toformation of a compound, which does not form in dilutesolutions due to hydration of the solute acid.
The mechanism of combination dealt with by the writer
is that pictured in equation (1), as distinct from formation of ’oxonium' compounds by very weak organic acids. The reaction could occur theoretically whenever the weaker acid has a lone pair of electrons, which could be shared, with a

123proton. The chemical nature of the weaker acid, molecule
decides whether the union will occur in practice. The
anions CIO4 , SO4 and PO4 have similar atomic and electronic configurations, but show very different affinities for protons. The difference is not completely accounted for by the different charges on the ions, as is revealed when we compare the similarly charged anions CIO4 , HSC^' and H2P04' by means of the 'degree of ionization' of the corresponding acid. The 'degrees of ionization', calculated from conductivity data of perchloric, sulphuric and orthophosphoric
acids, are 0-88, 0-57 and 0*17 respectively, in half normal solutions. These figures show that the perchloric anion has little affinity for a proton, whereas the di-hydrogen phosphate anion has marked affinity. The chemical nature of the orthophosphoric acid molecule thus favours combination with a proton, as does the high degree of symmetry of the resulting cation P(0H)4 , formed by the addition of one proton. It is hardly to be expected that such a compound between phosphoric acid and hydrochloric acid could be isolated in the pure state, but evidence of its existence is furnished by departure from the law of mixtures, when the
physical properties of the mixed solutions are examined.Data on the conductivities of mixtures of hydrochloric acid
Ml**and phosphoric acid already existed. It was decided to investigate the hydrogen ion concentrations of such mixtures,

and to see what general principles could be drawn from both observations. The direct action of dry hydrogen chloride gas on pure phosphoric acid was also studied.
EXPERIMENTAL PROCEDURE.
The pH values of solutions consisting of (a) HC1 of fixed concentration (viz. 0 25 M, 1 M, 2 M and 3 M) in the presence of varying amounts of H3PO4 ; and (b) 1 M solutions of H3PO4 in the presence of varying amounts of HC1 were measured. Values were also obtained from H2SO4 and for HC104 in the place of H3PO4 in the above schemes. It is emphasized that one acid was not merely added to another, but was substituted for an equal volume of water present in a solution of the other, the concentration of the latter acid
thus remaining unaltered.An exhaustive trial using Morton's glass electrode -
t>6saturated calomel electrode combination for this work,showed
that consistent results could not be obtained at the low pH values of these solutions. In addition, the Harrison electrometer employed for these glass electrode experiments has several defects in design and is not at all sensitive. The hydrogen electrode is obviously unsuited for use in solutions
containing a volatile constituent.
Accordingly, the pH values were measured with the
quinhydrone - N/^q calomel electrode combination, using a
Tinsley's Vernier Potentiometer. The vessel containing the solutions to be measured was connected by a bridge (bearing a stop-cock) of saturated potassium chloride solution, to a beaker of the same salt solution into which dipped the N/1Q calomel electrode arm. For solutions of perchloric acid, the potassium perchlorate, was replaced by saturated ammonium nitrate solution. The bridge solution was renewed for each reading. The pH limits for which the quinhydrone electrode functions as a perfect hydrogen electrode are narrow, and at the low pH values of the solutions used the absolute pH
values are probably slightly high. Measurements with the quinhydrone electrode were always reproducible, and frequent tests with HC1 - KC1 buffer solutions,of pH 1*6 and 2*0,
showed that the pH readings were only about 0-03 above the true values. In any case, relative rather than absolute values for the different acids were the main consideration in this investigation. Acid solutions of the concentration used are well buffered, and elaborate precautions against contamination, necessary when dealing with pure salt solutions,
were not required.
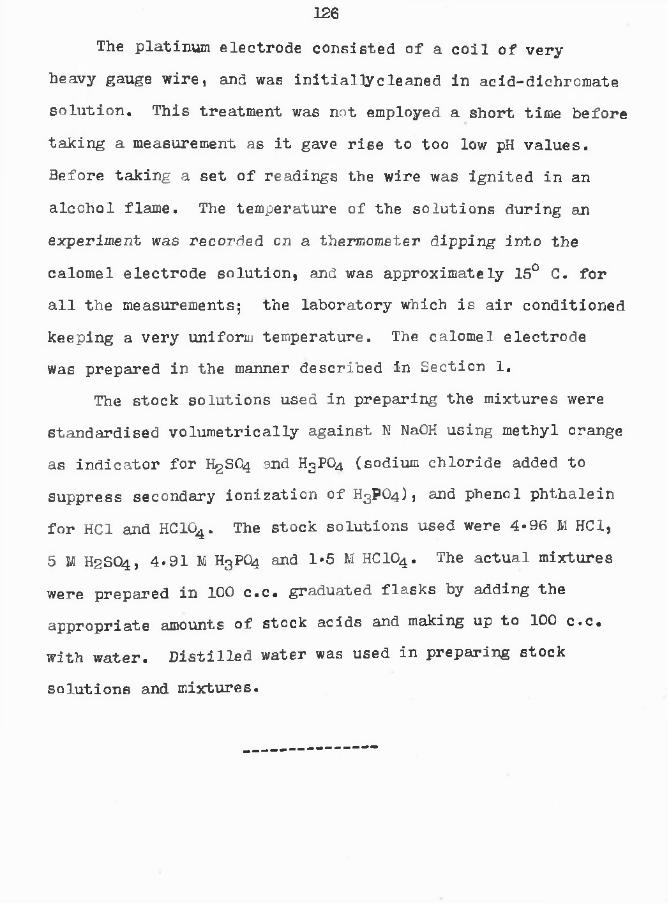
126The platinum electrode consisted of a coil of very-
heavy gauge wire, and was initially cleaned in acid-dichromate solution. This treatment was not employed a short time before taking a measurement as it gave rise to too low pH values.
Before taking a set of readings the wire was ignited in an alcohol flame. The temperature of the solutions during an
experiment was recorded on a thermometer dipping into the
calomel electrode solution, and was approximately 15° C. for all the measurements; the laboratory which is air conditioned keeping a very uniform temperature. The calomel electrode was prepared in the manner described in Section 1.
The stock solutions used in preparing the mixtures were standardised volumetrically against N NaOH using methyl orange
as indicator for H2SC>4 and H3P04 (sodium chloride added to suppress secondary ionization of H3PO4), and phenol phthalein for HC1 and HC104 . The stock solutions used were 4*96 M HC1,5 M H2SO4 , 4*91 M H3PO4 and 1*5 M HCIO4 . The actual mixtures were prepared in 100 c.c. graduated fla.sks by adding the appropriate amounts of stock acids and making up to 100 c.c. with water. Distilled water was used in preparing stock
solutions and mixtures.

127
DISCUSSION OF RESULTS.
The results given in Tables 1, 11, 111 and IV can best be interpreted in graphical form. As is seen from Figures 1, 2 and 3, substitution of H3PO4 , H2S04 or HC104 in place of water in an HC1 solution.always yields solutions of lower pH value. The more concentrated the HC1 solution, the less decrease in pH value as the amount of H3P04 , H2S04 or HC104 is increased. The effect is greatest with the moderately weak H3PO4., less with H2S04, and least with the strong HCIO^ as would be expected. To illustrate the point, it will be seen from Figure 1. that while the addition of H3P04 to 0'25M. HC1 causes an appreciable increase in hydrogen ion concentration, the effect with 3M HC1 is negligible. Two possible reasons for this are suppression of ionization of the acids due to addition of a common ion, and the flattening of the pH: [H] curve at low pH values. The latter explanation is not the cause since it does not occur in the case of HC104 at lower pH values. Examination of the conductivities of these solutions, shows that mere suppression of ionization is also insufficient to account for the almost horizontal graph given
by the stronger solutions of HC1 in figure 1. The specific conductivity of hydrochloric acid solutions weaker than
normal increases when some of the water is replaced by phosphoric acid^' This is of course in agreement with the

TABLE I.
Change in pH value when water in 0.25N, N, 2N and 3N HC1 is replaced by an equal volume of phosphoric
acid solution.
pH of mixtureMolar —Concentration 0.25N N HCl 2N HC1 3N HCl of H^P04 HCl
0 0.77 0 .11 -0.10 -0 .2 5
0 .2 5 0.73 - - -
0.5 0.68 0.08 -0.11 -0.25
1 .0 0.63 0.07 -0.13 -0.25
1.5 0.58 9 mm -0.14 -0.272 .0 0 .52 0.05 -0.14 -0.283 .0 0.42 0.03 -0.20 -
4 .0 0.35 -0.04 - -

0.2SA/HCy
, n h c /
anfffO
----- J}/V /7 C/
Mo/es tyPQ Fig. 1.
The pH value® of solutions containing fixed quantitiesof hydrochloric acid and varying anounts of phosphoricacid.
TABLE II.
Change in pH value when water in 0.25N, N and 2fl HC1 is replaced by an equal volume of sulphuric acid
solution.
Molar pH of Mixture.Concentration -----of H2S04 0.25N HC1 N HC1 2N HCl
0 0.77 0.11 -0.100.25 0.44 0.03 -0.160.5 0.29 0 -0.201.0 0.10 -0.13 -0.271.5 -0.04 -0.20 -0 .30
2.0 -0.15 -0.27 -0.355.0 -0.25 -0.32 -0.574.0 -0.36 -0.35 -

2N//C/ _ J- 0 4
Fig. 2.The t>E values ©f solutions containing fixed quantitiesof hydrochloric acid and varying amounts of sulphuricacid.

TABLE III.
Change in pH value when water in 0.1N, 0.25N and IN HC1 is replaced by an equal volume of perchloric
acid.
MolarConcentration ---------of HC104 0.1N HC1
0 1.06
0 .2 5 0.540 .5 0.330 .7 5 0.191.0 0.071 .25 -0.02
pH of Mixture.0.25N HCl 1.0N HC1
0.77 0.110.38 00.22 -0 .09
0.10 -0.140 -0.20
-0.07 -

0-7
0-/
Fig. 3.The pH values of solutions containing fixed quantitiesof hydrochloric acid and varying amounts of perchloricacid.

increase in hydrogen ion concentration noted here, but for
solutions stronger than normal with respect to HC1 replacement
of the water present by H3PO4 causes a decrease in conductivity. The rapid fall in specific conductivity of solutions twice and thrice normal with respect to HC1, as the concentration of
H3P^4 increases, points to a decrease in the number of ions present, a decrease which would result in a corresponding decrease in hydrogen ion concentration, i.e. an increase in pH. Actually as Figure 1. shows, a slight decrease in pH value occurs for these solutions.
The apparent anomaly that the conductivity and hydrogen ion concentration change in opposite directions, can be explained if a compound is formed according to equation (1).In this scheme some of the protons from the hydrochloric acid combine with the undissociated phc^)horic acid molecule, instead of combining with water molecules to form the usual H3O' ion. Thus:-
H3PO4 +■ H+- Cl"— > (H4PO4 )' +• Cl'.The formation of such a salt like compound would cause
a fall in specific conductivity, due to the lower mobility of the compound cation compared with the fast moving H30 ion which it replaces. The complex cation may, however, act as a hydrogen ion towards a hydrogen (or equivalent) electrode, just as does the H3O* complex, which is the unit implied when the hydrogen ion is referred to. If this does occur, and

there seems no fundamental reason why it should not, replacement of water in hydrochloric acid solutions by phosphoric
acid would cause a decrease in specific conductivity, but an increase in hydrogen ion concentration; an increase which would be least apparent in more concentrated solutions of
hydrochloric acid, due to the suppression of ionization of the phosphoric acid. Competition between the water molecules and the phosphoric acid molecules, for the proton donated by hydrogen chloride, accounts for the fall in specific conductivity of the more dilute hydrochloric acid mixtures.
The curves (Figure 4.) for the replacement of water in phosphoric, sulphuric, and perchloric acids by hydrochloric acid, throw no light on the compound formation. As would be expected, the curves for the three acids -are almost parallel at the higher concentrations of hydrochloric acid.
The high degree of asymmetry of the compound molecule
is illustrated by writing its electronic formula
The reaction represents essentially the competition between HgO and HgPC>4 for a proton. It is seen that the unshared pair of electrons in the fourth oxygen atom of the phosphoric acid molecule, forms a co-ordinate link with a proton
HsO-.P'-OS + H* 0 : + ;C l t
3Q
aQH»0-P:0 :H
0H
H QH

TABLE IV.
Change in pH value when and M HCIO^ is replaced
hydrochloric ■
MolarConcentration__________of HC1 M H^P04
0 0.810 .5 0.32
1.0 0.082.0 -0.172.5 -
3-0 -0.334.0 -0.47
water in M H^P04 , M H2S04 by an equal volume of .cid solution.
of Mixture.
M H2SO4. M HC104
0.10 -0.04-0.04 -0.13-0.17 -0.27-0.32 -0.47
- -0.56-0.47 --0.58 -

-Di
The pH values of solutions containing fixed quantities•f orthophosphoric * sulphuric and perchloric acidsrespectively and varying amounts of hydrochloric acid.

130
from the hydrochloric acid. The formation of the NHj ion
from ammonia is analogous. A large cation and small charge
favours electrovalency according to Fajan's Rule, lending support to the picture of a covalent H3P04 molecule being converted to the electrovalent compound (H4P04)’ c l". It has been suggested that compound formation between solute and solvent, as for example occurs with a strong acid and water,
is a preliminary to ionization. In addition,the increased stability of a symmetrical structure is considered to be the reason for the formation of many complexes. It is thus
seen that the formation of such an electrovalent compound
does not oppose theoretical principles.There seems reason to wonder whether the large number
of compounds between weak organic acids and a strong acidare not formed by a similar mechanism. The explanation issuggested as an alternative to the usual one of formationof an 'oxonium compound1. Considerable difference in thestrengths of two acids would also favour compound formationon the scheme suggested here. The writer has recently
67.noticed that Kendall and Andrews draw an analogy between hydration of an acid and compound formation between two acids.
Phosphoric acid was chosen for this work because it is
a moderately strong inorganic acid; evidence of compound formation between it and a stronger acid represents an extension of the type of acid compound formation studied by others. The symmetrical structure of the cation which is

formed when phosphoric acid combines with a proton was an additional reason for chocsing phosphoric acid for this work.
PREPARATION OF COMPOUND.
An attempt was made to prepare the compound (E4P04)' Cl,' by direct combination of the anhydrous acids. The conductivity and hydrogen ion concentration results having indicated the formation of a compound, in solutions of higher concentration than normal, it appeared that absence of water would favour the formation, since the water molecule is a competitor for the proton. Accordingly the effect of passing dry hydrogen chloride gas through 100% phosphoric acid was studied. The hydrogen chloride was prepared from pure reagents, by dropping concentrated sulphuric acid on to sodium chloride in a
round bottomed flask. The evolved gas was passed through two wash bottles, containing concentrated sulphuric acid and dry phosphorous pentachloride respectively. The dry hydrogen chloride was then led through the phosphoric acid, which was maintained in liquid state by first heating to 40° C, and then keeping the temperature just high enough to prevent crystallization. The train included a device to prevent
•sucking back’.
The volume of the liquid increased slightly during the passage of hydrogen chloride, while the maximum increase in weight in various repetitions of the experiment was 3*2%.For complete conversion of HgPC^into (H4P04)* Cl'the increase in weight would be 37-2%, so that apparently about one quarter of the phosphoric acid had been converted. An
attempt to raise the proportion of hydrogen chloride absorbed was made, using temperatures between - 1C? C and 150° C.The solution was then analysed volumetrically as follows.
The vessel containing the liquid was unstoppered and a few c.c. of the liquid poured into water in a flask. The resulting solution was made up to 500 c.c. with water, and the total acid present estimated with standard caustic soda solution, using the usual procedure required for the volumetric estimation of phosphoric acid. The hydrogen chloride present was found, by back-titrating an added excess of standard silver nitrate solution with standard ammonium thiocyanate solution. The highest percentage of hydrogen chloride
recorded was 9’4.The compound however was not stable, and if unstoppered
continuously evolved hydrogen chloride until very little remained. (05% HC1 was present after a week.) Great pressure was produced if the vessel containing the acids was tightly stoppered. An attempt was made to register the pressure generated, by quickly transferring to a vessel sealed to a

very long glass manometer U tube, formed by joining four feet lengths of capillary tubing. It was necessary to employ all glass joints, owing to the high pressure developed.The pressure rose to 4*2 atmospheres in six days, and was
still rising slowly when the mercury, having reached the foot of the U tube, was violently forced over. During this period
the pressure developed gradually, but depended on temperature. The increase in pressure during the day was slight, but during the night, when the laboratory was cooler, the pressure increased considerably. Crystals could be seen forming in the liquid in the flask, and bubbles of gas rose to the surface.
The experiment was repeated, using a closed end manometer, consisting of a U tube of total length about 35 cm. One end was sealed, and sufficient mercury added to the tube to trap
a convenient quantity of air in the closed end. The open end, bent over at 180°, was then quickly sealed to a small vessel, into which some of the freshly prepared liquid had been placed. The approximate pressure change in the flask, was then calculated from change in volume of the air in the closed end of the manometer. The pressure was released, after it had become steady at 2-5 atmospheres, by softening a capillary projection in the neck of the flask.
The capillary was then sealed in the bunsen again, and
the final pressure attained once more recorded. This

procedure was repeated several times. If the pressure had risen to a constant value, after allowing hydrogen chloride to escape, phase rule considerations would have proved the presence of a compound, since the dissociation pressure would then have been independent of the amount of hydrogen
chloride present. However, the equilibrium pressure recorded was somewhat less each time the gas was allowed to escape, due possibly to the initial evolution of most of the hydrogen
chloride from the small amount of liquid present. The small type of manometer, several of which were made, was
of service however, in examining the previously noted, effect of temperature on the pressure of the gas. It was found that immersing the vessel containing the two acids in a bath at 40° C, caused the pressure registered to fall from the original
2-5 atmospheres at 15° C. to 1*5 atmospheres at 40 C. On cooling, the 2*5 atmospheres pressure was re-established.
The conclusion from the above facts is that crystallization of the phosphoric acid is at least partly responsible
for the instability of the compound.
Note:-Ordinarv syruoy 90% phosphoric acio had been employed
p r e v i o u s to^the use of the 100% acid, since it was thought possible that passage of dry hydrogen chloride through the solution would, remove water. This however was not the case, as was proved by passing the escaping hydrogen chloridet h r o u g h " a w a t e r absorption train. T h e i n c r e a s e in w e i g h t
of the latter was negligible, ^ p h o r i c a c i d itsel:f s of course a strong dehydrating agent. High pressure was
135developed using 90% acid also, and it v/as impossible to stopper a vessel containing the two acids, for any length of time. It v/as noted, v/ith both the syrupy and the pure acid, thaw a small white precipitate collected at the bottom of the containing tube. The precipitate was very soluble in water, and gave an intense 'sodium flame*. It was probably caused by the acids attacking the glass, phosphoric acid alone having a strongly corrosive action. Owing to the small amount of water-soluble precipitate contained in the viscous acid it v/as not practical to isolate it. (Note:- most of the common organic solvents react with phosphoric acid).
Although considered very unlikely, it was desirable ’to show whether or not the precipitate was the compound under consideration. That it v/as not was shown by analysing (a) the clear solution obtained by decanting, and (b) the cloudy residue obtained after shaking. The acidity as well as the chloride present in the two samples was exactly the same.
The action of pure hydrochloric acid on pure phosphoric
acid does not conclusively settle whether a compound is formed, or whether the process is merely one of solution.The fine distinction raised by the terms is not however of primary importance. Whether the absorption of hydrogen chloride by phosphoric acid is to be ascribed to compound formation, or to -solution', cannot be proved. In any case, the mechanism to account for the absorption is best explained, in the writer's opinion, by assuming that the phosphoric acid
molecule attains symmetry, by accepting a proton from
hydrogen chloride.

SECTION V.
VOLuImS CHANGES IN NIXED ACIDS.
This work was undertaken with a view firstly, to test the suitability of the float method for detecting progressive volume change on mixing two acids; and secondly, to ascertain whether such volume changes could be used as an indication of acid 'strength1, and to show the formation of compounds
between acids.69Ostwald has shown that an expansion of about 20 c.c.
occurs, when a strong acid is neutralized by a strong base in
aqueous solution (one gran equivalent of acid or base in one kilogram of solution). The expansion is almost constant for different strong acids and bases, and is a maximum at the equivalence point**, just as is the heat of neutralization.Since the reaction is essentially the formation of water from
free hydrogen and hydroxyl ions, it is supposed that the heat evolved, and the expansion, are alike due to this combination. The expansion cannot be solely due to the volume of the water-
formed in the reaction, which is of course less than 20 c.c. - also the hydrogen and hydroxyl ions must have occupied some
volume originally. We may assume tentatively then, that a decrease in the number of hydrogen .and hydroxyl, possibly all ions, causes expansion. It is known that ions are hydrated in

aqueous solution, though to what extent is not certain.
The disappearance of ions will release the hydrated water
molecules from the ionic attraction, which it is reasonable
to suppose, has a constricting influence. This general
picture, is supported by the volume changes occuring whenweak acids .are neutralized. The volume change here is lessthan 20 c.c. by an amount equal to the contraction, whichoccurs when the undissociated acid ionizes, prior to
neutralization. This latter effect can be calculatedindependently, from the change in electrolytic dissociationof the acid with pressure. The neutralization of ammoniais a special case, which gives a contraction of 6*4 c.c.,and does not necessarily oppose the above conclusions. It
may be due, in the writer's opinion, to a contraction of
26*4 c.c., due to the ionization of NH40H, together with the• /removal of the dissolved ammonia gas to form NH4 and OH ions
thus:-MHg-f- H20 NH40H oh"
Most electrolytes dissolve in water with contraction, which supports the general view that the addition or formation of ions diminishes the volume of an aqueous solution.
The volume change occurring on mixing two acids was
likely to be small. Interest in the detection of minute changes in density has been stimulated in recent years by7/research on heavy water. Briscoe and co-workers have used

a flo.at method, in examining the heavy water content of
waters from natural and industrial sources. The principle of the float method of detecting volume changes is as follows. A suitably constructed float will float wholly immersed in a
liquid of the same density. If the density of the liquid
alters, the float will either rise or fall. A measure of the density change can be obtained, by causing the float to be once more suspended motionless in the body of the liquid. This can be cone by applying an electro-magnetic field (the float containing a metal), by altering the gas pressure above the surface of the liquid, or by changing the temperature of the liquid, and so adjusting its densit;/- once more to that of the float. The latter method was used by Briscoe and was the most suitable one for the present investigation.
The float method of detecting very small volume changes has several important advantages over pyknometric methods.
Cnee the technique has been acquired, the volume changes
occurring on mixing two liquids can be studied much more expeditiously with a float, than by measuring the absolute density at each step with a pyknometer. In addition, the float method is the more accurate one for density comparison. The accuracy of the method is limited by the accuracy with which temperature can be recorded. Assuming that a change
of 0*001° C. can be read, it will be seen from the coefficient

of expansion of dilute acid solutions, that density changes-7
of 3 x 10 , or one pant in thirty millions car. he detected.A change of one part in a million could thus be rapidly estimated with ease. It was thought that a float would be very suitable for the present work, since by its use, two acid solutions could be adjusted to exactly the same density, and change in density on adding one acid to the other- instantly
detected and quickly estimated. With a pyknometer, however,
starting with liquids of different density, the actual density
on mixing would have to be compared with the calculated 'ideal' value, before any conclusions could be drawn. This is the usual method of studying volume changes in liquids.
EXPERIMENTAL.
FloatsFused silica is the ideal substance for construction of a
density float, as it possesses small thermal expansion,7A
elasticity, mechanical strength, and is insoluble and non-
absorbent. A cylindrical float is the most sensitive, and as
it requires to be worked at the ends only, the subsequent slow change in volume after heat treatment is negligible. (Richard and Harris shaped their float in the form of a fish. The drastic heating required, caused the volume of the float to alter for two months subsequent to the treatment) . Briscoe,’

140using cylindrical floats, found no change in five months use.
The floats used in the present work were prepared from silica melting point tubes. Sufficient mercury was intro
duced into the tube to cause it to float vertically in a given liquid, the open end, temporarily sealed with paraffin wax, breaking the surface. The float v/as then dried, and the open end sealed in an oxy-coal gas flame. Softening the tip increased the density of the float, and the amount of heating required to just make it sink v/as found by trial, the liquid being kept several degrees above room temperature for this purpose. In this way, a float v/as made that v/ould remain
stationary in the body of the liquid at a convenient temperature. This temperature v/hen the float and the liquid have exactly the
same density is termed the 'flotation temperature'. A number
of floats for use in v/ater, acid, and salt solutions were made
in this way.
ThermostatA glass thermostat was fitted up at a convenient height
for observation. The usual mercury regulator and heater
lamp did not give a steady enough temperature, a variation of about 004° C. occurring. A change of 0«001° C. is sufficient
to reverse the motion of a float at the flotation temperature. Fitting a large surface toluene-mercury regulator improved the temperature control, though not sufficiently for the purpose

141required. After experimenting with various combinations of
heater lamps, the following arrangement v/as adopted. One heater lamp was lit permanently, the current passing being
adjusted to raise the temperature of the thermostat to just below that required for an experiment. The current passing in a second heater lamp, placed in the relay circuit, was diminished by placing a 100 watt lamp in series with it. In this way, the violent heating and cooling, which occurred with the one heater lamp only, v/as eliminated. The heater lamp in the relay circuit, v/as placed along with the regulator in one corner, the permanently lit heater lamp in another
corner, and a powerful tv/in stirrer in the centre of the bath. During a two hours test, a variation in bath temperature of
only 0*001° C. was recorded on a Beckmann thermometer, while the temperature inside a tube of water immersed in the bath- changed by only about half this amount. This degree of temperature control was adequate for the purpose required.
ThermometersSince accurate temperature changes, and not absolute
temperatures we re to be measured, a Beckmann thermometer v/as ideal, providing changes of more than 5° C. did not occur.
In only one case was a change of over 5° C. observed,-and for this, two of these thermometers were employed. The special
thermometers used by Briscoe, were graduated at intervals
(1 mm. apart) of 0*020 e, and could be read to 0*001° C. with

142
the aid of a lens, while the Beckmann thermometers used here, were graduated to 0-01° C. (1 mm. apart), and so were correspondingly easier to read.
Heavy Water;-
With a view to acquiring the technique of the float method, and as a matter of general interest, the density of two samples of water, expected to contain a slight excess of ’heavy water', were compared with that of ordinary water.The waters examined were taken (a) from a continuous still, used for preparing conductivity water, which had been running for several months without removing the residual water in the kettle; and (b) from large capacity storage accumulators, which had been undisturbed for a number of years, except for the addition of distilled water. No elaborate purification process was undertaken, as the subject of 'heavy water' was incidental to the study of the float method.
The tap water standard, and the residue from the still were filtered and '-''istilled into a Pyrex flask. They were 'degassed' just before a measurement, by boiling under a vacuum. The flotation temperatures in this trial, and in the mixed acids work, were recorded on a Beckmann thermometer passing through a flat cork, which fitted over the mouth of the tube containing the sample. The Beckmann also served to stir the water, and to control the float which was viewed through a cathetometer telescope.
The flotation temperature of the distilled water was between 1*667° and 1*669° on two consecutive days, while Q that of water from the still was between !•680° and 1*682 . This difference of 0*013° C. at 28*3° 0. (the temperature of the thermostat), represents an increase in density of 3*7 x 10“* .
The acid obtained from the accumulators was neutralized with barium and sodium carbonates, the precipitate filtered off and the filtrate twice distilled. The flotation temperature after 'degassing' was 2-362° 0. A third djstillat- ion did not alter this value. The difference^of 0*151 C. at 28*4° C., represents a density of 4*3x10 above that of standard to.p water. The increases in proportion of 9 ,0 noted are of course caused by (a) the lower volatility of DgO (3.P. 101*4° C.) compared with Ho0, an-' (b) heavy hydrogen bein- less mobile in water than the common isotope.

143These tests showed that it is essential to stir the
liquid under examination frequently, and to allow sufficient time for it to assume the temperature of the thermostat, before taking account of the floats behaviour. If this is not done, convection currents and uneven temperature
distribution lead to a false estimation of the flotation temperature. Preliminary trials with mixed acids, showed
the necessity for decreasing the amount of gases dissolved in the solutions. In the writer's experience, the change in
density of a liquid due to the presence of dissolved inert
gases is very small, and in any case, atmospheric gases removed by boiling under vacuum, would quickly redissolve on cooling. The experience with dissolved carbon dioxide, described in Section 111. on the pH of water, supports this view. A very appreciable error in flotation temperature is caused, however, when a liquid containing dissolved gases is placed in a thermostat above room temperature. Bubbles of gas, some almost invisible, collect on the float, due to
the lower solubility of the gas at higher temperature, and
completely vitiate any atterupt to estimate flotation temperature. Boiling the liquids in vacuum was undesirable
with volatile acids, and not necessary, since the trouble was readily overcome by warming the liquid above the temperature of the thermostat before use. This was conveniently done by standing the stock acids near a radiator.

144
EXPERIMENTAL PROCEDURE.
In all the experiments with acids, a solution of hydrochloric acid (A), was added to another acid solution (B). The acids were not purified before use, except in the case of hydrobromic acid, which was allowed to stand over red phosphorus to remove bromine, and then distilled. About two
litres of dilute hydrochloric acid were prepared, and the density adjusted by trial, to give a flotation temperature a
few degrees above room temperature with a given float. The
other acid solutions were prepared as required, the density
being adjusted approximately to that of solution A., with the aid of a Westphal balance. About 120 c.c. of solution A. were then placed in a boiling tube supported in the thermostat, and the flotation temperature of the float found to within 0«005°. The Beckmann thermometer, and the float, handled by means of forceps, were then washed, dried, and placed in a 200 c.c. graduated measuring cylinder, containing over 100 c.c. of solution B., supported in the thermostat. The tube containing
solution A. was stoppered to prevent evaporation. The density
of solution B. was then adjusted, by adding drops of water, or
of slightly more concentrated acid solution, to give the same
flotation temperature within 0*005° as that of solution A.The excess of solution B. over 100 c.c. was removed by a pipette, and the flotation temperature checked. 10 c.c. of solution A. were then pipetted into solution B., and the
145
temperature of the thermostat adjusted to the flotation
temperature of the mixture. Before accepting a temperature,
the Beckmann thermometer, and the walls of the cylinder below the level of the thermostat water, were flooded with the solution by means of a pipette, in order to ensure homogeneity. A rise in flotation temperature corresponds, of course, to an increase in density, and vice-versa. Ten 10 c.c. portions of solution A. were added in this way, the maximum change in
flotation temperature alv/ays occurring before the addition of 100 c.c. of solution A. A preliminary trial showed the extent
and direction of the density change, so that the Beckmann read
ing could be suitably adjusted beforehand. Two or three trials were performed for each pair of acids, and very similar curves
were always obtained. The set of experiments was repeated, using a less dense float, to reveal the effect of concentration on the results.

146
EXPERIMENTAL RESULTS.
The results for the two floats are recorded in Tables 1. and 11., and graphed in Figures 1. and 2. From Figure 1. it
will be seen that contraction occurs on adding hydrochloric acid to perchloric, and to hydrobromic acids, since a rise in flotation temperature indicates an increase in density for aqueous solutions. Sulphuric, oxalic, and phosphoric acids, however, give an expansion. The occurrence of a maximum or minimum in the graphs is caused by the progressive addition of hydrochloric acid, of less or greater density, respectively,
than that of the mixture.It can readily be shown on theoretical grounds, that the
ionization of a weak acid, is inversely proportional to the
concentration of a strong acid added to it. Hence in the case of orthophosphoric acid, oxalic acid and possibly sulphuric
acid (though this is doubtful), a decrease in ionization would be expected on the addition of hydrochloric acid, which would itself probably be unaffected. Therefore according to the view that a decrease in the number of ions present causes expansion, one would expect the curves for these three acids to be below the horizontal, and in the relative positions
shown; though with the curves for phosphoric and oxalic acids closer together, providing no interfering factor such as
compound formation is present.

TABT.F I.Float C. density = 1.04424.Initial Temperature . 26.3°C.
Solution A = 9-35# HC1. Volume of aoid B = 100 c.c.
Volume of A added in
c.c. Flotation Temperature of A + B.hc i o4 HRr h 2S04 (c o o h )2 h 3P04 CHyC02H.
0 3.60 3.60 3 .60 3.60 3.60 3.6010 4.00 3.86 3 .23 2.79 1.43 5.1420 4.29 4.03 3 .09 2 .50 0.99 6.2930 4.53 4.23 3 .08 2.42 O .96 6.9940 4.69 4.39 3-09 2.38 1.02 7-5550 4.85 4.46 3.09 2.47 1.13 7-9760 4.98 4.54 3.10 2.51 1.24 8.3370 4.98 4-59 3-11 2.62 1.41 8.6680 4.97 4.62 3.12 2.67 1.52 8.7390 4.97 4.64 3.12 2.81 1.60 8.82
100 4.96 4.63- 3.13 2.89 1.66 8.85

c.
bjacCCyujOtoLdUccO'U 2. Q-2
/
0 70/0 0000 00 70 so 90 100 ccV olume of h Cl
Fig. 1.Change in fletation temperature as a solution of hydrochloric acid is added to the following solutions of the same density:—
1. Perchloric acid. 2. Hydrobremic acid.3. Sulphuric acid. 4. Oxalic acid.
5. Phosphoric acid.

147The strong acids hydrobromic and perchloric acids
show a contraction on mixing with hydrochloric acid.Whether this can be accounted for by a slight increase in the number of ions present, due to dilution of the anion is doubtful. The figures for acetic acid are not graphed, as the increase in flotation temperature is so large (5*23°), but they fit 011 to a smooth curve, which reaches its highest value after the addition of 100 c.c. of hydrochloric acid.It is difficult to account for this large contraction, but it may be emphasized, that owing to the low density of acetic
acid- the solution was by no means dilute (6-3 II), and that conflicting factors like change in degree of hydration, and association, may be responsible. In addition, acetic acid is known to possess exceptional features. When it is neutralized by a strong alkali, the solution shows an initial contraction before the usual expansion takes place.
The curves obtained with the less dense solutions shown in Figure 2. are similar to those in Figure 1., but in each case, as is to be expected, the extent of the change in flotation temperature is less. With acetic acid the change is much less. The molarity of this acid, using the less
dense float E., is comparable with that of the other acids used with the denser float G. The remaining acids are of the same order of molarity, viz. about O'9 I- for float C., and about 0-3 K for float E. Konochloracetic acid was included
ii

TABLE II- Float E, density = 1.01285Initial Temperature = 26°C.
Solution A = 3.25% HC1. Volume of acid B - 100 c.c.
Volume of Flotation Temperature of A + B,A added in --------------.-------------------------------------c *c * HC104 HBr H2S04 (C00H)2 HjP04 CHyCOgH C^Cl.CC^H
0 3.00 3-00 3.00 3.0 3.00 3-00 3-0010 3.105 3.07 2.88 2.60 1.955 3.10 2.75520 3-295 3.10 2.79 2.52 1.81 3 .1 6 2.6730 3-375 3.14 2.71 2.44 1.70 3.24 2.6640 3 .435 3 .17 2.63 2.33 1.63 3-35 2.6850 3 .425 3.16 2.61 2.22 1.64 3.40 2.7860 3.375 3.14 2 .6 0 2.19 1.69 3-44 2.7970 3 .365 3.125 2.66 2.18 1.77 3-38 2 .9 1
80 3.355 3-12 2.70 2.23 1.81 3.42 2.92
90 3.325 3.07 2.77 2.31 1 .85 3.40 2.93
100 3.305 3-08 2.77 2.33 1.85 3.40 -

E.UJ=J
LUU J5 - 2LlJ ^Q
70 900 50 8010 20 ZOO cc.
V o l u m e of H C I .
Fig. 2.Change in flotation temperature as a solution of hydrochloric acid is added to the following solutions of the same density: —1. Acetic acid. 2. Perchloric acid.3. Hydrobromic acid. 4. Monochloraeetie acid.5. Sulphuric acid. 6. Oxalic acid.
7. Phosphoric acid.(Float E).

148
in the trial with float E. This acid., v/hich is stronger than acetic acid, gives a minimum shaped graph. It is thus apparent that the graphs do not give an indication of acid strength.
The values of the flotation temperature- are approximately proportional to the densities of all the solutions concerned,
except acetic acid. This follows from the fact that the coefficients of expansion of these solutions, (calculated from Tables), are about the same, at the temperature of the experiment. It seemed very probable that the coefficient ofexpansion of the.mixtures would also be the same. That thiswas so was proved by measuring, with a pyknometer, the density
of the mixture of phosphoric acid and hydrochloric acid yielding the maximum change in flotation temperature with
float C., firstly at the flotation temperature, and secondly,
at the original temperature before mixing. The change in density per degree was 0-00021, while the average change estimated from tables for 3% -and 10% acids is 0*0002-5. For acetic acid, however, v/hich was more concentrated than theother acids, the calculated change in density per degree was0*00075. The measured value for the mixture of acetic and hydrochloric acids was 0*00043. The above values are for solutions using float C. For the less dense solutions using float F.j the change in density per degree for acetic acid is about 0*0004, and about 0-0003 for the remaining acids. The

TABLE III.
Float C, densit7 = 1.04424.
Solution A *=• 2.66M (9.35$) HC1, added to 100 o.c. ofsolution B.
Flotation temperature of each acid before mixing « 26.3°C
Vol. of A Cone.of Ratios*!, Max. Max.changeto give B before - change, in
Solution max.change mixing in densit7 1B. in temp. moles/ temp. yiri4c.c. litre. in temp. oc> xlO
HC104 70 0.95HBr 90 0 .8 5
H2S04 30 0 .7 6
(cooh) 2 39 1.09
E3P°4 28 0.94
CH3C02H 100 6 .5
1 .9 6 + 1.38 + 4.82.82 + 1.04 + 3-61.05 -0.52 -1.80.96 " 1.22 -4.30.79 -2.66 “ 9-30.41 + 5.28 + 2 2 .7
* Composition of A and B estimated at 20°C.
t Assuming change in density per degree Centigrade s 0.00035 for all solutions except acetic acid mixture which has the measured value 0.00043.

TABLE IV.
Float E, density . 1.01285.
*•Solution A = 0.90M(3.25?J) HC1, added to 100 c.c. of
solution B..Flotation temperature of each acid before mixing a 26°C,
Vol. of A Rat io Max.to give Cone.of - J- J change Max.changemax. B before in in
Solution change mixing temp. densitytB. in temp, moles/ t “ or xin4c.c. litre. temP* C. X10
HC104 40 0.30 1.20 + 0.43 + 1*3HBr 45 0.29 1.40 + 0.18 + 0.54h 2S04 55 0.24 2.06 -0.40 -1.2(c o o h )2 70 0.33 1.91 -0.82 -2.5h 3po4 45 0 .30 1*35 -1*37 -4.1CH^CO^ 60 1-9 0.28 + 0.44 + 1*5
*£ Composition of A and B estimated at 20°C.
f Assuming change in density per degree Centigrade s 0.0003 for all solutions except acetic acid mixture which has the estimated value 0.00035*

TABLE V.
Float C, density s 1.04424.
aSolution A = 1.05M(7.4^) KC1 added to 100 c.c. ofsolution B.
Flotation temperature of each salt before mixing r 26.3°C.-------- a--------
Vol.of A Cone, of Ratioto give B before f maj J Max.
Solution max. mixing * change inB. change in Moles/ J* temp,
temp. litre.c.c. temp- C .
I ^ P 0 4 40 - - -0.30k 2so4 70 0.35 2.1 -0 .3 8
KBr >100 0.57 >1.8 >+3-2Na2S04 >100 0.38 >2.8 >-0.45
•S? Composition of A and B estimated at 20°C.

149results for float C. are summarised in Table 111., and forfloat E. in Table IV. The second column gives the volume
of A. added to 100 c.c. of B., to give the maximum change in
flotation temperature, the third column the molarity of solutionB.. the fourth column the ratio of the molar concentration of
A. to that of B., in the solution giving maximum volume change,
the fifth column the maximum change in flotation temperature,and the sixth column the approximate maximum change in densitycalculated from the estimated change in densit;^ per degree.Column four shows that no simple relationship exists, betweenthe molarities of the two acids at the point of maximum changein density; this is the case for viscosity graphs for mixtures
74also. A summary of the results for five salts that were
examined in this way, is given in Table V. The magnitude of changes for the acids and the salts are of the same order, and
show they are not peculiar to acids.
The densities of the floats were found by measuring the
density of the stock hydrochloric acid, and as a confirmation, phosphoric acid at their flotation temperature. The length of time the pyknometer was kept in the thermostat- and in the balance case was controlled, and the buoyancy of the air was
allowed for in the calculation.In seeking the reason for the apparently haphazard
volume changes, shown when hydrochloric acid is added to other acids of varying 'strength', it is necessary to review

150briefly the subject of volume change in solution, and to
refer to the work of others who have used pyknometric methods.The changes in volume accompanying neutralization of
acids and bases, and dilution of electrolytes, can be explained on the assumption that the attraction of ions for water molecules, causes a decrease in volume. These changes are comparatively large however. When dealing with smaller
volume differences, there is a multiplicity of factors operating, as is indicated by the fact that probably all liquids
and solutions, whether electrolytes or non-polar, show
departure from the mixture rule; so that the volume of a mixture of two liquids, is invariably slightly different from the sum of the volumes of the constituents. The type of volume change occurring on mixing two liquids of different density, such as an acid and water, can readily be obtained from density tables, by graphing the composition of the
solution against the density. It is important, however, to use the correct units. A graph of density against percentage composition by weight is not suitable, since it has an
equation of the type x+'oxy + caO, and so is not a straight line. Density plotted against weight per unit volume, (or specific volume against percentage composition), gives a straight line graph of the form x+by + c = 0, for no volume change. This can readily be verified, by calculating what should be the density of a solution, obtained by mixing varvina amounts of two liquids of known density. Hence by

151
drawing the experimental density ; gm. per litre graph for
a solution, and then joining the extremities by a straight line, the departure from 'ideal' behaviour can be seen.
The graphs of density against gm. per litre for the acids used
in the float experiments, are all situated on the density axis side of the straight line joining their extremities,
showing that these acids contract on dilution with water.Considerable research has been done on the subject of
volume and temperature change on mixing organic liquids, but all attempts to evolve a satisfactory theory to explain the results have failed. For example, Briscoe and co-workers
have measured the volume and temperature changes for seventeen binary mixtures of organic liquids. No relationship exists
between the changes, an increase in volume being accompanied
by an increase or decrease in temperature, while the maximum volume change, and maximum temperature change, do not necessarily occur at the same composition. The direction of volume change may even depend on the proportions of the two
7 4 7 7 . 78 .liquids mixed. Holmes and Sageman conclude that a readjustment of the dimensions of the interspaces between molecules, caused by changes in electrical forces on mixing two liquids,
is responsible for volume changes, as well as the variation due to difference in the volume of the respective molecules. Apparently the specific properties of the molecules present
in any given mixture determine its behaviour, just as gases

152
at high pressure cease to obey the gas laws and. exhibit7£~highly specific characteristics.
Apart from change in degree of ionization of two liquids which are mixed, it is very likely that alteration of degree of hydration of the solute, and of association of the solvent will occur, and cause volume changes. Briscoe and co-workers suggest the formation of molecular complexes. They think that the equilibrium, existing between simple and associated
molecules in each liquid, is altered on mixing, by the formation
of a complex by the simple molecules of both constituents.Thus:-
\ ^ .xA')
The question is complicated in the case of acid solutions by the presence of three components, any or all of v/hich may cause
a volume change. The ionic concentration of a mixture will, in general, be intermediate between that of the constituents, and the changes in volume v/hich may occur for each constituent on mixing, will probably not be equal, and so v/ill not
neutralize each other.The foregoing gives some indication of the complexity
of the subject of volume change in liquids, and more particularly
in solutions. If, as appears probable, the causes of volume change in solutions are specific to the particular set of reagents present, and so not amenable to general laws, the

153m e t h o d c a n n o t b e e m p l o y e d t o s h o w c o m p o u n d f o r m a t i o n o r t h e
r e l a t i v e s t r e n g t h s o f a c i d s o l u t i o n s . T h e v o l u m e c h a n g e s
o b t a i n e d w i t h m i x e d a c i d s a r e m i n u t e c o m p a r e d w i t h t h o s e
a c c o m p a n y i n g t h e n e u t r a l i z a t i o n o f a c i d s a n d b a s e s , a n d
a p p e a r t o c o n f o r m t o n o d e f i n i t e p r i n c i p l e , a n y m o r e t h a n d o
t h e r e s u l t s o b t a i n e d b y o t h e r s w i t h p u r e l i q u i d s .
The method of studying density changes used in this work has proved to be neat, and considerably less laborious than the pyknometric method. It suffers, however, from several disadvantages. While it detects smaller density changes than does a pyknometer, it does not give absolute density changes, since the coefficient of expansion for each mixture is not
known. The most serious disadvantage of the method, however,
is the fact that the solutions mixed must have the same density, so that suitable concentrations cannot be selected. Thus it
was necessary to mix 6*511 acetic acid with 2-7H: hydrochloric acid, owing to the low density of acetic acid.
It is probable that the method would be of most value for indicating the type of change to be expected, before attempting measurements with a pyknometer. It would also be very useful for obtaining qualitative data as to the
magnitude and direction of the volume changes occurring with
different types of liquids.

164
SUMMARY.
SECTION I.~ The measurement of pH value by electrodes was discussed, and the E.M.F. developed by the hydrogen electrode in solutions of formic, acetic, propionic, orthophosphoric and sulphuric acids recorded over a wide range in concentration, a relationship between electrode potential and dilution being obtained for dilute solutions. The magnitude of the junction potential between solutions of sulphuric acid and saturated potassium chloride was calculated. The behaviour of the glass electrode in the above acids was also studied by direct comparison with the hydrogen electrode.
SECTION II.— The subject of salt hydrolysis was discussed and the advantages possessed by the glass electrode for the determination of hydrolysis emphasized. After proving that it is unaffected by salts this electrode was used in measuring a number of ' hydrolysis constants1. Protection from atmospheric contamination was shown to be essential when dealing with salts having a reaction near to the neutral point of water. A method was devised of measuring pH values in carbon dioxide free solutions, and a number of 'hydrolysis constants' were calculated for solutions which give anomalous results using ordinary methods.

156
SECTION III. The pH of pure water was discussed, and evidence described indicating that traces of ammonia exist in conductivity water, the reaction on removal of dissolved carbon dioxide being about 8. Distillation of conductivity water from orthophosphoric acid, with precautions against atmospheric contamination, gave the purest water, the mean pH of ten samples being 7*0 at 18°C to 20°C.
SECTION IV.— The possibility of an acid acting as a proton acceptor in the presence of a stronger acid was discussed, and the view expressed that the proton accepting acid need not be a particularly weak one providing there are other reasons such as symmetry of the molecule to favour formation of a complex. Evidence of such a union between orthophosphoric and hydrochloric acids was obtained from the results of conductivity and pH measurements, and by the behaviour of a mixture of the two pure acids.
SECTION V.— The subject of volume changes on mixing liquids was discussed and a method described of studying, by means of a float, the change in density when two solutions are mixed. The volume changes with mixed acids conform to no general scheme and, as with organic liquids, appear to be specific to the solutions concerned.

LITERATURE.
1. Cremer, Z. Biologle, 1906, 47, 562.2. Haber and Klemensiewicz, Z. physlk. Chem., 1909, 67, 385.3. McFarlane, Phil. Mag., 1932, 14, 1; J. Sci. Instr. 1933,
10, 208.4. Harrison, J. Chem. Soc., 1930, 1528.5. Maclnnes and Shedlovsky, J. Amer. Chem. Soc., 1932, 54,
1429.6. Lewis and Randall, J. Amer. Chem. Soc., 1921, 43, 1112.7. Golden Jubilee Review, J. Amer. Chem. Soc., 1926.8. Maclagan, Biochem. Journ., 1929, 23, 308.9. Bovie and Hughes, J. Amer. Chem. Soc., 1923, 45, 1904.
10. Maclnnes and Dole, J. Amer. Chem. soo., 1930, 52, 29.11. Clark, ’The Determination of Hydrogen Ions’, 1928.12. Maclnnes and Belcher, J. Amer. Chem. Soc., 1931, 53, 3315.13. Hagguard, Comptes-rendus des travaux du Laboratoire
Carlsberg, 20me Vol. No. 9.14. Bennett, Brooks, and Glasstone, J. Chem. Soc., 1935, 1821.15. Hall and Conant, J. Amer. Chem. Soc., 1927, 49, 3047.16. Walpole, J. Chem. Soc., 1914, 2521.17. Hammett, J. Amer. Chem. Soc., 1928, 50, 2666.18. 'Thermodynamics', Lewis and Randall . (p. 335).19. Dole, J. Amer. Chem. Soc., 1932, 54, 2120 and 3095.20. Sammlung Chemischer und chemi3ch-technischer Vbrtrage,
1914, 21, 11.

157
21. Noyes, Z. physik. Chem., 1893, 11, 495.22. Kolthoff and Kameda, J. Amer. Chem. Soc., 1931, 53, 825.23. Denham and Marris, Trans. Far. Soc., 1928, 24, 510.24. Beans and Hammett, J. Amer. Chem. Soc., 1925, 47, 1215.25. Kolthoff and Kameda, J. Amer. Chem. Soc., 1929, 51, 2888.26. Kolthoff and Kameda, J. Amer. Chem. Soc., 1931, 53, 832.27. Britton and Robinson, Trans. Far. Soc., 1932, 28, 531.28. O’Sullivan, Trans. Far. Soc., 1925, 21, 319.29. Amis and Gabbard, J. Amer. Chem. Soc., 1937, 59, 557.30. Shields, Phil. Mag., 1893, 35, 365.31. Harman and Worley, Trans. Far. Soc., 1925, 20, 502.32. Hughes, J. Chem. Soc., 1928, 491.33. Denham, J. Chem. Soc., 1908, 41.34. Denham and Allmand, J. Chem. Soc., 1908, 424.35. Denham and Marris, Trans. Far. Soc., 1928, 24, 515.36. Tansley, J. Chem. Soc., 1923, 3164.37. prytz, Trans. Far. Soc., 1928, 24, 281.38. Sherril and Noyes, J. Amer. Chem. Soc., 1926, 48, 1861.39. Rudolphi, Z. physik. Chem., 1895, 17, 385.40. Michaelis and Fujita, Biochem Z., 1923, 142, 398.
41. Hill, J. Chem. Soc., 1906, 1273.42. Prideaux, Trans. Far. Soc., 1924, 20, 37.
43. Job, Comptes rendu, 1924, 1317.
44. J. Soc. Chem. Ind., 1923, p.p. 46, 164, 343, 564, 578,641, 744.

158
45. Bray, J. Amer. Chem. Soc., 1927, 49, 2372.46. Cowperthwaite and La Mer, J. Amer. Chem. Soc., 1931,
53, 4333.47. Quintin, J. chim. phys., 1925, 24, 712.48. Neuss and Rieman, J. Amer. Chem. Soc., 1934, 56, 2238.
49. Sherri 1, J. Amer. Chem. Soc., 1907, 29, 1614 and 1675.50. Sand and Kaestle, Z. anorg. Chem., 1907, 52, 101.51. Abegg and Cox, Z. physik. Chem., 1904, 48, 725.52. Powney and Jordan, J. soc. Chem. Ind., 1937, 56, 133.53. Br^nsted, J. Amer. Chem. Soc., 1920, 42, 761.54. Harned, J. Amer. Chem. Soc., 1925, 47, 930.55. Ellis and Kiehl, J. Amer. Chem. Soc., 1935, 57, 2139.56. Kolhoff and Kameda, J. Amer. Chem. soc., 1931, 53, 821.57. Kohlrausch and Heydweiller, Z. physik. Chem. 1894,
14, 317.58. Beans and Oakes, J. Amer. Chem. Soc., 1920, 42, 2116.59. Kendall, J. Amer. Chem. Soc., 1914, 36, 1722.60. King and Walton, J. Phys. Chem., 1931, 35, 1745.61. Knox and Richards, J. Chem. Soc., 1919, 115, 508.62. Kendall and Andrews, J. Amer. Chem. Soc., 1921, 43, 1545.
63. Walton and Kepfer, J. Phys. Chem., 1930, 34, 543.64. Cranston and Bell, Royal Technical College Journ., 1926,
3, 36.

169
65. Cranston and Duncan, Royal Technical College Journ.,1927, 4, 41.
66. Morton, J. Sci. Inst., 1930, 7, 187.67. Kendall and Andrews, J. Amer. Chem. Soc., 1917, 39, 2303.68. Ostwald, J. prak. Chemie., 1877, 16, 385; 1878, 18, 328.69. Zaslavskii, Standel and Tovarov, Z. anorg. allgem. Chem.,
1929, 180, 241.70. Fanjung, Z. phys. Chemie., 1894, 14, 673.71. Emeleus, James, King, Pearson, Purcell and Briscoe,
J. Chem. Soc., 1934, 1207.72. Richards and Harris, J. Amer. Chem. Soc., 1916, 38, 1000.73. Richards and Shipley, J. Amer. Chem. Soc., 1914, 36, 1.74. Bramley, J. Chem. Soc., 1916, 10.75. Peel, Madgin and Briscoe, J. Phys. Chem., 1928, 32, 285.76. 1 Solubility’, Hildebrand.77. Washburn and Lightbody, J. Phys. Chem., 1930, 34, 2701.78. Holmes and Sageman, J. Chem. Soc., 1909, 1919.79. Madgin, Peel and Briscoe, J. Chem. Soc., 1927, 2873.
*


![Effect of surface modification of zinc oxide on the electrochemical performances of [Ni4Al(OH)10]OH electrode](https://static.fdokumen.com/doc/165x107/6340241567d79c1de000fab3/effect-of-surface-modification-of-zinc-oxide-on-the-electrochemical-performances.jpg)