
Numerical reproduction of OH* radiation measurements of ...
9
Numerical reproduction of OH* radiation measurements of unsteady supercritical LOx/H2 combustion Symposium on Thermoacoustics in Combustion: Industry meets Academia (SoTiC 2021) Sept. 6 - Sept. 10, 2021 Munich, Germany Paper No.: XXX ©The Author(s) 2021 Federica Tonti 1 , Jos ´ e Zapata Usandivaras, 1 , Jaka Perovˇ sek 1 , Sebastian Karl 2 , Justin S.Hardi 1 , Michael Oschwald 1,3 Abstract Radiation emitted from hydroxyl radicals (OH*) in high pressure oxygen-hydrogen flames has often been used as a marker for the flame zone because it is a physical quantity which is relatively easy to capture experimentally with high-speed cameras or photomultipliers. However, quantitative comparison of CFD results with experimental data and its use as an indicator of heat release during the combustion process is still an open problem. In order to compare CFD simulation results with experimental data, a radiation modelling tool has been developed at the Institute of Space Propulsion at the German Aerospace Center (DLR). This tool takes as input the relevant field variables obtained by a CFD simulation and gives as an output the intensity of the radiation emitted by OH* molecules as a result of the thermal excitation of OH ground state molecules by applying a reverse ray-tracing algorithm. This work aims to investigate the flame response of a single injector element fed with LOx/H 2 subject to acoustic forcing and the fluctuations of the intensity of the OH* radiation emitted from the flame. The results are then compated with experimental data. The main steps are running a URANS simulation and investigate the flame response to acoustic excitation and apply the radiation modelling and ray-tracing tool to extract the OH* radiation intensity flucutations recored by an optical probe of the chamber. The results show a good qualitative agreement with the experimental data and give better understanding of the flame dynamics giving rise to inherently nonlinear radiation intensity dynamics. Keywords Radiation modelling, High pressure combustion, High frequency combustion instabilities, OH* radiation Introduction High frequency (HF) combustion instabilities are an ongoing challenge to the development of rocket combustion chambers. The occurring of the phenomenon is triggered by the coupling of pressure oscillations and unsteady energy release which derives from the combustion process. The coupling leads to an unsteady heat release rate and the phenomena close in a loop. Numerical simulations are a promising tool for the investigation of such phenomena as much as for design purposes. To validate such tools, a comparison between the results of simulations and experimental data is necessary. The experimental dectection of the physical properties of the flames is a challenging task, especially for liquid propellant rocket engines (LPRE), because of the extreme conditions at which they operate. During the combustion process very high temperatures and pressures are reached, and the detection of important combustion parameters, for example mass fractions of the involved species or temperature is difficult due to this unfriendly enviroment. It is then necessary to focus on quantities which can be given as results of a numerical simulation and are easily comparable with experimental data. A suitable physical parameter for this comparison is the radiation emitted from the flame, which is a often used as a marker of the flame zone. In particular, when dealing with LOx/H 2 flames, the radiation emitted by the excited hydroxyl radical (OH*) can be used for this purpose. OH* radiation has been used often to identify flame emis- sion zones in high temperature flames 1,2 because it is clearly distinguishable in the UV spectrum range with respect to other radiating sources, being the central wavelenght at 310 nm 3 . Chemiluminescence of excited radicals, which origi- nates from the relaxation of electronically excited species produced by the combustion reaction in the flame, has been used to study light emission taking place in the reaction zone, providing information about the energy release in the flame radiation zone. However, the fundamental parameter to study combustion instabilities is the volumetric heat release rate ˙ q, which cannot be measured experimentally. For this reason, many studies have been focusing on determining whether there can be a quantitative correlation between flame radiation and heat release rate to study combustion instabilities or not. 1 DLR-Institute of Space Propulsion, Im Langen Grund, 74239 Hardthausen am Kocher, Germany 2 DLR-Institute of Aerodynamics and Flow Technology, Bunsenstrasse 10, 32073, G ¨ ottingen, Germany 3 RWTH Aachen University, Institute of Jet Propulsion and Turbomachin- ery, Templergraben 55, 52062, Aachen, Germany Corresponding author: Federica Tonti, DLR-Institute of Space Propulsion, Im Langen Grund, 74239 Hardthausen am Kocher, Germany Email: [email protected] Prepared using sagej.cls [Version: 2017/01/17 v1.20]
-
Upload
khangminh22 -
Category
Documents
-
view
1 -
download
0
Transcript of Numerical reproduction of OH* radiation measurements of ...

Numerical reproduction of OH* radiationmeasurements of unsteady supercriticalLOx/H2 combustion
Symposium on Thermoacoustics inCombustion: Industry meets Academia(SoTiC 2021)Sept. 6 - Sept. 10, 2021Munich, GermanyPaper No.: XXX©The Author(s) 2021
Federica Tonti1, Jose Zapata Usandivaras,1, Jaka Perovsek1, Sebastian Karl2, JustinS.Hardi1, Michael Oschwald1,3
AbstractRadiation emitted from hydroxyl radicals (OH*) in high pressure oxygen-hydrogen flames has often been used as amarker for the flame zone because it is a physical quantity which is relatively easy to capture experimentally withhigh-speed cameras or photomultipliers. However, quantitative comparison of CFD results with experimental data andits use as an indicator of heat release during the combustion process is still an open problem. In order to compareCFD simulation results with experimental data, a radiation modelling tool has been developed at the Institute of SpacePropulsion at the German Aerospace Center (DLR). This tool takes as input the relevant field variables obtained by aCFD simulation and gives as an output the intensity of the radiation emitted by OH* molecules as a result of the thermalexcitation of OH ground state molecules by applying a reverse ray-tracing algorithm. This work aims to investigatethe flame response of a single injector element fed with LOx/H2 subject to acoustic forcing and the fluctuations ofthe intensity of the OH* radiation emitted from the flame. The results are then compated with experimental data. Themain steps are running a URANS simulation and investigate the flame response to acoustic excitation and apply theradiation modelling and ray-tracing tool to extract the OH* radiation intensity flucutations recored by an optical probe ofthe chamber. The results show a good qualitative agreement with the experimental data and give better understandingof the flame dynamics giving rise to inherently nonlinear radiation intensity dynamics.
KeywordsRadiation modelling, High pressure combustion, High frequency combustion instabilities, OH* radiation
Introduction
High frequency (HF) combustion instabilities are anongoing challenge to the development of rocket combustionchambers. The occurring of the phenomenon is triggered bythe coupling of pressure oscillations and unsteady energyrelease which derives from the combustion process. Thecoupling leads to an unsteady heat release rate and thephenomena close in a loop. Numerical simulations are apromising tool for the investigation of such phenomenaas much as for design purposes. To validate such tools,a comparison between the results of simulations andexperimental data is necessary. The experimental dectectionof the physical properties of the flames is a challengingtask, especially for liquid propellant rocket engines (LPRE),because of the extreme conditions at which they operate.During the combustion process very high temperaturesand pressures are reached, and the detection of importantcombustion parameters, for example mass fractions of theinvolved species or temperature is difficult due to thisunfriendly enviroment. It is then necessary to focus onquantities which can be given as results of a numericalsimulation and are easily comparable with experimental data.A suitable physical parameter for this comparison is theradiation emitted from the flame, which is a often used asa marker of the flame zone. In particular, when dealing withLOx/H2 flames, the radiation emitted by the excited hydroxylradical (OH*) can be used for this purpose.
OH* radiation has been used often to identify flame emis-sion zones in high temperature flames1,2 because it is clearlydistinguishable in the UV spectrum range with respect toother radiating sources, being the central wavelenght at 310nm3. Chemiluminescence of excited radicals, which origi-nates from the relaxation of electronically excited speciesproduced by the combustion reaction in the flame, has beenused to study light emission taking place in the reactionzone, providing information about the energy release in theflame radiation zone. However, the fundamental parameter tostudy combustion instabilities is the volumetric heat releaserate q, which cannot be measured experimentally. For thisreason, many studies have been focusing on determiningwhether there can be a quantitative correlation betweenflame radiation and heat release rate to study combustioninstabilities or not.
1DLR-Institute of Space Propulsion, Im Langen Grund, 74239Hardthausen am Kocher, Germany2DLR-Institute of Aerodynamics and Flow Technology, Bunsenstrasse10, 32073, Gottingen, Germany3 RWTH Aachen University, Institute of Jet Propulsion and Turbomachin-ery, Templergraben 55, 52062, Aachen, Germany
Corresponding author:Federica Tonti, DLR-Institute of Space Propulsion, Im Langen Grund,74239 Hardthausen am Kocher, GermanyEmail: [email protected]
Prepared using sagej.cls [Version: 2017/01/17 v1.20]

2 Symposium on Thermoacoustics in Combustion: Industry meets Academia (SoTiC 2021) XX(X)
Emission of radicals as an indicator of the heat release ratewas first investigated in real and experimental combustion4,5.In order to define whether OH* radiation (and also CH*in hydrocarbon flames) could be an indicator of heatrelease, many studies have been involved6–16 with thegoal to state if a quantitative correlation between OH*radiation and heat release rate is possible. In all ofthese works, it is assumed chemiluminescence takes placewhere the heat release rate is defined from chemicalreactions, and the use of chemiluminescence as a markerfor the heat release is made on a case-by-case basis, withdifferent results depending on strain rate of the flame,degree of turbulence, degree of premixing, pressure andequivalence ratio. Chemiluminescence of CH* and OH* ina methane flame was invenstigated both experimentally andnumerically in a recent work of Bedard et al.1 with a detailedchemical scheme for methane. It is shown that, although adetailed chemical reacition scheme was used for methane,the ratio of emission intensity between OH* and CH* isgreater than the one observed in experiments. This is dueto self-absorption which causes distorsion in the line-of-sight measurements. A spatial correlation of heat releaseand radiation was observed by comparing experimental dataand simulations, but both CH* and OH* radiation are notsufficient to resolve the spatial and temporal distributionof the heat release. In this work,thermal excitation wascompletely neglected.
Here, the focus is on thermal excitation of OH moleculesproduced during the combustion process of LOx and H2.Very little literature is available regarding high pressure andtemperature flames. Generally, for relatively cold flames withtemperatures below 2700 K, it is reasonable to take intoaccount only chemical excitation of the molecules, but abovethis threshold, thermal excitation becomes predominant asshown by Fiala17. Moreover, thermal equilibrium betweenOH and OH* is assumed. This is the main assumption of theEquilibrium Filtered Radiation Model (EFRM) of Fiala17.Experimentally, the relation between heat release and OH*radiation has not been discussed in detailed for non-premixedO2/H2 flames. The only work is the one of Burrows18, whichused OH* radiation to determine the reaction zone.
When studying flame radiation, taking into account self-absorption is crucial. Self-absorption is the phenomenonwhich takes place when the radiation emitted from themolecules is subject to the absorption by the same moleculeswhich are present in the ground state. Neglecting self-absorption can lead to an important overestimation ofthe calculated radiance, as shown in Perovsek19. Anotherimportant phenomenon to consider in high pressure andtemperature flames is refraction. Refraction is the bendingof a ray of light when it passes from one medium to another.The bending is caused by the differences in density betweenthe media where the rays pass through. This can be includedusing ray-tracing algorothms, where refraction is modeled.
The goal of this work is to show how a tool which modelsself-absorption and refraction can capture the fluctuationsof the radiation emitted by OH* molecules in a flamewhen exposed to acoustic forcing, and further investigatethe relation between heat release rate and radiation in theflame response. This is done in a post-processing step toavoid the computational cost of modeling the production of
OH* molecules at runtime. The tool is applied to the HF-9REST test case. Here an optical probe has to be modelledtocorrectly capture the total radiance emitted from the flame.The view angle of the optical probe is different from zero andthe rays cannot be approximated as parallel when reachingthe detector surface.
The next section describes the tool in detail and theequations implemented. Then, the methodology and logic ofthe simulations will be presented, with a short descriptionof the modelling of the optical probe. Finally, the section ofresults will show the main results of the simulation.
Radiation modelling and ray-tracing
The ray tracing routine approximates the behaviour ofthe light emitted by the excited OH* molecules byassuming the principles of geometrical optics with modelledrefraction caused by density gradients. The calculationsare spectrally resolved in a range of wavelengths from305 nm to 320 nm, which accounts for self-absorptionphenomena. This is crucial to model correctly the radiationof flames where OH is present as a combustion product inhigh concentrations. Previous studies underlined that self-absorption affects the flame radiation considerably withincreasing pressures17,20,21. Diffraction, refraction, scatteringand blackbody radiation from walls and gases are neglected.The algorithm takes the data coming from a CFD solutionas input. In this case the CFD solution was generated withthe in-house DLR TAU code. The data are treated as a quasi-continuum with an inverse distance interpolation based onnearest neighbours. First, the calculation of the refractiveindex n for each vertex of the considered CFD solutiondomain is performed using the Gladstone-Dale relation22:
n(T, p) = 1 + ρ(T, p) · k (1)
Here, T denotes the temperature, p the pressure, ρ thedensity and k the Gladstone-Dale coefficient. For mixturesof fluids with different atomic and molecular species therepresentative Gladstone-Dale coefficientk =
∑ki · xi is used, where ki is the Gladstone-Dale
coefficient of the species i and xi the molar fraction ofthe species at the evaluated point. In order to obtain thepseudo-OH* images, the definition of the points where therays are expected to enter a detector by the position vectorr = [rx, ry, rz]
T and the unit vector T = [Tx, Ty, Tz]T which
correspond to the opposite direction of the light that wouldenter a detector is necessary. Integrating the eikonal equation,each ray is obtained. The eikonal equation describes theelectromagnetic wave propagation on a path s under theassumption of geometrical optics in a scalar field n(r) ofcontinuously changing refractive index n23:
d
ds
[n(r)
dr
ds
]= ∇n(r) (2)
Then equation 2 is split into two differential equations offirst order and solved using the Runge-Kutta method of orderfive:
Prepared using sagej.cls

Tonti et al. 3
drds
=Tn(r)
(3)
dTds
= ∇n(r) (4)
Here, r and T are part of the vectors of initial conditionsrequired by the solver. The solver stops as soon as thecalculated position vector r(s) is outside of defined geometryboundaries and then outputs a solution set of vectors [r(s =0) . . . r(s = send)]T that represent the points on the ray. Thethermodynamic properties (temperature T , pressure p and aset of mass fractions X = [wH2 , wH2O, wO2 , wOH ]) at thevertices of the grid elements along the ray are obtained byinterpolation once the solution of the ray is available. Theyserve as inputs for a routine that determines the emissionspectrum eλ and absorption spectrum κλ for their respectivepoints. Subsequently, the radiative transfer equation is solvedin the spectral range of interest (305-320 nm) for eachwavelenght starting from the physical origin of the raytowards the detector. The obtained spectral radiance is thenmultiplied with the transmittance of the OH* filter. Thenext step is integrate the spectral filtered radiance over thewavelength range 305-320 nm using Simpson’s rule, and thespectral radiance is obtained for all the points of interest ona single ray. The tool developed follwing this procedure isnamed Spectral Modelling And Ray Tracing (SMART) tool.
HF-9 Test case descriptionThe test case to which SMART is applied is the one presentedin the frame of the 4th modelling workshop of the RESTcommunity. The focus of the modelling workshop was thecombustion chamber D (BKD), operated at the test bench P8at DLR Institute of Space Propulsion in Lampoldshausen.It is a cylindrical combustor which shows self-excitedcombustion instabilities at certain load points. The injectorhead has 42 shear coaxial injectors and combustion chamberpressure can reach up to 80 bar. The chamber has a diameterof 80 mm, the injectors have a recess of 2 mm and a taperangle of 5 degrees. The measurement ring is equipped witheight dynamic pressure sensors which are installed and flushmounted at equiangular positions along the circumference ofthe measurement ring. The measurement plane of the ring is5.5 mm downstream the faceplate. Figure 1 shows the BKDgeometry.The measurement ring is equipped with three optical probes.Figure 2 shows the position of the probes together with theline of sight and collection angle.
The fields of view of the probes are aligned in differentways with respect to the outer row of injectors. One probeis aligned with the axis of an outer element, the othertwo are aimed along a tangent of the LOx post, withthe line of sight passing through the shear layer betweenoxygen and hydrogen streams. Light from the combustionchamber enters the probes and passes into an optical fibre.Upon exiting the optical fibre the light passes through aninterference filter with a pass band in the UV wavelengthrange of 305-315 nm. The filtered light is collected by aphotomultiplier and the voltage output signal is recordedwith a sampling rate of 100 kHz. The effective frequency
Figure 1. Combustion Chamber BKD
Figure 2. Alignment of optical probes
response range of the photomultipliers is up to approximately30 kHz. For the chosen load point, the 1T mode shows self-excited combustion instability with an amplitude of 3.4 bar.
The data collected by the optical probes show that thecombustion dynamics is dominated by the LOx post resonantfrequencies24, which are multiples of 5 kHz. However, fromthe experiment it was unclear how the flame was modulatedby the dominant frequencies. This gives a motivation forthe use of a URANS simulation, in order to investigatemore in detail the flame dynamics. Another feature of theselected load point is the interaction of the 1T mode of thechamber and 2L mode of the LOx post, as they are very closein frequency, with a difference below 200 Hz. Moreover,in the experiment, OH* fluctuations and acoustic pressurefluctuations are mostly in phase for the described unstableconditions.
Numerical Modelling
First, a steady state simulation (RANS) under the prescribedoperating conditions is run. Then, for the BKD case anunsteady simulation (URANS) is run in order to investigatethe flame response under excitation in a representative sub-domain of the combustion chamber containing the flamefrom a single injector. The final step is the application ofSMART with the production of pseudo-OH* images and theevaluation of the intensity at one of the probe locations inBKD. The images and signals obtained are then comparedwith the experimental data. The simulations are run withDLR in-house code TAU. a 2D axisymmetric single injector
Prepared using sagej.cls

4 Symposium on Thermoacoustics in Combustion: Industry meets Academia (SoTiC 2021) XX(X)
subdomain was chosen. The radius of the representativechamber volume is 6.2 mm to make the area swept fromthe radius be 1/42 of the real chamber cross section, and thedomain includes the oxygen dome and orifice. The choiceof subdomain and axisymmetric model was made in order toreduce the computational time and costs of the simulation forthe unsteady case and it is justified because the wavelengthof the 1T mode is much greater than the dimensions of thesingle injector. Figure 3 shows the computational domain andboundary conditions adopted for the RANS simulation.
Figure 3. 2D computational domain and boundary conditionsfor RANS simulation.
The mesh is fully unstrctured with about 55 K nodes andrefined in the near injection region in order to correctlycapture the shear layer between the oxygen and hydrogenstreams. Table 1 summarizes the operating conditions of thesimulated load point.
Mass flow H2 [kg/s] 0.02Mass flow O2 [kg/s] 0.14Temperature H2 [K] 95.3Temperature O2 [K] 110.6
Chamber Pressure [bar] 80Table 1. Input data for the simulation. They correspond to theoperating conditions of the simulated load point.
After running the steady state simulation, the radiallyaveraged speed of sound profile and density wereinterpolated on a cylindrical domain with a diameter of80 mm, matching the real experimental combustor. Theacoustic modes of the chamber volume were estimated withthe commercial software COMSOL® Multiphjysics usingthe Helmholtz solver. The nozzle was modeled with animpedance boundary condition to calculate the 1T mode.The3D solution of the pressure distribution for the 1T mode wasused to create a pressure disturbance profile which could besuperimposed to the mean pressure on the single injector sub-domain in order to simulate the 1T mode excitation of thesingle injector in the outer row.In order to apply the presented method, the results of the2D excited simulations were interpolated on a 3D cylindricaldomain representative of the single injector domain volume.Subsequently, the algorithm was applied to get the intensityof the light captured by the probe and compare the obtainedsignal with the experimental data.Figure 4 shows the speed of sound, density and OHdistribution resulting from the RANS calculation.
Speed of sound and density distribution are then radiallyaveraged in order to obtain a distribution of the variablesalong the axis to be subsequently interpolated on acylindrical domain. Then, the Helmholtz equation in thenew domain is solved in COMSOL® and the correspondingeigenfrequencies and eigenmodes are obtained. Figure 5
(a) Speed of sound distribution
(b) Density distribution
(c) OH mass fraction distribution
Figure 4. Distribution of the relevant variables for acousticanalysis and radiation model.
shows the profiles of the variables along the axis and theresulting 1T mode profile. Table 2 summarizes the relevantcalculated and experimental eigenfrequencies.
Figure 5. Radially averaged speed of sound and densitydistribution along the axis and resulting 1T mode.
Simulation Experiment1T mode [Hz]: 11700 102202T mode [Hz]: 17667 166801R mode [Hz]: 21224 204603T mode [Hz]: 22940 22780
Table 2. Frequencies of the relevant eigenmodes of thechamber calculated with COMSOL®.
The procedure described above provides the frequency ofthe excitation which has to be imposed on the domain tomodel the 1T mode excitation. Once that the frequency ofthe excitation has been determined, the pressure disturbanceprofile has to be imposed on the numerical domain.The disturbance is imposed as an harmonic fluctuation
Prepared using sagej.cls

Tonti et al. 5
Figure 6. Axial profile of the pressure disturbance imposed onthe computational domain p′
at the excitation frequency f with amplitude A given bythe experimental data. As it can be seen from Table 2,the simulated frequencies does not match perfectly theexperimental ones. This is probably due to the boundaryconditions used in the acoustic simulation, which have to beimproved to have a better match.
p = p+ p′ (5)
where p′ has the form of:
p′ = Acos(πx
2L) (6)
where L denotes the length of the domain. In order toimpose the pressure disturbance, the inviscid wall boundarycondition used on the domain for the RANS simulation hasto be replaced with a farfield boundary condition. It is usedhere to represent an internal fluid boundary and it is definedby specifying the mixture properties at every point on theboundary surface and it allows to impose a distribution ofproperties along the boundary surface. Figure 6 shows asketch of the imposed excitation profile of the magnitude ofthe unsteady pressure along the domain boundary.
Probe ModellingBefore running SMART on the results of the URANSsimulation, a modelling of the optical probe which capturesthe light is needed, in particular of the view angle. Theview angle of the probe is determined by the rays thatreach the circular boundary of the fiber-optics face. Theprobe is approximated to an observation cone with a vertexrepresenting a sink for radiation, indicated withB. The probesurface is assumed to be non-reflective. The total radiationreaching the probe is then obtained by equation 7:
φ(B) =
∫ ∞0
∫Ω
τν,OHIν(B, ~u)∣∣~u · ~nB∣∣ dΩdν (7)
where τν , ~u, ~nB and Ω are the probe’s transmissivityfunction of the wavenumber ν, the radiation direction vector,the normal unit vector of the surface at point B (consideredas the probe’s pointing vector) and the solid angle givenby the observation cone, respectively. Iν represents theintegrated total radiance.
Figures 7a and 7b show the relative location of the BKDchamber and CFD domain boundary and the cross-sectionview of the trajectory of the rays, respectively. The originof the observation cone which identifies the probe domainis indicated in figure 7a as Probe Origin. Radiation comingfrom other surrounding flames is neglected as it is assumedthat the radiation detected by the selected probe would comemostly from the flame located at injector 10.
(a) Geometry of the global domain.
(b) Geometry of the CFD domain.
Figure 7. Schematics of the domain geometry with renderedray paths.
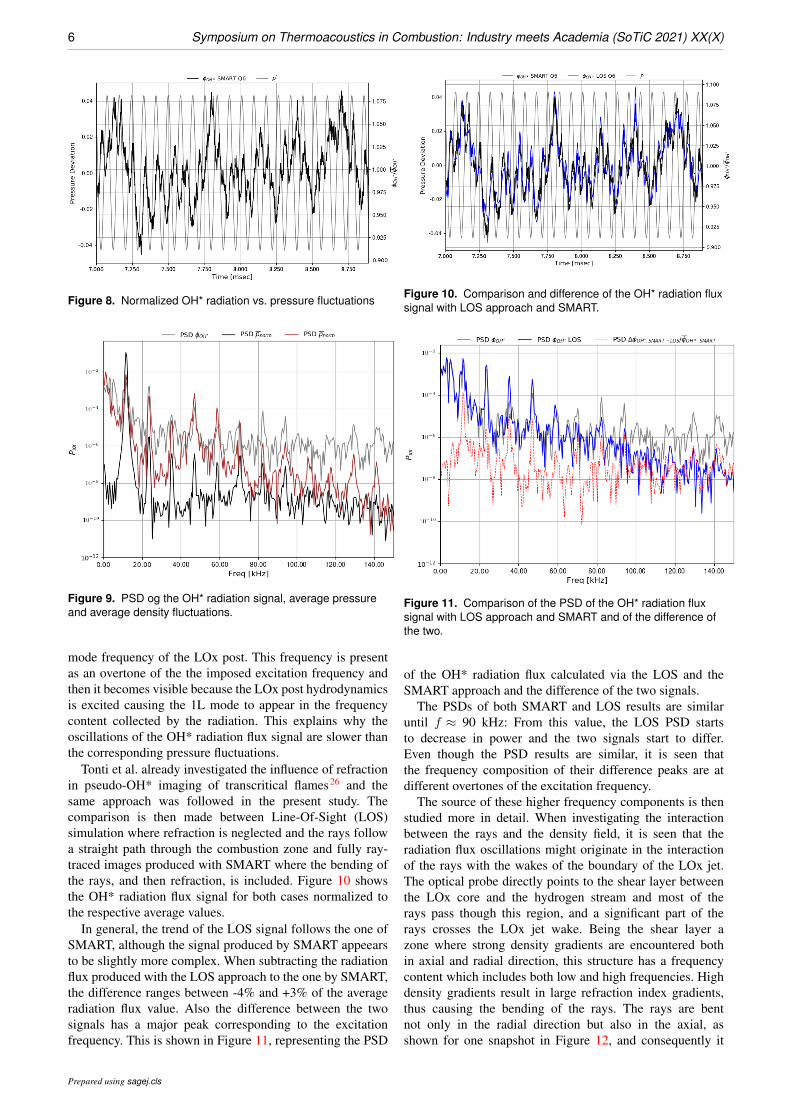
ResultsFigure 8 shows the flux of the OH* raidation signal collectedby the probe together with the applied pressure disturbancefluctuations.
It can be seen that radiation has a major frequencycomponent of the same value as the pressure with a phasedifference smaller than π/2. Higher and lower frequencycomponents are also visible. To try and explain the presenceof these components, a PSD analysis of the OH* radiationsignal is compared to the normalized average pressure p anddensity ρ signals , as shown in Figure 9.
The peak at f ≈ 11800 Hz is close to the calculatedfrequency of the 1T mode f1T = 11700 Hz and it isdistinguishable in all the three signals. The next observablepeaks can be considered as overtones. Focusing on the OH*radiation signal, the power content of the peaks shown inFigure 9 is similar and this explains the complexity of thesignal displayed in Figure 8.
Focusing on the range up to 10 kHz, the OH* radiationsignal shows a peak at f ≈ 5400 Hz. Based on theexperimental investigation conducted by Armbruster et al.25,it is reasonable to state that this peak corresponds to the 1L
Prepared using sagej.cls
6 Symposium on Thermoacoustics in Combustion: Industry meets Academia (SoTiC 2021) XX(X)
Figure 8. Normalized OH* radiation vs. pressure fluctuations
Figure 9. PSD og the OH* radiation signal, average pressureand average density fluctuations.
mode frequency of the LOx post. This frequency is presentas an overtone of the the imposed excitation frequency andthen it becomes visible because the LOx post hydrodynamicsis excited causing the 1L mode to appear in the frequencycontent collected by the radiation. This explains why theoscillations of the OH* radiation flux signal are slower thanthe corresponding pressure fluctuations.
Tonti et al. already investigated the influence of refractionin pseudo-OH* imaging of transcritical flames26 and thesame approach was followed in the present study. Thecomparison is then made between Line-Of-Sight (LOS)simulation where refraction is neglected and the rays followa straight path through the combustion zone and fully ray-traced images produced with SMART where the bending ofthe rays, and then refraction, is included. Figure 10 showsthe OH* radiation flux signal for both cases normalized tothe respective average values.
In general, the trend of the LOS signal follows the one ofSMART, although the signal produced by SMART appeearsto be slightly more complex. When subtracting the radiationflux produced with the LOS approach to the one by SMART,the difference ranges between -4% and +3% of the averageradiation flux value. Also the difference between the twosignals has a major peak corresponding to the excitationfrequency. This is shown in Figure 11, representing the PSD
Figure 10. Comparison and difference of the OH* radiation fluxsignal with LOS approach and SMART.
Figure 11. Comparison of the PSD of the OH* radiation fluxsignal with LOS approach and SMART and of the difference ofthe two.
of the OH* radiation flux calculated via the LOS and theSMART approach and the difference of the two signals.
The PSDs of both SMART and LOS results are similaruntil f ≈ 90 kHz: From this value, the LOS PSD startsto decrease in power and the two signals start to differ.Even though the PSD results are similar, it is seen thatthe frequency composition of their difference peaks are atdifferent overtones of the excitation frequency.
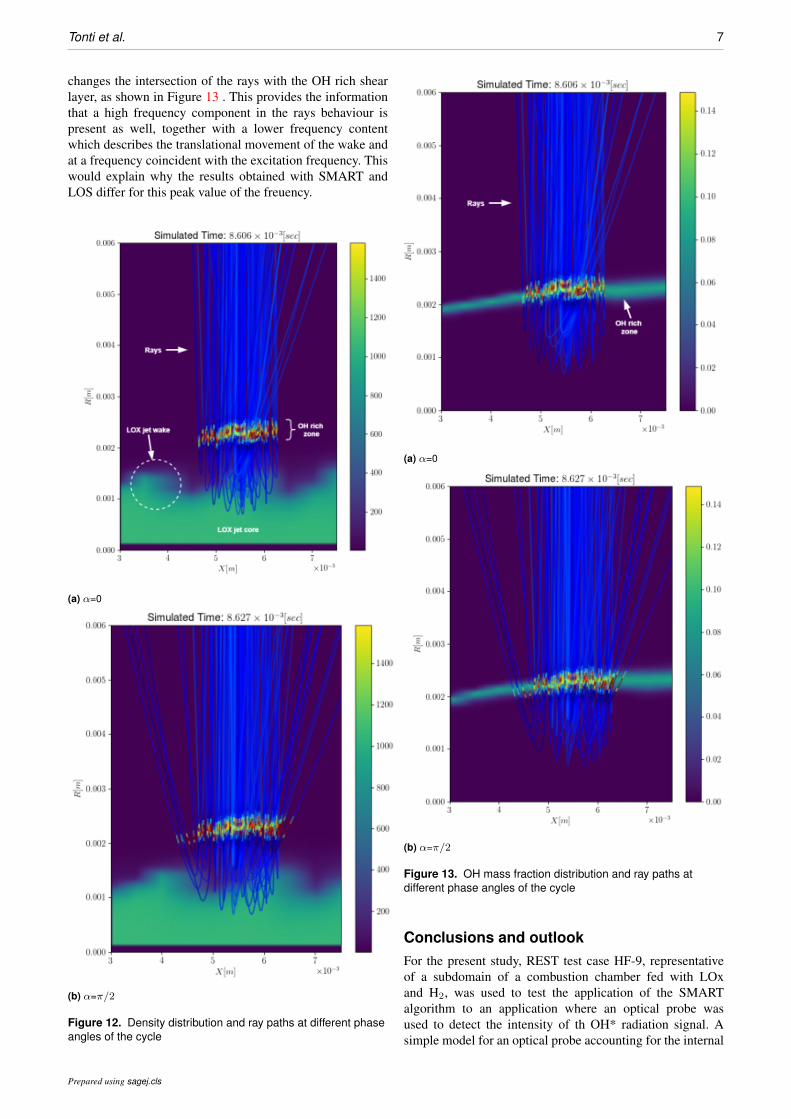
The source of these higher frequency components is thenstudied more in detail. When investigating the interactionbetween the rays and the density field, it is seen that theradiation flux oscillations might originate in the interactionof the rays with the wakes of the boundary of the LOx jet.The optical probe directly points to the shear layer betweenthe LOx core and the hydrogen stream and most of therays pass though this region, and a significant part of therays crosses the LOx jet wake. Being the shear layer azone where strong density gradients are encountered bothin axial and radial direction, this structure has a frequencycontent which includes both low and high frequencies. Highdensity gradients result in large refraction index gradients,thus causing the bending of the rays. The rays are bentnot only in the radial direction but also in the axial, asshown for one snapshot in Figure 12, and consequently it
Prepared using sagej.cls
Tonti et al. 7
changes the intersection of the rays with the OH rich shearlayer, as shown in Figure 13 . This provides the informationthat a high frequency component in the rays behaviour ispresent as well, together with a lower frequency contentwhich describes the translational movement of the wake andat a frequency coincident with the excitation frequency. Thiswould explain why the results obtained with SMART andLOS differ for this peak value of the freuency.
(a) α=0
(b) α=π/2
Figure 12. Density distribution and ray paths at different phaseangles of the cycle
(a) α=0
(b) α=π/2
Figure 13. OH mass fraction distribution and ray paths atdifferent phase angles of the cycle
Conclusions and outlookFor the present study, REST test case HF-9, representativeof a subdomain of a combustion chamber fed with LOxand H2, was used to test the application of the SMARTalgorithm to an application where an optical probe wasused to detect the intensity of th OH* radiation signal. Asimple model for an optical probe accounting for the internal
Prepared using sagej.cls

8 Symposium on Thermoacoustics in Combustion: Industry meets Academia (SoTiC 2021) XX(X)
refraction occurring in the sapphire rod was developedwith an angle of observation of the cone of 2.39. Theestimated OH* radiation flux signal was investigated. Thesignal has a major component at the excitation frequencyof the pressure field, which corresponds to the estimated 1Tmode frequency of the combustion chamber. Additionally, alower frequency peak is observed at f ≈ 5.4 kHz which isreasonable to consider the 1L mode of the LOX post, as thishas been modeled in the URANS simulations. Predominanthigher frequencies observed were found to correspond toovertones of the excitation frequency. A comparison betweenthe SMART and line-of-sight (LOS) results show that bothfollow a similar trend. The first presents higher frequencycomponents. The difference between the two signals showsthat the maximum deviation is ≈ 4% of the mean radiationflux. This deviation occurs at a frequency which correspondsto the excitation frequency and its overtones. The effectsof including refraction are visible when performing a PSDanalysis, as it impacts the spectral power distribution of theOH* radiation flux signal on the overtones of the excitationfrequency. Rays are refracted when passing through the LOXjet wake. The main frequency component is linked to thewake traslation movement, corresponing to the excitationfrequency. Turbulent structures with a higher frequencycomponent in the shear-layer result in spatial scattering ofthe rays which alters their path through the OH rich zonesmodifying the overall intensity of the signal. OH rich zonesdo not modify their spatial structure. This leads to theconclusion that refraction may play a role in the frequencycomposition of the radiation signal collected by the probe.SMART allowed to perform this analysis and gain moreinsights about the flame dynamics under excitation using theintensity of the radiation of OH* fluctuations. A quantitativeapproach using a DMD analysis and the parametric studyof refraction and OH rich shear layer composition of botheffects should be conducted to have further details about thisphenomenon.
References
1. Bedard MJ, Fuller TL, Sardeshmukh S et al. Chemilumines-cence as a diagnostic in studying combustion instability in apractical combustor. CombustFlame 2020; 213: 211–225.
2. Sardeshmukh SV, Bedard M and Anderson WE. The use ofOH∗ and CH∗ as heat release markers in combustion dynamics.International Journal of Spray and Combustion Dynamics2017; .
3. Liu Y, Tan J, Wan M et al. Quantitative measurement ofOH* and CH* chemiluminescence in jet diffusion flames. ACSOmega 2020; .
4. Price RB, Hurle RL and Sugden TM. Optical studies of thegeneration of noise in turbulent flames. Symp Combust 1969;12(1): 1093–1102.
5. Hornstein B, Budnik C and Courtney W. Research studyof light emission caused by pressure fluctuations in rocketengines. Final Report 5520-F, AFOSR, 1966.
6. Farhat SA, Ng WB and Zhang Y. Chemiluminescent emissionmeasurement of a diffusion flame jet in a loudspeaker inducedstanding wave. Fuel 2005; 84(14-15): 1760–1767. DOI:10.1016/j.fuel.2005.03.020.
7. Freitag E, Konle H, Lauer M et al. Pressure Influence onthe Flame Transfer Function of a Premixed Swirling Flame.Turbo Expo: Power for Land, Sea, and Air 2006; Volume 1:Combustion and Fuels, Education: 477–486.
8. Lauer M and Sattelmayer T. On the adequacy ofchemiluminescence as a measure for heat release in turbulentflames with mixture gradients. Turbo Expo: Power forLand, Sea, and Air 2009; Voume 2: Combustion, Fuelsand Emissions: 535–544. DOI:10.1115/GT2009-59631.URL https://doi.org/10.1115/GT2009-59631.https://asmedigitalcollection.asme.org/
GT/proceedings-pdf/GT2009/48838/535/
2764101/535_1.pdf.9. Hardalupas Y and Orain M. Local measurements of the
time-dependent heat release rate and equivalence ratio usingchemiluminescent emission from a flame. Comb Flame 2004;139: 188–207. DOI:10.1016/j.combustflame.2004.08.003.
10. Hardi JS. Experimental investigation of high frequencycombustion instability in cryogenic oxygen-hydrogen rocketengines. PhD Thesis, University of Adelaide, Australia, 2012.
11. Lee JG and Santavicca AD. Experimental diagnostics for thestudy of combustion instabilities in lean premixed combustors.Journal of Propulsion and Power 2003; 19(5): 735–750.
12. Wasle H, Winkler A, Lauer M et al. Combustion noisemodeling using chemiluminescence data as indicator for theheat release distribution. European Combustion Meeting 2007;.
13. Wierman M, Nugent N and Anderson W. Combustionresponse of a lox/lch4 element to transverse instabilites. 47thAIAA/ASME/SAE/ASEE Joint Propulsion Conference Exhibit,American Insitute of Aeronautics and Astronautics 2011; .
14. Katrothia T, Riedel IU and Warnatz J. A numerical study onthe relation of OH∗, CH∗ and C2
∗ chemiluminescence and heatrelease. Proc Europ Combust Meet 2009; .
15. Haber LC, Vandsburger U, Saunders WR et al. An experimen-tal examination of the relationship between chemiluminescentlight emissions and heat-release rate under non adiabatic con-ditions. Proceedings of IGTI 2000; (2000-GT-0121).
16. Zhang F, Zirwes T, Habisreuther P et al. A dns analysis of thecorrelation of heat release with chemiluminescence emissionsin turbulent combustion. High Perform Comput Sci Eng’162016; : 229–243.
17. Fiala T. Radiation from high pressure hydrogen-oxygen flamesand its use in assessing rocket combustion instability. PhDThesis, Technische Universitat Munchen, 2015.
18. Burrows MC. Radiation processes related to oxygen-hydrogencombustion at high pressures. Symp Comb 1965; : 207–215.
19. Perovsek J. Ray Tracing and Spectral Modeling ofExcited Hydroxyl Radiation from Cryogenic Flames in RocketCombustion Chambers. Master’s Thesis, LuleaUniversity ofTechnology, Department of Computer Science, Electrical andSpace Engineering, 2018.
20. Zhu XL and Gore JP. Radiation effects on combustion andpollutant emission of high-pressure opposed flow methane/airdiffusion flames. CombustFlame 2005; 141(1-2): 118–130.
21. Zhu XL, Gore JP, Karpetis AN et al. The effects of self-absorption of radiation on an opposed flow partially premixedflame. CombustFlame 2002; 129(3): 342–345.
22. Gladstone JH and Dale TP. XIV. researches on the refraction,dispersion, and sensitiveness of liquids. PhilosophicalTransactions of the Royal Society of London ; 153.
Prepared using sagej.cls

Tonti et al. 9
23. Born M and Wolf E. Principles of Optics: ElectromagneticTheory of Propagation, Interference and Diffraction of Light(7th Edition). 7th ed. Cambridge University Press, 1999. ISBN0521642221,9780521642224.
24. Groning M. Untersuchung selbsterregter Verbrennungsinsta-biliaten in einer Raketenbrennkammer. PhD Thesis, RWTHAachen University, 2017.
25. Armbruster W, Hardi JS, Suslov D et al. Injector-driven flamedynamics in a high-pressure multi-element oxygen–hydrogenrocket thrust chamber. Journal of Propulsion and Power 2019;35(3): 632–644.
26. Tonti F, Perovsek J, Zapata Usandivaras J et al. Obtainingpseudo-OH* radiation images from cfd solutions of transcriti-cal flames. Combustion and Flame 2021; .
Copyright statementPlease be aware that the use of this LATEX 2ε class file isgoverned by the following conditions.
CopyrightCopyright © 2021 SAGE Publications Ltd, 1 Oliver’s Yard,55 City Road, London, EC1Y 1SP, UK. All rights reserved.
Acknowledgements
This work is associated with the Franco-German Rocket EngineStability iniTiative (REST).
Prepared using sagej.cls


![Effect of surface modification of zinc oxide on the electrochemical performances of [Ni4Al(OH)10]OH electrode](https://static.fdokumen.com/doc/165x107/6340241567d79c1de000fab3/effect-of-surface-modification-of-zinc-oxide-on-the-electrochemical-performances.jpg)