Nitrate, nitrite and nitrosamine: contents and analyses in
217
Nitrate, nitrite and nitrosamine: contents and analyses in selected foods; effect of vitamin C supplementation on N-nitrosodimethylamine formation in humans; and an investigation of natural alternatives to nitrites as preservatives in cured meat products by James Hsu, M. Sc Supervisor: Dr. Jayashree Arcot Co-supervisors: Dr. N. Alice Lee and Dr. Julian Cox A Thesis Submitted to the School of Chemical Sciences and Engineering In Partial Fulfillment of the Requirements for the Degree of Doctor of Philosophy The University of New South Wales October 2009
-
Upload
khangminh22 -
Category
Documents
-
view
4 -
download
0
Transcript of Nitrate, nitrite and nitrosamine: contents and analyses in
Nitrate, nitrite and nitrosamine: contents and analyses in
selected foods; effect of vitamin C supplementation on
N-nitrosodimethylamine formation in humans; and an
investigation of natural alternatives to nitrites as
preservatives in cured meat products
by
James Hsu, M. Sc
Supervisor: Dr. Jayashree Arcot
Co-supervisors: Dr. N. Alice Lee and Dr. Julian Cox
A Thesis Submitted to the School of Chemical Sciences and Engineering
In Partial Fulfillment of the Requirements for the Degree of Doctor of Philosophy
The University of New South Wales
October 2009
2
Acknowledgement
Research requires a thirst for knowledge and the determination and dedication to
match. In addition, a network of people including supervisors, family, friends,
colleagues and laboratory technicians all works as a team to give advice and support
when need it. That being said, I would like to give my gratitude to my main supervisor
Dr. Jayashree Arcot for her consistent and helpful supervision throughout my PhD
candidature. I would also like to extend my gratitude to Dr. Alice Lee and Associate
Professor Dr. Julian Cox for their expertise in specific parts of my research. Big thanks
goes to my close friends and colleagues for lending an ear or a shoulder whatever the
occasion calls for, or simply by hanging out with me to save my sanity at times. The
laboratory staffs are the glue that holds everything together, without their experience
and knowledge the lives of any PhD candidates would be made a lot harder. Since I
started my PhD in 2004, Eileen and Evyone had helped me in many ways, but special
thanks go to Camillo for his dedication, professionalism and support that just made it
all worthwhile. All this could only happen with the financial support from Bruce
Veness Chandler Award, and to my mum Stephanie and my siblings Patricia and Frank
for showing their love in their own distinct ways. Finally but not least, my gratitude to
my late father Michael and my grandmother for their early upbringing that made me the
man I am today.
3
Abstract Dietary nitrite intake has been implicated in numerous gastrointestinal cancers in
humans due to the formation of a group of carcinogens called N-nitroso compounds.
The need to estimate their intake is vital in establishing at risk population and to
monitor and perhaps one day manage their dietary intake. This is the first study to
estimate nitrate and nitrite in selected vegetables, cured and fresh meat in Australian
food supply using ion-paired reversed-phased HPLC. Nitrite content in meat products
analysed ranged from 0 to 83.9 mg/kg in medallion beef and Frankfurt, respectively;
nitrate content ranged from 18.7 mg/kg in minced beef to 142.5 mg/kg in salami. The
nitrite content was below the maximum limit set by the Food Standards Australia and
New Zealand. Nitrate content in selected vegetables ranged from 123 to 4850 mg/kg in
Iceberg lettuce and English spinach, respectively; only minimal nitrite at 20 mg/kg was
present in Gai choy, which was most likely due to bacterial contamination during
storage. Based on the food consumption pattern of Australians, the dietary nitrite and
nitrate intake from bacon were 1.51 and 3.42 mg per capita per day, which was below
the Adequate Daily Intake set by the European Union Scientific Committee for food in
1995. Taking into considerations of oral nitrate reduction to nitrite and the endogenous
nitrate formation, the upper extreme of dietary nitrite and nitrate intake in Australians
were 44 and 2.4 times over the ADI, respectively. However, this does not take into
effect of other dietary promoters and inhibitors. Eighteen healthy human volunteers
were put on a low nitrate, nitrite and antioxidant diet for three days during which they
were fed one serving of cured meat with and without 500 mg of vitamin C. Using GC-
MS, N-nitrosodimethylamine was not detected in the urine before or after vitamin C
supplementation, suggested that a diet low on nitrate and nitrite cannot produce NDMA
and thus may reduce the risk of developing gastrointestinal cancers. Different
extraction methods and combination of herbs and spices were demonstrated in vitro to
show inhibition against B. cereus, Escherichia coli, Listeria monocytogenes,
Salmonella Enteritidis and Staphylococcus aureus. In addition, autoclaved turmeric
powder at 0.3 % (w/v), hot water extracted turmeric with ginger at 0.5 % and rosemary
at 1.0 % showed growth inhibition against Clostridium sporogenes, which was used as
a surrogate for Clostridium botulinum. The use of these combinations of herbs and
spices may replace or at least reduce the use of nitrite as a preservative in cured meat
products to prevent botulism and reduce dietary nitrite intake.

4
Table of Contents
Acknowledgement ................................................................................................................. 2 Abstract ..................................................................................................................................... 3 Table of Contents .................................................................................................................... 4 List of Figures .......................................................................................................................... 8 List of Tables ......................................................................................................................... 10 List of Abbreviations .......................................................................................................... 12 Chapter 1 ................................................................................................................................ 15 Introduction .......................................................................................................................... 15 1.1 Experimental aims ................................................................................................................. 16 1.1.1 Nitrate and nitrite in Australian sourced vegetables and cured meat and their estimated dietary intake by Australians ........................................................................................ 16 1.1.2 Effects of vitamin C supplementation on N‐nitrosodimethylamine formation in healthy human volunteers ................................................................................................................... 16 1.1.3 Anti‐Clostridia properties of herbs and spices and possible substitution for sodium nitrite ............................................................................................................................................ 16
Chapter 2 ................................................................................................................................ 18 Nitrate and nitrite ............................................................................................................... 18 2.1 Dietary sources of nitrates and nitrites ......................................................................... 18 2.1.1 Plant food ......................................................................................................................................... 18 2.1.2 Cured meat ...................................................................................................................................... 20 2.1.3 Water ................................................................................................................................................. 21
2.2 Nitrate, nitrite and its derivative ...................................................................................... 22 2.2.1 Mechanisms of nitrate reduction to nitrite ........................................................................ 22 2.2.2 Mechanisms of nitrite reduction to nitric oxide ............................................................... 22 2.2.3 Metabolism of nitrate, nitrite and nitric oxide ................................................................. 23 2.2.4 Physiological roles of nitrate, nitrite and nitric oxide ................................................... 26 2.2.5 Immunological effects and disease ........................................................................................ 29
2.3 Toxicity and Metabolism ..................................................................................................... 30 2.3.1 Nitrate and nitrite ......................................................................................................................... 30
2.4 Epidemiology studies ............................................................................................................ 34 2.4.1 Gastric cancer incidence ............................................................................................................ 34 2.4.2 Gastric cancer risk factors ......................................................................................................... 38 2.4.2.1 Carbohydrate............................................................................................................................................. 39 2.4.2.2 Saturated fat .............................................................................................................................................. 39 2.4.2.3 Alcohol .......................................................................................................................................................... 40 2.4.2.4 Salt, pickled and smoked food ........................................................................................................... 40 2.4.2.5 Cooking method ....................................................................................................................................... 40 2.4.2.6 Inappropriate food storage ................................................................................................................. 40 2.4.2.7 Helicobacter pylori infection ............................................................................................................... 41 2.4.2.8 Cigarette smoking ................................................................................................................................... 41 2.4.2.9 Low consumption of fruits and vegetables .................................................................................. 42 2.4.2.10 Others......................................................................................................................................................... 43
2.4.3 Estimated dietary nitrate and nitrite intake ...................................................................... 43 2.4.3.1 Asian‐pacific regions .............................................................................................................................. 43

5
2.4.3.2 United States and United Kingdom ................................................................................................. 44 2.4.3.3 Rest of Europe ........................................................................................................................................... 45 2.4.3.4 Summary ..................................................................................................................................................... 45
2.4.4 Recommended dietary nitrate and nitrite intake ............................................................ 47 2.4.4.1 International .............................................................................................................................................. 47 2.4.4.2 Food Standards Australia and New Zealand (FSANZ) ............................................................ 47
2.5 Determination of nitrate and nitrite ............................................................................... 49 2.5.1 Colourimetric and spectrophotometric ............................................................................... 49 2.5.2 Gas chromatography ................................................................................................................... 51 2.5.3 High performance liquid chromatography ........................................................................ 51 2.5.4 Ion chromatography .................................................................................................................... 53 2.5.5 Capillary electrophoresis ........................................................................................................... 55 2.5.6 Electronic sensors ........................................................................................................................ 56 2.5.7 Others ................................................................................................................................................ 56 2.5.8 Food .................................................................................................................................................... 57 2.5.9 Biological fluids ............................................................................................................................. 60
2.6 Food Industry and Regulations ......................................................................................... 65 2.6.1 Functions of nitrate and nitrite in meat‐based products ............................................. 65 2.6.2 Functions of ascorbate and erythorbate in cured meat ................................................ 67 2.6.3 International food safety ........................................................................................................... 67 2.6.4 Regulatory agencies and the government .......................................................................... 68
2.7 Determination of nitrate and nitrite in food and their estimated dietary intake .............................................................................................................................................................. 69 2.7.1 Introduction .................................................................................................................................... 69 2.7.2 Materials and Methods ............................................................................................................... 70 2.7.2.1 Reagents ...................................................................................................................................................... 70 2.7.2.2 Food samples ............................................................................................................................................. 70 2.7.2.3 Apparatus .................................................................................................................................................... 71 2.7.2.4 Standards .................................................................................................................................................... 71 2.7.2.5 Sampling and extraction ...................................................................................................................... 71 2.7.2.6 Statistical test ............................................................................................................................................ 72
2.7.3 Results and discussion ................................................................................................................ 72 2.7.4 Conclusion ....................................................................................................................................... 82 2.8 References ........................................................................................................................................... 84
Chapter 3 ................................................................................................................................ 96 Nnitroso compounds and nitrosation inhibitors ................................................... 96 3.1 Dietary sources of Nnitroso compounds ...................................................................... 96 3.2 Nnitroso compounds ........................................................................................................... 96 3.2.1 N‐nitrosamines .............................................................................................................................. 98 3.2.2 Nitrosation of amines and amides ...................................................................................... 100
3.3 Estimated dietary nitrosamine intake ........................................................................ 102 3.4 Epidemiology of cancer risks .......................................................................................... 104 3.5 Nnitrosation inhibitors .................................................................................................... 105 3.5.1 Ascorbic acid ................................................................................................................................ 105 3.5.1.1 Ascorbic acid chemistry and physiological roles ................................................................... 107 3.5.1.2 Ascorbic acid interactions with nitrate, nitrite and its derivatives ............................... 108 3.5.1.3 Kinetics and mass transfer of ascorbic acid and nitrosation ............................................ 110
3.6.2 α–tocopherol ................................................................................................................................ 112 3.6.3 Fibre ................................................................................................................................................ 113 3.6.4 Polyphenols and phytochemicals ........................................................................................ 113 3.6.5 Others ............................................................................................................................................. 114
3.7 Determination of Nnitroso compounds ..................................................................... 116 3.7.1 Volatile nitrosamines ............................................................................................................... 116 3.7.2 Non‐volatile nitrosamines ...................................................................................................... 121

6
3.7.3 Non‐volatile nitrosamides ...................................................................................................... 122 3.7.4 Nitrosamine extraction from food ...................................................................................... 123 3.7.5 Nitrosamines in biological fluids ......................................................................................... 124
3.8 Determination of vitamin C ............................................................................................. 126 3.8.1 Food ................................................................................................................................................. 128 3.8.2 Biological fluids .......................................................................................................................... 130 3.8.3 Extraction ...................................................................................................................................... 130 3.8.4 Detection ....................................................................................................................................... 131
3.9 Effects of vitamin C supplementation on Nnitrosodimethylamine formation in healthy human volunteers on a nitrate restricted diet with cured meat .............. 133 3.9.1 Introduction ................................................................................................................................. 133 3.9.2 Materials and methods ............................................................................................................ 134 3.9.2.1 Vitamin C Analysis ............................................................................................................................... 134 3.9.2.3 Form of Vitamin C used in the experiment ............................................................................... 134 3.9.2.4 Vitamin C in urine ................................................................................................................................ 135 3.9.2.5 Nitrate and nitrite analysis .............................................................................................................. 135 3.9.2.6 Analysis of meat .................................................................................................................................... 135 3.9.2.7 Analysis of saliva .................................................................................................................................. 135 3.9.2.8 Analysis of urine ................................................................................................................................... 136 3.9.2.9 Quantification of N‐nitrosodimethylamine in meat and urine ......................................... 136 3.9.2.10 Meat ......................................................................................................................................................... 136 3.9.2.11 Urine ........................................................................................................................................................ 136
3.9.2.12 Human trial ............................................................................................................................ 136 3.9.2.13 Recruitment of Volunteers: ...................................................................................................... 137 3.9.2.14 Experimental Protocol: .............................................................................................................. 137
3.10 Results and discussion .................................................................................................... 139 3.10.1 Results on nitrate conversion rate in the oral cavity ............................................... 139 3.10.2 Discussion on nitrate conversion rate in the oral cavity ........................................ 142 3.10.3 Results for nitrate and nitrite excretion in urine ....................................................... 144 3.10.4 Discussion on nitrate and nitrite concentrations in the urine ............................. 147 3.10.5 Results on the effects of vitamin C supplement on NDMA formation in vivo . 150 3.10.6 Discusssion on the effects of vitamin C supplement on NDMA formation in vivo ...................................................................................................................................................................... 152
3.10.11 Conclusion ..................................................................................................................... 160 3.11 References ........................................................................................................................... 161
Chapter 4 .............................................................................................................................. 171 Alternatives to sodium nitrite ...................................................................................... 171 4.1 Introduction .......................................................................................................................... 171 4.2 Foodborne pathogens and food poisoning ................................................................ 172 4.2.1 Clostridium species ................................................................................................................ 172 4.2.2 Common bacterial food inhibitors ...................................................................................... 174
4.3 Food preservation ............................................................................................................... 174 4.3.1 Traditional methods ................................................................................................................. 174 4.3.2 Recent methods ...................................................................................................................... 175 4.3.2.1 Alliaceae: Garlic and Onions ....................................................................................................... 175 4.3.2.2 Thymol ................................................................................................................................................. 176 4.3.2.3 Turmeric and curcuminoids ....................................................................................................... 176 4.3.2.4 Other herbs and spices ...................................................................................................................... 177 4.3.2.5 Other methods .................................................................................................................................. 181
4.4. Antibacterial properties of herbs and spices ........................................................... 182 4.5 Combinations of commercially available herbs and spices to prevent food poisoning and botulism in vitro and possible commercial application in cured meat products .............................................................................................................................. 187 4.5.1 Introduction ................................................................................................................................. 187
7
4.5.2 Materials and Methods ............................................................................................................ 188 4.5.2.1 Bacterial cultures ................................................................................................................................. 189 4.5.2.2 Reagents and media ............................................................................................................................ 189 4.5.2.3 Herbs and spices ................................................................................................................................... 189 4.5.2.4 MIC to common food borne pathogenic bacteria ................................................................... 189
4.5.3 Results and discussion ................................................................................................... 190 4.5.4 Conclusion .......................................................................................................................... 195 4.6 References ............................................................................................................................. 196
Chapter 5 .............................................................................................................................. 200 Conclusions ......................................................................................................................... 200 5.1 Overview to experimental aim one and major findings ........................................ 200 5.1 Overview to experimental aim two and major findings........................................ 200 5.3 Overview to experimental aim three and major findings .................................... 200
Appendix A .......................................................................................................................... 201 Appendix B .......................................................................................................................... 208 Appendix C ........................................................................................................................... 209 Appendix D .......................................................................................................................... 210

8
List of Figures
Figure 2.1 Names and general formulae of NOC precursors……………………….…25
Figure 2.2 General structures of NOCs……………………………………….……….25
Figure 2.3 Enterosalivary recirculation of ingested nitrate and its interaction with
gastric vitamin C in the acid stomach………………………………………………….31
Figure 2.4 Equilibrium reactions of nitrite in aqueous media……………………...….33
Figure 2.5 Environmental and dietary factors that influence gastric carcinogenesis….37
Figure 3.1 Nitrosamines found in foods and their averaged concentration……………99
Figure 3.2 Degradation of NOCs forming electrophilic products…………………....100
Figure 3.3 Mechanisms of nitrosation of a) amines and b) amides…………………..101
Figure 3.4 Reaction of ascorbic acid with nitrite……………………………………..106
Figure 3.5 Ascorbic acid and its common oxidation products……………………….109
Figure 3.6. Reaction of α–tocopherol with nitrite…………………………………....113
Figure 3.7 Mass spectral peaks for the identification and confirmation of
nitrosamines…………………………………………………………………………..117
Figure 3.8 Human trial study protocol………………………………………………..138
Figure 3.9 The mean rate (%) of nitrate conversion to nitrite in the oral cavity of 18
healthy human volunteers…………………………………………………………….140
Figure 3.10 Mean nitrate and nitrite content (mg/mL) in human saliva after fasting
overnight and after chewing cured meat (salami, hotdog and ham)……………….....142
Figure 3.11 Mean nitrate, nitrite and NDMA contents (mg/kg) of popular cured
meats……………………………………………………………………………….…144
Figure 3.12 Mean urinary nitrate (mg/mL) in healthy human volunteers consuming
cured meat and on a diet low on nitrate and nitrite over three days………………….146

9
Figure 3.13 Mean urinary nitrite in healthy human volunteers consuming cured meat
(mg/L) and on a diet low on nitrate and nitrite over three days……………………...147
Figure 3.14 Ascorbic acid content in 500 mg vitamin C tablets. Mean of five replicates
from ten tablets……………………………………………………………………….150
Figure 3.15 Effects of 500 mg vitamin C supplement on NDMA formation in healthy
human volunteers consuming different types of cured meat and on a nitrate, nitrite and
antioxidant restricited diet……………………………………………………………152

10
List of Tables
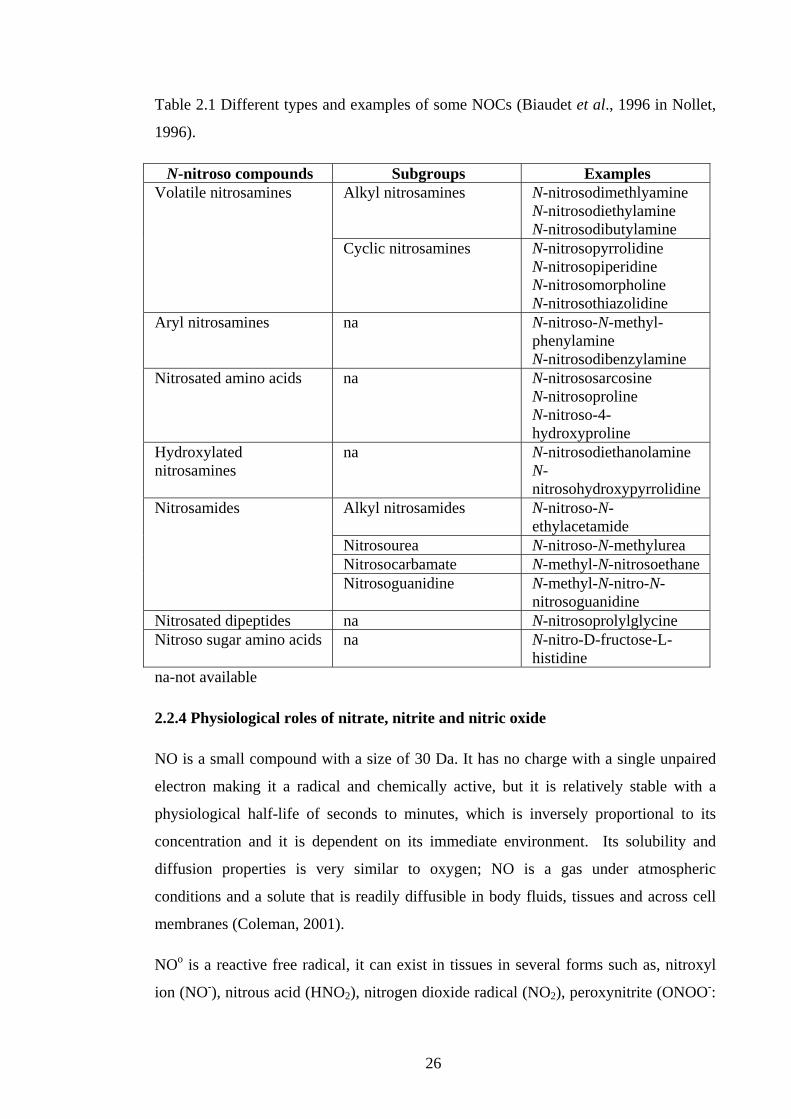
Table 2.1 Different types and examples of some NOCs……………………………....26
Table 2.2 Mean recoveries for nitrate and nitrite in selected vegetables and meat……72
Table 2.3. Mean nitrate and nitrite contents and their recoveries in fresh vegetables
after five minutes boiling…………………………………………………………...….72
Table 2.4 Mean raw nitrate and nitrite contents and recoveries in cured and fresh meat
from Sydney supermarkets after pH adjustment………………………………………73
Table 3.1 Maximal wavelength of ascorbic acid at different pH…………………….107
Table 3.2 Quantification parameters on the effects of saliva matrix on nitrate and nitrite
recoveries……………………………………………………………………………..140
Table 3.3 Individual Mean nitrate and nitrite contents in the saliva of healthy human
volunteers after rinsing with 350mg nitrate water as the control and chewed ten grams
of meat as the experiment…………………………………………………………….141
Table 3.4 Quantification parameters on the effects of urine matrix on nitrate and nitrite
recoveries……………………………………………………………………………..145
Table 3.5 Individual nitrate and nitrite contents in the urine of healthy human
volunteers before and after treatments………………………………………………..145
Table 3.6 Quantification parameters on the effects of urine matrix on ascorbic acid
recovery………………………………………………………………………………150
Table 3.7 Individual ascorbic acid and NDMA in the urine of healthy human volunteers
before and after treatments…………………………………………………………...151
Table 4.1 MIC range for various bacteria in vitro using curcumin or turmeric oil…..182
Table 4.2 MIC on selected food pathogenic bacteria using sumac spice…………….183
Table 4.3 MIC and MBC on selected food pathogenic bacteria using Viola tricolor
herb…………………………………………………………………………………...183
11
Table 4.4 MIC of various spices including allspice, clove, thyme, nutmeg and star anise
on selected Escherichia coli strains…………………………………………………..183
Table 4.5 Averaged MIC of classically or high-intensity ultrasound-extracted spices
including ginger, fingerroot and turmeric on various strains of Listeria and
Salmonella……………………………………………………………………………184
Table 4.6 Growth and survival of Escherichia coli O157 and Salmonella enterica
serovar Enteritidis in broth model systems and mayonnaise…………………………184
Table 4.7 Antibacterial activity of clove oil on Listeria monocytogenes in chicken
frankfurters…………………………………………………………………………...184
Table 4.8 Antimicrobial activities of garlic and clove on selected foodborne pathogenic
bacteria………………………………………………………………………………..185
Table 4.9 MIC of Australian native herb extracts against common food-related bacteria
using microtitre broth microdilution assay…………………………………………...185
Table 4.10 MIZ of Turkish spice extracts to the growth of E. coli O157:H7……..…185
Table 4.11 MIZ for oregano, garlic, and rosemary essential oil against common food-
borne pathogenic bacteria…………………………………………………………….186
Table 4.12 MIC for nitrite and its common derivatives or complexes on the growth of
C. sporogenes and L. monocytogenes……………………………………………...…186
Table 4.13 MIC (w/v) of common herbs and spices individually or in combination
(50:50) against common food borne pathogenic bacteria in vitro up to 72 hr……….191
Table 4.14 MIC (w/v) of common herbs and spices individually or in combination
(50:50) against Clostridium sporogenes at 24 hr..........................................................194
12
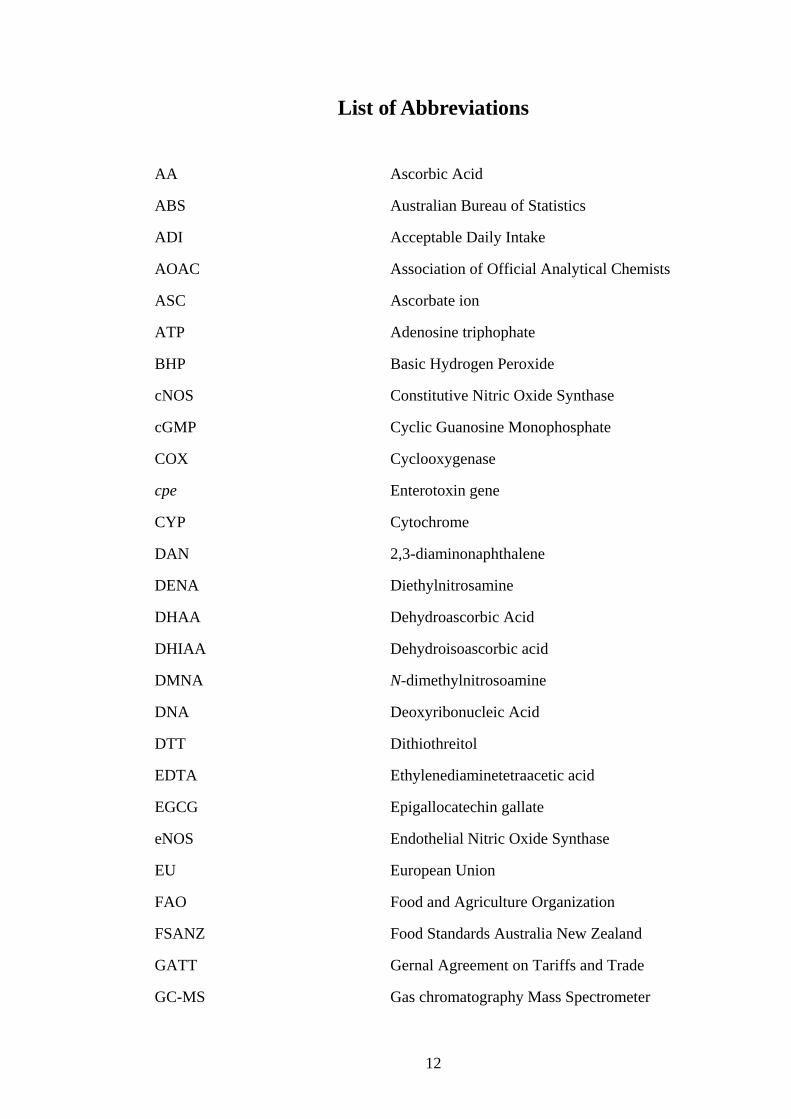
List of Abbreviations
AA Ascorbic Acid
ABS Australian Bureau of Statistics
ADI Acceptable Daily Intake
AOAC Association of Official Analytical Chemists
ASC Ascorbate ion
ATP Adenosine triphophate
BHP Basic Hydrogen Peroxide
cNOS Constitutive Nitric Oxide Synthase
cGMP Cyclic Guanosine Monophosphate
COX Cyclooxygenase
cpe Enterotoxin gene
CYP Cytochrome
DAN 2,3-diaminonaphthalene
DENA Diethylnitrosamine
DHAA Dehydroascorbic Acid
DHIAA Dehydroisoascorbic acid
DMNA N-dimethylnitrosoamine
DNA Deoxyribonucleic Acid
DTT Dithiothreitol
EDTA Ethylenediaminetetraacetic acid
EGCG Epigallocatechin gallate
eNOS Endothelial Nitric Oxide Synthase
EU European Union
FAO Food and Agriculture Organization
FSANZ Food Standards Australia New Zealand
GATT Gernal Agreement on Tariffs and Trade
GC-MS Gas chromatography Mass Spectrometer

13
GMP Good Manufacturing Practice
GRAS Generally Recognized As Safe
GS-NO S-nitroglutathione
HACCP Hazard Analysis Critical Control Points
HCA Heterocyclic Amine
HNO2 Nitrous Acid
HPLC High Performance Liquid Chromatography
HS Head Space
HTHQ 1-O-hexyl-2,3,5-trimethylhydroquinone
IAA Isoascorbic acid
IFN Interferon
IL Interleukin
iNOS Inducible Nitric Oxide Synthase
IR Infrared
LOD Limit of Detection
LOQ Limit of Quantification
MBC Minimum Bactericidal Concentration
MIC Minimum Inhibitory Concentration
MIZ Minimum Inhibitory Zone
NA Nutrient Agar
NDEA N-nitrosodiethanolamine NDMA N-nitrosodimethylamine
NMEA N-nitrosomethylethylamine
NMR Nuclear Magnetic Resonance
NOAEL No Observable Adverse Effect Level
NK Natural Killer (Cells)
NO Nitric Oxide
NO2 Nitrogen dioxide
N2O3 Dinitrogen trioxide

14
N3O4 Trinitrogen tetraoxide
NOC N-nitroso Compound(s)
NPIP N-nitrosopiperidine
NPRO N-nitrosoproline
NPYR N-nitrosopyrrolidine
NTCA N-nitrosocarboxylic acid
NTHZ N-nitrosothiazolidine
ONOOH Peroxynitrous acid
OONO- Peroxynitrite
PIC-A Tetrabutylammonium phosphate
ppb Parts Per Billion
ppm Parts Per Million
rpm Revolutions Per Minute
RNOS Reactive Nitrogrn Oxide Species
RP Reversed Phase
SCN- Thiocyanate
SPME Solid Phase Microextraction
SPS Sanitary and Phytosanitory (measures)
TBDMS Tert-butyldimethylsilyl
TBT Technical Barriers to Trade
TCEP Tris(2-carboxyethyl/phosphate)
TEA Thermal Energy Analyzer
TNF Tumor Necrosis Factor
TVC Total Vitamin C
TYG Trypticase-yeast extract glucose
UV Ultraviolet
WHO World Health Organization

15
Chapter 1
Introduction
N-nitroso compounds (NOCs) have received plenty of attention in the past five decades
as evidence suggests increasing risk of cancer in the gastrointestinal tract as dietary
nitrate and nitrite intake increases. Both anions are commonly found in food and due to
their reactive nature, together with their byproducts, can affect different systems in the
body. Nitrate and nitrite content in Australian food supply and their respective intakes
are not available for Australians, and hence the purpose of this thesis is to determine
their content in selected vegetables and cured meat products and their estimated intake.
In addition, ascorbic acid is known to reduce NOCs such as N-nitrosodimethylamine
(NDMA) in vivo, and its effectiveness will be determined in human subjects based on
restricted diet on cured meat with and without vitamin C supplement. Lastly, there is an
increasing interest in alternatives to nitrite as a food preservative in cured meat
products since they contribute to the majority of dietary nitrite intake. The antibacterial
properties of commercially available herbs and spices will be examined as well as
potential anti-Clostridia properties will be tested in vitro.
This thesis comprises of five chapters. Chapter One gives an introduction and
introduces specific experimental aims; Chapter Two provides literature review on
nitrate and nitrite followed by an analytical section on their content in selected foods
and their estimated intake; Chapter Three provides literature review on N-nitroso
compounds and their nitrosation inhibitors, followed by an analytical section on the
human trial; Chapter Four provides background on common food borne bacteria
including Clostridium species and antibacterial properties of herbs and spices, followed
by an analytical section on their potential anti-botulinal effects; and finally Chapter
Five summarizes the aims and the major findings.
16
1.1 Experimental aims
1.1.1 Nitrate and nitrite in Australian sourced vegetables and cured meat and
their estimated dietary intake by Australians
High dietary intake of nitrite can increase the production of N-nitroso compounds
(NOCs) in the stomach, which can increase the rate of gastrointestinal cancers as
shown in numerouns epidemiological studies. The preservative sodium nirite is added
to cured meat products to prevent botulism and the concentration varies from countries.
In addition, nitrate from green leafy vegetables can be converted to nitrite in the oral
cavity thus increases one’s dietary nitrite intake. The amount of nitrate contained in
these vegetables is a result of agricultural and environmental factors, which again
varies from countries. Therefore, in order to estimate the dietary intake of nitrite in the
Australian population, the current nitrate and nitrite concentrations in vegetables and
cured meat products need to be evaluated.
1.1.2 Effects of vitamin C supplementation on N-nitrosodimethylamine formation
in healthy human volunteers
N-nitrosodimethylamine (NMDA) is a potent carcinogen and is the most common N-
nitroso compound found in food and some beverages. NDMA formation is dependent
on the dietary intake of nitrate and nitrite, which is expected to increase with increasing
dietary intake of these anions. Asocrbic acid is known to reduce the formation of NOCs
by competing with nitrite ions for precursors present in the stomach. Based on 18
healthy human volunteers, this chapter will determine the concentration of NDMA in
their urine after a serving of cured meat followed by supplementation of 500 mg
vitamin C to determine its effective in reducing the formation of NDMA in vivo.
1.1.3 Anti-Clostridia properties of herbs and spices and possible substitution for
sodium nitrite
Sodium nitrite is added to cured meat products for public health measures to prevent
botulism. However, due to increasing evidence of high nitrite intake with numerous
gastrointestinal cancers, its addition is regulated in most developed countries. Many
herbs and spices have antibacterial properties that can inhibit many food poisoning
bacteria. Their antibacterial action against Clostridium botulinum has been tested and
shows great promise in replacing or at least minimizing the use of sodium nitrite as a

17
preservative. However, the combination of these herbs and spices will be looked at in
this part of the thesis since many of the active ingredients may have synergistic actions
that is worth exploring and may have commercial applications.

18
Chapter 2
Nitrate and nitrite
Nitrate and nitrite are simple anions present mainly in green leafy vegetables and cured
meat products, respectively. Their dietary sources, biochemistry and metabolism will
be revealed in this chapter.
2.1 Dietary sources of nitrates and nitrites
2.1.1 Plant food
Diet contributes to nitrosamine-related cancer in three different ways: 1) by modulating
the in vivo synthesis of nitrosamines; 2) as a source of exposure to preformed
nitrosamines, and 3) as a source of amines and nitrite that can react to form a variety of
nitrosamines in the mouth, stomach or intestine (Craddock, 1990).
Nitrates are essential plant nutrients as they are the principle source of nitrogen; the
presents of both constitutively and inducible nitrate transport systems in plants allow
the assimilation of inorganic nitrate from soil and is subject to negative feedback
regulation (Forde, 2000). Thus nitrates are naturally present in all vegetables, cereals
and fruits, although at different concentrations between plant species and plant parts.
Furthermore, nitrate concentration increases in plants grown at low light levels,
therefore northern hemisphere produces plants with higher nitrate content (Duncan et
al., 1997) than similar horticultural practices in the southern hemisphere.
Plant materials, water and soil are natural sources of nitrates as a consequence of
nitrogen fixation. The amount of nitrate present in these sources will vary from region
to region as well as dependent on its agricultural practices. For example, the use of
nitrogen-based fertilizers will greatly enhance the nitrate content of soil and hence its
crops. This may have explained the inter- and intra-variation in nitrate levels observed
between retail vegetables (Meah et al., 1994). Nitrite level in vegetables may increase
during post-harvest storage by the action of indigenous bacteria and/or the presence of
nitrate reductase (Hunt, 1994). However, under certain conditions, nitrite can be
oxidized back to nitrate (Cassens, 1995). Selecting the right cultivar and by
19
manipulating the horticultural practices can therefore reduce nitrate concentrations in
plants, as was demonstrated for English spinach (National Academy of Science, 1981).
Vegetables, particularly green leafy vegetables, contribute 80-90 % of dietary nitrate
according to Duncan et al. (1997). Thus vegetarians consume three times more dietary
nitrate than non-vegetarians at 189 mg/person/day and 61 mg/person/day, respectively
(Duncan et al., 1997). Therefore vegetables are the main dietary sources of nitrates
(Briggs and Lennard, 2002). However, the intake may vary significantly between
individuals and from day to day due to variation in consumption pattern and
horticultural practices. For example, Amr and Hadidi (2001) demonstrated that cultivar
and harvest date had some significant effect on the nitrate and nitrite levels of selected
vegetables. Although some vegetables contain low levels of nitrite, including potatoes,
tomatoes and beets, their contribution to the total dietary nitrite burden is minimal
(Walters, 1980).
Huarte-Mendicoa et al. (1997) demonstrated that fresh broccoli had traces of nitrites
and low amounts of nitrates in Spain produce, and that industrial freezing increased the
nitrate level perhaps as a result of nitrates in processing water. In addition, they showed
that cooking decreased nitrate levels in both fresh and frozen broccoli by 22 to 79 %,
and that nitrite levels were not significantly affected by either freezing or cooking. This
suggests that nitrites are more stable than nitrates in vegetables, probably due to the
lack of acidic condition in vegetables that is required to promote nitrite conversions.
Chen et al. (2004) demonstrated that at 0.30 gN/kg in the form of potassium nitrate
resulted in the optimal plant yield in three leafy vegetables. They also demonstrated
that increasing nitrate supply increased nitrate concentration in the whole plant due to
accumulation in various plant parts. Furthermore they had shown that there was a
threshold of nitrate concentration in the metabolic pool to induce nitrate reductase
activity.
White Jr. (1975) estimated that in US populations up to 80 % dietary nitrate came from
vegetables, with meat contributing only 15 %. Fruits, dairy, water and bread were
considered insignificant sources of dietary nitrate. In addition, dietary intake of nitrate
generates salivary nitrite that may contribute up to 65 % of dietary nitrite once
swallowed, followed by cured meats at 35 %. Other dietary sources of nitrite were
considered insignificant. Similarly, the estimated dietary intake of nitrate for UK was
20
95 mg/day and for nitrite was 1.4 mg/day, where vegetables contributed to over 90 %
of the nitrate intake and cured meat contributed 65 % of the nitrite intake (Knight et al.,
1987). In addition, nitrate is formed endogenously in humans at approximately 1 mg/kg
body weight per day (Gangolli et al., 1994), thus an average adult makes around 70 mg
of nitrate per day.
Australia’s food composition tables (FSANZ, 2009) were mostly based on overseas
data especially those from the United Kingdom and the United States. However, in the
revised Australian composition tables based on food analysis performed in Australia,
the edible portion of fruit increased by 4 % whereas in meat it decreased by 16 %
(Cashel and Greenfield, 1995). Thus dietary contribution of nitrates and nitrites may be
over-estimated, whereas dietary intake of antioxidants such as vitamin C and vitamin E
may have been under-estimated.
2.1.2 Cured meat
Nitrite used in meat preservation performs three diverse functions. Firstly, nitrite
imparts the desirable red color in cured meat at an initial concentration of
approximately 20 mg/kg of NaNO2 through the formation of nitrosylmyoglobin as a
result of nitric oxide reacting with myoglobin. Secondly, at concentrations of 50 mg/kg
of NaNO2, nitrite in combination with salt imparts the characteristic flavor of cured
meat. Finally, sodium nitrite is used to protect consumers from botulism by inhibiting
toxin production by the causative microbe Clostridium botulinum, and it was estimated
at least 100 mg/kg of residual NaNO2 is required for the protection under commercial
conditions (Walters, 1980). In addition, sodium nitrite can retard lipid oxidation thus
prolonging the shelf life of cured meat products (Pennington, 1998). It is apparent that
two out of three known functions of sodium nitrite added to cured meat is related to
consumer appeal and only one is important in food poisoning prevention, but the other
two functions obviously provide a vital economic incentive in the sale of cured meat
products.
Furthermore, since nitrate is much more stable than nitrite in cured meat, it is therefore
often added to provide a reservoir of nitrite during storage thorough microbial
reduction (Dennis et al., 1990). Nitrite exerts its antimicrobial effect in combination
with sodium chloride at low pH present in cured meat over time as the result of acid-
producing micro-organisms naturally present. In contrast, sodium nitrate has no direct
21
antimicrobial activity until it is reduced to nitrite by bacterial nitrate reduction (Duncan
et al., 1997).
Different authors attributed different percentage of dietary nitrate and nitrite to the
major food groups, but the consensus are that vegetables contributed to the majority of
dietary nitrate and that cured meat products contributed to the majority of dietary
nitrite. However, the nitrate and nitrite concentrations in meat samples can be
significantly reduced by boiling and roasting with boiling being more effective. Thus it
was recommended to boil meat and poultry before consumption (Ologhobo et al.,
1996).
2.1.3 Water
According to Walters (1980), drinking water supplies may contribute to the total
dietary nitrate burden. It can also vary dramatically from one country’s water supply to
the next, or even within a country since the nitrate present can vary significantly. So
besides food, tap water may contribute 10-20 mg nitrate per person per day (MAFF,
1987 in Meah et al., 1994).
The guideline for the maximum concentration of nitrate and nitrite allowed in Sydney
water supply was set at 50 and 3 mg/L, respectively (Sydney Water, 2007). This
guideline was similar to those of the European Communities for nitrate but nitrite was
set at 0.1 mg/L. These limits were introduced to prevent infantile
methaemoglobinaemia (Massey, 1991).
As part of Sydney water quality monitorty program, Sydney drinking water satisfied
the requirement at 0.02 to 2.89 mg/L of nitrate and 0.003 to 0.234 mg/L of nitrite
(Sydney Water, 2007). Assuming that each adult drinks two liters of water a day, tap
water in Australia is generally not a significant source of dietary nitrate and nitrite.
However, nitrate concentrations in natural waters had increased in many countries due
to increased use of artificial fertilizers, changes in land use and disposal of waste from
intensive farming (WHO, 1985, in Gangolli et al., 1994), which should be carefully
monitored over time and drastic changes to modern farming and land use may be
required to prevent nitrate from accumulating in the natural waterways.
22
2.2 Nitrate, nitrite and its derivative
2.2.1 Mechanisms of nitrate reduction to nitrite
In addition to the ingestion of dietary nitrite, the ingested nitrate can contribute to the
body’s total burden of nitrite by the enzyme nitrate reductase. In eukaryotic organisms,
the following equation was proposed for its nitrate reductase activity: NO3- + NAD(P)H
→ NO2- + NAD(P)+ + OH-. The NAD(P)H-nitrate reductase is the first enzyme in the
nitrate assimilatory pathway, which catalyses the reduction of nitrate to nitrite (Barbier
et al., 2004). Prokaryotic organisms, especially facultative anaerobic bacteria, can
synthesize nitrate reductase enzyme when exposed to low oxygen tension, such as the
micro-organisms residing in the oral cavities of humans (Duncan et al., 1995).
The total nitrite level in humans may not all come from dietary sources. For example,
Shiotani et al. (2004) demonstrated that Helicobacter pylori positive patients had
significantly higher nitrite concentrations in their gastric juice compared to H. pylori
negative patients. In addition, they had shown that the nitrite contents in H. pylori
positive patients decreased after the eradication of H. pylori. Hence the bacterium may
have a role in nitrate-reduction in the stomach cavity.
It was suggested that H. pylori infection reduces stomach acid secretion thereby
inhibiting the conversion from nitrite to NO in the stomach. Therefore more nitrite is
accumulated in the stomachs of H. pylori positive patients. It was proposed by Shiotani
et al. (2004) that H. pylori increases gastric nitrite concentration by promoting the
conversion of nitric oxide (NO) to nitrite due to more alkaline stomach pH and
inflammation with increased formation of superoxide anion. In addition, Shiotani et al.
(2004) had shown that the higher stability of nitrite at neutral pH reduced its reactivity
with other components present in the gastric content. This should decrease the
formation of NOCs and decrease the risk of gastric cancer. However, to the contrary,
the incidence of gastric cancer is higher in people infected with H. pylori, which may
be due to its irritation effects on the lining of stomach cells causing them to divide
uncontrollably.
2.2.2 Mechanisms of nitrite reduction to nitric oxide
Nitrite under acidic condition is converted to nitrous acid and other reactive nitrogen
species (see equations below), which can cause nitration of aromatic compounds such

23
as tyrosine, de-amination of DNA bases, and nitrosation of amines (Pannala et al.,
2003).
NO2- + H+ → HNO2
2HNO2 → H2O + N2O3
N2O3 → NO + NO2
3HNO2 → HNO3 + 2NO + H2O
HNO2 + 2HNO3 → H3O+ + 2NO3- + NO+
In addition, haemoglobin had been shown to act as nitrite reductase, where
haemoglobin becomes deoxygenated, vacant haem become nitrite reductase to produce
methemoglobin and nitric oxide (see equations below). As the pH decreases, the
reaction of nitrite reductase by deoxyhaemoglobin increases. However, under
oxygenated conditions, nitrite is oxidized to nitrate by oxyhaemoglobin. This process is
thought to perform a vasodilation function by the nitric oxide generated (Gladwin et
al., 2004).
NO2- + haemoglobin-FeII (deoxyhaemoglobin) + H+ → haem-FeIII (methemoglobin) +
NO + OH-: NO + haem-FeII → haem-FeII-NO (Doyle et al., 1981, in Gladwin et al.,
2004).
Interestingly, in the presence of nitrite and under aerobic condition, plant nitrate
reductase produces NO and its toxic derivative peroxynitrite (Yamasaki and Sakihama,
2000). How much this process contributes to the body’s total level of nitrite and
reactive nitrogen derivatives is not known. However, it is commonly suggested that
plant food do not contribute much to the total dietary nitrite intake.
2.2.3 Metabolism of nitrate, nitrite and nitric oxide
The major source of dietary nitrate and nitrite are vegetables and cured meat products,
respectively. Once ingested, approximately 20 % of the nitrates can be reduced to
nitrite by nitrate-reducing bacteria situated on the posterior surface of the tongue
(Mowat and McColl, 2001). The salivary glands can concentrate dietary nitrates and
secrete them into the saliva. In addition to nitrate-reducing bacteria, mammalian
24
possesses nitrate reductase, which can also reduce part of the ingested nitrate to nitrite
(Duncan et al., 1995).
Once swallowed, nitrate and nitrite is absorbed in the stomach and proximal small
intestine. It was estimated that approximately 25 % of ingested nitrate is re-circulated
in the plasma and saliva, and approximately 75 % of ingested nitrate is excreted mainly
in urine, with little excreted in sweat and faeces (Pannala et al., 2003). Mitsui and
Kondo (2000) demonstrated that at least 1 % of dietary nitrate was excreted as breath
N2O. In addition, older subjects gave higher N2O than younger subjects indicated that
dietetary nitrate was reduced rapidly in the upper inestine with more bacteria inhabiting
their gut. Nitrite on the other hand, can react with hydrochloric acid in the stomach to
form nitrous acid, nitric oxide, as well as other reactive nitrogen species (Pannala et al.,
2003).
It was demonstrated by Pannala et al. (2003) that high nitrate intake from food lead to a
significant increase in nitrate and nitrite concentrations in the urine and saliva. Plasma
nitrate level also increased correspondingly, but there were no changes in the plasma
nitrite concentration. They also demonstrated that the maximum urinary nitrate
excretion occurred 4 to 6 hours after the consumption of high-nitrate meal, and that the
absorption of nitrate from organic nitrate source such as food was slower than from
inorganic nitrate salt. It was proposed that organic dietary sources must undergo the
additional extraction step and hence takes longer to be absorbed.
Some ingested nitrite can bind with numerous precursors (Figure 2.1) or nitrosatable
amines to form powerful carcinogens known as N-nitroso compounds
(NOCs)(International Agency for Research on Caner, 1987). Two major groups of
NOCs include N-nitrosamine and N-nitrosamide (Figure 2.2) with some examples
shown in Table 2.1. The former requires metabolic transformation by cytochrome
P450-dependent hydroxylation to form an alkylating agent α-hydroxynitrosamine
(Tricker and Preussmann, 1991). In contrast, N-nitrosamide is chemically reactive and
is not stable at physiological pH and decomposes to form an alkylating agent (Shank,
1975).

25
Figure 2. 1 Names and general formulae of NOC precursors (Shephard et al., 1987).
Figure 2. 2 General structures of NOCs (Shank, 1975).
26
Table 2.1 Different types and examples of some NOCs (Biaudet et al., 1996 in Nollet,
1996).
N-nitroso compounds Subgroups Examples Volatile nitrosamines Alkyl nitrosamines N-nitrosodimethlyamine
N-nitrosodiethylamine N-nitrosodibutylamine
Cyclic nitrosamines N-nitrosopyrrolidine N-nitrosopiperidine N-nitrosomorpholine N-nitrosothiazolidine
Aryl nitrosamines na N-nitroso-N-methyl-phenylamine N-nitrosodibenzylamine
Nitrosated amino acids na N-nitrososarcosine N-nitrosoproline N-nitroso-4-hydroxyproline
Hydroxylated nitrosamines
na N-nitrosodiethanolamine N-nitrosohydroxypyrrolidine
Nitrosamides Alkyl nitrosamides N-nitroso-N-ethylacetamide
Nitrosourea N-nitroso-N-methylurea Nitrosocarbamate N-methyl-N-nitrosoethane Nitrosoguanidine N-methyl-N-nitro-N-
nitrosoguanidine Nitrosated dipeptides na N-nitrosoprolylglycine Nitroso sugar amino acids na N-nitro-D-fructose-L-
histidine na-not available
2.2.4 Physiological roles of nitrate, nitrite and nitric oxide
NO is a small compound with a size of 30 Da. It has no charge with a single unpaired
electron making it a radical and chemically active, but it is relatively stable with a
physiological half-life of seconds to minutes, which is inversely proportional to its
concentration and it is dependent on its immediate environment. Its solubility and
diffusion properties is very similar to oxygen; NO is a gas under atmospheric
conditions and a solute that is readily diffusible in body fluids, tissues and across cell
membranes (Coleman, 2001).
NOo is a reactive free radical, it can exist in tissues in several forms such as, nitroxyl
ion (NO-), nitrous acid (HNO2), nitrogen dioxide radical (NO2), peroxynitrite (ONOO-:
27
combination of superoxide and NO) and peroxynitrous acid (ONOOH). NO may exert
a pro-inflammatory reaction, but it may also have immunoregulatory roles (Bryan,
2006).
NO has numerous functions in the human body that includes vasodilation,
inflammation, antimicrobial, and is believed to be involved in nerve signaling (Ellis et
al., 1998). NO plays a role in defense against infectious organisms, as well as
regulating the activity, growth, and death of many immune and inflammatory cells
including macrophages, T lymphocytes, mast cells, neutrophils and natural killer cells.
The principal enzyme that produces high-level sustained NO is the inducible type-2
isoform of NO synthase (iNOS-2), where the NO is rapidly oxidized to reactive NO
species that can S-nitrosate thiols to modify key signaling molecules such as kinases,
transcription factors and enzymes in mitochondrial respiration resulting in depletion of
ATP and cellular energy (Coleman, 2001).
NO is produced by endothelial cells and diffuses into smooth muscle causing
vasodilation and into vessel lumen where most of the gas is rapidly inactivated by
dioxygenation reaction with oxyhaemoglobin to form nitrate. As a result of the
diffusional barrier of NO around the erythrocyte and along the endothelium in laminar
flowing blood, the inactivation reaction of NO by haemogloin is reduced, allowing
sufficient NO can escape for vasodilation and to react in plasma and tissues to form
nitrite anions and NO-modified peptides and proteins (RX-NO) (Dejam et al., 2004).
Since NO has no cell surface receptor it enters cells indiscriminately. However, its
selectivity is dependent on three factors: Firstly, its concentrations and reactivity with
surrounding molecules. Secondly, the proximity of target cells, and thirdly the way in
which the target cells is programmed to respond (Coleman, 2001).
NO is produced by:
1. Constitutively expressed enzymes NOS-1 and NOS-3 that produce NO rapidly and
transiently at low concentrations and are activated by physiological stimuli that trigger
intracellular calcium signal such as an action potential or activation of endothelial cell
receptors by acetylcholine. They act directly with the iron atom in the haem group of
guanylyl cyclase to activate the enzyme cGMP to trigger a rapid transient cellular
response (Coleman, 2001).

28
2. Unlike NOS-1 and NOS-3, the induced enzyme NOS-2 is not expressed in resting
cells and produces NO at sustained high concentrations when it is induced by
immunological stimuli such as bacterial lipopolysaccharide or cytokines such as IL-1,
TNF-α or IFN-γ. They have indirect effects because they are unstable at high
concentrations and are rapidly oxidized under aerobic conditions to reactive nitrogen
oxide species (RNOS) (Coleman, 2001).
Under gaseous conditions the RNOS formed are nitrogen dioxide (NO2), dinitrogen
trioxide (N2O3) and trinitrogen tetraoxide (N3O4), but under aqueous biological
conditions the major oxidative product is dinitrogen trioxide. RNOS can be hydrolysed
and excreted as nitrite, or nitrosate the thiol group in glutathione to produce S-
nitrosoglutathione (GS-NO) or thiol groups in proteins to generate protein-S-NO,
which inhibit the activity of many proteins including mitochondrial enzymes and
transcription factors producing long term cellular effects. Furthermore, when high
concentrations of NO is combined with high oxidative stress, superoxide (O2-) interacts
with NO to produce a highly toxic compound known as peroxynitrite (OONO-), which
irreversibly damages mitochondrial complexes I, II, IV and V, as well as acetonitase,
creatine kinase, mitrochondrial DNA and superoxide dismutase. At higher
concentrations, RNOS can induce cell toxicity by nitrosating DNA and tyrosine
residues as well as inducing lipid peroxidation (Coleman, 2001).
In addition, molecular oxygen and NOS converts L-arginine to NO and L-citrulline via
the intermediate N-hydroxgy-L-arginine involving an enzymatic process that utilizes
electrons donated by NADPH. The nitrogen atom in NO is derived from a terminal
guanidine group of the arginine side chain (Coleman, 2001). Furthermore, it was
demonstrated by Gladwin et al. (2004) that deoxyhaemoglobin can act as a nitrite
reductase that reduces nitrite to give nitric oxide.
Vetrovsky et al. (1996) proposed an alternate pathway to the well-established synthesis
of NO by NO-synthase via Hydroxy-L-arginine (OH-L-Arg), which is an intermediate
in NO production from L-arginine. They concluded that after the production of OH-L-
Arg by NO-synthase, it could decompose to NO by the action of superoxide ion.
Vetrovsky et al. (1996) also provided another possible mechanism of NO production
by hydrolysis of OH-L-Arg to hydroxylamine, which can then be oxidized to NO by
superoxide ion. Once NO is formed, it can be further oxidized to form nitrite ions. It
29
was suggested that these non-enzymic NOx formation might explain tissue formation
of nitrite from OH-L-Arg. This process may therefore increase the availability of NO
for different functions, where OH-L-Arg and hydroxylamine may serve as NO-
precursor for cells that do not possess the L-Arg/NO pathway, for example, human
monocytes.
Nitrite exists in all tissues capable of nitric oxide synthesis form L-arginine, and
Kozlov et al. (1999) suggested that the mammalian mitochondria may be a site for
nitric oxide synthase-independent NO formation from the major metabolic degradation
product nitrite.
2.2.5 Immunological effects and disease
NO have several roles in immunity: as a toxic agent towards infectious organisms, an
inducer or suppressor of apoptosis, or as an immunoregulator. Coleman (2001)
suggested that the inducible NOS-2 is likely involved in the immune response for two
reasons. Firstly, NOS-2 produces NO over days or weeks, similar to an immune
response. Secondly, NOS-2 generates high levels of NO over sustained period of time,
which is necessary to be effective as a toxic or immune regulatory mediator (Coleman,
2001).
Many immune and inflammatory cells express NOS-2 and produce NO, which
includes: fibroblasts, endothelial and epithelial cells, macrophages, antigen-presenting
cells, natural killer (NK) cells, T lymphocytes, mast cells, and neutrophils. In most of
these cells, the effect of NO is inhibitory on cell function or growth. For examples: NO
mediates NK cell destroying target cells and regulates NK cell function, it inhibits
activation of mast cells, and can enhance or inhibit neutrophil activation depending on
its concentration (Coleman, 2001).
Based on animal research on Balb/c mice, Abuharfeil et al. (2001) demonstrated the
maximum suppression of immune cell activities including the proliferation of B and T
cells, antibody production and reduction in NK (natural killer) cell occurred in the first
24 h at 100 mg/kg sodium nitrite. In addition, they had shown the immunosuppressive
effect of sodium nitrite was reversible after stopping the exposure.
The effects of NO on inflammation are concentration dependent. At low
concentrations, NO is pro-inflammatory by inducing vasodilation and the recruitment

30
of neutrophils. In contrast, at high concentrations, NO is anti-inflammatory where it
down-regulates adhesion molecules, suppresses activation and induces apoptosis of
inflammatory cells. The inhibitory effects of NO on immune cell function and growth
may be due to its inhibition of mitochondrial respiratory pathways leading to the
depletion of energy resources (Coleman, 2001).
NO regulates the death of immune cells, either by induction or inhibition of apoptosis,
or by necrosis. NO can also mediate the killing of tissue-specific cells in
immunologically mediated diseases (Coleman, 2001).
2.3 Toxicity and Metabolism
2.3.1 Nitrate and nitrite
Dietary intake of nitrate generates salivary nitrite by activities of microorganisms
residing in the mouth, which can react with secondary amines in the acidic gastric
condition and forming potentially carcinogenic N-nitrosamines amongst other reactive
intermediates of nitrogen (Dykhuizen et al., 1996). However, despite its possible
harmful effect, one of the intermediate products such as nitric oxide may provide a
significant defense against swallowed pathogens in the mouth and lower gut of humans
as the result of symbiotic actions of nitrate-reducing bacteria on the surfaces of tongue
(Duncan et al., 1995; Dykhuizen et al., 1996). Furthermore, McKnight et al. (1997) had
demonstrated that majority of dietary nitrite entering the stomach were rapidly
converted to nitric oxide therefore only small amount of nitrite can participate in
nitrosation to form NOCs. In addition, it was suggested that nitric oxides might play a
role in the normal gastric functioning.
Human oral microflora including Veillonella species, Staphylococcus aureus, S.
epidermidis and Nocardia species are known to reduce salivary nitrate to nitrite, which
was shown to protect against gastrointestinal diseases most susceptible in people
treated with antibiotics that inhibit nitrite-producing bacteria in the mouth. More
alarmingly, antibiotic misuse had been implicated in increased antibiotic resistant
human gastrointestinal pathogens (Duncan et al., 1997).
Although dietary nitrate is eliminated rapidly in the human body, some is transported to
the salivary glands and secreted in the oral cavity, where it is then microbially reduced
to nitrite and ends up in the stomach through the action of swallowing saliva (Figure
31
2.3) (Cassens, 1995). Since nitrate-reducing bacteria are more active at higher pH
values (Ruddell et al., 1976), majority of nitrate reduction occurs in the oral cavity due
to its alkaline condition.
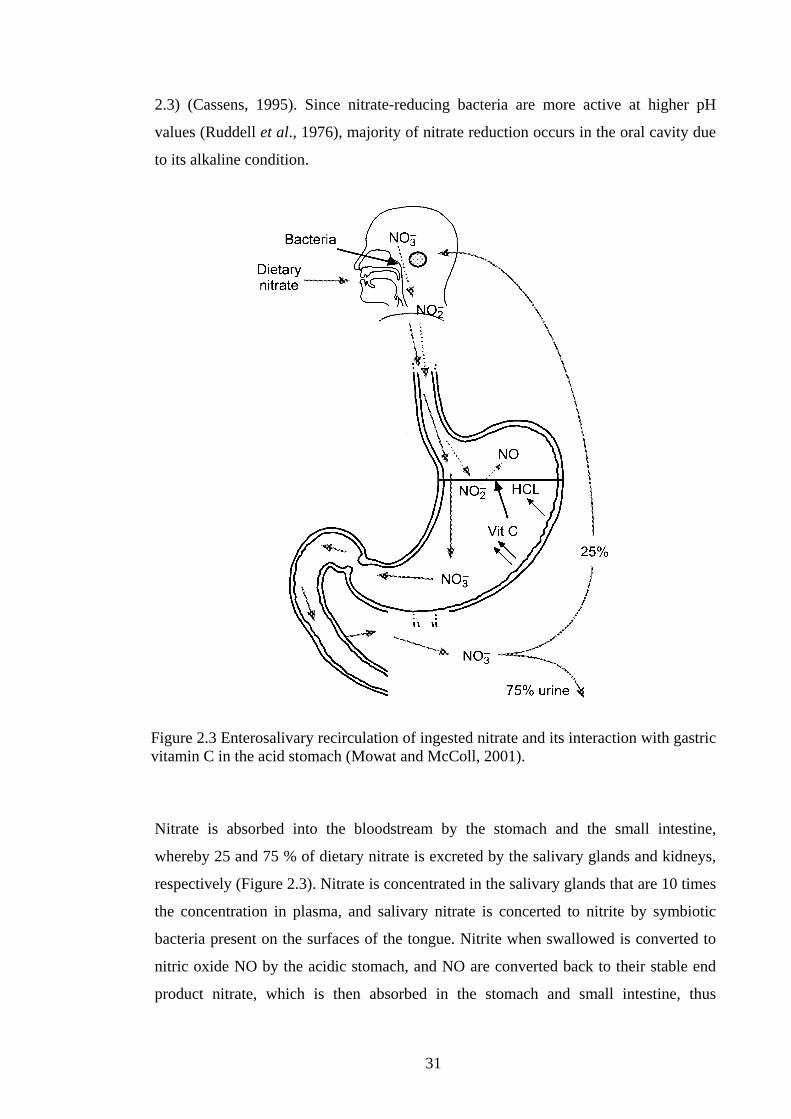
Figure 2.3 Enterosalivary recirculation of ingested nitrate and its interaction with gastric vitamin C in the acid stomach (Mowat and McColl, 2001).
Nitrate is absorbed into the bloodstream by the stomach and the small intestine,
whereby 25 and 75 % of dietary nitrate is excreted by the salivary glands and kidneys,
respectively (Figure 2.3). Nitrate is concentrated in the salivary glands that are 10 times
the concentration in plasma, and salivary nitrate is concerted to nitrite by symbiotic
bacteria present on the surfaces of the tongue. Nitrite when swallowed is converted to
nitric oxide NO by the acidic stomach, and NO are converted back to their stable end
product nitrate, which is then absorbed in the stomach and small intestine, thus

32
completing the cycle of enterosalivary circulation of nitrate. Vitamin C secreted by the
stomach lining can increase the conversion of nitrite to NO (Duncan et al., 1997).
The amount of nitrite formed in vivo is dependent on the nitrate reductase activity of
microorganisms (Gangolli et al., 1994), which accounts for approximately 20 % of the
25 % ingested nitrate being converted to nitrite in the oral cavity that is then secreted
and concentrated in the saliva. This entero-salivary recirculation pathway is the result
of 5-7 % of the total absorbed nitrate intake in healthy adults (Bottex et al., 2008).
Hence about 5 % of dietary nitrate is converted to nitrite that is dependent on the
availability and amount of nitrate consumed, which can then potentially be converted to
NOCs (Massey, 1997).
Approximately 80 % of gastric nitrite arises from this endogenous reduction of nitrate.
The other 20 % of gastric nitrite arises from ingested nitrite from preserved and smoked
meat or fish. Thus most nitrosation occurs 1 to 2 hours after a meal within the human
stomach. Gastric nitrosation may be catalysed by halides and thiocyanate in addition to
bacteria (Mirvish, 1995). Craddock (1990) suggested that the rate limiting factor was
the rate of nitrite formation by oral bacteria, and the extent of endogenous synthesis of
nitrite from sources other than vegetables, which its nitrate contents was readily
converted to nitrite.
From Figure 2.4, nitrosating agent is produced between nitrite ions (NO2-) with protons
(H+ or H3O+) to give nitrous acid (HNO2) (Tricker and Kubacki, 1992), which
dimerizes with the loss of water to form N2O3 that can react with amines forming
NOCs (Mirvish, 1995). Thus neither nitrite nor nitrous acid are nitrosating agents, but
are intermediates in the formation of nitrosating agents that includes dinitrogen trioxide
(N2O3), dinitrogen tetraoxide (N2O4) and nitrous acidium ion (H2O+NO)(Tricker and
Kubacki, 1992). Furthermore, HNO2 can also be protonated to form H2NO2+, which
has an affinity with amides to form nitrosamides (Mirvish, 1995). Since these reactions
occur in acid conditions, the stomach with its low pH provides the right kind of
condition for the formation of NOCs in vivo.

33
Figure 2.4 Equilibrium reactions of nitrite in aqueous media (Tricker and Kubacki, 1992).
Nitrates once ingested are readily absorbed from the proximal small intestine, where it
will be rapidly distributed throughout the body followed by excretion in the urine.
Blood nitrate on the other hand, is selectively transported to the saliva where
mammalian nitrate reductase activity may account for half the reduction of nitrates to
nitrite, with the other half utilised by microorganisms enzymic action (Gangolli et al.,
1994). Not many data are available on the absorption of nitrite in humans. However,
nitrite could be utilised by gut flora as a source of nitrogen (Gangolli et al., 1994),
therefore suggests absorption into the small intestines.
The bioactivity of nitric oxide (NO) is terminated by oxidation to nitrite and nitrate. In
addition, nitrite can be recycled to bioactive NO in cells and tissues, and nitrate is a
substrate for systemic generation of nitrite, thus a reverse pathway for generation of
NO from nitrate is completed (Lundberg and Govoni, 2004). Furthermore, NO can
rapidly react with superoxide to form the highly reactive free radical peroxynitrite
(ONOO-), which was demonstrated to cause tissue damage and animal mortality (Chow
and Hong, 2002).
The no observable adverse effect level (NOAEL) for nitrate based on two-years rat
studies was 2500 mg NaNO3/kg body weight per day, whereas the NOAEL for nitrite
was 10 mg NaNO2/kg body weight per day, or 6.7 mg NO2 ions/kg body weight per
day (Gangolli et al., 1994). Unlike nitrate, nitrite is genotoxic and can readily induce
methaemoglobinaemia in infants (Fan and Steinberg, 1996). In addition, the lethal dose
for nitrite in adults was estimated to be between 2 and 9 g NaNO2 per day, or 33-250
mg/kg body weight (Corre and Breimer, 1979, in Gangolli et al., 1994), whereas the
34
lethal dose for nitrate ions was estimated at 20 g per day, or 330 mg nitrate ions/kg
body weight (Leu et al., 1986, in Gangolli et al., 1994).
2.4 Epidemiology studies
2.4.1 Gastric cancer incidence
It is well established that diet contributes significantly to the development and control
of numerous diseases including atherosclerosis, diabetes mellitus, renal failure,
osteoporosis and cancer of major body organs. The incidence of cancer was
significantly higher in a typical modern Western diet compared to a diet based on
vegetables, legumes, grains, nuts and fruits (Hubbard et al., 1994). It is well known that
the combination of vitamins, minerals, antioxidants, phytochemical, low saturated fat
and fiber makes vegetarians and vegans less susceptible to a range of cancers including
cancer of the digestive systems.
It was estimated that 80 % of human cancers are caused by environmental factors
associated with food, water and air (Lathia, 1989, in Ologhobo et al., 1996). In
addition, malnutrition, dietary habits and lifestyle may be directly or indirectly related
to 40 % of the human cancers (Palmer, 1985, in Ologhobo et al., 1996).
Stomach is most at risk from endogenous NOC synthesis since acid catalyses
nitrosation reactions. High nitrate intake was associated with gastric cancer in countries
such as England, Colombia, Chile, Japan, Denmark, Hungary, Korea and Italy (Forman
et al., 1985). However, some findings were contradictory. For example, Forman et al.
(1985) concluded in their study that high-risk population had lower intake of nitrate
and nitrite than those at low risk. In addition, they found that although smokers had a
higher risk of stomach cancer than non-smokers their salivary nitrate/nitrite levels were
lower, which suggest possible protective effect of nitrates and/or nitrites. This inverse
relationship between nitrate/nitrite intake and gastric cancer incidence may be partly
explained by the inherent flaws of the food frequency method adopted by Forman et al.
(1985) to derive the crude estimate of the mean population used in their study. For
instance, food frequency method may not cover all dietary sources of nitrate and nitrite.
Furthermore, since no analyses of samples were required, it was assumed that there are
no inter- or intra-variations within food groups (Massey, 1997).

35
South Korea, Japan and China had the highest stomach cancer mortality for men, in
decreasing order. Canada, Denmark and US had the lowest stomach cancer mortality
for men, in decreasing order. For women, the highest stomach cancer mortality in
decreasing order were South Korea, China and Colombia, whereas the least gastric
cancer mortality rate for women were Denmark, Canada, and US, in decreasing order
(Joossens et al., 1996). The high gastric cancer incidence in the Far East may be due to
the consumption of specific foods high in nitrates such as Korean Kimchi, or high in
salt as in many traditional Japanese dishes, or particular food preparation method such
as broiling of meats (Duncan et al., 1997). Regions of high risk to gastric cancer often
coincide with a low intake of foods containing vitamin C. Other risk factors for human
gastric cancer include residence in areas with high nitrate-containing soil and foods
pickled with salt (Weisburger, 1981). For example, Weisburger (1981) demonstrated
the mutagenicity of Salmonella typhimurium TA 1535 found in pickled fish commonly
eaten in high risk Japan.
Chen et al. (1992) had associated certain salted fermented fish products including fish
sauce to the high gastric cancer mortality in Fujian province of China. Similarly, Seel et
al. (1994) had identified potential link of the high gastric cancer rate in Southwest
Korea, where salted pickled cabbage and salted seafood sauce were consumed in high
amount in that region. The former, also contained high levels of total NOC precursors,
and cabbages are known to contain high levels of nitrate than other vegetables.
Exposure to endogenously formed NOC had been associated with increased risks of
cancer of the stomach, oesophagus and bladder (Bartsch et al., 1990). Japan has seven
times the rate of gastric cancer than U.S., and when immigrated to US their children
showed the risk as Caucasian Americans. Thus this epidemiology study showed that
environmental factors such as diet played an important part in gastric cancer aetiology.
In addition, it was estimated that up to 30 % of cancers are diet related (Dervan, 1999).
High bacon consumption in the Netherlands in the 1960s and the consumption of
nitrite-cured meat suggested linkage to the high incidence of gastric and other
gastrointestinal cancer (Mirvish, 1995).
Joossens et al. (1996) studied dietary salt, nitrate and gastric cancer mortality in 24
countries and demonstrated that nitrate intake became an increased risk factor for
gastric cancer when salt intake was also high, but the correlation between gastric cancer

36
and sodium was stronger than with nitrate. They concluded that salt intake was the rate-
limiting factor in gastric cancer mortality at the population level. However, one
drawback from their study was the relatively small sample size from each country;
therefore the representative nature of their data and conclusion is questionable.
Populations with a high incidence of gastric cancer also exhibited a high incidence of
hypertension since salt exerted a promoting effect in both the etiology of gastric cancer
and heart diseases (Weisburger, 1981). Thus a lowered salt intake should reduce the
occurrence of hypertension and stroke as well as the risk of gastric cancer in
susceptible individuals.
It was suggested by Walters (1980) that gastric ulcers and cancer was due to the
resultant pH in the stomach rather than the pathological lesion per se, as an inverse
relationship between nitrite and hydrogen ions concentrations was shown in cases with
stomach ulcers and cancer.
There was no epidemiological link between populations with high dietary vegetable or
nitrate intake and gastric or intestinal cancer (Duncan et al., 1997). This may be due to
the increased intake of fruits and the protective role of vitamin C commonly practiced
amongst vegetarians and vegans. Figure 2.5 summarizes environmental and dietary
factors that either promote or inhibit gastric carcinogenesis.
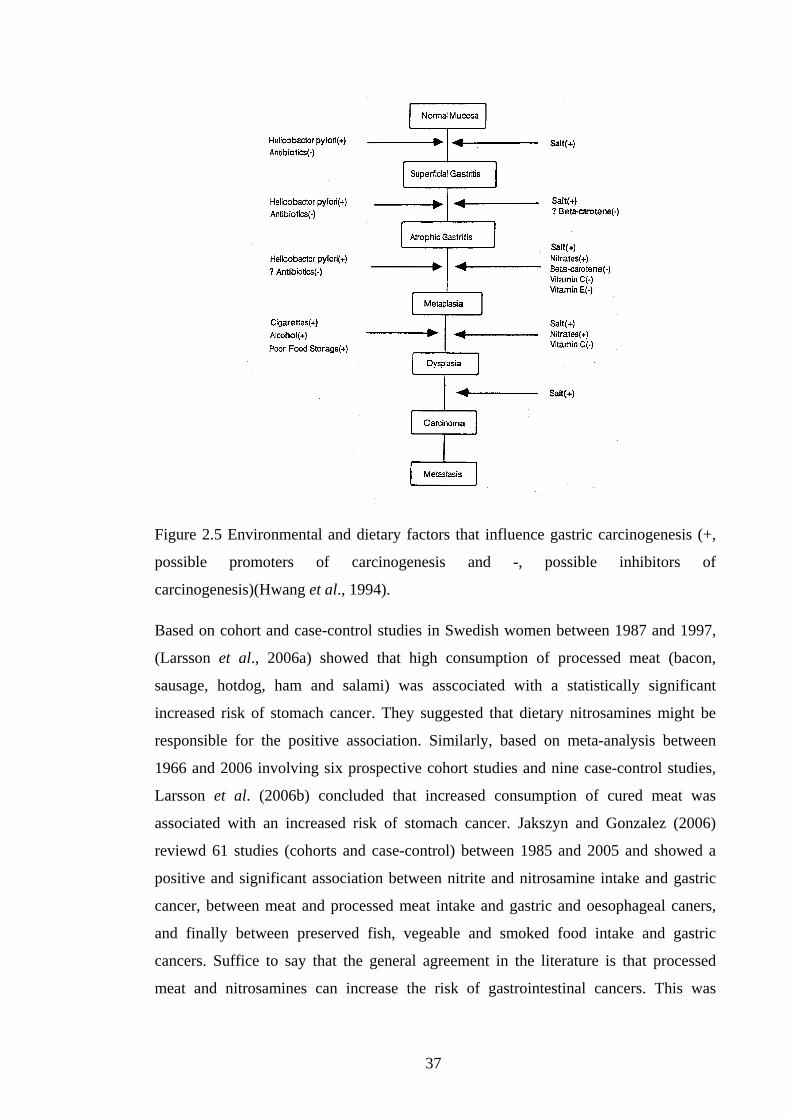
37
Figure 2.5 Environmental and dietary factors that influence gastric carcinogenesis (+,
possible promoters of carcinogenesis and -, possible inhibitors of
carcinogenesis)(Hwang et al., 1994).
Based on cohort and case-control studies in Swedish women between 1987 and 1997,
(Larsson et al., 2006a) showed that high consumption of processed meat (bacon,
sausage, hotdog, ham and salami) was asscociated with a statistically significant
increased risk of stomach cancer. They suggested that dietary nitrosamines might be
responsible for the positive association. Similarly, based on meta-analysis between
1966 and 2006 involving six prospective cohort studies and nine case-control studies,
Larsson et al. (2006b) concluded that increased consumption of cured meat was
associated with an increased risk of stomach cancer. Jakszyn and Gonzalez (2006)
reviewd 61 studies (cohorts and case-control) between 1985 and 2005 and showed a
positive and significant association between nitrite and nitrosamine intake and gastric
cancer, between meat and processed meat intake and gastric and oesophageal caners,
and finally between preserved fish, vegeable and smoked food intake and gastric
cancers. Suffice to say that the general agreement in the literature is that processed
meat and nitrosamines can increase the risk of gastrointestinal cancers. This was
38
discussed by Linseisen et al. (2006) where factors such as preservation methods,
cooking methods, and nutrient content were considered in a prospective cohort study in
27 centres across 10 European countries. They concluded that highest intake of cured
meats were in Germany, Dutch and northern European centers, but due to
manufacturing differences, the highest intake of sodium nitrite was found in Spanish
centers that also had the highest salt intake from cured meat. Central and northern
European centers consumed the most cholesterol and iron-rich processed meat, and
possible hazardous cooking methods such as deep-frying were more common for
processed meat preparation in those regions.
2.4.2 Gastric cancer risk factors
By examining the expression of endothelial nitric oxide synthase (eNOS) and inducible
nitric oxide synthase (iNOS) in samples from normal gastric muscosa and gastric
cancer, Doi et al. (1999) suggested that iNOS and not eNOS plays a role in gastric
cancer tumour metastases. Furthermore, they demonstrated that iNOS mRNA may not
be induced by either alpha-tumour necrosis factor (α-TNF) or interleukin-6 (IL-6).
The molecular markers to tumour characteristics and metastatic potential including
NOS, cyclooxygenase (COX) expression and p53 status in patients with gastric
adenocarcinoma were assessed using immunohistochemical technique. It was shown
that the expression of inducible enzymes, iNOS and COX-2, increased significantly
with increasing tumour stage, size, and the presence of metastases. In contrast, the
expression of constitutive enzymes, cNOS and COX-1 showed the opposite trend. It
was concluded that turmour-associated nitric oxide production and COX-2 over
expression might promote gastric cancer progression by providing a selective growth
advantage to tumour cells with non-functioning p53 (Rajnakova et al. 2001).
Hirose et al. (1999) demonstrated strong chemoprevention properties of the synthetic
antioxidant 1-O-hexyl-2,3,5-trimethylhydroquinone (HTHQ) in heterocyclic amine
(HCA)-induced carcinogenesis. In addition, they have shown that curcumin exerted
significant enhancing effects. HCA found in cooked meats was shown to be genotoxic
from Ames and other mutation assays. It was suggested that HCA are metabolically
activated to N-hydroxy amino forms by CYP1A/1A2 and then further metabolised by
N-acetyltransferase-mediated O-acetylation to esters in the liver. These metabolites can
then react with DNA and form adducts in the C-8 position.
39
Kamataki et al. (1999) concluded that CYP2A6 gene polymorphism is respnosible for
the variability on cancer susceptibility of individuals. Kushida et al. (2000)
demonstrated that CYP2A6 was reponsible for the metabolic activation of N-
nitrosomethylphenylamine in recombinant Salmonella strain with human cytochrome
P450 (CYP2A6) and cytochrome P450 reductase. This established strain may be used
to predict human activation of N-nitrosamine promutagens. Furthermore, Fujita and
Kamataki (2001) showed that N-nitrosamines with relatively short alkyl chains such as
NDMA and NMEA were primarily activated by CYP2E1 in recombinant Salmonella
strain by Ames test.
2.4.2.1 Carbohydrate
Carbohydrate consumption was associated with increasing risk of gastric cancer.
However, the mechanism was not known and that different types of carbohydrates were
not tested (Risch et al., 1985). More recently, it was suggested that the consumption of
various types of starchy foods may contribute to the risk of gastric cancer by acting as a
physical irritant of the gastric mucosa and combined with a low protein diet may reduce
the production of gastric mucus thus facilitating carcinogen absorption (Kato et al.,
1992).
2.4.2.2 Saturated fat
Unsaturated fatty acids had been studied for their role in peroxidative reactions
possibly resulting in tissue damage and gastric carcinogenesis (Risch et al., 1985). Fat
intake was the only macronutrient positively associated with the risk of gastric cancer
in a population-based case-control study in Sweden (Hansson et al., 1994a). It was
proposed that a fatty meal delayed emptying of the stomach thus prolonged the
exposure to carcinogens ingested and/or those already present (Heddle et al., 1988 in
Hansson et al., 1994a).
González et al. (1994) concluded that high consumption of exogenous nitrosamines,
nitrites, fat and cholesterol increased the risk of gastric cancer in case-control study of
the Spanish population.
40
2.4.2.3 Alcohol
Certain alcoholic beverages such as beer, scotch and whiskey contains preformed
nitrosamines, and studies had shown that even moderate alcohol consumption is
associated with gastric cancer incidence (Hwang et al., 1994).
2.4.2.4 Salt, pickled and smoked food
Excess salt (NaCl) is known to cause mucosal damage in the stomach lining followed
by inflammatory changes during repair. Furthermore, salt promotes intragastric
nitrosation and cell replication thus increases the rate of carcinogen formation and
mutation (Hwang et al., 1994). Lee et al. (1995) showed a positive association between
high salt intake, broiling method of cooking and stomach cancer in case-control
population in Korea.
Skrökki (1995) had demonstrated that 65 % of the Finnish cured meat products tested
contained more salt averaging 2.3 % NaCl (w/w) than was recommended (1.2 - 1.8 %
w/w). This can pose increased risk of gastric cancer as well as hypertension in the
susceptible populations.
Dietary exposure to NOCs can be either the ingestion of preformed NOC such as
nitrosamines, in smoked food, or the ingestion of nitrite and nitrosatable substances
(Wogan and Tannenbaum, 1975).
2.4.2.5 Cooking method
High temperature cooking such as broiling or frying yielded the highest nitrosamine
levels (Cassens, 1995). In addition, Skrypec et al. (1985) had demonstrated that the
fatty acid composition of bacon and the frying atmosphere influenced its N-nitrosamine
formation. Furthermore, they showed that wood smoke was linked to the formation of
N-nitrosothiazolidine (NTHZ) and N-nitroso carboxylic acid (NTCA) in smoked cured
meat.
2.4.2.6 Inappropriate food storage
The introduction of refrigeration as well as other improved food storage technology or
processes may be responsible for the universal decline of gastric cancer rate worldwide.
This may be due to the reduction of exogenous nitrite production by bacterial

41
conversion of nitrates and a decline in other possible carcinogenic metabolite
production by natural food microflora (Hwang et al., 1994; Lee et al., 1995).
2.4.2.7 Helicobacter pylori infection
Peptic ulcers and infection with Helicobacter pylori were common in people diagnosed
with gastric cancer. It was suggested that H. pylori alters the integrity of the stomach
lining, therefore promotes cancer formation (Hwang et al., 1994). Furthermore, Shapiro
and Hotchkiss (1996) demonstrated that viable H. pylori cells stimulated the most NO
synthesis in in vitro murine macrophage system by the L-arginine-NO pathway and
exhibited dose-dependent relationship. Thus chronic H. pylori may increase
endogenous NO production leading to chronic inflammation in the gastric epithelium,
which may initiate carcinogenesis associated with gastric cancer. The decrease in
vitamin C secretion during H. pylori infection also increased the nitrosation potential in
vivo due to decreased antioxidant scavenging of nitrosating agents by vitamin C.
Elevated exposure to NO is also potentially genotoxic and mutagenic in bacterial and
mammalian cell systems, and can form NOC in the presence of secondary amines
(Shapiro and Hotchkiss, 1996).
Chronic H. pylori infection leads to constant nitric oxide production that may lead to
tissue and DNA damage thus increases the risk for developing cancer. Rieder et al.
(2003) investigated the association between chronic H. pylori infection and iNOS
expression in samples from stomach carcinoma patients including biopsies from
patients with H. pylori associated gastritis. Their results supported the hypothesis that
CagA-positive H. pylori strains were associated with the expression and activity of
iNOS, hence may contribute to the development of intestinal metaplasia leading to
gastric cancer of the intestinal type.
2.4.2.8 Cigarette smoking
Like alcohol, cigarettes contain preformed nitrosamines therefore smokers are at more
risk of gastric cancer compared to non-smokers or ex-smokers (Hwang et al., 1994).
Similarly, Lee et al. (1995) showed a positive association between cigarette smoking
and the risk of stomach cancer in case-control population in Korea.
Kato et al. (1992) suggested genetic link of stomach cancer between family members
with history of the disease. They also concluded that smokers were more likely to die

42
from stomach cancers than those never smoked, but there was no dose-response to the
amount of cigarettes smoked. There was a positive association between high fruit
intake and reduced risk of stomach cancer. Furthermore, Kato et al. (1992) did not find
any association between different cooking methods for meats and fish and the risk of
developing stomach cancer. However, in their study only a specific population of rural
Japanese living in mountainous area were surveyed, therefore their conclusion may be
biased and is not representative of the general population.
Hwang et al. (1994) concluded that the consumption of nitrites, nitrates, alcohol and
highly salted, pickled, fermented, or smoked foods increased the risk of gastric cancer.
In addition, environmental factors such as H. pylori infection and cigarette smoking
also increase the risk. They suggested that high intake of fruits and vegetables or
antioxidants such as β–carotene, vitamin E and vitamin C may decrease the risk.
The duration of cigarette smoking was shown to be positively associated with gastric
cancer risk among population-based case-control study in Sweden (Hansson et al.,
1994b). Furthermore, they have shown that high fruit consumption was more protective
among smokers than non-smokers. Hence smokers should be encouraged to increase
their fruit and vegetable intake in order to lower their risk of gastric cancer.
Stomachs of smokers had significantly higher thiocynate levels than non-smokers,
which were shown to be a potent catalyst of the nitrosation reaction (Ruddell et al.,
1976). Ruddell et al. (1976) had shown that patients with gastric cancer and
hypochlorhydria (under production of HCl by the stomach) had the highest level of
stomach pH and similarly high nitrite concentrations. However, that latter group did not
develop gastric cancer suggested that high dietary nitrite may not be linked to gastric
cancer, but indicate other environmental or genetic factors are involved.
2.4.2.9 Low consumption of fruits and vegetables
Low intake of fruits and vegetables was common amongst people diagnosed with
gastric cancers, since nutrient factors including vitamin C and E, fibre, low saturated fat
are known to protect against numerous cancers including gastric cancer (Bartsch et al.,
1990).
43
2.4.2.10 Others
Risch et al. (1985) concluded that chocolate or cocoa consumption was strongly
associated with the increased trends in the risk of gastric cancer, but did not indicate
any possible mechanisms.
Thiocynate is present in relatively large amounts in vegetables of the Brassica family,
such as cauliflower, and is known to stimulate the rate of nitrosation of nitrite and
secondary amine at low pH (Walters, 1980).
Indoles are present in several plant species and are present in high concentrations in the
Brassica family. This is significant as naturally occurring indoles can be readily
nitrosated under mild conditions (Tricker and Kubacki, 1992).
In summary, high consumption of red or processed meat might increase colorectal
cancer risk, and the consumption of salted fish actually increased risk (Marques-Vidal
et al., 2006). The consumption of fruit and vegetables may have beneficial and
protective effects against gastrointestinal cancers, whereas alcohol consumption and
overweight may increase the risk (van den Brandt and Goldbohm, 2006). The
heterogeneity between prospective studies makes it hard in analysing and drawing
conclusions from them (Marques-Vidal et al., 2006). Therefore in order to overcome
this flaw and faciliate communucations between epidemiologists a standardized method
need to be developed and implemented.
2.4.3 Estimated dietary nitrate and nitrite intake
Many studies have been done to estimate the dietary nitrate and nitrite intake in specific
regions, countries and/or continents. This will be summarized below.
2.4.3.1 Asian-pacific regions
The average daily consumption of dietary nitrate in Singapore was estimated to be
around 215 mg, with Chinese flowing cabbage and kale contributing to half this intake
(Dutt et al., 1987). This was significant, as they have identified the two main sources of
dietary nitrate amongst Singapore population, which may explain the prevalence of
gastric cancer in that country.
44
Pennington (1998) mentioned several flaws in dietary surveys used in compiling
national dietary data, such as the lack of honesty or poor food recall in the participants,
which will contribute to the accuracy of the population dietary surveys. In addition, the
author pointed out a major flaw in national dietary survey that was the lack of data on
unusual food or food groups in certain populations. Australia being a multi-cultural
country with big ethnic and religious diversity makes its national nutrition survey
possibly an underestimate of the true food consumption pattern and hence the data
collected may not be representative for the whole nation.
Prospective studies can reduce several kinds of biases associated with data collection,
but requires reliable and complete quantitative estimates of nutrient and food
consumption in the population of interest (Kato et al., 1992). Australia is currently
renewing its national food consumption data in accordance with the most recent
findings. This will enhance the accuracy of existing data made eight years ago since
dietary preferences had changed dramatically in recent years as a result of improved
food technology and analysis.
2.4.3.2 United States and United Kingdom
Gangolli et al. (1994) estimated the mean daily intake of nitrate and nitrites in the US
were 106 and 1.5 mg/kg, respectively. In the UK, the estimated nitrite intake in 1979
was between 0.32 and 0.87 mg/day. However, in 1985 the estimate was risen to
between 2.4 and 4.2 mg/day with potatoes contributing the major source of dietary
nitrite of up to 43 %. It was suggested that the increase was not due to a real increase in
dietary intake, but due to the restructuring of the total diet study since 1981.
Nevertheless, between 1979 and 1985, it was demonstrated that vegetable food group
contributed 75 % of the total nitrate intake from the diet. (Meah et al., 1994). More
recently, Gangolli et al. (1994) estimated the mean daily intake of nitrate and nitrites in
the UK were 104 and 1.5 mg/kg, respectively.
The differences observed may also be due to underestimation from interfering matrix
naturally occurring in plants, such that Hunt (1994) measured nitrite in fresh vegetables
and reduced interference from ascorbic acid, tannins and nitrate reductase by extracting
the nitrite with zinc acetate at approximately pH 7.3 with activated carbon, since these
compounds can react with nitrite and result in underestimation. Hunt and Turner (1994)
demonstrated no detectable nitrite in 93.4 % of edible fresh retail vegetables, with

45
potatoes containing less than 0.4 mg/kg nitrite. Thus it was concluded that potatoes
would contribute to dietary nitrite of the vegetable food group.
2.4.3.3 Rest of Europe
In 1994 using 24-hour duplicate diet and HPLC-UV method, van Vliet et al. (1997)
estimated the mean intake of nitrate in the Dutch population was 80 mg/day per person,
and the median intake of nitrite was 0.1 mg/day per person. They showed that the daily
intake of nitrate and nitrite was higher than found in the 1984/1985 studies, which may
be due to underestimation in the early study, or a better detection method employed in
the latter study.
Italy had a mean daily intake of nitrate of 245 mg/day, whereas Poland and Switzerland
mean daily nitrate intake were 178 and 125 mg/day, respectively. France’s mean daily
intake of nitrate and nitrite were 150.7 and > 3 mg/day, respectively, followed by
Netherlands, Germany and Norway mean daily nitrate intake of 71, 68 and 43 mg/day,
respectively. The mean daily nitrite consumption in those countries was 0.6, 2.6 and 1.8
mg/day, respectively (Gangolli et al., 1994).
The acceptable daily intake (ADI) for nitrate was set at 3.7 mg/kg body weight by the
European Union Scientific committee for Food (1995) and since nitrite has higher acute
toxicity than nitrate its ADI was set at 0.06 mg/kg body weight (Reinik et al., 2005).
Reinik et al. (2005) estimated the mean daily intake of nitrate was 1.7 mg/kg body
weight for Estonian children between 2000 and 2005 and for nitrite and N-nitrosamines
were 0.83 mg and 0.073 µg, respectively. They found that the nitrite intake exceeded
the acceptable daily intake by up to 140 % for 1 to 6 years-old children in 2000-2001
and up to 105 % in 2003-2004. However, the concentrations of nitrate, nitrite and N-
nitrosamines showed a decrease every year between 2000 and 2005.
2.4.3.4 Summary
Walters (1980) reported the estimated total intake of nitrite ion was 12.15 mg/day. Of
that amount, 0.02 mg was present in foods, 1.20 mg added to foods, 10.0 and 0.06 mg
from nitrate in vegetables and water respectively, and 0.33 mg formed endogenously in
the stomach. According to Walters (1980), vegetables contributed up to 82 % of dietary
nitrite, whereas other food sources (< 0.002 %) and added nitrate or nitrite salts (0.1 %)
46
were insignificant. However, the author did not account for the remaining nitrite
sources of 0.54 mg, but may likely to come from salivary nitrate.
Pennington (1998) estimated that the daily nitrate intake ranges between 53 and 350
mg/day depending on the type and quantity of the vegetable consumed and the level of
nitrate in drinking water. Whereas daily nitrite consumption was between 0 and 20
mg/day depending on the levels of nitrite present in cured meat and of much of it was
consumed.
According to Cornee et al. (1992), the average daily nitrate intake per person per day
was 121 mg (85 % from vegetables, 5 % from preserved and cured meat, and 5 % from
cereal products). For the average daily nitrite intake per person per day, it was found to
be 1.88 mg (43 % from vegetables, 28 % from cured meat, and 16 % from cereals). The
remaining 13% of nitrite must come from non-dietary sources of nitrite such as
atmospheric contamination.
A simple, rapid and accurate spectrophotometric method is available for determining
the concentration of nitrates in human biological fluids using NADPH oxidation by
Aspergillus nitrate reductase (Gilliam et al., 1993), or for the simultaneous detection of
nitrate and nitrite in a variety of fluids using nitrate reducing vanadium III and
detection by acidic Griess reaction (Miranda et al., 2001). These methods are necessary
for long-term monitoring of nitrate and nitrite concentrations in susceptible
populations. In addition, it may be useful as an alternate method to estimate nitrate and
nitrite intake in populations where dietary history and food composition data are not
available, or provide a biochemical confirmation to those reported in dietary history or
national nutrition surveys.
Pennington (1998) advocated the Total Diet Survey (TDS) in the United States that
focuses on core foods and allows development as more foods were analysed from
groceries and restaurants rather than using data from a database. This then provides a
foundation for estimating variances for the food components in each food.
47
2.4.4 Recommended dietary nitrate and nitrite intake
2.4.4.1 International
Many countries have restricted the amount of nitrate and nitrite to be added in food and
drinking water demonstrate the epidemiological significance of these chemicals in the
etiology of human gastric cancer.
ADI set by the Scientific Committee for Food for nitrite is 0 - 4.2 mg/60 kg person/day
and 0 – 219 mg/60 kg person/day for nitrate. On average, 0.1 to 4.2 mg of nitrite from a
mixed diet was consumed per person per day. The variation observed was dependent on
the method of estimation. On average, 54 to 157 mg of nitrate from a mixed diet was
consumed per person per day. The variations observed were dependent on the method
of estimation (total diet, food frequency, duplicate diet)(Massey, 1997). Similarly, ADI
set by the EU Scientific Committee for Food for nitrate was 3.7 mg/kg body weight
(Reinik et al., 2005).
This has led to the restriction of nitrate and nitrite intake in 1973 by the Joint
FAO/WHO Expert Committee on Food Additives (JECFA), which set an acceptable
daily intake of sodium nitrate from 0 to 300 mg for a 60 kg person, and 0 to 12 mg per
60 kg person of sodium nitrite per day (WHO, 1973).
Different countries have set their maximum limits for the addition of nitrate and/or
nitrite salts in cured meat. For example, in US the maximum allowed sodium nitrite in
cured meat is 156 mg/kg, but in practice, often less than 120 mg/kg is used. The
residual nitrite is the amount analytically detectable in the cured meat, and is much
lower than the actual amount added (Cassens, 1995). In UK, the maximum allowed
sodium nitrate and sodium nitrite for uncooked bacon and ham is 500 mg/kg combined
with the latter not exceeding 200 mg/kg (Dennis et al., 1990). In Spain, the maximum
allowed addition of potassium nitrate in cooked meat products was 200 mg/kg and less
for sodium nitrite at 125 mg/kg. The combined used of nitrate and nitrite salts was
allowed at 250 mg/kg (Pérez-Rodríguez et al., 1996).
2.4.4.2 Food Standards Australia and New Zealand (FSANZ)
Under the Australian Food Standard Code 1.3.1 schedule 1, 125 mg/kg of nitrite
(potassium or sodium salts) are permitted in cured, dried, and slow dried cured meat;

48
whereas in commercially sterile and canned cured meat, the maximum nitrite
(potassium or sodium salts) permitted is 50 mg/kg. For slow dried cured meat, the
maximum allowed nitrate (potassium or sodium salts) is 500 mg/kg (FSANZ, 2009).
Given the established antimicrobial effect of nitrite salts, particularly in reference to
Clostridium botulinum in cured meat, its level should remain sufficient to prevent the
occurrence of foodborne illnesses (Cassens, 1995), since public health and safety is the
number one priority in the Australian and New Zealand food standards code (FSANZ,
2009).
Since nitrate and nitrite can cause methaemoglobinaemia in infants and young children,
as well as contributing to the body’s total burden of NOCs, the National Academy of
Science (1981) report recommended the elimination of nitrate salts in curing except for
some products, and suggested reducing the nitrate level of vegetables and drinking
water. In addition, the report recommended the further study of nitrosation inhibitors.
N-nitrosoproline (NPRO) test had been used to quantify human exposure to
endogenous NOCs and/or methylating agents. The test is based on the excretion of
NPRO and other N-nitrosoamino acids in the urine, which are measured as an index of
endogenous nitrosation. However, the determination of nitrate and nitrite alone in the
body fluids did not indicate the extent of in vivo nitrosation process (Bartsch et al.,
1990).
Australia’s food composition table set by Food Standards Australia and New Zealand
(FSANZ, 2009) did not include nitrate and nitrite. From recent improvements in food
analysis and policies, Australia had finally produced a national food composition table
using data mostly gained within Australia. Cashel and Greenfield (1996) had shown
that these new Australia-based data gave different national dietary references and hence
led to new dietary guidelines and core food groups. For example, the 2000 target for
total fat of less than 30 % energy had almost been met for 1990-91 data (Cashel and
Greenfield, 1997). This finding is significant since many dietary components such as
high saturated fat and salt intake had been associated with gastric cancer, whereas high
dietary fibre intake had been associated with lower risk of gastric cancer (Bartsch et al.,
1990).
Since nitrite can be more active in synthesising NOCs when ingested in one application
over a short period of time, than ingestion of low concentrations of nitrite continuously
49
over a long period (Walters, 1980). If these restrictions are enforced and monitored, the
average dietary consumption of low nitrite concentrations over time may not pose a
greater risk to developing gastric cancer.
2.5 Determination of nitrate and nitrite
With advancing qualitative and quantitative methods: selectivity, sensitivity, time and
costs are some important factors for the determinant of the method used for analysis.
However, few methods exist that has all the above quality, thus the choice of method is
dependent on the specific goals of the researcher. Nevertheless, several potential
methods will be described below as well as procedures to improve detection accuracy.
Homogenization of food is difficult but often necessary prior to chromatographic
analysis. Factors such as variable texture, structure and the presence of immiscible
phases may hinder the homogenization process (Lichon, 1996). Because these
properties are inherent properties of the food product, it cannot be changed during the
manufacturing process. The sampling of food and their preparation must therefore be
considered carefully prior to analysis to ensure representative and accurate results. This
means using traditional cooking practices so that factors that affect nitrate and nitrite
determination and their recovery are consistent and applicable to dietary exposure of
these anions.
2.5.1 Colourimetric and spectrophotometric
Torró et al. (1998) reported good agreement between flow-injection biamperometric
method with the reference method of AOAC Griess reaction in the determination of
nitrate and nitrite in meat products. Major advantages in their proposed method were its
high selectivity, simple design, low cost and the avoidance of carcinogenic reagents
and toxic metals as required by the Griess reaction.
It was demonstrated by Wang et al. (1998) that precolumn concentration using
diazotization-coupling reaction for nitrite and cadmium-copper column for nitrate
before spectrophotometric determination of both nitrates and nitrites in water and some
vegetables provided high sensitivity, unlike standard spectrophotometry method, high
selectivity and accuracy, unlike flow injection methods, and simplicity and low cost,
unlike ion chromatography.

50
Similar to the reference spectrophotometric method, Zatar et al. (1999) determined
nitrite and nitrate in water, meat and vegetable samples by using the oxidation of nitrite
to the phosphomolybdenum blue complex resulting in a reduction in intensity of the
blue color, whereby its rate of reduction was directly proportional to the amount of
nitrite added.
A completely automated method for the determination of nitrite, nitrate and chloride in
cured meat was developed by Velasco-Arjona et al. (1998), which was based on the
coupling of discontinuous (robotic) and continuous (flow injection) systems. This was
shown to be accurate when compared with the traditional methods, as well as reducing
significant amount of analysis time. However, the set-up seemed to be much elaborated
and complex, and requires extra computing knowledge in order to set-up and interpret
the results. Nevertheless, once set-up with fully trained technicians, this automated
system should save time and will allow large sampling size to be tested.
Clark et al. (2003) measured the nitrate intake in vegetarian duplicate diets in the UK
using HPLC with UV detection at 214 nm. They concluded that vegetarians’ nitrate
intake was similar to other consumers’ and were both under the acceptable daily nitrate
intake. However, their extraction method of nitrate involved a lot more chemical
reactions. Firstly, they added hot alkali solution containing borax solution and water.
After mixing and cooling, Carrez solutions I and II were added followed by further
shaking. Samples were then cleaned up using solid phase extraction on endcapped
cyclohexyl cartridges prior to analysis. Separation occurred on a Dionex AS11 column
with the same material for the guard column, and was eluted with water and sodium
hydroxide mixture (80:20) at 1 ml/min.
Rincón et al. (2003) reviewed the Association of the Official Analytical Chemists
(AOAC) method for the detection of nitrite in meat products, and recommended that
the reagents Carrez II and I should be eliminated because they do not provide efficient
clean up and interferes with nitrite extraction. In addition, they recommended the use of
borax reagent, as it is highly efficient in extracting nitrite during heat treatment. More
recently, Stalikas et al. (2003) demonstrated a relatively sensitive, fast and accurate
method for the simultaneous determination of nitrate and nitrite in cured meat by using
ion chromatography method with post-column indirect fluorescence detection.

51
Determination of nitrate and nitrite in complex sample matrices including biological
fluids and food products by vanadium (III) reduction with chemiluminescence
detection was shown to be rapid in terms of analysis time, less than four minutes per
sample, and simple without the need for sample pretreatment (Hendrix and Braman,
1995).
Miranda et al. (2001) developed a sensitive, rapid, inexpensive and simple method for
the simultaneous detection of nitrate and nitrite based on nitrate reduction by vanadium
(III) combined with detection by the Griess reaction. Furthermore, it was applicable in
a range of media including buffer, media and biological fluids.
A flow-injection spectrophotometric method was used for the simultaneous
determination of nitrate and nitrite in meat and vegetable samples by the reduction of
nitrate to nitrite in a cadmium copper reductor column, and the reduction of nitrite to
nitric oxide in a sulphuric acid medium. The range of 0.30-3.00 and 1.00-10.00 mg/L
was the detection range for nitrite and nitrate respectively, and the precision and
accuracy of this method were comparable to the reference spectrophotometric method
developed by the AOAC (Andrade et al., 2003). Similarly, flow injection catalytic
spectrophotometric method was used to simultaneously determine nitrates and nitrites
in water with rapid speed and sensitivity at 0.3 ng/ml for nitrite and 1.0 ng/ml for
nitrate as the detection limits (Yue et al., 2004).
2.5.2 Gas chromatography
Gas chromatography has been used for the measurement of nitrate and nitrite in foods
and water. It is based on the formation of a volatile derivative, followed by extraction
into organic solvent, which is then measured by gas chromatography using a selective
detector. Under good conditions, the detection limit for this method is as low as 5 μg/L
of aqueous samples. This method also showed good agreement with the traditional
colorimetry assay for the analysis of cured meat, and it is less time-consuming
(Massey, 1991).
2.5.3 High performance liquid chromatography
Wootton et al. (1985) concluded that HPLC method for the determination of nitrate and
nitrite in meat, fresh and canned vegetable products was satisfactory. However, some
meat products were subject to matrix interference. For example, sodium chloride

52
increased the apparent levels of nitrate and nitrite, whereas ascorbic and erythorbic
acids decreased and increased the apparent levels of nitrite and nitrate, respectively.
Despite the apparent shortcomings of HPLC, it offered a simple, rapid and practical
means of determining both nitrate and nitrite simultaneously.
Dennis et al. (1990) used a rapid strong anion exchange HPLC-UV method for the
determination of nitrate and nitrite in a wide range of cured meat. They have confirmed
the accuracy of this technique by comparing to the existing British Standard
colorimetric method. The traditional colorimetric method for the determination of
nitrate and nitrite is time consuming and requires maintenance of the efficiency of its
cadmium reduction column. In contrast, HPLC was demonstrated by Dennis et al.
(1990) to be a better alternative with its speed and elimination of using the toxic metal
cadmium. However, the additional costs of HPLC equipment, column and disposable
Bond Elut cartridges may represent a significant disadvantage of this technique. Based
on their method of nitrate and nitrite determination in cured meat, Reece and Hird
(2000) were able to modify it for a more accurate nitrate and nitrite determination in
dairy products that was comparable with the AOAC method.
Most of the chromatographic methods mentioned above used UV detection for the
determination of nitrate and nitrite ions. However, Di Mattel and Esposito (1997)
concluded that HPLC with electrochemical detection (ED) was successfully used for
the determination of nitrate and nitrite ions in food, biological and environmental
samples and was shown to be more sensitive, selective and faster than methods based
on UV absorption, photometry, fluorometry or chemiluminescence. The detection
limits for nitrite in fish and cured meat ranged from 1 to 50 ppb.
Reversed-phase (RP) C18 columns are commonly used for separating nitrates and
nitrites due to their reproducibility in wide range of pH, relatively low cost and
versatility. The separation is based on hydrophobicity thus polar compounds are eluted
faster then non-polar compounds (Hanai, 1999).
Butt et al. (2001) had introduced an application of normal phase ion-pair liquid
chromatography for the analysis of inorganic anions with tetraethylammonium as the
ion-pairing agent. They had developed a relatively simple, sensitive, selective and rapid
method for the simultaneous determination of nitrite and nitrate in spinach and lettuce
samples. For nitrate and nitrite extraction, they blended 50 g of each sample in a
53
blender with 50 ml of double deionized distilled water for 5 min at 60 oC. They then
further homogenized the samples ultrasonically using Bransonic-52. Followed
centrifugation, the supernatant was passed through a 0.25 µm Millipore syringe filter
and then through a C18 sample clean-up column for direct injection into the liquid
chromatograph.
Dennis et al. (1990) used a rapid strong anion exchange HPLC-UV method for the
determination of nitrate and nitrite in a wide range of cured meat. They have confirmed
the accuracy of this technique by comparing to the existing British Standard
colorimetric method. The traditional colorimetric method for the determination of
nitrate and nitrite is time consuming and requires maintenance of the efficiency of its
cadmium reduction column. In contrast, HPLC was demonstrated by Dennis et al.
(1990) to be a better alternative with its speed and elimination of using the toxic metal
cadmium. However, the additional costs of HPLC equipment, column and disposable
Bond Elut cartridges may represent a significant disadvantage of this technique. Based
on their method of nitrate and nitrite determination in cured meat, Reece and Hird
(2000) were able to modify it for a more accurate nitrate and nitrite determination in
dairy products that was comparable with the AOAC method.
Siu and Henshall (1998) used a similar extraction method as Stalikas et al. (2003). But
in addition to salami they also tested ham. They also used a higher centrifugation speed
at 4960 g (6000 rpm Beckman GA-10 rotor) for 15 min. Siu and Henshall (1998) then
filtered the supernatant through Whatman No.2 and GF/A filters, and then through the
1.2 µm and 0.2 µm Acrodisc filters. The filtrate was then analyzed for nitrate and
nitrite using pellicular anion-exchange columns with UV detection at 225 nm. This
method was developed to remove most of the potentially matrix interferences such as
protein and fat-based substances, and the column chosen provided good selectivity for
the separation of nitrate and nitrite, as well as for the separation of other residual matrix
components. Nitrite and nitrate content in salami were 108.0 and 98.5 mg/kg,
respectively, and 11.6 and 5.4 mg/kg for ham, respectively.
2.5.4 Ion chromatography
Due to interferences from meat samples, Jackson et al. (1984) used low capacity anion-
exchange column for the determination of nitrate and nitrite in cured meats. It was
shown to be rapid, sensitive and precise with satisfactory recovery of added nitrate and

54
nitrite. In addition, it was shown to be applicable to vegetables and cheese. However,
their results did not agree with spectrophotometric method, but they attributed the
differences to the deficiencies of the conventional method.
Siu and Henshall (1998) minimized interferences from meat products by using ion
chromatography with specific UV absorbance detection. The recovery of nitrate and
nitrite were greater than 90 % with detection limits of 50 and 30 μg/l for nitrate and
nitrite, respectively. They also used extraction procedures to remove majority of the
interfering components, which used then be analyzed within 12 hours to avoid changes
in nitrate and nitrite concentration in the meat samples.
Butt et al. (2001) demonstrated the applicability of ion-paired liquid chromatography
for the simultaneous determination of nitrite and nitrate in complex food matrices, and
was shown to be relatively simple, sensitive, selective and fast. Although ion
chromatography and HPLC methods have been shown to be faster, more accurate and
sensitive than spectrophotometric methods, these relatively newer methods are often
time consuming, require pre-treatment and can be expensive (Badea et al., 2001).
Kazemzadeh and Ensafi (2001) used a flow-injection spectrophotometric method for
the simultaneous determination of nitrite and nitrate in food samples including meat
and cheese and showed good reproducibility and accuracy in comparison to the
standard method. The detection limit for nitrite and nitrate were 0.001 and 0.010 μg/ml,
respectively. However, this method required the use of specific columns and reagents,
including cadmium, but was fast processing about 20 samples per hour.
Stalikas et al. (2003) homogenized ten grams of salami using a blender for 1 min with
70 ml of warmed double-distilled water. Then the mixed sample was heated for 15 min
and maintained at 70 oC. After cooling to room temperature, the sample was
centrifuged at 1370 g for 10 min, then the supernatant was removed and filtered
successively using a Whatman filter paper No. 40 and a GF/A filter. The filtrate was
then diluted and collected in a volumetric flask and analyzed using ion chromatography
with post-column indirect fluorescence detection. It was shown that this coupling
technique was relatively sensitive, fast and accurate for the determination of nitrate and
nitrite in meat samples. Matrix interferences were eliminated with fluorescence
detection since components that may decrease the background fluorescence of
tryptophan are rarely found in real samples.
55
Overall, the theoretical column efficiency of ion-pair liquid chromatography is much
better than that of an ion-exchange column. Hence ion-pair liquid chromatography is
much more commonly used. In addition, the regeneration of ion-pair column is much
faster therefore provides a faster turn over (Hanai, 1999).
2.5.5 Capillary electrophoresis
Using AOAC as reference method, Jimidar et al. (1995) demonstrated the precision and
accuracy of capillary electrophoresis with indirect detection for the determination of
nitrate and nitrite in vegetables. The major advantage of the capillary electrophoresis
method compared to the traditional spectrophotometric method is that the former is
extremely fast (around five minutes) as oppose to the latter method (about one hour).
Marshall and Trenerry (1996) used capillary ion electrophoresis to determine the nitrite
and nitrate content of a variety of foods including vegetables, water and meat products.
They concluded that the method was rapid, simple, and reliable and gave good
recoveries of nitrite and nitrate in a variety of foods when using thiocyanate as the
internal standard.
Öztekin et al. (2002) used capillary electrophoresis with direct UV detection for the
simultaneous determination of nitrite and nitrate in meat products and vegetables,
which was demonstrated to be rapid with sufficient detection limit for food samples. In
addition, capillary electrophoresis uses much less electrolyte and sample consumption
than colorimetric method, and is less expensive and more accurate than
chromatographic columns due to minimal interfering matrix.
Öztekin et al. (2002) used capillary coated with a cationic polymer polyethyleneimine
in capillary electrophoresis to simultaneously detect nitrite and nitrate in meat products
and vegetables. Their method showed very short analysis time, good reproducibility,
less expansive than chromatographic columns, low electrolyte and sample consumption
and good recovery for the anions. The detection limit for nitrite ions was 4 mg/kg.
The simultaneous determination of nitrite and nitrate by ultra-rapid capillary
electrophoresis was demonstrated to be much more rapid and environmentally friendly
with excellent detection limits for both anions compared to standard electrophoresis,
HPLC, ion chromatography and flow injection analysis (Melanson and Lucy, 2000).

56
However, it was not demonstrated on samples with complex matrices such as food and
biological fluids. Furthermore, no recovery was performed to ensure accuracy.
Using AOAC as reference method, Jimidar et al. (1995) demonstrated the precision and
accuracy of capillary electrophoresis with indirect detection for the determination of
nitrate and nitrite in vegetables. The major advantage of the capillary electrophoresis
method compared to the traditional spectrophotometric method is that the former is
extremely fast (around five minutes) as oppose to the latter method (about one hour).
2.5.6 Electronic sensors
New electrochemical sensors were used by Badea et al. (2001) for rapid amperometric
detection of nitrites and nitrates in water, and was suggested that this method could be
applied to food samples for the rapid and simple determination of nitrates and nitrites.
2.5.7 Others
Basing their method on the generation of nitric oxide and polarography, Ximenes et al.
(2000) were able to recover 85.4 to 107.4% of the nitrate in various vegetable samples,
with precision and accuracy comparable to those of the standard AOAC
spectrophometric method.
Escherichia coli cell method in the measurement of nitrate was based on nitrate
reduction by the wild-type E. coli DSM 498k cell under aerobic conditions, followed
by nitrite determination with the Griess reaction. The nitrate contained in meat was
found to be 217 mg/kg. This method was simpler than those requiring inorganic
reductants and purified enzymes, and can be adapted for nitrate measurement in other
matrices (Xu et al. 2000).
Chemiluminescence techniques are 600 times more sensitive than the colorimetric
methods. Furthermore, traditional colorimetric methods can underestimate the amount
of nitrite present in the presence of reductants such as ascorbate. However, this
limitation in the colorimetric method can be prevented by the addition of charcoal that
removes these reductants (National Academy of Science, 1981). Thus the
chemiluminescence method for nitrite determination was recommended by the National
Academy of Science (1981) for cured meat and biological samples because of its
accuracy, sensitivity, and lack of interferences from the food matrix.
57
2.5.8 Food
There are many methods available for the determination of nitrates and nitrites in food
samples including cured meat and vegetables. These methods mainly consist of high-
performance liquid chromatography, capillary electrophoresis and ion chromatography.
The major advantages with capillary electrophoresis are the speed of separation of
nitrate and nitrite anions (approximately 10 seconds), and that less waste is generated
due to the absence of continuous mobile phase. However, one major drawback with
capillary electrophoresis is its lowered sensitivity when compared with high-
performance liquid chromatography. Ion chromatography is perhaps the most suitable
method for anion separations, but in terms of sensitivity, accuracy, limits of detection,
and speed of analysis, high-performance liquid chromatography is very similar, but
more robust with wider applications. However, all the methods mentioned above would
require some form of sample pretreatment, which may take up to 1 h, hence is the most
time consuming step of the total analysis time. Following are the recent methods used
for extracting and detecting nitrate and nitrite in food.
Since both nitrates and nitrite are readily soluble in water, they can be easily extracted
by hot water. However, because of nitrite’s high reactivity at acidic pH, alkaline or near
neutral conditions are preferred for nitrite extraction. Aqueous extraction of nitrite from
meat gave 97 % recovery at pH 5.5 to 6.5, compared to 44 % recovery at pH 3.5 and 92
% recovery at pH 9.5. Because some nitrites are bound to meat compunds such as
nitrosothiols and nitrosylmyoglobin, most hot water extraction technique only measures
the free nitrite ions. Heavy metal ions such as mercury and silver can cause cleavage of
the nitrosyl ion from NOCs hence releases some bound nitrite. Whereas an alkaline
condition was shown to degrade nitrosothiols into NO+ that occurs rapidly, which also
measures some bound nitrite (Usher and Telling, 1975).
Oxidizing and reducing agents such as ascorbic acid and ascorbate is known to
interfere with nitrate and nitrite determination. However, the addition of activated
charcoal such as Darco 60 to the extraction solutions can remove any ascorbate. It was
also shown that the two-hour water bath extraction technique in the AOAC colorimetric
method could eliminate ascorbate. Other interferences such as sulfur dioxide often
added to cured meat can interfere with nitrite determination. However, it was
demonstrated that recovery increases as the meat solids decreases (Usher and Telling,

58
1975). Hence by using smaller meat samples should minimize the effects of interfering
substance.
Stalikas et al. (2003) homogenized ten grams of salami using a blender for 1 min with
70 ml of warmed double-distilled water. Then the mixed sample was heated for 15 min
and maintained at 70 oC. After cooling to room temperature, the sample was
centrifuged at 1370 g for 10 min, then the supernatant was removed and filtered
successively using a Whatman filter paper No. 40 and a GF/A filter. The filtrate was
then diluted and collected in a volumetric flask and analyzed using ion chromatography
with post-column indirect fluorescence detection. It was shown that this coupling
technique was relatively sensitive, fast and accurate for the determination of nitrate and
nitrite in meat samples. Matrix interferences were eliminated with fluorescence
detection since components that may decrease the background fluorescence of
tryptophan are rarely found in real samples.
Siu and Henshall (1998) used a similar extraction method as Stalikas et al. (2003). But
in addition to salami they also tested ham. They also used a higher centrifugation speed
at 4960 g (6000 rpm Beckman GA-10 rotor) for 15 min. Siu and Henshall (1998) then
filtered the supernatant through Whatman No.2 and GF/A filters, and then through the
1.2 µm and 0.2 µm Acrodisc filters. The filtrate was then analyzed for nitrate and
nitrite using pellicular anion-exchange columns with UV detection at 225 nm. This
method was developed to remove most of the potentially matrix interferences such as
protein and fat-based substances, and the column chosen provided good selectivity for
the separation of nitrate and nitrite, as well as for the separation of other residual matrix
components.
Butt et al. (2001) had introduced an application of normal phase ion-pair liquid
chromatography for the analysis of inorganic anions. They had developed a relatively
simple, sensitive, selective and rapid method for the simultaneous determination of
nitrite and nitrate in spinach and lettuce samples. For nitrate and nitrite extraction, they
blended 50 g of each sample in a blender with 50 ml of double deionized distilled water
for 5 min at 60 oC. They then further homogenized the samples ultrasonically using
Bransonic-52. Followed centrifugation, the supernatant was passed through a 0.25 µm
Millipore syringe filter and then through a C18 sample clean-up column for direct
injection into the liquid chromatograph.

59
Butt et al. (2001) demonstrated that the presence of 50-fold sulfate and chloride did not
affect the resolution and percentage recovery of nitrite, but did reduced the resolution
and recovery of nitrate. Similarly, 1-2 % salt caused more losses of nitrate than for
nitrite. In addition, the presence of magnesium, iron and calcium significantly reduced
the percentage recovery of both anions. However, excess iron was suppressed by the
addition of ethylenediaminetetraacetic acid (EDTA). Furthermore, they had also
demonstrated that under optimized conditions, both nitrate and nitrite peaks began to
merge when the concentration of nitrite was above six-fold of nitrate concentration.
Clark et al. (2003) measured the nitrate intake in vegetarian duplicate diets in the UK
using HPLC with UV detection at 214 nm. They concluded that vegetarians’ nitrate
intake was similar to other consumers’ and were both under the acceptable daily nitrate
intake. However, their extraction method of nitrate involved a lot more chemical
reactions. Firstly, they added hot alkali solution containing borax solution and water.
After mixing and cooling, Carrez solutions I and II were added followed by further
shaking. Samples were then cleaned up using solid phase extraction on endcapped
cyclohexyl cartridges prior to analysis. Separation occurred on a Dionex AS11 column
with the same material for the guard column, and was eluted with water and sodium
hydroxide mixture (80:20) at 1 ml/min.
Most of the chromatographic methods mentioned above used UV detection for the
determination of nitrate and nitrite ions. However, Di Mattel and Esposito (1997)
concluded that HPLC with electrochemical detection (ED) was successfully used for
the determination of nitrate and nitrite ions in food, biological and environmental
samples and was shown to be more sensitive, selective and faster than methods based
on UV absorption, photometry, fluorometry or chemiluminescence. The detection
limits for nitrite in fish and cured meat ranged from 1 to 50 ppb.
Although most interference can be eliminated by using UV detection, large quantities
of nitrate and chloride ions can still interfere with nitrite detection in HPLC. UV may
detect chloride ions as positive or negative peaks in the wavelength used for nitrate and
nitrite, but are eluted before nitrite (Di Mattel and Esposito, 1997). Hence, dilution is
used before nitrate and nitrite extraction to minize the effects of interferences.
Ionic compounds such as nitrate and nitrite can be extracted from food at above 57 oC,
at lower temperatures cell membranes are impermeable to solutes, whereas at higher
60
temperatures between 80 and 90 oC the maximum leaching rate of ions can be achieved
(Gaiser et al., 1996).
Spinach contains varied amount of nitrate depending on the growth conditions and the
agricultural practices. However, it is generally in the range from 50 to 5600 mg/kg with
a mean nitrate concentration of approximately 2000 mg/kg (Gaiser et al., 1996). The
cooking or blanching of spinach prior to preservation significantly reduced the content
of nitrates and nitrites. In addition, it was found that preservation by canning resulted in
reduced nitrate and nitrite content over a 12 month period compared to preservation by
freezing (Jaworska, 2005).
Due to its reactive nature, nitrite analysis from food does not give a true representation
of the total nitrite added. In addition, ascorbate accelerates the depletion of nitrite, but
can be removed by reduction with iodine. Furthermore, nitrite added to meat is usually
present as NO bound with other food components such as myoglobin (5-15 %),
sulphydryl groups (5-15 %), lipids (1-5 %), proteins (20-30 %), as nitrate (< 10 %), and
as free nitrite (10-15 %)(Zanardi et al., 2002). Because only free nitrite can participate
in nitrosation, current methods of food extraction usually estimates the total nitrite
present by releasing food-bound nitrite. This may over emphasize the significance of
dietary nitrite and the aetiology of gastric cancer.
Based on literature comparisons, HPLC-UV is used for quantifiying nitrate and nitrite
in foods for this experiment because it is sensitive, fast, accurate and applicable for
both cured meat and vegetables.
2.5.9 Biological fluids
Li et al. (2000) used a simple, highly sensitive and specific and rapid method for the
determination of nitrite in biological samples by reducing nitrate to nitrite using nitrate
reductase and then derivatizing total nitrite with 2,3-diaminonaphthalene (DAN) to
form a highly fluorescence compound 2,3-naphthotriazole (NAT) followed by
detection using HPLC coupled with fluorescence detector.
Since the activation of the immune system is associated with an increased production
of NO, by measuring the nitrate and nitrite levels in the plasma and urine, it may allow
for the monitoring of NO production and possible disease activity in vivo.
Approximately 30% of the total body water is found in the extracellular fluid such as

61
plasma, urine and lymph, and the rapid transport and exchange of metabolites to the
extracellular fluid provides a good indicator for those metabolic processes that occur at
the cellular and tissue level. So the measurement of the excreted extracellular fluids
such as urine and saliva provides a simple and non-invasive method for quantifying
systemic NO production (Grisham et al., 1995).
However, even though nitrate and nitrite are commonly used as markers for NO
production in vivo, its quantification from patient’s urine and sera does not represent
the total NO production, since nitrate and nitrite may also be derived from gut- or
airway-associated bacteria in healthy individuals (Marzinzig et al., 1997).
It was demonstrated that the enzymatic reduction of nitrate to nitrite by commercially
available nitrate reductase was an inexpensive, simple and sensitive method for the
determination of total body nitrate and nitrite (Grisham et al., 1995).
The only stable product from the spontaneous decomposition of NO is oxygenated
solutions is nitrite. However, nitrite derived from NO is rapidly converted to nitrate via
oxidation by certain oxyhemoproteins such as oxyhemoglobin or oxymyoglobin. This
explains the low levels of nitrite found in the excreted extracellular fluids (Grisham et
al., 1995).
Griess reaction, a colorimetric assay for nitrite, combined with enzymatic conversion of
nitrate to nitrite, was suggested to be a cost effective method for measuring urinary
nitrate and nitrite levels. In addition, solid phase extraction and pH adjustment of the
urine minimized interferences and improved activities of the nitrate reductase to obtain
adequate sensitivity and accuracy (Ohkawa et al., 1998).
Bacterial nitrate reductase from E. coli coupled to the Griess reaction was shown to be
a sensitive, accurate and inexpensive method for the determination of nitrate and nitrite
in biological fluids and in tissue cultures with detection limit at µM level (Granger et
al., 1995). Furthermore, Marzinzig et al. (1997) modified the conventional Griess
reaction by replacing sulfanilamide with dapsone (4,4’-diamion-diphenylsulfone)
coupled with bacterial nitrate reductase, which gave improved detection limit of nitrate
and nitrite ions at 0.5 µM in sera, urine or culture media. In addition, they had
demonstrated that bacterial nitrate reductase was superior in terms of sensitivity and
linear range to reducing metal cadmium to convert nitrate to nitrite. However, in their

62
modified method, the retention time for nitrite and nitrite were 5 and 10 minutes,
respectively, together with a costly experimental set up, may not be practical for
routine analysis.
Because NO has a short half-life, nitrate and nitrite is measured as a marker for NO
production in biological samples as they are the major metabolite of NO in blood
(Bories et al., 1999). The measurement of plasma nitrite was shown to be a sensitive
index of constitutive NO synthesis, which may be used as a marker for endothelial
function. Furthermore, recent research suggested that nitrite represents a circulating
reserve of NO and may selectively donate NO to hypoxic vascular beds (Dejam et al.,
2004).
Similar to the methods used to determine nitrate and nitrite in food, the detection of
these anions in biological fluids such as blood and urine are performed using a UV
detector, where traditional methods measures the reduction of nitrate to nitrite either by
a metal catalyst in HPLC, or by nitrate reductase using spectrophotometry after using
the Griess reaction (Bories et al., 1999).
Bories et al. (1999) developed a method for the determination of nitrate and nitrite in
biological fluids using capillary electrophoresis coupled with UV detector. In addition
to the low cost, small sample and buffer requirements and rapidity (about 4 minutes per
run), the recovery for nitrate and nitrite were 92-106 % and 93-115 %, respectively.
Nitrate and nitrite are usually present in low concentrations in biological samples
whereas matrix interferences such as chloride are present at much higher levels and can
often mask nitrite peak and proceeds immediately before nitrite peak in
chromatographic elution. Therefore sample clean up is important prior to HPLC
analysis in order to achieve good recoveries. For example, the use of silver resin to the
sample can effectively reduce the chloride level (Jobgen et al., 2007).
Major direct dietary sources of nitrite include cured meat and cereals, however, 90 % of
ingested nitrate, from green-leafy vegetable, can be reduced to nitrite by the action of
nitrate reductase expressed by natural microflora on the surface of the mouth (Duncan
et al., 1995).
Tsikas (2004) reported a simple, rapid GC-MS validated anion-pairing HPLC method
with UV detection at 205nm for the accurate determination of urinary nitrate without

63
the need for sample pretreatment. However, this method does not allow for the
simultaneous determination of both nitrate and nitrite, which are both commonly
occurring anions in many foodstuffs.
Based on similar HPLC conditions as this study, Connolly et al. (2002) demonstrated
that urinary sample pre-treatment involving centrifugation and filtering with solid-
phase extraction on C18 cartridge was sufficient to remove organic interferences,
resulting in both precise and sensitive method for the simultaneous determination of
nitrite and nitrate in urine samples.
Traditional sample preparation involves the use of organic solvents followed by clean-
up and pre-concentration steps, which are time consuming, labour intensive, costly and
is bad for the environment. Hence SPME is gaining popularity as “green chemistry”
which is solvent-less, economical and is less time consuming and includes pre-
concentration step allowing a lower limit of detection (Wardencki et al., 2007).
Nitric oxide synthases (NOS) in humans produces nitric oxide from L-arginine and the
metabolic fate of nitric oxide includes oxidation to nitrate by oxyhaemoglobin and
autoxidation in haemoglobin-free media to nitrite. Nitrate and nitrite circulate in the
blood and are excreted in the urine. Circulating nitrite reflects constitutive endothelial
NOS activity, whereas circulatory nitrate indicates systemic NO production. The
concentrations of these NO metabolites in biological fluids are often used to measure
NO synthesis in vivo under standardized low-nitrate diet (Tsikas, 2005).
It is well established that the major urinary metabolite of NO is nitrate. In addition, it
was shown that endogenous NO synthesis follows a circadian variation (Tsikas, 2005);
hence the time of urine collection may affect the concentration of nitrate in the urine.
For example, the maximum and minimum excretion rate was between 5 and 8 pm and 5
to 8 am, respectively (Tsikas, 2005).
In healthy humans with uncontrolled nitrate diet, urinary excretion rate of nitrate was
1200 µmol/24h and for nitrite was 6 µmol/24h. Urinary nitrate and nitrite excretions
were less in the same subjects on low-nitrate diet indicating that diet is a major
contribution factor to urinary nitrate (Tsikas, 2005).
The main metabolic products of endogenously formed NO include oxidation to nitrate
by oxyhemoglobin in red blood cells and autoxidation to nitrite. Both nitrate and nitrite

64
circulate in blood and are eliminated via renal excretion as urine (Wennmalm et al.,
1993). It is known that circulating nitrite reflects constitutive endothelial NOS activity
and that excretory nitrate indicates systemic NO production (Tsikas et al., 2006).
Nitrite concentrations in urine of healthy adults usually range in between 100 and 3000
µM, whereas nitrate concentration is usually in the range of 300 to 1400 µmol/day.
Humans consistently excreted more nitrate than ingested from food. Nitrate in human
urine is not entirely derived from nitrate in the food, but is endogenously produced at a
relatively constant rate and independently of nitrate ingestion. Thus differences in
urinary nitrate excretion are due to differences in the intensity of nitrate production
(Tsikas, 2007).
GC-MS can be used to simultaneously determine nitrate and nitrite in human biological
fluids with high sensitivity, selectivity and a low detection limit. However, it requires
time consuming derivatisation step and sample pretreatment and cleanup (Helmke and
Duncan, 2007).
Nitrite can be reduced to nitric oxide by dietary reductants such as anthocyanin and
catechol (caffeic acid) from red wine as was demonstrated in healthy volunteers by
measuring NO in the air expelled from the stomach following consumption of wine
(Gago et al., 2007). Although NO is now recognized as an important signal molecule,
the physiological significance of the amount generated from the consumption of red
wine is not known. Furthermore, ascorbic acid (AA) can also reduce nitrite to NO and
since AA is commonly occurring in foodstuffs the significance of red wine as a
modulator for NO production is unknown.
NO function as a messenger molecule within the cardiovascular system and is a highly
unstable free radical in circulating blood and is oxidized rapidly to nitrite and nitrate.
However, under hypoxic conditions nitrite is reduced to bioactive NO by
deoxyhemoglobin, which represent NO cycle that adapt to demand and supply by the
vascular system. Endothelium-derived NO is synthesized from the amino acid L-
arginine by the constitutive calcium/calmodulin-dependent endothelial NO synthase.
NO autoxidizes exclusively to nitrite in acqueous solutions free of biological materials,
however, in whole blood NO is oxidized by oxyhemoglobin almost completely to
nitrate. Although HPLC can offer simultaneous and high-throughput detection of
nitrate and nitrite without derivatization, it can suffer from interference by chloride
65
with UV detection due to insufficient resolution and column saturation. (Grau et al.,
2007).
Urinary and plasma nitrate and nitrite levels not only reflects endogenous NO
production, but also total dietary nitrate and nitrite as well as conversions made by
bacteria found in the oral cavity and in the gastro-intestinal tract. Various detection
methods are available for the simultaneous determination of nitrate and nitrite ions.
However, major problems involving biological samples include matrix interferences,
low sensitivity and lack of selectivity. Therefore sample preparation may be the crucial
step in accurately quantifying these anions in biological fluids (Bryan and Grisham,
2007). Ellis et al. (1998) gave a concise review on nitrite and nitrate analyses from a
clinical biochemistry perspective.
2.6 Food Industry and Regulations
2.6.1 Functions of nitrate and nitrite in meat-based products
Nitrite is used in meat curing for colour development, flavour enhancement and as a
preservative. Nitric oxide (NO) is formed from nitrite under acidic conditions, and
when it combines with the muscle pigment myoglobin, NO myoglobin is formed. This
complex is relatively resistant to light and oxygen, but is very resistant to heat, which
allows cured meat to maintain its red colour even after cooking. Doses of NaNO2
between 3 and 50 mg /kg are usually enough for this purpose. Similarly, flavour
development could be achieved with 20 – 40 mg/kg NaNO2. Lastly, as a preservative,
80 to 150 mg/kg NaNO2 can inhibit the growth of numerous food-poisoning bacteria
including Clostridium botulinum, Salmonella and Staphylococci (FAO, 1991).
The inhibitory effect of nitrite on bacterial spore formers such as Clostridium is due to
inhibition of outgrowth during cell division. Nitrite acts in threes ways on bacterial cell
metabolic processes: Firstly, nitrite interferes with energy conservation by inhibiting
oxygen uptake, oxidation phosphorylation, and proton-dependent active transport;
secondly, nitrite acts as an uncoupler, causing a collapase of the proton gradient; and
finally, nitrite inhibits certain metabolic enzymes. Factors such as pH, oxygen, heating
and other food components can affect the effectiveness of nitrite as an anti-Clostridial
agent. Nitrites have found to be most inhibitory at acidic pH under anaerobic and
heated conditions (Shafiur Rahman, 1999). However, the preservative effect of sodium

66
nitrite decreases with increasing storage temperature, therefore instructions for
refrigeration is necessary to prolong shelf life and prevent food poisoning (FAO, 1991).
Due to the toxic effects of nitrite, it is often mixed with table salt at approximately 0.6
% of nitrite when used for curing. This is to ensure public health so that if excessive
levels of nitrite are accidentally added to the final product, the accompanying salty taste
should be rejected by the consumer, thereby preventing nitrite poisoning. In addition to
the prevention of nitrite poisoning, salt is added to cured meat for flavor enhancement,
is essential for the functional properties of meat proteins, and also act as a preservative
(FAO, 1991).
Alternative preservation method such as gamma irradiation had been demonstrated to
inactivate many microbes including the pathogenic C. botulinum in cured meat.
However, because irradiation does not impart the characteristic flavor or color typical
of cured meat, sodium nitrite will still be needed but in much less quantity (National
Academy of Sciences, 1981) from about 150 to 40 mg/kg NaNO2, which should
significantly reduce the body’s burden of dietary nitrite intake.
In Mediterranean countries, the consumption of non-fermented sausages is increasing
due to the dislake of intense acid flavour of fermented sausages, thus Sanz et al. (1998)
examined the effects of nitrate and nitrite curing salt on microbial changes and sensory
quality of non-fermented sausages. It was shown that by the end of the ripening process
(26 days), the levels of microorganisms were similar in both batches of sausages except
psychrotrophs such as lactic acid bacteria and yeasts were higher in those made from
nitrite. However, nitrate-made sausages showed higher aroma and taste intensity. In
contrast, nitrite discourages the growth of psychrotrophs in fermented sausages. It was
concluded that nitrate-made sausages produced better sensory qualities without
compromising microbiological safety.
Pegg and Shahidi (1996) elucidated the structure of pre-formed cooked cured-meat
pigment (CCMP) using visible spectroscopy and concluded that CCMP is a
mononitrosol, not a dinitrosyl. This was further supported as a pentacoordinated
paramagnetic complex using electron paramagnetic resonance study.
It was shown that curing ingredients especially nitrate increased the production of
important branched-chain flavor compounds in sausages (Olesen et al., 2004). Cured

67
color development during dry cured sausage processing was studied by Chasco et al.
(1996) and it was shown that during fermentation nitrites reacted with myoglobin to
form nitrosomyoglobin and metmyoglobin, which was reduced to nitrosomyoglobin
during the drying process.
The development of foods with an attractive color is paramount since consumers are
more likely to reject a food product based on its color. Furthermore, the additions of
naturally occurring colorants are preferred due to their perception of healthy and better
quality then those foods with artificial coloring (Bloukas et al., 1999). Bloukas et al.
(1999) tested various natural colorants including curcumin in frankfurters but
concluded that betanin followed by carminic acid and nitrite gave the highest score for
overall acceptability. Furthermore, they had demonstrated that increasing the level of
betanin could reduce the amount of nitrite added from 150 to 100 mg/kg.
2.6.2 Functions of ascorbate and erythorbate in cured meat
The salts of ascorbic acid and erythorbic acid in the forms of sodium ascorbate and
sodium erythorbate are used in cured meat since they do not react with nitrite to form
nitrous oxide. The roles of these antioxidants are four-fold. Firstly, ascorbate
accelerates the rates of curing by reducing metmyoglobin to myoglobin; Secondly,
ascorbate reacts with nitrite to increase the yield of nitric oxide from nitrous acid;
Thirdly, as an antioxidant, excess ascorbate help stabilize both color and flavor by
preventing heme-catalyzed lipid oxidation resulting in reduced pigment degradation
and delayed rancidity; Finally, ascorbate have been shown to reduce nitrosamine
formation under certain conditions. For example, at the ratio of 1:4.5 nitrite and
ascorbate, respectively, has been shown to reduce or eliminate nitrosamine formation
(Pearson and Gillett, 1996).
2.6.3 International food safety
The HACCP is a food safety management system that ensures the overall management
of food quality and safety by identifying and managing critical points in food
processing as part of the Good Manufacturing practices (GMP). Risk analysis forms a
major part of developing standards, guidelines and other recommendations regarding
food safety (FAO, 1995). However, HACCP is not applicable to all food industries,
usually only to those food industry sectors with scientifically proven or good

68
epidemiological link of a particular food to public health risks. It is in these industries
that are required to develop and implement HACCP plans (FAO, 1995).
The Uruguay Round of the General Agreement on Tariffs and Trade (GATT), the
Agreement on the Application of Sanitary and Phytosanitary Measures (SPS) and the
agreement on Technical Barriers to Trade (TBT) are all administered by the Codex
Alimentarius Commission to ensure fair trading in international food trade as well as to
ensure public health by establishing international food standards to minimize food
related illnesses (FAO, 1995).
2.6.4 Regulatory agencies and the government
The regulatory agencies help to establish the principles of HACCP and to verify that
the plans are working by regular reviews and inspections. In addition, the regulatory
agencies monitor epidemiological studies to identify possible food safety hazards and
to conduct risk evaluations to improve and update HACCP plans (FAO, 1995).
HACCP-based operating practices for the transportation and warehousing sector
requires general educational programs for those companies responsible for transporting
and/or storing sensitive foods or foods that are potentially hazardous to health if not
handled correctly (FAO, 1995).
Food service and food retail represent a diverse work force and a wide range of foods,
as well as having an extremely high turnover of employees, up to 400 % per year in
some cases has been reported (FAO, 1995). This represented a major problem with
HACCP compliance due to the high employee turnover rate and the varying level of
education and language competency. It is therefore essential to ensure that educational
programs with reference to proper food handling and personal hygiene are taught
efficiently in these food sectors, especially when high-risk foods are involved. For
example, the use of thermometer in supermarket refrigerators will minimize NOC
formation in cured meat products, whereas constant training is required to maintain
employee awareness (FAO, 1995).
69
2.7 Determination of nitrate and nitrite in food and their estimated dietary intake
2.7.1 Introduction
High dietary intake of nitrate and nitrite has been implicated in the aetiology of human
gastric cancer. Nitrate is naturally present in green leafy vegetables and nitrite is
usually added in meat as a preservative in the form of sodium or potassium nitrite
(Mirvish, 1995). However, Campos and Gerschenson (1996) demonstrated that in the
absence of sodium nitrite, ascorbic acid exhibited pro-oxidant effect. In contrast, in the
presence of sodium nitrite, asocorbic acid exhibited a protective role. The combined
use of the preservative sorbates and nitrites in meat can result in the formation of a
mutagen ethylnitrolic acid during processing and storage (Binstok et al., 1998).
Nitrate can be reduced to nitrite in the oral cavity and in the stomach. Once in the
stomach, nitrite can react with amines to form a group of carcinogens known as NOCs.
However, there are dietary factors that can inhibit or reduce the formation of these
carcinogens. For example, ascorbic acid and α-tocopherol has been shown to compete
with nitrite for the precursors thus reducing the amount of precursors available to react
with nitrite (Hwang et al., 1994).
It was estimated that 80 % of human cancers were caused by environmental factors
associated with food, water and air (Walters, 1980). In addition, malnutrition, dietary
habits and lifestyle may be directly or indirectly related to 40 % of the human cancers
(Ologhobo et al., 1996). High dietary intakes of nitrate and nitrite have been implicated
in the etiology of human gastric cancer based on epidemiology and clinical studies
(Bartsch et al., 1990 and Joossens et al., 1996).
Nitrate is naturally present in leafy vegetables and nitrite is usually added to meat as a
preservative in the form of sodium or potassium salt (Cammack et al., 1999). In
addition nitrate can be reduced to nitrite in the oral cavity and in the stomach (Duncan
et al., 1997). Once in the stomach, nitrite can react with amines and amides, which are
organics containing nitrogen such as amino acids, to form a group of carcinogens
known as NOCs (Archer, 1989). Stomach is most at risk from endogenous NOC
synthesis since stomach acid catalyses nitrosation reactions. High nitrate intake was
associated with gastric cancer in England, Colombia, Chile, Japan, Denmark, Hungary
and Italy (Forman et al., 1997). Exposure to endogenously formed NOCs had been
70
associated with increased risks of cancer of the stomach, oesophagus and bladder
(Bartsch et al., 1990).
Australia’s food composition data were mostly based on overseas data especially those
from the United Kingdom and the United States until recently. However, in the revised
Australian composition tables based on food analysis performed in Australia, the edible
portion of fruit increased by 4 % whereas in meat it decreased by 16 % (Cashel and
Greenfield, 1995). Thus dietary contribution of nitrate and nitrite may be over-
estimated, whereas dietary intake of antioxidants such as vitamin C and vitamin E may
have been underestimated.
The dietary intake of nitrates and nitrites in foods can vary greatly from region to
region depending on factors such as farming practices, climate, soil quality,
manufacturing processes and legislation. Nitrate and nitrite contents of foods are not
available in Australia; hence values from overseas are commonly used. Due to the
growing concern of NOCs, accurate and robust methods are necessary for long-term
monitoring of nitrate and nitrite concentrations in foods for susceptible populations.
It is therefore the aim of this study to develop an accurate, simple and cost-effective
method for quantifying the nitrate and nitrite contents in commonly consumed
vegetables, cured meat and fresh meat produced in Australia.
2.7.2 Materials and Methods
2.7.2.1 Reagents
Analytical grade sodium nitrite and potassium nitrate from Univar (Ajax Finechem)
were used as standards and for recovery studies. HPLC grade methanol from Lab-Scan
was used and ion-pairing agent tetrabutylammonium phosphate was purchased from
Waters.
2.7.2.2 Food samples
All vegetables were purchased at local supermarkets, produce shops or wholesale and
kept at refrigeration temperature and analyzed within 24 hr. All cured and fresh meat
products were also purchased at supermarkets and kept at refrigeration temperature (4 oC) and analyzed within 48 hr.
71
2.7.2.3 Apparatus
Waters HPLC controller model number 600 with photo array detector model number
996 and autosampler model number 717 plus were used. Phenomenex C18 110A
Gemini column (250 mm x 4.6 mm x 5 µm) was used for the separation. Injection
volume was 10 µl with flow rate set at 1 mL/min and wavelength set at 214 nm.
Mobile phase consisted of methanol: water (75:25) with 0.075M of
tetrabutylammonium phosphate (PIC-A).
2.7.2.4 Standards
Potassium nitrate (KNO3) and sodium nitrite (NaNO2) were mixed in MilliQ water in
volumetric flasks to give a range between 5.0 and 100.0 mg/L for nitrite ions and 2.5 to
50.0 mg/L for nitrate ions.
2.7.2.5 Sampling and extraction
Weighed 10.0 to 50.0 g of meat samples including salami, hot dogs, ham, bacon,
Frankfurt and beef, which were purchased from the local supermarkets (at least two
packets each) of two different brands, were blended with 300 mL distilled water for 1
min, then made up to 500 mL in volumetric flasks. The pH was measured and 1 mL
was taken out for measuring nitrate and nitrite content before cooking using HPLC.
Ten mL of mixture of each sample was transferred into 100 mL volumetric flasks and
heated in a water bath at 75, 80, 90 and 100 oC for 5, 10 and 15 min. The mixture was
made up to 100 mL with distilled water and was shaken. The mixture was allowed to
settle and cool; then measured pH and nitrite and nitrate contents. The pH was adjusted
with 0.1 M NaOH to neutral pH. Then the mixture was centrifuged at 10,000 rpm for
10 min; then supernatant was removed for ultra-filtration. The filtrate was used for
further analysis including quality control such as recovery studies.
Fresh vegetables including English spinach, buk choy, choy sum, Chinese cabbage, gai
choy and iceberg lettuce were purchased from the local supermarkets and produce
stores. Three bunches each from two different locations with at least three replicates
were used for the analysis including recoveries. To examine the effects of sample
preparation and extraction conditions on nitrate and nitrite determination samples were
chopped in thirds or blended or both and weighed between 25 and 100 g in 500 mL

72
beakers. Spiking with standards was done before cooking in water bath between 60 and
100 oC for 5 to 30 min.
2.7.2.6 Statistical test
Multivariant ANOVA by SPSS Data Editor was used to determine any significant
differences in recoveries of nitrate and nitrite based on different sampling and cooking
parameters.
2.7.3 Results and discussion
Table 2.2 Mean recoveries for nitrate and nitrite in selected vegetables and meat.
___________________________________________________ Food Nitrite recovery (%) Nitrate recovery (%) ___________________________________________________ Vegetables 97.0 ± 10.1 96.5 ± 11.0 Meat 92.1 ± 10.2 92.2 ± 11.5 ___________________________________________________ All values are means of replicate analyses. Mean recoveries from all vegetables and
meat tested. Meat includes cured and fresh meat.
Table 2.3. Mean nitrate and nitrite contents and their recoveries in fresh vegetables
after five minutes boiling.
Vegetables Nitrite Nitrate (mg/kg) (mg/kg) English spinach 0 4849.6 ± 573.6 Recovery (%) 89 74 Buk choy 0 1841.1 ± 84.0 Recovery (%) 97 97 Choy sum 0 1376.9 ± 56.0 Recovery (%) 111 102 Chinese cabbage 0 236.2 ± 27.4 Recovery (%) 91 97 Gai choy 19.6 ± 10.8 1642.3 ± 126.0 Recovery (%) 102 100 Iceberg lettuce 0 48.0 ± 30.2 Recovery (%) 92 110 Detection by UV at 214 nm using C18 Phenomenex column with 0.075M PIC-A and
methanol and water (25:75) as the mobile phase. Values were means of at least four
replicates from two sources and up to fifteen determinations.

73
Table 2.4 Mean raw nitrate and nitrite contents and recoveries in cured and fresh meat
from Sydney supermarkets after pH adjustment.
Meat Nitrite Nitrate (mg/kg) (mg/kg) Hot dog 78.6 ± 16.4 69.9 ± 11.3 Recovery (%) 109 103 Ham 34.2 ± 5.5 19.0 ± 8.1 Recovery (%) 97 87 Salami 0 142.5 ± 36.3 Recovery (%) 91 102 Bacon 15.7 ± 14.5 23.3 ± 8.2 Recovery (%) 91 82 Frankfurt 83.9 ± 10.1 54.9 ± 8.7 Recovery (%) 96 94 Minced Beef 0 18.7 ± 6.2 Recovery (%) 80 104 Beef medallion 0 38.5±14.9 recovery (%) 80 75
Detection by UV 214 nm using C18 Phenomenex column with 0.075M PIC-A and
methanol: water (25:75) as the mobile phase. Values were means of at least four
replicates from two to four brands with up to five determinations.
Nitrate and nitrite can be unstable and different sampling methods and extraction
procedures can influence their recoveries (Usher and Telling, 1975). Hence various
sampling and extraction procedures were tested to find the optimal extraction
conditions for nitrate and nitrite determinations in fresh vegetables, cured meat and
fresh meat. The optimal extraction conditions were determined by analyzing nitrate and
nitrite concentration at various temperatures, cooking time and sample size since these
can affect their detection. Vegetables were cooked at 100 oC for 5 min with sample size
of 100 g to correspond common cooking practises. Cured and freshed meat were
extracted at 75 oC for 15 min with a sample size of 50 g. Since cured meat is not
normally cooked before consumption, the lowest temperature was used and gave a
good recovery (Table 2.2).
Sample size was chosen so that a representative sample can be ensured that also takes
into account of natural heterogeneity of the samples tested. Mean recoveries were > 92
% for both nitrate and nitrite in two food matrices tested (Table 2.2). Taking into

74
account of factors affecting nitrate and nitrite recovery in foods include 1) temperature
since nitrate and nitrite are not stable at high temperatures, 2) cooking conditions,
which can affect pH of the sample water and exposure to atmospheric oxygen, 3) pH of
the sample water, since nitrite is readily converted to nitric acid or nitric oxide at acidic
pH, and 4) sources of food samples can vary greatly and may contain interfering
substances such as iron and magnesium (Usher and Telling, 1975). In addition, plants
posesses nitric oxide synthase (del Río et al., 2004) that can further reduce its nitrate
and nitrite content to nitric oxide. Boiling was used to extract nitrate and nitrite in
vegetables in this study (Table 2.3) because it is the commonly used method to cook
vegetables. In addition, pH was monitored and maintained close to neutral pH to
minimize conversion of nitrite to nitrous acid or nitrous oxide.
Nitrite levels in vegetables may increase during post-harvest storage by the action of
indigenous bacteria and/or the presence of nitrate reductase (Hunt, 1994), especially
when they are left at room temperature or higher. This may explain the small amount of
nitrite (19.6 mg/kg) present in Gai choy during the preparation at room temperature
(Figure 2.6). Likewise, it was demonstrated that there was no detectable nitrite in 94 %
of edible fresh retail vegetables (Hunt and Turner, 1994). Cultivar and harvest date can
affect the nitrate and nitrite levels of selected vegetables (Amr and Hadidi, 2001). This
may explain the high variability and hence the high standard deviation observed in
Table 2.3.
English spinach had the highest nitrate content (4850 mg/kg) compared to other
vegetables (Table 2.3). This finding correlated well with the literature (Öztekin et al.,
2002). However, according to Gaiser et al (1996), spinach blanched for 3 min can
contain in the range of 50 to 5600 mg/kg nitrates with a mean nitrate concentration of
approximately 2000 mg/kg and a large standard deviation of 1411.4 mg/kg. This
demonstrated the high variability of nitrate content in spinach and other green leafy
vegetables. Excluding spinach, other vegetables tested had nitrate ranging 48 - 2121
mg/kg, which is half that of spinach (Table 2.3). Thus it can be concluded that spinach
contributed to the highest dietary nitrate intake from leafy green vegetables. Lettuce
contained lowest amount of nitrate in this study (48.0 mg/kg, Table 2.3), which was
significantly lower to earlier studies that demonstrated high nitrate content in lettuce at
2500 mg/kg (Marshall and Trenerry, 1996). The dissimilarity may be due to
horticultural practices such as the use of nitrate-based fertilizers.
75
Hot water extraction was used in this study to mimic common household cooking
method. However, the nitrate content was shown to vary depending on the cooking
method. For example, Prasad and Chetty (2008) demonstrated that frying in soya bean
oil increased nitrate content of leafy vegetables from 159 to 307 %. In contrast, boiling
reduced nitrate content by 47-56 %, most likely due to nitrate ions leaching into the
cooking water, whereas baking had no significant effect on the nitrate content. In
addition, Pham et al. (2008) shown that frozen spinach had half the nitrate content of
fresh spinach. This may be caused by the leaching of nitrate ions upon defrosting due to
the damage to plant cell integrity during freezing.
Based on plasma nitrate and nitrite from a small human trial, van Velzen et al. (2008)
demonstrated that the absolute bioavailability of nitrate from vegetables was almost
100 % regardless of whether it was cooked or raw. This suggests that vegetable matrix
components may affect extraction efficiency, but once it is ingested it releases all the
nitrate content for circulation.
Different countries have set their maximum limits for the addition of nitrate and/or
nitrite salts in cured meat. Under the Australian Food Standard Code 1.3.1 schedule 1,
125 mg/kg of nitrite in a form of potassium or sodium salt is permitted in cured, dried,
and slow dried cured meat; whereas in commercially sterile and canned cured meat, the
maximum nitrite (potassium or sodium salts) permitted is 50 mg/kg. For slow dried
cured meat, the maximum allowed nitrate (potassium or sodium salts) is 500 mg/kg
(FSANZ, 2009). Given the established antimicrobial effect of nitrite salts, particularly
in reference to Clostridium botulinum in cured meat, its level should remain sufficient
to prevent the occurrence of food borne illnesses, but also kept to the minimum to
minimize dietary nitrite intake in light of its potential adverse health effects based on
epidemiological and clinical studies. Due to growing popularity of “natural” and
“organic” foods in the United States, alternative processes that use high nitrate
vegetable-based ingredients and nitrate-reducing starter culture have produced
processed meat products with very similar cured meat properties (Sebranek and Bacus,
2007). However, the nitrate and nitrite content and residual content were hard to
standardize in these natural products because of the “live” reactions that occurs.
Therefore food safety especially botulism is a key issue as well as product consistency
and quality may also be compromised.
76
Seven types of meat tested in this study had at least four replicates each from at least
two brands. Nitrate and nitrite contents in various cured meat products and fresh meat
were below the maximum allowable limit set by Food Standards Australia and New
Zealand (FSANZ, 2009)(Table 2.4). Continuous monitoring of nitrite used in cured
meat products is important to ensure that the dietary intake of nitrite is kept to below
the limit set by FSANZ. Nitrate and nitrite concentration in these cured meat products
were tested before cooking (hot water extraction), after cooking and after pH
adjustment. Nitrate and nitrite concentration increased after extraction since these
anions were released into the water, however, the final concentration was presented
after pH adjustment once they were stabilized.
Interferences naturally present or added additives in cured meat products may account
for differences in nitrate and nitrite recovery. For example, Butt et al. (2001)
demonstrated that the presence of 50-fold sulphate and chloride did not affect the
resolution and percent recovery of nitrite, but did reduce the resolution and recovery of
nitrate. In addition, the presence of magnesium, iron and calcium significantly reduced
the percentage recovery of both anions, which should be removed to ensure accurate
determination of nitrate and nitrite. Furthermore, they also demonstrated that under
optimized HPLC conditions, both nitrate and nitrite peaks began to merge when the
concentration of nitrite was above six-fold of nitrate concentration, hence nitrite used in
calibration curve and for recovery were half the concentration of nitrate to minimize
the merging of nitrite and nitrate peaks.
Using similar detection method as Reinik et al. (2005), they found the mean sodium
nitrite and nitrate concentrations in ham were 20.8 and 68.0 mg/kg, respectively.
However in this study, the nitrite concentration in ham averaged at 34.2 ± 5.6 mg/kg
and nitrate concentration was lower at 19.0 mg/kg (Table 2.4). Some manufacturers
add less nitrite but more nitrate as a nitrite reserve. This may also explain the
differences in the findings by Öztekin et al. (2002), where the nitrite and nitrate
contents in ham were 4.0 and 35.6 mg/kg, respectively.
Dionex Corporation (1998) found the nitrite and nitrate contents in ham to be 11.6 and
5.4 mg/kg, respectively, whereas salami contained 108.0 mg/kg nitrite and 98.5 mg/kg
nitrate. Using capillary electrophoresis, the nitrite and nitrate content in salami detected
were 24.3 and 43.6 mg/kg, respectively (Öztekin et al., 2002). Compared to their

77
findings, the current study showed that the salami contained much less nitrite at 3.7
mg/kg and much more nitrate at 139.5 mg/kg (Table 2.4). Although the extraction
methods were similar the temperature used in our study was higher, apart from the
differences that may be attributed to the manufacturing practices. Stalikas et al. (2003)
used similar extraction temperature and reported that nitrate and nitrite contents in
salami were 54.0 and 84.0 mg/kg, respectively. Thus differences are more likely to be
due to the manufacturing processes.
It was reported by Dennis et al. (1990) that the mean nitrite content in bacon was 24.0
mg/kg and for nitrate was 43.0 mg/kg, whereas nitrite and nitrate in ham were 56.0 and
22.0 mg/kg, respectively. They used similar extraction and detection methods but with
an anion exchange column. Both bacon and ham products in this study contained less
nitrate and nitrite (Table 2.4) in comparison. Siu and Henshall (1998) who found that
nitrite and nitrate contents in salami were 108.0 and 98.5 mg/kg, respectively, and 11.6
and 5.4 mg/kg for ham, respectively. Sample extraction procedures used in the current
study were similar to Marshall and Trenerry (1996), but they omitted the heating step.
This may explain the low nitrite content of less than 10 mg/kg in salami, leg ham and
bacon. However the nitrate contents were higher at 141.5, 132.5 and 48.0 mg/kg,
respectively. Different cured meat products may require different ratio of nitrite and
nitrate as preservatives. Since fresh meat does not naturally contain nitrite (Table 2.4),
its nitrite and nitrate contents have not been extensively tested. However, based on this
study, the nitrate content in minced beef and medallion beef were within the range
found in cured meat products (Table 2.4).
It was demonstrated that recovery increases as the meat solids decreases (Usher and
Telling, 1975). Hence using smaller meat samples should reduce the effects of
interfering substances, which was demonstrated in this study with acceptable recoveries
(Table 2.2). Furthermore, most interference can be eliminated by UV detection.
However, UV may detect chloride ions as positive or negative peaks in the wavelength
used for nitrate and nitrite and are eluted before nitrite (Di Matteo and Esposito, 1997).
Chloride peaks were not present at 214 nm in this study, which suggests that chloride
ions did not interfere with nitrite quantification since nitrite recovery was above 92 %
for both meat and vegetable samples (Table 2.2).

78
Due to its reactive nature, nitrite analysis from food does not give a true representation
of the total nitrite added. Furthermore, nitrite added to meat is usually present as nitric
oxide bound with other food components such as myoglobin (5-15 %), sulphydryl
groups (5-15 %), lipids (1-5 %), proteins (20-30 %), as nitrate (< 10 %), and as free
nitrite (10-15 %) (Zanardi et al., 2002). Therefore recovery range may be quite large as
a result of nitrite’s reactive nature and its attachment to other food components. Other
methods of food extraction estimate the total nitrite present by releasing food-bound
nitrite. This may over estimate the significance of dietary nitrite and the etiology of
gastric cancer because only free nitrite can participate in nitrosation. Hot water
extraction to quantify free nitrite available to participate in nitrosation was used in this
study.
Regarding relevance to incidence of gastric cancer, based on age-standardized
statistics, diagnosed gastric cancer rate per 100 000 in males and females worldwide is
22 and 10.3 %, respectively, with mortality rate of 14.3 and 8.3 %, respectively. Gastric
cancer is the third leading cause of death in men after lung and prostate cancer, and is
the fourth leading cause of death in women worldwide (Forman and Burley, 2006).
Overall gastric cancer rate is declining, especial in more developed countries, with the
exception of Miyagi prefecture of Japan still having the highest gastric cancer rate.
Korea, East Asia, South America and Eastern Europe also sustained a high gastric
cancer rate. However, Bombay in India always maintained a low gastric cancer rate
between 1953 and 1997 (Forman and Burley, 2006). This maybe due to higher
consumption of antioxidant rich fruits and vegetables and herbs and spices, which have
been shown to reduce the risk of gastric cancer. Joossens et al. (1996) studied dietary
salt, nitrate and gastric cancer mortality in 24 countries and demonstrated that nitrate
intake became an increased risk factor for gastric cancer when salt intake was also
high.
It was predicted that increasing population numbers and longevity could cause a net
increase in gastric cancer rate worldwide. Since diagnosis often occurs between the
ages of 60 and 80, with up to 30 % mortality rate after five years diagnosis (Forman
and Burley, 2006), it is vital to make dietary and lifestyle changes to decrease gastric
cancer rate and to increase survival rate with better diagnostic facility and education.
Risk factors to be avoided include H. pylori infection, smoking, high consumption of
cured meat and salt, and low consumption of fruits and vegetables.
79
Once the nitrate and nitrite content in food is established, one can estimate the intake of
these anions based on national dietary surveys. However, the availability for nitrate
certified reference materials is still poor, but is necessary for comparing values
(Castanheira et al., 2004). Gangolli et al. (1994) estimated that the mean daily intake of
nitrate and nitrite in the US were 106 and 1.5 mg/kg, respectively, and in the UK were
104 and 1.5 mg/kg, respectively. In 1994 van Vliet et al. (1997) estimated the mean
intake of nitrate in the Dutch population to be 80 mg/day per person, and the median
intake of nitrite to be 0.1 mg/day per person. In comparison, Italy had a mean daily
intake of nitrate of 245 mg/day, whereas Poland and Switzerland recorded mean daily
nitrate intakes of 178 and 125 mg/day, respectively. France’s mean daily intake of
nitrate and nitrite were 150.7 and > 3 mg/day, respectively, followed by Netherlands,
Germany and Norway where mean daily nitrate intakes were 71, 68 and 43 mg/day,
respectively. The mean daily nitrite consumption in those countries was 0.6, 2.6 and 1.8
mg/day, respectively (Gangolli et al., 1994). According to Cornee et al. (1992), the
average daily nitrate intake per person per day was 121 mg (85 % from vegetables, 5 %
from preserved and cured meat, and 5% from cereal products). For the average daily
nitrite intake per person per day, it was found to be 1.88 mg (43 % from vegetables, 28
% from cured meat, and 16 % from cereals). The remaining 13 % of nitrite must come
from non-dietary sources of nitrite such as atmospheric contamination.
In summary, Pennington (1998) estimated that the daily nitrate intake ranges between
53 and 350 mg/day depending on the type and quantity of the vegetable consumed and
the level of nitrate in drinking water. Whereas daily nitrite consumption was between 0
and 20 mg/day depending on the levels of nitrite present in cured meat and much of it
was consumed. In 1995, the ADI for nitrate was set at 3.7 mg/kg body weight by the
European Union Scientific Committee for Food. Since nitrite has higher acute toxicity
than nitrate its ADI was set at 0.06 mg/kg body weight (Reinik et al., 2005).
Based on the Australian Bureau of Statistics (ABS, 1998-1999), Australians consumed
8.7 kg of bacon and ham combined per capita per year in 1998-1999. Assuming half of
each product was consumed at 4.35 kg per capita per year (or 12 g per capita per day)
based on the finding in this study, nitrite from bacon per capita per day was 0.19 mg,
and for nitrate was 0.41 mg. For ham (12 g per capita per day) nitrite consumed per
capita per day was 0.28 mg and for nitrate was 0.23 mg. Thus combined nitrite and
nitrate intake from bacon and ham per capita per day were 0.47 and 0.64 mg,

80
respectively. At the upper extreme, assuming 100 g of bacon or ham was consumed
every day, the nitrite and nitrate intake from bacon would be 1.57 mg and 3.42 mg per
capita per day, respectively. Similarly for ham the nitrite and nitrate intake would be
2.33 and 1.90 mg nitrite and nitrate per capita per day, respectively, giving a total of
3.9 mg of nitrite and 5.32 mg nitrate per capita per day. This is significantly lower than
the ADI set by the European Union Scientific Committee for Food in 1995.
However, taking endogenous formation of nitrate into account, this means additional
70 mg of nitrate for an average 70 kg adult (Gangolli et al. 1994). Furthermore, it was
estimated approximately 25 % of dietary nitrate is converted to nitrite by bacteria and
nitrate reductase in the oral cavity (Gangolli et al. 1994). Thus assuming two servings
(150 g) of vegetables comes from green leafy vegetables, again taking the analytical
data from this study, this means approximately 727.5 mg of nitrate from English
spinach (Figure 2.7) is ingested, of which 181.9 mg of nitrite can participate in
nitrosation in the stomach. Based on the above assumptions, the total nitrite and nitrate
burden for an Australian adult of 70 kg body weight, the intakes per day is
approximately 185.8 and 620.9 mg, respectively, sourced from cured meat, spinach and
endogenous nitrate formation. This exceeds the ADI of 4.2 mg for nitrite by 44 times
per 70 kg adult per day, and by 2.4 times of ADI of 259 mg nitrate per 70 kg adult per
day. However, it must be noted that the above prediction assumed that nitrite only came
from bacon and ham, and that nitrate intake only came from two servings of English
spinach. Since English spinach had the highest nitrate content, this predicts the upper
extreme of dietary nitrate intake. Furthermore, the ADI do not include the 25 %
conversion of dietary nitrate to nitrite in the oral cavity, which underestimate the total
ingested dietary nitrite. Du et al. (2007) stated that at least 15 % of the adult Dutch
population exceeded the acceptable daily nitrate intake, with children this figure went
up to 45 % due to dietary practices. Although it is possible to exceed the ADI of nitrate
based on the recommended daily intake of 400 g fruit and vegetables, this would not
pose a significant health risk in the context of a balanced diet (Heppner et al., 2008).
However, the source of dietary nitrate and nitrite is an important risk factor since fruit
and vegetable also offers other protections in the form of antioxidants.
Japan has seven times the rate of gastric cancer than the United States and is also
significantly higher compared to the United Kingdom and Germany. There is little
evidence that genetic differences contributed to the different gastric cancer rates

81
(Davies and Sano, 2001). Thus this epidemiological study suggests that diet and
lifestyle may play an important role in gastric cancer aetiology besides effective
screening and management. Countries such as South Korea, Japan and China had the
highest stomach cancer mortality for men, whereas countries with the highest stomach
cancer mortality for women were South Korea, China and Columbia. Canada and
Denmark had the lowest stomach cancer mortality for men and women, respectively
(Joossens et al., 1996).
The high gastric cancer incidence in the Far East may be due to the consumption of
specific foods that are high in nitrates such as Korean Kimchi or high in salt as in many
traditional Japanese dishes, or particular food preparation methods such as broiling of
meats (Duncan et al., 1997). Regions of high risk to gastric cancer often coincide with
a low intake of foods containing vitamin C. Other risk factors for human gastric cancer
include residence in areas with high nitrate-containing soil due to many factors such as
the addition of fertilizers and foods pickled with salt (Weisburger, 1981). Certain salted
fermented fish products including fish sauce were associated with the high gastric
cancer mortality in Fujian province of China (Chen et al., 1992). Similarly, a potential
link for the high gastric cancer rate in Southwest Korea was associated with regular
high consumption of salted pickled cabbage and salted seafood sauce (Seel et al.,
1994). The former also contained high levels of total NOC precursors, and cabbages,
which are known to contain high levels of nitrate than any other vegetables. However,
it was suggested by Lundberg et al. (2006) that green leafy vegetables might have
cardioprotective benefits because of the high nitrate content and its role in vasodilation
once it is reduced to nitric oxide in vivo. This can be tested in clinical trials by
inorganic nitrate supplementation, but green leafy vegetables may contain other
cardioprotective components that work synergistically to prevent a range of human
diseases.
There are no nitrate standards for vegetables to date, except in 2000 Chinese
government had established a maximum level of nitrate in vegetables of 3100 mg/kg
(Du et al., 2007). It was suggested that since there may be health risks associated with
dietary nitrate intake, it was very reasonable to limite the nitrate content in vegetables
and drinking water by legislations (Du et al., 2007). This is perhaps the first step in
achieving a “safety” standard for nitrates in vegetables. However, considering the cost
of the produce, production variability and the cost of analysis, whether this can be
82
sustained and monitored requires further considerations. Another key step is the
development and compilation of vegetable composition databases based on available
data (Hoefkens et al., 2009). This can then be used for estimating nutrient and
contaminant including nitrate intake in susceptible populations, thus providing a useful
tool in the epidemiology studies of nitrate intake and gastrointestinal cancers.
In addition to forming carcinogens in the stomach, nitrite is also genotoxic and can
readily induce methaemoglobinaemia especially in babies (Gangolli et al., 1994).
Furthermore, the lethal dose for nitrite in adults was estimated to be between 2 and 9 g
NaNO2 per day, or 33-250 mg/kg body weight (Gangolli et al., 1994), whereas the
lethal dose for nitrate ions was estimated at 20 g per day, or 330 mg nitrate ions/kg
body weight (Gangolli et al., 1994). Although it is unlikely to reach these toxic levels
from dietary intake alone, the long-term effects may be detrimental based on
epidemiological and clinical studies.
The European Union have regulated the maximum nitrate levels for vegetables ranging
from 2000 mg/kg frozen spinach to 4500 mg/kg fresh lettuce (Bottex et al., 2008).
Given the potential adverse health effect of dietary nitrate and nitrite intake, it would be
beneficial for Australia to set up similar regulatory and monitoring programs to ensure
public health in the long term.
2.7.4 Conclusion
Different authors attributed different percentage of dietary nitrate and nitrite to the
major food groups, but the consensus is that vegetables contributed to the majority of
dietary nitrate and that cured meat products contributed to the majority of dietary
nitrite. This study agreed with the literature that vegetables are the major dietary nitrate
contributor and that meat and especially cured meat provided the majority of dietary
nitrite. The extraction and detection method used in this study was demonstrated to be
simple, fast, sensitive and applicable to both meat and vegetable samples.
Nitrate and nitrite content of foodstuff should be monitored in the long term to estimate
the dietary intake and to provide insights into the effects of new horticultural and
manufacturing technologies on the levels of nitrates and nitrite in foods and in the
aetiology of gastro-intestinal cancers. It was demonstrated that nitrate and nitrite
content tested were below the guideline set by FSANZ and their intake were within the

83
range reported in the Western countries and were below the acceptable daily intake.
This study will be the first to quantify the levels of nitrate and nitrite in foods in the
Sydney supermarket and will provide useful data to industry and health professionals.

84
2.8 References
Abuharfeil, N., Sarsour, E., and Hassuneh, M. 2001. The effect of sodium nitrite on some parameters of the immune system. Food and Chemical Toxicology, 39:119-124.
Amr, A., and Hadidi, N. 2001. Effect of cultivar and harvest date on nitrate (NO3) and nitrite (NO2) content of selected vegetables grown under open field and greenhouse conditions in Jordan. Journal of Food Composition and Analysis, 14:59-67.
Andrade, R., Viana, C.O., Guadagnin, S.G., Reyes, F.G.R., and Rath, S. 2003. A flow-injection spectrophotometric method for nitrate and nitrite determination through nitric oxide generation. Food Chemistry, 80:597-602.
Archer, M.C. 1989. Mechanisms of action of N-nitroso compounds. Cancer Surveys, 8:241-250.
Australia Bureau of Statistics. 1998-1999. 16.59 Apparent per capita consumption of foodstuffs. Available on: www.abs.com.au [25 Feb 2008]
Badea, M., Amine, A., Palleschi, G., Moscone, D., Volpe, G., Curulli, A. 2001. New electrochemical sensors for detection of nitrites and nitrates. Journal of Electroanalytical Chemistry, 509:66-72. Barbier, G.G., Joshi, R.C., Campbell, E.R., and Campbell, W.H. 2004. Purification and biochemical characterization of simplified eukaryotic nitrate reductase express in Pichia pastoris. Protein Expression and Purification, 37:61-71.
Bartsch, H., Ohshima, H., Shuker, D., Pignatelli, B., and Calmels, S. 1990. Exposure of humans to endogenous N-nitroso compounds: implications in cancer etiology. Mutation Research, 238:255-267.
Binstok, G., Campos, C., Varela, O., and Gerschenson, L.N. 1998. Sorbate-nitrite reactions in meat products. Food Research International, 31:581-585.
Bloukas, J.G., Arvanitoyannis, I.S., and Siopi, A.A. 1999. Effect of natural colourants and nitrites on colour attributes of frankfurters. Meat Science, 52:257-265.
Bories, P.N., Scherman, E., and Dziedzic, L. 1999. Analysis of nitrite and nitrate in biological fluids by capillary electrophoresis. Clinical Biochemistry, 32:9-14.
Bottex, B., Dorne, J.J., Carlander, D., Benford, D., Przyrembel, H., Heppner, C., Kleiner, J., and Cockburn, A. 2008. Risk-benefit health assessment of food-Food fortification and nitrate in vegetables. Trends in Food Science and Technology, 19:S113-119.
van den Brandt, P.A., and Goldbohm, R.A. 2006. Nutrition in the prevention of gastrointestinal cancer. Best Practice and Research Clinical Gastroenterology, 20: 589-603.
Briggs, D., and Lennard, L. 2002. ‘Risks, additives, contaminates and natural toxicants’, In Food and Nutrition: Australasia, Asia and the Pacific, 2nd ed. ed. M. Wahlqvist, Allen and Unwin Pty Ltd, Sydney.

85
Bryan, N.S. 2006. Nitrite in nitric oxide biology: Cause or consequence? A systems-based review. Free Radical Biology and Medicine, 41:691-701.
Bryan, N.S., and Grisham, M.B. 2007. Methods to detect nitric oxide and its metabolites in biological samples. Free Radical Biology and Medicine, 43:645-657.
Butt, S.B., Riaz, M., and Iqbal, M.Z. 2001. Simultaneous determination of nitrite and nitrate by normal phase ion-pair liquid chromatography. Talanta, 55:789-797.
Cammack, R., Joannou, C.L., Cui, X-Y., Martinez, C.T., Maraj, S.R., and Hughes, M.N. 1999. Nitrite and nitrosyl compounds in food preservation. Biochimica et Biophysica Acta, 1411:475-488.
Campos, C.A., and Gerschenson, L.N. 1996. Effect of certain additives on sorbate stability. Food Research International, 29:147-154.
Cashel, K.M., and Greenfield, H. 1995. The effect of revised Australian food composition tables on estimates of foods and nutrients available for national consumption, 1983-1984. Journal of Food Composition and Analysis, 8:45-61.
Cashel, K.M., and Greenfield, H. 1996. The impact of new Australian food composition data on national dietary references. Food Chemistry, 57:63-66. Cashel, K.M., and Greenfield, H. 1997. Population Nutrition Goals and Targets for Australia: Influences of New Australian Food Composition Data. Journal of Food Composition and Analysis, 10:176-189. Cassens, R.G. 1995. Use of nitrite in cured meats today. Food Technology, 49:72-80.
Castanheira, I., Oliveira, L., Valente, A., Alvito, P., Costa, H.S. and Alink, A. 2004. The need for reference materials when monitoring nitrate intake. Analytical and Bioanalytical Chemistry, 378:12332-1238.
Chasco, J., Lizaso, G., and Beriain, M.J. 1996. Cured colour development during sausage processing. Meat Science, 44:203-211.
Cassens, R.G. 1995. Use of nitrite in cured meats today. Food Technology, 49:72-80.
Chen, C.S., Pignatelli, B., Malaveille, C., Bouvier, G., Shuker, D., Hautefeuille, A., Zhang, R.F., Bartsch, H. 1992. Levels of direct-acting mutagens, total N-nitroso compounds in nitrosated fermented fish products, consumed in a high-risk area for gastric cancer in southern China. Mutation Research, 265:211-221.
Chen, B-M., Wang, Z-H., Li, S-X., Wang, G-X., Song, H-X., and Wang, X-N. 2004. Effects of nitrate supply on plant growth, nitrate accumulation, metabolic nitrate concentration and nitrate reductase activity in three leafy vegetables. Plant Science, 167:635-643.
Chow, C.K., and Hong, C.B. 2002. Dietary vitamin E and selenium and toxicity of nitrite and nitrate. Toxicology, 180:195-207.
Clark, D.B., Barnes, K.A., Castle, L., Rose, M., Wilson, L.A., Baxter, M.J., Price, K.R., and DuPont, M.S. 2003. Levels of phytoestrogen, inorganic trace-elements, natural toxicants and nitrate in vegetarian duplicate diets. Food Chemistry, 81:287-300.
86
Coleman, J.W. 2001. Nitric oxide in immunity and inflammation. International Immunopharmacology, 1:1397-1406.
Connolly, D., Barron, L., and Paull, B. 2002. Determination of urinary thiocyanate and nitrate using fast ion-interaction chromatography. Journal of Chromatography B, 767:175-180.
Cornée, J., Lairon, D., Velema, J., Guyader, M., and Berthezene, P. 1992. An estimate of nitrate, nitrite, and N-nitrosodimethylamine concentrations in French food products or food groups. Sciences Des Aliments, 12:155-197.
Craddock, V.M. 1990. Nitrosamines, food and cancer: Assessment in Lyon. Food and Chemical Toxicology, 28:63-65.
Davies, P.A., and Sano, T. 2001. The difference in gastric cancer between Japan, USA and Europe: what are the facts? what are the suggestions? Critical Reviews in Oncology/Hematology, 40:77-94.
Dejam, A., Hunter, C.J., Schechter, A.N., and Gladwin, M.T. 2004. Emerging role of nitrite in human biology. Blood Cells, Molecules, and Diseases, 32:423-429.
Dennis, M.J., Key, P.E., Papworth, T., Pointer, M., and Massey, R.C. 1990. The determination of nitrate and nitrite in cured meat by HPLC/UV. Food Additives and Contaminants, 7:455-461.
Dionex Corporation. 1998. Determination of nitrate and nitrite in meat using high-performance anion-exchange chromatography. Application Note 112.
Doi, C., Noguchi, Y., Marat, D., Saito, A., Fukuzawa, K., Yoshikawa, T., Tsuburaya, A., and Ito, T. 1999. Expression of nitric oxide synthase in gastric cancer. Cancer Letters, 144:161-167.
Duncan, C., Dougall, H., Johnston, P., Green, S., Brogan, R., Leifert, C., Smith, L., Golden, M., and Benjamin, N. 1995. Chemical generation of nitric oxide in the mouth from the enterosalivary circulation of dietary nitrate. Nature Medicine, 1:546-551.
Duncan, C., Li, H., Dykhuizen, R., Frazer, R., Johnston, P., MacKnight, G., Smith, L., Lamza, K., McKenzie, H., Batt, L., Kelly, D., Golden, M., Benjamin, N., and Leifert, C. 1997. Protection against oral and gastrointestinal diseases: importance of dietary nitrate intake, oral nitrate reduction and enterosalivary nitrate circulation. Comparative Biochemistry and Physiology, 118A:939-948.
Du, S-T., Zhang, Y-S., and Lin, X-Y. 2007. Accumulation of nitrate in vegetables and its possible implications to human health. Agricultural Sciences in China, 6:1246-1255.
Dutt, M.C., Lim, H.Y., and Chew, R.K. 1987. Nitrate consumption and incidence of gastric cancer in Singapore. Food and Chemical Toxicology, 25:515-520.
Dykhuizen, R.S., Frazer, R., Duncan, C., Smith, C., Golden, M., Benjamin, N., Leifert, C. 1996. Antimicrobial effect of acidified nitrite on gut pathogens: importance of dietary nitrate in host defense. Antimicrobial Agents and Chemotherapy, 40:1422-1425.
Dykhuizen, R.S., Fraser, A., McKenzie, H., Golden, M., Leifert, C., and Benjamin, N. 1998. Helicobacter pylori is killed by nitrite under acidic conditions. Gut, 42:334-337.
87
Ellis, G., Adatia, I., Yazdanpanah, M., and Makela, S. K. 1998. Nitrite and nitrate analyses: a clinical biochemistry perspective. Clinical Biochemistry, 31:195-220.
Fan, A.M., and Steinberg, V.E. 1996. Health implications of nitrate and nitrite in drinking water: An update on methemoglobinemia occurrence and reproductive and developmental toxicity. Regulatory Toxicology and Pharmacology, 23:35-43.
Food and Agriculture Organization. 1991. Guidelines for slaughtering, meat cutting and further processing. FAO Animal Production and Health Paper No. 91. FAO of the United Nations, Rome.
Food and Agriculture Organization. 1995. The use of hazard analysis critical control point (HACCP) principles in food control. FAO Food and Nutrition Paper No. 58, FAO of the United Nations, Rome.
Food Standards Australia and New Zealand. (2009). Food Standards Code. Available online: http://www.foodstandards.gov.au
Forde, B.G. 2000. Nitrate transportersin plants: structure, function and regulation. Biochemica et Biophysica Acta, 1465:219-235.
Forman, D., Al-Dabbagh, S., and Doll, R. 1985. Nitrates, nitrites and gastric cancer in Great Britain. Nature, 313:620-625.
Forman, D., and Shuker, D. 1997. Helicobacter pylori and gastric cancer - A case study in molecular epidemiology. Mutation Research/Fundamental and Molecular Mechanisms of Mutagenesis, 379: S159.
Forman, D., and Burley, V.J. 2006. Gastric cancer: global pattern of the disease and an overview of the environmental risk factors. Best Practice and Research Clinical Gastroenterology, 20:633-649.
Fujita, K-I., and Kamataki, T. 2001. Role of human cytochrome P450 (CYP) in the metabolic activation of N-alkylnitrosamines: application of genetically engineered Salmonella typhimurium YG7108 expressing each form of CYP together with human NADPH-cytochrome P450 reductase. Mutation Research, 483:35-41.
Gaiser, M., Rathjen, A., and Spiess, W. E. L. 1996. Nitrate extraction during blanching of spinach. Lebensmittel-Wissenschaft und Technologie (Food Science and Technology), 30:432-435.
Gangolli, S.D., van den Brandt, P., Feron, V.J., Janzowsky, C., Koeman, J.H., Speijers, G.J., Spiegelhalder, B., Walker, R., and Wishnok, J.S. 1994. Nitrate, nitrite and N-nitroso compounds, European Journal of Pharmacology, Environmental Toxicology and Pharmacology Section, 292:1-38.
Gago, B., Lundberg, J.O., Barbosa, R.M., Laranjinha, J. 2007. Red wine-dependent reduction of nitrite to nitric oxide in the stomach. Free Radical Biology and Medicine, 43:1233-1242. Gilliam, M.B., Sherman M.P., Griscavage J.M., Ignarro L.J. 1993. A Spectrophotometric Assay for Nitrate Using NADPH Oxidation by Aspergillus Nitrate Reductase. Analytical Biochemistry, 212:359-365.
88
Gladwin, M.T., Crawford, J.H., and Patel, R. 2004. The biochemistry of nitric oxide, nitrite, and hemoglobin: role in blood flow regulation. Free Radical Biology and Medicine, 36:707-717.
Gonzalez M.J., Valle A.I., Marina M.L. 1994. Determination of nitrate and nitrite anions in natural waters by reversed-phase ion pair liquid chromatography. Microchemical Journal, 50: 1-5. Granger, D.L., Taintor, R.R., Boockvar, K.S., and Hibbs, Jr., J.B. 1995. Determination of nitrate and nitrite in biological samples using bacterial nitrate reductase coupled with the Griess reaction. Methods: A Companion to Methods in Enzymology, 7:78-83.
Grau, M., Hendgen-Cotta, U.B.., Brouzos, P., Drexhage, C., Rassaf, T., Lauer, T., Dejam, A., Kelm, M., and Kleinbongard, P. 2007. Recent methodological advances in the analysis of nitrite in the human circulation: Nitrite as a biochemical parameter of the l-arginine/NO pathway. Journal of Chromatography B, 851:106-123. Grisham, M.B., Johnson, G.G., Gautreaux, M.D. and Berg, R.D. 1995. Measurement of nitrate and nitrite in extracellular fluids: A window to systemic nitric oxide metabolism. Methods: A Comparison to Methods in Enzymology, 7:84-90. Hanai, T. 1999. HPLC A Practical Guide. RSC Chromatography Monographs. Royal Society of Chemistry, United Kingdom. Hansson, L-E., Nyrén, O., Bergström, R., Wolk, A., Lindgren, A., Baron, J., and Adami, H-O. 1994a. Nutrients and gastric cancer risk. A population-based case-control study in Sweden. International Journal of Cancer, 57:638-644.
Hansson, L-E., Baron, J., Nyrén, O., Bergström, R., Wolk, A., and Adami, H-O. 1994b. Tobacco, alcohol and the risk of gastric cancer. A population-based case-control study in Sweden. International Journal of Cancer, 57:26-31.
Helmke, S.M., and Ducan, M.W. 2007. Measurement of the NO metabolites, nitrite and nitrate, in human biological fluids by GC-MS. Journal of Chromatograpy B, 851:83-92.
Hendrix, S.A., and Braman, R.S. 1995. Determination of nitrite and nitrate by vanadium (III) reduction with chemiluminescence detection. Methods: A Companion to Methods in Enzymology, 7:91-97.
Heppner, C., Dorne, J.L., Fabiansson, S., Verger, P., Fuerst, P., Fernandez-Cruz, M.L., Brandy, P.V., Darnerud, P.O., Speijers, G., Addiscot, T., and Cockburn, A. 2008. The first risk benefit assessment of nitrate in vegetables: A European perspective. Toxicology Letter, 180(S1):S65.
Hirose, M., Takahashi, S., Ogawa, K., Futakuchi, M., and Shirai, T. 1999. Phenolics: Blocking agents for heterocyclic amine-induced carcinogenesis. Food and Chemical Toxicology, 37:985-992.
Hoefkens, C., Sioen, I., De Henauw, S., Vandekinderen, I., Baert, K., De Meulenaer, B., Devlieghere, F., and Van Camp, J. 2009. Development of vegetable composition
89
databases based on available data for probabilistic nutrient and contaminant intake assessments. Food Chemistry, 113:799-803. Huarte-Mendicoa, J.C., Astiasarán, I., and Bello, J. 1997. Nitrate and nitrite levels in fresh and frozen broccoli: effect of freezing and cooking. Food Chemistry, 58:39-42.
Hubbar, R.W., Mejia, A., and Horning, M. 1994. The potential of diet to alter disease processes. Nutrition Research, 14:1853-1896. Hunt, J. 1994. A method for measuring nitrite in fresh vegetables. Food Additives and Contaminants, 11:317-325.
Hunt, J., and Turner, M.K. 1994. A survey of nitrite concentrations in retail fresh vegetables. Food Additives and Contaminants, 11:327-332.
Hwang, H., Dwyer, J., and Russell, R.M. 1994. Diet, Helicobacter pylori infection, food preservation and gastric cancer risk: are there new roles for preventative factors? Nutrition Reviews, 52:75-83.
International Agency for Research on Cancer (IARC). 1987. Monographs on the evaluation of carcinogenic risks to humans. Volumes 17, World Health Organization.
Jackson, P.E., Haddad, P.R., and Dilli, S. 1984. Determination of nitrate and nitrite in cured meats using high-performance liquid chromatography. Journal of Chromatography A, 295:471-478.
Jakszyn, P., and Gonzalez, C.A. 2006. Nitrosamine and related food intake and gastric and oesophageal cancer risk: a systematic review of the epidemiological evidence. Carcinogenesis, 27:1497-501.
Jaworska, G. 2005. Nitrates, nitrites, and oxalates in products of spinach and New Zealand spinach: Effect of technological measures and storage time on the level of nitrates, nitrites, and oxalates in frozen and canned products of spinach and New Zealand spinach. Food Chemistry, 93:395-401.
Jimidar, M., Hartmann, C., Cousement, N., and Massart, D.L. 1995. Determination of nitrate and nitrite in vegetables by capillary electrophoresis with indirect detection. 1995. Journal of Chromatography A, 706:479-492. Jobgen, W.S., Jobgen, S.C., Li, H., Meininger, C.J., and Wu, G-Y. 2007. Analysis of nitrite and nitrate in biological samples using high-performance liquid chromatography. Journal of Chromatography B, 851:71-82. Joossens, J.V., Hill, M.J., Elliott, P., Stamler, R., Stamler, J., Lesaffre, E., Dyer, A., Nichols, R., and Kesteloot, H. 1996. Dietary salt, nitrate and stomach cancer mortality in 24 countries. International Journal of Epidemiology, 25:494-504.
Kamataki, T., Nunoya, K-I., Sakai, Y., Kushida, H., and Fujita, K-I. 1999. Genetic polymorphism of CYP2A6 in relation to cancer. Mutation Research, 428:125-130.
Kato, I., Tominaga, S., and Matsumoto, K. 1992. A prospective study of stomach cancer among a rural Japanese population: a 6-year survey. Japanese Journal of Cancer Research, 83:568-575.
90
Kazemzadeh, A., and Ensafi, A.A. 2001. Simultaneous determination of nitrite and nitrate in various samples using flow-injection spectrophotometric detection. Microchemical Journal, 69:159-166.
Knight, T.M., Forman, D., Al-Dabbagh, S.A., and Doll, R. 1987. Estimation of dietary intake of nitrate and nitrate in Great Britain. Food and Chemical Toxicology, 25:277-285. Kozlov, A.V., Staniek, K., and Nohl, H. 1999. Nitrite reductase activity is a novel function of mammalian mitochondria. FEBS Letters, 454:127-130.
Kushida, H., Fujita, K-I., Suzuki, A., Yamada, M., Nohmi, T., and Kamataki, T. 2000. Development of a Salmonella tester strain sensitive to promutagenic N-nitrosamines: expression of recombinant CYP2A6 and human NADPH-cytochrome P450 reductase in S. typhimurium YG7108. Mutation Research, 471:135-143.
Larsson S.C., Bergkvist, L., and Wolk, A. 2006a. Processed meat consumption, dietary nitrosamines and stomach cancer risk in a cohort of Swedish women. World Journal of Gastroenterology, 12:4296-303.
Larsson, S.C., Orsini, N., and Wolk, A. 2006b. Processed meat consumption and stomach cancer risk: a meta-analysis. Public Health Nutrition, 9:449-64.
Lee, J-K., Park, B-J., Yoo, K-Y., and Ahn, Y-O. 1995. Dietary factors and stomach cancer: a case-control study in Korea. International Journal of Epidemiology, 24:33-41.
Li, H., Meininger, C.J., and Wu, G. 2000. Rapid determination of nitrite by reversed-phase high-performance liquid chromatography with fluorescence detection. Journal of Chromatography B, 746:199-207.
Lichon, M. J. 1996. ‘Sample preparation’ in Handbook of Food Analysis: Physical Characterization and Nutrient Analysis, vol. 1. ed L. M. L. Nollet, Marcel Dekker Inc., New York.
Linseisen, J., Rohrmann, S., Norat, T. Gonzalez, C.A., Dorronsoro, I.M., Skeie, G., Slimani, N., and Riboli, E. 2006. Dietary intake of different types and characteristics of processed meat which might be associated with cancer risk-results from the 24-hour diet recalls in the European Prospective Investigation into Cancer and Nutrition (EPIC). International Journal of Cancer, 119:915-9.
Lundberg, J.O., and Govoni, M. 2004. Inorganic nitrate is a possible source for systemic generation of nitric oxide. Free Radical Biology and Medicine, 37:395-400.
Lundberg, J.O., Feelisch, M., Björne, H., Jansson, E.Å., and Weitzberg. 2006. Cardioprotective effects of vegetables: Is nitrate the answer? Nitric Oxide, 15:359-362.
Marques-Vidal, P., Ravasco, P., and Camillo, M.E. 2006. Foodstuffs and colorectal cancer risks: A review. Clinical Nutrition, 25:14-36.
Marshall, P.A., and Trenerry, V.C. 1996. The determination of nitrite and nitrate in foods by capillary ion electrophoresis. Food Chemistry, 57:339-345.

91
Marzinzig, M., Nussler, A.K., Stadler, J., Marzinzig, E., Barthlen, W., Nussler, N.C., Beger, H.G., Morris, Jr., S.M., and Brückner, U.B. 1997. Improved methods to measure end products of nitric oxide in biological fluids: Nitrite, nitrate, and S-nitrosothiols. Nitric Oxide: Biology and Chemistry, 1:177-189.
Massey, R.C. 1991. ‘Methods for the analysis of nitrate and nitrite in food and water’ in Nitrates and Nitrites in Food and Water, ed M. Hill. Ellis Horwood, New York.
Massey, R.C. 1997. Estimation of daily intake of food preservatives. Food Chemistry, 60:177-185.
Di Matteo, V., and Esposito, E. 1997. Methods for the determination of nitrite by high-performance liquid chromatography with electrochemical detection. Journal of Chromatography A, 789:213-219.
McKnight, G.M., Smith, L.M., Drummond, R.S., Duncan, C.W., Golden, M., and Benjamin, N. 1997. Chemical synthesis of nitric oxide in the stomach from dietary nitrate in man. Gut, 40:211-214.
Meah, M.N., Harrison, N., and Davies, A. 1994. Nitrate and nitrite in foods and the diet. Food Additives and Contaminants, 11:519-532.
Melanson, J.E., and Lucy, C.A. 2000. Ultra-rapid analysis of nitrate and nitrite by capillary electrophoresis. Journal of Chromatography A, 884:311-316.
Miranda, K.M., Espey, M.G., and Wink, D.A. 2001. A rapid, simple spectrophotometric method for simultaneous detection of nitrate and nitrite. Nitric Oxide: Biology and Chemistry, 5:62-71.
Mirvish, S.S. 1995. Role of N-nitroso compounds (NOC) and N-nitrosation in etiology of gastric, esophageal, nasopharyngeal and bladder cancer and contribution to cancer of known exposures to NOC. Cancer Letter, 93:17-48.
Mitsui, T., and Kondo, T. 2002. Assessing nitrate metabolism in the intestinal tract by measuring breath nitric oxide and nitrous oxide, and its clinical significance. Clinica Chimica Acta, 319:57-62.
Mowat, C., and McColl, K.E. 2001. Alternations in intragastric nitrite and vitamin C levels during acid inhibitory therapy. Best Practice and Research Clinical Gastroenterology, 15:523-537.
National Academy of Sciences. 1981. The Health Effects of Nitrate, Nitrite and N-Nitroso Compounds. National Academy Press, Washington.
Nollet, L.M.L. 1996. ‘Handbook of Food Analysis:physical characterization and nutrient analysis.
Ohkawa, S., Ohishi, K., Yoneyama, T., Hishida, A., and Kumagai, H. 1998. The effect of eliminating interfering substances by solid-phase extraction and sample-pH adjustment in the colorimetric assay of urinary nitrite and nitrate. Analytical Biochemistry, 258:379-381.
92
Olesen, P.T., Meyer, A.S., Stahnke, L.H. 2004. Generation of flavour compounds in fermented sausages-the influence of curing ingredients, Staphylococcus starter culture and ripening time. Meat Science, 66:675-687.
Ologhobo, A.D., Adegede, H.I., and Maduagiwu, E.N. 1996. Occurrence of nitrate, nitrite and volatile nitrosamines in certain feedstuffs and animal products. Nutrition and Health, 11:109-114.
Öztekin, N., Nutku, M.S., and Erim, F.B. 2002. Simultaneous determination of nitrite and nitrate in meat products and vegetables by capillary electrophoresis. Food Chemistry, 76:103-106.
Pannala, A., Mani, A.R., Spencer, J.P.E., Skinner, V., Bruckdorfer, K.R., Moore, K.P., and Rice-Evans, C.A. 2003. The effect of dietary nitrate on salivary, plasma, and urinary nitrate metabolism in humans. Free Radical Biology and Medicine, 34:576-584.
Pearson, A.M., and Gillett, T.A. 1996. Processed Meats, 3rd Edition. Chapman and Hall, New York.
Pegg, R.B., and Shahidi, F. 1996. A novel titration methodology for elucidation of the structure of preformed cooked cured-meat pigment by visible spectroscopy. Food Chemistry, 56:105-110. Pennington, J.A. 1998. Dietary exposure models for nitrates and nitrites. Food Control, 9:389-395.
Pérez-Rodríguez, M.L., Bosch-Bosch, N., and Garciá-Mata, M. 1996. Monitoring nitrite and nitrate residues in frankfurters during processing and storage. Meat Science, 44:65-73.
Pham, H.N., Benitez, A., Hommet, F., Bombe, D., Schoefs, O., and Pauss, A. 2008. A new quantitative and low-cost determination method of nitrate in vegetables, based on deconvolution of UV spectra. Talanta, 76:936-940.
Prasad, S., and Chetty, A.A. 2008. Nitrate-N determination in leafy vegetables: study of the effects of cooking and freezing. Food Chemistry, 106:772-780.
Rajnakova, A., Moochhala, S., Goh, P.M.Y., and Ngoi, S.-S. 2001. Expression of nitric oxide synthase, cyclooxygenase, and p53 in different stages of human gastric cancer. Cancer Letters, 172:177-185.
Reece, P., and Hird, H. 2000. Modification of the ion exchange HPLC procedure for the detection of nitrate and nitrite in dairy products. Food Additives and Contaminants, 17:219-222.
Rieder, G., Hofmann, J.A., Hatz, R.A., Stolte, M., and Enders, G.A. 2003. Up-regulation of inducible nitric oxide synthase in Helicobacter pylori-associated gastritis may represent an increased risk factor to develop gastric carcinoma of the intestinal type. International Journal of Medical Microbiology, 293:403-412.
del Río, L.A., Corpas, F.J., and Barroso, J.B. 2004. Nitric oxide and nitric oxide synthase activity in plants. Phytochemistry, 65:783-792.

93
Rincón, F., Martínez, B., and Delgado, J.M. 2003. Detection of factors influencing nitrite determination in meat. Meat Science, 65:1421-1427. Reinik, M., Tamme, T., Roasto, M., Juhkam, K., Jurtšenko, S., Tenńo, T., and Kiis, A. 2005. Nitrites, nitrates and N-nitrosamines in Estonian cured meat products: Intake by Estonia children and adolescents. Food Additives and Contaminants, 22:1098-1105.
Risch, H.A., Jain, M., Choi, N.W., Fodor, J.G., Pfeiffer, C.J., Howe, G.R., Harrison, L.W., Craib, K.J., and Miller, A.B. 1985. Dietary factors and the incidence of cancer of the stomach. American Journal of Epidemiology, 122:947-959.
Ruddell, W.S.J., Bone, E.S., Hill, M. J., Blendis, L.M., and Walters, C.L. 1976. Gastric-juice nitrite: A risk factor for cancer in the hypochlorhydric stomach? The Lancet, 308:1037-1039. Sanz, Y., Vila, R., Toldra, F., and Flores, J. 1998. Effect of nitrate and nitrite curing salt on microbial changes and sensory quality of non-fermented sausages. International Journal of Food Microbiology, 42:213-217.
Sebranek, J.G., and Bacus, J.N. 2007. Cured meat products without direct addition of nitrate or nitrite: what are the issues? Meat Science, 77:136-147.
Seel, D.J., Kawabata, T., Nakamura, M., Ishibashi, T., Hamano, M., Mashimo, M., Shin, S.H., Sakamoto, K., Jhee, E.C., and Watanabe, S. 1994. N-nitroso compounds in two nitrosated food products in southwest Korea. Food and Chemical Toxicology, 32:1117-1123.
Shafiur Rahman, M. 1999. “Chapter 14: Nitrites in Food Preservation”. In, Handbook of Food Preservation, ed. M. Shafiur Rahman. Marcel Dekker, Inc. New York.
Shapiro, K.B., and Hotchkiss, J.H. 1996. Induction of nitric oxide synthesis in murine macrophages by Helicobacter pylori. Cancer Letters, 102:49-56.
Shank, R.C. 1975. Toxicology of N-nitroso compounds. Toxicology and Applied Pharmacology, 31:361-368. Shephard, S.E., Schlatter, C., and Lutz, W.K. 1987. Assessment of the risk of formation of carcinogenic N-nitroso compounds from dietary precursors in the stomach. Food and Chemical Toxicology, 25:91-108. Shiotani, A., Iishi, H., Kumamoto, M., and Nakae, Y. 2004. Helicobacter pylori infection and increased nitrite synthesis in the stomach. Digestive and Liver Disease, 36:327-332.
Siu, D.C., and Henshall, A. 1998. Ion chromatography determination of nitrate and nitrite in meat products. Journal of Chromatography A, 804:157-160.
Skrökki, A. 1995. Additives in Finnish sausages and other meat products. Meat Science, 39:311-315. Skrypec, D.J., Gray, J.I., Mandagere, A.K., Booren, A.M., Pearson, A.M., and Cuppett, S.L. 1985. Effect of bacon composition and processing on N-nitrosamine formation. Food Technology, 39:74-79.
94
Stalikas, C.D., Konidari, C.N., and Nanos, C.G. 2003. Ion chromatographic method for the simultaneous determination of nitrite and nitrate by post-column indirect fluorescence detection. Journal of Chromatography A, 1002:237-241.
Sydney Water. 2007. Sydney water quality monitorting program, Typical drinking water analysis. Available online at www.sydneywater.com.au Torró, I.G., García Mateo, J.V., and Martínez Calatayud, J. 1998. Flow-injection biamperometric determination of nitrate (by photoreduction) and nitrite with the NO2
-/I- reaction. Analytica Chimica Acta, 366:241-249.
Tricker, A.R., and Preussmann, R. 1991. Carcinogenic N-nitrosamines in the diet: occurrence, formation, mechanisms and carcinogenic potential. Mutation Research/Genetic Toxicology, 259:277-289. Tricker, A.R., and Kubacki, S.J. 1992. Review of the occurrence and formation of non-volatile N-nitroso compounds in foods. Food Additives and Contaminants, 9:39-69.
Tsikas, D. 2005. Methods of quantitative analysis of the nitric oxide metabolites nitrite and nitrate in human biological fluids. Free Radical Research, 39:797-815. Tsikas, D., Gutzki, F-H., and Stichtenoth, D.O. 2006. Circulating and excretory nitrite and nitrate as indicators of nitroc oxide synthesis in humans: methods of analysis. European Journal of Clinical Pharmacology, 62:51-59. Tsikas, D. 2007. Analysis of nitrite and nitrate in biological fluids by assays based on the Griess reaction: Appraisal of the Griess reaction in the L-arginine/nitric oxide area of research. Journal of Chromatography B, 851:51-70. Usher, C.D., and Telling, G.M. 1975. Analysis of nitrates and nitrite in foodstuffs: A critical review. Journal of the Science of Food and Agriculture, 2:1793-1805.
Velasco-Arjona, A., García-Garrido, J.A., Quiles-Zafra, R., and Luque de Castro, M.D. 1998. Full automated robotic method for the determination of chloride, nitrite and nitrate in cured meat products. Talanta, 46:969-976.
van Velzen, A.G., Sips, A.J., Schothorst, R.C., Lambers, A.C., and Meulenbelt, J. 2008. The oral bioavailability of nitrate from nitrate-rich vegetables in human. Toxicology Letters, 181:177-181.
van Vliet, J.J., Vaessen, H.A., van de Burg, G., and Schothorst, R.C. 1997. Twenty-four-hour duplicate diet study 1994; nitrate and nitrite: method development and intake per person per day. Cancer Letters, 114:305-307.
Vetrovsky, P., Stoclet, J-C., and Entlicher, G. 1996. Possible mechanism of nitric oxide production from NG-hydroxy-L-arginine or hydroxylamine by superoxide ion. International Journal of Biochemistry and Cell Biology, 28:1311-1318.
Walters, C.L. 1980. The exposure of humans to nitrite. Oncology, 37:289-296.
Wang, G.F., Horita, K., Satake, M. 1998. Simultaneous spectrophotometric determination of nitrate and nitrite in water and some vegetable samples by column preconcentration. Microchemical Journal, 58:162-174.

95
Wardencki, W., Curylo, J., and Namiesnik, J. 2007. Trends in solventless sample preparation techiniques for environmental analysis. Journal of Biochemical and Biophysical Methods, 70:275-288. Weisburger, J.H. 1981. ‘N-nitroso compounds: diet and cancer trends’, in N-nitroso Compounds. eds. R.A. Scanlan and S.R. Tannenbaum. American Chemical Society Symposium Series 174, United States. Wennmalm, A., Benthin, G., Edlund, A, Jungersten, L., Kieler-Jensen, N., Lundin, S., Westfelt, U.N., Petersson, A.S., and Waagstein, F. 1993. Metabolism and excretion of nitric oxide in humans. An experimental and clinical study. Journal of the American Heart Association, 73:1121-1127. White Jr., J.W. 1975. Relative significance of dietary sources of nitrate and nitrite. Journal of Agricultural and Food Chemistry, 23:886-891.
Wogan, G.N., and Tannenbaum, S.R. 1975. Environmental N-nitroso compounds: Implications for public health. Toxicology and Applied Pharmacology, 31:375-383. Wootton, M., Kok, S.H., and Buckle, K.A. 1985. Determination of nitrite and nitrate levels in meat and vegetable products by high performance liquid chromatography. Journal of the Science of Food and Agriculture, 36:297-304.
World Health Organization 1973. Toxicological evaluation of certain food additives with a review of general principles and of specifications. 17th Report of the Joint FAO/WHO Expert Committee on Food Additives. FAO Nutrition Report Series No. 53 (Geneva: WHO).
Ximenes, M.I.N., Rath, S., and Reyes, F.G.R. 2000. Polarographic determination of nitrate in vegetables. Talanta, 51:49-56. Xu, J., Xu, X., and Verstraete, W. 2000. Adaptation of E. coli cell method for micro-scale nitrate measurement wit the Griess reaction in culture media. Journal of Microbiological Methods, 41:23-33.
Yamasaki, H., and Sakihama, Y. 2000. Simultaneous production of nitric oxide and peroxynitrite by plant nitrate reductase: in vitro evidence for the NR-dependent formation of active nitrogen species. FEBS Letter, 468:89-92. Yue, X-F., Zhang, Z-Q, and Yan, H-T. 2004. Flow injection catalytic spectrophotometric simultaneous determination of nitrite and nitrate. Talanta, 62:97-101.
Zanardi, E., Dazzi, G., Madarena, G., and Chizzolini, R. 2002. Comparative study on nitrite and nitrate ions determination. Ann. Fac. Medic. Vet. Di Parma, 22:79-86.
Zatar, N.A., Abu-Eid, M.A., and Eid, A.F. 1999. Spectrophotometric determination of nitrite and nitrate using phosphomolybdenum blue complex. Talanta, 50:819-826.

96
Chapter 3
N-nitroso compounds and nitrosation inhibitors
Literature review on N-nitroso compounds including nitrosamines and nitrosamides
will be presented, followed by their nitrosation promoters, inhibitors and their
interactions.
3.1 Dietary sources of N-nitroso compounds
NOCs are almost exclusively found in foods and beverages containing nitrite such as
cured meat or those that have been exposed to nitrogen oxides for example beer. In the
cured meat group, bacon has the highest NOC content of NDMA ranging from 10 to
100 µg/kg when cooked, which corresponds to a dietary intake of approximately 1 µg
of NDMA per 100 g portion. In beer, the NDMA can range from 5 to 70 µg/L and is
higher in German beer varieties (Lijinsky, 1999).
There are several hundred NOCs that exist; however, only a few are encountered by
humans outside the laboratory mainly in food, industrial plants and the environment.
Nitrosamines are the most common occurring NOC encountered, which are stable and
not directly acting. Nitrosamines on the whole were shown to induce tumors in a
variety of organs including liver, lung, kidney, bladder pancreas, esophagus and tongue
in animal experiments. In contrast, nitrosamides are unstable and direct acting; for
examples alkylnitrosoureas and alkylnitrosocarbamates, and can induce tumors of the
nervous system, stomach, GIT and bone in animals (Lijinsky, 1999).
3.2 N-nitroso compounds
NOCs are carcinogens formed in food or in the digestive tract of mammals. They are
carcinogenic because they form potent electrophilic alkylating agents. The electrophiles
will then react with DNA of target tissue and alter the bases thus initiating the start of
carcinogenesis (Archer, 1989). There are approximately 21 identified NOCs in foods
and beverages. Non-volatile nitrosamines, such as N-nitrosoproline and N-
nitrosothiazolidine-4-carboxylic acid, account for almost half of them (Tricker and
Kubacki, 1992).
97
NOCs are powerful carcinogens and were demonstrated to induce tumours in numerous
organs of all tested animal species (Gangolli et al., 1994), and can be divided into three
broad groups which are: 1) N-nitrosamines derived from secondary amines containing
dialkyl, alkylaryl and diaryl substituents, 2) N-nitrosamides derived from N-alkylureas,
N-alkylcarbamates or cyanamides, and 3) simple N-alkylamides (Tricker and Kubacki,
1992). However, more recently, Pourazrang et al. (2002) had categorized NOCs into
six categories, which are: 1) volatile N-nitrosamine, 2) non-volatile N-nitrosamine, 3)
N-nitrosamide, 4) N-nitrosated glycosylamines and amadori compounds, 5) N-
nitrosated heterocyclic carboxylic acids, and 6) products formed when amino sugar
reacted with nitrite. Figure 3 listed the names and formulae of NOC precursors. Since
nitrosation reactions occur via diaotization and nucleophilic replacement of the amino
group, primary amines are generally not considered as precursors of N-nitrosamines
(Tricker and Kubacki, 1992).
Shephard et al. (1987) grouped dietary precursors (Figure 2.1) of NOCs in classes
depending on its probability of endogenous nitrosation. They concluded that ureas,
aromatic amines were potentially important risk factors in gastric cancer. On the other
hand, amides guanidines, and primary amino acids had uncertain risk status. Finally,
alkylamines and secondary amino acids probably had a negligible role in gastric
cancer.
Nitrosation reactions can be inhibited by redox compounds such as ascorbate and
vitamin E, or accelerated by catalysts such as metal ions, carbonyl compounds and
nucelophilic anions including chlorine and iodine (Tricker and Preussmann, 1991).
Tricker and Preussmann (1991) had grouped foods that are most commonly
contaminated with NOCs into six broad groups, and these are: 1) foods preserved with
either nitrate and/or nitrite that act as nitrosating agents, 2) foods such as fish and meat
preserved by smoking which generates nitrogen oxide that can participate in
nitrosation, 3) foods subjected to drying by combustion gases, again includes nitrogen
oxide, which include foods such as malt in beer production and other dried products, 4)
foods preserved by pickling or salting especially plant-based foods in which microbial
reduction occurs, 5) foods that are stored under humid conditions and are therefore
susceptible to fungal metabolites from Fusarium species that can produce nitrosamines
98
(Tricker and Kubacki, 1992), and finally 6) food packaging materials that are in contact
with the food and allows the migration and formation of nitrosamines.
3.2.1 N-nitrosamines
Nitrosamines as a class are potent carcinogens. However, the specific action and hence
potency depends on numerous factors including its structure (Figure 2.2), frequency
and route of administration, species, strain and other variables (Weisburger, 1981). N-
nitrosamines are stable at neutral pH and require metabolic activation by mammalian
enzyme systems before they can exert any mutagenic effects (Shank, 1975), whereas
nitrosamides are direct acting alkylating agents (Gangolli et al., 1994). Thus
nitrosamines can produce tumours in tissues remote from the site of administration
(Archer, 1989). For example, the conversion of nitrates to nitrites in the oral cavities
followed by the formation of nitrosamine in the stomach under acidic pH.
The proposed mechanisms by which bacteria contribute to the formation of NOCs both
in vitro and in vivo include: 1) decrease pH of the system, 2) reduction of nitrate to
nitrite, 3) adsorption of amine onto cell surface or cytoplasm membrane and 4)
enzymatic transformation (Ralt and Tannenbaum, 1981). Creating an acidic
environment that catalyses the formation of nitrosamines. However, nitrosation is
possible above neutral pH in the presence of micro-organisms, thiocyanate, metals,
phenol and other nitroso compounds, which acts as catalysts (Ralt and Tannenbaum,
1981). The reduction of nitrate to nitrite and amine adsorption increases the formation
of nitrosamine of the two essential component of nitrosamine synthesis pathway.
Direct enzymatic conversion of nitrite to nitrosamine is also possible. Examples of
NOCs and their associated food product and the relative carcinogenicity for each
common nitrosamine found in food are listed in Figure 3.1.

99
Figure 3.1 Nitrosamines found in foods and their averaged concentration. Foods high in
nitrosamines mostly belongs to the cured meat and fermented fish group, with N-
nitrosodimethylamine, diethylamine and methylbenzylamine being the most
carcinogenic (Lijinsky, 1999).
The optimal pH for nitrosamine formation is at 3.4, which is the pKa for nitrous acid.
However, other factors have been identified that interferes with this reaction. For
example, not all nitrosatable substances follow the same kinetic pattern and that
nitrosation are multi-step processes. A number of chemical compounds can also inhibit,
slow down or accelerate the reaction. In addition, foods and stomach contents are non-
homogenous thus partitioning of reactants between phases may pose further changes in
the rate of nitrosamine formation (Wogan and Tannenbaum, 1975).
Evidence suggests that volatile N-nitrosamines are rapidly absorbed from the
duodenum, which is subsequently carried by the portal circulation to the liver
(Hashimoto et al., 1976, in Gangolli et al., 1994), possibly for breaking down N-
nitrosamines to less toxic forms.
N-nitrosamines can be measured in human blood, urine and fecal matter after the
consumption of nitrite or nitrate containing foods such as bacon and spinach, which
demonstrated the in vivo production of NOCs in humans (Wagner and Tannenbaum,
1985).
Most drugs are known to cross the placenta but recently it was demonstrated that food
mutagen such as NDMA can also cross the placenta from maternal to fetal circulation
(Annola et al., 2007). The implication of this finding is enormous since it may involve
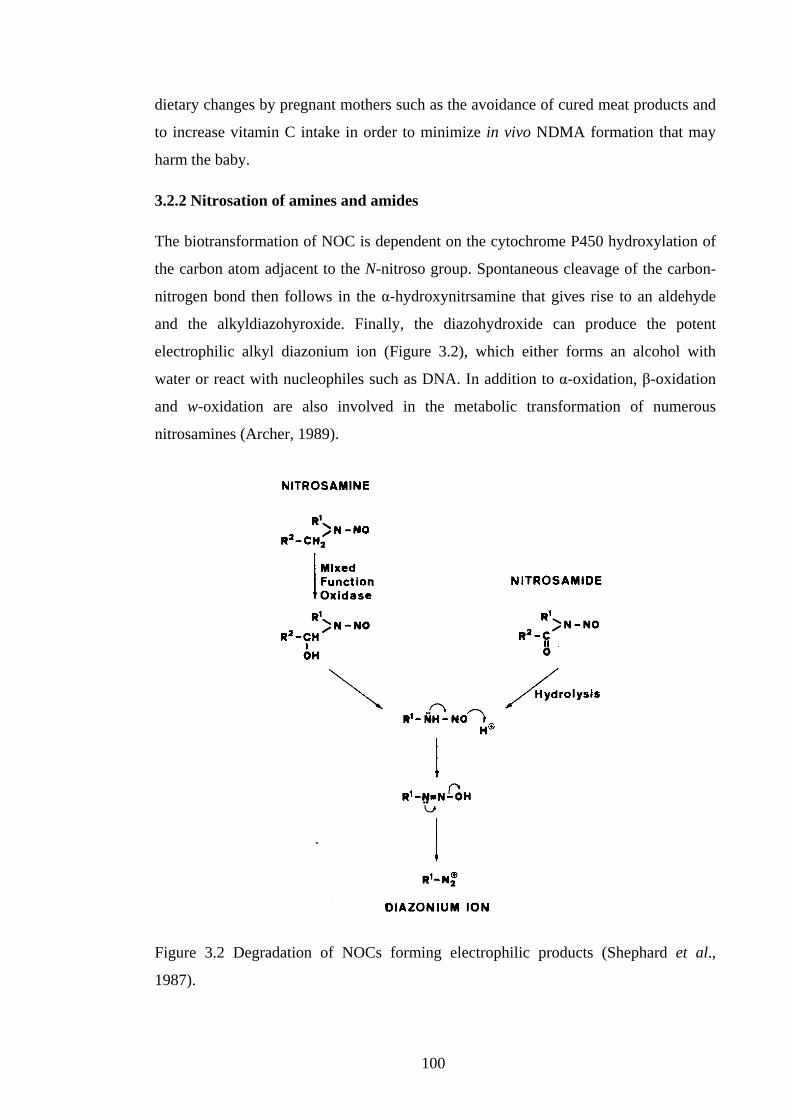
100
dietary changes by pregnant mothers such as the avoidance of cured meat products and
to increase vitamin C intake in order to minimize in vivo NDMA formation that may
harm the baby.
3.2.2 Nitrosation of amines and amides
The biotransformation of NOC is dependent on the cytochrome P450 hydroxylation of
the carbon atom adjacent to the N-nitroso group. Spontaneous cleavage of the carbon-
nitrogen bond then follows in the α-hydroxynitrsamine that gives rise to an aldehyde
and the alkyldiazohyroxide. Finally, the diazohydroxide can produce the potent
electrophilic alkyl diazonium ion (Figure 3.2), which either forms an alcohol with
water or react with nucleophiles such as DNA. In addition to α-oxidation, β-oxidation
and w-oxidation are also involved in the metabolic transformation of numerous
nitrosamines (Archer, 1989).
Figure 3.2 Degradation of NOCs forming electrophilic products (Shephard et al.,
1987).

101
The nitrosation of amines is based on a nucleophilic substitution reaction (Figure 3.3a),
whereby the electron-rich amine nitrogen interacts with the nitrogen of nitrous
anhydride, which replaces the nitrite group, causing the latter to separate. The reactants
formed are the unprotonated amine, R1R2NH, and two molecules of nitrous acid. Thus
the limiting step for determining the rate of amine nitrosation involves the acid-base
equilibria of both amine and nitrous acid (Shephard et al., 1987).
Amide nitrosation involves nucleophilic attack of the nitrogen on protonated nitrous
acid, with water acting as the leaving group (Figure 3.3b). Unlike amine nitrosation, the
nitrosation of amide is first order reaction with respect to nitrous acid, thus the latter is
less sensitive to the concentration of nitrite in the stomach. Amide nitrogen is much
less basic than an amine, and is usually unprotonated at acid pH. Thus amide
nitrosation is dependent only on the nitrous acid-nitrite equilibrium, where decreasing
pH lead to increasing reaction rate (Shephard et al., 1987).
Figure 3.3 Mechanisms of nitrosation of a) amines and b) amides (Shephard et al.,
1987).
102
Gerbaux et al. (2004) demonstrated that nitrosation occurs through the actions of
nitrosonium cation (NO+) carriers such as nitrosothiols or nitrosamines under
physiological pH. It was also shown that peroxynitrite can nitrosate phenol by a CO2-
dependent pathway, and that nucleophiles such as amines and thiols with pKa values
between 7 and 9 could be nitrosated at physiological pH (Uppu et al., 1998). In
addition, certain drugs contain secondary and tertiary amines that may contribute to the
overall burden of nitrosating agents (Mirvish et al., 1972).
Oxygenated nitrogen species including protonated nitrous acid, dinitrogentrioxide,
dinitrogentetroxide and peroxynitrite can react with amines to form molecular nitrogen
in a spontaneous reaction with primary amines or via cytochrome P450 catalysed
reaction with secondary amines. In addition, secondary amines can be nitrosated by
either nitrite or NO. Thus the quantification of molecular nitrogen can provide an
indirect estimate of the level of oxygenated nitrogen species acting as nitrosating
agents. Molecular nitrogen production is thought to play a protective role-taking place
mainly in the gastrointestinal tract to control the body’s NO and nitrite levels (Junghans
et al., 1999).
It was suggested that carbon dioxide reacts with dimethylamine, which is a precursor to
NDMA, then reacts with nitrite anion to form NDMA. Hence carbon dioxide appears to
be a catalyst to promote the formation of a common volatile nitrosamine (Lv et al.,
2006).
3.3 Estimated dietary nitrosamine intake
The largest known source of human exposure to exogenous nitrosamines is not foods
but the environment such as in the workplace. However, some food and beverage can
contain greater than 10 µg/kg of NDMA (Biaudet et al., 1994).
Yamamoto et al., (1984) estimated the average daily intake of endogenous volatile
nitrosamines in Japanese population was 0.5 µg per person and 88 % of it came from
fish products, which were significant part of their diet. The estimation was based on
food consumption data and their analysis of volatile nitrosamine content of commonly
eaten food including fresh fish, fish products, meat, cheese, and beer. NDMA was the
most common occurring volatile nitrosamine in Chinese foods with up to 6 µg/kg in

103
beer, up to 7.4 µg/kg in meat products, and up to 131.5 µg/kg in some seafood. Other
volatile nitrosamines detected were NDEA, NPIP and NPYR (Song and Hu, 1988).
Österdahl (1988) estimated the average dietary intake of volatile nitrosamines in
Sweden populations was 0.29 μg per person, and over 80 % of that came from meat
and malt products, which was highest in fried bacon and pork. Beer and other malt
beverages contributed 14 % of the dietary intake of volatile N-nitrosamines in Sweden,
with dried products, cheese and smoked with represent 7 %. Österdahl (1988) reported
that NDMA was the most common volatile N-nitrosamine in foods such as cocoa and
chocolate products (up to1.2 μg /kg), tea (up to1.2 μg /kg), coffee (0.1-0.8 μg /kg), and
cereal products (0.2-0.9 μg /kg). In West Germany, Tricker et al. (1991) estimated the
total volatile nitrosamine intake from food for men and women were 0.3 and 0.2
μg/day, respectively. Furthermore, 31 % of the daily intake of NDMA for men came
from the consumption of beer, thus represented a significant source of dietary volatile
nitrosamine.
In West Germany, the mean daily intake of volatile nitrosamines between 1989 and
1990 were: 0.28 and 0.17 µg NDMA/day for men and women, respectively. A third of
the dietary NDMA for men resulted from the consumption of beer. For NPYR and
NPIP, the averaged daily intake for both men and women was the same at 0.011 and
0.015 µg NPYR and NPIP/day, respectively (Tricker et al., 1991).
The NDMA range found in sausage products was 0.5 to 1.8 µg/kg with a mean of 0.84
µg/kg, and for bacon and ham it ranged from 0.5 to 1.6 µg/kg with a mean of 1.01
µg/kg. NDMA was highest in fresh fish and fish products with a range of 0.5 to 8.0
µg/kg and a mean of 2.18 µg/kg. Despite this, meat and meat products contributed
more than double the daily dietary intake of NDMA for both men and women
compared to fish products. There was no detectable NDMA in fresh vegetables and
only negligible levels were found in preserved vegetables. Other volatile nitrosamines
including NPIP and NPYR were not present in vegetables and only negligible levels
were found in sausage products (Tricker et al., 1991).
Tricker et al. (1991) compiled the mean daily dietary intake of NDMA from different
countries ranged from 0.08 to 1.10 µg/day with a mean of 0.5 µg/day based on
published dietary surveys between 1978 and 1990. It was concluded that beer, cured
meat and fish products contributed to most of their dietary NDMA intake.
104
The mean daily intake of NDMA from French foods and beverages between 1987 and
1992 was 0.19µg/day, and one-third of this came from the consumption of alcoholic
beverages. Vegetables represented 22 % of NDMA intake followed by meat and meat
products at 12.5 % (Biaudet et al., 1994).
Mitacek et al. (1999) concluded that based on case-control studies in Thai population
that exposure to exogenous and possible endogenous nitrosamines in food or tobacco
may contribute to the development of liver cancer. With over 1800 food samples tested,
relatively high levels of NDMA, NPIP and NPYR were detected in traditional Thai
foods such as fermented, salted and dried fish. Levels of these volatile nitrosamines
ranged from trace amount to 146 µg/kg.
Mavelle et al. (1991) measured NDMA in French food in 1987-88 and found that 89 %
of samples tested contained NDMA with a maximum level of 16 µg/kg. Stone fruit
spirits were shown to contain the highest level of NDMA followed by nitrite-cured
meats, smoked meats and smoked fishes. Beer contained a mean NDMA level of 0.28
µg/kg, which was lower than in the past due to modification of the brewing processes.
Other volatile nitrosamines found were rare and was below 0.5 µg/kg.
N-nitrosamines in food and beverages are the result of the manufacturing processes
such as smoking, curing and so on. Therefore changes or modification of these
processes should eliminate or at least minimize their presence in food (Mavelle et al.,
1991).
3.4 Epidemiology of cancer risks
It was demonstrated that NOC concentration and stomach pH increased significantly
with age, and there was a positive correlation between pH and NOCs concentration,
and between pH and an increase concentration of nitrites. In addition, it was
demonstrated that the population of nitrate reductase-positive microorganisms rose as
NOCs and nitrite levels increased (Reed et al., 1981). The rise in gastric pH with age
maybe due to decreased gastric acid secretion as a result of natural aging process. This
rise in pH then allows microorganisms to survive in the stomach-converting nitrate
present in the stomach to nitrite. Since nitrite is more stable at higher pH, this may
allow more nitrosation to occur thus resulting in higher N-nitrosamine levels with
increasing age.

105
N-nitrosamine levels ranged from 0.01 to 40 µmol/L in healthy volunteers and patients
aged between 18 and 87 years. A significant rise in N-nitrosamine concentrations and
gastric pH was demonstrated with increasing age. Furthermore, N-nitrosamine levels
were significantly higher in males than females, taking other factors into account.
Cigarette smoking had no significant effect on either N-nitrosamine or nitrite
concentrations (Reed et al., 1981).
Case-control study of colorectal cancer in the United States shown that higher exposure
to heterocyclic amines was strongly associated with colorectal cancer risk taking into
account of meat consumption and cooking method (Nowell et al., 2002).
3.5 N-nitrosation inhibitors
3.5.1 Ascorbic acid
Ascorbic acid can prevent nitrosation by converting nitrite precursors to NO (Figure
3.4) thus preventing or at least reducing the formation of NOCs including nitrosamine
(Hwang et al., 1994). Hence a strong negative association between vitamin C
supplementation and gastric cancer support the protective role of ascorbic acid
(Hansson et al. 1994).
Ascorbate and erythorbate are added in cured meat to inhibit formation of nitrosamines
(Cassens, 1995), as well as inhibiting nitrosation from occurring within the stomach
from residual nitrite (Walters, 1980). In the United States, reducers such as ascorbate or
erythrobates are often added in cured meat to promote the reduction of nitrous acid to
nitric acid, which reduces residual nitrite and retards the formation of N-nitrosamines
(Pennington, 1998). The maximum addition of ascorbate in the United States was 550
mg/kg, of which 40 % or 209 mg/kg was detected in cured meat samples (Cassens,
1997). Thus the inhibitory effect of ascorbic acid against nitrosation reactions is well
recognized.

106
Figure 3.4 Reaction of ascorbic acid with nitrite where nitrite is reduced to NO and
ascorbic acid is oxidized to dehydroascorbic acid. The latter competes with amines for
nitrosating species such as N2O3 (National Academy of Sciences, 1981).
Contrary to other findings, Risch et al. (1985) found that vitamin C intake was only
slightly protective against gastric cancer, and that vitamin E had not effects at all.
Similarly, Kato et al. (1992) revealed an adverse effect of fruit consumption, which
may be due to the lack of detailed information on the types of fruits consumed in the
rural Japanese population surveyed.
The addition of ascorbic acid at a concentration of 2,000 mg/kg to cured meat did not
reduce the antimicrobial effect of sodium nitrite (Walters, 1980). However, 500 mg/kg
ascorbic acid was shown to be more efficient at reducing the mutagenicity of NOC by
61 % than at 2,000 mg/kg ascorbic acid at only 54 % (Pourazrang et al., 2002).
Since the discovery in 1956 that NOC are carcinogenic to more than 40 animal species,
human exposure to NOCs has been related to increased risk of gastro-intestinal cancers.
The endogenous nitrosation increases when precursors are ingested in foods, which
commonly contains these precursors. Under acidic conditions such as the stomach,
nitrite can react with secondary amines to form N-nitrosamines. Ascorbic acid and
ascorbate can inhibit nitrosation because they react faster than the amine with the
nitrosating agents. AA can reduce nitrous acid to nitric oxide that is not a nitrosating
agent, and is itself oxidized to dehydroascorbic acid. Whole strawberries, garlic juice or
kale juice decreased NDMA formation in humans fed an amine-rich diet with nitrate by
70, 71 and 44 %, respectively. Increased dietary nitrate intake also significantly
increased salivary and urinary nitrate. It was suggested that phenolic compounds
derived from plants and fruits are potent nitrosation inhibitors. In addition, strawberries
contain the highest vitamin C amongst fruits at 99 mg/100g. Cysteine and other
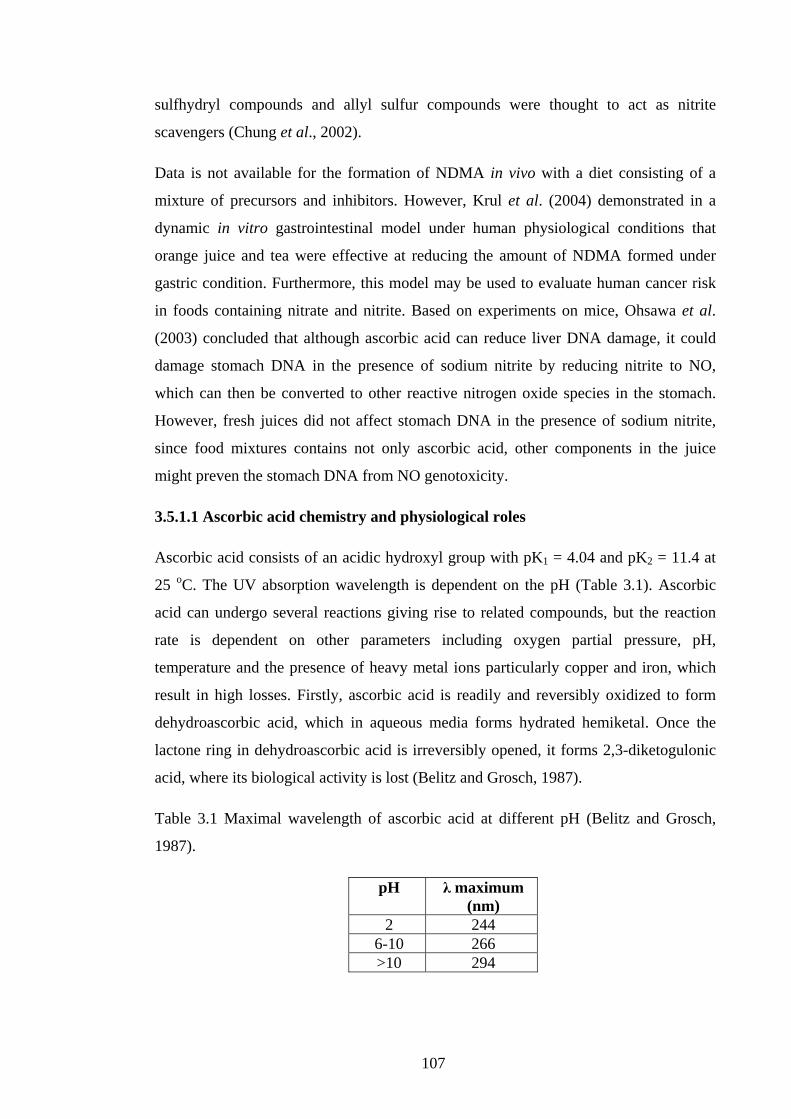
107
sulfhydryl compounds and allyl sulfur compounds were thought to act as nitrite
scavengers (Chung et al., 2002).
Data is not available for the formation of NDMA in vivo with a diet consisting of a
mixture of precursors and inhibitors. However, Krul et al. (2004) demonstrated in a
dynamic in vitro gastrointestinal model under human physiological conditions that
orange juice and tea were effective at reducing the amount of NDMA formed under
gastric condition. Furthermore, this model may be used to evaluate human cancer risk
in foods containing nitrate and nitrite. Based on experiments on mice, Ohsawa et al.
(2003) concluded that although ascorbic acid can reduce liver DNA damage, it could
damage stomach DNA in the presence of sodium nitrite by reducing nitrite to NO,
which can then be converted to other reactive nitrogen oxide species in the stomach.
However, fresh juices did not affect stomach DNA in the presence of sodium nitrite,
since food mixtures contains not only ascorbic acid, other components in the juice
might preven the stomach DNA from NO genotoxicity.
3.5.1.1 Ascorbic acid chemistry and physiological roles
Ascorbic acid consists of an acidic hydroxyl group with pK1 = 4.04 and pK2 = 11.4 at
25 oC. The UV absorption wavelength is dependent on the pH (Table 3.1). Ascorbic
acid can undergo several reactions giving rise to related compounds, but the reaction
rate is dependent on other parameters including oxygen partial pressure, pH,
temperature and the presence of heavy metal ions particularly copper and iron, which
result in high losses. Firstly, ascorbic acid is readily and reversibly oxidized to form
dehydroascorbic acid, which in aqueous media forms hydrated hemiketal. Once the
lactone ring in dehydroascorbic acid is irreversibly opened, it forms 2,3-diketogulonic
acid, where its biological activity is lost (Belitz and Grosch, 1987).
Table 3.1 Maximal wavelength of ascorbic acid at different pH (Belitz and Grosch,
1987).
pH λ maximum (nm)
2 244 6-10 266 >10 294
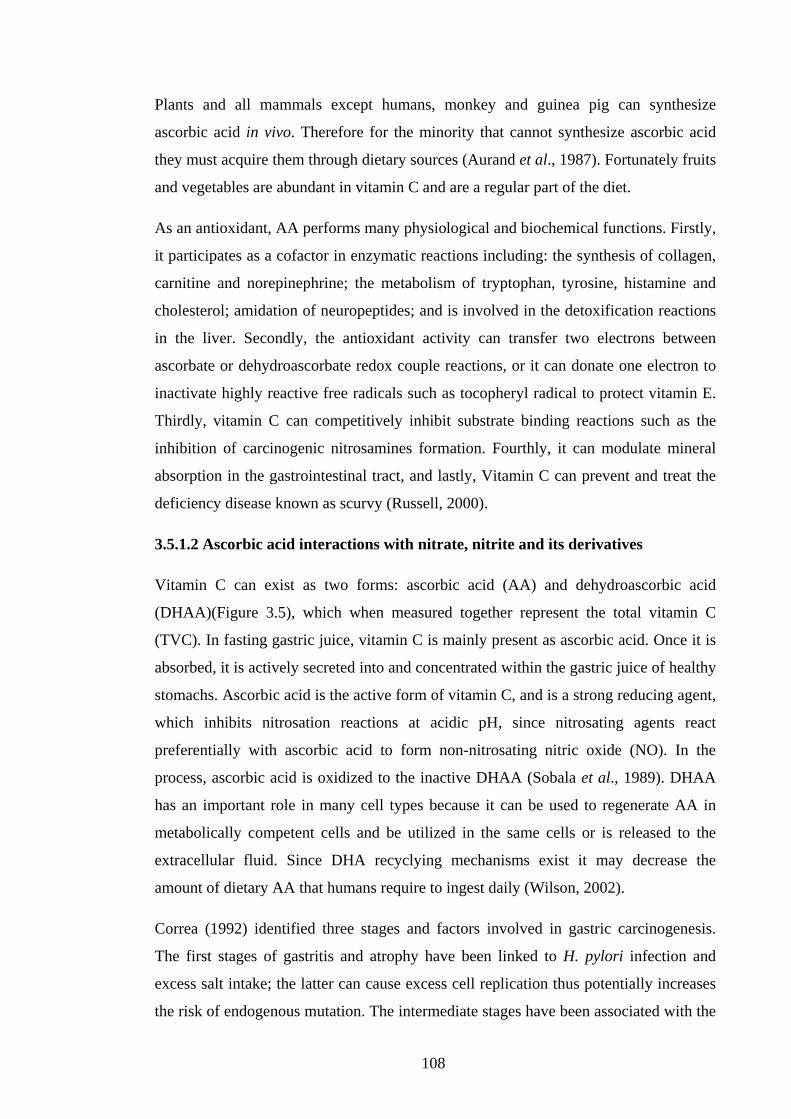
108
Plants and all mammals except humans, monkey and guinea pig can synthesize
ascorbic acid in vivo. Therefore for the minority that cannot synthesize ascorbic acid
they must acquire them through dietary sources (Aurand et al., 1987). Fortunately fruits
and vegetables are abundant in vitamin C and are a regular part of the diet.
As an antioxidant, AA performs many physiological and biochemical functions. Firstly,
it participates as a cofactor in enzymatic reactions including: the synthesis of collagen,
carnitine and norepinephrine; the metabolism of tryptophan, tyrosine, histamine and
cholesterol; amidation of neuropeptides; and is involved in the detoxification reactions
in the liver. Secondly, the antioxidant activity can transfer two electrons between
ascorbate or dehydroascorbate redox couple reactions, or it can donate one electron to
inactivate highly reactive free radicals such as tocopheryl radical to protect vitamin E.
Thirdly, vitamin C can competitively inhibit substrate binding reactions such as the
inhibition of carcinogenic nitrosamines formation. Fourthly, it can modulate mineral
absorption in the gastrointestinal tract, and lastly, Vitamin C can prevent and treat the
deficiency disease known as scurvy (Russell, 2000).
3.5.1.2 Ascorbic acid interactions with nitrate, nitrite and its derivatives
Vitamin C can exist as two forms: ascorbic acid (AA) and dehydroascorbic acid
(DHAA)(Figure 3.5), which when measured together represent the total vitamin C
(TVC). In fasting gastric juice, vitamin C is mainly present as ascorbic acid. Once it is
absorbed, it is actively secreted into and concentrated within the gastric juice of healthy
stomachs. Ascorbic acid is the active form of vitamin C, and is a strong reducing agent,
which inhibits nitrosation reactions at acidic pH, since nitrosating agents react
preferentially with ascorbic acid to form non-nitrosating nitric oxide (NO). In the
process, ascorbic acid is oxidized to the inactive DHAA (Sobala et al., 1989). DHAA
has an important role in many cell types because it can be used to regenerate AA in
metabolically competent cells and be utilized in the same cells or is released to the
extracellular fluid. Since DHA recyclying mechanisms exist it may decrease the
amount of dietary AA that humans require to ingest daily (Wilson, 2002).
Correa (1992) identified three stages and factors involved in gastric carcinogenesis.
The first stages of gastritis and atrophy have been linked to H. pylori infection and
excess salt intake; the latter can cause excess cell replication thus potentially increases
the risk of endogenous mutation. The intermediate stages have been associated with the
109
ascorbic acid and nitrate/nitrite ratio, which determines the degree of endogenous N-
nitrosation. The last stages of gastric carcinogenesis had been linked to β-carotene and
excessive salt intake.
Once nitrite is swallowed, it is reduced to nitric oxide by ascorbic acid normally
present in the stomach of healthy individuals. The nitric oxide is then absorbed through
the mucosa, and the ascorbic acid is oxidized to dehydroascorbic acid. However, in the
absence of ascorbic acid, nitrosating compounds such as nitrite can nitrosate precursors
to form NOC (Mowat and McColl, 2001).
Figure 3.5 Ascorbic acid and its common oxidation products (Washko et al., 1992).
As the enterosalivary recirculation of nitrate occurs, a constant supply of salivary nitrite
to the stomach is ensured. Since ingested nitrite continuously reacts in vivo with gastric
juice contents including ascorbic acid, their content is usually undetectable in the acid
stomach (Mowat and McColl, 2001). However, once anti-secretary agents are released
in the stomach, the pH increases to neutral, where nitrite remains stable and do not
react with ascorbic acid, hence accumulates in the stomach (Mowat and McColl, 2001).

110
Nitrite and its nitrogen oxide derivatives can react with other nitrogenous organic
compounds present in food and gastric juice to form NOCs. The level of NOC formed
is dependent on the amount of available nitrite and ascorbic acid. This nitrosation
reaction occurs spontaneously in acidic gastric juice. However, in achlorhydric stomach
of pH > 4, bacteria present on the stomach lining can catalyse the nitrosation reaction
(Mirvish, 1995).
Correa (1992) identified several risk factors for mid and distal gastric cancer based on
epidemiological research. The risk factors were: achlorhydria or hypochlorhydria, diets
high in nitrate or nitrite and low in vitamin C and Helicobacter pylori infection. It was
proposed that bacteria colonized in the stomach of hypochlorhydria patients might
convert ingested nitrate to nitrite and then catalyze the nitrosation process. It was
shown that bacteria could colonize the stomach when intragastric pH is above 4 (Gray
and Shiner, 1967).
3.5.1.3 Kinetics and mass transfer of ascorbic acid and nitrosation
Both ascorbic acid and ascorbate ion, or ASC, can indirectly inhibit nitrosation by
competing for nitrosating agents in the stomach formed from reactions with nitrite and
gastric juice contents. Subsequently, for each mole of ascorbic acid and ascorbate ion
oxidized, which is an irreversible process, two moles of non-nitrosating nitric oxide is
produced from nitrite. Although this reaction is fast, in the presence of oxygen, NO
may be reconverted to nitrosating agents, thus counteracting the inhibition effects of
ascorbic acid and ascorbate ion (Licht et al., 1988).
Nitrite can be lost from the gastric juice by either oxidation to nitrate (Equation 5)
and/or by forming volatile species such as nitric oxide and nitrogen dioxide (Equation
3). It was demonstrated by Licht et al. (1988) that loss of nitrite in vitro was more rapid
at low pH and with high rates of agitation. It was suggested that at lower pH more
nitrous acid is formed (Equation 1), which shifts the equilibria toward increased
production of volatile species, namely NO, NO2 and N2O4 (Equations 2-4).
Furthermore, increasing agitation rate promoted further removal of NO and NO2 from
the liquid phase.

111
NO2- + H+ ↔ HNO2…………….....………………………………………......………(1)
2HNO2 ↔ N2O3 + H2O…….......……………………………………………….....…..(2)
N2O3 ↔ NO + NO2…………………………..…………………………….....……….(3)
2NO2 ↔ N2O4…………………………...……...…………………………….…….…(4)
N2O4 + H2O → 2H+ + NO2- + NO3
-…………………...…………………...………….(5)
Equation 7 accounted for all the ASC lost. In addition, it also increases the loss of
nitrite via the formation of NO after reacting with NOX. The reaction between ASC
and nitrite depends on the competing reactions between the recycling of NO back into
nitrosating agent, and the removal of NO via mass transfer. The recycle process is
second order in NO while mass transfer is first order. This means that as the NO
concentration increases, the recycle reaction will increase faster than physical removal.
Thus anything that catalyzes the reaction between ASC and nitrite (Equation 7), for
examples SCN-, Cl- and lower pH, tends to favour recycle relative to removal by mass
transfer (Licht et al., 1988).
In addition, increasing temperature was shown to increase reaction (7) and the
formation of NO, also favouring the recycle of ASC, thus minimizes the effectiveness
of nitrosation inhibition by ASC. However, decreasing oxygen concentration was
shown to decrease the rate of recycle, thus maximizes nitrosation inhibition by ASC.
But since oxygen concentration has an inverse relationship with temperature, so the
reaction between ASC and nitrite was dependent on other conditions. For example,
more ASC was consumed at 37oC than at 23oC at pH 3.0, and the opposite trend was
observed at pH 2.0 (Licht et al., 1988).
ASC- + H+ ↔ ASCo…………………………………………………………....……...(6)
ASC + NOX → DHA + 2NO + H+ + X- + H2O……………………………...…….(7)
HNO2 + H+ ↔ NO+ + H2O……………………………………………........……...….(8)
NO+ + SCN- ↔ NOSCN………………………………………………………….......(9)
NO+ + Cl- ↔ NOCl………………………………………………………………......(10)
(ASC--ascorbate ion, ASCo-ascorbic acid, NOX-N2O3, NO+, NOSCN, or NOCl).
Xu and Read (1993) had demonstrated that significantly higher concentration of NOC
was produced at lower pH ranges of 1.1 to 3.0 and at higher pH ranges of 6.0 to 8.4
compared to a pH range of 3.0 to 6.0. They had also shown that nitrite concentration is
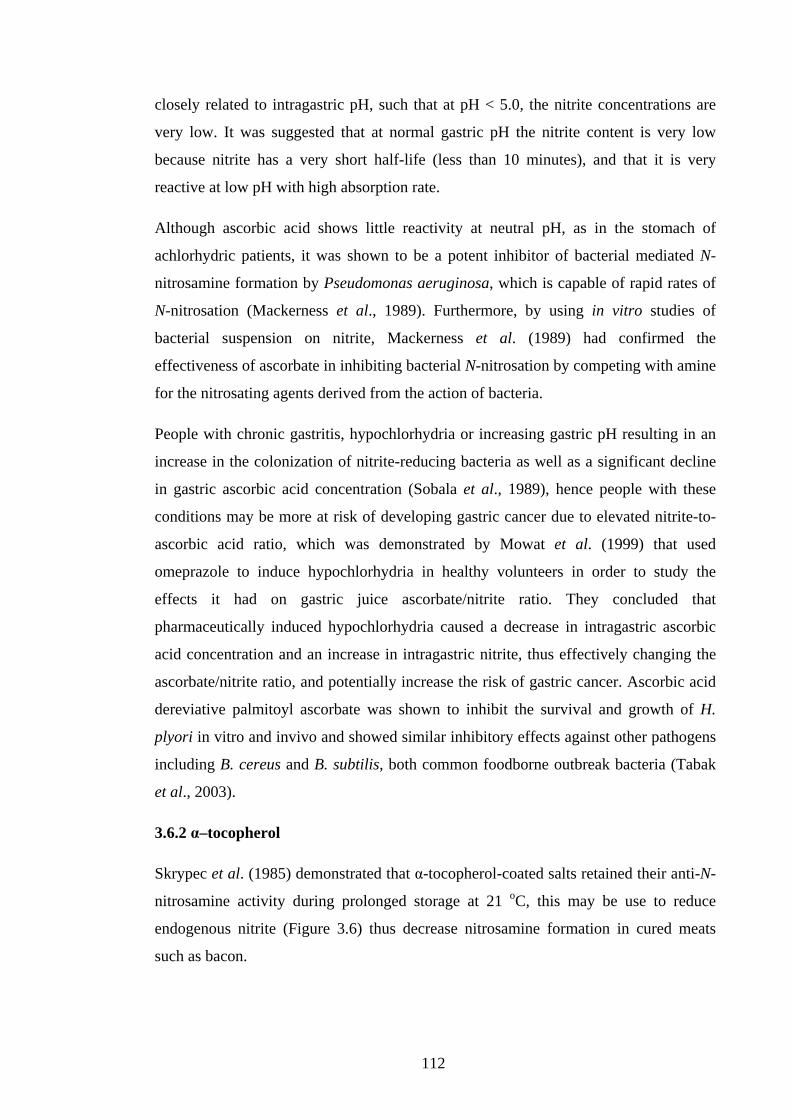
112
closely related to intragastric pH, such that at pH < 5.0, the nitrite concentrations are
very low. It was suggested that at normal gastric pH the nitrite content is very low
because nitrite has a very short half-life (less than 10 minutes), and that it is very
reactive at low pH with high absorption rate.
Although ascorbic acid shows little reactivity at neutral pH, as in the stomach of
achlorhydric patients, it was shown to be a potent inhibitor of bacterial mediated N-
nitrosamine formation by Pseudomonas aeruginosa, which is capable of rapid rates of
N-nitrosation (Mackerness et al., 1989). Furthermore, by using in vitro studies of
bacterial suspension on nitrite, Mackerness et al. (1989) had confirmed the
effectiveness of ascorbate in inhibiting bacterial N-nitrosation by competing with amine
for the nitrosating agents derived from the action of bacteria.
People with chronic gastritis, hypochlorhydria or increasing gastric pH resulting in an
increase in the colonization of nitrite-reducing bacteria as well as a significant decline
in gastric ascorbic acid concentration (Sobala et al., 1989), hence people with these
conditions may be more at risk of developing gastric cancer due to elevated nitrite-to-
ascorbic acid ratio, which was demonstrated by Mowat et al. (1999) that used
omeprazole to induce hypochlorhydria in healthy volunteers in order to study the
effects it had on gastric juice ascorbate/nitrite ratio. They concluded that
pharmaceutically induced hypochlorhydria caused a decrease in intragastric ascorbic
acid concentration and an increase in intragastric nitrite, thus effectively changing the
ascorbate/nitrite ratio, and potentially increase the risk of gastric cancer. Ascorbic acid
dereviative palmitoyl ascorbate was shown to inhibit the survival and growth of H.
plyori in vitro and invivo and showed similar inhibitory effects against other pathogens
including B. cereus and B. subtilis, both common foodborne outbreak bacteria (Tabak
et al., 2003).
3.6.2 α–tocopherol
Skrypec et al. (1985) demonstrated that α-tocopherol-coated salts retained their anti-N-
nitrosamine activity during prolonged storage at 21 oC, this may be use to reduce
endogenous nitrite (Figure 3.6) thus decrease nitrosamine formation in cured meats
such as bacon.
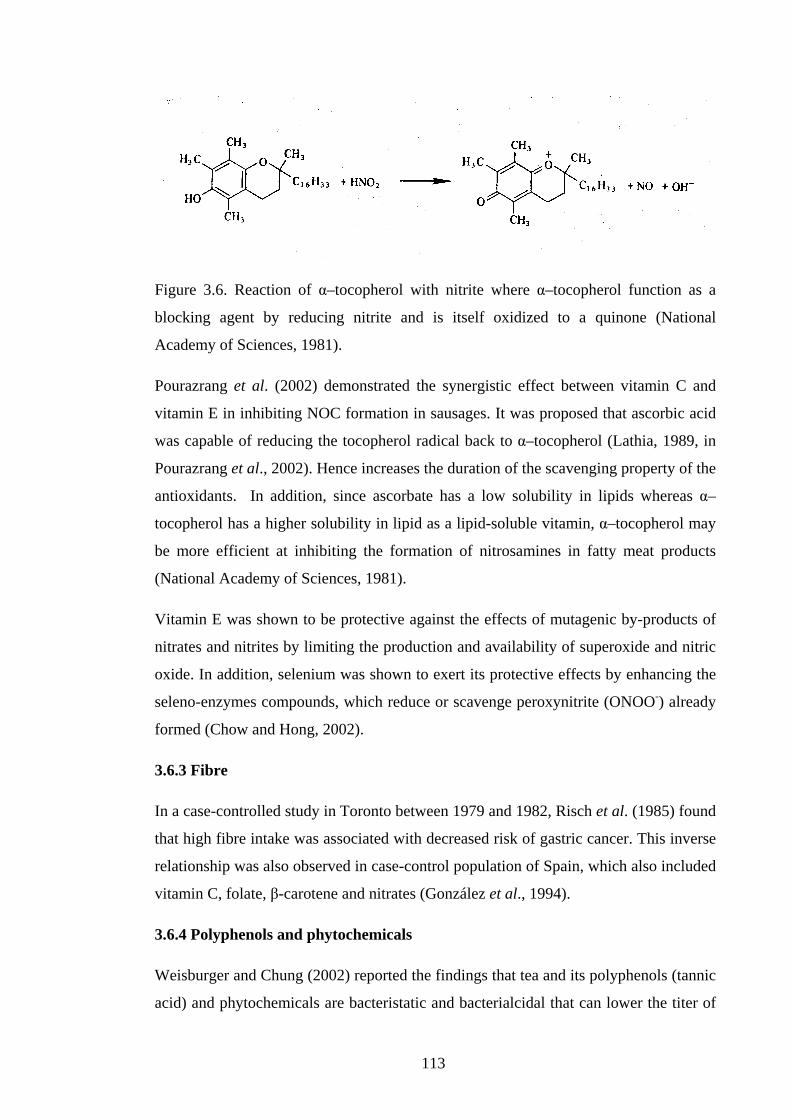
113
Figure 3.6. Reaction of α–tocopherol with nitrite where α–tocopherol function as a
blocking agent by reducing nitrite and is itself oxidized to a quinone (National
Academy of Sciences, 1981).
Pourazrang et al. (2002) demonstrated the synergistic effect between vitamin C and
vitamin E in inhibiting NOC formation in sausages. It was proposed that ascorbic acid
was capable of reducing the tocopherol radical back to α–tocopherol (Lathia, 1989, in
Pourazrang et al., 2002). Hence increases the duration of the scavenging property of the
antioxidants. In addition, since ascorbate has a low solubility in lipids whereas α–
tocopherol has a higher solubility in lipid as a lipid-soluble vitamin, α–tocopherol may
be more efficient at inhibiting the formation of nitrosamines in fatty meat products
(National Academy of Sciences, 1981).
Vitamin E was shown to be protective against the effects of mutagenic by-products of
nitrates and nitrites by limiting the production and availability of superoxide and nitric
oxide. In addition, selenium was shown to exert its protective effects by enhancing the
seleno-enzymes compounds, which reduce or scavenge peroxynitrite (ONOO-) already
formed (Chow and Hong, 2002).
3.6.3 Fibre
In a case-controlled study in Toronto between 1979 and 1982, Risch et al. (1985) found
that high fibre intake was associated with decreased risk of gastric cancer. This inverse
relationship was also observed in case-control population of Spain, which also included
vitamin C, folate, β-carotene and nitrates (González et al., 1994).
3.6.4 Polyphenols and phytochemicals
Weisburger and Chung (2002) reported the findings that tea and its polyphenols (tannic
acid) and phytochemicals are bacteristatic and bacterialcidal that can lower the titer of
114
H. pylori and the associated gastric cancer incidence. In addition, tea was shown to
react with nitrosating agents thereby reducing the body’s burden of carcinogens. For
example, Choi et al. (2002) demonstrated a significant increase in urinary
dimethylamine and trimethylamine in subjects fed with diets rich in amine, nitrate and
Korean green tea. Others such as α-tocopherol were demonstrated to be an effective N-
nitrosamine inhibitor in fried bacon (Skrypec et al., 1985).
Other NOC inhibitors including polyphenols in tea are scavengers for nitrite, however,
some will react with the nitrite to form NOC, which can effectively nitrosate amines.
Factors such as tea type, processing, preparation will determine whether tea is causative
or protective (Bartsch et al., 1990).
Recently Lee et al. (2006) demonstrated that flavanols epicatechin and its dimer B2 can
inhibit nitrous acid induced tyrosine nitration and the formation of carcinogenic volatile
N-nitrosamine such as NDMA. Furthermore, the resulting nitroso-flavanols may inhibit
the proliferation of and/or trigger apoptosis in large intestinal cancer cells.
Turmeric’s roles in cancer prevention at the cellular level was extensively studied.
However, its role in inhibiting NOC formation is not yet understood. Turmeric and/or
curcumin can prevent the activation of carcinogens and acts as an anti-oxidant and anti-
promoter. It can also retard the conversion of pre-neoplasia and repairs damage to DNA
(Krishnaswamy and Raghuramulu, 1998).
A recent review by Duvoix et al. (2005) described the properties and mode of action of
curcumin on carcinogenesis, gene expression and drug metabolism with reference to
their anti-tumor, antioxidant and anti-inflammatory properties. They concluded that
curcumin might have potential as a cancer therapeutic agent.
3.6.5 Others
Caffeic acid can be found in fruits, vegetables, wine, olive oil, teas, and coffee beans,
and along with its related compounds have been demonstrated to inhibit N-nitrosation
reactions by reacting with nitrite side chain at pH 2.0 (Cotelle and Vezin, 2001).
Cotelle and Vezin (2001) had shown that under acidic conditions caffeates could react
with nitrite to give nitroderivatives, nitrogen heterocycles or benzofuran dimers.
However, the formation of these products is dependent on the structure of caffeates as

115
either ester or acid. In addition, sodium azide had also been shown to be an inhibitor of
NO production (Yamasaki and Sakihama, 2000).
Ohshima and Bartsch (1981) suggested the potential of measuring N-nitrosoproline
excretion in the urine within 24 hours for the estimation of endogenous formation of
NOCs in humans after the ingestion of nitrate and proline together. In addition, they
had demonstrated the inhibitory effect on the nitrosation of proline in vivo by
simultaneous intake of ascorbic acid and α-tocopherol.
Different fractions of curcumin showed different levels of nitrosation inhibition
demonstrated by checking the mutagenicity in S. typhimurium strains with methylurea
and sodium nitrite at pH 3.6 and 30 oC. Since nitrosomethlurea is a direct-acting
mutagen in S. typhimurium TA1535 and TA100, it permits an accurate estimation of
the increase of his+ revertants. Both turmeric extract and curcumin exhibited dose-
dependent decreases of nitrosation. Under the same condition, curcumin I showed
dose-dependent depletion of nitrite ions thus making nitrite unavailable to participate in
nitrosation reactions. Furthermore, curcumin III showed higher affinity for nitrite ions
than curcumin I (Nagabhushan et al., 1988).
Cooking methods such as boiling, frying and baking of food proteins and carbohydrates
pyrolyses form Maillard reaction products, some of which are mutagenic and/or
carcinogenic and may contribute to the development and progression of diabetes and
age-related degenerative diseases, as well as destroying important essential amino
acids. Turmeric and curcumin was shown to block the formation of hazardous Maillard
reaction products and its mutagenic activity in histidine mutant strains of S.
typhimurium TA98 and TA100. Curcumin is currently undergoing clinical trials for the
prevention of cancer at National Cancer Institute in the United States (Kolpe et al.,
2002).
Kato et al. (1992) did not find any association between different cooking methods for
meats and fish and the risk of developing stomach cancer. However, in their study only
a specific population of rural Japanese living in mountainous area were surveyed,
therefore their conclusion may be biased and is not representative of the general
population.
116
3.7 Determination of N-nitroso compounds
Nitrosamines are present in very small quantities in food in units of µg/kg. Therefore
detection and analysis must be highly sensitive. In addition, due to the inherent
complexity of food matrices the methods used must also be selective. Nitrosamines are
divided into two major groups: volatile and non-volatile nitrosamines. Volatile
nitrosamines include simple dialkyl compounds such as N-nitrosodimethylamine and
N-nitrosodiethylamine that are relatively non-polar with low molecular weight that
possess a sufficiently high vapour pressure for extraction from food matrix by
distillation. In contrast, non-volatile nitrosamines such as NPRO and NDELA generally
have a higher molecular weight, or are more polar, and hence have a relatively low
vapour pressure. This makes their detection and analysis much more difficult. Due to
differences in their vapour pressure, volatile nitrosamines can be analysed by GC-TEA,
and non-volatile nitrosamines can be analysed using HPLC-TEA. However, due to
sample matrices, identification by retention time alone from either instrument requires
independent confirmation techniques including spectroscopic analysis (IR, NMR, UV
and MS), identification of derivatives or parallel GC-TEA and HPLC-TEA methods.
Although many methods and detectors are available for trace analysis of volatile
nitrosamines in food samples, GC-TEA is the standard method due to its highly
sensitive and selective detector (Sung, 2004).
Distillation is the most common extraction method for determining volatile
nitrosamines in food samples since they are relatively non-polar and low molecular
weight compounds (Andrade et al., 2005).
3.7.1 Volatile nitrosamines
Volatile nitrosamines are relatively non-polar, low molecular weight compounds that
possess sufficient vapor pressure to be removed by distillation in a food matrix
(Scanlan and Reyes, 1985), followed by isolation and separation procedures such as
solvent partitioning and thin-layer electrophoresis. Gas chromatography with thermal
energy analyzer (GC-TEA) as detector is commonly used for the separation and
detection of volatile nitrosamines due to its relatively specific and very sensitive
detector, with detection level of 1 ppb or less (Fiddler, 1975; Lijinsky, 1999). However,
low or high-resolution mass spectrometry is often required for the confirmation of
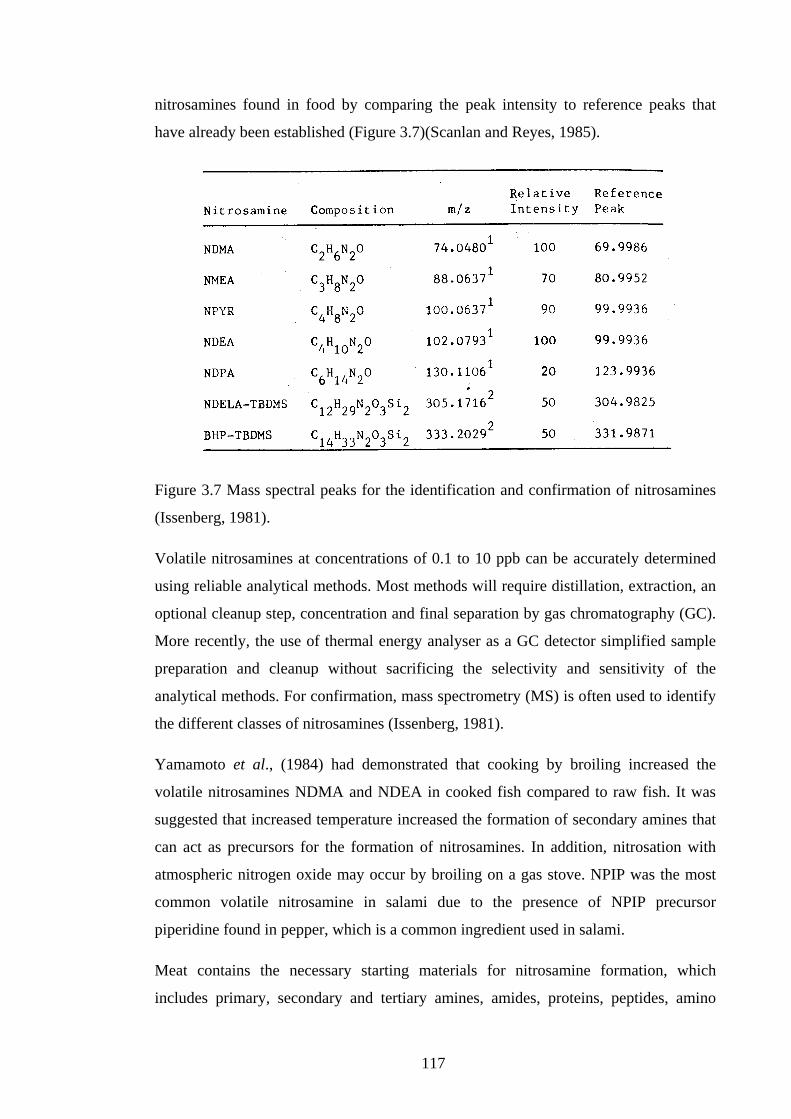
117
nitrosamines found in food by comparing the peak intensity to reference peaks that
have already been established (Figure 3.7)(Scanlan and Reyes, 1985).
Figure 3.7 Mass spectral peaks for the identification and confirmation of nitrosamines
(Issenberg, 1981).
Volatile nitrosamines at concentrations of 0.1 to 10 ppb can be accurately determined
using reliable analytical methods. Most methods will require distillation, extraction, an
optional cleanup step, concentration and final separation by gas chromatography (GC).
More recently, the use of thermal energy analyser as a GC detector simplified sample
preparation and cleanup without sacrificing the selectivity and sensitivity of the
analytical methods. For confirmation, mass spectrometry (MS) is often used to identify
the different classes of nitrosamines (Issenberg, 1981).
Yamamoto et al., (1984) had demonstrated that cooking by broiling increased the
volatile nitrosamines NDMA and NDEA in cooked fish compared to raw fish. It was
suggested that increased temperature increased the formation of secondary amines that
can act as precursors for the formation of nitrosamines. In addition, nitrosation with
atmospheric nitrogen oxide may occur by broiling on a gas stove. NPIP was the most
common volatile nitrosamine in salami due to the presence of NPIP precursor
piperidine found in pepper, which is a common ingredient used in salami.
Meat contains the necessary starting materials for nitrosamine formation, which
includes primary, secondary and tertiary amines, amides, proteins, peptides, amino
118
acids, nitrates and nitrites. In addition, microorganism can take part by nitrate reduction
to nitrite and the degradation of proteins to amines and amino acids. Furthermore, the
formation of higher nitrogen oxides after cooking can act as nitrosating agents. Thus
the concentration of nitrosamines in meat is dependent on the method of cooking,
cooking temperature and time, residual and added nitrite concentrations, concentration
of nitrosamine precursors, presence of nitrosating catalysts and inhibitors, and the
storage factors (Yurchenko and Mölder, 2005).
NDMA, N-nitrosopyrrolidine and N-nitrosopiperidine are the three most commonly
volatile nitrosamines found in six broad food groups. These include cured meats,
smoked fish/meat, foods subjected to drying by combustion gases such as malt used in
beer, pickled and salt preserved foods that favors microbial nitrate reduction, foods
stored under humid conditions that favors fungal growth, and finally interactions with
food packaging materials (Cassens, 1995). Furthermore, volatile nitrosamine was
generally not detected in other meat samples, and if present was only present at low
concentration of 0.001 g/kg (Ologhobo et al., 1996).
Volatile nitrosamines were detected in raw and various food process Estonian meat
samples using two-step solid-phase extraction with separation by GC and detection by
positive-ion chemical ionization using ammonia as a reagent gas. Limit of detection
and limit of quantification of nitrosamines were 0.09 and 0.29 µg/kg, respectively, with
about 85 % recovery. The estimated total volatile nitrosamines were 3.97 µg/kg
(Yurchenko and Mölder, 2005).
Ventanas and Ruiz (2006) successfully determined nine nitrosamines in gelatine based
food model system using SPME coupled to a direct extraction device and subsequent
GC-MS in selected ion monitoring mode. In addition, all nitrosamines were extracted
without any sample manipulation making it a rapid and non-destructive method for
preliminary screening of these carcinogens in solid foods.
Meat contains natural source of precursors for nitrosamine production. For example,
the amino acid glycine is a precursor of N-nitrosodimethylamine, which can be derived
from amino salts choline, acetylocholine and betaine, which are common in meat
(Rywotycki, 2003). In addition, in meat free amino acids praline, glycine, alanine
valine and biologically active ones such as putrescine and cadaverine are susceptible to
nitrosation (Rywotycki, 2007). Thus it is important to know the initial nitrosamine

119
concentrations in fresh meat before processing. Rywotycki (2003) had shown that
animal species, breeding factors and season of the year affected the nitrosamine
contents in raw meat. This is most likely due to the variations in nitrate and nitrite
content in the feed and water, as well as other environmental factors. It was also
demonstrated that in winter the nitrosamine level is at its lowest compared to the
highest nitrosamine content occurs in autumn. In addition, the overall NDMA
concentration is highest in pork and beef and lowest in ram, goat and veal.
Andrade et al. (2005) developed a method that is simple, rapid with adequate accuracy,
selectivity, sensitivity and precision for the determination of N-nitrosamines including
N-nitrosodimethylamine, N-nitrosodiethylamine, N-nitrosopiperidine and N-
nitrosopyrrolidine in sausages using headspace sampling by solid-phase micro-
extraction and gas chromatography with thermal energy analyzer detection (HS-SPME-
GC-TEA). The clean-up and extraction method used is less time-consuming and less
labor intensive compared to traditional extraction methods such as low-temperature
vacuum distillation, supercritical fluid extraction and solid-phase extraction. In
addition, it eliminated the use of potentially toxic and expensive in the traditional
solvent-bases extraction methods. Although GC-TEA is a common detection method
for volatile nitrosamines, HPLC-TEA can also be used for the analysis of volatile
nitrosamines with similar retention time and peak height as the traditional GC-TEA
method (Khalaf and Steinert, 2000).
The rate of nitrosamine formation is proportional to the square of the nitrite
concentration; therefore reduction of nitrite has a profound effect in reducing the
amount of nitrosamines formed in foods. There is a steady decline in the use of nitrite
in foods worldwide either by voluntary actions of manufacturers or by government
regulations (Lijinsky, 1999).
Food processing technology could be useful besides function in food production and
preservation. For example, Jo et al. (2003) demonstrated that residual nitrite content in
cooked pork sausage was lowest with carbon dioxide packaging compared to aerobic
and vacuum packaging. In addition, irradiation at 5 kGy significantly decreased volatile
N-nitrosamines in that product. Similarly, high dose irradiation at more than 10 kGy
was shown to reduce nitrosamines content including NDMA and NPYR in fermented
sausage during storage. In addition, vacuum packaging gave significant nitrosamine

120
reduction than aerobic packaging (Byun et al., 2004). The reduction of nitrite to
nitrogen oxides may explain the higher levels of nitrosamines in aerobic packaging
since nitrogen oxides reacts with amines to form nitrosamines (Yurchenko and Mölder,
2006).
Rywotycki (2007) demonstrated that functional additives including sodium chloride
and sodium ascorbate caused a decrease in NDMA formation in raw meat. In addition,
baking process increased the level of NDMA in meat without the additives compared to
meat containing the additives.
Fish especially marine fish contains abundant source of precursors of NDMA including
dimethylamine, diethylamine, trimethylamine and trimethylamine oxide. The total
concentrations of five nitrosamines (NDMA, NDEA, NPYR, NPIP, and NDBA) in fish
products ranged from non-detectable to 10.34 µg/kg. In addition, baking temperature
and time was shown to affect the nitrosamine content: increasing temperature and
cooking time increased the nitrosamines content of the fish products (Yurchenko and
Mölder, 2006).
Miller et al. (1989) demonstrated that cooking method affected the content of N-
nitrosamines in bacon. It was shown that fried bacon fat contained up to 20.8 and 23.3
ng/g of NPYR and NDMA, respectively. In contrast, no NPYR and NDMA were
detected in bacon or its fat from microwave cooking for 45 sec per slice. Therefore
cooking method drastically affected the level of exposure to N-nitrosamines in humans.
The elevation in NPRO excretion in urine after the consumption of nitrite cured meat
was not diminished by the concurrent consumption of the nitrosation inhibitor ascorbic
acid suggests the presence of pre-formed NPRO or NPRO pre-cursor in the meat.
Furthermore, the amount of NPRO in cured meat increased significantly after digestion
with proteolytic enzymes, accounting for 3 to 93 % of protein-associated N-
nitrosamines and only detectable after proteolytic digestion (Dunn and Stich, 1984).
The vigorous proteolysis of meat in vitro may release greater amount of N-nitrosamines
then are released by natural digestive processes in the body. Thus the best way to
measure the amount of biologically available N-nitrosamine in foods is to measure
what is excreted than subjecting them to any laboratory treatments (Dunn and Stich,
1984).
121
Rywotycki (2002) concluded that meat curing with polyphosphates and sodium nitrite
increased the level of short chain nitrosamines such as dimethylonitrosamine (DMNA)
and diethylonitrosamine (DENA). However, the content of these nitrosamines can be
reduced by the addition of sodium ascorbate.
NDMA is the most common volatile N-nitrosamine. It is found in beer and other
beverages based on malted barley. In contrast, other grain- or grape- derived alcoholic
beverages only contain trace amount of NDMA (McWeeny, 1983).
Many aliphatic and nitrogen-containing heterocyclic compounds can be nitrosated to
form carcinogenic substances. Nitrite in food is the most important precursor and
nitrosating agent, as well as nitrate, which can be reduced to nitrite in vivo. The crucial
nitrosating agent for secondary amines is another nitroso compound and not nitrous
acid or other oxides of nitrogen. For example, S-Nitrosocysteine can transnitrosate
secondary amines at pH up to 9.75 therefore may contribute to preformed NOC in
foods that are not acidic (Lin, 1990).
Shahidi and Pegg (1994) demonstrated that nitrite-free curing of meat and fish products
containing preformed cooked cured-meat pigment did not contain volatile nitrosamines.
This is not surprising since nitrite is a strong nitrosating agent normally added to cured
meat products. Although they have eliminated problems associated with color and
nitrosamine formation, they did not address the potential growth of C. botulinum spores
that is normally controlled with nitrite salts.
It was shown that certain nitrosamines are formed from precursors during cooking of
salt-preserved fish. Furthermore, different cooking practices such as steaming and
frying may result in the presence of nitrosamines in the aqueous phase or oil in the case
of frying. It was also suggested that most of the nitrosamines content in the frying oil
maybe lost to the atmosphere during frying (Huang et al., 1981).
3.7.2 Non-volatile nitrosamines
Non-volatile nitrosamines such as N-nitrosoproline and N-nitrosodiethanolamine
(NDELA) are more polar and have higher molecular weight than volatile nitrosamine,
which means they possess relatively low vapor pressure, thus generally cannot be
removed from a food matrix by distillation technique. Instead, nonvolatile nitrosamines
can either be converted to volatile nitrosamine followed by separation and detection
122
GC-TEA, or it can be separated by HPLC followed by detection by HPLC-TEA.
Furthermore, the total NOCs contained in the food can be detected by converting them
to nitric oxide followed by separation and detection using GC-TEA. Thus the size of
nitric oxide peak should be proportional to the total N-nitroso content in the food
(Scanlan and Reyes, 1985). Ologhobo et al. (1996) used ultraviolet light to split
nitrosamines to nitrite and amines. The nitrite was then determined using the method
proposed by Montgomery and Dymock (1961), in Ologhobo et al. (1996).
The nitrosation-TEA system is based on selective chemical denitrosation of the
compounds to nitric oxide followed by detection of the liberated NO by TEA. This
system can be coupled to HPLC for the analysis of a variety of polar and non-polar
non-volatile nitrosamides that are particularly unstable for determination by other
methods (Sen et al., 1985). Sen et al. (1985) had used this system and confirmed its
sensitivity for the determination of N-nitroso-N-methylurea (NMU), a nitrosamide in
fried bacon.
Liquid-liquid partition is used as the initial isolation step in the determination of non-
volatile nitrosamines by extracting volatile nitrosamines in the samples. Subsequently,
non-volatile nitrosamines can be extracted by using vacuum distillation or column
extraction. Although the latter method offers numerous advantages over the traditional
distillation method, its use in determining nitrosamines in foods and beverages must be
carefully validated (Issenberg, 1981).
3.7.3 Non-volatile nitrosamides
The distribution of NOC in food lacks information on non-volatile N-nitroso
compounds including alkylnitrosamides (alkylnitrosoureas) and hydroxylated
nitrosamines (nitrosodiethanolamine and nitrosobis-2-hydroxypropylamine). These are
highly potent NOC with both mutagenic and carcinogenic activities, and can only be
determined by high-performance liquid chromatography. However, accurate
determination of alkylnitrosamide is challenging since they are unstable and difficult to
identify at low concentrations (Lijinsky, 1999).
Massey et al. (1982) described a simple clean-up procedure for the routine analysis of
N-nitrosamines in cured meats and beverages using reverse phase microbore HPLC
with an organic ion-pairing agent and a post-column acetone make-up solvent prior to a
123
TEA detector. This allowed the determination of polar N-nitrosamines in cured meats
and beverages that are traditional analyzed using GC-TEA.
3.7.4 Nitrosamine extraction from food
SPME utilizes a fiber support coated in a thin layer of diverse range of polymer
material to extract and concentrate analytes for analysis. Application of heat or the
addition of salt can increase sorption onto the SPME fiber by increasing the volatility
and solubility of the analyte, respectivly. Major advantages includes: no solvents
required thus reducing costs and generating less waste, extraction and concentration
occur simultaneously, and SPME can be automated thus further reducing extraction
time (Grebel et al., 2006).
The optimum headspace to total volume ratio is 0.6 for most nitrosamines including
NDMA, which corresponds to 7 ml of sample in a 17 ml vial including HS. The
optimal extraction temperature for NDMA is 65 oC with optimal salt saturation at 100
% corresponds to 2.4 g NaCl for a 7 ml sample volume (Grebel et al., 2006). Although
NDMA requires about 4 h to reach equilibrium, it was suggested that 45min was close
to the point of equilibrium without compromising extraction efficiency. These
conditions resulted in a detection limit of 30 ng/L and making it an inexpensive and
simple method for the routine analysis of NDMA using HS-SPME method.
Considerable reduction in extraction and analysis time is around 1.25 h compared to
other methods taking 3-20 h (Grebel et al., 2006).
By using solid-phase microextraction (SPME) coupled to a direct extract device
(DED), Ventanas et al. (2006) managed to extract standard mixture containing nine
volatile nitrosamines (NDMA, NMEA, NDEA, NPYR, NMOR, NDPA, NPIP, NDBA,
and NDPheA) at 1 to 5 ng/ml from a solid food model system composed of gelatine at
refrigeration (4 oC) and room temperatures (25 oC) with different extraction time
analysed by GC-MS in selected ion monitoring mode. It was concluded that this
method is rapid and suitable for extracting nitrosamines from model food systems.
Solid-phase microextraction is a relatively new, sensitive and convenient device for
extracting compounds from samples. There are two techniques for the use of SPME:
headspace (HS)-SPME and direct immersion (DI)-SPME. In HS-SPME, the fiber is
exposed to the vapor phase above a gaseous, liquid or solid sample, whereas in DI-

124
SPME, the fiber is immersed in liquid samples. The choice of technique depends on the
analyte. For example, for volatile nitrosamines, the HS-SPME is most suitable and
since the fiber is not in direct contact of the sample its shelf life is extended. Following
extraction, desorption is achieved by exposing the fiber in the injection port of GC or
GC-MS to heat or by running solvent in the SPME-HPLC interface (Kataoka et al.,
2000).
One major advantage of SPME is that full equilibrium is not necessary for quantitative
analysis since there is a proportional linear relationship between the amount of analyte
adsorbed by the SPME fiber and its initial concentration in the sample matrix before
reaching partition equilibrium. This means time spent on sample clean up may be
avoided or at least minimized (Kataoka et al., 2000).
Mixed coating fibers such as carboxen divinylbenzene (CAR-DVB) is useful for the
extraction of low molecular weight volatile and polar analytes such as NDMA.
Optimization of extraction using SPME depends on the concentration of analyte
extracted, the polarity and thickness of the stationary phase, the extraction time, pH,
temperature and amount of agitation. (Kataoka et al., 2000).
3.7.5 Nitrosamines in biological fluids
Traces of NDMA, although at low levels of 0.1 µg/kg, is only found in six of 23 urine
samples from subjects ingesting daily large doses of ammonium nitrate (Ellen et al.,
1982). There are numerous flaws in their experimental design, specifically the lack of
controls. The compositions of the two most recent meals were recorded, but the meals
were not controlled so that the amount of nitrosamines precursors varied from subject
to subject. In addition, all subjects were patients at a hospital therefore might not have a
normal metabolism compared to healthy individuals.
Lakritz et al. (1982) measured nitrosamine levels in human blood, urine and gastric
content after feeding 21 healthy volunteers different types of meals including fish, beef
or bacon in combination with spinach and vegetable juice. They concluded that gastric
formation of nitrosamine did not seem to be a health risk for healthy people since the
levels of nitrosamine found in physiological fluids did not markedly increased after
eating.

125
Salivary nitrite concentration showed no correlation with blood nitrosamine levels.
However, after feeding 23 non-smoking volunteers food including bacon, spinach,
bread and beer, the concentration of NDMA increased in the blood with a mean of 0.5
µg/L. It was also demonstrated that the highest level of NDMA in the blood occurred
after 1hr eating the meal after which the concentration started to decline (Gough et al.,
1983).
Vermeer et al. (1998) tested the effects of amine and nitrate rich diet in human
volunteers to determine its impact on volatile N-nitrosamine production in vivo.
Salivary nitrate and nitrite, urinary nitrate and urinary NDMA and NPIP increased
significantly after the introduction of amine and nitrate rich diet for one week, whereas
a significant reduction was shown one week after the diet stopped. Furthermore, it was
demonstrated that nitrate and NDMA excretion were significantly correlated, as well as
salivary nitrate and nitrite concentration and NDMA excretion. However, NPIP
excretion was not directly related to the nitrate intake and composition of the diet. This
finding is remarkable as it is perhaps the first human in vivo experiment that showed a
correlation between diet and the formation of carcinogenic N-nitrosamines. In addition,
they have demonstrated human volunteers that a daily dose of 250 mg ascorbic acid
was sufficient to inhibit NDMA excretion to the maximum extent, and that two grams
(four cups) of green tea a day also decreased NDMA excretion. However, at more than
four grams (eight cups) of green tea a day increased the formation of NDMA via a yet
unknown mechanism (Vermeer et al., 1999).
Al-Mamary et al. (2006) investigated nitrosamine formation in aqueous and simulated
normal fasting stomach conditions (37 oC at pH 2.0 for 1 h) with constant concentration
of nitrite (14.4 mM) with Catha edulis leave extracts as a source of primary (cathinone,
cathine, and norephedrine) and secondary amines (ephedrine and pseudoephedrine). It
was demonstrated that various levels of nitrite yielded a dose-dependent amount of
total nitrosamine compounds. In addition, these were not detected in aqueous solution ≤
0.5 mM sodium nitrite or ≤ 1.0 mM in stimulated gastric condition.
By using a novel 15N breath test on healthy volunteers and patients infected with H.
pylori, Junghans et al. (1999) had demonstrated that molecular nitrogen is produced
from the body from oxygenated nitrogen species including protonated form of nitrous
acid (H2ONO+), dinitrogentrioxide (N2O3), dinitrogentetroxide (N2O4) and
126
peroxynitrite (ONOO-). It was suggested that molecular nitrogen can be used as a non-
invasive technique for assessing body’s NO and nitrite levels, the body’s nitrosation
potential, and possibly oxidative stress status associated with particular diseases such as
cancer, which highlights the importance of developing an accurate method for
measuring or estimating the body’s NO level. However, only seven subjects
participated in this study, therefore more numbers are required to support the validity of
the method.
Helaleh and Korenaga (2000) reported 4.85 and 15.48 µg/ml of nitrite and nitrate,
respectively, in human saliva based on ion chromatography with suppressed
conductivity detection. In addition, they had demonstrated that the saliva sample only
needed centrifugation to remove the insoluble matter and that no sample preparation or
clean-up process was required.
Levallois et al., (2000) concluded that dietary nitrate intake and urinary nitrate
excretion was not related to nitrosamine N-nitrosopiperidine excretion in a small-scale
rural population in Québec, Canada. However, they showed a correlation between
urinary nitrate excretion and total nitrate intake. Dietary nitrate and vitamins C and E
intake were estimated by means of a 24-hr recall and by using a validated Canadian
food database.
3.8 Determination of vitamin C
Vitamin C in food exists as two vitamers. Ascorbic acid (AA) can be oxidized to
dehydroascorbic acid (DHAA) under conditions such as high temperature, presence of
oxygen, degradative enzymes and/or metal ions especially copper and iron, alkaline pH
and light. This process is reversible so DHAA can be reduced back to AA (Russell,
2000) in the presence of reducing agents such as hydrogen sulfide, homocysteine and
dithiothreitol (Aurand et al., 1987). However, DHAA can be further oxidized to 2, 3-
diketogulonic acid that is biological inactive and is an irreversible process. In addition,
DHAA can undergo spontaneous hydrolysis to form 2, 3-diketogulonic acid (Washko
et al., 1992). AA and DHAA have equivalent biological activities, whereas D-ascorbic
acid including isoascorbic acid (IAA) and erythorbic acid have a biological activity
about 5 % of L-ascorbic acid (Russell, 2000), and is usually added to food as an
antioxidant since it does not occur naturally in food products (van Niekerk, 1982). D-
ascorbic acid can also be oxidized to give dehydroisoascorbic acid (DHIAA). Both

127
IAA and DHIAA can interfere with the determination of AA and DHAA (Russell,
2000).
Total ascorbic acid is defined as the sum of both ascorbic acid and its oxidized form
dehydroascorbic acid (DHAA). Although DHAA is present naturally in food, its
instability makes quantification difficult. Thus its quantification is usually performed
after its conversion into AA after the addition of reducing agents. Reducing agents such
as cystein, homocystein and dithiothreitol (DTT) are often used to convert DHA into its
reduced form and to stabilize AA. However, TCEP was demonstrated to offer better
reduction efficiency at low pH compared to DTT. Isoascorbic acid (IAA) also called D-
ascorbic acid or erythorbic acid is often used as an antioxidant in food but with only 5
% of the antiscorbutic effect of AA. The traditional AOAC method for determining
vitaminc C only estimate the total content without distinguishing between AA and
IAA. In recent years reverse phase HPLC with either ion exchange column or ion-
pairing agent is used to distinguish between AA and DHA. However, this method
required a pre- or post derivatization step, which is time consuming and may result in
the degradation of AA in the process (Fontannaz et al., 2006).
Kall and Andersen (1999) used a dual detection system using HPLC for separation with
direct detection of ascorbic acid and indirect fluorimetric detection of dehydroascorbic
acid after a post-column O-phenyldiamine derivatisation. Total analysis time was only
10 minutes with good reproducibility and recovery. Since dehydroascorbic acid has a
weak UV absorption and no response to electrochemical detection, it needs to be
derivatised prior to or after chromatographic separation to increase its detection
sensitivity. DHAA can be reduced to AA by L-cysteine or dithiothreitol or derivatised
with O-phenyldiamine to form a fluorophore.
Metaphosphoric acid may provide the most efficient ascorbic acid extraction by
preventing oxidation compared to citric acid, acetic acid, perchloric acid and
orthophosphoric acid. However, compared to other acids mentioned above,
metaphosphoric acid may cause analytical interferences by reacting with silica-based
column materials such as C18 or NH2 bonded-phases thus affecting baseline and
retention time. It was suggested that a combination of 1 % (w/v) metaphosphoric acid
and 0.5 % (w/v) oxalic acid at pH 2 as extraction buffer provides high stability of AA
128
and DHAA and have minimal interactions with the chromatographic system (Kall and
Andersen, 1999).
Furusawa (2001) developed a rapid and simple HPLC-UV method for the identification
and quantification of L-ascorbic acid in fruit drinks. DHAA was reduced by
dithiothreitol before HPLC analysis using 2 % (v/v) acetic acid as the mobile phase.
The limit of detection was 10 µg/ml with analysis time approximately three minutes.
A new micro-calorimetric method based on the oxidation of vitamin C using the
enzyme ascorbate oxidase was comparable to the HPLC-UV method in terms of
sensitivity, specificity and short analysis time of less than five minutes. But the major
advantage of the micro-calorimetric method over the HPLC method is that no pre-
treatment of the food or pharmaceutical samples is required which significantly reduces
overall analysis time (Antonelli et al., 2002).
It was demonstrated that HPLC-UV (243 nm) offered high accuracy, good repeatability
and reproducibility in relatively short analysis time as well as good separation of AA
and IAA. Recovery was more than 99 % with LOD of 0.1 µg/ml, which corresponds to
0.1 mg/100 g samples (Fontannaz et al., 2006).
3.8.1 Food
Due to the increase practice of adding vitamins to food as a marketing tool, a more
reliable and standardized method is required for their accurate determination in food
samples. Because vitamin C is a non-volatile and hydrophilic compound, reversed-
phase HPLC analysis has been very popular choice for its determination in foods.
HPLC affords great advantage over other analytical systems for its ability to separate
the vitamins from interferences inherent in complex matrices such as biological fluids
and food. In addition, HPLC is much faster compared to spectrophotometic methods or
microbiological assays with increased precision, reasonable accuracy, increased
specificity by using UV detection and can be easily automated (Russell, 2000).
Because AA is heat sensitive, HPLC is routinely used for its determination and
quantification in food samples since minimal heat is generated by using HPLC
compared to GC-MS. However, recently GC was shown to be accurate in AA
determination by Silva (2005) after simple clean up techniques and a freeze-drying
step. However, GC gave slightly less recovery (2 %) and slightly longer analysis time
129
of seven minutes instead of approximately four minutes when compared to HPLC.
Furthermore, GC does not distinguish between ascorbic acid and isoascorbic acid.
Based on spectrophotometric, conductometric and traditional titrimetry methods,
Grundpan et al. (1999) demonstrated that commercially available vitamin C tablets
from Thailand were between 73 and 107 % of the labeled vitamin C content with an
average of 96 % detected from the labeled content. Commercial vitamin C tablets in the
United States were shown to be between 92 and 111 % of the labeled content based on
enzymatic spectrophotometric determinations (Esteban and Ho, 1997).
Nisperos-Carriedo et al. (1992) simultaneously determined dehydroascorbic acid,
ascorbic acid and other organic acids in fruits and vegetables by reversed-phase HPLC
with UV detection at 215 and 260 nm using a mobile phase consisted of 2 % potassium
dihydrogen phosphate (KH2PO4) at 0.4 ml/min. Although ascorbic acid has a maximum
absorbance at 245 nm, 260 nm was used to avoid interferences from the food matrix.
However, since no food is used for this experiment, interferences are expected to be
low and hence the maximal absorbance will be used for increased sensitivity and
selectivity.
Similarly, Zapata and Dufour (1992) simultaneously determined ascorbic,
dehydroascorbic and isoascorbic acid in fruit juices, beer and vitamin C tablets using
reversed-phase ion interaction HPLC with UV detection at 261 nm. Detection was
under 11 minutes with limit of detection of 10 ppm. The peak separation and resolution
was much better compared to Nisperos-Carriedo et al. (1992).
Total ascorbic acid and isoascorbic acid can be quantified based on acidic extraction of
ascorbic acid in the presence of reducing agent Tris [2-carboxyethyl/ phosphate]
(TCEP) that maintains ascorbic acid in its reduced form. The separation was achieved
using HPLC with C18 column and sodium acetate as mobile phase containing TCEP
and decylamine as ion pairing agent. (Fontannaz et al., 2006).
Odriozola-Serrano et al. (2007) compared different HPLC-UV methods and reducing
agents for the routine determination of vitamin C in fruits. It was demonstrated that C18
column was more reliable than the NH2 column, and that DL-1,4-dithiotretol (DTT)
was a better reducing agent than 2,3-dimercapto-1-propanol.
130
Tai and Gohda (2007) developed a new, simple and sensitive hydrophilic interaction
liquid chromatography method for the simultaneous determination of ascorbic acid and
its related compounds in foods and beverages with commercial applications.
Dithiothreitol (50 mg/L) was used as a stabilizer resulted in good linearity and
reproducibility. Detection with UV was set at 260 nm with retention time for ascorbic
acid at approximately 12 minutes.
A new method involving radical oxidation of L-ascorbic acid to dehydro-L-ascorbic
acid with HPLC detection by fluorometric on a Nova-Pak C18 column was
demonstrated to have good reproducibility, sensitivity and accuracy (Burini, 2007).
3.8.2 Biological fluids
A comprehensive review for vitamin C analyses in biological samples were
summarized by Washko et al. (1992). Most of the colorimetric and chromatography
methods reviewed had limitations involving sensitivity, specificity, matrix interference
and stability. In addition, methods involving spectophotometric assays were time
consuming, as well as GC that requires lengthy derivatization process. Overall, the
HPLC coupled with a UV detector seemed to have more advantages over other
methods in reference to the limitations mentioned above. In addition, HPLC-UV has
the ability to measure both AA and DHAA using the same system set up either directly
using an amine column or indirectly through derivatization or reduction of the
vitamers.
In summary, vitamin C analysis suffers from the four ‘S’ syndromes: stability,
sensitivity, specificity and substance interference (Washko et al., 1992). Therefore, an
accurate determination of vitamin C requires an extraction method that minimizes
losses due to the factors mentioned above, as well as being sensitive and selective with
short analysis time for large sample runs.
3.8.3 Extraction
Extraction method used to extract vitamins from food is a crucial step, since the
extraction method itself may contribute to losses or incomplete extraction of the desired
vitamin as they are commonly bound to food components such as carbohydrates and
proteins. In addition, due to the trace quantity of naturally occurring vitamins in foods,
the detection sensitivity needs to be sufficient to detect minute amounts (Russell,
131
2000). UV detector set at 254 or 264 nm is selective for vitamin C thus increases
detection sensitivity and accuracy. However, electrochemical detector offers greater
sensitivity and selectivity for ascorbic acid than UV detector, especially for samples
with very low vitamin C content (van Niekerk, 1982).
The aim of the extraction method for vitamins analysis is to prevent the degradation
and loss of vitamers in order to ensure an accurate determination. Acids such as
metaphosphoric acid, trichloroacetic acid and oxalic acid can protect vitamin C
vitamers from oxidation and hydrolysis of the lactone ring, at the same precipitating
proteins often associated with endogenous vitamin C in foods (Washko et al., 1992).
Extraction solutions containing 3 to 6 % of oxalic or metaphosphoric acid are
commonly used to extract vitamin C from foods. These acids can prevent catalysis of
the oxidation of ascorbic acid by cupric or ferric ions, however, metaphosphoric acid is
more useful for its ability to precipitate proteins and deactivate ascorbic acid oxidase.
The sample is usually homogenized with the extraction solution followed by
centrifugation or filter before chromatography analysis (van Niekerk, 1982).
Metal chelators such as EDTA and diethylenetriaminepentaacetic acid prevents
oxidation of AA by binding to metal cations such as iron and copper. By extracting at
low temperature and minimizing exposure to white light using amber vials can
minimize the oxidation of AA. In addition, purging the mobile phase used in HPLC
with inert gases such as helium can minimize oxidation by removing dissolved oxygen
in the solution (Russell, 2000). Vitamin C content in foods can decrease considerably
during storage and processing (Aurand et al., 1987), so storing of samples at -70 oC is
recommended if it is not been analyzed immediately (Washko et al., 1992).
3.8.4 Detection
There are many non-spectrophotometric methods available for the determination of
vitamin C in various samples including titrimetry, voltammetry, fluorometry,
potentiometry, kinetic-based chemiluminescence, flow-injection analyses and
chromatography. Except methods based on chromatography, other non-
spectrophotometric methods have numerous disadvantages including the lack of
sensitivity and/or selectivity, time of analysis can be long and often requires chemical
derivatization. In addition, they can suffer from matrix interferences and have limited
sample range (Arya et al., 2000).
132
The two most common detectors used with HPLC for vitamin C analysis are UV and
electrochemical detectors. UV detector for AA detection has maximum absorbance at
245 to 265 nm that is pH dependent (Table 3.1). For the detection of DHAA the
maximum absorbance is at 210 to 230 nm, but is susceptible to interferences by
naturally occurring food components, and has limited choice of reagents and solvents.
Electrochemical detector and be used to determine AA due to its reducing capacity, but
since DHAA is electrochemically inactive; it is therefore not used for the determination
of the latter. Although fluorescence detector can be used to determine AA and DHAA,
they need to be derivatized with o-phenylenediamine in order to produce a fluorescent
quinoxaline complex. However, chemical dramatization is often required to achieve the
sensitivity needed for detecting minute amounts of vitamin C present naturally in food
(Russell, 2000). By reducing DHAA to AA with homocysteine at pH 6.8, the total
vitamin C content of a sample can be determined (van Niekerk, 1982).
Anion-exchange columns with pellicular or microparticulate packing can be used to
determine ascorbic acid, but reversed phase columns are often preferred for its better
reproducibility and robustness (van Niekerk, 1982). The major drawback with using
reversed-phase column in HPLC is that AA is not readily retained therefore requires
the addition of a cationic ion pairing reagent such as tetrabutylammounium phosphate
(Arya et al., 2000), which can be very costly. However, the right ion-pairing reagents
can minimize food matrix interferences by altering the retention time of ascorbic acid
and other components in the sample (van Niekerk, 1982).
Chromatography conditions are important for the accurate determination of ascorbic
acid. For example, metal ions especially iron and copper can catalyse the oxidation of
ascorbic acid during chromatography therefore should be removed from the food
sample and mobile phase. Proper and continuous degassing of the mobile phase during
analysis is vital to minimize oxidation by oxygen. In addition, the mobile phase pH
should be adjusted to pH 5 or lower since vitamin C is only stable in acid solutions
(van Niekerk, 1982).

133
3.9 Effects of vitamin C supplementation on N-nitrosodimethylamine formation in
healthy human volunteers on a nitrate restricted diet with cured meat
3.9.1 Introduction
Since the discovery in 1956 that NOCs are carcinogenic to more than 40 animal
species, and human exposure to NOCs has been related to increased risk of gastro-
intestinal cancers. The endogenous nitrosation increases when precursors are ingested
in foods, which commonly contain these precursors. Under acidic conditions such as
the stomach, nitrite can react with secondary amines to form N-nitrosamines. Ascorbic
acid and ascorbate can inhibit nitrosation because they react faster than the amine with
the nitrosating agents. AA can reduce nitrous acid to nitric oxide that is not a
nitrosating agent, and is itself oxidized to dehydroascorbic acid. Whole strawberries,
garlic juice or kale juice decreased NDMA formation in humans fed an amine-rich diet
with nitrate by 70, 71 and 44 %, respectively. Increased dietary nitrate intake also
significantly increased salivary and urinary nitrate. It was suggested that phenolic
compounds derived from plants and fruits are potent nitrosation inhibitors. In addition,
strawberries contain the highest vitamin C amongst fruits at 99 mg/100g. Cysteine and
other sulfhydryl compounds and allyl sulfur compounds were thought to act as nitrite
scavengers (Chung et al., 2002).
NOCs are carcinogens almost exclusively found in foods and beverages containing
nitrite such as cured meat or those that have been exposed to nitrogen oxides, for
example beer. Nitrosamines are the most commonly occurring NOC encountered and
on the whole is shown to induce tumors in a variety of organs including liver, lung,
kidney, bladder pancreas, esophagus and tongue in animal experiments (Lijinsky,
1999).
The optimal pH for nitrosamine formation is at 3.4, which is the pKa for nitrous acid.
Hence the stomach is the most vulnerable organ that is exposed to nitrosamines for the
longest amount of time. However, other factors have been identified that interfere with
this reaction. For example, not all nitrosatable substances follow the same kinetic
pattern and that nitrosation is a multi-step process. A number of chemical compounds
can also inhibit, slow down or accelerate the reaction (Hansson et al. 1994). For
example, ascorbic acid can prevent nitrosation by converting nitrite precursors to NO
thus preventing or at least reducing the formation of NOCs including nitrosamine

134
(Hwang et al., 1994). In addition, foods and stomach contents are non-homogenous
thus partitioning of reactants between phases may pose further changes in the rate of
nitrosamine formation (Wogan and Tannenbaum, 1975).
The aim of this study was to determine the effects of 500 mg vitamin C supplement on
NDMA formation in vivo in subjects on a low nitrate and a cured meat diet.
3.9.2 Materials and methods
A modified HPLC method was used for the determination of ascorbic acid nitrate and
nitrite in human saliva and urine; a modified GC-MS method was used for the
determination of NDMA in cured meat and human urine based on Ventanas and Ruiz,
2006 and Grebel et al. 2006.
3.9.2.1 Vitamin C Analysis
Extraction from samples was based on dilution with milliQ water and then purification
using Sep-Pak C18 cartridge. All samples food, vitamin C tablets and urine were
extracted and purified using the same methods and then analyzed for ascorbic acid
using HPLC-UV.
3.9.2.3 Form of Vitamin C used in the experiment
Ten vitamin C tablets claimed to contain 500 mg equivalent of ascorbic acid were
crushed with a pestle and mortar and homogenized into powder form as a composite
sample. Five replicates were performed by diluting 0.25 g into 100 mL distilled water
followed by filtration using Sep-Pak C18 cartridge. Injection volume of 7.5 µL was then
injected into Waters HPLC-UV using autosampler and reversed-phase Gemini C18
column. Flow rate was set at 1.6 mL/min with mobile phase containing 0.22 % (w/v)
KH2PO4 and 0.68 % (w/v) cetrimide (hexadecyltrimethylammonium bromide) in
methanol and milliQ water (10:90). UV absorbance at 261 nm was used for detection.
Calibration curve using ascorbic acid standard diluted with milliQ water to give 0.1 to
0.5 % (w/v).
135
3.9.2.4 Vitamin C in urine
One mL of urine sample in duplicate was diluted to 10 mL with MilliQ water in a
volumetric flask. Samples were then centrifuged and filtered through Sep-Pak C18
cartridge before injection into Waters HPLC-UV as for vitamin C tablets analysis.
3.9.2.5 Nitrate and nitrite analysis
Sample extraction was based on hot water extraction followed by centrifugation and
ultra-filtration. Filtrate was then injected into Waters HPLC-UV for quantifying nitrate
and nitrite in meat, human saliva and urine as was developed in this study based on Sui
et al. (1983) (see Chapter 2).
3.9.2.6 Analysis of meat
Two packets of salami, ham and hotdogs at 100 g per packet were purchased from local
supermarkets (two different brands) and a composite sample of each type of meat was
prepared by homogenizing in a commercial blender. 25 g of each type of meat were
taken in duplicates and re-homogenized in 300 mL distilled water for one minute and
then made up to 500 mL in a volumetric flask.
Ten mL of the mixture of each sample was transferred into 100 mL volumetric flasks
and heated in a water bath at 75 oC for 15 min. On cooling the mixture was centrifuged
at 10,000 rpm for 10 min; and then the supernatant was removed for ultra-filtration.
Duplicate analysis was performed. The filtrate was also used for recovery studies by
adding known quantities of nitrate and nitrite standards.
3.9.2.7 Analysis of saliva
Saliva samples were collected in 50 ml specimen jars containing 50 mg solid NaOH.
They were stored in the freezer at -20 oC until analysis. One ml of saliva sample in
duplicates was diluted with distilled water to 10 ml in a volumetric flask and was then
filtered through conditioned Sep-Pak C18 syringe with duplicates. Similarly recovery
was performed by adding nitrate and nitrite standards to give 50 mg NO2 and 25 mg
NO3 ions per 10 ml. Nitrate water for nitrate conversion contained 350 mg of nitrate
ions.
136
3.9.2.8 Analysis of urine
Urine samples were collected in 1 L urine bottles containing 300 mg solid NaOH. They
were stored in the freezer until analysis. One ml of urine was diluted in 10 ml vol. flask
then ultra-filtered using Sep-Pak C18 cartridge with duplicates. Similarly recovery study
was performed by adding nitrate and nitrite standards to give 100 mg NO2 and 50 mg
NO3 ions per 10 ml.
3.9.2.9 Quantification of N-nitrosodimethylamine in meat and urine
Extraction of NDMA from meat and urine were based on headspace solid phase
microextraction method followed by quantification and confirmation using Agilant
GC-MS (5975 inert mass selective detector coupled with 7683B series injector and
processed using 6890N network GC system (Ventanas and Ruiz, 2006; Grebel et al.,
2006).
3.9.2.10 Meat
Samples were weighed and 150 g of each salami, ham and hotdog were homogenized
in a commercial blender for 3 min. Then 1.0 g of the sample was added along with 2.4
g of NaCl to 15 mL headspace vial and distilled water was added to make-up volume to
7 ml then sealed with Teflon-silicone septa. The solution was magnetically stirred and
was placed on a hot plate at 65 oC for 10 min. The SPME-CAR/PDMS fibre was then
inserted into the vapour phase above the liquid for 15 min and was then withdrawn into
the needle, which was subsequently introduced into the injection port of the GC-MS.
Desorption of the fibre coating was performed at 200 oC for 8 min.
3.9.2.11 Urine
Similar extraction method as in meat samples except 1 mL of urine sample was used in
the HS-SPME.
3.9.2.12 Human trial
This experiment was granted ethics approval by the University of New South Wales,
Human Research Ethics Committee (HREC) and the project number was 07129.
137
3.9.2.13 Recruitment of Volunteers:
Volunteers were recruited via posters placed on campus at the University of New South
Wales. Total of eighteen healthy volunteers were recruited. Subject consent to
participate in the study was obtained.
3.9.2.14 Experimental Protocol:
Day 1: Restricted diet (Figure 3.8): This diet consisted of no source of Vitamin C,
nitrate and nitrite. The background information and participant consent form (Appendix
A), details of the diet (Appendix B) and questionnaire form (Apendix C) are provided
in details in the appendices.
Day 2 and 3: A restricted diet similar to Day 1 was followed.

138
Figure 3.8 Human trial study protocol. All foods were prepared fresh and stored in
refrigerator at 4 oC and all biological samples were stored in containers containing
sodium hydroxide and stored in freezer at -20 oC until analysis.
Human Trials:
Nitrate reduction in the oral cavity; and the effects of Vitamin C on NDMA formation in vivo
DAY 1
Take home
3 x urine bottles 3 x saliva specimen jars
3 x meat samples 1 x nitrate water
1 x vitamin C tablet 1 x chewing gum
DAY 2
On Waking provide:
1 x urine sample (1) 1 x saliva sample (A)
DAY 3
On Waking:
1. Discard urine 2. Brush teeth
Tasks (morning):
1. Nitrate water rinse,
provide saliva (B) 2. Chew meat (A), provide
saliva (C) 3. Eat meat (B1)
3 hours fasting:
1 x urine sample (2)(or collect urine up to 3 hr
after meat consumption)
Return samples to me
Tasks (morning):
1. Eat meat (B2) 2. Take one (1) vitamin C
tablet provided
3 hours fasting:
1 x urine sample (3)(or collect urine up to 3 hr
from meat consumption)
Resume usual diet after providing urine sample.
Avoid foods (Appendix A):
Vitamin C rich e.g.
vegetables and fruits. Also avoid all cured meat except ones
given.

139
3.10 Results and discussion
Firstly, this section discussed the conversion of nitrate to nitrite in the oral cavity and
the effects of food matrix and gender on its conversion rate. Secondly, after a nitrate
and antioxidant restricted diet, healthy human volunteers were given cured meat
sandwich for determining NDMA formation in vivo from analyzing NDMA content
extracted in the urine. Finally, the effect of vitamin C supplement on NDMA formation
in vivo is discussed.
3.10.1 Results on nitrate conversion rate in the oral cavity
The mean nitrate conversion rate in the oral cavity of 18 healthy volunteers was
presented in Figure 3.9. The mean nitrate conversion rate in males was 17 % compared
to 24 % in females. The conversion was assumed to be due to nitrate-reducing bacteria
residing in the mouth, and the result (Figure 3.9) suggested that more nitrate-reducing
bacteria resided in the mouths of females than males. The differences may also be due
to other factors that may affect nitrate-reducing bacteria population such as age, race,
diet and daily variations.

140
Figure 3.9 The mean rate (%) of nitrate conversion to nitrite in the oral cavity of 18
healthy human volunteers. Water containing 350 mg of nitrate ions were rinsed in the
mouth for 30 s and then collected in 50 mL specimen jar for quantifying both nitrate
and nitrite ions using ion-paired RP-HPLC-UV. The mean nitrate conversion rate in the
oral cavity was derived by averaging individual conversion rate for males and females.
Based on one-tail t test, there was no significant difference (p ≥ 0.05) in the nitrate
conversion rate between the sexes. However, the error bars showed that there was a
larger range in male than in female
Table 3.2 Quantification parameters on the effects of saliva matrix on nitrate and nitrite
recoveries.
Parameters LOD (mg/L) LOQ (mg/L) Recovery (%) Linearity (R2) Nitrate 1.0 2.5 96.6 ± 6.68 0.99995 Nitrite 1.0 5.0 100.9 ± 7.77 0.99950 Six replicates.
From Table 3.2. The recoveries for nitrate in nitrite in saliva were excellent with little
interence in nitrate recovery resulting less than 100 % recovery when compared to
nitrite.

141
Table 3.3 Individual Mean nitrate and nitrite contents in the saliva of healthy human
volunteers after rinsing with 350 mg nitrate water as the control and chewing ten grams
of meat as the experiment.
Volunteer Fastinga (µg/ml) Experimentalb (µg/ml) number Nitrate Nitrite Nitrate Nitrite 1 9.1 ± 2.3 2.1 ± 0.4 9.4 ± 2.1 2.6 ± 0.1 2 7.8 ± 1.8 5.4 ± 1.1 8.5 ± 1.2 5.5 ± 0.6 3 15.6 ± 3.2 11.2 ± 2.3 14.9 ± 3.1 13.2 ± 1.4 4 26.3 ± 5.4 6.8 ± 1.6 26.4 ± 1.3 7.1 ± 2.1 5 12.7 ± 1.9 7.3 ± 1.8 15.2 ± 1.9 7.6 ± 1.1 6 5.5 ± 0.7 12.8 ± 0.9 4.5 ± 0.1 13.4 ± 0.4 7 11.8 ± 1.1 2.9 ± 0.2 12.0 ± 0.7 2.7 ± 0.3 8 23.2 ± 2.1 5.8 ± 2.1 23.8 ± 1.2 6.5 ± 0.8 9 17.0 ± 3.5 3.6 ± 0.5 15.3 ± 1.6 4.3 ± 1.0 10 9.5 ± 1.6 4.0 ± 0.4 8.2 ± 0.6 4.5 ± 0.2 11 16.4 ± 2.2 3.9 ± 0.2 16.6 ± 1.3 3.4 ± 1.1 12 8.8 ± 1.7 15.5 ± 2.1 8.5 ± 1.1 15.3 ± 1.7 13 24.1 ± 3.9 7.2 ± 1.3 26.1 ± 3.2 7.5 ± 0.9 14 13.5 ± 4.2 3.9 ± 0.8 13.4 ± 1.0 4.2 ± 0.3 15 20.0 ± 3.3 8.8 ± 1.1 19.9 ± 2.2 9.8 ± 0.6 16 14.6 ± 1.8 10.4 ± 2.2 15.2 ± 2.4 10.8 ± 1.3 17 26.7 ± 6.9 21.3 ± 3.9 28.8 ± 0.9 20.9 ± 1.4 18 21.7 ± 5.4 16.9 ± 2.7 15.2 ± 0.3 12.5 ± 2.6
aFasting-after 24h restricted diet, saliva sample was collected first on the second day
morning in a jar containing sodium hydroxide as a stabilizer after overnight fasting. bExperimental- chewed ten grams of meat (ham, salami or hotdog) for 30 secs. All
samples were mean of triplicates.
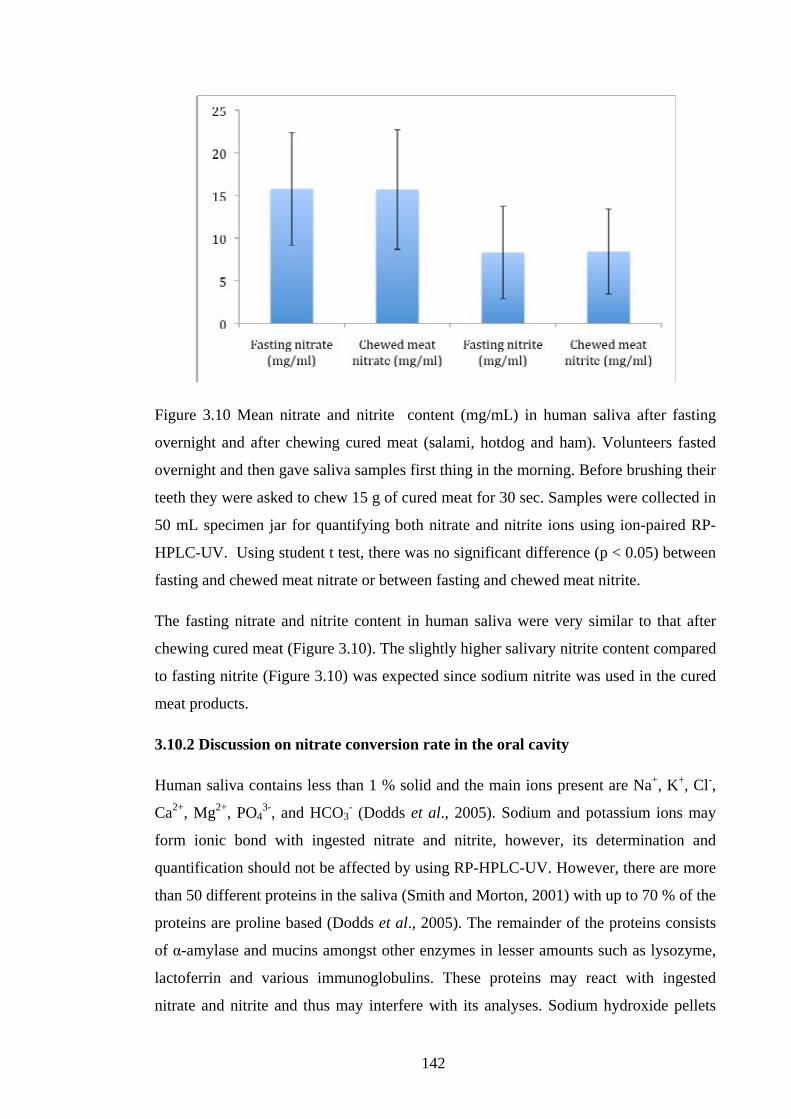
142
Figure 3.10 Mean nitrate and nitrite content (mg/mL) in human saliva after fasting
overnight and after chewing cured meat (salami, hotdog and ham). Volunteers fasted
overnight and then gave saliva samples first thing in the morning. Before brushing their
teeth they were asked to chew 15 g of cured meat for 30 sec. Samples were collected in
50 mL specimen jar for quantifying both nitrate and nitrite ions using ion-paired RP-
HPLC-UV. Using student t test, there was no significant difference (p < 0.05) between
fasting and chewed meat nitrate or between fasting and chewed meat nitrite.
The fasting nitrate and nitrite content in human saliva were very similar to that after
chewing cured meat (Figure 3.10). The slightly higher salivary nitrite content compared
to fasting nitrite (Figure 3.10) was expected since sodium nitrite was used in the cured
meat products.
3.10.2 Discussion on nitrate conversion rate in the oral cavity
Human saliva contains less than 1 % solid and the main ions present are Na+, K+, Cl-,
Ca2+, Mg2+, PO43-, and HCO3
- (Dodds et al., 2005). Sodium and potassium ions may
form ionic bond with ingested nitrate and nitrite, however, its determination and
quantification should not be affected by using RP-HPLC-UV. However, there are more
than 50 different proteins in the saliva (Smith and Morton, 2001) with up to 70 % of the
proteins are proline based (Dodds et al., 2005). The remainder of the proteins consists
of α-amylase and mucins amongst other enzymes in lesser amounts such as lysozyme,
lactoferrin and various immunoglobulins. These proteins may react with ingested
nitrate and nitrite and thus may interfere with its analyses. Sodium hydroxide pellets
143
were added to specimen jars in order to stabilize nitrate and nitrite during storage until
further analysis as suggested by Vermeer et al. (1998).
Furthermore, the pH of the saliva can vary from 6.2 to 8.0 depending on the rate of
flow. At rest the human saliva is slightly acidic whereas stimulated salivary secretion as
a result of eating increases the alkalinity of the saliva (Smith and Morton, 2001). Since
nitrite is unstable at acid pH, as in fasting, the nitrite content was expected to decrease
compared to control because chewing can result in a more alkaline condition and thus
stabilize nitrite (Table 3.3). On the other hand, vitamin C supplement given during the
experiment also decreased nitrite content (Table 3.3) possibly due to the increased
acidity in the mouth and caused nitrite to react to form other derivatives that were not
analyzed such as nitric oxide.
The concentration of human salivary nitrite, which is dependent on the dietary intake of
nitrate, varies from 0.05 to 1 mmol/L, Gastric nitrite concentrations are significantly
lower than that of salivary nitrite because the former is converted to nitrous acid at
acidic pH followed by the formation of nitric oxide and nitrogen dioxide that escapes
into the gaseous phase (Dykhuizen et al., 1998).
Nitrate and nitrite concentrations in the saliva were not significantly related to those in
the gastric juice as demonstrated by Dallinga et al. (1998). In addition, they concluded
that there was no association with pH, nitrosamines content, age and sex of the
subjects. However, they established a positive correlation between gastric nitrite
contents and pH, whereby higher gastric pH resulted in higher gastric nitrite content
due to enhanced bacterial growth and thus higher nitrate to nitrite conversion.
It was suggested that the formation of salivary nitrite in symbiosis with facultative
anaerobic bacteria in the pharynx enhances the antimicrobial effects of gastric juice in
humans by the formation of free radical nitrogen species that have bactericidal effects
(Dykhuizen et al., 1998). For example, it was demonstrated in vitro that at pH 2 with 1
mM nitrite resulted in the complete kill of H. pylori within 30 minutes of exposure.
Furthermore, the antimicrobial effect of nitrite at pH 2 against H. pylori was dose
dependent and complete kill of the organism occurred at ≥ 500 µmol/L. It was
concluded that the antimicrobial effect was not due to nitrite per se, but due to the
generation of reactive oxides of nitrogen (Dykhuizen et al., 1998). The data presented
was limited to in vitro conditions, thus it was suggested that the effect of salivary nitrite
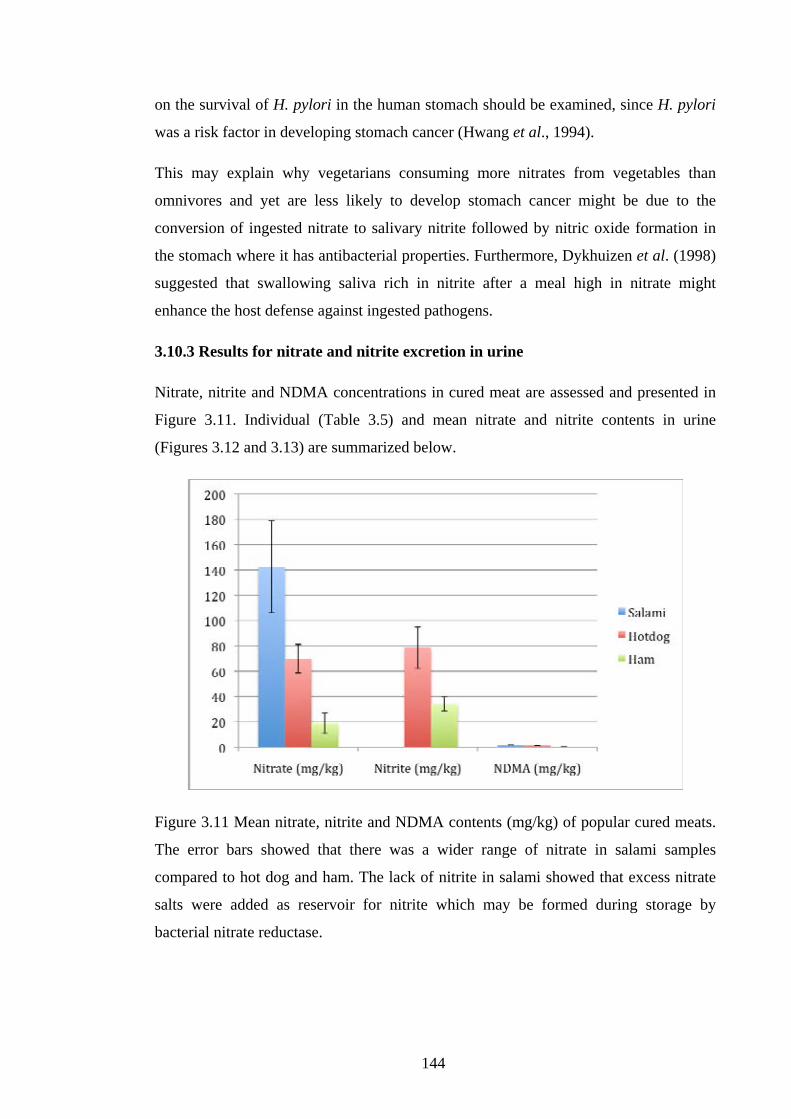
144
on the survival of H. pylori in the human stomach should be examined, since H. pylori
was a risk factor in developing stomach cancer (Hwang et al., 1994).
This may explain why vegetarians consuming more nitrates from vegetables than
omnivores and yet are less likely to develop stomach cancer might be due to the
conversion of ingested nitrate to salivary nitrite followed by nitric oxide formation in
the stomach where it has antibacterial properties. Furthermore, Dykhuizen et al. (1998)
suggested that swallowing saliva rich in nitrite after a meal high in nitrate might
enhance the host defense against ingested pathogens.
3.10.3 Results for nitrate and nitrite excretion in urine
Nitrate, nitrite and NDMA concentrations in cured meat are assessed and presented in
Figure 3.11. Individual (Table 3.5) and mean nitrate and nitrite contents in urine
(Figures 3.12 and 3.13) are summarized below.
Figure 3.11 Mean nitrate, nitrite and NDMA contents (mg/kg) of popular cured meats.
The error bars showed that there was a wider range of nitrate in salami samples
compared to hot dog and ham. The lack of nitrite in salami showed that excess nitrate
salts were added as reservoir for nitrite which may be formed during storage by
bacterial nitrate reductase.

145
Table 3.4 Quantification parameters on the effects of urine matrix on nitrate and nitrite
recoveries.
Parameters LOD (mg/L) LOQ (mg/L) Recovery (%) Linearity (R2) Nitrate 1.0 2.5 92.8 ± 9.69 0.99997 Nitrite 1.0 5.0 92.9 ± 4.04 0.99400 Triplicates.
From Table 3.4, urine matrix interfered with nitrate and nitrite recoveries but was still
considered reasonable at almost 93 % for both anions.
Table 3.5 Individual nitrate and nitrite contents in the urine of healthy human
volunteers before and after treatments.
Volunteer Fastinga (mg/l) Control (mg/l) Experimentc (mg/l) number Nitrate Nitrite Nitrate Nitrite Nitrate Nitrite 1 15.3 ± 2.1 19.0 ± 2.3 0.6 ± 0.2 2.6 ± 0.3 1.0 ± 0.2 11.0 ± 0.6 2 8.1 ± 0.6 7.5 ± 1.1 30.5 ± 3.6 8.2 ± 0.5 41.6 ± 5.3 7.1 ± 0.3 3 2.1 ± 0.3 9.7 ± 0.9 11.2 ± 1.2 10.2 ± 0.6 7.2 ± 1.2 0.4 ± 0.1 4 3.0 ± 0.5 11.3 ± 0.5 6.5 ± 0.7 9.3 ± 1.0 7.7 ± 1.1 14.4 ± 1.3 5 3.2 ± 0.4 13.5 ± 1.7 4.5 ± 0.4 3.8 ± 0.1 2.0 ± 0.1 13.7 ± 0.9 6 8.6 ± 1.6 3.4 ± 0.3 4.4 ± 0.4 6.0 ± 0.2 11.0 ± 0.6 26.3 ± 2.7 7 1.4 ± 0.2 8.2 ± 1.2 3.8 ± 0.6 12.9 ± 0.9 2.3 ± 0.4 19.3 ± 1.8 8 61.7 ± 7.3 25.8 ± 4.1 54.8 ± 1.9 36.3 ± 1.3 0.8 ± 0.1 1.4 ± 0.6 9 3.5 ± 1.1 15.7 ± 1.8 4.6 ± 0.8 14.1 ± 1.1 9.2 ± 1.3 28.6 ± 2.3 10 38.4 ± 3.1 21.2 ± 2.1 12.4 ± 1.7 6.9 ± 0.6 25.5 ± 2.3 11.4 ± 1.6 11 11.9 ± 0.9 13.4 ± 1.6 8.1 ± 0.6 14.1 ± 1.3 3.9 ± 0.2 0.9 ± 0.1 12 7.5 ± 0.8 4.9 ± 0.5 20.9 ± 1.6 13.7 ± 0.9 28.2 ± 1.5 19.3 ± 2.7 13 72.8 ± 6.4 31.1 ± 3.4 37.8 ± 3.8 9.2 ± 0.8 15.1 ± 2.1 21.8 ± 1.8 14 29.0 ± 2.1 18.2 ± 2.3 9.9 ± 1.2 14.2 ± 1.0 38.6 ± 1.9 19.2 ± 1.6 15 37.1 ± 3.9 21.7 ± 2.8 13.5 ± 2.1 19.4 ± 2.2 9.5 ± 1.1 3.9 ± 0.4 16 6.9 ± 0.3 12.6 ± 0.6 15.6 ± 2.3 1.8 ± 0.3 22.3 ± 1.3 12.1 ± 0.7 17 12.3 ± 1.1 7.1 ± 0.3 23.8 ± 3.0 16.3 ± 0.7 16.8 ± 0.8 27.9 ± 1.0 18 36.1 ± 4.4 10.3 ± 0.3 15.3 ± 0.9 18.6 ± 1.6 21.3 ± 3.5 8.8 ± 0.3
aFasting- after 24h restricted diet urine sample was collected first in the morning on the
second day in a 2L urine bottle containing sodium hydroxide as a stabilizer after
overnight fasting. bControl- on the second day urine was also collected 3 hrs after
eating a cured meat sandwich. cExperimental- on the third day after overnight fasting
urine was collected 3 hrs after eating another cured meat sandwich with 500 mg
vitamin C tablet. a-c mean of duplicates.
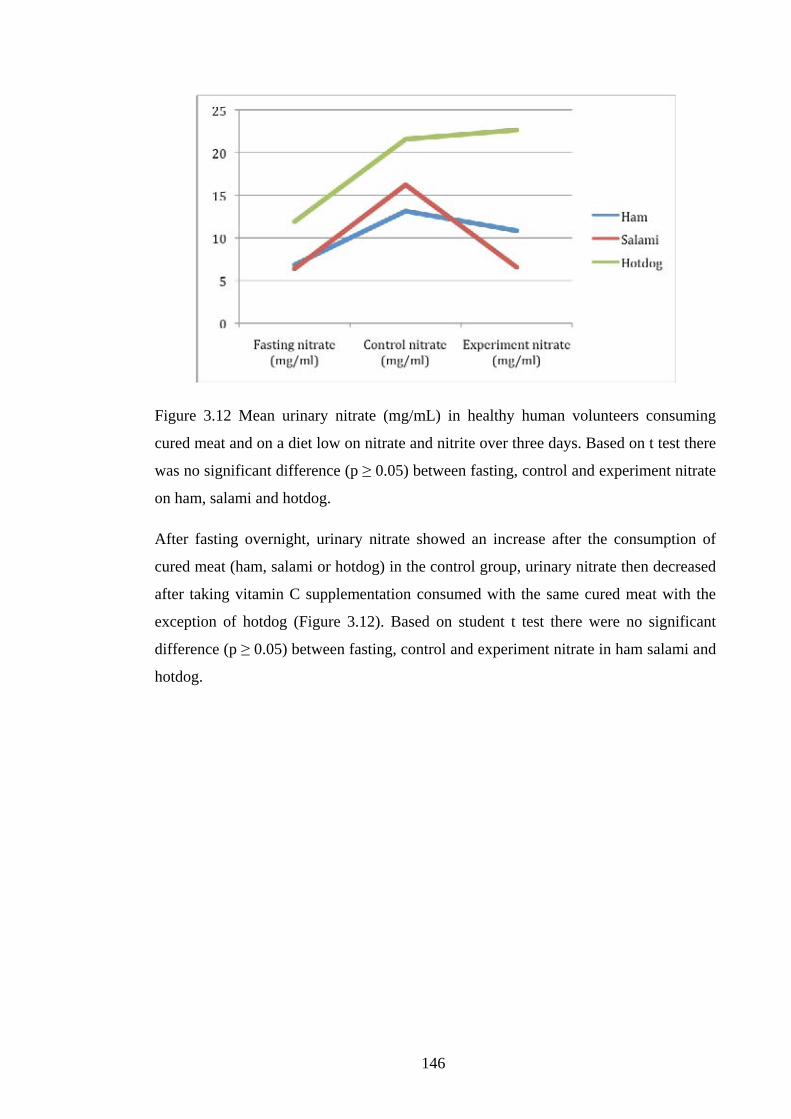
146
Figure 3.12 Mean urinary nitrate (mg/mL) in healthy human volunteers consuming
cured meat and on a diet low on nitrate and nitrite over three days. Based on t test there
was no significant difference (p ≥ 0.05) between fasting, control and experiment nitrate
on ham, salami and hotdog.
After fasting overnight, urinary nitrate showed an increase after the consumption of
cured meat (ham, salami or hotdog) in the control group, urinary nitrate then decreased
after taking vitamin C supplementation consumed with the same cured meat with the
exception of hotdog (Figure 3.12). Based on student t test there were no significant
difference (p ≥ 0.05) between fasting, control and experiment nitrate in ham salami and
hotdog.

147
Figure 3.13 Mean urinary nitrite in healthy human volunteers consuming cured meat
(mg/L) and on a diet low on nitrate and nitrite over three days. Based on student t test
there were no significant difference (p ≥ 0.05) between fasting, control and experiment
nitrite in ham, salami and hotdog.
After fasting overnight, a decrease in urinary nitrite was shown after consuming cured
meat (ham, salami or hotdog) with the exception of volunteers consuming salami
(Figure 3.13). After consuming the same cured meat with vitamin C supplementation,
the urinary nitrite increased with the exception of volunteers consuming salami (Figure
3.13).
3.10.4 Discussion on nitrate and nitrite concentrations in the urine
It was demonstrated by Pannala et al. (2003) that high nitrate intake from food lead to a
significant increase in nitrate and nitrite concentrations in the urine and saliva. They
also demonstrated that the maximum urinary nitrate excretion occurred 4 to 6 hours
after the consumption of high-nitrate meal. However, in this experiment a low nitrate
and nitrite diet (Appendix A) was used thus most nitrate and nitrite excretion resulted
from that of cured meat and endogenous formation. In healthy humans on a diet low in
nitrite and nitrate, approximately 50 % of the urine nitrate originates from the in vivo
synthesis of NO from L-arginine and gastrointestinal nitrogen oxides (Jobgen et al.,
2007). In addition, Pannala et al. (2003) showed that the absorption of nitrate from
organic nitrate source such as food was slower than from inorganic nitrate salt. It was
proposed that organic dietary sources must undergo the additional extraction step and

148
hence takes longer to be absorbed. Sodium hydroxide pellets were added to urine
bottles in order to stabilize nitrate and nitrite during storage until further analysis as
suggested by Vermeer et al. (1998).
The decrease in urinary nitrite after consuming cured meat could be attributed to the
reactivity of nitrite in the stomach as the pH in the stomach increased as a result of food
and may have facilitated the conversion to NO, nitrous acid or enabled nitrosation
(Figure 3.13). However, after consuming the same cured meat with vitamin C
supplementation, the urinary nitrite increased with the exception of volunteers
consuming salami (Figure 3.13). Urinary nitrite increased after consuming vitamin C
supplement since ascorbic acid is known to compete with nitrite for nitrosatable
compounds in the stomach
Nitrite can also be lost from the gastric juice by either oxidation to nitrate and/or by
forming volatile species such as nitric oxide and nitrogen dioxide that escapes through
the mouth and nose (Licht et al., 1988). Therefore only nitrite that remained in the body
was excreted as urine. It was also demonstrated in vitro and in rats that nitric oxide can
be generated by the anaerobic gut flora in the presence of nitrate or nitrite (Sobko et al.,
2005). This may decrease the amount of nitrate and nitrite available to participate in
nitrosation.
Air and soil quality is affected by climate change and other human impact, which
explains the wide range of levels of nitrosamines of individual game species
(Rywotycki, 2003). The NDMA content in cured meat was very low but contained
nitrosatable amines and nitrite (Figure 3.11). Using GC-TEA, the mean NDMA in ham
and sausage from France was 0.14 and 1.5 µg/kg, respectively (Mavelle et al., 1991).
Using GC-MS, the mean NDMA in ham and sausage from China was 0.8 and 0.9
µg/kg, respectively (Song and Hu, 1988). Based on GC-MS method, Yurchenko and
Mölder (2005) found the mean NDMA content in Estonian cured meats were: salami
0.84 µg/kg, frankfurters 0.16 µg/kg, ham 2.08 µg/kg and cooked sausage 1.3 µg/kg.
Different dietary sources of NOCs can be contributed to cultural differences in dietary
traditions and practices. For examples, cured meats, especially bacon, are the major
sources of nitrosamines in Western diets. On the other hand, fish and fish products
contribute significant dietary nitrosamines in the Oriental diet. Cured meat is known to

149
contain preformed nitrosamine and nitrite and seafood contains plenty of amines such
as methylamine, ethylamine, dimethylamine and diethylamine (Lin, 1990).
Sample preparation is used to increase the accuracy and precision of the analysis and
consists of three major steps: sampling, homogenization and extraction. Since food
such as cured meats consists of a range of compounds that may interact to form more
complex compounds. This creates an inhomogeneous mixture of number of chemical
substances, which makes sample preparation of food a crucial step before instrumental
analysis. Unfortunately each sample preparation step introduces inherent errors that are
irreversible and cumulative, especially the sampling step that is often the greatest
source of error in chemical analysis (Lichon, 1996).
Homogenization is used to reduce particle size and for mixing. This is essential for
increasing the number of particles in a test portion to increase the probability of
sampling parts of the original (Lichon, 1996). The particle size is therefore important to
food analyst because the size of surface area may influence the accuracy of the
analytical procedure by the degree of exposure of the sample to reagents and other
experimental conditions. Hence, recovery data may be inconsistent due to the particle
size effects. Spiking just prior to HPLC analysis usually gives favorable recoveries
since the only variable is HPLC separation and detection. However, spiking at the
beginning of the extraction method gives a better indication of loss or degradation of
the analytes during the extraction procedure as well as during HPLC separation and
quantification (Russell, 2000).
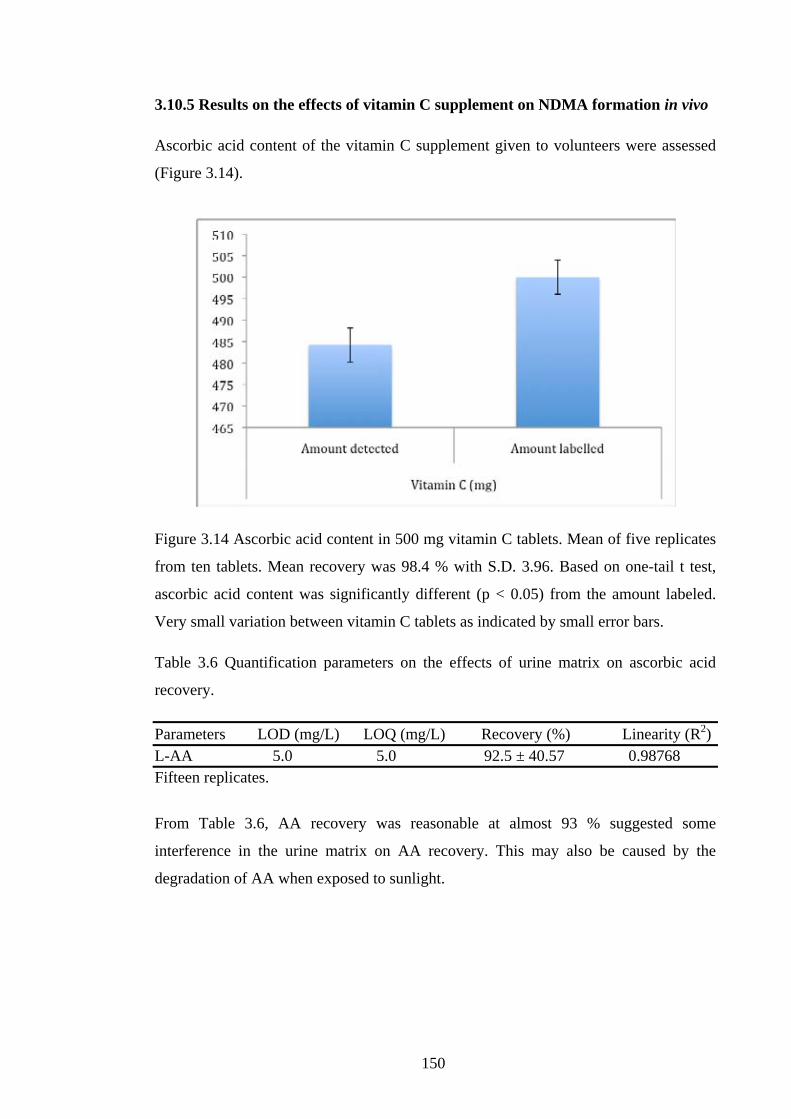
150
3.10.5 Results on the effects of vitamin C supplement on NDMA formation in vivo
Ascorbic acid content of the vitamin C supplement given to volunteers were assessed
(Figure 3.14).
Figure 3.14 Ascorbic acid content in 500 mg vitamin C tablets. Mean of five replicates
from ten tablets. Mean recovery was 98.4 % with S.D. 3.96. Based on one-tail t test,
ascorbic acid content was significantly different (p < 0.05) from the amount labeled.
Very small variation between vitamin C tablets as indicated by small error bars.
Table 3.6 Quantification parameters on the effects of urine matrix on ascorbic acid
recovery.
Parameters LOD (mg/L) LOQ (mg/L) Recovery (%) Linearity (R2) L-AA 5.0 5.0 92.5 ± 40.57 0.98768 Fifteen replicates.
From Table 3.6, AA recovery was reasonable at almost 93 % suggested some
interference in the urine matrix on AA recovery. This may also be caused by the
degradation of AA when exposed to sunlight.
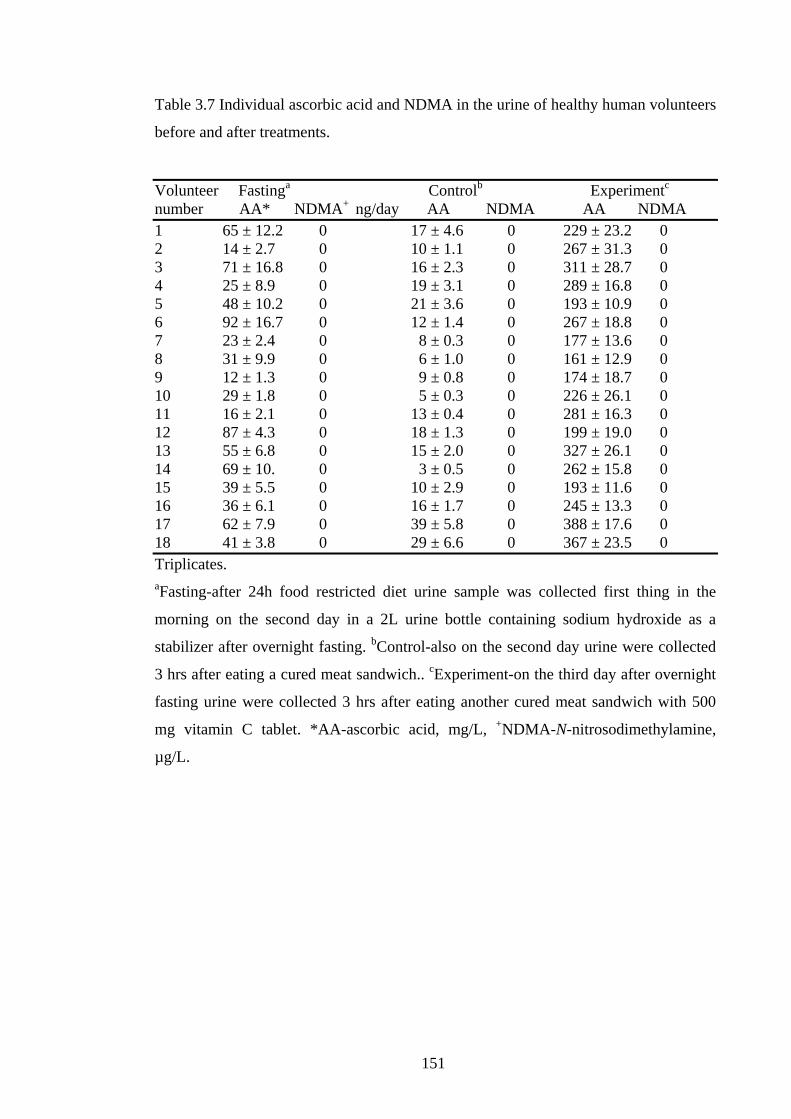
151
Table 3.7 Individual ascorbic acid and NDMA in the urine of healthy human volunteers
before and after treatments.
Volunteer Fastinga Controlb Experimentc number AA* NDMA+ ng/day AA NDMA AA NDMA 1 65 ± 12.2 0 17 ± 4.6 0 229 ± 23.2 0 2 14 ± 2.7 0 10 ± 1.1 0 267 ± 31.3 0 3 71 ± 16.8 0 16 ± 2.3 0 311 ± 28.7 0 4 25 ± 8.9 0 19 ± 3.1 0 289 ± 16.8 0 5 48 ± 10.2 0 21 ± 3.6 0 193 ± 10.9 0 6 92 ± 16.7 0 12 ± 1.4 0 267 ± 18.8 0 7 23 ± 2.4 0 8 ± 0.3 0 177 ± 13.6 0 8 31 ± 9.9 0 6 ± 1.0 0 161 ± 12.9 0 9 12 ± 1.3 0 9 ± 0.8 0 174 ± 18.7 0 10 29 ± 1.8 0 5 ± 0.3 0 226 ± 26.1 0 11 16 ± 2.1 0 13 ± 0.4 0 281 ± 16.3 0 12 87 ± 4.3 0 18 ± 1.3 0 199 ± 19.0 0 13 55 ± 6.8 0 15 ± 2.0 0 327 ± 26.1 0 14 69 ± 10. 0 3 ± 0.5 0 262 ± 15.8 0 15 39 ± 5.5 0 10 ± 2.9 0 193 ± 11.6 0 16 36 ± 6.1 0 16 ± 1.7 0 245 ± 13.3 0 17 62 ± 7.9 0 39 ± 5.8 0 388 ± 17.6 0 18 41 ± 3.8 0 29 ± 6.6 0 367 ± 23.5 0 Triplicates. aFasting-after 24h food restricted diet urine sample was collected first thing in the
morning on the second day in a 2L urine bottle containing sodium hydroxide as a
stabilizer after overnight fasting. bControl-also on the second day urine were collected
3 hrs after eating a cured meat sandwich.. cExperiment-on the third day after overnight
fasting urine were collected 3 hrs after eating another cured meat sandwich with 500
mg vitamin C tablet. *AA-ascorbic acid, mg/L, +NDMA-N-nitrosodimethylamine,
µg/L.

152
Figure 3.15 Effects of 500 mg vitamin C supplement on NDMA formation in healthy
human volunteers consuming different types of cured meat and on a nitrate, nitrite and
antioxidant restricited diet. For baseline comparison, volunteers fasted overnight had
less than 50 mg/L AA in their urine and no NDMA. For control, volunteers were not
given vitamin C supplement and their AA levels dropped to below 25 mg/L and had no
NDMA after consuming a cured meat sandwich. The next day volunteers were given
vitamin C supplment with a cured meat sandwich and had spiked AA levels but still
had no NDMA in their urine. Based on one-way ANOVA ascorbic acid concentrations
had no effect on NDMA formation in vivo.
3.10.6 Discusssion on the effects of vitamin C supplement on NDMA formation in
vivo
Nitrosamines can be measured in human blood, urine and fecal matter after the
consumption of nitrite or nitrate containing foods such as bacon and spinach, which
demonstrated the in vivo production of NOCs in humans (Wagner and Tannenbaum,
1985). Once nitrite is swallowed, it is reduced to NO by ascorbic acid normally present
in the stomach of healthy individuals. The NO is then absorbed through the mucosa,
and the ascorbic acid is oxidized to dehydroascorbic acid. However, in the absence of
ascorbic acid, nitrosating compounds such as nitrite can nitrosate precursors to form
NOC (Mowat and McColl, 2001).
The NDMA content in human urine was measured before cured meat consumption as
baseline level after overnight fasting and a nitrate and antioxidant restricted diet

153
(Appendix A). The NDMA was then measured again 3 h after cured meat consumption.
The following day (3), each volunteer was asked to eat the same cured meat with the
addition to 500 mg vitamin C tablet. Similarly, after 3 h the urine was collected for
NDMA extracted using HS-SPME followed by quantification and confirmation with
GC-MS.
It is important to estimate body’s ascorbic acid level since elevated nitrite-to-ascorbic
acid ratio increases the formation of NOC in vivo and hence may increase the risks of
developing gastric cancer (Mowat and McColl, 2001). Fasting ascorbic acid content
was less than 50 mg/L (Figure 3.15) after antioxidant restricted diet and fasting
overnight. No NDMA was found in the urine after nitrate and nitrite restricted diet
(Table 3.7). Urinary ascorbic acid further dropped on day 2 as a result of antioxidant
restricted diet (Table 3.7). No NDMA was formed 3 h after the consumption of cured
meat with or without vitamin C supplementation (Figure 3.15). This suggested that on a
diet low in nitrate, nitrite and antioxidant, one serving of cured meat was not sufficient
on its own to produce detectable NDMA in vivo. However, if volunteers were on a
higher or unrestricted nitrate and nitrite diet, some NDMA would be expected to form
and be present in the urine. For example, it was shown that vitamin C in strawberries
and garlic juice was effective in reducing NDMA formation in a typical Korean diet
rich in amine and nitrate in stimulated salivary and gastric conditions (Choi et al.,
2006). Vitamin C absorption rate varies depending on the concentration ingested and
the vitamin C status. At 100 mg 80-95 % is absorbed, whereas at 1 g the absorption rate
falls to 50 %, at 6 g to 25 % and at 12 g to 16 % (Bender, 2005). This may affect the
true available vitamin C on NDMA inhibition in subjects (Figure 3.15)
Dallinga et al. (1998) measured the mean total volatile nitrosamines in the gastric juice
of patients and were found to be 4.84 nmol/L and ranged between 0 and 17.7 nmol/L.
The main nitrosamines found were NDEA at 3.1 nmol/L (approximately 70 % of the
total volatile nitrosamnines found) followed by NDMA and NPYR at 0.90 and 0.38
nmol/L, respectively. The high levels found in their subjects do not reflect the major
populations since their subjects already had various conditions of the gastrointestinal
tract.
Since ascorbic acid is a free radical scavenger, it is suggested that it may prevent
carcinogenesis by inhibiting nitrosation from occurring. In addition, it may also inhibit
154
carcinogens by blocking the conversion of precursors into carcinogens and
carcinogenic metabolites (Radcliffe et al., 2003). In this experiment, low nitrate and
nitrite intake did not result in the formation of NDMA with or without vitamin C
supplementation (Fig. 3.15). Hence nitrosation inhibition by vitamin C was not
demonstrated. However, this experiment did not look at other volatile and non-volatile
nitrosamines and nitrosamides, respectively. Both ascorbic acid and ascorbate ion, or
ASC, can indirectly inhibit nitrosation by competing for nitrosating agents in the
stomach formed from reactions with nitrite and gastric juice contents. Subsequently, for
each mole of ascorbic acid and ascorbate ion oxidized, which is an irreversible process,
two moles of non-nitrosating nitric oxide is produced from nitrite. Although this
reaction is fast, in the presence of oxygen, NO may be reconverted to nitrosating
agents, thus counteracting the inhibition effects of ascorbic acid and ascorbate ion
(Licht et al., 1988).
Thus ascorbate and erythorbate are added in cured meat to inhibit formation of
nitrosamines (Cassens, 1995), as well as inhibiting nitrosation from occurring within
the stomach from residual nitrite (Walters, 1980). In the United States, reducers such as
ascorbate or erythrobates are often added in cured meat to promote the oxidation of
nitrous acid to nitric acid, which reduces residual nitrite and retards the formation of N-
nitrosamines (Pennington, 1998). The maximum addition of ascorbate in the United
States was 550 mg/kg, of which 40 % or 209 mg/kg was detected in cured meat
samples tested (Cassens, 1997).
As the enterosalivary recirculation of nitrate occurs, a constant supply of salivary nitrite
to the stomach is ensured. Since ingested nitrite continuously reacts in vivo with gastric
juice contents including ascorbic acid, its level was usually undetectable in the acid
stomach (Mowat and McColl, 2001). However, once anti-secretary agents are released
in the stomach, the pH increases to neutral, where nitrite remains stable and do not
react with ascorbic acid, hence accumulates in the stomach and is excreted mainly in
the urine (Mowat and McColl, 2001).
Acidification of urine, for example by taking vitamin C, has been used to protect
against lower urinary tract infection, and it was suggested by Lundberg et al., (1997)
that nitrite-producing bacteria induce their own death by supplying the substrate for the
production of bacteriostatic NO under acidic conditions. In addition, infected urine may

155
contain large amounts of nitrite as a result of bacterial nitrate reductase activity. Thus
in any human trials for measuring NO level, the health status of the subjects must be
carefully evaluated in order to accurately interpret the findings related to possible
oxidative stress and nitrosation potential as suggested by Junghans et al. (1999).
At acid pH, nitrite is converted to nitrous acid (pKa 3.2) and then to nitric oxide and
nitrogen dioxide radicals. It is suggested that these radicals are harmful to bacteria but
the conversion requires an acid environment (Radcliffe et al., 2003). Radcliffe et al.
(2003) demonstrated that ascorbic acid could increase the effectiveness of sodium
nitrite (200 mM) in reducing the viability of Streptococcus mutans by reducing the pH
of the system thus increasing the conversion of nitrite to its free radical nitrogen
species. Since ascorbic acid is not a toxic substance, up to 2000 mg of ascorbic acid
showed no adverse effects, hence ascorbic acid may be safely added to food with high
nitrite content such as cured meat, to increase the effectiveness of nitrite and possibly
inhibit nitrosation reactions.
Österdahl (1988) estimated the average dietary intake of volatile nitrosamines in
Sweden populations was 0.29 μg per person, and over 80 % of that came from meat
and malt products, which was highest in fried bacon and pork. Beer and other malt
beverages contributed 14 % of the dietary intake of volatile N-nitrosamines in Sweden,
with dried products, cheese and smoked with represent 7 %. Österdahl (1988) reported
that NDMA was the most common volatile N-nitrosamine in foods such as cocoa and
chocolate products (up to 1.2 μg /kg), tea (up to1.2 μg /kg), coffee (0.1-0.8 μg /kg), and
cereal products (0.2-0.9 μg /kg). In West Germany, Tricker et al. (1991) estimated the
total volatile nitrosamine intake from food for men and women were 0.3 and 0.2
μg/day, respectively. Furthermore, 31 % of the daily intake of NDMA for men came
from the consumption of beer, thus represented a significant source of dietary volatile
nitrosamine.
Yamamoto et al., (1984) estimated the average daily intake of volatile nitrosamines in
Japanese population was 0.5 µg per person and 88 % of it came from fish products,
which were significant part of their diet. The estimation was based on food
consumption data and their analysis of volatile nitrosamine content of commonly eaten
food including fresh fish, fish products, meat, cheese, and beer.
156
Different countries and regions within a country may have a distinctive and different
dietary practice compared to other countries and regions, therefore the major food
groups contributing to dietary NDMA intake will vary depending on their culture and
hence dietary lifestyles.
In West Germany, the mean daily intake of volatile nitrosamines between 1989 and
1990 were: 0.28 and 0.17 µg NDMA/day for men and women, respectively. A third of
the dietary NDMA for men resulted from the consumption of beer. For NPYR and
NPIP, the averaged daily intake for both men and women was the same at 0.011 and
0.015 µg NPYR and NPIP/day, respectively (Tricker et al., 1991).
According to Tricker et al. (1991), the NDMA range found in sausage products was 0.5
to 1.8 µg/kg with a mean of 0.84 µg/kg, and for bacon and ham it ranged from 0.5 to
1.6 µg/kg with a mean of 1.01 µg/kg. This studied showed that the NDMA in ham,
hotdog and salami were 0.42, 1.43 1.83 µg/kg, respectively (Figure 18), which were
slightly outside their range with a mean of 1.23 µg/kg. NDMA was highest in fresh fish
and fish products with a range of 0.5 to 8.0µg/kg and a mean of 2.18 µg/kg. Despite
this, meat and meat products contributed more than double the daily dietary intake of
NDMA for both men and women compared to fish products. There was no detectable
NDMA in fresh vegetables and only negligible levels were found in preserved
vegetables. Other volatile nitrosamines including NPIP and NPYR were not present in
vegetables and only negligible levels were found in sausage products (Tricker et al.,
1991).
Tricker et al. (1991) compiled the mean daily dietary intake of NDMA from different
countries ranged from 0.08 to 1.10 µg/day with a mean of 0.5 µg/day based on
published dietary surveys between 1978 and 1990. It was concluded that beer, cured
meat and fish products contributed to most of their dietary NDMA intake.
The mean daily intake of NDMA from French foods and beverages between 1987 and
1992 was 0.19 µg/day, and one-third of this came from the consumption of alcoholic
beverages. Vegetables represented 22 % of NDMA intake followed by meat and meat
products at 12.5 % (Biaudet et al., 1994).
Mitacek et al. (1999) concluded that based on case-control studies in Thai population
that exposure to exogenous and possible endogenous nitrosamines in food or tobacco

157
may contribute to the development of liver cancer. With over 1800 food samples tested,
relatively high levels of NDMA, NPIP and NPYR were detected in traditional Thai
foods such as fermented, salted and dried fish. Levels of these volatile nitrosamines
ranged from trace amount to 146 µg/kg.
NDMA was the most common occurring volatile nitrosamine in Chinese foods with up
to 6 µg/kg in beer, up to 7.4 µg/kg in meat products, and up to 131.5 µg/kg in some
seafood. Other volatile nitrosamines detected were NDEA, NPIP and NPYR (Song and
Hu, 1988).
Mavelle et al. (1991) measured NDMA in French food in 1987-88 and found that 89 %
of samples tested contained NDMA with a maximum level of 16 µg/kg. Stone fruit
spirits were shown to contain the highest level of NDMA followed by nitrite-cured
meats, smoked meats and smoked fishes. Beer contained a mean NDMA level of 0.28
µg/kg, which was lower than in the past due to modification of the brewing processes.
Other volatile nitrosamines found were rare and was below 0.5 µg/kg.
It was demonstrated that NOC concentration and stomach pH increased significantly
with age, and there was a positive correlation between pH and NOC concentration, and
between pH and an increase concentration of nitrites. In addition, it was demonstrated
that the population of nitrate reductase-positive microorganisms rose as NOC and
nitrite levels increased (Reed et al., 1981). The rise in gastric pH with age maybe due
to decreased gastric acid secretion as a result of natural aging process. This rise in pH
then allows microorganisms to survive in the stomach-converting nitrate present in the
stomach to nitrite. Since nitrite is more stable at higher pH, this may allow more
nitrosation to occur thus resulting in higher N-nitrosamine levels with increasing age.
N-nitrosamine levels ranged from 0.01 to 40 µmol/L in healthy volunteers and patients
aged between 18 and 87 years. A significant rise in N-nitrosamine concentrations and
gastric pH was demonstrated with increasing age. Furthermore, N-nitrosamine levels
were significantly higher in males than females, taking other factors into account.
Cigarette smoking had no significant effect on either N-nitrosamine or nitrite
concentrations (Reed et al., 1981).
Contrary to other findings, Risch et al. (1985) found that vitamin C intake was only
slightly protective against gastric cancer, and that vitamin E had not effects at all.

158
Similarly, Kato et al. (1992) revealed an adverse effect of fruit consumption, which
may be due to the lack of detailed information on the types of fruits consumed in the
rural Japanese population surveyed.
The addition of ascorbic acid at a concentration of 2,000 mg/kg to cured meat did not
reduce the antimicrobial effect of sodium nitrite (Walters, 1980). However, 500 mg/kg
ascorbic acid was shown to be more efficient at reducing the mutagenicity of NOC by
61 % than at 2,000 mg/kg ascorbic acid at only 54 % (Pourazrang et al., 2002).
Data is not available for the formation of NDMA in vivo with a diet consisting of a
mixture of precursors and inhibitors. However, Krul et al. (2004) demonstrated in a
dynamic in vitro gastrointestinal model under human physiological conditions that
orange juice and tea were effective at reducing the amount of NDMA formed under
gastric condition. Furthermore, this model may be used to evaluate human cancer risk
in foods containing nitrate and nitrite.
Xu and Read (1993) had demonstrated that significantly higher concentration of NOC
was produced at lower pH ranges of 1.1 to 3.0 and at higher pH ranges of 6.0 to 8.4
compared to a pH range of 3.0 to 6.0. They had also shown that nitrite concentration is
closely related to intragastric pH, such that at pH < 5.0, the nitrite concentrations are
very low. It was suggested that at normal gastric pH the nitrite content is very low
because nitrite has a very short half-life (less than 10 minutes), and that it is very
reactive at low pH with high absorption rate.
Although ascorbic acid shown little reactivity at neutral pH, as in the stomach of
achlorhydric patients, it was shown to be a potent inhibitor of bacterial mediated N-
nitrosamine formation by Pseudomonas aeruginosa, which is capable of rapid rates of
N-nitrosation (Mackerness et al., 1989). Furthermore, by using in vitro studies of
bacterial suspension on nitrite, Mackerness et al. (1989) had confirmed the
effectiveness of ascorbate in inhibiting bacterial N-nitrosation by competing with amine
for the nitrosating agents derived from the action of bacteria.
Mirvish et al. (1972) demonstrated that ascorbate inhibits N-nitrosation by competing
for available nitrite in the form of N2O3 and H2NO2+. It was also shown that ascorbate
anion is 240 times more rapidly nitrosated than ascorbic acid. At pH 3.0 to 5.0,
ascorbate anion is abundant and that the reaction with nitrite is very rapid, where the

159
formation of N2O3 becomes the rate limiting step. Thus the optimal pH for the
inhibition of N-nitrosation by ascorbate is at pH 3.0 to 4.0.
People with chronic gastritis, hypochlorhydria or increasing gastric pH resulting in an
increase in the colonization of nitrite-reducing bacteria as well as a significant decline
in gastric ascorbic acid concentration (Sobala et al., 1989), hence people with these
conditions may be more at risk of developing gastric cancer due to elevated nitrite-to-
ascorbic acid ratio, which was demonstrated by Mowat et al. (1999) that used
omeprazole to induce hypochlorhydria in healthy volunteers in order to study the
effects it had on gastric juice ascorbate/nitrite ratio. They concluded that
pharmaceutically induced hypochlorhydria caused a decrease in intragastric ascorbic
acid concentration and an increase in intragastric nitrite, thus effectively changing the
ascorbate/nitrite ratio, and potentially increase the risk of gastric cancer.
Japan has seven times the rate of gastric cancer than the United States and is also
significantly higher compared to the United Kingdom and Germany. There is little
evidence that genetic differences contributed to the different gastric cancer rates
(Davies and Sano, 2001). Thus this epidemiological study suggests that diet and
lifestyle may play an important role in gastric cancer aetiology besides effective
screening and management. Countries such as South Korea, Japan and China had the
highest stomach cancer mortality for men, whereas countries with the highest stomach
cancer mortality for women were South Korea, China and Columbia. Canada and
Denmark had the lowest stomach cancer mortality for men and women, respectively
(Joossens et al., 1996).
The high gastric cancer incidence in the Far East may be due to the consumption of
specific foods that are high in nitrates such as Korean Kimchi or high in salt as in many
traditional Japanese dishes, or particular food preparation methods such as broiling of
meats (Duncan et al., 1997). Regions of high risk to gastric cancer often coincide with
a low intake of foods containing vitamin C. Other risk factors for human gastric cancer
include residence in areas with high nitrate-containing soil due to many factors such as
the addition of fertilizers and foods pickled with salt (Weisburger, 1981). Certain salted
fermented fish products including fish sauce were associated with the high gastric
cancer mortality in Fujian province of China (Chen et al., 1992). Similarly, a potential
link for the high gastric cancer rate in Southwest Korea was associated with regular

160
high consumption of salted pickled cabbage and salted seafood sauce (Seel et al.,
1994). The former also contained high levels of total NOC precursors, and cabbages,
which are known to contain high levels of nitrate than any other vegetables.
Comparison with other countries dietary nitrate and nitrite intake can be difficult since
different countries and even regions within a country may use different processing
technologies to achieve the end product with particular sensory characteristics (Flores,
1997).
3.10.11 Conclusion
N-nitrosamines in food and beverages are the result of the manufacturing processes
such as smoking and curing. Therefore changes or modification of this process should
eliminate or at least minimize their presence in food (Mavelle et al., 1991).
Diet and lifestyle contributes to significant number of preventable cancers. Nitrite is
used as a preservative in cured meat and is known to produce carcinogens in the
stomach. Vitamin C was known to reduce the formation of these carcinogens in vitro
and in vivo. Based on the human trial presented, the intake of one serve of cured meat
was not enough to cause the formation of NDMA in vivo, thus vitamin C
supplementation had no effect on NDMA formation. However, vitamin C
supplementation may have decreased nitrite ions available for nitrosation by competing
for nitrosatable compounds in the stomach, therefore may have prevented the formation
of NDMA.
161
3.11 References
Al-Mamary, M., Al-Habori, M., Al-Shoaibi, Z., and Shamsan, B. 2006. Nitrosamine formation from different Catha edulis leaves extracts under stimulated gastric condition. Food Chemistry, 97:586-590.
Andrade, R., Reyes, F. G., and Rath, S. 2005. A method for the determination of volatile N-nitrosamines in food by HS-SPME-GC-TEA. Food Chemistry, 91:173-179.
Annola, K., Karttunen, V., Luukkainen, P., Segerbäck, D., and Vähäkangas, K. 2007. Transplacental transfer of NDMA in human placental perfusion and DNA adduct formation in the placenta. Toxicology Letters, 172S:S176.
Antonelli, M.L., D’Ascenzo, G., Laganà, A., Pusceddu, P. 2002. Food analyses: a new calorimetric method for ascorbic acid (vitamin C) determination. Talanta, 58:961-967.
Archer, M.C. 1989. Mechanisms of action of N-nitroso compounds. Cancer Surveys, 8:241-250.
Arya, S. P., Mahajan, M., and Jain, P. 2000. Non-spectrophotometric methods for the determination of vitamin C. Analytica Chimica Acta, 417:1-14.
Aurand, L. W., Woods, A. E., and Wells, M. R. 1987. Food Composition and Analysis. Van Nostrand Reinhold Company, New York.
Bartsch, H., Ohshima, H., Shuker, D., Pignatelli, B., and Calmels, S. 1990. Exposure of humans to endogenous N-nitroso compounds: implications in cancer etiology. Mutation Research, 238:255-267.
Belitz, H.-D., and Grosch, W. 1987. Food Chemistry. Springer Verlag, Berlin.
Bender, D.A. 2005. Ascorbic acid: physiology, dietary sources and requirements. Encyclopedia of Human Nutrition, 169-176.
Biaudet, H., Mavelle, T., and Debry, G. 1994. Mean daily intake of N-nitrosodimethylamine from foods and beverages in France in 1987-1992. Food and Chemical Toxicology, 32:417-421.
Burini, G. 2007. Development of a quantitative method for the analysis of total L-ascorbic acid in foods by high-performance liquid chromatography. Journal of Chromatography A, 1154:97-102.
Byun, M-W., Ahn, H-J., Kim, J-H., Lee, J-W., Yook, H-S., and Han, S-B. 2004. Determination of volatile N-nitrosamines in irradiated fermented sausage by gas chromatography coupled to a thermal energy analyzer. Journal of Chromatography A, 1054:403-407.
Cassens, R.G. 1995. Use of nitrite in cured meats today. Food Technology, 49:72-80.
Cassens, R.G. 1997. Residual nitrite in cured meat. Food Technology, 51:53-55.
Chen, C.S., Pignatelli, B., Malaveille, C., Bouvier, G., Shuker, D., Hautefeuille, A., Zhang, R.F., Bartsch, H. 1992. Levels of direct-acting mutagens, total N-nitroso

162
compounds in nitrosated fermented fish products, consumed in a high-risk area for gastric cancer in southern China. Mutation Research, 265:211-221.
Choi, S.Y., Chung, M.J., and Sung, N.J. 2002. Volatile N-nitrosamine inhibition after intake Korean green tea and Maesil (Prunus mume SIEB. et ZACC.) extracts with an amine-rich diet in subjects ingesting nitrate. Food and Chemical Toxicology, 40:949-957.
Choi, S.Y., Chung, M.J., Lee, S.-J., Shin, J.H., and Sung, N.J. 2006. N-nitrosamine inhibition by strawberry, garlic, kale, and the effects of nitrite-scavenging and N-nitrosamine formation by functional compounds in strawberry and garlic. Food Control, 18:485-491.
Chow, C.K., and Hong, C.B. 2002. Dietary vitamin E and selenium and toxicity of nitrite and nitrate. Toxicology, 180:195-207.
Chung, M.J., Lee, S.H., Sung, N.J. 2002. Inhibitory effect of whole strawberries, garlic juice or kale juice on endogenous formation of N-nitrosodimethylamine in humans. Cancer Letters, 182:1-10.
Correa, P. 1992. Human gastric carcinogenesis: A multistep and multifactorial process- First American cancer society award lecture on cancer epidemiology and prevention. Cancer Research, 52:6735-6740.
Cotelle, P., and Vezin, H. 2001. Reaction of caffeic acid derivatives with acidic nitrite. Tetrahedron Letters, 42:3303-3305.
Dallinga, J.W., Pachen, D.M., Lousberg, A.H., van Geel, J.A., Houben, G.M., Stockbrugger, R.W., van Maanen, J.M., and Kleinjans, J.C. 1998. Volatile N-nitrosamines in gastric juice of patients with various conditions of the gastrointestinal tract determined by gas chromatography-mass spectrometry and related to intragastic pH and nitrate and nitrite levels. Cancer Letters, 124:119-125.
Davis, P.A., and Sano, T. 2001. The difference in gastric cancer between Japan, USA and Europe: What are the facts? What are the suggestions? Critical Reviews in Oncology/Hematology, 40:77-94. Dodds, M.W., Johnson, D.A., and Yeh, C.-K. 2005. Health benefits of saliva: a review. Journal of Dentistry, 33:223-233. Duncan, C., Li, H., Dykhuizen, R., Frazer, R., Johnston, P., MacKnight, G., Smith, L., Lamza, K., McKenzie, H., Batt, L., Kelly, D., Golden, M., Benjamin, N., and Leifert, C. 1997. Protection against oral and gastrointestinal diseases: importance of dietary nitrate intake, oral nitrate reduction and enterosalivary nitrate circulation. Comparative Biochemistry and Physiology, 118A:939:948.
Dunn, B.P., and Stich, H.F. 1984. Determination of free and protein-bound N-nitrosoproline in nitrite-cured meat products. Food and Chemical Toxicology, 22:609-613.
Duvoix, A., Blasius, R., Delhalle, S., Schnekenburger, M., Morceau, F., Henry, E., Dicato, M., and Diederich, M. 2005. Chemopreventive and therapeutic effects of curcumin. Cancer Letters, 223:181-190.

163
Dykhuizen, R.S., Fraser, A., McKenzie, H., Golden, M., Leifert, C., and Benjamin, N. 1998. Helicobacter pylori is killed by nitrite under acidic conditions. Gut, 42:334-337.
Ellen, G., Schuller, P.L., Froeling, P.G., and Bruijns, E. 1982. Non volatile N-nitrosamines detected in blood and urine from patients ingesting daily large amounts of ammonium nitrate. Food and Chemical Toxicology, 20:879-882.
Esteban, M.R., and Ho, C-N. 1997. Enzymatic spectrophotometric determination of ascorbic acid in commercial vitamin C tablets. Microchemical Journal, 56:122-129.
European Union Scientific Commission on Food. 1995.
Fiddler, W. 1975. The occurrence and determination of N-nitroso compounds. Toxicology and Applied Pharmacology, 31:352-360.
Flores, J. 1997. Mediterranean vs northern European meat products. Processing technologies and main differences. Food Chemistry, 59:505-510.
Fontannaz, P., Kilinç, T., and Heudi, O. 2006. HPLC-UV determination of total vitamin C in a wide range of fortified food products. Food Chemistry, 94:626-631.
Furusawa, N. 2001. Rapid high-performance liquid chromatographic identification/quantification of total vitamin C in fruit drinks. Food Control, 12:27-29.
Gangolli, S.D., van den Brandt, P., Feron, V.J., Janzowsky, C., Koeman, J.H., Speijers, G.J., Spiegelhalder, B., Walker, R., and Wishnok, J.S. 1994. Nitrate, nitrite and N-nitroso compounds, European Journal of Pharmacology, Environmental Toxicology and Pharmacology Section, 292:1-38.
Gerbaux, P., Wantier, P., and Flammang, R. 2004. Nitrosation of thiols and thioethers in the gas phase: A combined theoretical and experimental study. Journal of American Society for Mass Spectrometry, 15:344-355.
González, C., Riboli, E., Badosa, J., Batiste, E., Cardona, T., Pita, S., Sanz, J.M., Torrent, M., and Agudo, A. 1994. Nutritional factors and gastric cancer in Spain. American Journal of Epidemiology, 139:466-473.
González, P.J., Correia, C., Moura, I., Brondino, C.D., and Moura, J.J.G. 2006. Bacterial nitrate reductases: Molecular and biological aspects of nitrate reduction. Journal of Inorganice Biochemistry, 100:1015-1023.
Gough, T.A., Webb, K.S., and Swann, P.F. 1983. An examination of human blood for the presence of volatile nitrosamines. Food and Chemical Toxicology, 21:151-156.
Gray, J. D., and Shiner, M. 1967. Influence of gastric pH on gastric and jejunal flora. Gut, 8:574-581.
Grebel, J.E., Young, C.C., and Suffet, I.H. 2006. Solid-phase microextraction of N-nitrosamines. Journal of Chromatography A, 1117:11-18.
Grudpan, K., Kamfoo, K., and Jakmunee, J. 1999. Flow injection spectrophotometric or conductometric determination of ascorbic acid in a vitamin C tablet using permanganate or ammonia. Talanta, 49:1023-1026.
164
Hansson, L-E., Nyrén, O., Bergström, R., Wolk, A., Lindgren, A., Baron, J., and Adami, H-O. 1994. Nutrients and gastric cancer risk. A population-based case-control study in Sweden. International Journal of Cancer, 57:638-644.
Helaleh, M.I.H., and Korenaga, T. 2000. Ion chromatographic method for simultaneous determination of nitrate and nitrite in human saliva. Journal of Chromatography B, 744:433-437.
Huang, D.P., Ho, J.H.C., Webb, K.S., Wood, B.J., and Gough, T.A. 1981. Volatile nitrosamines in salt-preserved fish before and after cooking. Fd Cosmet. Toxicology, 19:167-171.
Hwang, H., Dwyer, J., and Russell, R.M. 1994. Diet, Helicobacter pylori infection, food preservation and gastric cancer risk: are there new roles for preventative factors? Nutrition Reviews, 52:75-83.
Issenberg, P. 1981. ‘Analytical methods for nitrosamines’, in N-nitroso Compounds. eds R.A. Scanlan and S.R. Tannenbaum. American Chemical Society Symposium Series 174, United States.
Jo, C., Ahn, H.J., Son, J.H., Lee, J.W., and Byun, M.W. 2003. Packaging and irradiation effect on lipid oxidation, color, residual nitrite content, and nitrosamine formation in cooked pork sausage. Food Control, 14:7-12.
Jobgen, W.S., Jobgen, S.C. Li, H., Meininger, C.J., and Wu, G. 2007. Analysis of nitrite and nitrate in biological samples using high-performance liquid chromatography. Journal of Chromatography B, 851:71-82.
Joossens, J.V., Hill, M.J., Elliott, P., Stamler, R., Stamler, J., Lesaffre, E., Dyer, A., Nichols, R., and Kesteloot, H. 1996. Dietary salt, nitrate and stomach cancer mortality in 24 countries. International Journal of Epidemiology, 25:494-504.
Junghans, P., Fischer, U., and Kuklinski, B. 1999. Body nitrosation potential measured by a novel 15N breath test. Free Radical Biology and Medicine, 27:1302-1307.
Kall, M.A., and Andersen, C. 1999. Improved method for simultaneous determination of ascorbic acid and dehydroascorbic acid, isoascorbic acid and dehydroascorbic acid in food and biological samples. Journal of Chromatography B, 730:101-111.
Kataoka, H., Lord, H.L., Pawliszyn, J. 2000. Applications of solid-phase microextraction in food analysis. Journal of Chromatography A, 880:35-62.
Kato, I., Tominaga, S., and Matsumoto, K. 1992. A prospective study of stomach cancer among a rural Japanese population: a 6-year survey. Japanese Journal of Cancer Research, 83:568-575.
Khalaf, H., and Steinert, J. 2000. Chapter 22, ‘Determination of N-nitoso compounds in foods and beverages using HPLC’, In Food Analysis by HPLC, 2nd ed. Ed L. M. L. Nollet. Marcel Dekker, New York.
Krishnaswamy, K., and Raghuramulu, N. 1998. Bioactive phytochemicals with emphasis on dietary practices. Indian Journal of Medical Research, 108:167-181.
165
Kolpe, U., Ramaswamy, V., Satish Rao, B. S., and Nagabhushan, M. 2002. Turmeric and curcumin prevents the formation of mutagenic Maillard reaction products. International Congress Series, 1245:327-334.
Krul, C.A.M., Zeilmaker, M.J., Schothorst, R.C., and Havenaar, R. 2004. Intragastric formation and modulation of N-nitrosodimethylamine in a dynamic in vitro gastrointestinal model under human physiological conditions. Food and Chemical Toxicology, 42:51-63.
Lakritz, L., Gates, R.A., Gugger, A.M., and Wasserman, A.E. 1982. Nitrosamine levels in human blood, urine and gastric aspirate following ingestion of foods containing potential nitrosamine precursors or preformed nitrosamines. Food and Chemical Toxicology, 20:455-459.
Lee, S.Y.H., Munerol, B., Pollard, S., Youdim, K.A., Pannala, A.S., Kuhnle, G.G., Debnam, E.S., Rice-Evans, C., and Spencer, J.P. 2006. The reaction of flavanols with nitrous acid protects against N-nitrosamine formation and leads to the formation of nitroso derivatives which inhibit cancer cell growth. Free Radical Biology and Medicine, 40:323-334.
Levallois, P., Ayotte, P., van Maanen, J.M.S., Desrosiers, T., Gingras, S., Dallinga, J.W., Vermeer, I.T.M., Lee, J., and Poirier, G. 2000. Excretion of volatile nitrosamines in a rural population in relation to food and drinking water consumption. Food and Chemical Toxicology, 38:1013-1019.
Lichon, M. J. 1996. ‘Sample preparation’ in Handbook of Food Analysis: Physical Characterization and Nutrient Analysis, vol. 1. ed L. M. L. Nollet, Marcel Dekker Inc., New York.
Licht, W. R., Tannenbaum, S. R., and Deen, W. M. 1988. Use of ascorbic acid to inhibit nitrosation: kinetic and mass transfer considerations for an in vitro system. Carcinogenesis, 9:365-372.
Lijinsky, W. 1999. N-Nitroso compounds in the diet. Mutation Research, 443:129-138.
Lin, J.K. 1990. Nitrosamines as potential environmental carcinogens in man. Clinical Biochemistry, 23:67-71.
Lundberg, J. O., Carlsson, S., Engstrand, L., Morcos, E., Wiklund, N. P., and Weitzberg, E. 1997. Urinary nitrite: More than a marker of infection. Urology, 50:189-191.
Lv, C.L., Liu, Y.D., Zhong, R., and Wang, Y. 2006. Theoretical studies on the formation of N-nitrosodimethylamine. Journal of Molecular Structure: THEOCHEM, 802:1-6.
Mackerness, C. W., Leach, S. A., Thompson, M. H., and Hill, M. J. 1989. The inhibition of bacterially mediated N-nitrosation by vitamin C: relevance to the inhibition of endogenous N-nitrosation in the achlorhydric stomach. Carcinogenesis, 10:397-399.

166
Massey, R.C., Crews, C., and McWeeny, D.J. 1982. Method for high-performance liquid chromatographic measurement of N-nitrosamines in food and beverages. Journal of Chromatography, 241:423-427.
Mavelle, T., Bouchikhi, B., and Debry, G. 1991. The occurence of volatile N-nitrosamines in French foodstuffs. Food Chemistry, 42: 321-338.
McWeeny, D.J. 1983. Nitrosamines in beverages. Food Chemistry, 11:273-287.
Miller, B.J., Billedeau, S.M., and Miller, D.W. 1989. Formation of N-nitrosamines in microwaved versus skillet-fried bacon containing nitrite. Food and Chemical Toxicology, 27:295-299.
Mirvish, S. S., Wallcave, L., Eagen, M., and Shubik, P. 1972. Ascorbate-nitrite reaction: Possible means of blocking the formation of carcinogenic N-nitroso compounds. Science, 177:65-68.
Mirvish, S.S. 1995. Role of N-nitroso compounds (NOC) and N-nitrosation in etiology of gastric, esophageal, nasopharyngeal and bladder cancer and contribution to cancer of known exposures to NOC. Cancer Letters, 93:17-48.
Mitacek, E.J., Brunnemann, K.D., Suttajit, M., Martin, N., Limsila, T., Ohshima, H., and Caplan, L.S. 1999. Exposure to N-Nitroso compounds in a population of high liver cancer regions in Thailand: Volatile nitrosamine (VNA) levels in Thai food. Food and Chemical Toxicology, 37:297-305.
Mowat, C., Carswell, A., Wirz, A., and McColl, K. E. 1999. Omeprazole and dietary nitrate independently affect levels of vitamin C and nitrite in gastric juice. Gastroenterology, 116:813-822.
Mowat, C., and McColl, K. E. 2001. Alternations in intragastric nitrite and vitamin C levels during acid inhibitory therapy. Best Practice and Research Clinical Gastroenterology, 15:523-537.
Nagabhushan, M., Nair, U. J., Amonkar, A. J., D’Souza, A. V., and Bhide, S. V. 1988. Curcumins as inhibitors of nitrosation in vitro. Mutation Research, 202:163-169.
National Academy of Sciences. 1981. The Health Effects of Nitrate, Nitrite and N-Nitroso Compounds. National Academy Press, Washington.
van Niekerk, P. J. 1982. ‘Determination of vitamins’, In HPLC in Food Analysis. Ed. R. Macrae. Academic Press, London.
Nisperos-Carriedo, M.O., Buslig, B.S., and Shaw, P.E. 1992. Simultaneous detection of dehydroascorbic, ascorbic, and some organic acids in fruits and vegetable by HPLC. Journal of Agriculture and Food Chemistry, 40:1127-1130.
Nowell, S., Coles, B., Sinha, R., MacLeod, S., Ratnasinghe, D.L., Stotts, C., Kadlubar, F.F., Ambrosone, C.B., and Lang, N.P. 2002. Analysis of total meat intake and exposure to individual heterocyclic amines in a case-control study of colorectal cancer: contribution of metabolic variation to risk. Mutation Research, 506-507:175-185.
167
Odriozola-Serrano, I., Hernández-Jover, T., Martín-Belloso, O. 2007. Comparative evaluation of UV-HPLC methods and reducing agents to determine vitamin C in fruits. Food Chemistry, 105:1151-1158.
Ohsawa, K-I., Nakagawa, S-Y., Kimura, M., Shimada, C., Tsuda, S., Kabasawa, K., Kawaguchi, S., and Sasaki, Y. F. 2003. Detection of in vivo genotoxicity of endogenously formed N-nitroso compounds and suppression by ascorbic acid, teas and fruit juices. Mutation Research, 539:65-76.
Ohshima, H., and Bartsch, H. 1981. Quantitative estimation of endogenous nitrosation in humans by monitoring N-nitrosoproline excreted in the urine. Cancer Research, 41:3658-3662.
Ologhobo, A.D., Adegede, H.I., and Maduagiwu, E.N. 1996. Occurrence of nitrate, nitrite and volatile nitrosamines in certain feedstuffs and animal products. Nutrition and Health, 11:109-114.
Österdahl, B.-G. 1988. Volatile nitrosamines in foods on the Swedish market and estimation of their daily intake. Food Additives and Contaminants, 5:587-595.
Pannala, A., Mani, A. R., Spencer, J. P. E., Skinner, V., Bruckdorfer, K. R., Moore, K. P., and Rice-Evans, C. A. 2003. The effect of dietary nitrate on salivary, plasma, and urinary nitrate metabolism in humans. Free Radical Biology and Medicine, 34:576-584.
Pennington, J.A. 1998. Dietary exposure models for nitrates and nitrites. Food Control, 9:389-395.
Pourazrang, H., Moazzami, A.A., and Fazky Bazzaz, B.S. 2002. Inhibition of mutagenic N-nitroso compound formation in sausage samples using L-ascorbic acid and α-tocopherol. Meat Science, 62:479-483.
Ralt, D., and Tannenbaum, S.R. 1981. ‘The role of bacteria in nitrosamine formation’, in N-nitroso Compounds. eds R.A. Scanlan and S.R. Tannenbaum. American Chemical Society Symposium Series 174, United States.
Radcliffe, C.E., Lamb, R., Blinkhorn, A.S., Drucker, D.B. 2003. Effect of sodium nitrite and ascorbic acid on the growth and acid production of Streptococcus mutans. Journal of Dentistry, 31:367-370.
Reed, P.I., Haines, K., Smith, P.L., House, F.R., and Walters, C.L. 1981. Gastric juice N-Nitrosamines in health and gastroduodenal disease. The Lancet, 318:550-552.
Risch, H.A., Jain, M., Choi, N.W., Fodor, J.G., Pfeiffer, C.J., Howe, G.R., Harrison, L.W., Craib, K.J., and Miller, A.B. 1985. Dietary factors and the incidence of cancer of the stomach. American Journal of Epidemiology, 122:947-959.
Russell, L. F. 2000. Chapter 10, ‘Quantitative determination of water-soluble vitamins’, In Food Analysis by HPLC, 2nd ed. Ed L. M. L. Nollet. Marcel Dekker, New York.
Rywotycki, R. 2002. The effect of selected functional additives and heat treatment on nitrosamine content in pasteurized pork ham. Meat Science, 60:335-339.

168
Rywotycki, R. 2003. Meat nitrosamine contamination level depending on animal breeding factors. Meat Science, 65:669-676.
Rywotycki, R. 2007. The effect of baking of various kinds of raw meat from different animal species and meat with functional additives on nitrosamine contamination level. Food Chemistry, 101:540-548.
Scanlan, R.A., and Reyes, F.G. 1985. An update on analytical techniques for N-nitrosamine. Food Technology, 39:95-99.
Seel, D.J., Kawabata, T., Nakamura, M., Ishibashi, T., Hamano, M., Mashimo, M., Shin, S.H., Sakamoto, K., Jhee, E.C., Watanabe, S. 1994. N-nitroso compounds in two nitrosated food products in Southwest Korea. Food and Chemical Toxicology, 32:1117-1123. Sen, N.P., Seaman, S.W., and Baddoo, P.A. 1985. N-nitrosothiazolidine and nonvolatile N-nitroso compounds in foods. Food Technology, 39:84-88.
Shahidi, F., and Pegg, R.B. 1994. Absence of volatile N-nitrosamines in cooked nitrite-free cured muscle foods. Meat Science, 37:327-336.
Shank, R.C. 1975. Toxicology of N-nitroso compounds. Toxicology and Applied Pharmacology, 31:361-368.
Shephard, S., Schlatter, C., and Lutz, W. 1987. Assessment of the risk of formation of carcinogenic N-nitroso compounds from dietary precursors in the stomach, Food and Chemistry Toxicology, 25:91-108.
Skrypec, D.J., Gray, J.I., Mandagere, A.K., Booren, A.M., Pearson, A.M., and Cuppett, S.L. 1985. Effect of bacon composition and processing on N-nitrosamine formation. Food Technology, 39:74-79.
Silva, F.O. 2005. Total ascorbic acid determination in fresh squeezed orange juice by gas chromatography. Food Control, 16:55-58.
Sobala, G. M., Schorah, C. J., Sanderson, M., Dixon, M. F., Tompkins, D. S., Godwin, P., and Axon, A. T. 1989. Ascorbic acid in the human stomach. Gastroenterology, 97:357-363.
Sobko, T., Reinders, C.I., E.Å., Jansson, Norin, E., Midtvedt, T., and Lundberg, J.O. 2005. Gastrointestinal bacteria generate nitric oxide from nitrate and nitrite. Nitric Oxide, 13:272-278.
Song, P.J., and Hu, J.F. 1988. N-nitrosamines in Chinese foods. Food and Chemical Toxicology, 26:205-208.
Smith, M.E., and Morton, D.G. 2001. The Digestive System. Churchill Livingstone, Edinburgh.
Sung, N.-J. 2004. ‘N-Nitroso compounds in food’, In Handbook of Food Analysis: Residues and Other Food component Analysis, Volume 2, 2nd ed. L.M. Nollet (ed). Marcel Dekker, New York.

169
Tabak, M., Armon, R., Rosenblat, G., Stermer, E., and Neeman, I. 2003. Diverse effects of ascorbic acid and palmitoyl ascorbate on Helicobater pylori survival and growth. FEMS Microbiology Letters, 224:247-253.
Tai, A., and Gohda, E. 2007. Determination of ascorbic acid and its related compounds in foods and beverages by hydrophilic interaction liquid chromatography. Journal of Chromatography B, 853:214-220.
Tricker, A.R., and Kubacki, S.J. 1992. Review of the occurrence and formation of non-volatile N-nitroso compounds in foods. Food Additives and Contaminants, 9:39-69.
Tricker, A.R., Pfundstein, B., Theobald, E., Preussmann, R., and Spiegelhalder, B. 1991. Mean daily intake of volatile N-nitrosamines from foods and beverages in West Germany in 1989-1990. Food and Chemical Toxicology, 29:729-732.
Tricker, A.R., and Preussmann, R. 1991. Carcinogenic N-nitrosamines in the diet: occurrence, formation, mechanisms and carcinogenic potential. Mutation Research, 259:277-289.
Uppu, R. M., Lemercier, J-N., Squadrito, G. L., Zhang, H., Bolzan, R. M., and Pryor, W. A. 1998. Nitrosation by peroxynitrite: Use of phenol as a probe. Archives of Biochemistry and Biophysics, 358:1-16.
Ventanas, S., Martín, D., Estévez, M., and Ruiz, J. 2006. Analysis of volatile nitrosamines from a model system using SPME-DED at different temperatures and times of extraction. Food Chemistry, 99:842-850.
Ventanas, S., and Ruiz, J. 2006. On-site analysis of volatile nitrosamines in food model systems by solid-phase microextraction coupled to a direct extraction device. Talanta, 70:1017-1023.
Vermeer, I.T., Pachen, D.M., Dallinga, J.W., Kleinjans, J.C., van Maanen, J.M. 1998. Volatile N-nitrosamine formation after intake of nitrate at the ADI level in combination with an amine-rich diet. Environmental Health Perspective, 106:459-463.
Vermeer, I.T., Moonen, E.J., Dallinga, J.W., Kleinjans, J.C., and van Maanen, J.M. 1999. Effect of ascorbic acid and green tea on endogenous formation of N-nitrosodimethylamine and N-nitrosopiperidine in humans. Mutation Research, 428:353-361.
Wagner, D.A. and Tannenbaum, S.R. 1985. In-vivo formation of N-nitroso compounds. Food Technology, 39:89-90.
Walters, C.L. 1980. The exposure of humans to nitrite. Oncology, 37:289-296.
Washko, P. W., Welch, R. W., Dhariwal, K., R., Wang, Y., and Levine, M. 1992. Ascorbic acid and dehydroascorbic acid analyses in biological samples. Analytical Biochemistry, 204:1-14.
Weisburger, J.H. 1981. ‘N-nitroso compounds: diet and cancer trends’, in N-nitroso Compounds. eds. R.A. Scanlan and S.R. Tannenbaum. American Chemical Society Symposium Series 174, United States.
170
Weisburger, J.H., and Chung, F.-L. 2002. Mechanisms of chronic disease causation by nutritional factors and tobacco products and their prevention by tea polyphenols. Food and Chemical Toxicology, 40:1145-1154.
Wilson, J.X. 2002. The physiological role of dehydroascorbic acid. FEBS Letters, 527:5-9.
Wogan, G.N., and Tannenbaum, S.R. 1975. Environmental N-Nitroso compounds: implications for public health. Toxicology and Applied Pharmacology, 31:375-383.
Xu, G. P., and Reed, P. J. 1993. N-Nitroso compounds in fresh gastric juice and their relation to intragastric pH and nitrite employing an improved analytical method. Carcinogenesis, 14:2547-2551.
Yamamoto, M., Iwata, R., Ishiwata, H., Yamada, T., and Tanimura, A. 1984. Determination of volatile nitrosamine levels in foods and estimation of their daily intake in Japan. Food and Chemical Toxicology, 22:61-64.
Yamasaki, H., and Sakihama, Y. 2000. Simultaneous production of nitric oxide and peroxynitrite by plant nitrate reductase: in vitro evidence for the NR-dependent formation of active nitrogen species. FEBS Letter, 468:89-92.
Yurchenko, S., and Mölder, U. 2005. The occurrence of volatile N-nitrosamines in Estonaian meat products. Food Chemistry, 100:1713-1721.
Yurchenko, S., and Mölder, U. 2006. Volatile N-nitrosamines in various fish products. Food Chemistry, 96:325-333.
Zapata, S., and Dufour, J.-P. 1992. Ascorbic, dehydroascorbic and isoascorbic acid simultaneous determinations by reverse phase ion interaction HPLC. Journal of Food Science, 57:506-511.

171
Chapter 4
Alternatives to sodium nitrite
Due to increasing concerns over the long term harmful effects of sodium nitrite in
developing gastrointestinal cancers, their use in cured meat products are stringently
regulated in most developed countries and the use of other technologies and natural
preservatives to prevent botulism is been explored to date.
4.1 Introduction
Food preservation has been practiced for centuries and the methods used have
improved shelf life and safety significantly especially in recent years due to advancing
knowledge and technology. Currently, there are numerous natural antimicrobial agents
that are being used or tested, and these include: Lactoperoxidase, lactoferrin, lysozyme,
ovotransferrin, avidin, nisin, bacteriocins, plant and spice essential oils. The growing
interest in using natural antimicrobials as food preservatives is due to the short and/or
long term side effects as a result of consuming chemical food preservatives over a
period of time (Naidu, 2000).
Antimicrobial properties of many spices have been firmly established in the literature,
ironically they are often vectors for various pathogenic microorganisms specially
spore-formers such as B. cereus and C. perfringens. Banerjee and Sarkar (2004)
demonstrated that contaminated spices, including turmeric powder, when added to
foods might allow the growth of pathogens and the subsequent toxin production.
Food poisoning by B. cereus and C. perfringens is much more common than one
realizes, despite the vast knowledge available on them. Causes of food poisoning by
these spore formers are usually due to insufficient cooling and reheating. Food
processing does not always apply enough heat to destroy the spores. In addition,
pasteurization actually activates the spores, triggering germination and enhances further
vegetative cell multiplication (Andersson et al., 1995). Thus other methods for killing
the spores are required to ensure food safety at home where temperature abuse is
common.

172
Food poisoning outbreaks were estimated at 2 million cases in Australia and the cost
was estimated at between $487 and $1900 million per year. The causes of the rises of
foodborne diseases in Australia was attributed to a greater diversity of food available
and changing consumer demand, as well as changes in food manufacturing, retail,
distribution and storage. In addition, new food pathogens have emerged coupled with
increasing numbers of susceptible individuals. Common food borne outbreaks in
Australia involved B. cereus, Campylobacter species, C. perfringens, E. coli O111, L.
monocytogenes and S. aureus. Typical food types involved in those outbreaks included
meat, seafood, salad and vegetables and inadequate cooling and inappropriate holding
temperature was to blame in most cases (Foodborne Disease Working Party, 1997).
4.2 Foodborne pathogens and food poisoning
4.2.1 Clostridium species
C. perfringens type A food poisoning is very common in the industrialized world
producing enterotoxin (cpe) that breaks down normal plasma membrane permeability
properties. The toxin producing gene cpe can be either chromosomal or plasmid-borne
but only a small minority of global C. perfringens is cpe positive. C. perfringens can
cause human gas gangrene and two types of food poisoning: type A diarrhea which is
common and mild in industrialized countries and the very serious but rare type C
human necrotic enteritis (Brynestad and Granum, 2002). C. perfringens is mainly found
in meat products because of their requirement for 13 amino acids that they cannot
synthesis and are found naturally in meat (Andersson et al., 1995). Hence spices and
their essential oils have been evaluated for their anti-clostridia activities.
The temperature range for C. perfringens is between 33 and 49oC with the optimal
temperature at 45oC. They can produce over 13 different toxins with four major lethal
toxins used to type isolates (A-E). C. perfringens can grow from pH 5 to 9 with optimal
pH between 6 and 7. Food poisoning outbreaks caused by C. perfringens often involves
events where large quantity of food is cooked in advance followed by temperature
abuse. However, since most illness is mild with short duration time, many cases are not
been reported to healthcare professionals thus may underestimate the true number of C.
perfringens outbreaks worldwide (Brynestad and Granum, 2002). Nevertheless, food
poisoning caused by C. perfringens in the United States is estimated at around 250,000
cases annually, including about 41 hospitalization and seven deaths. Furthermore, the
173
economic impact associated with its outbreak was estimated to be around US$12.5
billion annually (Juneja et al., 2006b).
Juneja et al. (2006b) developed a mathematical model that predicts the growth pattern
of C. perfringens spores in cooked cured ham at various temperatures and concluded
that it can be used to design microbiologically safe cooling regimes for cured pork ham
and similar products. This model may be modified for elucidating C. botulinum growth
pattern and may indicate when it is best to add the antimicrobial agent during the
fermentation or processing stage to achieve a maximum reduction of their spores and
vegetative cells.
C. botulinum poisoning is known as botulism where the toxin binds to presynaptic
nerve endings blocking acetylcholine secretion that inhibits muscle contraction. This
results in double vision, uncontrolled salivation, blurred speech, and difficulty in
swallowing. Urgent medical attention is necessary since it may lead to death as a result
of respiratory musculature failure. Therapy consists of intravenous delivery of trivalent
(types A, B and E) anti-toxin and intensive care. Recovery ranges from a few weeks to
several months (Lindström et al., 2006). However, antibiotic resistance of Clostridium
species in hospitals is increasing (Munro, 1989), which may become a probably in
major food poisoning outbreaks especially in susceptible populations such as the
elderly, immunocompromised patients and young children.
Since C. botulinum spores are widely distributed, they may enter food products through
raw materials or by post-processing contamination. They are in abundance in the soil,
hence fruits and vegetables can easily carry C. botulinum spores if they are not
adequately washed. Most foodborne botulism outbreaks are actually the result of home-
processed or home-canned foods. Outbreaks due to commercial products are rare but
do occur sporadically. Different types of C. botulinum have different optimal growth
conditions so can grow and produce toxins in different product groups that meet their
growth requirements (Rhodehamel et al., 1992).
Strains of C. botulinum that can cause human botulisms belong to group I and II. Group
I consists of proteolytic mesophilic organisms producing neurotoxins A, B and F that
grows optimally at 35 -37 oC but not below 10 oC with growth limiting pH of around
4.4 and can tolerate up to 10 % NaCl concentrations. Group II consists of non-
proteolytic psychrotrophic organisms producing type B, E and F toxins with an

174
optimum temperature of 26 -30 oC, but can grow from as low as 3 oC. Growth limiting
pH for group II C. botulinum is 5.0 and inhibitory NaCl concentration is 5 %. Spores
from group II are not as heat-resistant compared to group I, but they can still survive
the heat processes encountered in the food industry, especially in ready-to-eat food
(Lindström et al., 2006).
Due to the toxicity of C. botulinum, often C. sporogenes is used to evaluate the anti-
Clostridia properties of herbs and spices due to their similar growth requirements.
Mead (1985) concluded that tryptone-sulphite-cycloserine media with or without the
addition of egg yolk are currently the best media for the purpose of enumerating
Clostridium perfringens. In addition, this media can also be used to grow other
Clostridia species such as C. sporogenes. However, the colonies produced are
indistinguishable from C. perfringens, hence confirmatory tests are necessary.
4.2.2 Common bacterial food inhibitors
Various herbs and spices have been tested for their antibacterial properties. For
example, the active antimicrobial compound in garlic is allicin, a diallyl thiosulfinate
(2-propenyl-2-propenethiol sulfinate) that is colorless oil and provide the pungent odor
and taste to garlic and onion. An intact garlic bulb contains a precursor to allicin that is
alliin (S-allyl-L-cysteine-S-oxide). However, once the bulb is disrupted the enzyme
allinases, a phosphopyridoxal enzyme, hydrolyses alliin to give allicin, pyruvate and
ammonium. Fresh garlic extract at 10 % (w/v) was shown to inhibit the growth of
Bacillus cereus on nutrient agar plates, and was germicidal at 5 % to Staphylococcus
aureus and inhibitory at more than 2 % in liquid culture (Beuchat, 1994).
4.3 Food preservation
4.3.1 Traditional methods
The bactericidal effects of nitrite are due to its derivatives such as nitric oxide that is
toxic to Clostridium and Listeria species. There are numerous possible targets for
inhibition including respiratory chains, iron-sulfur proteins and other metalloproteins,
membranes and gene expression (Cammack et al., 1999). However, increasing clinical
and epidemiological evidence suggest that nitrite can increase the risk of developing
gastrointestinal cancers, therefore other alternatives are been researched to date.

175
4.3.2 Recent methods
Most essential oils from aromatic plants and spices have GRAS status and some are
routinely used in food industry mainly as flavoring or coloring compounds. However,
recent studies have shown that many of these compounds also possess antimicrobial
properties against a range of spoilage and pathogenic bacteria, yeasts, and moulds
(Chaibi et al., 1997).
Jo et al. (2003) demonstrated that ionizing irradiation at 5 kGy significantly decreased
volatile N-nitrosamines in cooked pork sausage as well as destroyed pathogenic and
spoilage microorganisms without altering the nutritional and sensory qualities of the
food. Similarly, Byun et al. (2002) demonstrated that gamma irradiation at 5 kGy was
just effective as the use of 200 mg/kg sodium nitrite in ham without adversely affecting
its color, texture or flavor. Furthermore, residual nitrite was at the lowest with carbon
dioxide packaging. Therefore irradiation may be used commercially to reduce residual
nitrite and N-nitrosamines during storage and increase the shelf life of cured meat
products (Ahn et al., 2004). However, the use of irradiation technology is not accepted
in all countries, or at least is used on case-by-case basis or for specific food groups.
Therefore other methods are still necessary.
Using hurdle technology, which is the combination of intrinsic hurdles such as water
activity and acidity, along with extrinsic hurdles such as processing temperature and
storage temperature, to reduce the nitrite content in hot dogs without compromising
product safety and quality (Jafari and Emam-Djomeh, 2007).
4.3.2.1 Alliaceae: Garlic and Onions
Freshly reconstituted dehydrated onion and garlic at 1 and 5 % (w/v), respectively,
were shown to be bactericidal to S. typhimurium and E. coli 9002. However, E. coli
was more resistant to onion than S. typhimurium (Johnson and Vaughn, 1969). Garlic
and onion oils at 1500 µg/g of meat slurry partially inhibited toxin production by C.
botulinum type A, but have minimal effect on type B and E (De Wit et al., 1979). It
was concluded that garlic and onion oils should not be used for toxin inhibition in meat
since meat can naturally contain several types of Clostridium species. Higher
concentrations of garlic and onion oils should also be tested to evaluate their toxin

176
inhibition activity in meat. From Table 4.8, garlic had antimicrobial effects against a
range of food borne pathogenic bacteria (Arora and Kaur, 1999).
4.3.2.2 Thymol
The major antimicrobial compound thymol (5-methyl-2-(1-methylethyl)phenol) from
thyme, oregano, savory and sage is effective against a broad range of bacteria
especially thyme oil. Alcoholic extracts of these spices including rosemary and
turmeric can inhibit the growth and toxin production by C. botulinum at 500 µg/ml.
Rosemary extract at 1000 µg/ml significantly inhibited the growth of S. typhimurium
and S. aureus, and at 3000 µg/ml of either sage or rosemary inhibited the growth of 20
food borne Gram-positive bacteria, and was considered bactericidal at 5000 µg/ml
(Beuchat, 1994). Thyme also showed the most inhibition against E. coli O157:H7
followed by myrtle and sage, whereas laurel showed no inhibition (Sağdiç et al., 2002).
Similarly, from Table 11, oregano essential oil showed inhibition against E. coli
O157:H7, S. aureus, S. enteritidis and L. monocytogenes at 4 % (w/v)(Seydim and
Sarikus, 2006).
It was shown that the antimicrobial activity of sage increased with increasing water and
salt content in food, possibly due to increasing sensitivity of bacteria and increasing
essential oil partitioning in the liquid phase. On the contrary, the efficacy of sage as an
antimicrobial agent decreased with increasing fat and protein content in foods, possibly
due to the absorption of essential oils in the solid phase (Shelef et al., 1984). Since salt
is often added to cured meat products, the combination of salt and other spices may
provide synergistic action against pathogenic and spoilage bacteria in foods. However,
because cured meat products are often high in fat and protein, sage alone might not be
useful as an antibacterial agent for that specific product group.
4.3.2.3 Turmeric and curcuminoids
The yellow pigment in turmeric is composed of three types of curcumin and these are:
curcumin (CUR I), mono-demethoxycurcumin (CUR II) and bis-demethoxycurcumin
(CUR III)(Pfeiffer et al., 2003). These curcuminoids has been reported to possess anti-
oxidant, anti-inflammatory, anti-angiogenic and anti-carcinogenic properties
(Maheshwari et al., 2006). However, the stability of the curcuminoids and the
formation of decomposition products and metabolites should be taken into account

177
when determining their physiological roles. The stability of different curcuminoid was
demonstrated by Pfeiffer et al. (2003) using cell culture medium with and without fetal
calf serum. It was concluded that all three curcuminoids decomposed very rapidly
(more than 90 % within 12 h) when serum was omitted compared to with serum.
Furthermore, CUR III was the most stable curcuminoid and CUR I was the least stable.
Turmeric is the powdered rhizome of a perennial herb called Curcuma longa L. often
cultivated in tropical regions of Asia. It was shown in vitro and animal studies that
turmeric possesses anti-inflammatory and anti-spasmodic activities as well as exerting
protective effect on the liver and stimulates bile secretion aiding digestion. Since most
of the yellow pigment curcumin (diferuloylmethane) in turmeric is excreted in the
faeces, it may not be readily digestible and hence absorbed in the gastrointestinal tract
(Ammon and Wahl, 1991). Hence other health benefits of turmeric may not be
significant if it cannot be absorbed readily.
Furthermore, the doses required to achieve adequate tissue concentrations far exceeds
the normal daily intake (Gescher et al., 2001). Other two major constituents in turmeric
are derivatives of curcumin [p-hydroxycinnamoyl(feruloyl) methane and p,p’-
dihydroxydicinnamoylmethane]. Depending on the origin and cultivation practices,
turmeric can vary in essential oil (4.2 to 14 %), fatty oil (4.4 to 12.7 %) and moisture
(10 to 12 %). The antibacterial effect of turmeric was contributed to curcumin or the
essential oil (Ammon and Wahl, 1991). In addition, Shishu et al. (2003) demonstrated
that dibenzoylmethane, a structural analogue of curcumin, was inhibitory against seven
cooked food heterocyclic amines.
4.3.2.4 Other herbs and spices
Other less popular or non-culinary herbs and spices has been tested for their anti-
botulinal properties, including cedar, Eucalyptus, (Chaibi et al., 1997) and mastic resin
(Daifas et al., 2004). It was suggested that the inhibitory effect of spice oil was similar
to phenols by affecting the permeability, transport system, electron transport and
energy production of bacteria (Ismaiel and Pierson, 1990b). There may be commercial
applications for these spice oils in certain foods since traditional preservative sodium
nitrite requires more than 20,000 ppm in order to inhibit the germination of C.
botulinum.

178
When nitrite was heated in a bacteriological medium, more inhibitory effect was shown
against C. sporogenes than nitrite added aseptically to the medium after autoclaving.
The unidentified inhibitory substance became known as Perigo factors. It was shown
that reducing agents such as ascorbate was necessary to produce the effect. In a meat-
less medium at 110 oC heated for 20 minutes containing 20 mg/kg nitrite showed
enhanced inhibition of C. botulinum, whereas in a meat-based medium containing 150
mg/kg nitrite the inhibition effect was lessened. Therefore meat was found to neutralize
the inhibitory factor (Cammack et al., 1999).
Huhtanen (1980) tested 33 spices for anti-botulinal properties and concluded that mace
and achiote were the most effective with MIC of 31 µg/ml. However, achiote is not
used in food due to its suspected carcinogenicity. Other effective spices with MIC of
125 µg/ml were: black and white pepper, bay leaf and nutmeg. Spices with MIC of 500
µg/ml were: paprika, rosemary, cloves, oregano, thyme and turmeric. The justification
of testing these spices was because many cured meat and sausage products use one or
more of the spices tested. However, due to trade confidentiality, the exact quantity used
is not known and varies from manufacturers and the type of product. One major flaw in
their experimental design is that inhibition was concluded from test-tube turbidity only
without selective plate count, thus any contamination might give false negative results.
Chaibi et al. (1997) tested nine essentials oils for their antibacterial activity against B.
cereus and C. botulinum, both spore formers. The most effective essential oil against
the spores of B. cereus was cedar with MIC of 100 ppm, followed by rosemary at 200
ppm, then eucalyptus and orange at 250 ppm. For inhibiting C. botulinum spores, cedar
was again the most effective but at 300 ppm, followed by Savage carrots and Vervain
at 350 ppm. Eucalyptus, chamomile and orange also showed inhibition at 400 ppm. The
oil fraction of turmeric was shown to be inhibitory towards B. cereus, S. aureus, and E.
coli (Beuchat, 1994). These essential oils may have application in minimally processed
food to extend shelf life and improve safety. However, the antibacterial activity of
essential oils against the spores of B. cereus and C. botulinum need to be tested in food
systems taking into account of the interaction with food matrices.
Daifas et al. (2004) demonstrated that mastic resin in ethanol (8 % w/w) and mastic oil
(0.3% v/v) inhibited the growth of C. botulinum type A and B. In addition, inhibition
was strain specific with C. botulinum type A strains more sensitive to mastic resin and
179
its essential oil than type B strains. However, mastic resin and mastic oil did not inhibit
neurotoxin production in English-style crumpets. Even though bakery products are a
suitable substrate for the growth of C. botulinum, there is yet botulism outbreak
associated with bakery products to date. Hence further testing of mastic resin and its
essential oil on neurotoxin production by C. botulinum should be carried out in meat
systems instead.
The addition of grapefruit extract Citricidal at 200 ppm significantly reduces the
growth of C. perfringens in marinated, vacuum-packed chicken. However, since 1.0 %
NaCl was also added to the chicken, the antibacterial activity of Citricidal may be
contributed to salt that works synergistically perhaps by increasing the sensitivity of C.
perfringens to Citricidal. From the consumer perspective, Citricidal did not have any
impact on the sensory aspect of the product (Juneja et al., 2006a).
It was demonstrated by Ismaiel and Pierson (1990a) that the oils of black pepper and
clove had significantly higher inhibition of vegetative growth by C. botulinum 67B
than any other oils such as garlic, onion, cinnamon, thyme and origanum. However, at
concentrations between 100 and 150 ppm all the oils prevented germination of C.
botulinum 67B. It was suggested that the inhibitory effect of spice oil was similar to
phenols by affecting the permeability, transport system, electron transport and energy
production of bacteria. There may be commercial applications for these spice oils in
certain foods since traditional preservative sodium nitrite requires more than 20,000
ppm in order to inhibit germination. Similarly, Ismaiel and Pierson (1990c) shown that
clove, thyme, black pepper, pimento, origanum, garlic, onion and cinnamon oil at 200
ppm inhibited the growth and germination of C. botulinum 33A, 40B and 1623E.
Ismaiel and Pierson (1990b) demonstrated that at 200 ppm origanum oil was effective
at inhibiting C. botulinum growth in TYG broth. However, in meat system the effective
concentration increased to 400 ppm in combination with sodium nitrite at 50 to 100
ppm.
Clove oil at 1 to 2 % reduced the initial population of L. monocytogenes in chicken
Frankfurts (Table 4.7). However, the inhibition was strain dependent (Mytle et al.,
2006). By combining with other herbs and spices such as garlic, it may lead to
complete growth inhibition. Clove powder was very bacteriocidal at 0.5 to 1.0 %
against S. enteritidis and E. coli O157. Garlic at 0.5 to 1.0 % showed greater inhibition

180
to E. coli O157 than S. enteritidis. In addition, garlic at 0.5 to 1.0 % showed
bacteriostatic and bacteriocidal effects against S. enteritidis in broth system. Ground
dried ginger and mustard powder showed little antimicrobial activity against either
bacteria (Leuschner and Zamparini, 2002).
From Table 4.2, Gram-positive bacteria were more sensitive to sumac spice compared
to Gram-negative bacteria. Of the Gram-positive strains, L. monocytogenes showed
highest resistance whereas Bacillus species were the least resistant. It was demonstrated
that 1 % sumac extract resulted in 4-5 log reduction in Bacillus species and 2-3 log
reduction in other bacteria tested including S. aureus, L. monocytogenes, E. coli
O157:H7 and S. enteritidis (Nasar-Abbas and Halkman, 2004).
From Table 4.3, using agar dilution assay method, Viola tricolor herb gave a significant
log reduction in S. aureus, B. cereus, S. epidermidis, with moderate inhibition against
P. aeruginosa, E. faecalis, E. coli and K. pneumoniae (Witkowska-Banaszczak et al.,
2005).
From Table 4.4, at 0.1 %, nutmeg extract showed significant reduction of E. coli O157
strains compared to non-pathogenic E. coli strains. At 0.1 %, allspice completely
inhibited the growth of both pathogenic and non-pathogenic E. coli strains, whereas at
the same concentration, thyme completely inhibited growth for all the pathogenic E.
coli strains and inhibited growth for most of the non-pathogenic E. coli strains. Star
anise showed complete inhibition for most of the pathogenic and non-pathogenic E.
coli strains at 1 %, whereas cinnamon did not show antibacterial properties (Takikawa
et al., 2002).
From Table 4.9, all five Australian native herb extracts exhibited antibacterial
properties in the concentration range from 7.8 to 500 µg/ml. S. aureus was the most
sensitive whereas E. coli and L. monocytogenes were the most resistant (Dupont et al.,
2005). These native herbs are often used in traditional Australian Aboriginal tucker or
bush foods. Their consumption at low levels appears to be safe for humans, and
therefore should be exploited in commercial foods such as cured meat products. From
Table 4.10, every Turkish spice extracts tested showed some inhibition against E. coli
O157:H7 with the exception of laurel extracts. Thyme gave the largest inhibition zone
whereas cumin gave the smallest inhibition zone (Sağdiç et al., 2002).

181
4.3.2.5 Other methods
Sprong et al. (2002) demonstrated in vitro and in vivo using male Wistar rats that
bovine milk fat tryglycerides containing C10:0, C12:0 and C18 together with digestion
products of sphingolipids were effective bactericidal agents against L. monocytogenes
and C. jejuni, whereas E. coli O157:H7 and S. enteritidis were less susceptible. It was
suggested that Gram-positive bacteria are more susceptible to fatty acids and
monoglycerides due to the lack of protective lipopolysaccharide-rich outer membrane
found in Gram-negative bacteria. However, moderate to high dairy consumption in
humans does not necessarily result in less foodborne illnesses, but may be added as a
natural food preservative. Furthermore, excess consumption of dairy food may result in
other harmful effects such as weight gain.
Using media with inoculated C. botulinum spores, it was recently suggested that fat
may reduce the efficacy of some antimicrobials added to or found naturally in foods
including free fatty acids, sorbic acid and potassium sorbate. It was suggested that
many food preservatives are lipophilic acids, which interacts with the phospholipids
within the bacterial cell membrane thus interfering with substrate transport across the
membrane. Since fats naturally occur in meat products it may compete for the
llipophilic molecule thereby reducing the concentration available for antimicrobial
activities. Fat had less effect on the antimicrobial activity of amphiphilic compounds
such as phosphates, or water-soluble antimicrobials such as sodium nitrite, thus its anti-
botulinal activity is only slightly affected (Glass and Johnson, 2004).
Østerlie and Lerfall (2005) shown that lycopene from tomato products can increase
shelf life and decrease rancidity in minced meat products as well as providing a stable
reddish colour during storage. It was suggested that the antibacterial effect of tomato
products was due to the lowering of pH and consequently reducing microbial growth
and thus increases shelf life. However, the minced meat mixtures also contained salt
and various spices such as white pepper, allspice, ginger and nutmeg, which may
contribute to increased shelf life.
Pediococcus damnosus and Pediococcus pentosaceus was shown to inhibit the growth
of C. perfringens, L. monocytogenes, Salmonella infantis, and Yersinia enterocolitica
in minced meat juice. The antibacterial effect was attributed to the production of a
bacteriocin called pediocin A. It was suggested that Pediococcus species may be used
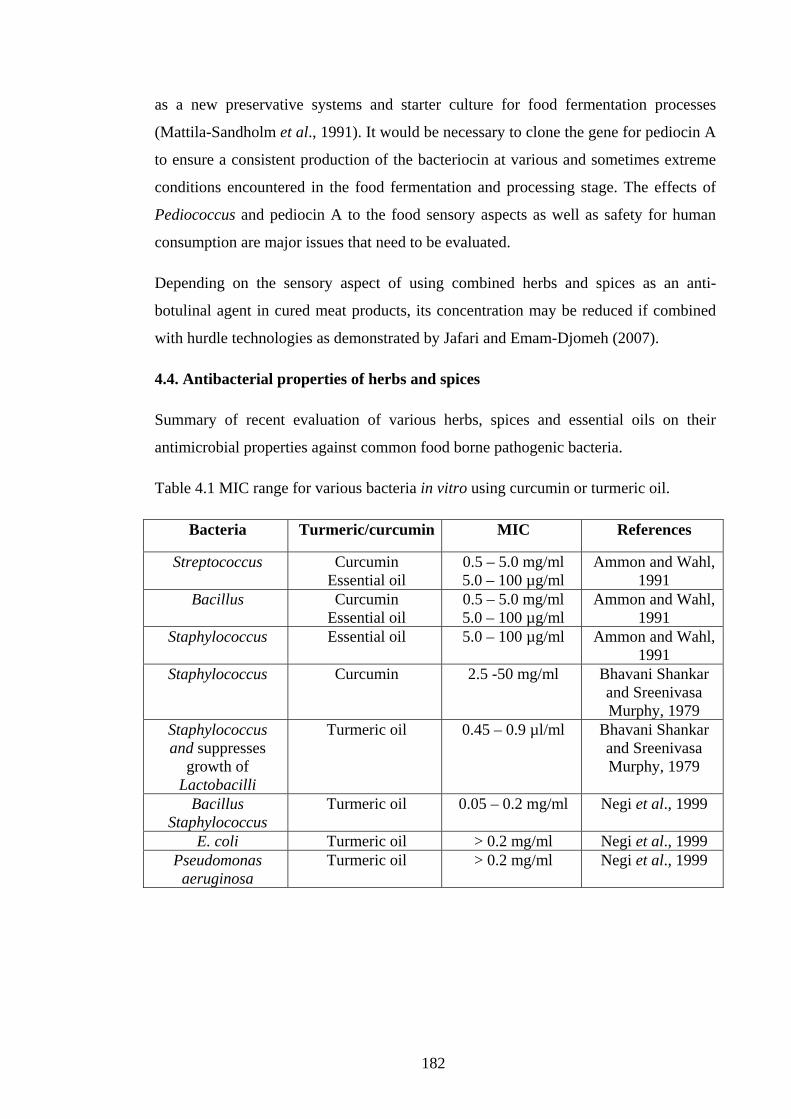
182
as a new preservative systems and starter culture for food fermentation processes
(Mattila-Sandholm et al., 1991). It would be necessary to clone the gene for pediocin A
to ensure a consistent production of the bacteriocin at various and sometimes extreme
conditions encountered in the food fermentation and processing stage. The effects of
Pediococcus and pediocin A to the food sensory aspects as well as safety for human
consumption are major issues that need to be evaluated.
Depending on the sensory aspect of using combined herbs and spices as an anti-
botulinal agent in cured meat products, its concentration may be reduced if combined
with hurdle technologies as demonstrated by Jafari and Emam-Djomeh (2007).
4.4. Antibacterial properties of herbs and spices
Summary of recent evaluation of various herbs, spices and essential oils on their
antimicrobial properties against common food borne pathogenic bacteria.
Table 4.1 MIC range for various bacteria in vitro using curcumin or turmeric oil.
Bacteria Turmeric/curcumin MIC References
Streptococcus
Curcumin Essential oil
0.5 – 5.0 mg/ml 5.0 – 100 µg/ml
Ammon and Wahl, 1991
Bacillus Curcumin Essential oil
0.5 – 5.0 mg/ml 5.0 – 100 µg/ml
Ammon and Wahl, 1991
Staphylococcus Essential oil 5.0 – 100 µg/ml Ammon and Wahl, 1991
Staphylococcus Curcumin 2.5 -50 mg/ml Bhavani Shankar and Sreenivasa Murphy, 1979
Staphylococcus and suppresses
growth of Lactobacilli
Turmeric oil 0.45 – 0.9 µl/ml Bhavani Shankar and Sreenivasa Murphy, 1979
Bacillus Staphylococcus
Turmeric oil 0.05 – 0.2 mg/ml Negi et al., 1999
E. coli Turmeric oil > 0.2 mg/ml Negi et al., 1999 Pseudomonas
aeruginosa Turmeric oil > 0.2 mg/ml Negi et al., 1999
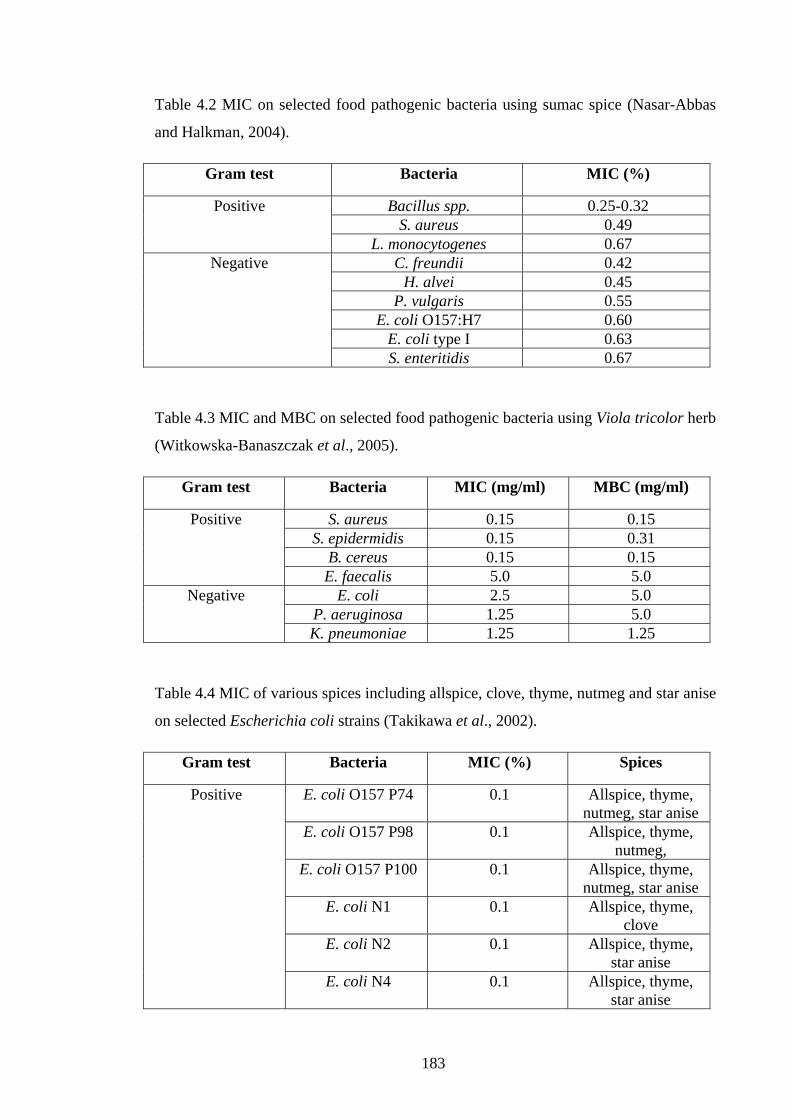
183
Table 4.2 MIC on selected food pathogenic bacteria using sumac spice (Nasar-Abbas
and Halkman, 2004).
Gram test Bacteria MIC (%)
Positive Bacillus spp. 0.25-0.32 S. aureus 0.49
L. monocytogenes 0.67 Negative C. freundii 0.42
H. alvei 0.45 P. vulgaris 0.55
E. coli O157:H7 0.60 E. coli type I 0.63 S. enteritidis 0.67
Table 4.3 MIC and MBC on selected food pathogenic bacteria using Viola tricolor herb
(Witkowska-Banaszczak et al., 2005).
Gram test Bacteria MIC (mg/ml) MBC (mg/ml)
Positive S. aureus 0.15 0.15 S. epidermidis 0.15 0.31
B. cereus 0.15 0.15 E. faecalis 5.0 5.0
Negative E. coli 2.5 5.0 P. aeruginosa 1.25 5.0 K. pneumoniae 1.25 1.25
Table 4.4 MIC of various spices including allspice, clove, thyme, nutmeg and star anise
on selected Escherichia coli strains (Takikawa et al., 2002).
Gram test Bacteria MIC (%) Spices
Positive E. coli O157 P74 0.1 Allspice, thyme, nutmeg, star anise
E. coli O157 P98 0.1 Allspice, thyme, nutmeg,
E. coli O157 P100 0.1 Allspice, thyme, nutmeg, star anise
E. coli N1 0.1 Allspice, thyme, clove
E. coli N2 0.1 Allspice, thyme, star anise
E. coli N4 0.1 Allspice, thyme, star anise

184
Table 4.5 Averaged MIC of classically or high-intensity ultrasound-extracted spices
including ginger, fingerroot and turmeric on various strains of Listeria and Salmonella
(Thongson et al., 2004).
Gram test Bacteria MIC (%) v/v Spices
Positive L. monocytogenes 2.8 Ginger Solvent extraction 0.048 Turmeric
0.076 Fingerroot Negative Salmonella
Typhimurium 6 Ginger
HI-US extraction 7 Turmeric HI-US extraction 6.25 Fingerroot
Table 4.6 Growth and survival of Escherichia coli O157 and Salmonella enterica
serovar Enteritidis in broth model systems and mayonnaise (Leuschner and Zamparini,
2002).
Bacteria Spice Concentration of spice (%)
Significant log reduction
S. enterica Clove 1 Yes (broth) Ginger 1 No
Mustard 1 No Garlic 0.5-1 Yes (mayonnaise)
E. coli O157 Clove 0.5-1 Yes (broth) Ginger 1 No
Mustard 1 No Garlic 0.25-1 No
Table 4.7 Antibacterial activity of clove oil on Listeria monocytogenes in chicken
frankfurters (Mytle et al., 2006).
Bacteria Clove oils concentration (% v/w)
Significant log reduction
L. monocytogenes (7 strains)
1 to 2 Yes (dependent on strains, initial population and storage temperature)
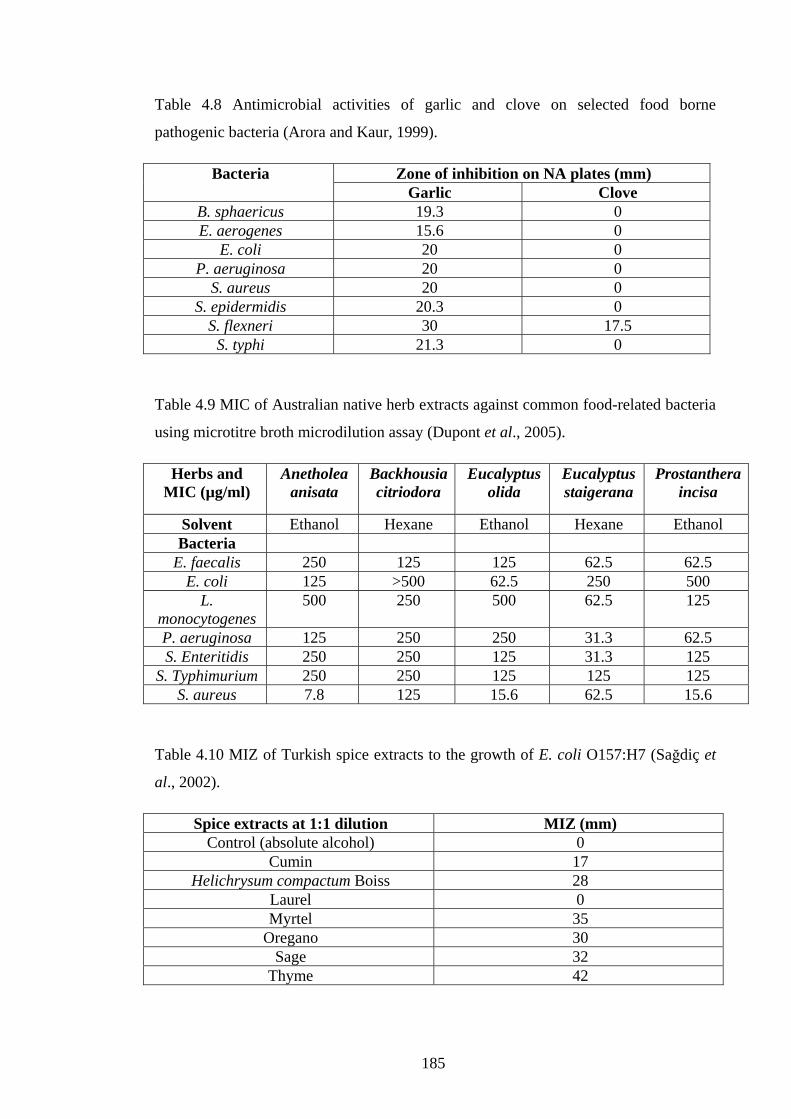
185
Table 4.8 Antimicrobial activities of garlic and clove on selected food borne
pathogenic bacteria (Arora and Kaur, 1999).
Bacteria Zone of inhibition on NA plates (mm) Garlic Clove
B. sphaericus 19.3 0 E. aerogenes 15.6 0
E. coli 20 0 P. aeruginosa 20 0
S. aureus 20 0 S. epidermidis 20.3 0
S. flexneri 30 17.5 S. typhi 21.3 0
Table 4.9 MIC of Australian native herb extracts against common food-related bacteria
using microtitre broth microdilution assay (Dupont et al., 2005).
Herbs and MIC (µg/ml)
Anetholea anisata
Backhousia citriodora
Eucalyptus olida
Eucalyptus staigerana
Prostanthera incisa
Solvent Ethanol Hexane Ethanol Hexane Ethanol Bacteria
E. faecalis 250 125 125 62.5 62.5 E. coli 125 >500 62.5 250 500
L. monocytogenes
500 250 500 62.5 125
P. aeruginosa 125 250 250 31.3 62.5 S. Enteritidis 250 250 125 31.3 125
S. Typhimurium 250 250 125 125 125 S. aureus 7.8 125 15.6 62.5 15.6
Table 4.10 MIZ of Turkish spice extracts to the growth of E. coli O157:H7 (Sağdiç et
al., 2002).
Spice extracts at 1:1 dilution MIZ (mm) Control (absolute alcohol) 0
Cumin 17 Helichrysum compactum Boiss 28
Laurel 0 Myrtel 35
Oregano 30 Sage 32
Thyme 42
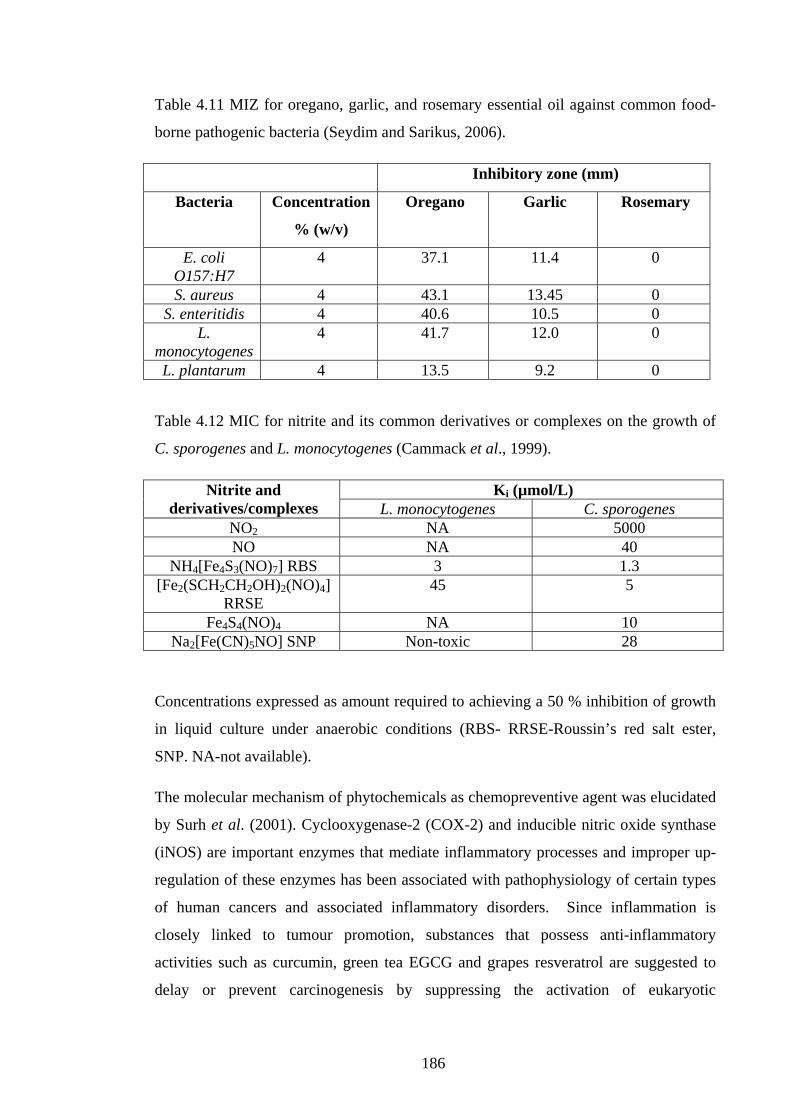
186
Table 4.11 MIZ for oregano, garlic, and rosemary essential oil against common food-
borne pathogenic bacteria (Seydim and Sarikus, 2006).
Inhibitory zone (mm)
Bacteria Concentration
% (w/v)
Oregano Garlic Rosemary
E. coli O157:H7
4 37.1 11.4 0
S. aureus 4 43.1 13.45 0 S. enteritidis 4 40.6 10.5 0
L. monocytogenes
4 41.7 12.0 0
L. plantarum 4 13.5 9.2 0
Table 4.12 MIC for nitrite and its common derivatives or complexes on the growth of
C. sporogenes and L. monocytogenes (Cammack et al., 1999).
Nitrite and derivatives/complexes
Ki (µmol/L) L. monocytogenes C. sporogenes
NO2 NA 5000 NO NA 40
NH4[Fe4S3(NO)7] RBS 3 1.3 [Fe2(SCH2CH2OH)2(NO)4]
RRSE 45 5
Fe4S4(NO)4 NA 10 Na2[Fe(CN)5NO] SNP Non-toxic 28
Concentrations expressed as amount required to achieving a 50 % inhibition of growth
in liquid culture under anaerobic conditions (RBS- RRSE-Roussin’s red salt ester,
SNP. NA-not available).
The molecular mechanism of phytochemicals as chemopreventive agent was elucidated
by Surh et al. (2001). Cyclooxygenase-2 (COX-2) and inducible nitric oxide synthase
(iNOS) are important enzymes that mediate inflammatory processes and improper up-
regulation of these enzymes has been associated with pathophysiology of certain types
of human cancers and associated inflammatory disorders. Since inflammation is
closely linked to tumour promotion, substances that possess anti-inflammatory
activities such as curcumin, green tea EGCG and grapes resveratrol are suggested to
delay or prevent carcinogenesis by suppressing the activation of eukaryotic
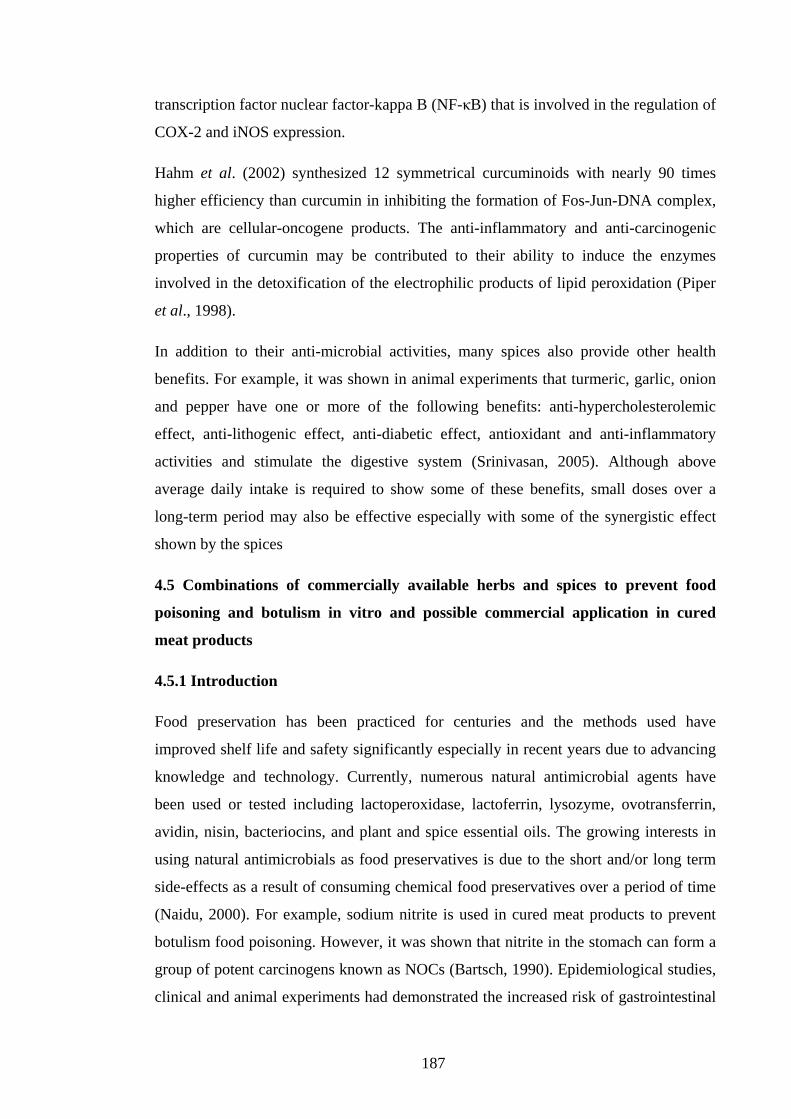
187
transcription factor nuclear factor-kappa B (NF-κB) that is involved in the regulation of
COX-2 and iNOS expression.
Hahm et al. (2002) synthesized 12 symmetrical curcuminoids with nearly 90 times
higher efficiency than curcumin in inhibiting the formation of Fos-Jun-DNA complex,
which are cellular-oncogene products. The anti-inflammatory and anti-carcinogenic
properties of curcumin may be contributed to their ability to induce the enzymes
involved in the detoxification of the electrophilic products of lipid peroxidation (Piper
et al., 1998).
In addition to their anti-microbial activities, many spices also provide other health
benefits. For example, it was shown in animal experiments that turmeric, garlic, onion
and pepper have one or more of the following benefits: anti-hypercholesterolemic
effect, anti-lithogenic effect, anti-diabetic effect, antioxidant and anti-inflammatory
activities and stimulate the digestive system (Srinivasan, 2005). Although above
average daily intake is required to show some of these benefits, small doses over a
long-term period may also be effective especially with some of the synergistic effect
shown by the spices
4.5 Combinations of commercially available herbs and spices to prevent food
poisoning and botulism in vitro and possible commercial application in cured
meat products
4.5.1 Introduction
Food preservation has been practiced for centuries and the methods used have
improved shelf life and safety significantly especially in recent years due to advancing
knowledge and technology. Currently, numerous natural antimicrobial agents have
been used or tested including lactoperoxidase, lactoferrin, lysozyme, ovotransferrin,
avidin, nisin, bacteriocins, and plant and spice essential oils. The growing interests in
using natural antimicrobials as food preservatives is due to the short and/or long term
side-effects as a result of consuming chemical food preservatives over a period of time
(Naidu, 2000). For example, sodium nitrite is used in cured meat products to prevent
botulism food poisoning. However, it was shown that nitrite in the stomach can form a
group of potent carcinogens known as NOCs (Bartsch, 1990). Epidemiological studies,
clinical and animal experiments had demonstrated the increased risk of gastrointestinal
188
cancers such as stomach cancer in countries where high intake of nitrite is common in
the diet (Jossens et al., 1996).
Clostridium species thrive in meat products because of their requirement for 13 amino
acids that they cannot synthesize and their spores can be found in meat products and
multiply when the conditions are optimal for their growth (Andersson et al., 1995). The
economic impact associated with Clostridia related outbreak was estimated to be
around US$12.5 billion annually (Juneja et al., 2006a). Furthermore, many cases of
food poisoning outbreaks caused by C. perfringens are not reported due to its mild and
short incubation period (Brynestad and Granum, 2002) and was estimated at around
250,000 cases annually in the United States, including about 41 hospitalization and
seven deaths. It is therefore in the best interests of the food provider and the public to
ensure the safety of the food due to the financial burden as a result of a food poisoning
outbreak and the possible lethal outcome in case of botulism food poisoning.
Most food borne botulism outbreaks are actually the result of home-processed or home-
canned foods. Outbreaks due to commercial products are rare but do occur
sporadically. C. botulinum and their sub-types have different optimal growth conditions
and their spores can contaminate food and grow and produce toxins when conditions
are right (Rhodehamel et al., 1992). Most essential oils from aromatic plants and spices
have GRAS status and some are routinely used in food industry mainly as flavoring or
coloring compounds. However, recent studies have shown that many of these
compounds also possess antimicrobial properties against a range of spoilage and
pathogenic bacteria, yeasts, and moulds (Chaibi et al., 1997).
Therefore it was the aim of this study to determine, using an in vitro method, the
minimum inhibitory concentrations of readily available herbs and spices, singly and in
combination, on the growth inhibition against Clostridium sporogenes (as a surrogate
for C. botulinum) as well as other common food borne pathogenic bacteria.
4.5.2 Materials and Methods
The minimum inhibitory concentration was demonstrated in vitro using herbs and
spices either singly or in different combinations against common food borne bacteria
and C. sporogenes.

189
4.5.2.1 Bacterial cultures
All bacterial strains tested were provided by the Microbiological Culture Collection at
the School of Biotechnoloy and Biomolecular Sciences at University of New South
Wales. Detail of strains: B. cereus UNSW011100T (CSIRO Food Research), C.
sporogenes UNSW005600 (School of Medicine, Universitry of Sydney), E. coli
UNSW002500, L. monocytogenes UNSW 028700, S. enteritidis UNSW031901, and S.
aureus UNSW002100 (Prince of Wales Hospital).
4.5.2.2 Reagents and media
Chemical grade sodium nitrite from Univar was used. Nutrient agar and broths, peptone
water, re-enforced Clostridial agar and medium were supplied by Oxoid and were made
up according to instructions provided by the manufacturer.
4.5.2.3 Herbs and spices
Different brands of dried packaged herb and spices as well as fresh raw garlic were
purchased from supermarkets. The garlic was peeled then blended prior to use. Herb
included rosemary, sage, thyme and spices included grounded chili, ginger, and
turmeric and analytical grade curcumin from Sigma catalogue number C1386. Herbs
and spices were extracted at 60 oC in nutrient broths.
4.5.2.4 MIC to common food borne pathogenic bacteria
Herbs and spices were made up to 1.0, 3.0 and 5.0 % (w/v) either individually or in
combination at 50:50 in 9.0 ml nutrient broth tubes. These were then UV sterilized for
20 minutes then either incubated at 60 oC for 30 minutes or autoclaved at 121 oC for 15
minutes. Aliquots of 0.1 ml were taken out and streaked onto nutrient agar plates and
incubated at 37 oC for 24 hr to ensure no contaminations. One ml of each test bacteria
was transferred into four nutrient broth tubes with three different concentrations and
one as control without the test substance. All nutrient broth tubes were then incubated
at 37 oC for 24 hours then 0.1 ml of the aliquot were taken out and serially diluted with
sterilized peptone water and 0.1 ml of each was added to duplicate nutrient agar plates
and spread with glass rod and incubated at 37 oC for 24 hr for total live bacteria count.
At 48 hrs further samples were taken for dilution and spread plate. Pure bacterial
190
cultures were re-streaked every week and grown in nutrient broths with the exception
of C. sporogenes.
Similarly for C. sporogenes, herb and spices were made up to three concentrations as
above except in 9.0 ml reinforced Clostridial broth tubes. Incubation and extraction
conditions were the same as above except Clostridial broth tubes were sealed and
Clostridial plates were incubated in anaerobic jars. In addition, 5.0 and 10.0 % (w/v) of
sodium nitrite was made up for assessing the growth inhibition efficiency of the test
substances. All reinforced Clostridial agar plates were incubated at 37 oC for 24 hours
in anaerobic jars with nutrient agar plates incubated aerobically under the same
condition. Pure cultures were re-streaked every week and grown on reinforced
Clostridial agar plate in anaerobic jars.
4.5.3 Results and discussion
Various herbs and spices tested showed total growth inhibition between 0.1 and 5.0 %
(w/v) against common food borne bacteria within 72 hr (Table 4.13). Table 4.13
showed the MIC for all the bacteria tested and positive herbs and spices used. Results
for sage, thyme and curcumin were not show since no inhibition was demonstrated.

191
Table 4.13 MIC (w/v) of common herbs and spices individually or in combination
(50:50) against common food borne pathogenic bacteria in vitro up to 72 hr.
Bacteria Treatment Herb/Spice MIC (w/v) Bacillus cereus Autoclave Turmeric 0 Turmeric:garlic 3.0 Hot water Curcumin 0 Raw garlic 0 Turmeric:chili 0 Turmeric 0.1 Turmeric:garlic 1.0 Turmeric:ginger 1.0 Rosemary 1.0 Escherichia coli Hot water Curcumin 0 Turmeric 0 Turmeric:ginger 0 Turmeric:chili 0 Turmeric:garlic 3.0 Raw garlic 5.0 Listeria monocytogene Autoclave Turmeric 0 Turmeric:garlic 1.0 (48hr) Hot water Raw garlic 5.0 Turmeric:garlic 3.0 Turmeric:ginger 1.0 (48hr) Rosemary 1.0 Salmonella enteritidis Autoclave Turmeric 2.5 (72hr) Hot water Curcumin 0 Raw garlic 5.0 Turmeric:garlic 5.0 Staphylococcus aureus Autoclave Turmeric:garlic 1.0 (48hr) Hot water Turmeric:chili 0 Raw garlic 5.0 Turmeric:garlic 3.0 Turmeric:ginger 3.0 Rosemary 1.0
The combination of herbs and spices may enhance their antimicrobial properties by
synergistic actions. For example, autoclaved turmeric and hot water extracted raw
garlic alone did not inhibit the growth of B. cereus (Table 4.13), but when combined
with garlic it showed growth inhibition at 3.0 % (Table 4.13). Furthermore, hot water
extracted turmeric and garlic showed growth inhibition at lower concentration of 1.0 %
(Table 4.13), suggesting synergistic antibacterial activities. However, high temperature
can result in loss of active agents in some common spices (Srinivasan et al., 1992),

192
which may explain the lack of antibacterial properties in some of the herbs and spices
tested (Table 4.13). Turmeric combined with ginger was also effective at 1.0 %, as well
as rosemary alone (Table 4.13). In contrast Beuchat (1994) demonstrated that raw
garlic extract at 10.0 % (w/v) inhibited the growth of B. cereus on nutrient agar plates,
and was germicidal at 5.0 % against S. aureus. In this study fresh garlic at 5.0 % only
reduced the growth of B. cereus (result not shown), which maybe due to different sub-
species, but at 5.0 % it did inhibit the growth of S. aureus (Table 4.13).
From Table 4.13, MIC for curcumin against tested bacteria was less than 0.5 % (w/v)
and the required concentration was much less for its essential oils. In general higher
concentration of turmeric oil was needed may be because curcumin was the active
antibacterial agent. However, turmeric oil must contain other antibacterial agents to
display inhibition activities. Autoclaved and hot water extracted curcumin did not show
any inhibition (Table 4.13), this is most likely because the active agent can only be
extracted in ethanol and may be destroyed at higher temperatures.
Hot water extracted turmeric and garlic required higher MIC against L. monocytogenes
than autoclaved turmeric and garlic. Suggesting that higher temperature was required to
release the active antibacterial agents. However the latter required longer time before
growth inhibition was demonstrated (Table 4.13). Rosemary was also effective at just
1.0 % and raw garlic at 5.0 % (Table 4.13). Extraction was not required in the case of
fresh garlic where the antibacterial agent allicin is released upon crushing.
From Table 4.5, it was demonstrated that fingerroot or Chinese ginger extracted with
isopropanol-hexane and without HI-US had the highest anti-Listerial effect whereas
HI-US-isopropanol fingerroot extract had the greatest inhibition against Salmonella
Typhimurium (Thongson et al., 2004). Inhibition against L. monocytogenes was also
demonstrated with turmeric combined with ginger at 1.0 % (Table 4.13).
Only hot water extracted raw garlic and turmeric with garlic show growth inhibition
against E. coli at 5.0 and 3.0 %, respectively (Table 4.13). Similarly, only hot water
extracted raw garlic and turmeric with garlic at 5.0 % was effective at inhibiting the
growth of S. enteritidis (Table 1). MIC for S. aureus in hot water extracted raw garlic
and rosemary were 5.0 and 1.0 %, respectively (Table 4.13), whereas the MIC for
turmeric with garlic and turmeric with ginger were both at 3.0 % (Table 4.13).
193
Farbood et al. (1976) demonstrated bactericidal effect of rosemary extract to S. aureus
at 5 % concentration in various meat media. However, there were no effects against
other bacteria tested such as E. coli and S. typhimurium. The lack of antimicrobial
activity in meat systems was suggested to be due to the lack of rosemary extract in the
aqueous phase because of absorption into the solid phase by lipid and protein that are
naturally occurring in meat.
Most antibacterial properties of herbs and spices tested here were lost when autoclaved
suggesting that the active antibacterial agent is heat sensitive (Table 4.13). However,
the antibacterial agent in turmeric and garlic was able to work after 48 to 72 hr against
L. monocytogenes, S. enteritidis, and S. aureus (Table 4.13).
Hot water extracted turmeric with garlic required higher MIC against L. monocytogenes
at 3.0 % than autoclaved turmeric with garlic at only 1.0 % (Table 4.13). However the
latter required a longer time (48 hr) before inhibition of growth was demonstrated
(Table 4.13). It could mean that heat may activate or increase the activity of the
antibacterial agent in turmeric and garlic. Rosemary was effective at 1.0 % against L.
monocytogenes and S. aureus (Table 4.13). In contrast, Seydim and Sarikus (2006)
concluded that rosemary essential oil exhibited no inhibitory effect against S. aureus, S.
enteritidis, L. monocytogenes, and E. coli. This suggests that the antibacterial activity
in rosemary is not just the essential oil; the activity may be associated with other
compounds present in the leaves, perhaps in combination with the oil.
In was demonstrated here that hot water extracted raw garlic at 5.0 % was effective at
inhibiting the growth of S. enteritidis (Table 4.13). The higher concentration used here
resulted in complete inhibition, whereas at 1.0 % used in mayonnaise only gave 10 log
growth reduction (Leuschner and Zamparini, 2002). The delayed growth inhibition may
also be due to other ingredients present in mayonnaise such as salt. In addition, garlic
concentration was reduced to 2.5 % when combined with turmeric at 2.5 % (Table
4.13), suggesting synergistic actions between the two spices.
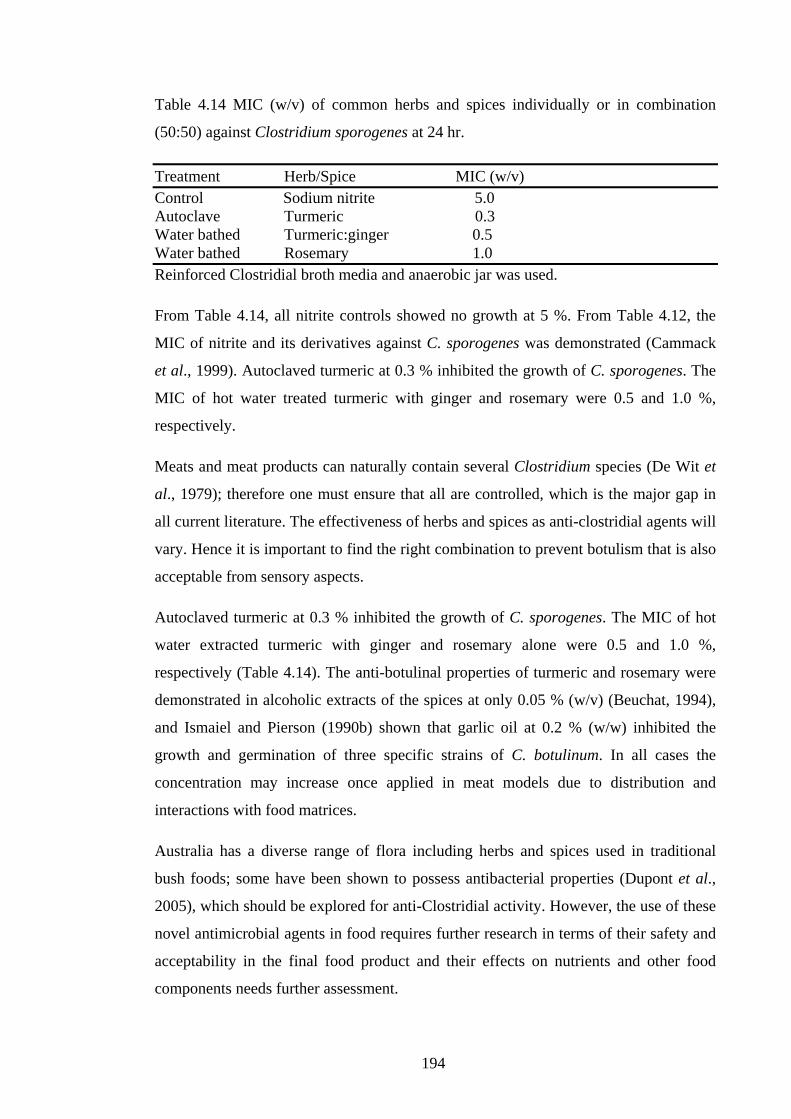
194
Table 4.14 MIC (w/v) of common herbs and spices individually or in combination
(50:50) against Clostridium sporogenes at 24 hr.
Treatment Herb/Spice MIC (w/v) Control Sodium nitrite 5.0 Autoclave Turmeric 0.3 Water bathed Turmeric:ginger 0.5 Water bathed Rosemary 1.0 Reinforced Clostridial broth media and anaerobic jar was used.
From Table 4.14, all nitrite controls showed no growth at 5 %. From Table 4.12, the
MIC of nitrite and its derivatives against C. sporogenes was demonstrated (Cammack
et al., 1999). Autoclaved turmeric at 0.3 % inhibited the growth of C. sporogenes. The
MIC of hot water treated turmeric with ginger and rosemary were 0.5 and 1.0 %,
respectively.
Meats and meat products can naturally contain several Clostridium species (De Wit et
al., 1979); therefore one must ensure that all are controlled, which is the major gap in
all current literature. The effectiveness of herbs and spices as anti-clostridial agents will
vary. Hence it is important to find the right combination to prevent botulism that is also
acceptable from sensory aspects.
Autoclaved turmeric at 0.3 % inhibited the growth of C. sporogenes. The MIC of hot
water extracted turmeric with ginger and rosemary alone were 0.5 and 1.0 %,
respectively (Table 4.14). The anti-botulinal properties of turmeric and rosemary were
demonstrated in alcoholic extracts of the spices at only 0.05 % (w/v) (Beuchat, 1994),
and Ismaiel and Pierson (1990b) shown that garlic oil at 0.2 % (w/w) inhibited the
growth and germination of three specific strains of C. botulinum. In all cases the
concentration may increase once applied in meat models due to distribution and
interactions with food matrices.
Australia has a diverse range of flora including herbs and spices used in traditional
bush foods; some have been shown to possess antibacterial properties (Dupont et al.,
2005), which should be explored for anti-Clostridial activity. However, the use of these
novel antimicrobial agents in food requires further research in terms of their safety and
acceptability in the final food product and their effects on nutrients and other food
components needs further assessment.
195
The justification of testing these spices was because many cured meat products uses
one or more of the spices tested. Furthermore, the synergistic effects of combined herbs
and spices have not been explored, specifically as an anti-Clostridia agent in cured
meat products. The availability and inexpensiveness of herbs and spices may also be
useful for preventing food poisoning in home made cured products, where botulism is
common.
4.5.4 Conclusion
Out of the herbs and spices tested alone or in combination showed some degree of in
vitro antibacterial activity against food borne pathogenic bacteria including C.
sporogenes. The use of moderate heat as the extraction step generally minimized the
loss of the active compounds in herbs and spices. In addition, the inexpensiveness and
wide availability of the herbs and spices may be used to prevent food poisoning in
home made food where botulism is very common. However, the antibacterial
properties of combined herbs and spices should be tested in meat models and evaluated
for their suitability in the final product in order to replace nitrite and minimize dietary
nitrite intake and indirectly reduce the risk of developing gastrointestinal cancers in
susceptible populations.

196
4.6 References
Ahn, H.J., Kim, J.H., Jo, C., Lee, J.W., Yook, H.S., and Byun, M.W. 2004. Effects of gamma irradiation on residual nitrite, residual ascorbate, color, and N-nitrosamines of cooked sausage during storage. Food Control, 15:197-203.
Ammon, H.P.T., and Wahl, M.A. 1991. Pharmacology of Curcuma longa. Planta Medica, 57:1-7.
Andersson, A., Rönner, U., and Granum, P. E. 1995. What problems does the food industry have with the spore-forming pathogens Bacillus cereus and Clostridium perfringens?. International Journal of Food Microbiology, 28:145-155.
Arora, D.S., and Kaur, J. 1999. Antimicrobial activity of spices. International Journal of Antimicrobial Agents, 12:257-262.
Bartsch, H., Ohshima, H., Shuker, D., Pignatelli, B., and Calmels, S. 1990. Exposure of humans to endogenous N-nitroso compounds: implications in cancer etiology. Mutation Research, 238:255-267.
Banerjee, M., and Sarkar, P. K. 2004. Growth and enterotoxin production by sporeforming bacterial pathogens from spices. Food Control, 15:491-496.
Beuchat, L.R. 1994. ‘Antimicrobial properties of spices and their essential oils’ in Natural Antimicrobial Systems and Food Preservation. eds. V.M. Dillon and R.G. Board. CAB International, United Kingdom.
Bhavani Shankar, T.N., and Sreenivasa Murphy, V. 1979. Effect of turmeric (Curcuma longa) fractions on the growth of some intestinal and pathogenic bacteria in vitro. Indian Journal of Experimental Biology, 17:1363-1366.
Brynestad, S., and Granum, P.E. 2002. Clostridium perfringens and foodborne infections. International Journal of Food Microbiology, 74:195-202.
Byun, M.W., Lee, J.W., Yook, H.S., Lee, K.H., and Kim, H.Y. 2002. Improvement of shelf stability and processing properties of meat products by gamma irradiation. Radiation Physics and Chemistry, 63:361-364.
Cammack, R., Joannou, C.L., Cui, X-Y., Martinez, C.T., Maraj, S.R., and Hughes, M.N. 1999. Nitrite and nitrosyl compounds in food preservation. Biochimica et Biophysica Acta, 1411:475-488.
Chaibi, A., Ababouch, L.H., Belasri, K., Boucetta, S., and Busta, F.F. 1997. Inhibition of germination and vegetative growth of Bacillus cereus T and Clostridium botulinum 62A spores by essential oils. Food Microbiology, 14:161-174.
Daifas, D. P., Smith, J.P., Blanchfield, B., Sanders, G., Austin, J. W. and Koukoutisis, J. 2004. Effects of mastic resin and its essential oil on the growth of proteolytic Clostridium botulinum. International Journal of Food Microbiology, 94:313-322.
De Wit, J.C., Notermans, S., Gorin, N., and Kampelmacher, E.H. 1979. Effect of garlic oil or onion oil on toxin production by Clostridium botulinum in meat slurry. Journal of Food Protection, 42:222-224.

197
Dupont, S., Caffin, N., Bhandari, B., and Dykes, G.A. 2005. In vitro antibacterial activity of Australian native herb extracts against food-related bacteria. Food Control, 17:929-932.
Farbood, M.I., MacNeil, J.H., and Ostovar, K. 1976/. Effect of rosemary spice extractive on growth of microorganisms in meats. Journal of Milk and Food Technology, 39:675-679.
Foodborne Disease Working Party. 1997. Foodborne disease: Towards reducing foodborne illness in Australia. Technical Report Series No. 2, Communicable Diseases Network Australia and New Zealand, New South Wales.
Gescher, A. J., Sharma, R., A., and Steward, W. P. 2001. Cancer chemoprevention by dietary constituents: a tale of failure and promise. The Lancet Oncology, 2:371-379.
Glass, K. A., and Eric A. Johnson, E. A. 2004. Antagonistic effect of fat on the antibotulinal activity of food preservatives and fatty acids. Food Microbiology, 21: 675-682. Hahm, E-R., Cheon, G., Lee, J., Kim, B., Park, C., and Yang, C-H. 2002. New and known symmetrical curcumin derivatives inhibit the formation of Fos-Jun-DNA complex. Cancer Letters, 184:89-96.
Huhtamen, C.N. 1980. Inhibition of Clostridium botulinum by spice extracts and aliphatic alcohols. Journal of Food Protection, 43:195-196. Ismaiel, A.A., and Pierson, M.D. 1990a. Effect of sodium nitrite and origanum oil on growth and toxin production of Clostridium botulinum in TYG broth and ground pork. Journal of Food Protection, 53:958-960. Ismaiel, A.A., and Pierson, M.D. 1990b. Inhibition of germination, outgrowth, and vegetative growth of Clostridium botulinum 67B by spice oils. Journal of Food Protection, 53:755-758.
Ismaiel, A.A., and Pierson, M.D. 1990c. Inhibition of growth and germination of C. botulinum 33A, 40B, and 1623E by essential oil of spices. Journal of Food Science, 55:1676-1678.
Jafari, M., and Emam-Djomeh, Z. 2007. Reducing nitrite content in hot dogs by hurdle technology. Food Control, 18:1488-1493.
Jo., C., Ahn, H.J., Son, J.H., Lee, J.W., and Byun, M.W. 2003. Packaging and irradiation effect on lipid oxidation, color, residual nitrite content, and nitrosamine formation in cooked pork sausages. Food Control, 14:7-12.
Johnson, M.G., and Vaughn, R.H. 1969. Death of Salmonella typhimurium and Escherichia coli in the presence of freshly reconstituted dehydrated garlic and onin. Applied Microbiology, 17:903-905.
Joossens, J.V., Hill, M.J., Elliott, P., Stamler, R., Stamler, J., Lesaffre, E., Dyer, A., Nichols, R., and Kesteloot, H. 1996. Dietary salt, nitrate and stomach cancer mortality in 24 countries. International Journal of Epidemiology, 25:494-504.

198
Juneja, V.K., Huang, L-H., and Thippareddi, H.H. 2006a. Predictive model growth of Clostridium perfringens in cooked cured pork. International Journal of Food Microbiology, 110:85-92.
Juneja, V.K., Fan, X., Pena-Ramos, A., Diaz-Cinco, M., and Pacheco-Aguilar, R. 2006b. The effect of grapefruit extract and temperature abuse on growth of Clostridium perfringens from spore inocula in marinated, sous-vide chicken products. Innovative Food Science and Emerging Technologies, 7:100-106.
Leuschner, R.G.K., and Zamparini, J. 2002. Effects of spices on growth and survival of Escherichia coli O157 and Salmonella enterica serovar Enteritidis in broth model systems and mayonnaise. Food Control, 13:399-404.
Lindström, M., Kiviniemi, K., and Korkeala, H. 2006. Hazard and control of group II (non-proteolytic) Clostridium botulinum in modern food processing. International Journal of Food Microbiology, 108:92-104.
Maheshwari, R.K., Singh, A.K., Gaddipati, J. and Srimal, R.C. 2006. Multiple biological activities of curcumin: A short review. Life Sciences, 78:2081-2087.
Mattila-Sandholm, T., Haikara, A., and E. Skyttä, E. 1991. The effect of Pediococcus damnosus and Pediococcus pentosaceus on the growth of pathogens in minced meat. International Journal of Food Microbiology, 13:87-94.
Mead, G.C. 1985. Selective and differential media for Clostridium perfringens. International Journal of Food Microbiology, 2:89-98.
Munro, R. 1989. Patterns of resistance to anaerobic organisms in Australia. Diagnostic Microbiology and Infectious Disease, 12:159-163. Mytle, N., Anderson, G.L., Doyle, M.P. and Smith, M.A. 2006. Antimicrobial activity of clove (Syzgium aromaticum) oil in inhibiting Listeria monocytogenes on chicken frankfurters. Food Control, 17:102-107.
Naidu, A. S. ed. 2000. Natural Food Antimicrobial Systems. CRC Press, United States.
Nasar-Abbas, S.M., and Halkman, A.K. 2004. Antimicrobial effect of water extract of sumac (Rhus coriaria L.) on the growth of some food borne bacteria including pathogens. International Journal of Food Microbiology, 97:63-69.
Negi, P. S., Jayaprakasha, G. K., Jagan Mohan Rao, L., and Sakariah, K. K. 1999. Antibacterial activity of turmeric oil: A byproduct from curcumin manufacture. Journal of Agricultural Food Chemistry, 47:4297-4300.
Østerlie, M., and Lerfall, J. 2005. Lycopene from tomato products added minced meat: Effect on storage quality and colour. Food Research International, 38:925-929.
Pfeiffer, E., Höhle, S., Solyom, A. M., and Metzler, M. 2003. Studies on the stability of turmeric constituents. Journal of Food Engineering, 56:257-259.
Piper, J.T., Singhal, S.S., Salameh, M.S., Torman, R.T., Awasthi, Y.C., and Awasthi, S. 1998. Mechanisms of anticarcinogenic properties of curcumin: the effect of curcumin on glutathione linked detoxication enzymes in rat liver. The International Journal of Biochemistry and Cell Biology, 30:445-456.
199
Rhodehamel, E.J., Reddy, N.R., and Pierson, M.D. 1992. Botulism: the causative agent and its control in foods. Food Control, 3:125-143.
Sağdiç, O., Kuşçu, A., Özcan, M., and Özçelik, S. 2002. Effects of Turkish spice extracts at various concentrations on the growth of Escherichia coli O157:H7. Food Microbiology, 19:473-480.
Seydim, A.C., and Sarikus, G. 2006. Antimicrobial activity of whey protein based edible films incorporated with oregano, rosemary and garlic essential oils. Food Research International, 39:639-644.
Shelef, L.A., Jyothi, E.K., and Bulgarelli, M.A. 1984. Growth of enteropathogenic and spoilage bacteria in sage-containing broth and foods. Journal of Food Science, 49:737-740.
Shishu, Singla, A.K., and Kaur, I.P. 2003. Inhibitory effect of dibenzoylmethane on mutagenicity of food-derived heterocyclic amine mutagens. Phytomedicine, 10:575-582.
Sprong, R. C., Hulstein, M. F. E., and van der Meer, R. 2002. Bovine milk fat components inhibit food-borne pathogens. International Dairy Journal, 12:209-215.
Srinivasan, K., Sambaiah, K., and Chandrasekhara, N. 1992. Loss of active principles of common spices during domestic cooking. Food Chemistry, 43:271-274.
Srinivasan, K. 2005. Spices as influencers of body metabolism: an overview of three decades of research. Food Research International, 38:77-86.
Surh, U-J., Chun, K-S., Cha, H-H., Han, S. S., Keum, Y-S., Park, K-K., and Lee, S. S. 2001. Molecular mechanisms underlying chemopreventive activities of anti-inflammatory phytochemicals: Down-regulation of COX-2 and iNOS through suppression of NF-κB activation. Mutation Research, 480-481:243-268.
Takikawa, A., Abe, K., Yamamoto, M., Ishimaru, S., Yasui, M., Okubo, Y., and Yokoigawa, K. 2002. Antimicrobial activity of nutmeg against Escherichia coli O157. Journal of Bioscience and Bioengineering, 94:315-320.
Thongson, C., Davidson, P.M., Mahakarnchanakul, W., and Weiss, J. 2004. Antimicrobial activity of ultrasound-assisted solvent-extracted spices. Letters in Applied Microbiology, 39:401-406.
Witkowska-Banaszczak, E., Bylka, W., Matlawska, I., Goślińska, O., and Muszyński, Z. 2005. Antimicrobial activity of Viola tricolor herb. Fitoterapia, 76:458-46.

200
Chapter 5
Conclusions
5.1 Overview to experimental aim one and major findings
Nitrate and nitrite in Australian food supply was determined and their estimated dietary
intake was shown to be higher than the recommended dietary intake. However, these
intakes were based on the upper extreme on high dietary sources of nitrate and nitrite.
Thus depending on the dietary practices of individuals, the dietary intake of these
anions may not pose a significant public health issue due to the formation of N-nitroso
compounds in vivo.
5.1 Overview to experimental aim two and major findings
The consumption of one serving of cured meat with a low nitrate and nitrite diet did not
produce detectable N-nitrosodimethylamine in vivo. Therefore the supplementation of
500 mg vitamin C did not show a reduction in N-nitrosodimethylamine in vivo.
However, if the diet consisted of high nitrate containing vegetables and other high
nitrite containing meat then a reduction of N-nitrosomethylamine would be expected.
5.3 Overview to experimental aim three and major findings
Turmeric, ginger and rosemary leaves showed inhibition against C. sporogenes in vitro.
In addition, these spices along with garlic displayed growth inhibition against other
common foodborne bacteria including E. coli, L. monocytogenes, S. enteritidis and S.
aureus. There is a potential to add these spices in the formulation of cured meat
products to reduce the use of sodium nitrite thus minimising their dietary intake.

201
Appendix A
Participation information statement and consent form
THE UNIVERSITY OF NEW SOUTH WALES
Fate of nitrates and nitrites in food and body
[Participant selection and purpose of study]
You (i.e. the research participant) are invited to participate in a study of nitrates and
nitrites in the body. We James Hsu and Dr. Jayashree Arcot hope to learn the rate of
nitrite reduction to nitrate in the saliva, and to minimize potential carcinogen
formation in vivo using vitamin C. You were selected as a possible participant in this
study because you are over 18 years of age and are healthy.
[Description of study and risks]
If you decide to participate, we will ask you to provide saliva and urine samples first
thing in the morning, rinse your mouth with nitrate containing water and collect saliva,
then chew cured meat (salami, ham, sausage) and collect saliva. Same meat will then
be provided with bread for consumption followed by a urine sample after 3 hours. The
next day after fasting overnight, you will be asked to consume the same meat with
bread then provide a urine sample after 3 hours.
Discomforts may be to follow a diet without cured meat, green leafy vegetables and
fruits for 48 hours except cured meat provided during the study. Providing saliva and
urine samples is not invasive but may cause embarrassment which is minimised if done
at the privacy of the participant’s home. Participant is required to bring the bodily
fluid samples to UNSW for storage twice. Total participation time is about 48 hours but
actual experimental time for collecting bodily fluids and eating food provided is only
about 20 minutes in total during the 48 hours period.
Risks are minimal if participant is healthy and eats a variety of other fresh meats and
vegetables. Alternatively, experiment can be done on university campus, within the

202
School of Chemical Sciences and Engineering, if participant is unsure or if it is more
convenient.
[Confidentiality and disclosure of information]
Any information that is obtained in connection with this study and that can be
identified with you will remain confidential and will be disclosed only with your
permission, except as required by law. If you give us your permission by signing this
document, we plan to discuss/publish the results in scientific journals in the form of
averaged numbers and statistics reported in the result section. In any publication,
information will be provided in such a way that you cannot be identified.
[Recompense to participants]
One movie voucher per participant will be given to compensate for their time, and
transport costs (cheapest option) will be covered if student needs to come to the
University for the sole purpose of the experiment on the day.
Complaints may be directed to the Ethics Secretariat, The University of New South
Wales, SYDNEY 2052 AUSTRALIA (phone 9385 4234, fax 9385 6648, email
[email protected]). Any complaint you make will be investigated promptly and
you will be informed of the outcome.
[Feedback to participants]
If requested, a summary of research findings will be sent to the participants as email,
mail or fax based on their preferred method of contact.
[Your consent]
Your decision whether or not to participate will not prejudice your future relations with
the University of New South Wales. If you decide to participate, you are free to
withdraw your consent and to discontinue participation at any time without prejudice.
If you have any questions, please feel free to ask us. If you have any additional
questions later, Mr. James Hsu, 0410 465 130 or Dr. Jayashree Arcot 9385 5360 will
be happy to answer them.
203
EXPERIMENTAL BACKGROUND AND PROCEDURES
INTRODUCTION
Nitrite salt is used as a chemical preservative in cured meat to prevent a type of food
poisoning called botulism. However, nitrite can react with food in the stomach to form
a group of potent carcinogens known collectively as N-nitroso compounds (NOCs),
which increases the risk of developing stomach cancer in the long term. Nitrate
naturally found in vegetables can be reduced to nitrite by oral bacteria in the mouth,
which also contributes to the daily intake of nitrite. Vitamin C (ascorbic acid) is known
to reduce the formation of NOCs such as Nitrosodimethylamine (NDMA).
This study will estimate the amount of nitrate reduction to nitrite in the oral cavity of
humans, and the effect of vitamin C on NDMA formation in vivo (in the body) after the
consumption of cured meat and vitamin C supplement.
SCIENTIFIC MERITS
Diet consisting of vegetables and cured meat contributes to a person’s daily intake of
nitrates and nitrites, the latter can increase the risk of stomach cancer. However, oral
bacteria in the mouth can also increase one’s daily dietary intake of nitrite. Therefore
by measuring the amount of nitrate and nitrite in foods and understanding factors
involved in the conversion rate of nitrate to nitrite in the oral cavity, one can estimate
the total dietary intake of nitrates and nitrites. This study will gain useful insights on
nitrate and nitrite conversion in vivo, and study the potential of vitamin C to greatly
reduce the formation of NDMA. This may also encourage meat manufacturers to find
and use healthier alternatives to sodium nitrite.
EXPERIMENTAL PROCEDURE
AIMS: To determine the rate of nitrate reduction to nitrite in human oral cavities; and
to understand the effects of ascorbic acid (vitamin C) on the production of NDMA
(carcinogen) in human urine.

204
HYPOTHESES: 1. The rate of nitrate reduction in the oral cavity should vary between
individuals due to differences in the oral microflora, diet, lifestyle and medications. 2.
Diet without vitamin C supplement should produce more NDMA in their urine
compared to the same diet with vitamin C supplement.
MATERIALS AND METHODS:
Day 1
1. Collect materials OR participate at UNSW and sign a consent form.
2. Follow a restricted diet (Appendix A) for today and tomorrow-resume normal diet
after Day 3. Two (2) breakfast provided for Days 2 and 3.
3. Store all meat samples and one water jar in the fridge.
Day 2 (store all biological samples in fridge then bring them to me on completion of
each day’s tasks, OR come to university and do it).
On waking: (after overnight fasting and don’t brush teeth yet):
1. Provide urine in 2 L urine bottle marked (1). Contains sodium hydroxide (corrosive:
DO NOT TOUCH OR EAT!)
2. Chew the chewing gum periodically and spit out saliva into 50 mL yellow cap
specimen jar marked A to red marked line (may take up to 5 mins, discard chewing
gum). Contains sodium hydroxide (corrosive: DO NOT TOUCH OR EAT!)
Tasks:
3. Rinse mouth thoroughly with tap water.
4. Rinse mouth with nitrate-water marked D for 30 sec then spit all into a yellow cap
specimen jar marked B. (DO NOT DRINK).
5. Rinse mouth thoroughly with tap water.
6. Chew meat (Snap lock A) provided for 30 sec then spit into yellow cap specimen jar
marked C (DO NOT EAT MEAT).
7. Brush your teeth as usual then rinse with tap water thoroughly.
8. Eat the meat sandwich (at least eat all the meat, snap lock B) provided then do not
eat or drink anything for 3 hrs (water ok).

205
9. After 3 hrs provide urine sample in the second urine bottle marked (2)(If necessary
collect urine for up to 3 hrs in that bottle).
10. Bring all samples collected today to me (contact details below).
Day 3
On waking :
1. Discard urine and brush teeth then rinse thoroughly with tap water.
Tasks:
2. Eat the meat sandwich (Snap lock C) provided and the vitamin C tablet (in foil wrap)
then do not eat or drink anything for 3 hrs (water ok).
3. After 3 hrs provide urine sample in the third urine bottle marked (3)(If necessary
collect urine for up to 3 hrs in that bottle).
4. Bring all samples collected today to me.
5. Collect your movie voucher and thank you for your participation (resume normal
diet).

206
FLOW CHART
Human Trials:
Nitrate reduction in the oral cavity; and the effect of Vitamin C on NDMA formation in vivo
DAY 1
Take home
3 x urine bottles 3 x saliva specimen jars
3 x meat samples 1 x nitrate water
1 x vitamin C tablet 1 x chewing gum
DAY 2
On Waking provide:
1 x urine sample (1)
1 x saliva sample (A)
DAY 3
On Waking:
1. Discard urine
2. Brush teeth
Tasks (morning):
1. Nitrate water rinse, provide saliva (B)
2. Chew meat (A), provide saliva (C)
3. Eat meat (B1)
3 hours fasting:
1 x urine sample (2)(or collect urine up to 3 hr
after meat consumption)
Return samples to me
Tasks (morning):
1. Eat meat (B2) 2. Take one (1) vitamin C
tablet provided
3 hours fasting:
1 x urine sample (3)(or collect urine up to 3 hr
from meat consumption)
Resume usual diet after providing urine sample.
Avoid foods (Appendix A):
Vitamin C rich e.g. vegetables and fruits. Also avoid all cured meat except ones given.
207
CONCLUSION
Diet and lifestyle contributes to significant number of preventable cancers. Nitrite is
used as a preservative in cured meat and is known to produce carcinogens in the
stomach. Vitamin C is shown to reduce the formation of these carcinogens in vitro and
in animals. By knowing the intake of nitrate and nitrite and the effect of vitamin C in
vivo (in the body), it may be possible to modify ones lifestyle and diet to minimize the
risk of developing digestive cancers.
THANK YOU for your participation, it means a lot to me and my research for your
time and effort.
CONTACT DETAILS
James Hsu
Level 7, room 714
Applied Science Building (F10)
Enter gate 2, High St.
Kensington, UNSW 2052
Office: 9385 5053
Mobile: 0410 465 130,
Email: [email protected]
Dr. Jayashree Arcot (supervisor)
Level 7,
Applied Science Building (F10)
Enter gate 2, High St.
Kensington, UNSW 2052
Office: 9385 5360
Email: [email protected]
END
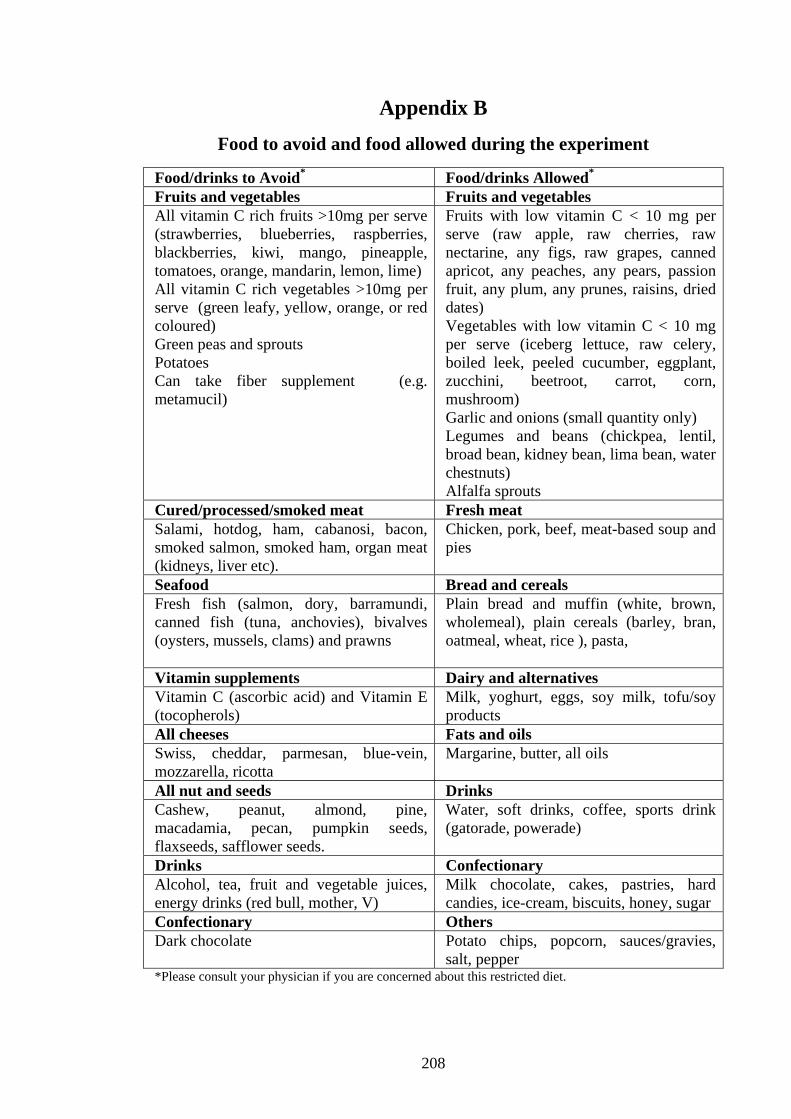
208
Appendix B
Food to avoid and food allowed during the experiment
Food/drinks to Avoid* Food/drinks Allowed* Fruits and vegetables Fruits and vegetables All vitamin C rich fruits >10mg per serve (strawberries, blueberries, raspberries, blackberries, kiwi, mango, pineapple, tomatoes, orange, mandarin, lemon, lime) All vitamin C rich vegetables >10mg per serve (green leafy, yellow, orange, or red coloured) Green peas and sprouts Potatoes Can take fiber supplement (e.g. metamucil)
Fruits with low vitamin C < 10 mg per serve (raw apple, raw cherries, raw nectarine, any figs, raw grapes, canned apricot, any peaches, any pears, passion fruit, any plum, any prunes, raisins, dried dates) Vegetables with low vitamin C < 10 mg per serve (iceberg lettuce, raw celery, boiled leek, peeled cucumber, eggplant, zucchini, beetroot, carrot, corn, mushroom) Garlic and onions (small quantity only) Legumes and beans (chickpea, lentil, broad bean, kidney bean, lima bean, water chestnuts) Alfalfa sprouts
Cured/processed/smoked meat Fresh meat Salami, hotdog, ham, cabanosi, bacon, smoked salmon, smoked ham, organ meat (kidneys, liver etc).
Chicken, pork, beef, meat-based soup and pies
Seafood Bread and cereals Fresh fish (salmon, dory, barramundi, canned fish (tuna, anchovies), bivalves (oysters, mussels, clams) and prawns
Plain bread and muffin (white, brown, wholemeal), plain cereals (barley, bran, oatmeal, wheat, rice ), pasta,
Vitamin supplements Dairy and alternatives Vitamin C (ascorbic acid) and Vitamin E (tocopherols)
Milk, yoghurt, eggs, soy milk, tofu/soy products
All cheeses Fats and oils Swiss, cheddar, parmesan, blue-vein, mozzarella, ricotta
Margarine, butter, all oils
All nut and seeds Drinks Cashew, peanut, almond, pine, macadamia, pecan, pumpkin seeds, flaxseeds, safflower seeds.
Water, soft drinks, coffee, sports drink (gatorade, powerade)
Drinks Confectionary Alcohol, tea, fruit and vegetable juices, energy drinks (red bull, mother, V)
Milk chocolate, cakes, pastries, hard candies, ice-cream, biscuits, honey, sugar
Confectionary Others Dark chocolate Potato chips, popcorn, sauces/gravies,
salt, pepper *Please consult your physician if you are concerned about this restricted diet.
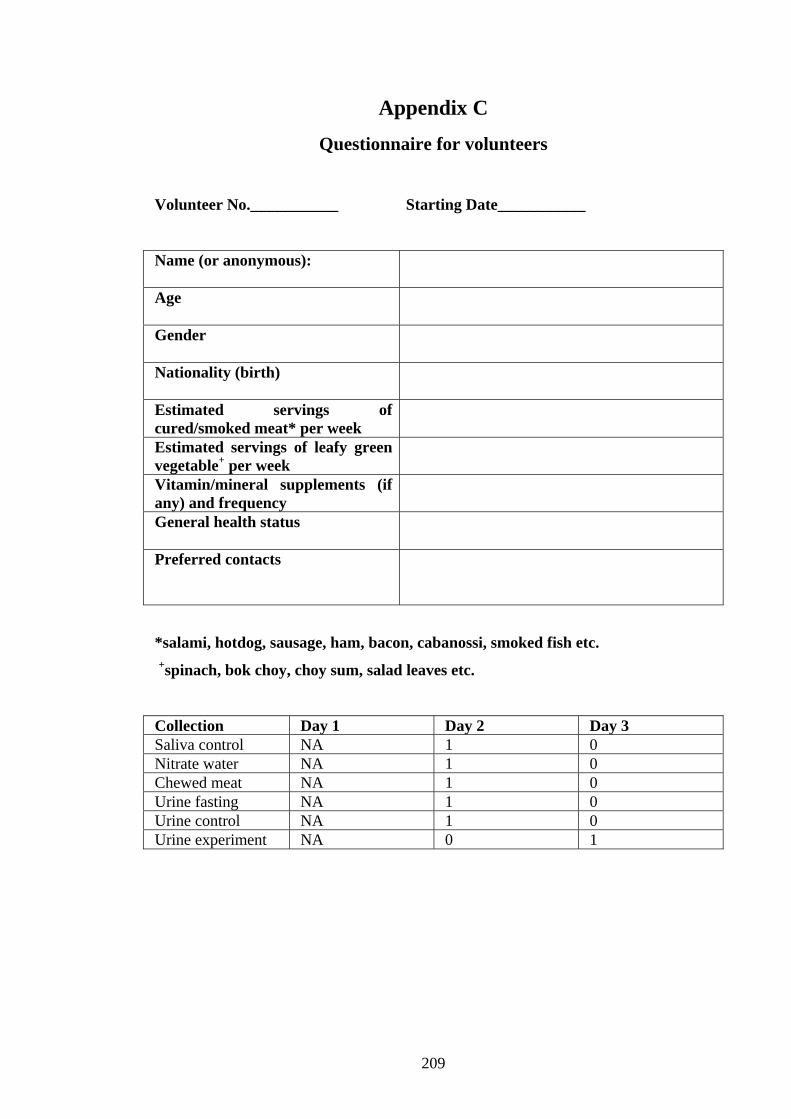
209
Appendix C
Questionnaire for volunteers
Volunteer No.___________ Starting Date___________
Name (or anonymous):
Age
Gender
Nationality (birth)
Estimated servings of cured/smoked meat* per week
Estimated servings of leafy green vegetable+ per week
Vitamin/mineral supplements (if any) and frequency
General health status
Preferred contacts
*salami, hotdog, sausage, ham, bacon, cabanossi, smoked fish etc.
+spinach, bok choy, choy sum, salad leaves etc.
Collection Day 1 Day 2 Day 3 Saliva control NA 1 0 Nitrate water NA 1 0 Chewed meat NA 1 0 Urine fasting NA 1 0 Urine control NA 1 0 Urine experiment NA 0 1
210
Appendix D
Publication in the Journal of Food Chemistry
Nitrate and nitrite quantification from cured meat and vegetables
and their estimated dietary intake in Australians
James Hsu, Jayashree Arcot *, N. Alice Lee
Food Science and Technology, School of Chemical Sciences and Engineering,
University of New South Wales, Sydney, NSW 2052, Australia
This article appeared in a journal published by Elsevier. The attachedcopy is furnished to the author for internal non-commercial researchand education use, including for instruction at the authors institution
and sharing with colleagues.
Other uses, including reproduction and distribution, or selling orlicensing copies, or posting to personal, institutional or third party
websites are prohibited.
In most cases authors are permitted to post their version of thearticle (e.g. in Word or Tex form) to their personal website orinstitutional repository. Authors requiring further information
regarding Elsevier’s archiving and manuscript policies areencouraged to visit:
http://www.elsevier.com/copyright

Author's personal copy
Analytical Methods
Nitrate and nitrite quantification from cured meat and vegetablesand their estimated dietary intake in Australians
James Hsu, Jayashree Arcot *, N. Alice LeeFood Science and Technology, School of Chemical Sciences and Engineering, University of New South Wales, Sydney, NSW 2052, Australia
a r t i c l e i n f o
Article history:Received 7 May 2008Received in revised form 19 November 2008Accepted 21 November 2008
Keywords:AnionsExtractionCarcinogenCured meatNitratesNitritesTetrabutylammonium phosphateMatrix interference
a b s t r a c t
High dietary nitrate and nitrite intake may increase the risk of gastro-intestinal cancers due to the in vivoformation of carcinogenic chemicals known as N-nitroso compounds. Water and leafy vegetables are nat-ural sources of dietary nitrate, whereas cured meats are the major sources of dietary nitrite. This paperdescribes a simple and fast analytical method for determining nitrate and nitrite contents in vegetablesand meat, using reversed-phase HPLC-UV. The linearity R2 value was >0.998 for the anions. The limits ofquantification for nitrite and nitrate were 5.0 and 2.5 mg/kg, respectively. This method is applicable forboth leafy vegetable and meat samples. A range of vegetables was tested, which contained <23 mg/kgnitrite, but as much as 5000 mg/kg of nitrate. In cured and fresh meat samples, nitrate content rangedfrom 3.7 to 139.5 mg/kg, and nitrite content ranged from 3.7 to 86.7 mg/kg. These were below the regu-latory limits set by food standards Australia and New Zealand (FSANZ). Based on the average consump-tion of these vegetables and cured meat in Australia, the estimated dietary intake for nitrate and nitritefor Australians were 267 and 5.3 mg/adult/day, respectively.
� 2008 Elsevier Ltd. All rights reserved.
1. Introduction
It was estimated that 80% of human cancers were caused byenvironmental factors associated with food, water and air (Walt-ers, 1980). In addition, malnutrition, dietary habits and lifestylemay be directly or indirectly related to 40% of the human cancers(Ologhobo, Adegede, & Maduagiwu, 1996). High dietary intakes ofnitrate and nitrite have been implicated in the etiology of humangastric cancer based on epidemiology and clinical studies (Bartsch,Ohshima, Shuker, Pignatelli, & Calmels, 1990; Joossens et al.,1996).
Nitrate is naturally present in leafy vegetables and nitrite isusually added to meat as a preservative in the form of sodium orpotassium salt (Cammack et al., 1999). In addition nitrate can bereduced to nitrite in the oral cavity and in the stomach (Duncanet al., 1997). Once in the stomach, nitrite can react with aminesand amides, which are organics containing nitrogen such as aminoacids, to form a group of carcinogens known as N-nitroso com-pounds (Archer, 1989). Stomach is most at risk from endogenousN-nitroso compound synthesis since stomach acid catalyses nitro-sation reactions. High nitrate intake was associated with gastriccancer in England, Colombia, Chile, Japan, Denmark, Hungary and
Italy (Forman & Shuker, 1997). Exposure to endogenously formedN-nitroso compounds had been associated with increased risks ofcancer of the stomach, oesophagus and bladder (Bartsch et al.,1990).
Australia’s food composition data were mostly based on over-seas data especially those from the United Kingdom (UK) and theUnited States (US) till recently. However, in the revised Australiancomposition tables based on food analysis performed in Australia,the edible portion of fruit increased by 4% whereas in meat it de-creased by 16% (Cashel & Greenfield, 1995). Thus dietary contribu-tion of nitrate and nitrite may be over-estimated, whereas dietaryintake of antioxidants such as vitamin C and vitamin E may havebeen underestimated.
The dietary intake of nitrates and nitrites in foods can varygreatly from region to region depending on factors such as farmingpractices, climate, soil quality, manufacturing processes andlegislation. Nitrate and nitrite contents of foods are not availablein Australia; hence values from overseas are commonly used.Due to the growing concern of N-nitroso compounds, accurateand robust methods are necessary for long-term monitoring ofnitrate and nitrite concentrations in foods for susceptiblepopulations.
It is therefore the aim of this study was to develop an accurate,simple and cost-effective method for quantifying the nitrate andnitrite contents in commonly consumed vegetables, cured meatand fresh meat produced in Australia.
0308-8146/$ - see front matter � 2008 Elsevier Ltd. All rights reserved.doi:10.1016/j.foodchem.2008.11.081
* Corresponding author. Tel.: +61 2 9385 5360; fax: +61 2 9385 5966.E-mail address: [email protected] (J. Arcot).
Food Chemistry 115 (2009) 334–339
Contents lists available at ScienceDirect
Food Chemistry
journal homepage: www.elsevier .com/locate / foodchem

Author's personal copy
2. Materials and methods
2.1. Reagents
Analytical grade sodium nitrite and potassium nitrate from Uni-var (Ajax Finechem) were used as standards and for recovery stud-ies. HPLC grade methanol from lab-scan was used and ion-pairingagent tetrabutylammonium phosphate was purchased from Waters.
2.2. Food samples
All vegetables were purchased at local supermarkets, produceshops or wholesale and kept at refrigeration temperature and ana-lysed within 24 h. All cured and fresh meat products were also pur-chased at supermarkets and kept at refrigeration temperature andanalysed within 48 h.
2.3. Apparatus
Waters HPLC controller model number 600 with photo arraydetector model number 996 and autosampler model number717 plus were used. Phenomenex C18 110A Gemini column(250 mm � 4.6 mm � 5 lm) was used for the separation. Injectionvolume was 10 ll with flow rate set at 1 mL/min and wavelengthset at 214 nm. Mobile phase consisted of methanol: water(75:25) with 0.075 M of tetrabutylammonium phosphate (PIC-A).
2.4. Methods
2.4.1. StandardsPotassium nitrate (KNO3) and sodium nitrite (NaNO2) were
mixed in MilliQ water in volumetric flasks to give a range between5.0 and 100 mg/L for nitrite ions and 2.5–50 mg/L for nitrate ions.
2.4.2. SamplesWeighed 10–50 g of meat samples including salami, hot dogs,
ham, bacon, Frankfurt and beef, which were purchased from the lo-cal supermarkets (at least two packets each) of two different brands,were blended with 300 mL distilled water for 1 min, then made up to500 mL in volumetric flasks. The pH was measured and 1 mL was ta-ken out for measuring nitrate and nitrite content before cookingusing HPLC. Ten millilitre of mixture of each sample was transferredinto 100 mL volumetric flasks and heated in a water bath at 75, 80,90 and 100 �C for 5, 10 and 15 min. The mixture was made up to100 mL with distilled water and was shaken. The mixture was al-lowed to settle and cool; then measured pH and nitrite and nitratecontents. The pH was adjusted with 0.1 M NaOH to neutral pH. Thenthe mixture was centrifuged at 10,000 rpm for 10 min; then super-natant was removed for ultra-filtration. The filtrate was used for fur-ther analysis including quality control such as recovery studies.
Fresh vegetables including English spinach, buk choy, choy sum,Chinese cabbage, gai choy and iceberg lettuce were purchased fromthe local supermarkets and produce stores. Three bunches eachfrom two different locations with at least three replicates wereused for the analysis including recoveries. To examine the effectsof sample preparation and extraction conditions on nitrate and ni-trite determination samples were chopped in thirds or blended orboth and weighed between 25 and 100 g in 500 mL beakers. Spik-ing with standards was done before cooking in water bath between60 and 100 �C for 5–30 min.
3. Results and discussion
Nitrate and nitrite can be unstable and different samplingmethods and extraction procedures can influence their recoveries
(Usher & Telling, 1975). Hence, the optimal extraction conditionswere used for nitrate and nitrite determinations in fresh vegeta-bles, cured meat and fresh meat. Mean recoveries were >92% forboth nitrate and nitrite in all three food matrices tested (Tables 1and 2). Factors affecting nitrate and nitrite recovery in foods in-clude (1) temperature, since nitrate and nitrite are not stable athigh temperatures, (2) cooking conditions, which can affect pH ofthe sample water and exposure to atmospheric oxygen, (3) pH ofthe sample water, since nitrite is readily converted to nitric acidor nitric oxide at acidic pH, and (4) sources of food samples canvary greatly and may contain interfering substances such as ironand magnesium (Usher & Telling, 1975).
The extraction and detection method would affect nitrite andnitrate quantification in meat and vegetables. This method waschosen because it was fast, sensitive and accurate. In both casesheat (hot water) was used to extract nitrite and nitrate, and inthe case of vegetables blanching was a common cooking practicethat was chosen in the present study. In addition, pH was moni-tored and maintained close to neutral pH to minimize conversionof nitrite to nitrous acid or nitrous oxide.
Nitrite levels in vegetables may increase during post-harveststorage by the action of indigenous bacteria and/or the presenceof nitrate reductase (Hunt, 1994), especially when they are left atroom temperature or higher. This may explain the small amountof nitrite (20 mg/kg) present in Gai choy during the preparationat room temperature (Table 1). Likewise, it was demonstrated thatthere was no detectable nitrite in 94% of edible fresh retail vegeta-bles (Hunt & Turner, 1994).
Table 1Mean nitrate and nitrite contents and their recoveries in cooked fresh vegetables.
Vegetables Nitrite (mg/kg) Nitrate (mg/kg)
English spinach 0 4849.6 ± 573.6Recovery (%) 89 74Buk choy 0 1841.1 ± 84.0Recovery (%) 97 97Choy sum 0 1376.9 ± 56.0Recovery (%) 111 102Chinese cabbage 0 236.2 ± 27.4Recovery (%) 91 97Gai choy 19.6 ± 10.8 1642.3 ± 126.0Recovery (%) 102 100Iceberg lettuce 0 48.0 ± 30.2Recovery (%) 92 110
Values are means of at least four replicate determinations from two sources and upto 15 determinations.
Table 2Mean raw nitrate and nitrite contents and their recoveries in cured and fresh meatfrom Sydney supermarkets after pH adjustment.
Meat Nitrite (mg/kg) Nitrate (mg/kg)
Hot dog 78.6 ± 16.4 69.9 ± 11.3Recovery (%) 109 103Ham 34.2 ± 5.5 19.0 ± 8.1Recovery (%) 97 87Salami 0 142.5 ± 36.3Recovery (%) 91 102Bacon 15.7 ± 14.5 23.3 ± 8.2Recovery (%) 91 82Frankfurt 83.9 ± 10.1 54.9 ± 8.7Recovery (%) 96 94Minced beef 0 18.7 ± 6.2Recovery (%) 80 104Beef medallion 0 38.5 ± 14.9Recovery (%) 80 75
Values are means of at least four replicates from two to four brands with up to fivedeterminations.
J. Hsu et al. / Food Chemistry 115 (2009) 334–339 335
Author's personal copy
Cultivar and harvest date can affect the nitrate and nitrite levelsof selected vegetables (Amr & Hadidi, 2001). This may explain thehigh variability between findings presented in this study also con-tributing to high standard deviation particularly in English spinachas observed in Table 1. However, meat samples with low levels ofnitrates had smaller standard deviation (Table 2), most likely be-cause the low levels of nitrates in general meant less chance ofreacting to the conditions they were exposed to.
English spinach had the highest nitrate content (4850 mg/kg)compared to other vegetables (Table 1). This finding correlatedwell with the literature (Öztekin, Nutku, & Erim, 2002). However,according to Gaiser, Rathjen, and Spiess (1996), spinach blanchedfor 3 min can contain in the range of 50–5600 mg/kg nitrates witha mean nitrate concentration of approximately 2000 mg/kg and alarge standard deviation of 1411.4 mg/kg. This demonstrated thehigh variability of nitrate content in spinach and other green leafyvegetables. Excluding spinach, other vegetables tested had nitrateranging 48–1841 mg/kg, which was less than half that of spinach(Table 1). Thus it can be concluded that spinach contributed tothe highest dietary nitrate intake from leafy green vegetables. Let-tuce contained lowest amount of nitrate in this study (48.0 mg/kg,Table 1), which was significantly lower to earlier studies that dem-onstrated high nitrate content in lettuce at 2500 mg/kg (Marshall &Trenerry, 1996). This dissimilarity may be due to horticulturalpractices such as the use of nitrate-based fertilizers.
Different countries have set their maximum limits for the addi-tion of nitrate and/or nitrite salts in cured meat. Under the Austra-lian Food Standard Code 1.3.1 schedule 1, 125 mg/kg of nitrite in aform of potassium or sodium salt is permitted in cured, dried, andslow dried cured meat; whereas in commercially sterile andcanned cured meat, the maximum nitrite (potassium or sodiumsalts) permitted is 50 mg/kg. For slow dried cured meat, the max-imum allowed nitrate (potassium or sodium salts) is 500 mg/kg(FSANZ, 2007–2008). Given the established antimicrobial effect ofnitrite salts, particularly in reference to Clostridium botulinum incured meat, its level should remain sufficient enough to preventthe occurrence of foodborne illnesses, but also kept to the mini-mum to minimize dietary nitrite intake in light of its potential ad-verse health effects based on epidemiological and clinical studies.
Seven types of meat tested in this study had at least four repli-cates each from at least two brands. Nitrate and nitrite contents invarious cured meat products were below the maximum allowablelimit set by Food Standards Australia and New Zealand (FSANZ) at125 mg/kg (Table 2). However, there was no limit set for freshmeat. Continuous monitoring of nitrite used in cured meat prod-ucts is important to ensure that the dietary intake of nitrite is keptto below the limit set by FSANZ.
Interferences naturally present or added additives in curedmeat products may account for differences in nitrate and nitriterecovery. For example, Butt, Riaz, and Iqbal (2001) demonstratedthat the presence of 50-fold sulphate and chloride did not affectthe resolution and percent recovery of nitrite, but did reduce theresolution and recovery of nitrate. In addition, the presence ofmagnesium, iron and calcium significantly reduced the percentagerecovery of both anions, which should be removed to ensure accu-rate determination of nitrate and nitrite. Furthermore, Butt et al.(2001) also demonstrated that under optimized HPLC conditions,both nitrate and nitrite peaks began to merge when the concentra-tion of nitrite was above six-fold of nitrate concentration, hence ni-trite used in calibration curve and for recovery were half theconcentration of nitrate to minimize the merging of nitrite and ni-trate peaks.
Using similar detection method as Reinik et al. (2005), theyfound the mean sodium nitrite and nitrate concentrations in hamwere 20.8 and 68 mg/kg, respectively. However in this study, thenitrite concentration in ham averaged at 34.2 ± 5.6 mg/kg and
nitrate concentration was lower at 19.0 mg/kg (Table 2). Somemanufacturers add less nitrite but more nitrate as a nitrite reserve.This may also explain the differences in the findings by Öztekinet al. (2002), where the nitrite and nitrate contents in ham were4.0 and 35.6 mg/kg, respectively.
Dionex Corporation (1998) found the nitrite and nitrate con-tents in ham to be 11.6 and 5.4 mg/kg, respectively, whereas sala-mi contained 108.0 mg/kg nitrite and 98.5 mg/kg nitrate. Usingcapillary electrophoresis, the nitrite and nitrate content in salamidetected were 24.3 and 43.6 mg/kg, respectively (Öztekin et al.,2002). Compared to their findings, the current study showed thatthe salami contained no nitrite but much more nitrate at142.5 mg/kg (Table 2). Although the extraction methods were sim-ilar the temperature used in our study was higher, apart from thedifferences that may be attributed to the manufacturing practices.Stalikas, Konidari, and Nanos (2003) used similar extraction tem-perature and reported that nitrate and nitrite contents in salamiwere 54 and 84 mg/kg, respectively. Thus differences are morelikely to be due to the manufacturing processes.
It was reported by Dennis, Key, Papworth, Pointer, and Massey(1990) that the mean nitrite content in bacon was 24.0 mg/kg andfor nitrate was 43.0 mg/kg, whereas nitrite and nitrate in ham were56.0 and 22.0 mg/kg, respectively. They used similar extraction anddetection methods but with an anion exchange column. Both ba-con and ham products in this study contained less nitrate and ni-trite (Table 2) in comparison. Siu and Henshall (1998) who foundthat nitrite and nitrate contents in salami were 108.0 and98.5 mg/kg, respectively, and 11.6 and 5.4 mg/kg for ham, respec-tively. Sample extraction procedures used in the current studywere similar to Marshall and Trenerry (1996), but they omittedthe heating step. This may explain the low nitrite content of lessthan 10 mg/kg in salami, leg ham and bacon. However the nitratecontents were higher at 141.5, 132.5 and 48.0 mg/kg, respectively.Different cured meat products may require different ratio of nitriteand nitrate as preservatives. Since fresh meat does not naturallycontain nitrite (Table 2), its nitrite and nitrate contents have notbeen extensively tested. However, based on this study, the nitratecontent in minced beef and medallion beef were within the rangefound in cured meat products (Table 2).
It was demonstrated that recovery increases as the meat solidsdecreases (Usher & Telling, 1975). Hence using smaller meat sam-ples should reduce the effects of interfering substances, which wasdemonstrated in this study (Table 2). Furthermore, most interfer-ence can be eliminated by UV detection. However, chloride ionsmaybe detected by UV as positive or negative peaks in the wave-length used for nitrate and nitrite and are eluted before nitrite(Di Matteo & Esposito, 1997). Chloride peaks were not present at214 nm in this study, which suggests that chloride ions did notinterfere with nitrite quantification since nitrite recovery wasabove 92% for both meat and vegetable samples (Tables 1 and 2).
Due to its reactive nature, nitrite analysis from food does notgive a true representation of the total nitrite added. Furthermore,nitrite added to meat is usually present as nitric oxide bound withother food components such as myoglobin (5–15%), sulphydrylgroups (5–15%), lipids (1–5%), proteins (20–30%), as nitrate(<10%), and as free nitrite (10–15%) (Zanardi, Dazzi, Madarena, &Chizzolini, 2002). Therefore recovery range may be quite large asa result of nitrite’s reactive nature and its attachment to other foodcomponents. However, because only free nitrite can participate innitrosation, other methods of food extraction estimate the total ni-trite present by releasing food-bound nitrite. This may over esti-mate the significance of dietary nitrite and the etiology of gastriccancer. Hot water extraction to quantify free nitrite available toparticipate in nitrosation was used in this study.
Regarding relevance to incidence of gastric cancer, based onage-standardized statistics, diagnosed gastric cancer rate per 100,
336 J. Hsu et al. / Food Chemistry 115 (2009) 334–339

Author's personal copy
000 in males and females worldwide is 22% and 10.3%, respec-tively, with mortality rate of 14.3% and 8.3%, respectively. Gastriccancer is the third leading cause of death in men after lung andprostate cancer, and is the fourth leading cause of death in womenworldwide (Forman & Burley, 2006). Overall gastric cancer rate isdeclining, especial in more developed countries, with the exceptionof Miyagi prefecture of Japan still having the highest gastric cancerrate. Korea, East Asia, South America and Eastern Europe also sus-tained a high gastric cancer rate. However, Bombay in India alwaysmaintained a low gastric cancer rate between 1953 and 1997 (For-man & Burley, 2006). This may be due to higher consumption ofantioxidant rich fruits and vegetables and herbs and spices, whichhave been shown to reduce the risk of gastric cancer. Joossens et al.(1996) studied dietary salt, nitrate and gastric cancer mortality in24 countries and demonstrated that nitrate intake became an in-creased risk factor for gastric cancer when salt intake was alsohigh.
It was predicted that with increasing population numbers andincreasing longevity, it would cause a net increase in gastric cancerrate worldwide. Since diagnosis often occurs between the ages of60 and 80, with up to 30% mortality rate after five years diagnosis(Forman & Burley, 2006), it is vital to make dietary and lifestylechanges to decrease gastric cancer rate and to increase survivalrate with better diagnostic facility and education. Risk factors tobe avoided include Helicobacter pylori infection, smoking, high con-sumption of cured meat and salt, and low consumption of fruitsand vegetables.
Once the nitrate and nitrite contents in food were established,one can estimate the intake of these anions based on national die-tary surveys. Gangolli et al. (1994) estimated that the mean dailyintake of nitrate and nitrite in the US were 106 and 1.5 mg/kg,respectively, and in the UK were 104 and 1.5 mg/kg, respectively.In 1994, van Vliet, Vaessen, van de Burg, and Schothorst (1997)estimated the mean intake of nitrate in the Dutch population tobe 80 mg/day per person, and the median intake of nitrite to be0.1 mg/day per person. In comparison, Italy had a mean daily in-take of nitrate of 245 mg/day, whereas Poland and Switzerland re-corded mean daily nitrate intakes of 178 and 125 mg/day,respectively. France’s mean daily intake of nitrate and nitrite were150.7 and >3 mg/day, respectively, followed by Netherlands, Ger-many and Norway where mean daily nitrate intakes were 71, 68and 43 mg/day, respectively. The mean daily nitrite consumptionin those countries was 0.6, 2.6 and 1.8 mg/day, respectively (Gang-olli et al., 1994). According to Cornée, Lairon, Velema, Guyader, andBerthezene (1992), the average daily nitrate intake per person perday was 121 mg (85% from vegetables, 5% from preserved andcured meat, and 5% from cereal products). For the average daily ni-trite intake per person per day, it was found to be 1.88 mg (43%from vegetables, 28% from cured meat, and 16% from cereals).The remaining 13% of nitrite must come from non-dietary sourcesof nitrite such as atmospheric contamination.
In summary, Pennington (1998) estimated that the daily nitrateintake ranges between 53 and 350 mg/day depending on the typeand quantity of the vegetable consumed and the level of nitrate indrinking water. Whereas daily nitrite consumption was between 0and 20 mg/day depending on the levels of nitrite present in curedmeat and much of it was consumed. The acceptable daily intake(ADI) for nitrate was set at 3.7 mg/kg body weight by the EuropeanUnion Scientific Committee for Food (1995) and since nitrite hashigher acute toxicity than nitrate its ADI was set at 0.06 mg/kgbody weight (Reinik et al., 2005).
Based on the Australian Bureau of Statistics (Australian Bureauof Statistics, 1998–1999), Australians consumed 8.7 kg of baconand ham combined per capita per year in 1998–1999. Assuminghalf of each product was consumed at 4.35 kg per capita per year(or 12 g per capita per day) based on the finding in this study, ni-
trite from bacon per capita per day was 0.19 mg, and for nitratewas 0.41 mg. For ham (12 g per capita per day) nitrite consumedper capita per day was 0.28 mg and for nitrate was 0.23 mg. Thuscombined nitrite and nitrate intake from bacon and ham per capitaper day were 0.47 and 0.64 mg, respectively. At the upper extreme,assuming 100 g of bacon or ham was consumed every day, the ni-trite and nitrate intake from bacon would be 1.57 mg and 3.42 mgper capita per day, respectively. Similarly for ham the nitrite andnitrate intake would be 2.33 and 1.90 mg nitrite and nitrate per ca-pita per day, respectively, giving a total of 3.9 mg of nitrite and5.32 mg nitrate per capita per day. This is significantly lower thanthe ADI set by the European Union Scientific Committee for Food in1995.
However, taking endogenous formation of nitrate into account,this means additional 70 mg of nitrate for an average 70 kg adult(Gangolli et al., 1994). Furthermore, it was estimated approxi-mately 25% of dietary nitrate is converted to nitrite by bacteriaand nitrate reductase in the oral cavity (Gangolli et al., 1994). Thusassuming two servings (150 g) of vegetables comes from green lea-fy vegetables, again taking the analytical data from this study (Ta-ble 1), this means approximately 727.5 mg of nitrate from Englishspinach (Fig. 1) is ingested, of which 181.9 mg of nitrite can partic-ipate in nitrosation in the stomach. Based on the above assump-tions, the total nitrite and nitrate burden for an Australian adultof 70 kg body weight, the intakes per day is approximately 184.4and 617.7 mg, respectively, sourced from cured meat, spinachand endogenous nitrate formation. This exceeds the ADI of4.2 mg for nitrite by 44 times per 70 kg adult per day, and by 2.4times of ADI of 259 mg nitrate per 70 kg adult per day. However,it must be noted that the above prediction assumed that nitriteonly came from one serving (50 g) each of bacon and ham(Fig. 2), and that nitrate intake only came from two servings ofEnglish spinach. Since English spinach had the highest nitrate con-tent, this predicts the upper extreme of dietary nitrate intake. Fur-thermore, the ADI do not include the 25% conversion of dietarynitrate to nitrite in the oral cavity, which underestimate the totalingested dietary nitrite.
Japan has seven times the rate of gastric cancer than the UnitedStates and is also significantly higher compared to the United King-dom and Germany. There is little evidence that genetic differencescontributed to the different gastric cancer rates (Davies & Sano,2001). Thus this epidemiological study suggests that diet and life-style may play an important role in gastric cancer etiology besideseffective screening and management. Countries such as South Kor-ea, Japan and China had the highest stomach cancer mortality formen, whereas countries with the highest stomach cancer mortalityfor women were South Korea, China and Columbia. Canada andDenmark had the lowest stomach cancer mortality for men andwomen, respectively (Joossens et al., 1996).
Fig. 1. Mean nitrate and nitrite contents and recoveries in fresh vegetables after5 min boiling. Values are means of at least four replicate determinations.
J. Hsu et al. / Food Chemistry 115 (2009) 334–339 337

Author's personal copy
The high gastric cancer incidence in the Far East may be due tothe consumption of specific foods that are high in nitrates such asKorean Kimchi or high in salt as in many traditional Japanesedishes, or particular food preparation methods such as broiling ofmeats (Duncan et al., 1997). Regions of high risk to gastric canceroften coincide with a low intake of foods containing vitamin C.Other risk factors for human gastric cancer include residence inareas with high nitrate-containing soil due to many factors suchas the addition of fertilizers and foods pickled with salt (Weisburg-er, 1981). Certain salted fermented fish products including fishsauce were associated with the high gastric cancer mortality inFujian province of China (Chen et al., 1992). Similarly, a potentiallink for the high gastric cancer rate in Southwest Korea was asso-ciated with regular high consumption of salted pickled cabbageand salted seafood sauce (Seel et al., 1994). The former, also con-tained high levels of total N-nitroso compound precursors, andcabbages, which are known to contain high levels of nitrate thanany other vegetables.
In addition of forming carcinogens in the stomach, nitrite is alsogenotoxic and can readily induce methaemoglobinaemia especiallyin babies (Gangolli et al., 1994). Furthermore, the lethal dose for ni-trite in adults was estimated to be between 2 and 9 g NaNO2 perday, or 33–250 mg/kg body weight (Gangolli et al., 1994), whereasthe lethal dose for nitrate ions was estimated at 20 g per day, or330 mg nitrate ions/kg body weight (Gangolli et al., 1994).Although it is unlikely to reach these toxic levels from dietary in-take alone, the long-term effects may be detrimental based on epi-demiological and clinical studies.
Homogenization of food is difficult but often necessary prior tochromatographic analysis. Factors such as variable texture, struc-ture and the presence of immiscible phases may hinder thehomogenization process (Lichon, 1996). Because these propertiesare inherent properties of the food product, it cannot be changedduring the manufacturing process. The sampling of food and theirpreparation must therefore be considered carefully prior to analy-sis to ensure representative and accurate results. This means usingtraditional cooking practices so that factors that affect nitrate andnitrite determination and their recovery are consistent and appli-cable to dietary exposure of these anions.
4. Conclusion
Different authors attributed different percentage of dietary ni-trate and nitrite to the major food groups, but the consensus is that
vegetables contributed to the majority of dietary nitrate and thatcured meat products contributed to the majority of dietary nitrite.This study agreed with the literature that vegetables are the majordietary nitrate contributor and that meat and especially cured meatprovided the majority of dietary nitrite. The extraction and detec-tion method used in this study was demonstrated to be simple, fast,sensitive and applicable to both meat and vegetable samples.
Nitrate and nitrite content of foodstuff should be monitored inthe long-term to estimate the dietary intake and to provide in-sights into the effects of new horticultural and manufacturingtechnologies on the levels of nitrates and nitrite in foods and inthe etiology of gastro-intestinal cancers. It was demonstrated thatnitrate and nitrite content tested were below the guideline set byFSANZ and their intake were within the range reported in the Wes-tern countries and were below the ADI. This study will be the firstto quantify the levels of nitrate and nitrite in foods in the Sydneysupermarket and will provide useful data to industry and healthprofessionals.
References
Amr, A., & Hadidi, N. (2001). Effect of cultivar and harvest date on nitrate (NO3) andnitrite (NO2) content of selected vegetables grown under open field andgreenhouse conditions in Jordan. Journal of Food Composition and Analysis, 14,59–67.
Archer, M. C. (1989). Mechanisms of action of N-nitroso compounds. Cancer Surveys,8, 241–250.
Australia Bureau of Statistics. (1998–1999). 16.59 Apparent per capita consumptionof foodstuffs. Available from http://www.abs.com.au Accessed 25.02.08.
Bartsch, H., Ohshima, H., Shuker, D., Pignatelli, B., & Calmels, S. (1990). Exposure ofhumans to endogenous N-nitroso compounds: Implications in cancer etiology.Mutation Research, 238, 255–267.
Butt, S. B., Riaz, M., & Iqbal, M. Z. (2001). Simultaneous determination of nitrite andnitrate by normal phase ion-pair liquid chromatography. Talanta, 55, 789–797.
Cammack, R., Joannou, C. L., Cui, X.-Y., Martinez, C. T., Maraj, S. R., & Hughes, M. N.(1999). Nitrite and nitrosyl compounds in food preservation. Biochimica etBiophysica Acta, 1411, 475–488.
Cashel, K. M., & Greenfield, H. (1995). The effect of revised Australian foodcomposition tables on estimates of foods and nutrients available for nationalconsumption, 1983–1984. Journal of Food Composition and Analysis, 8, 45–61.
Chen, C. S., Pignatelli, B., Malaveille, C., Bouvier, G., Shuker, D., Hautefeuille, A., et al.(1992). Levels of direct-acting mutagens, total N-nitroso compounds innitrosated fermented fish products, consumed in a high-risk area for gastriccancer in southern China. Mutation Research, 265, 211–221.
Cornée, J., Lairon, D., Velema, J., Guyader, M., & Berthezene, P. (1992). An estimate ofnitrate, nitrite, and N-nitrosodimethylamine concentrations in French foodproducts or food groups. Sciences Des Aliments, 12, 155–197.
Davies, P. A., & Sano, T. (2001). The difference in gastric cancer between Japan, USAand Europe: What are the facts? What are the suggestions? Critical Reviews inOncology/Hematology, 40, 77–94.
Dennis, M. J., Key, P. E., Papworth, T., Pointer, M., & Massey, R. C. (1990). Thedetermination of nitrate and nitrite in cured meat by HPLC/UV. Food Additivesand Contaminants, 7, 455–461.
Di Matteo, V., & Esposito, E. (1997). Methods for the determination of nitrite byhigh-performance liquid chromatography with electrochemical detection.Journal of Chromatography A, 789, 213–219.
Dionex Corporation. (1998). Determination of nitrate and nitrite in meat usinghigh-performance anion-exchange chromatography. Application Note, 112.
Duncan, C., Li, H., Dykhuizen, R., Frazer, R., Johnston, P., MacKnight, G., et al. (1997).Protection against oral and gastrointestinal diseases: Importance of dietarynitrate intake, oral nitrate reduction and enterosalivary nitrate circulation.Comparative Biochemistry and Physiology, 118A, 939–948.
Food Standards Australia and New Zealand. (2007–2008). Food standards code.http://www.foodstandards.gov.au Accessed 10.11.08.
Forman, D., & Shuker, D. (1997). Helicobacter pylori and gastric cancer – A case studyin molecular epidemiology. Mutation Research/Fundamental and MolecularMechanisms of Mutagenesis, 379, S159.
Forman, D., & Burley, V. J. (2006). Gastric cancer: Global pattern of the disease andan overview of the environmental risk factors. Best Practice and Research ClinicalGastroenterology, 20, 633–649.
Gaiser, M., Rathjen, A., & Spiess, W. E. L. (1996). Nitrate extraction during blanchingof spinach. Lebensmittel-Wissenschaft und Technologie (Food Science andTechnology), 30, 432–435.
Gangolli, S. D., van den Brandt, P., Feron, V. J., Janzowsky, C., Koeman, J. H., Speijers,G. J., et al. (1994). Nitrate, nitrite and N-nitroso compounds. European Journal ofPharmacology, Environmental Toxicology and Pharmacology Section, 292, 1–38.
Hunt, J. (1994). A method for measuring nitrite in fresh vegetables. Food Additivesand Contaminants, 11, 317–325.
Hunt, J., & Turner, M. K. (1994). A survey of nitrite concentrations in retail freshvegetables. Food Additives and Contaminants, 11, 327–332.
Fig. 2. Mean nitrate and nitrite contents in cured and fresh meat from Sydneysupermarkets. Values are means of at least four replicate determinations.
338 J. Hsu et al. / Food Chemistry 115 (2009) 334–339

Author's personal copy
Joossens, J. V., Hill, M. J., Elliott, P., Stamler, R., Stamler, J., Lesaffre, E., et al. (1996).Dietary salt, nitrate and stomach cancer mortality in 24 countries. InternationalJournal of Epidemiology, 25, 494–504.
Lichon, M. J. (1996). ‘Sample preparation’. In L. M. L. Nollet (Ed.). Handbook of foodanalysis: Physical characterization and nutrient analysis (Vol. 1). New York:Marcel Dekker Inc.
Marshall, P. A., & Trenerry, V. C. (1996). The determination of nitrite and nitrate infoods by capillary ion electrophoresis. Food Chemistry, 57, 339–345.
Ologhobo, A. D., Adegede, H. I., & Maduagiwu, E. N. (1996). Occurrence of nitrate,nitrite and volatile nitrosamines in certain feedstuffs and animal products.Nutrition and Health, 11, 109–114.
Öztekin, N., Nutku, M. S., & Erim, F. B. (2002). Simultaneous determination of nitriteand nitrate in meat products and vegetables by capillary electrophoresis. FoodChemistry, 76, 103–106.
Pennington, J. A. (1998). Dietary exposure models for nitrates and nitrites. FoodControl, 9, 389–395.
Reinik, M., Tamme, T., Roasto, M., Juhkam, K., Jurtšenko, S., Tenno, T., et al. (2005).Nitrites, nitrates and N-nitrosamines in Estonian cured meat products: Intakeby Estonia children and adolescents. Food Additives and Contaminants, 22,1098–1105.
Seel, D. J., Kawabata, T., Nakamura, M., Ishibashi, T., Hamano, M., Mashimo, M., et al.(1994). N-nitroso compounds in two nitrosated food products in southwestKorea. Food and Chemical Toxicology, 32, 1117–1123.
Siu, D. C., & Henshall, A. (1998). Ion chromatography determination of nitrate andnitrite in meat products. Journal of Chromatography A, 804, 157–160.
Stalikas, C. D., Konidari, C. N., & Nanos, C. G. (2003). Ion chromatographic method forthe simultaneous determination of nitrite and nitrate by post-column indirectfluorescence detection. Journal of Chromatography A, 1002, 237–241.
Usher, C. D., & Telling, G. M. (1975). Analysis of nitrates and nitrite in foodstuffs: Acritical review. Journal of the Science of Food and Agriculture, 2, 1793–1805.
van Vliet, J. J., Vaessen, H. A., van de Burg, G., & Schothorst, R. C. (1997). Twenty-four-hour duplicate diet study 1994; nitrate and nitrite: Method developmentand intake per person per day. Cancer Letters, 114, 305–307.
Walters, C. L. (1980). The exposure of humans to nitrite. Oncology, 37, 289–296.Weisburger, J. H. (1981). ‘N-nitroso compounds: Diet and cancer trends’, in N-
nitroso Compounds. In R.A. Scanlan, S.R. Tannenbaum (Eds.), American chemicalsociety symposium series 174, United States.
Zanardi, E., Dazzi, G., Madarena, G., & Chizzolini, R. (2002). Comparative study onnitrite and nitrate ions determination. Annali Facolta di medicina veterinaria DiParma, 22, 79–86.
J. Hsu et al. / Food Chemistry 115 (2009) 334–339 339