Nitrite Reduction Mediated by Heme Models. Routes to NO and HNO?
11
Nitrite Reduction Mediated by Heme Models. Routes to NO and HNO? Julie L. Heinecke, † Chosu Khin, † Jose Clayston Melo Pereira, † Sebastia ́ n A. Sua ́ rez, ‡ Alexei V. Iretskii, †,§ Fabio Doctorovich, ‡ and Peter C. Ford* ,† † Department of Chemistry and Biochemistry, University of California at Santa Barbara, Santa Barbara, California 93106-9510, United States ‡ Departamento de Química Inorga ́ nica, Analítica y Química Física/INQUIMAE, Facultad de Ciencias Exactas y Naturales, Universidad de Buenos Aires, Ciudad Universitaria, Pabellon II, C1428EHA Buenos Aires, Argentina § Department of Chemistry, Lake Superior State University, Sault Ste Marie, Michigan 49783, United States * S Supporting Information ABSTRACT: The water-soluble ferriheme model Fe III (TPPS) mediates oxygen atom transfer from inorganic nitrite to a water-soluble phosphine (tppts), dimethyl sulfide, and the biological thiols cysteine (CysSH) and glutathione (GSH). The products with the latter reductant are the respective sulfenic acids CysS(O)H and GS(O)H, although these reactive intermediates are rapidly trapped by reaction with excess thiol. The nitrosyl complex Fe II (TPPS)(NO) is the dominant iron species while excess substrate is present. However, in slightly acidic media (pH ≈ 6), the system does not terminate at this very stable ferrous nitrosyl. Instead, it displays a matrix of redox transformations linking spontaneous regeneration of Fe III (TPPS) to the formation of both N 2 O and NO. Electrochemical sensor and trapping experiments demonstrate that HNO (nitroxyl) is formed, at least when tppts is the reductant. HNO is the likely predecessor of the N 2 O. A key pathway to NO formation is nitrite reduction by Fe II (TPPS), and the kinetics of this iron-mediated transformation are described. Given that inorganic nitrite has protective roles during ischemia/reperfusion (I/R) injury to organs, attributed in part to NO formation, and that HNO may also reduce net damage from I/R, the present studies are relevant to potential mechanisms of such nitrite protection. ■ INTRODUCTION Ionic nitrite has been shown to be protective of mammalian organs under ischemic physiology, and this activity has been attributed to nitrite (NO 2 − ) conversion to nitric oxide, the latter being a regulator of hypoxic signaling responses. 1−5 For example, NO 2 − reduction to NO occurs in liver homogenates under conditions of low oxygen tension, and cytochrome P 450 type proteins and thiols are reported to play major roles in this transformation. 6 Other ferrous heme proteins such as hemoglobin (Hb), 7,8 myoglobin (Mb), 9−11 neuroglobin, 12 and endothelial nitric oxide synthase (eNOS) 13 have been reported to act as nitrite reductases (NiRs) (eq 1, Fe(Por) = a heme protein or model). 14 Heme-mediated NiR activity is complicated by side reactions, specifically, the formation of stable ferrous heme nitrosyls (eq 2, K 2 > 10 11 M −1 for ferrous globins) 15−17 and NO dioxygenation by oxo-heme proteins (eq 3, k 3 =9 × 10 7 M −1 s −1 for Hb(O 2 )). 18,19 Despite these complications, it has been shown that in isolated heart homogenates and red blood cells, nitrite reduction by Mb and Hb, respectively, generates sufficient NO to inhibit mitochondrial respiration. 20 + + → + + − + Fe (Por) NO 2H Fe (Por) NO H O II 2 III 2 (1) + ⇄ Fe (Por) NO Fe (Por)(NO) II II (2) + → + − Fe (Por)(O ) NO Fe (Por) NO II 2 III 3 (3) Another pathway to NO formation from nitrite is by oxygen atom transfer (OAT) to substrates (S) as mediated by a metal center (eqs 4 and 5). Such transformations have been long known for metallo-phthalocyanines and -porphyrins in organic media 21−23 and more recently have been shown in solid matrices. 24,25 One such report described OAT from a mixture of Fe III (OEP)Cl (OEP 2− = octaethylporphyrinato) and [K(18- crown-6)]NO 2 in N-methylpyrrolidone/acetic acid to various substrates while generating Fe II NO. 23 However, this medium is strongly acidic, and acid-promoted nitrite disproportionation 26 forms NO 2 and N 2 O 3 , both being strong oxidants. 27 Thus, even in the absence of the Fe III (OEP)Cl, analogous solutions of NaNO 2 in this medium still effect oxidations, for example, of PPh 3 to PPh 3 O. 28 + ⇄ + − − MLX NO ML (NO ) X n n 2 2 (4) + → + ML (NO ) S ML (NO) SO n n 2 (5) Received: December 17, 2012 Article pubs.acs.org/JACS © XXXX American Chemical Society A dx.doi.org/10.1021/ja312092x | J. Am. Chem. Soc. XXXX, XXX, XXX−XXX
-
Upload
independent -
Category
Documents
-
view
3 -
download
0
Transcript of Nitrite Reduction Mediated by Heme Models. Routes to NO and HNO?

Nitrite Reduction Mediated by Heme Models. Routes to NO andHNO?Julie L. Heinecke,† Chosu Khin,† Jose Clayston Melo Pereira,† Sebastian A. Suarez,‡ Alexei V. Iretskii,†,§
Fabio Doctorovich,‡ and Peter C. Ford*,†
†Department of Chemistry and Biochemistry, University of California at Santa Barbara, Santa Barbara, California 93106-9510, UnitedStates‡Departamento de Química Inorganica, Analítica y Química Física/INQUIMAE, Facultad de Ciencias Exactas y Naturales,Universidad de Buenos Aires, Ciudad Universitaria, Pabellon II, C1428EHA Buenos Aires, Argentina§Department of Chemistry, Lake Superior State University, Sault Ste Marie, Michigan 49783, United States
*S Supporting Information
ABSTRACT: The water-soluble ferriheme model FeIII(TPPS)mediates oxygen atom transfer from inorganic nitrite to awater-soluble phosphine (tppts), dimethyl sulfide, and thebiological thiols cysteine (CysSH) and glutathione (GSH).The products with the latter reductant are the respectivesulfenic acids CysS(O)H and GS(O)H, although these reactiveintermediates are rapidly trapped by reaction with excess thiol.The nitrosyl complex FeII(TPPS)(NO) is the dominant ironspecies while excess substrate is present. However, in slightly acidic media (pH ≈ 6), the system does not terminate at this verystable ferrous nitrosyl. Instead, it displays a matrix of redox transformations linking spontaneous regeneration of FeIII(TPPS) tothe formation of both N2O and NO. Electrochemical sensor and trapping experiments demonstrate that HNO (nitroxyl) isformed, at least when tppts is the reductant. HNO is the likely predecessor of the N2O. A key pathway to NO formation is nitritereduction by FeII(TPPS), and the kinetics of this iron-mediated transformation are described. Given that inorganic nitrite hasprotective roles during ischemia/reperfusion (I/R) injury to organs, attributed in part to NO formation, and that HNO may alsoreduce net damage from I/R, the present studies are relevant to potential mechanisms of such nitrite protection.
■ INTRODUCTION
Ionic nitrite has been shown to be protective of mammalianorgans under ischemic physiology, and this activity has beenattributed to nitrite (NO2
−) conversion to nitric oxide, thelatter being a regulator of hypoxic signaling responses.1−5 Forexample, NO2
− reduction to NO occurs in liver homogenatesunder conditions of low oxygen tension, and cytochrome P450
type proteins and thiols are reported to play major roles in thistransformation.6 Other ferrous heme proteins such ashemoglobin (Hb),7,8 myoglobin (Mb),9−11 neuroglobin,12
and endothelial nitric oxide synthase (eNOS)13 have beenreported to act as nitrite reductases (NiRs) (eq 1, Fe(Por) = aheme protein or model).14 Heme-mediated NiR activity iscomplicated by side reactions, specifically, the formation ofstable ferrous heme nitrosyls (eq 2, K2 > 1011 M−1 for ferrousglobins)15−17 and NO dioxygenation by oxo-heme proteins (eq3, k3 = 9 × 10⁷ M−1 s−1 for Hb(O2)).
18,19 Despite thesecomplications, it has been shown that in isolated hearthomogenates and red blood cells, nitrite reduction by Mband Hb, respectively, generates sufficient NO to inhibitmitochondrial respiration.20
+ + → + +− +Fe (Por) NO 2H Fe (Por) NO H OII2
III2
(1)
+ ⇄Fe (Por) NO Fe (Por)(NO)II II (2)
+ → + −Fe (Por)(O ) NO Fe (Por) NOII2
III3 (3)
Another pathway to NO formation from nitrite is by oxygenatom transfer (OAT) to substrates (S) as mediated by a metalcenter (eqs 4 and 5). Such transformations have been longknown for metallo-phthalocyanines and -porphyrins in organicmedia21−23 and more recently have been shown in solidmatrices.24,25 One such report described OAT from a mixtureof FeIII(OEP)Cl (OEP2− = octaethylporphyrinato) and [K(18-crown-6)]NO2 in N-methylpyrrolidone/acetic acid to varioussubstrates while generating FeIINO.23 However, this medium isstrongly acidic, and acid-promoted nitrite disproportionation26
forms NO2 and N2O3, both being strong oxidants.27 Thus, even
in the absence of the FeIII(OEP)Cl, analogous solutions ofNaNO2 in this medium still effect oxidations, for example, ofPPh3 to PPh3O.
28
+ ⇄ +− −ML X NO ML (NO ) Xn n2 2 (4)
+ → +ML (NO ) S ML (NO) SOn n2 (5)
Received: December 17, 2012
Article
pubs.acs.org/JACS
© XXXX American Chemical Society A dx.doi.org/10.1021/ja312092x | J. Am. Chem. Soc. XXXX, XXX, XXX−XXX
More recently, we demonstrated similar Fe(III)-mediatedOAT reactions from nitrite in aqueous solution (Scheme 1, step
(a)). The FeIII(Por) complexes were the ferriheme modelsFeIII(TPPS) (1) or FeIII(TMPS),29 and the substrates (S)included a water-soluble phosphine (tppts), dimethyl sulfide(DMS), and the biological thiols cysteine (CysSH) andglutathione (GSH).30,31 These reactions were carried out inpH 5.81 and pH 7.40 aqueous buffer solutions, where nitritedisproportionation is significantly less important than in moreacidic media. The products were the corresponding substrateoxides and the respective ferrous nitrosyls FeII(Por)(NO) (eq5). Furthermore, FeII(TPPS)(NO) (2) was found to undergospontaneous regeneration to the ferric complex 1. Thus, theferrous nitrosyls, despite their well-known stability,32 are notsimply dead-end products. Instead, they are part of a dynamiccatalytic system. Described here are studies directed towarddefining these transformations and their mechanisms that serveas models for the analogous transformations in mammalianheme proteins.
■ EXPERIMENTAL SECTIONMaterials. FeIII(TPPS) (1) and FeIII(TMPS) (3) were purchased
from Midcentury Chemicals, and tris(3-sulfonatophenyl)phosphine(tppts) was synthesized by T. L. Matson of this laboratory by apublished procedure33 and purified by passing through a G-25Sephadex column. Sodium nitrite (99.999%) and the remainingchemicals were of the highest purity and purchased from Sigma-Aldrich. Angeli’s salt (Na2[N2O3]) was a gift from Prof. Jon Fukuto atSonoma State University. Nitric oxide gas (99.5%) was purchased fromPraxair and purified by passing through an Ascarite II filled stainlesssteel column submerged in dry ice/acetone bath (−78 °C)34 toremove any adventitious NOx. Nitrous oxide gas was purchased fromSigma-Aldrich and used without further purification for the stand-ardization of GC and FTIR.Solution Preparations. The rates of substrate oxidations by the
NaNO2/FeIII(TPPS) system were studied in pH 5.81 buffered
solutions (50 mM phosphate) at 25 °C under deaerated conditionsunless otherwise noted. Reaction solutions for these studies wereprepared in custom Schlenk line glassware equipped with a 1.0 cmpath length quartz cell, a septa sealed electrode adaptor (ThermogreenLB2 from Sigma), and a small round-bottom flask (SupportingInformation Figure S-1). Solutions were deaerated by freeze−pump−thaw techniques, then backfilled with high-grade argon (1 atm).Substrates were added to the NaNO2/Fe
III(TPPS) system using argonpurged gastight syringes, and changes in the optical spectra were usedto monitor the reaction progress.Solutions of the ferrous nitrosyl complex FeII(TPPS)(NO) (2)
alone were generated by reductive nitrosylation of 1 by excess NO inpH 5.81 or pH 7.40 solution. The excess NO was then removed by
freeze−pump−thaw techniques or by evacuating the flask at roomtemperature followed by backfilling with argon.
For nitrite reductase studies, the ferrous complex FeII(TPPS) wasprepared by reduction of 1 with a slight excess of sodium dithionite(15 μM) in pH 5.81 buffered solution. The reaction was initiated oncethe dithionite (λmax = 314 nm, εmax = 8 × 10³ M−1 cm−1) decomposed,as evidenced from the spectral changes. All substrate additions tosolutions were effected using argon purged, gastight syringes via thesepta sealed electrode adapters.
Reactions of tppts with HNO generated by the decomposition ofAngeli’s salt (AS) were studied in pH 5.81 and pH 7.40 phosphatebuffered solutions with 10% D2O. Solid AS was added to a J-YoungNMR tube to which a gas sampling, septa sealed electrode adaptercould be attached. The NMR tube was purged with argon, and 0.6 mLof a degassed tppts solution was added after which the 31P NMRspectrum was monitored (see below). Once the reaction wascomplete, headspace aliquots were removed and analyzed for N2O.
The kinetics of the reaction between aqueous tppts and NO werestudied under deaerated conditions using the Schlenk type cellillustrated in Supporting Information Figure S-1. A solution (3.0 mL)of tppts (0.56 mM) in pH 5.81 solution (50 mM phosphate) wasintroduced to the cell and then deaerated by freeze−pump−thawtechniques. Gaseous NO was either added directly to the cellmeasured by the manometer and pressurized to 1 atm of Ar or the cellwas pressurized to 1 atm Ar and known volumes of NO were added tothe cell using gastight syringes, and spectral changes were monitoredby recording the optical spectrum every 20 s. Between the spectralmeasurements, the reaction flask was vigorously shaken to maintainthe equilibrium between the liquid and gas phases. Because thesolubility of NO in aqueous solution is relatively low and the volumeof the gas phase (28 mL) was much larger than that of the solutionphase (3.0 mL), the total amount of NO present in the system (100−250 μmol) was in substantial excess of the tppts present (1.7 μmol), sothat the solution-phase NO concentration remained at a near constantvalue (pseudo first-order conditions) throughout any one study.
Instrumental Methods. Optical absorbance measurements wererecorded using a Shimadzu dual beam UV-2401 PC spectropho-tometer in 1.00 cm path-length quartz cells and referenced to therespective buffer solutions. For all kinetics studies, the spectrometercell compartment was thermostatted to 298 K. The 31P{1H} NMRspectra were recorded on a Bruker DMX-500 NMR spectrometer at202.45 MHz for 31P and 500.13 MHz for 1H with a 2 s time delay.Phosphorus chemical shifts were referenced to 85% H3PO4, and thespectra were processed using TopSpin software. The ESI−MS+ of thereaction products was analyzed using a Waters Micromass Q-TOF-2mass spectrometer.
Infrared spectra (400−4000 cm−1) with 1 cm−1 resolution wererecorded with a research series FT Mattson FTIR spectrophotometer.All gas-phase IR spectra were recorded using an 8 cm path length gascell with CaF2 windows. The reaction vessel was equilibrated with theIR cell under reduced pressure using a t-joint, and then the cell wasbackfilled with argon to ∼1 atm to minimize pressure effects on theextinction coefficient. The IR spectrum of the N2O present wasquantified using calibration curves for the absorption at 2212 and 2236cm−1 for the P and R branches, respectively. The detection limit forthis system was 0.2 μmol of N2O. Alternatively, the gas phase abovethe reacting system was sampled using a gastight syringe and wasanalyzed by gas chromatography using an Agilent Technologies model6890 GC and a 30 m Carbosieve packed column with a 300 °C maxtemperature. The GC was operated with the inlet and detector at 250°C with the following temperature program: Initial T was 125 °C for 5min, then T was ramped at 40 °C/min to 240 °C and held for 10 min.The carrier gas was helium at a constant flow at 31.46 psi (gauge), andthe software used was GC ChemStation Rev.B.01.03[204]. Underthese conditions, nitrous oxide had a retention time (RT) of 11.3 min,and N2O signals for each injection were compared to a calibrationcurve prepared by injecting samples of pure N2O. The detection limitwas 2 nmol. The concentrations of NO and N2O in the reactionsolutions were determined from the composition of the injectionsamples, the volumes of the injection sample, the reaction cell, and the
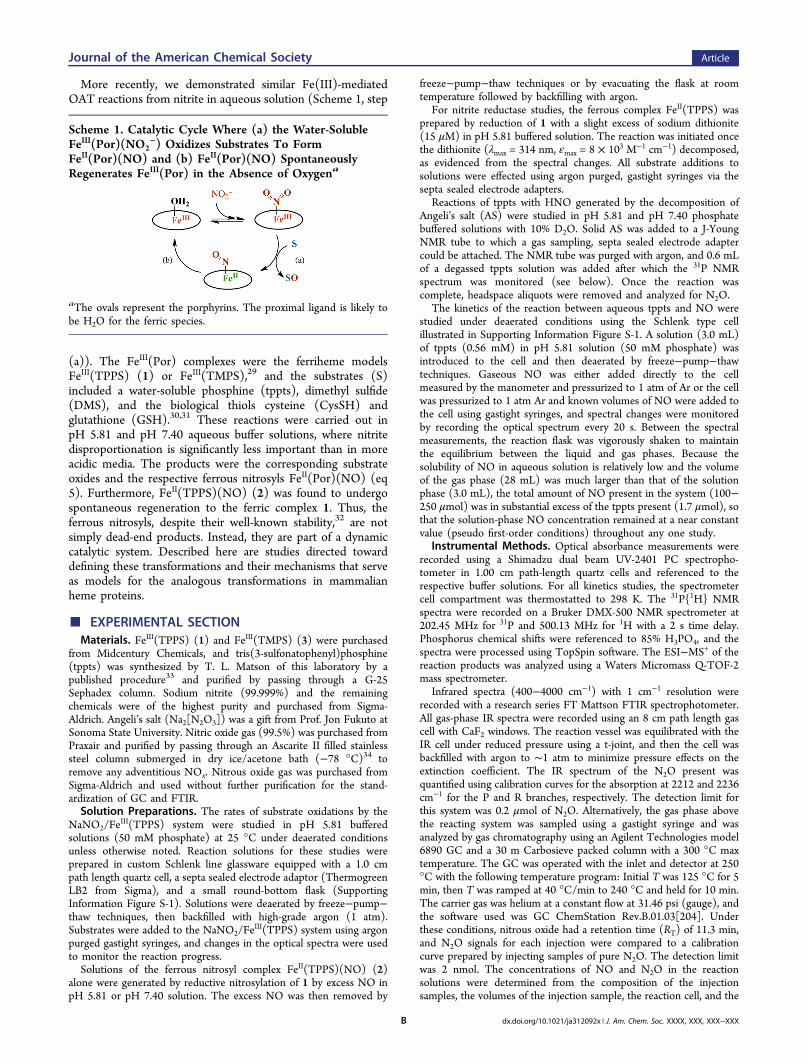
Scheme 1. Catalytic Cycle Where (a) the Water-SolubleFeIII(Por)(NO2
−) Oxidizes Substrates To FormFeII(Por)(NO) and (b) FeII(Por)(NO) SpontaneouslyRegenerates FeIII(Por) in the Absence of Oxygena
aThe ovals represent the porphyrins. The proximal ligand is likely tobe H2O for the ferric species.
Journal of the American Chemical Society Article
dx.doi.org/10.1021/ja312092x | J. Am. Chem. Soc. XXXX, XXX, XXX−XXXB

solution, and the partition coefficients for NO (20.9)35 and N2O(1.65)36 between the gas and aqueous phases.Nitric oxide was detected and analyzed using a GE Sievers model
280i nitric oxide analyzer (NOA). Known volumes of the gases fromthe solution headspace were injected into the NOA purge vessel, andthese gases were entrained to the detector using helium. The NOpresent in the sample was quantified using a calibration curvegenerated from the reaction of NaNO2 with acidic KI.Amperometric analysis for HNO formation was carried out as
described previously37 with a TEQ 03 potentiostat and a three-electrode system consisting of platinum counter electrode, a Ag/AgClreference electrode, and a gold working electrode modified with amonolayer of cobalt porphyrin with 1-decanethiol covalently attached.This modified electrode has been demonstrated to be specific forHNO,37 as NO, nitrate, nitrite, and FeII(TPPS)(NO) showed nocurrent. The release of HNO from AS was used to calibrate thisanalysis, and the reactions considered for HNO detection by theelectrode are shown in Scheme S-1. Modeling of the electrode currentwas achieved by numerical integration of a set of differential equationsrepresenting the mechanism of the reactions involved as well as thosetaking place at the electrode surface; the reactions, rate laws, and rateconstants are shown in Table S-1. The SimBiology toolbox fromMatlab 2009b was used to solve the equations and fit the current.DFT calculations for iron containing species were performed at
unrestricted TPSSTPSS/DGDZTVP level of theory in the gas phaseusing the Gaussian 03 software package. In limited cases, a solution-phase geometry optimization using a polarized continuum medium(PCM) was completed to assess the influence of a solvent (water).
■ RESULTS AND DISCUSSIONA. Fe(TPPS)-Mediated Oxygen Atom Transfer from
Nitrite to Various Substrates. Substrate Oxidation and theFormation of Nitrosyl Complexes. Two communications fromthis laboratory30,31 have described the reaction of aqueousFeIII(TPPS) (1) and sodium nitrite with various substrates (S)to give FeII(TPPS)(NO) (2) and oxidized substrate (SO) andwill be briefly summarized and expanded upon here. Figure 1
illustrates the temporal spectrum changes after addition of thewater-soluble phosphine tppts (1 mM) to solutions containing1 (8 μM) and NaNO2 (10 mM) at pH 5.81 (50 mM phosphatebuffer). The transformation of 1 (λmax 393 and 528 nm) to 2(λmax 413 and 543 nm) was indicated by shifts in thecharacteristic Soret and Q bands of the optical spectra forthese very strongly absorbing chromophores. Distinct isosbestic
points at 403, 489, 540, and 615 nm were also observed. Therate of absorbance change did not follow a simple exponential(Figure 1, inset); therefore, the initial rate method was used toprobe the kinetics dependence on reactant concentrations.From these data, the rate law was determined to be first orderin [NO2
−], first order in [1], and first order in [tppts] (eq 6)with a rate constant kOAT of 2.1 × 10² M−2 s−1.28 This behavioris consistent with the reversible formation of the ferric nitritecomplex FeIII(TPPS)(NO2
−) (K = 3 M−1)38 followed by rate-limiting reaction with the substrate (k2 = 70 M−1 s−1) to form 2plus the phosphine oxide tpptsO as depicted in Scheme 1.
− = −t k1 1(d[ ]/d ) [NO ][ ][tppts]OAT 2 (6)
After the formation of 2 was complete, the tpptsO wasidentified by in situ 31P NMR and by mass spectroscopy. Thephosphine oxide was not formed in significant quantities inanalogous solutions that were prepared from NaNO2 and tpptsbut did not contain 1 even after 1 week. Such OAT from anitrite complex of a ferriheme is consistent with earliercomputational studies that indicate the feasibility of thisreaction.39
Similarly, we showed that when dimethyl sulfide (DMS) wasthe substrate, the product was dimethylsulfoxide as identifiedby GCMS techniques, but DMSO was not formed in theabsence of 1. These solution-phase experiments parallel studiesin porous layered solids by Kurtikyan et al.25 that demonstrated18O transfer from the 6-coordinate N-nitrito complexesFeIII(TPP)(L)(N18O2)
29 to the sulfides DMS and tetrahy-drothiophene (THT) to give the respective 18O labeledsulfoxides with concomitant formation of Fe(TPP)(L)(N18O)(L = DMS or THT).The ferrous nitrosyl product 2 was also observed when
cysteine or glutathione were the substrates in pH 5.81 aqueoussolutions of 1 (8 μM) and NaNO2 (10 mM). Notably, theorganic products were the respective disulfides cystine or GSSGas identified by mass spectrometry.30 However, trapping studiesusing dimedone, which is specific for sulfenic acids,demonstrated that the OAT products, the sulfenic acidsRS(O)H, are formed as intermediates (see below). Thekinetics of CysSH oxidation were further complicated by therapid formation of the ferric thiolate, FeIII(TPPS)(CysS−), in adead-end equilibrium (eq 7, K7 = 230 ± 50 M−1, pKa = 4.7 ±0.1).31 Nonetheless, the rate of the slow formation of 2 provedto be first order in [NaNO2] and in [1] and approached firstorder in [CysSH] at low thiol concentrations.31
The analogous reaction of CysSH was also studied using adifferent water-soluble ferric porphyrin complex, FeIII(TMPS)(3), which has bulky mesityl groups at the porphyrin mesopositions that inhibit formation of μ-oxo FeIII−O−FeIII dimersat higher pH (a major complication for studies with 1). At pH5.81, the reaction of 3 with CysSH and nitrite to giveFeII(TMPS)(NO) (4) behaved quite similarly to the reactionof 1 under analogous conditions. There was a fast initialabsorbance change due to formation of the cysteinate complexas in eq 7, followed by slower reaction with nitrite to give theferrous nitrosyl as characterized by its broad Soret band at 407
Figure 1. Spectral changes and kinetic trace (inset) for the reaction ofFeIII(TPPS) (1, 8 μM) and NaNO2 (10 mM) with tppts (1 mM) inpH 5.81 aqueous solution. The spectrum changes directly from that of1 (λmax 393 nm, εmax = 1.6 × 10⁵ M−1 cm−1) to that ofFeII(TPPS)(NO) (2, λmax 413 nm, 1.55 × 10⁵ M−1 cm−1) with noapparent intermediates. The reaction is nearly complete within 30 min(inset).
Journal of the American Chemical Society Article
dx.doi.org/10.1021/ja312092x | J. Am. Chem. Soc. XXXX, XXX, XXX−XXXC

nm and Q bands at 477 and 539 nm. In buffered solutions atpH 7.4, CysSH addition to a solution of 3 led to a similar initialspectral shift followed by formation of 4. The temporal changesindicated that formation of 4 was slower at the higher pH dueto the increased importance of the dead-end equilibria formingFeIII(TMPS)(CysS−) and the hydroxo complex FeIII(TMPS)-(H2O)(OH)
31 (see Supporting Information Scheme S-2).Sulfenic Acid Products from CysSH and GSH. As noted
above, oxygen atom transfer to CysSH or GSH from themixture of NO2
− and the ferri-heme model 1 would have beenexpected to generate initially the respective sulfenic acidderivatives CysS(O)H and GS(O)H. However, mass spectralstudies of the product solutions showed instead the presence ofthe corresponding disulfides cystine and GSSG. This can beexplained in terms of trapping of any sulfenic acid formed bythe excess thiols (∼1 mM) to give disulfides (Scheme 2).40
Thus, we employed dimedone (D) as a competitive trappingagent to probe the potential intermediacy of sulfenic acid OATproducts.31
Dimedone is a specific trapping agent for RS(O)H,41 and theproduct is the corresponding thiol ether (Scheme 2) that canbe identified by LC/MS techniques. For example, when D (1mM) was added to a deaerated, pH 5.81 aqueous solution of 1(8.6 μM) and NaNO2 (10 mM) just before RSH addition (1mM, either CysSH or GSH), the reaction proceeded to formthe ferrous nitrosyl 2, according to the changes in the opticalspectrum. The respective cysteine and glutathione thioethersexpected from dimedone trapping of RS(O)H intermediateswere detected and identified by LC/MS analysis of the productsolutions. The analogous products were similarly identified forthe reaction at pH 7.4 using the TMPS complex 3 (8.6 μM),NaNO2 (10 mM), RSH (1 mM), and D (1 mM) with eitherCysSH or GSH.Notably, these thioether products were found only when a
FeIII(Por) was present. Furthermore, the addition of higherconcentrations of CysSH or GSH led to smaller yields of thedimedone thioether adducts, and addition of a higherconcentration of D led to an increase in the respectivethioether.31 Both of these observations are consistent with thecompetitive trapping of RS(O)H by RSH or D as illustrated inScheme 2. Thus, we conclude that sulfenic acid intermediatesare the initial products formed by OAT to CysSH and GSH asimplied by step (a) of Scheme 1.B. The Back Reaction: Nitrous Oxide Formation and
Nitrite Reductase Activity. Spontaneous Regeneration of
FeIII(TPPS) (1). Notably, the ferrous nitrosyl productFeII(TPPS)(NO) (2) is not indefinitely stable after formationin the medium where the OAT reaction occurs. Regardless ofthe substrate, the introduction of traces of air led to changes inthe spectrum indicative of the reformation of 1 and otherproducts that were not investigated further. More surprisingly,even when dioxygen was rigorously excluded from the reactionvessel, slow regeneration of 1 (Soret band λmax 393 nm) anddisappearance of 2 (λmax 413 nm), step (b) of Scheme 1, wereconsistently observed (Supporting Information Figure S-2).Furthermore, this transformation proved to be faster at pH 5.81than at higher pH and was accompanied by the formation ofnitrous oxide when tppts was the substrate but not whenCysSH was present.30 In the context of this limitedinformation, several potential mechanisms were suggested.The studies described below are largely focused on elucidatingthe pathways responsible for depletion of 2 and regeneration of1.Figure 2 illustrates the temporal changes in the absorbance at
413 nm corresponding to the Soret band λmax characteristic of 2
after mixing solutions of 1, NaNO2 (10 mM), and severalconcentrations of tppts at pH 5.81 (1.0, 1.5, and 2.0 mM). Theinitial fast formation of 2 was followed by a period where therewas a roughly steady-state concentration of this product,followed by slow decay back to the spectrum of 1. Similarbehavior was seen when CysSH was the substrate (SupportingInformation, Figure S-3); however, the regeneration time wasconsiderably longer. After 1 was fully reformed, presumably asthe result of substrate exhaustion, further addition of eithertppts or CysSH led again to formation of 2 followed by slowdecay back to the initial spectrum, indicating that the systemremained active for OAT. Thus, under these conditions, therate-limiting step(s) of the catalytic cycle indicated by Scheme1 is the regeneration of 1 from 2. When analogous reactionswere carried out at higher pH, the rate of FeIII(TPPS)reformation decreased (see below), and at pH 7.4 the rate wastoo slow to measure.To provide a more quantitative estimate of rates, we have
measured the time that the various reaction systems required toreturn from the maximum absorbance due to 2 found upon theOAT reaction initiated by mixing 1, nitrite, and substrate to theabsorbance where the concentrations of 2 and 1 were equal.This value that is defined here as τr/2 is affected by the natureand concentration of the substrate as well as by the pH (Table1). As expected, τr/2 becomes longer when there is more
Scheme 2. Heme-Mediated OAT to RSH (CysSH or GSH)Gives the Sulfenic Acid, RS(O)H, Which Is Trapped byExcess RSH To Form RSSR or by Dimedone (D) To GiveD−SR
Figure 2. The temporal changes for the OAT reaction at pH 5.81 withFeIII(TPPS) (1, 8 μM), NaNO2 (10 mM), and several tpptsconcentrations (1−2 mM), showing fast initial formation ofFeII(TPPS)(NO) (2, 413 nm) followed by slow reformation of 1.
Journal of the American Chemical Society Article
dx.doi.org/10.1021/ja312092x | J. Am. Chem. Soc. XXXX, XXX, XXX−XXXD

substrate to consume; however, the nonlinear relationshipbetween the values of τr/2 and [tppts] suggests that the timerequired for the system to cycle fully may be affected byfeedback mechanisms. For example, we have shown previouslythat the OAT reaction to tppts is inhibited by the tpptsOproduct, presumably due to competitive binding of this speciesand NO2
− to 1.28 The other feature of the data in Table 1 is thestrong relationship between τr/2 and pH that clearly shows thatthe catalytic cycle leading to full consumption of the substrate,and the concomitant return of the iron complex to 1 is faster ina more acidic medium.Nitrous Oxide as a Product. In our earlier study, FTIR
analyses of the headspace gases present after mixtures of 1,nitrite, and tppts had reacted to full substrate exhaustion in pH5.81 buffer solution clearly indicated that nitrous oxide is also aproduct of this system.30 This technique showed that N2O wasformed when tppts was the substrate, but when CysSH was thesubstrate N2O was not detected. In that study, we reported thatthe amount of N2O generated corresponded to ∼one-half themoles of tppts consumed, that is, approximately stoichiometricquantities in terms of substrate redox equivalents. However, therevised data described below suggest that this result was inerror apparently due to a failure to appreciate the dramaticpressure dependence of the extinction coefficients of IRabsorbances in the spectra of gas phase molecules.42 Thepresent data show that substantial quantities of nitrous oxideare indeed formed, but these are less than stoichiometric withsubstrate consumed.Quantification of N2O production was readdressed using a
combination of FTIR and GC analysis. For example, thereaction of 1 (8 μM), nitrite (10 mM), and tppts (1.0 mM) wasrun in a Schlenk-type cell of the type illustrated in SupportingInformation Figure S-1. The 3.0 mL solution contained initially0.024, 30, and 3.0 μmol of the respective reactants. Afterspectral changes indicated the complete regeneration of 1, thereaction cell was equilibrated with an 8 cm path length CaF2 IRcell connected by t-joint. The IR cell was then pressurized to∼1 atm with argon and the FTIR spectrum was recorded, thegas-phase N2O spectrum showing the characteristic P and Rbranches (Supporting Information Figure S-4). The amount ofN2O present was then calculated by comparison to an IRabsorbance calibration curve generated by recording the FTIRspectra of gas mixtures containing different amounts of pureN2O pressurized to ∼1 atm with argon. From this measure-ment together with the respective gas and liquid volumes andthe partition coefficient between the liquid and gas phases (seeExperimental Section), the quantity of N2O formed wascalculated as 0.42 μmol. GC analysis of a 500 μL aliquot ofthe gas phase gave a similar, but somewhat larger, quantity ofN2O (0.69 μmol) generated by the same reaction system. The
latter value is considered the more reliable given the pressuresensitivity of the FTIR measurement and the need torepressurize the cell before recording the spectrum. Thus,while the N2O formed proved to be considerably greater thanthe quantity of 1 initially present, the yield was only about one-half (46%) the amount predicted (1.5 μmol), if the oxidation oftppts to tpptsO were entirely due to the heme-mediatedreduction of NO2
− to N2O. Notably, within detection limits, noN2O was formed after 12 h by a control solution containingNaNO2 (10 mM) and tppts (1 mM) but not containingFe(TPPS) complexes (Supporting Information Figure S-4).The pH effect on FeIII(TPPS) reformation and the
observation of N2O as a product led to our proposal30 thatHNO was slowly generated via the protonation of 2 to form anitroxyl complex (Scheme 3). Dissociation of HNO would give
1, while rapid dehydrative dimerization of HNO would formN2O.
43 The absence of N2O in the CysSH reaction isconsistent with this hypothesis, because it is well-known thatHNO is trapped by thiols to give sulfinamides.44−47
Analysis for HNO Formation. There are other potentialpathways to nitrous oxide, so alternative tests for HNOgeneration are necessary to evaluate the pathway suggested byScheme 3. For example, in an earlier study, Reisz et al.48
reported that tris(4,6-dimethyl-3-sulfonato-phenyl)phosphine(trisodium salt) reacts with HNO in pH 7.4 aqueous solutionto form a 1:1 ratio of the phosphine oxide (R3PO) and aza-ylide (R3P(NH)) (eq 8), the formation of which can beevaluated by 31P NMR. The respective chemical shift values forR3PO and R3P(NH) of this phosphine are 39.8 and 34.5 ppmversus phosphoric acid in buffered aqueous solution, and nitritedid not interfere with their analysis. Analogous reactivity shouldbe observed with the analogous water-soluble phosphine tppts,and this supposition was tested by examining the products fromthe reaction of equimolar (0.5 mmol) tppts and the HNOdonor AS in pH 5.81 solution (0.6 mL of buffer containing 10%D2O) for 30 min. The 31P NMR spectrum of the resultingsolution indicated the depletion of the signal for tppts (−5.0ppm vs phosphoric acid) and the formation of tpptsO (34.5ppm) and another species (35.5 ppm) consistent withformation of tppts(NH) in a roughly 1:1 ratio (SupportingInformation Figure S-5). The latter species was relatively stable,although the 31P NMR spectra did show it to hydrolyze totpptsO over a period of 36 h (data not shown). Consistent withtpptsO and tppts(NH) being formed by the trapping of HNOby tppts, GC analysis of the head space from such solutionsshowed only ∼15% of the N2O seen for the analogous decay ofAS in the absence of tppts.
+ → +2R P HNO R PO R P(NH)3 3 3 (8)
In this context, it is notable that the 31P NMR spectrum ofthe products recorded 12 h after preparing a deaerated, ambienttemperature solution of 1 (8 μM), NO2
− (10 mM), and tppts(1 mM) showed not only the resonance for tpptsO at 34.5 ppmbut also one at 35.5 ppm consistent with formation oftppts(NH) (Supporting Information Figure S-6), at about one-third of the intensity of the phosphine oxide. The lower butsignificant intensity of the latter signal would be expected
Table 1. Effect of Substrate Concentration and of pH onτr/2
a
[tppts]b (mM) 1.0 1.5 2.0τr/2 (min) 71 240 376
pHc 5.65 5.81 6.25τr/2 (min) 81 240 570
aτr/2 is the time required for a solution prepared from FeIII(TPPS) (1,10 μM), nitrite (10 mM), and the phosphine tppts (at 298 K) toreturn from the maximum concentration of FeII(TPPS)(NO) (2) firstformed to the state where [2] = [1]. bpH 5.81. c[tppts] = 1.5 mM.
Scheme 3. Proposed Formation of HNO
Journal of the American Chemical Society Article
dx.doi.org/10.1021/ja312092x | J. Am. Chem. Soc. XXXX, XXX, XXX−XXXE

because tpptsO is also the product of the OAT reaction (seeabove). While this observation would be consistent with theHNO hypothesis, the pH of our experiment (5.81) was lowerthan that (7.4) used by Reisz et al.48 As a control, nitrite (10mM) was allowed to react with tppts (1 mM) in pH 5.81solutions for 12 h. Surprisingly, the 31P NMR spectrum of theproduct solution revealed resonances at 34.5 and 35.5 ppm(Figure S-7). Previously, we reported that the 31P NMR did notshow significant formation of the tppts oxide after 1 week, andno peak at 35.5 was identified. These solutions were measuredafter a prolonged reaction time, and any aza-ylide that may havebeen generated would have undergone hydrolysis to the oxide.If indeed the peak at 35.5 ppm after 12 h represents the aza-ylide, it is not clear how this might have formed, given thatanalogous solutions showed no N2O production. Thus, theresults of the trapping experiments with tppts appear to beambiguous.Another approach to HNO detection is the amperometric
method recently developed by Suarez et al37 using a goldelectrode modified with Co(Por) (Por2− = 5,10,15,20-tetrakis-[3-(p-acetyl-thiopropoxy)phenyl]porphyrinato) as a HNOspecific sensor. The OAT reaction was carried out with thisdetector in deaerated pH 5.81 phosphate buffer solution usingthe following concentrations: 1 (8 μM), NaNO2 (10 mM), andtppts (1.5 or 0.1 mM). Sodium nitrate (0.1 M) was added assupporting electrolyte to achieve good conductivity (NaNO3alone showed no detectable signal), and the electrochemicalmeasurements were calibrated versus the release of HNO fromdifferent concentrations of Angeli’s salt (AS) (Figure S-8).Upon adding tppts (1.5 mM) to a solution of FeIII(TPPS) andnitrite, a strong positive signal for HNO was observed to riseslowly (Figure 3). A total of ∼3 μmol of HNO was generated
according to the AS calibration curve. This was approximatelyequivalent to the amount of HNO released by a 1 mM solutionof AS under the same conditions. This would correspond to a∼67% yield of HNO based upon the reducing equivalents ofthe tppts added to the reaction solution. Given that under theseconditions with the tppts concentration at 1.5 mM, ∼3000nanomol of HNO was detected in a solution containing only 24nanomoles of 1, HNO production is clearly catalytic in the iron
species. Addition of less tppts (0.1 mM) produced much lessHNO (Figure 3).Notably, when 1 was not present, addition of tppts (1.5 mM)
to an analogous solution of sodium nitrite (10 mM) led to theformation of trace amounts of HNO, but this was only ∼5% ofthat produced in the presence of 1. Thus, the amperometrictechnique clearly demonstrates that substantial HNO is formedin this reaction system in a process coupled to FeIII(TPPS),nitrite, and tppts.If all of the HNO detected in the OAT reaction of the 1.5
mM tppts solution were to dimerize, the resulting amount ofN2O would have been 1.5 μmol. For comparison, the GCexperiments quantifying the nitrous oxide formed by a solutioninitially 1.0 mM in tppts (see above) gave a N2O yield of 0.69μmol (46% of the theoretical maximum), a yield that is of amagnitude similar to that (67%) for the HNO detected directly.Furthermore, as we have noted, the phosphine itself can act as atrap for HNO, although it is less efficient than are the thiols.Any such trapping would serve both to diminish the net yield ofN2O and to deplete the tppts substrate. Similarly, NO is knownto trap HNO (second-order rate constant = 5.8 × 10⁶ M−1
s−1),49 and as noted below, NO is also generated during theFe(TPPS)-mediated nitrite oxidation of tppts.The observation that HNO is indeed generated, albeit to a
much lesser extent, in the solutions containing only nitrite andtppts may explain the 31P NMR results noted above. Thedimerization to give nitrous oxide would be second order inHNO, while the trapping of this reactive species by excessphosphine would be first order. As a consequence, the slowerproduction of HNO in the uncatalyzed system would beexpected to result in more efficient trapping by tppts to give theoxo- and aza-phosphine and much less N2O.If HNO were indeed produced according to Scheme 3, one
would expect to observe the signature N2O product from thespontaneous reactions of 2 in the absence of the other reactioncomponents. Accordingly, 2 was generated in the absence ofadded NO2
− by the (slow) reductive nitrosylation of 1 (10 μM)under excess NO at pH 5.81.38 The excess NO was removed,and the reaction cell was backfilled with argon. After NOremoval, the spontaneous back reaction of 2 proceeded over 5h at ambient temperature to reform 1, and this occurred both inthe absence and in the presence of added tppts (1 mM). Thus,tppts does not reduce 1 in the absence of nitrite. There was nomeasurable formation of N2O detected in GC-TD tracesrecorded for 500 μL aliquots of the headspace gas (data notshown, estimated detection limit is 2 nmol). However, it shouldbe noted that the maximum amount of N2O anticipated by thisexperiment in 3 mL solution would be only 15 nmol. In arelated experiment, 2 was similarly generated but remainedunder NO (1 atm) for a period of 36 h. Under these conditions,the spectrum remained that of 2. Samples of the headspacewere analyzed by gas chromatography after 0, 12, and 36 h.Again, nitrous oxide (above the small background) was notdetected in either of the latter samples (data not shown). Thus,one can conclude that the N2O product seen when both nitriteand tppts are present is not due to Fe(TPPS)-mediateddisproportionation of NO. Furthermore, these results suggestthat the formation of HNO from 2 in these reactions systemsmust also involve the additional presence of nitrite or tppts inthe solution.
NO Reduction by tppts? Although the nitric oxide initiallyformed by the OAT reaction would be strongly coordinated tothe FeII(TPPS) moiety (Scheme 1), it is necessary to consider
Figure 3. Temporal [HNO] detected using the cobalt-modified goldelectrode37 as generated by pH 5.81 buffered solutions containingFeIII(TPPS) (1, 8 μM), NaNO2 (10 mM), and tppts at 1.5 mM (blue)or 0.1 mM (pink). The supporting electrolyte was NaNO3 (0.1 M).The plots are the average of two independent runs (see Figure S-9 forthe individual raw data).
Journal of the American Chemical Society Article
dx.doi.org/10.1021/ja312092x | J. Am. Chem. Soc. XXXX, XXX, XXX−XXXF

the possibility of NO dissociation and reaction with thetriarylphosphines according to eq 9:
+ → +R P 2NO R PO N Ok
3 3 29
(9)
because this is another possible pathway to N2O formation. Inan earlier study from this laboratory,50 the reaction oftriphenylphosphine with NO was shown to be first order in[Ph3P] and second order in [NO], with third-order rateconstants k9 of 90, 1.05 × 10³, and 1.57 × 10³ M−2 s−1 in 294 Ktoluene, chloroform, and 1,2-dichloroethane, respectively.Substantial substituent effects were observed. However, phenylring sulfonates are but modestly electron withdrawing,51 somajor reactivity differences between Ph3P and tppts in theanalogous media would not be expected. The reaction wasproposed to proceed through reversible formation of anintermediate with the composition R3P(N2O2) (KP),
50 whichwould be stabilized by a more polar medium (Scheme 4),
where k9 = KPkP. A subsequent DFT study (B3LYP/6-31+G*)of the model reaction of PH3 + 2NO has concluded thatR3P(N2O2) adduct is likely to be a 1,4-dioxoazaphospholeformed by coordinating both oxygens of the N2O2 dimer to thephosphine.52 DFT calculations (B3LYP/6-311+G**) in thislaboratory confirmed that a 1,4-dioxoazaphosphole intermedi-ate provides the lowest energy in silico path to the products ofeq 9 (R3P = iPr3P, Supporting Information Figure S-10).To evaluate the potential contribution of the NO/tppts
reaction under the present conditions, the kinetics wereinvestigated in pH 5.81 (50 mM phosphate buffer) solutionby monitoring temporal absorbance changes at 290 nm,corresponding to the loss of tppts. The experiments wereconducted in a Schlenk spectrophotometer cell (SupportingInformation Figure S-1) for which the headspace volume (28mL) greatly exceeded that of the solution (3.0 mL). Thus, thebulk (>99%) of the NO equivalents was in the headspace dueto the gas/aqueous liquid partition coefficient (20.9),35 and thesolution [NO] was maintained at an approximately constantvalue by shaking the cell between spectral measurements. First-order kinetics were observed under these conditions. A plot ofthe resulting kobs values versus [NO]2, where [NO] is thecalculated solution-phase nitric oxide concentration (0.14−0.44mM), proved to be linear with a slope (k9) of (3.9 ± 0.4) × 104
M−2 s−1 (Figure 4). This value is much larger than thosedetermined in organic solvents in accord with the reactionbeing faster in more polar media.Nonetheless, this kinetics result suggests that the direct
reduction of NO by tppts (Scheme 4) would be too slow tocontribute significantly to N2O generation under conditions ofthe OAT reactions. To test this conclusion, control reactionsbetween a low steady-state NO concentration of 500 nM andtppts (1 mM) were investigated. These did not generateappreciable amounts of N2O over a 12 h period according tothe IR method (where we estimate the threshold of N2O
detection to be ∼200 nmol). When higher concentrations ofboth tppts (2 mM) and NO (2 μM) were used, sufficient N2O(∼250 nmol) was formed after 20 h to be detected by the IRtechnique. However, these studies show that it is unlikely thatNO reduction by tppts is a major contributor to the nitrousacid formation in the present system.53,54
Nitric Oxide Production. Two potential NO sources in thissystem are the OAT reaction (Scheme 1) and aciddisproportionation of nitrite (eq 10). The NO formed byheme-mediated OAT to tppts would be strongly coordinated toa ferrous heme (the dissociation constant for 2 is ∼10−13 M inaqueous solution),16 while NO formed by nitrite disproportio-nation would also be low at this pH (∼100 nM). A thirdpotential NO source would be from nitrite reductase activity ofthe ferrous complex FeII(TPPS) (5), although it is anticipatedthat the concentration of free 5 would be very low, unless othercomponents in the system affect the FeII/FeII(NO) equilibrium.In this context, the Sievers nitric oxide analyzer was used toprobe the temporal [NO] in pH 5.81 reaction solutionscontaining 1, NaNO2, and either tppts or CysSH.
+ ⇌
⇌ +
⇌ +
+ −2H 2NO 2HNO
H O N O
NO NO
2 2
2 2 3
2 (10)
Cysteine does not react directly with NO under anaerobicconditions,55 so any free NO formed in the heme-mediatednitrite oxidation of CysSH should not be depleted. To evaluatepossible NO production in this case, a reaction solution wasprepared from 1 (10 μM), sodium nitrite (10 mM), and CysSH(1 mM) at pH 5.81. The presence of 2 was monitored by theSoret band absorbance at 413 nm, while the NOA was used todetermine the temporal [NO] in headspace aliquots takenperiodically over 10 h at 298 K (Figure 5). An analogousexperiment was also carried out using tppts (2 mM) as thesubstrate. For 2, the patterns were analogous to those describedabove. When tppts was the substrate, there was a rapid rise inabsorbance at 413 nm to a near steady-state value close tocomplete conversion of 1 to 2 for several hours, followed by agradual decay back to an absorption spectrum close to that of 1.When CysSH was the substrate, the steady-state stage wasmuch longer, so that even at 10 h, the heme complexes were
Scheme 4. Proposed Pathway for NO Oxidation ofTriarylphosphine by NO
Figure 4. Temporal absorbance changes at 290 nm for the reaction oftppts (0.56 mM) with an approximately constant [NO] (0.14 mM, seetext) fitted to a single exponential (kobs of 1.3 × 10⁻³ s−1). Inset: Plotfor kobs versus [NO]
2 giving k11 = (3.9 ± 0.4) × 104 M−2 s−1 (pH 5.81at 298 K).
Journal of the American Chemical Society Article
dx.doi.org/10.1021/ja312092x | J. Am. Chem. Soc. XXXX, XXX, XXX−XXXG

mostly in the ferrous nitrosyl state. Furthermore, there was amarked difference in the ability of the two systems to generateNO. While [NO]solution was initially ∼100 nM in both cases,NO generated from the tppts substrate leveled off at ∼400 nM.For the CysSH substrate, this was ∼4-fold higher at ∼1.6 μM.Indeed, calculations using the relative volumes of the gas (28mL) and solution (3.0 mL) phases in the reaction cell and theNO partition coefficient between the gas and aqueous phasesindicate that total NO production from the respective reactionswas ∼235 nmol from the tppts (6 μmol total) and ∼940 nmolfrom the CysSH (3 μmol total), even though in the latter casethe system had not yet returned to the ferric state. The formervalue corresponds to a yield of ∼2% of the theoreticalmaximum, if the sole reaction were the Fe(TPPS)-mediatedreduction of nitrite to NO, while the latter corresponds to a∼16% yield. Therefore, free NO is also produced by thecatalytic cycle, especially when cysteine is the reducing agent.Nitrite Reductase Activity of FeII(TPPS) (5). It is clear that
NO is produced by reactive systems containing nitrite,substrate, and Fe(TPPS) in molar quantities substantiallyexceeding that of the initially added 1 (typically 24−30nmol).56 While this result was especially apparent for the nitriteoxidation of CysSH (Figure 5), it was also true for tppts. Whatare the likely sources of this NO? Fe(TPPS) is clearly necessaryfor NO generation in both cases, hence it must be a catalyst,but if so, how can the ferrous complex participate in furthernitrite reduction given the high stability of 2?To probe such questions, the nitrosyl complex 2 was
generated in situ by the reductive nitrosylation of 1 (8 μM) inbuffered solutions containing different concentrations of nitritebut no organic reductant.38 After the excess NO was removed,the effect of nitrite concentration and of pH on the oxidation of2 to 1 was probed by recording the time elapsed from initiationto when a 1:1 ratio of [2]:[1] was reached (τr/2, describedabove). These data are summarized in Table 2 where it isobvious that increasing either [H+] or [NO2
−] in both casesaccelerates the transformation of 2 to 1 in this medium.Given that solutions of 2 spontaneously regenerate 1 at pH
5.81 when nitrite is present without added substrate, a plausible
explanation is that some ferrous complex in this mediumreduces nitrite in analogy to the NiR activity of ferrous hemeproteins.7,9 This hypothesis was probed with solutions ofFeII(TPPS) (5) prepared by the dithionite (∼15 μM) reductionof 1 (10 μM) at various pH’s (5.81−6.25). After the dithionitehad spontaneously decayed,57 NaNO2 (6.6 mM) was added.The resulting temporal optical spectra showed a decrease of theSoret band for 5 (λmax 412 nm) and appearance of a broad bandconsistent with a 1:1 mixture of 1 and 2 (Figure 6). Such
behavior parallels the NiR activity demonstrated for ferro-hemeproteins such as myoglobin,9 where the NO generated rapidlytraps an equivalent of 5 to give a 1:1 ratio of the ferro-hemenitrosyl and the ferri-heme (eq 11). The reaction depicted in eq11 is quite favorable for Por = TPPS, in part due to the stabilityof the ferrous nitrosyl product. Although the reactions were notfollowed further in this case, the above results imply that thismixture will eventually evolve to a solution containing mostly 1.The spectral changes display a fast initial phase followed by aslower one, so the initial rates method was used to evaluate thefirst stage. The response of the initial rates (M s−1) to variationsin the solution components indicated first-order behavior in[NO2
−] (3.3−13 mM) and in [H+] (eq 12, SupportingInformation Figure S-11), consistent with eq 11. From thesedata, the second-order rate constant (k′ = k11[H
+]) for thereaction at pH 5.81 was calculated to be 0.024 ± 0.001 M−1 s−1.
+ +
⇌ + +
− +2Fe (Por) NO 2H
Fe (Por) Fe (Por)(NO) H O
II2
III II2 (11)
− = − +t k5 5d[ ]/d [NO ][H ][ ]11 2 (12)
A possible scenario for this NiR is shown in Scheme 5. Theequilibrium and rate constants for spontaneous NO dissocia-
Figure 5. Reactions following addition of tppts (2.0 mM) or cysteine(1.0 mM), blue and green, respectively, to solutions of FeIII(TPPS) (1,10 μM) and nitrite (10 mM) monitored by using the NOA todetermine the NO formation (dots) and by the temporal absorbanceat 413 nm, the λmax of FeII(TPPS)(NO) (2) (lines). The NOconcentration in solution was calculated by determining that present inthe gaseous head space and using the gas/aqueous solution partitioncoefficient to calculate [NO]solution. (Note that a control reaction oftppts and nitrite without Fe(TPPS) did not lead to enhanced NOformation relative to nitrite solutions alone under the sameconditions.)
Table 2. Effect of [NO2−] and of pH on τr/2
a
[NO2−]b (mM) 2.0 5.0 10.0
τr/2 (min) 491 319 145
pHc 5.81 6.05 6.25τr/2 (min) 145 300 430
aτr/2 is the time required 2 (initially 8 μM) to evolve to a 1:1 ratio of 2and 1 in the absence of other reductants at 298 K. bpH 5.81. c[NO2
−]= 10 mM.
Figure 6. The reaction of FeII(TPPS) (5, 10 μM) and nitrite (6.6mM) at pH 5.81 (50 mM phosphate) as monitored by the absorbancechanges. The reaction proceeds from 5 (412 nm) to form a broadband due to the formation of a 1:1 ratio of FeII(TPPS)(NO) (2,413nm) and FeIII(TPPS) (1, 393 nm). Inset: Temporal absorptionchanges at 413 nm (above) and 393 nm.
Journal of the American Chemical Society Article
dx.doi.org/10.1021/ja312092x | J. Am. Chem. Soc. XXXX, XXX, XXX−XXXH

tion from 2 are both quite small (Kd < 10−12 M, koff = 6.4 ×10⁻⁴ s−1)16 in aqueous solutions. Thus, it seems likely that NOdissociation may be promoted by association of 2 with aproximal ligand, most likely a nitrite ion. DFT studies,described briefly below, confirm the labilizing effect of aproximal N-nitrito (“nitro”) group. Alternatively, the nitrosylnitrito complex itself might react to give (transiently) adinitrosyl iron(III) complex. The reaction kinetics brieflyinvestigated do not differentiate these alternatives. Notably,the substrates in the OAT systems may also serve as translabilizers of coordinated NO (see below), although as reportedabove, their presence is not a necessary condition for nitritepromoted transformation of 2 to 1.DFT computations of FeII(P)(L)(NO) (P = porphine
dianion) were used to provide some insight into the potentialsignificance of a proximal ligand L in labilizing nitric oxide froma ferro-heme nitrosyl. Various neutral and anionic ligandsincluding H2O, O- and N-coordinated nitrite ion, cysteine andcysteinate ion, dimethylsulfide, methylsulfide, and trimethyl-phosphine were considered. As noted previously,58 thecalculated Fe−NO bond distances and Fe−N−O angles ofFeII(P)(L)(NO) are significantly affected by the proximalligand. The former increases from ∼0.02 Å for L = H2O,CysSH, and DMS to ∼0.08−0.09 Å for Me3P, CysS
−, and N-nitrito relative to FeII(P)(NO) (see Supporting InformationFigure S-12); the latter moves from a calculated angle of 144°for FeII(P)(NO) to 140° for L = H2O and similar ligands to∼138° for L = Me3P, CysS
−, and N-nitrito. Interestingly, thelargest calculated effects are seen for a proximal N-nitritoligand, and these in silico results suggest that NO labilizationmay be promoted by nitrite coordination, and perhaps bycoordination of the phosphine or thiol substrates. Furthermore,the more acute Fe−N−O angle of the proximal coordinatedferrous nitrosyl also invites the speculation that the NO is morenegatively charged and therefore is more susceptible toprotonation. Thus, coordination of nitrite (or a substratesuch as a tppts or a thiolate) to 2 may also promote theformation of HNO as well as NO labilization (and subsequentnitrite reduction to a second NO). Both of these pathways leadto the formation of 1, although it is important to note that bothare acid dependent, thus activated by the lower pH’s studiedhere. In the presence of excess nitrite, the OAT reaction closesthe cycle back to 2 so long as a sulfide, thiol, or phosphinesubstrate is present. Thus, the heme is catalyzing the reductionof nitrite to NO and/or HNO by these substrates.
■ SUMMARYWe have described a complex matrix of transformations for anaqueous system composed of inorganic nitrite and reductantssuch as a water-soluble phosphine, dimethyl sulfide, or thebiological thiols cysteine or glutathione and mediated by theheme-model Fe(TPPS). These processes include: (i) The ferriccomplex 1 promotes oxygen atom transfer from coordinatednitrite to the substrates tppts, DMS, CysSH, and GSH withconcomitant formation of 2. (ii) For the thiols CysSH andGSH, trapping studies show the initial products to be therespective sulfenic acids, functional groups that are drawingincreasing attention with regard to their biological relevance assensors of oxidative stress and in redox-based signaling.59 (iii)The OAT product solutions do not terminate at the very stableferrous nitrosyl 2. Instead, spectral changes showing the slowregeneration of 1 are an indicator that the system remainsdynamic with both N2O and free NO being produced. (iv)Exploration of various pathways to nitrous oxide formationpoints to nitroxyl (HNO) as an intermediate product thatundergoes dehydrative dimerization to give N2O. The HNOintermediate was directly observed using a recently reportedelectrochemical HNO sensor.37 (v) The nitrite reductaseactivity of the ferrous complex FeII(TPPS) is described, andit is suggested that the lability of ferrous nitrosyl complexes isenhanced by coordination of a nitrite ion or a thiol in theproximal site.Furthermore, the production both of the transient HNO and
of NO as the iron species cycles from 1 to 2 and back duringthe mediated oxidation of tppts by nitrite is clearly catalytic inFe. Similar catalysis is evident in the iron-mediated oxidation ofCysSH and the concomitant net production of NOThe overall reaction cycle proposed for the aqueous system
composed of FeIII(TPPS) (3), NO2−, and substrate (tppts,
DMS, CysSH, or GSH) is illustrated by Scheme 6. Given the
several competing pathways described here, the exactstoichiometry of this reaction system is likely to be a subtlefunction of the conditions. Initial OAT from the ferric N-nitritocomplex forms the ferrous nitrosyl 2 plus the oxidized substrate(tpptsO, DMSO, CysS(O)H, or GS(O)H, respectively). For S= CysSH or GSH, the sulfenic acid initially formed reactsrapidly with the excess RSH to form the correspondingdisulfide, RSSR (Scheme 2, k > 720 M−1 s−1).60 In addition, we
Scheme 5. Hypothetical Pathway for the Nitrite ReductaseReactions of FeII(TPPS) in Aqueous Solutiona
aCoordination sites without a ligand may be occupied by H2O.
Scheme 6. Compendium of Reactions Described for pH 5.81Solutions of Fe(TPPS), Nitrite, and Various Substratesa
aCoordination sites without a ligand may be occupied by H2O.
Journal of the American Chemical Society Article
dx.doi.org/10.1021/ja312092x | J. Am. Chem. Soc. XXXX, XXX, XXX−XXXI

show that in these weakly acidic media (pH ≈ 6) the ferrousnitrosyl is simply not as inert as commonly assumed. One decayprocess is the slow formation of HNO, presumably byprotonation of the metal nitrosyl, because this pathway isquite pH dependent.61 Another involves the nitrite reductionby ferrous complex(es) via rate-limiting NO dissociation fromthe ferrousnitrosyl promoted by various proximal ligands. Byanalogy, the bacterial nitrite reductase P. aeruginosa c,d1 NIRand wild-type cytochrome P450 BM3 have nitric oxide off ratesthat are >103 times faster than most Fe(II) nitrosyls.62,63
Computational studies suggest that NO loss may be facilitatedby direct reaction of NO2
− with 2 to give a ferrous nitrosyl N-nitrito complex FeII(TPPS)(NO)(NO2
−). It is likely that theproximal ligand also plays a role in activating the ferrouscoordinated NO toward protonation and release of HNO.Endogenous formation of HNO has been speculated for
many years.47 The difficulty in detecting this elusive species isdue to its inherent reactivity and the dependence on indirectmarkers for HNO. Nitric oxide synthase (NOS) has beenconsidered to be a likely candidate for HNO production, andvarious mechanisms have been proposed.64−68 Fukuto et al.have shown that Nω-hydroxy-L-arginine (L-NOHA, a reactionintermediate during NOS turnover) can be uncoupled fromNOS and subsequently oxidized to form HNO.65 Anothermechanism depends on the bioavailability of the NOS cofactortetrahydrobiopterin (BH4), which was shown to be necessaryfor production of NO. During turnover conditions withoutBH4, the ferrous nitrosyl (FeIINO) complex of NOSaccumulates and HNO is formed.67 The exact sequence forHNO (NO−) or FeIINO formation has not been determined;however, an essential comparison of NOS turnover to oursystem is that after formation of the ferrous nitrosyl (the so-called “futile pathway”),69 HNO formation is continuous untilthe resting ferric state is reached.Although the present studies were carried out at pH values
lower than considered typical of tissues or circulatory fluids inmammalian physiology, it should be noted that there arevarious environments where a lower pH is indeed relevant. Forexample, the tissue of organs suffering ischemia/reperfusioninjury often becomes relatively acidic,70 and that proteinexpression of inducible NOS, a potential source of HNO,increases during ischemic preconditioning.71 In this context, thetypes of processes described here are consistent with theperceived protective roles of inorganic nitrite during I/R injurythat have been attributed in part to NO formation.1,2 Giventhat HNO has also been ascribed to protective properties,47 thepresent studies may be doubly relevant with regard to themechanisms of nitrite protection under these circumstances.Other acidic microenvironments have been documented. ThepH ranges from 5.5 to 7.0 along the GI tract72 and from 4.5 to6.5 in the organelles involved in the removal of cellular waste(endosomes, lysosomes, phagosomes).73 The role of NO inthese environments has not been fully investigated; however,high levels of nitrite are present in acidic phagosomes to helpdestroy invading pathogens. In these contexts, it is interestingto hypothesize that production of NO and even HNO bypathways analogous to those described here could add to thediverse signaling mechanisms associated with nitrite biology.
■ ASSOCIATED CONTENT*S Supporting InformationTwelve figures, one table, and two schemes. This material isavailable free of charge via the Internet at http://pubs.acs.org.
■ AUTHOR INFORMATION
Corresponding [email protected]
NotesThe authors declare no competing financial interest.
■ ACKNOWLEDGMENTS
This work was supported by the Chemistry Division of the U.S.National Science Foundation (CHE-0749524 and CHE-1058794). J.L.H. thanks the ConvEne IGERT Program(NSF-DGE 0801627) for a fellowship, and we also thankProf. Jon Fukuto of Sonoma State University for providing theAngeli’s salt used in these studies.
■ REFERENCES(1) (a) Shiva, S.; Gladwin, M. T. Basic Res. Cardiol. 2009, 104, 113−9. (b) Tejero, J.; Basu, S.; Helms, C.; Hogg, N.; King, S. B.; Kim-Shapiro, D. B.; Gladwin, M. T.; Low, N. O. J. Biol. Chem. 2012, 287,18262−18274.(2) (a) Lundberg, J.; Weitzberg, E.; Gladwin, M. T. Nat. Rev. DrugDiscovery 2008, 7, 156−67. (b) Castiglione, N.; Rinaldo, S.; Giardina,G.; Stelitano, V.; Cutruzzola, F. Antioxid. Redox Signaling 2012, 17,684−716. (c) Hines, I. N.; Grisham, M. B. J. Clin. Biochem. Nutr. 2011,48, 50−56.(3) However, see also: Luchsinger, B. P.; Rich, E. N.; Yan, Y.;Williams, E. M.; Stamler, J. S.; Singel, D. J. J. Inorg. Biochem. 2005, 99,912−21.(4) Hendgen-Cotta, U. B.; Kelm, M.; Rassaf, T. Nitric Oxide-Biol.Chem. 2010, 22, 75−82.(5) Tsuchiya, K.; Kanematsu, Y.; Yoshizumi, M.; Ohnishi, H.; Kirima,K.; Izawa, Y.; Shikishima, M.; Ishida, T.; Kondo, S.; Kagami, S.;Takiguchi, Y.; Tamaki, T. Am. J. Physiol. 2005, 288, H2163−70.(6) Feelisch, M.; Fernandez, B. O.; Bryan, N. S.; Garcia-Saura, M. F.;Bauer, S.; Whitlock, D. R.; Ford, P. C.; Janero, D. R.; Rodriguez, J.;Ashrafian, H. J. Biol. Chem. 2008, 283, 33927−34.(7) Huang, K. T.; Keszler, A.; Patel, N.; Patel, R. P.; Gladwin, M. T.;Kim-Shapiro, D. B.; Hogg, N. J. Biol. Chem. 2005, 280, 31126−31.(8) Nagababu, E.; Ramasamy, S.; Abernethy, D. R.; Rifkind, J. M. J.Biol. Chem. 2003, 278, 46349−56.(9) Shiva, S.; Huang, Z.; Grubina, R.; Sun, J.; Ringwood, L. A.;MacArthur, P. H.; Xu, X.; Murphy, E.; Darley-Usmar, V. M.; Gladwin,M. T. Circ. Res. 2007, 100, 654−61.(10) Yi, J.; Heinecke, J.; Tan, H.; Ford, P. C.; Richter-Addo, G. B. J.Am. Chem. Soc. 2009, 131, 18119−28.(11) Heinecke, J.; Yi, J.; Pereira, J. C. M.; Richter-Addo, G. B.; Ford,P. C. J. Inorg. Biochem. 2012, 107, 47−53.(12) Tiso, M.; Tejero, J.; Basu, S.; Azarov, I.; Wang, X.; Simplaceanu,V.; Frizzell, S.; Jayaraman, T.; Geary, L.; Shapiro, C.; Ho, C.; Shiva, S.;Kim-Shapiro, D. B.; Gladwin, M. T. J. Biol. Chem. 2011, 286, 18277−89.(13) Webb, A. J.; Milsom, A. B.; Rathod, K. S.; Chu, W. L.; Qureshi,S.; Lovell, M. J.; Lecomte, F. M. J.; Perrett, D.; Raimondo, C.;Khoshbin, E.; Ahmed, Z.; Uppal, R.; Benjamin, N.; Hobbs, A. J.;Ahluwalia, A. Circ. Res. 2008, 103, 957−964.(14) Heinecke, J.; Ford, P. C. Coord. Chem. Rev. 2010, 254, 235−247.(15) Rose, E. J.; Hoffman, B. M. J. Am. Chem. Soc. 1983, 105, 2866−73.(16) Laverman, L. E.; Ford, P. C. J. Am. Chem. Soc. 2001, 123,11614−22.(17) Ford, P. C.; Laverman, L. E.; Lorkovic, I. M. Adv. Inorg. Chem.2003, 51, 203−257.(18) Doyle, M. P.; Hoekstra, J. W. J. Inorg. Biochem. 1981, 14, 351−8.(19) Olson, J. S.; Foley, E. W.; Rogge, C.; Tsai, A. L.; Doyle, M. P.;Lemon, D. D. Free Radical Biol. Med. 2004, 36, 685−697.(20) Shiva, S.; Rassaf, T.; Patel, R. P.; Gladwin, M. T. Cardiovasc. Res.2011, 89, 566−573.
Journal of the American Chemical Society Article
dx.doi.org/10.1021/ja312092x | J. Am. Chem. Soc. XXXX, XXX, XXX−XXXJ

(21) Tovrog, B. S.; Diamond, S. E.; Mares, F. J. Am. Chem. Soc. 1979,101, 270−272.(22) Ercolani, C.; Paoletti, A. M.; Pennesi, G.; Rossi, G. J. Chem. Soc.,Dalton Trans. 1991, 1317−1321.(23) O’Shea, S. K.; Wang, W.; Wade, R. S.; Castro, C. E. J. Org. Chem.1996, 61, 6388−6395.(24) Cheng, L.; Powell, D. R.; Khan, M. A.; Richter-Addo, G. B.Chem. Commun. 2000, 2301−2302.(25) Kurtikyan, T. S.; Hovhannisyan, A. A.; Iretskii, A. V.; Ford, P. C.Inorg. Chem. 2009, 48, 11236−11241.(26) (a) Treinin, A.; Hayon, E. J. Am. Chem. Soc. 1970, 92, 5821−8.(b) Markovits, G. Y.; Schwartz, S. E.; Newman, L. Inorg. Chem. 1981,20, 445−450. (c) Williams, D. L. H. Nitrosation Reactions and theChemistry of Nitric Oxide; Elsevier: Amsterdam, 2004.(27) Bard, A. J., Parsons, R., Jordan, J., Eds. Standard Potentials inAqueous Solutions; Marcel Dekker: New York, 1985; pp 127−139.(28) Khin, C. Ph.D Dissertation, University of California, SantaBarbara, CA, 2008.(29) TPPS is tetrakis(4-sulfonatophenyl)-porphyrinato, FeIII(TPPS)= FeIII(TPPS)(H2O)2
3− (Na+ salt). TMPS is tetrakis(sulfonatomesi-tyl)porphyrinato, FeIII(TMPS) = FeIII(TMPS)(H2O)2
3− (Na+ salt).TPP is tetraphenylporphyrinato.(30) Khin, C.; Heinecke, J.; Ford, P. C. J. Am. Chem. Soc. 2008, 130,13830−13831 and supporting information.(31) Heinecke, J.; Ford, P. C. J. Am. Chem. Soc. 2010, 132, 9240−9243 and supporting information.(32) Ford, P. C. Inorg. Chem. 2010, 49, 6226−6239.(33) Bartik, T.; Bartik, B.; Hanson, B. E.; Glass, T.; Bebout, W. Inorg.Chem. 1992, 31, 2667−2670.(34) Lim, M. D.; Lorkovic, I. M.; Ford, P. C. Methods Enzymol. 2005,396, 3−17.(35) Shaw, A. W.; Vosper, A. J. J. Chem. Soc., Faraday Trans. 1 1977,73, 1239−1244.(36) Wilhelm, E.; Battino, R.; Wilcock, R. J. Chem. Rev. 1977, 77,219−262.(37) Suarez, S .A.; Fonticelli, M. H.; Rubert, A. A.; de la Llave, E.;Scherlis, D.; Salvarezza, R. C.; Martí, M. A.; Doctorovich, F. A. Inorg.Chem. 2010, 49, 6955−6966.(38) (a) Hoshino, M.; Maeda, M.; Konishi, R.; Seki, H.; Ford, P. C. J.Am. Chem. Soc. 1996, 118, 5702−5707. (b) Fernandez, B. O.;Lorkovic, I. M.; Ford, P. C. Inorg. Chem. 2004, 43, 5393−5402.(39) Conradie, J.; Ghosh, A. Inorg. Chem. 2006, 45, 4902−4909.(40) Allison, W. S. Acc. Chem. Res. 1976, 9, 293−299.(41) (a) Percival, M. D.; Ouellet, M.; Campagnolo, C.; Claveau, D.;Li, C. Biochemistry 1999, 38, 13574−13583. (b) Poole, L. B.; Zeng, B.B.; Knaggs, S. A.; Yakubu, M.; King, S. B. Bioconjugate Chem. 2005, 16,1624−1628.(42) Rimmer, R. D.; Richter, H.; Ford, P. C. Inorg. Chem. 2009, 49,1180−5.(43) Shafirovich, V.; Lymar, S. V. Proc. Natl. Acad. Sci. U.S.A. 2002,99, 7340−5.(44) Doyle, M. P.; Mahapatro, S. N.; Broene, R. D.; Guy, J. K. J. Am.Chem. Soc. 1988, 110, 593−599.(45) Wong, P. S.-Y.; Hyun, J.; Fukuto, J. M.; Shirota, F. N.;DeMaster, E. G.; Shoeman, D. W.; Nagasawa, H. T. Biochemistry 1998,37, 5362−5371 [erratum, p 18129].(46) Shoeman, D. W.; Shirota, F. N.; DeMaster, E. G.; Nagasawa, H.T. Alcohol 2000, 20, 55−59.(47) Miranda, K. M. Coord. Chem. Rev. 2005, 249, 433−455.(48) (a) Reisz, J. A.; Klorig, E. B.; Wright, M. W.; King, S. B. Org.Lett. 2009, 11, 2719−21. (b) Reisz, J. A.; Zink, C. N.; King, S. B. J. Am.Chem. Soc. 2011, 133, 11675−11680.(49) Lymar, S. V.; Shafirovich, V.; Poskrebyshev, G. A. Inorg. Chem.2005, 44, 5212−5221.(50) Lim, M. D.; Lorkovic, I. M.; Ford, P. C. Inorg. Chem. 2002, 41,1026−28.(51) Hine, J. Physical Organic Chemistry; McGraw-Hill Book Co.:New York, 1962; p 87.
(52) Zhao, Y.-L.; Bartberger, M. D.; Goto, K.; Shimada, K.;Kawashima, T.; Houk, K. N. J. Am. Chem. Soc. 2005, 127, 7964−7965.(53) A recent study (ref 54) of the analogous NO oxidation of amonosulfonated triphenylphosphine in acidic solution (2−5 mM H+)gave a larger k9 value (5.2 × 10⁶ M−2 s−1 at 298 K). The differencebetween this rate constant and that described here for tppts in pH 5.81solution led us to conduct an independent reinvestigation of the lattersystem. Kinetics studies with 25 μM tppts and 0.25−0.93 mM NOconfirmed the k9[NO]
2[tppts] form of the rate law for tppts oxidation,with k9 = (3.9 ± 0.3) × 104 M−2 s−1 at pH 5.8 and (3.7 ± 0.4) × 104
M−2 s−1 at pH 3.0. These values are in good agreement with the k9described in the text and indicate no pH effect on the reaction rate.(54) Bakac, A.; Schouten, M.; Johnson, A.; Song, W.; Pestovsky, O.;Szajna-Fuller, E. Inorg. Chem. 2009, 48, 6979−6985.(55) Kharitonove, V. G.; Sundquist, A. R.; Sharma, V. S. J. Biol. Chem.1995, 270, 28158−28164.(56) It should be noted that the design of the Schlenk cell, which hasa sizable gas phase volume, provides a very large sink for any gasesgenerated during a reaction. This is especially the case for NO giventhe partition coefficient favoring the gas phase over the aqueous phase.(57) Dithionite could not be removed by chromatography due to thetendency of FeII(TPPS) to stick on a G-25 Sephadex column;therefore, the reactions were started 15 min after completedecomposition of dithionite (λmax 314 nm (8000 M−1 cm−1) (ref56b)). Holman, D. A.; Bennett, D. W. J. Phys. Chem. 1994, 98, 13300−7.(58) Goodrich, L. E.; Paulat, F.; Praneeth, V. K. K.; Lehnert, N. Inorg.Chem. 2010, 49, 6293−6316.(59) (a) Paulsen, C. E.; Carroll, K. S. ACS Chem. Biol. 2010, 5, 47−62. (b) Roos, G.; Messens, J. Free Radical Biol. Med. 2011, 51, 314−326. (c) Vazquez-Torres, A. Antioxid. Redox Signaling 2012, 17, 1201−1214.(60) (a) Claiborne, A.; Miller, H.; Parsonage, D.; Ross, R. P. FASEBJ. 1993, 7, 1483−1490. (b) Ashby, M. T.; Nagy, P. J. Pharm. Sci. 2006,95, 15−18.(61) (a) Note that this reaction is reversible given that ferrihememodels and proteins are known to react with HNO to give theanalogous ferroheme nitrosyls (refs 61b and 61c). (b) Miranda, K. M.;Nims, R. W.; Thomas, D. D.; Espey, M. G.; Citrin, D.; Bartberger, M.D.; Paolocci, N.; Fukuto, J. M.; Feelisch, M.; Wink, D. A. J. Inorg.Biochem. 2003, 93, 52−60. (c) Suarez, S. A.; Martí, M. A.; De Biase, P.M.; Estrin, D. A.; Bari, S. E.; Doctorovich, F. Polyhedron 2007, 26,4673−4679.(62) Rinaldo, S.; Arcovito, A.; Brunori, M.; Cutruzzola, F. J. Biol.Chem. 2007, 282, 14761−14767.(63) Quaroni, L. G.; Seward, H. E.; McLean, K. J.; Girvan, H. M.;Ost, T. W. B.; Noble, M. A.; Kelly, S. M.; Price, N. C.; Cheesman, M.R.; Smith, W. E.; Munro, A. W. Biochemistry 2004, 43, 16416−16431.(64) Schmidt, H. H. W.; Hofmann, H.; Schindle, R. U.; Shutenko, Z.S.; Cunningham, D. D.; Feelisch, M. Proc. Natl. Acad. Sci. U.S.A. 1996,93, 14492−14497.(65) Fukuto, J. M.; Wallace, G. C.; Hszieh, R.; Chaudhuri, G.Biochem. Pharmacol. 1992, 43, 607−613.(66) Pufahl, R. A.; Wishnok, J. S.; Marletta, M. A. Biochemistry 1995,3, 1930−1941.(67) Adak, S.; Wang, Q.; Stuehr, D. J. J. Biol. Chem. 2000, 275,33554−33561.(68) Fukuto, J. M.; Stuehr, D. J.; Feldman, P. L.; Bova, M. P.; Wong,P. J. Med. Chem. 1993, 36, 2666−2670.(69) Santolini, J.; Meade, A. L.; Stuehr, D. J. J. Biol. Chem. 2001, 276,48887−48898.(70) Zweier, J. L.; Samouilov, A.; Kuppusamy, P. Biochim. Biophys.Acta, Bioenerg. 1999, 1411, 250−262.(71) Wang, Y.; Guo, Y.; Zhang, S. X.; Wu, W.; Wang, J.; Bao, W.;Bolli, R. J. Mol. Cell Cardiol. 2002, 34, 5−15.(72) Nugent, S. G.; Kumar, D. Gut 2001, 48, 571−577.(73) (a) Sorkin, A.; von Zastrow, M. Nat. Rev. Mol. Cell Biol. 2002, 3,600−614. (b) Geisow, M. J.; Hart, P. D.; Young, M. R. J. Cell Biol.1981, 89, 645−652.
Journal of the American Chemical Society Article
dx.doi.org/10.1021/ja312092x | J. Am. Chem. Soc. XXXX, XXX, XXX−XXXK