Postischemic cardiac recovery in heme oxygenase-1 transgenic ischemic/reperfused mouse myocardium
Upload
khangminh22Category
view
5download
0
Virginia Commonwealth University Virginia Commonwealth University
VCU Scholars Compass VCU Scholars Compass
Theses and Dissertations Graduate School
2017
Heme Oxygenase 1 expression after traumatic brain injury and Heme Oxygenase 1 expression after traumatic brain injury and
effect of pharmacological manipulation on functional recovery. effect of pharmacological manipulation on functional recovery.
Nicholas H. Russell Virginia Commonwealth University
Follow this and additional works at: https://scholarscompass.vcu.edu/etd
Part of the Medical Neurobiology Commons
© The Author
Downloaded from Downloaded from https://scholarscompass.vcu.edu/etd/5525
This Dissertation is brought to you for free and open access by the Graduate School at VCU Scholars Compass. It has been accepted for inclusion in Theses and Dissertations by an authorized administrator of VCU Scholars Compass. For more information, please contact [email protected].

1
0 Preamble
0.1 Cover Page
Heme Oxygenase 1 expression after traumatic brain injury and effect of pharmacological
manipulation on functional recovery.
A dissertation submitted in partial fulfillment of the requirements for the degree of Doctor of
Philosophy at Virginia Commonwealth University.
By
Nicholas Hyatt Russell
M. ChE., Carnegie Mellon University, 2011
B.S. Mechanical Engineering and Biomedical Engineering, Carnegie Mellon University, 2010
Director: Linda L. Phillips, Ph.D.
Professor, Department of Anatomy and Neurobiology.
Virginia Commonwealth University
Richmond, Virginia
May 2017

2
0.2 Acknowledgements
To Anna, Carolina, and Eleanor.
I would like to thank my advisor, Dr. Linda L. Phillips for her continued support,
mentoring, and guiding through the course of my research and writing. She has been truly
invested in my success as a student and researcher and has provided me with a foundation in
lifelong research skills. I would also like to thank my Ph.D. advisory committee: Dr. Clive
Baumgarten, Dr. Andrew Ottens, Dr. John T. Povlishock, and Dr. Dong Sun who have each
provided me with invaluable resources and guidance through the course of my studies. I am also
forever grateful to Dr. Gordon L. Archer, and Sandra Sorrell for their support and guidance
through the many stages of the MD-PhD Program.
I am further ever in the debt of the members of the Phillips’ lab where I have made my
home these past years. Raiford T. Black and Lesley K. Harris provided invaluable technical
knowledge for my studies in Western Blot and Zymogram. Nancy N. Lee both trained me in the
craniectomy surgery and provided significant expertise in immunohistochemistry. Terry L. Smith
provided continued support for a variety of experiments repeated short notice. Dr. Thomas M.
Reeves provided a sounding board for statistical rigor and hypotheticals that assisted the
interpretation of multi-component assays.
I would also like to thank the students of Dr. Phillips; Dr. Julie L. Chan, Dr. Adele E.
Doperalski, and Dr. Melissa A. Powell. They each independently provided training, humor, and
camaraderie throughout and were always eager to share advice and knowledge. The style and
format of this document was influenced by the work of Dr. Phillips’ previous students: Dr. Julie
Chan, Dr. Melissa Powell, & Dr. Kelly Warren. I would also like to thank my cohort of MD-PhD
classmates and select Neuroscience classmates who also provided significant camaraderie and
technical support; Adam Blakeney, Marc Cantwell, Sheela Damles, Mackenzie Lind, Spencer
Harris, Mike Waters, and Pavel Lizhnyak.
Finally I would like to thank my family who have supported me throughout the process
from my earliest application through to the present day. This includes my Mom and Dad, my
brother Ben, and my sister Amanda. Most importantly I would like to thank and dedicate this
body of work to my wife Anna, and my two daughters Carolina and Eleanor; without their
sustained support this work would not have been possible.
This work was supported by NIH grants: NIH-NS56247, NS44372, NS57758, 5P30NS047463

3
0.3 Table of Contents
0 Preamble ................................................................................................................................. 1
0.1 Cover Page ....................................................................................................................... 1
0.2 Acknowledgements .......................................................................................................... 2
0.3 Table of Contents ............................................................................................................. 3
0.4 List of Figures ................................................................................................................ 13
0.5 List of Tables .................................................................................................................. 16
0.6 List of Abbreviations ...................................................................................................... 17
0.7 Abstract .......................................................................................................................... 23
1 Chapter 1: Introduction ......................................................................................................... 26
1.1 Impact, Epidemiology, and Classification ..................................................................... 26
1.1.1 Table 1-1: TBI ED Visits, Hospitalizations, and Deaths by Age ........................... 27
1.2 Traumatic Brain Injury Pathophysiology ....................................................................... 29
1.2.1 Table 1-2: Categories of Neuropathological Damage ............................................ 30
1.2.2 Figure 1-1: Neurovascular Unit .............................................................................. 33
1.3 Molecular Mechanisms of Injury ................................................................................... 36
1.4 NVU and Inflammatory Response ................................................................................. 42
1.5 Neuroplasticity and the Extracellular Environment after TBI ....................................... 47
1.5.1 Figure 1-2: Reactive Synaptogenesis ...................................................................... 49

4
1.5.2 Table 1-3: MMPs and Their Classifications ........................................................... 55
1.5.3 Figure 1-3: Domain Structure of the MMP Family ................................................ 58
1.6 Gelatinases, NVU and TBI............................................................................................. 60
1.7 Heme Oxygenase............................................................................................................ 62
1.7.1 Discovery, Structure, Biological Role .................................................................... 62
1.7.2 NVU Breach, HO-1 and Cytotoxicity ..................................................................... 65
1.7.3 HO Genetics, Gene Regulation, and Signal Transduction ...................................... 66
1.7.4 Figure 1-4: HO-1 Gene Regulation......................................................................... 67
1.7.5 HO Subcellular Localization................................................................................... 69
1.7.6 HO-1 Sources of Activation.................................................................................... 69
1.7.7 Figure 1-5: HO-1 Activation Pathways .................................................................. 71
1.8 Non Traumatic Role for HO-1 ....................................................................................... 73
1.9 HO-1 and Traumatic Brain Injury .................................................................................. 74
1.9.1 Figure 1-6: HO-1 Expression 1-7d Post-Injury ...................................................... 75
1.10 Novel Role in Traumatic Brain Injury Recovery ....................................................... 78
1.10.1 Pharmacological Inducers of HO-1 ........................................................................ 81
1.10.2 A Proposed Mechanism for HO-1 Induced Cytoprotection after TBI .................... 82
1.11 Choice of FPI as Experimental Model ....................................................................... 84
1.11.1 The Hippocampus as a TBI Model ......................................................................... 87
1.11.2 Figure 1-7: Mid-Dorsal Coronal Section of Rodent Brain ..................................... 90

5
1.11.3 The Neocortex as a TBI Model ............................................................................... 93
1.11.4 Figure 1-8: Simplified Cortical Excitatory Circuits................................................ 94
1.11.5 Hypotheses Tested and Dissertation Organization by Chapter............................... 98
2 Chapter 2 ............................................................................................................................. 100
2.1 Abstract Chapter 2 ........................................................................................................ 101
2.2 Introduction Chapter 2 ................................................................................................. 103
2.2.1 Figure 2-1: Pathway of Heme Metabolism ........................................................... 105
2.3 Methods Chapter 2 ....................................................................................................... 109
2.3.1 Experimental Animals .......................................................................................... 109
2.3.2 Surgical Preparation for Rat Central Fluid Percussion Injury .............................. 109
2.3.3 Central Fluid Percussion Injury ............................................................................ 110
2.3.4 Protein Extraction ................................................................................................. 111
2.3.5 Western Blotting ................................................................................................... 115
2.3.6 Tissue Fixation ...................................................................................................... 116
2.3.7 Immunohistochemistry ......................................................................................... 116
2.3.8 Statistics ................................................................................................................ 117
2.3.9 Table 2-1 Antibodies used in Western Blot Experiments ..................................... 118
2.3.10 Table 2-2: Antibodies used in Immunohistochemistry Experiments .................... 118
2.4 Chapter 2 Data .............................................................................................................. 119
2.4.1 Figure 2-3: Widefield Hemorrhage after cFPI 1-7d Post-Injury .......................... 121

6
2.4.2 Figure 2-4: Enlarged view of 3d Post-Injury Hemorrhage ................................... 123
2.4.3 Figure 2-5: HO-1 Response to Injury Over Time ................................................. 126
2.5 HO-1 Change Neocortex vs Hippocampus .................................................................. 128
2.5.1 Figure 2-6: Acute Changes in HO-1 vs GFAP or IBA1 in Hippocampus and
Neocortex ............................................................................................................................ 129
2.5.2 Figure 2-7: HO-1 Western Blot Time Course 1-15d ............................................ 133
2.5.3 Figure 2-8: HO-1 and Glial Reactivity in Reactive Neocortex 1-7d Post-Injury . 136
2.5.4 Figure 2-9: HO-1 and Glial Reactivity in Necrotic Neocortex 3-7d .................... 138
2.5.5 Figure 2-10: HO-1 and Reactive Glia in Hippocampus 1-7d Post-Injury ............ 141
2.5.6 Summary of Observations in HO-1 ...................................................................... 143
2.6 FTL Change Neocortex vs Hippocampus .................................................................... 144
2.6.1 Figure 2-11:FTL vs LCN2 in Neocortex 1-15d Post-Injury ................................. 145
2.6.2 Figure 2-12:FTL vs LCN2 in Hippocampus 1-15d Post-Injury ........................... 147
2.6.3 Figure 2-13: FTL vs LCN2 Hippocampal Fissure 1-7d Post-Injury..................... 149
2.6.4 Figure 2-14: FTL Western Blot 1-15d Post-Injury ............................................... 152
2.6.5 Summary of Observations in FTL ........................................................................ 154
2.7 LCN2 Change Neocortex vs Hippocampus ................................................................. 155
2.7.1 Figure 2-15: Acute HO-1 vs LCN2 Hippocampus Widefield .............................. 156
2.7.2 Figure 2-16: Acute HO-1 vs LCN2 Hippocampus and Neocortex Confocal ....... 158
2.7.3 Figure 2-17: HO-1 vs LCN2 Hippocampus 1-7d Post-Injury Widefield ............. 161

7
2.7.4 Figure 2-18: LCN2 Western Blot 1-7d Post-Injury .............................................. 164
2.7.5 Summary of Observations in LCN2 ..................................................................... 166
2.8 Gelatinase Response Neocortex vs Hippocampus ....................................................... 167
2.8.1 Figure 2-19: Zymography of MMP2 and MMP9 1-7d Post-Injury in Neocortex 169
2.8.2 Figure 2-20: Zymography of MMP2 and MMP9 1-7d Post-Injury in Hippocampus
172
2.8.3 Summary of Observations in Zymograms ............................................................ 174
2.9 Chapter 2 Discussion .................................................................................................... 175
2.9.1 Summary of Results in Chapter 2 ......................................................................... 175
2.9.2 Hemorrhage and HO-1 Response to mild-moderate FPI ...................................... 176
2.9.3 Correlated Post-injury changes in heme processing pathway molecules ............. 179
2.9.4 Neocortical HO-1 Response Relative to Hemorrhagic Damage at NVU ............. 184
2.9.5 Hippocampal HO-1 Response Relative to Absence of Hemorrhagic Damage..... 187
2.9.6 Impact of these results on post-injury management of hemorrhage ..................... 190
3 Chapter 3 ............................................................................................................................. 193
3.1 Abstract Chapter 3 ........................................................................................................ 194
3.2 Introduction Chapter 3 ................................................................................................. 196
3.3 Methods Chapter 3 ....................................................................................................... 199
3.3.1 Experimental Animals .......................................................................................... 199
3.3.2 Surgical Preparation for Rat Central Fluid Percussion Injury .............................. 199

8
3.3.3 Central Fluid Percussion Injury ............................................................................ 200
3.3.4 Protein Extraction ................................................................................................. 201
3.3.5 Figure 3-1: cFPI Device ........................................................................................ 203
3.3.6 Western Blotting ................................................................................................... 205
3.3.7 Tissue Fixation ...................................................................................................... 206
3.3.8 Immunohistochemistry ......................................................................................... 206
3.3.9 Drug Injection Protocol......................................................................................... 207
3.3.10 Figure 3-2: Rotarod Device .................................................................................. 209
3.3.11 Rotarod .................................................................................................................. 211
3.3.12 Morris Water Maze ............................................................................................... 211
3.3.13 Figure 3-3: Morris Water Maze Apparatus ........................................................... 213
3.3.14 Statistics ................................................................................................................ 215
3.3.15 Table 3-1: Antibodies Used in Western Blot Experiments ................................... 216
3.3.16 Table 3-2 Antibodies Used in Immunohistochemistry Experiments .................... 216
3.4 Chapter 3 Data .............................................................................................................. 217
3.5 Heme Pigment Disappearance in Drug Treated Animals ............................................ 218
3.5.1 Figure 3-4: Heme Procesing Cartoon: .................................................................. 220
3.5.2 Figure 3-5: Loss of Heme Pigment After Drug Treatment 1d Post-Injury ........... 223
3.6 Drug Treated HO-1 Shift responding to pigment changes, LCN2 unaffected ............ 225
3.6.1 HO-1 Results ......................................................................................................... 225

9
3.6.2 Figure 3-6: HO-1 Western Blot Results Drug Treated 1-15d Post-Injury ............ 227
3.6.3 Table 3-3: HO-1 Western Blot Result Table 1-15d Post-Injury ........................... 229
3.6.4 Figure 3-7: HO-1 vs LCN2 Neocortex Drug Treated 1d Post-Injury ................... 232
3.6.5 Figure 3-8: HO-1 vs LCN2 Hippocampus Drug Treated 1d Post-Injury ............. 234
3.6.6 Figure 3-9: HO-1 vs IBA1 Neocortex Drug Treated 3d Post-Injury .................... 237
3.6.7 Figure 3-10: HO-1 vs IBA1 Hippocampus Drug Treated 3d Post-Injury ........... 239
3.6.8 Figure 3-11: HO-1 vs GFAP Neocortex Drug Treated 7d Post-Injury ................. 241
3.6.9 Figure 3-12: HO-1 vs FTL Neocortex Drug Treated 15d Post-Injury .................. 243
3.7 Summary of Observations HO-1 .................................................................................. 245
3.8 LCN2 Results ............................................................................................................... 246
3.8.1 Figure 3-13: LCN2 Western Blot Results Drug Treated 1-7d Post-Injury ........... 248
3.8.2 Table 3-4: LCN2 Western Blot Result Table 1-7d ............................................... 250
3.9 Rotarod Behavioral Results .......................................................................................... 251
3.9.1 Figure 3-14: Rotarod Contact Time 1-7d Post-Injury ........................................... 253
3.9.2 Table 3-5: Rotarod ANOVA Model ..................................................................... 255
3.9.3 Figure 3-15: Rotarod Max RPM 1-7d Post-Injury ................................................ 256
3.9.4 Table 3-6: Rotarod Max RPM ANOVA Model ................................................... 258
3.9.5 Figure 3-16: Rotarod Contact Time Box Plots 1,3,5,7d Post-Injury .................... 260
3.9.6 Figure 3-17: Cumulative Rotarod Metrics ............................................................ 262
3.9.7 Summary of Observations Rotarod ....................................................................... 264

10
3.10 Zymogram changes and long term sequelae of tissue damage (FTL) ...................... 265
3.10.1 Zymogram Results ................................................................................................ 265
3.10.2 Figure 3-18: Zymography for MMP2, MMP9 in Drug Treated Neocortex ......... 268
3.10.3 Figure 3-19: Zymography for MMP2, MMP9 in Drug Treated Hippocampus .... 270
3.10.4 Summary of Observations Zymography ............................................................... 272
3.10.5 FTL Results ........................................................................................................... 273
3.10.6 Figure 3-20: FTL Western Blot Results Drug Treated 1-15d Post-Injury ............ 275
3.10.7 Table 3-7: FTL Western Blot ANOVA Model ..................................................... 277
3.11 Long Term Behavioral Shifts ................................................................................... 278
3.11.1 Morris Water Maze ............................................................................................... 278
3.12 General Metrics: Path Length, Platform Latency, Swim Speed ............................... 280
3.12.1 Figure 3-21: Morris Water Maze Path Length during Training 11-14d Post-Injury
280
3.12.2 Figure 3-22: Morris Water Maze Latency to Platform Post-Injury 11-14d .......... 282
3.12.3 Figure 3-23: Morris Water Maze Swim Speed 11-14d Post-Injury ...................... 284
3.12.4 Water Maze Heat Maps for Individual Groups..................................................... 286
3.12.5 Figure 3-24: Morris Water Maze Probe Trials for Individual Sham Animals ...... 288
3.12.6 Figure 3-25Morris Water Maze Probe Trials for Individual TBI Animals .......... 289
3.12.7 Figure 3-26Morris Water Maze Probe Trials for Individual TBI+HMN Animals 290
3.12.8 Figure 3-27Morris Water Maze Probe Trials for Individual TBI+SFN Animals . 291

11
3.12.9 MWM Summaries and Analysis ........................................................................... 292
3.12.10 Figure 3-28: Morris Water Maze Probe Trial Heat Maps by Condition ........... 294
3.12.11 Figure 3-29: Morris Water Maze Probe Trial Quadrant Score by Group ......... 296
3.12.12 Figure 3-30: Morris Water Maze Proximity Score by Group ........................... 298
3.12.13 Figure 3-31: Morris Water Maze Relative Proximity Score by Group ............. 300
3.12.14 Table 3-8: Morris Water Maze Training Quadrant Score ANOVA Model ...... 302
3.12.15 Table 3-9: Morris Water Maze Probe Trial Proximity Score ............................ 303
3.12.16 Table 3-10: Morris Water Maze All Days Relative Proximity Score ............... 304
3.13 Discussion Chapter 3 ................................................................................................ 306
3.13.1 Summary Chapter 3 .............................................................................................. 306
3.13.2 Discussion Chapter 3 ............................................................................................ 307
4 Chapter 4: Discussion ......................................................................................................... 325
4.1 Summary of Results ..................................................................................................... 325
4.2 Post-Injury Heme Processing ....................................................................................... 326
4.3 Hemorrhagic Processing in the Neocortex vs Hippocampus ....................................... 328
4.4 HO-1 Expression/Evidence of Bleeds .......................................................................... 329
4.5 Lipocalin 2 and Gelatinase Role in Heme Processing and Recovery .......................... 331
4.5.1 Lipocalin 2 is a known effector of Angiogenesis and Dendritic Spine Remodeling
331
4.5.2 Gelatinases as effective targets for both synaptic and vascular remodeling ......... 334

12
4.5.3 Mechanisms of Select Agents ............................................................................... 337
4.6 Behavioral outcomes after Treatment .......................................................................... 338
4.7 HO-1 as a Therapeutic Target ...................................................................................... 339
4.8 Differential Drug Treatment Effects ............................................................................ 343
4.9 Future Directions .......................................................................................................... 346
4.9.1 Pathway Mechanism Experiments ........................................................................ 346
4.9.2 Pathway Manipulation Experiments ..................................................................... 348
4.9.3 Behavioral Outcomes ............................................................................................ 348
4.10 Final Remarks ........................................................................................................... 350
5 List of References ............................................................................................................... 351
6 Appendices .......................................................................................................................... 394
6.1 Description of Injury Model ......................................................................................... 394
6.2 Commentary on Randomization, Blinding, Animal Sex Selection .............................. 394
6.3 Drug Blood Brain Barrier Transport ............................................................................ 395
6.4 Sham Drug Treated Animal Behavior .......................................................................... 396
6.4.1 Morris Water Maze ............................................................................................... 396
6.5 Appendix Data for Chapter 3 ....................................................................................... 398
6.6 Affymetric Rat Genome Microarray Screening ........................................................... 407
7 Vita ...................................................................................................................................... 408

13
0.4 List of Figures
1.2.2 Figure 1-1: Neurovascular Unit...................................................................................... 33
1.5.1 Figure 1-2: Reactive Synaptogenesis ............................................................................. 49
1.5.3 Figure 1-3: Domain Structure of the MMP Family........................................................ 58
1.7.4 Figure 1-4: HO-1 Gene Regulation ................................................................................ 67
1.7.7 Figure 1-5: HO-1 Activation Pathways .......................................................................... 71
1.9.1 Figure 1-6: HO-1 Expression 1-7d Post-Injury .............................................................. 75
1.11.2 Figure 1-7: Mid-Dorsal Coronal Section of Rodent Brain ............................................. 90
1.11.4 Figure 1-8: Simplified Cortical Excitatory Circuits ....................................................... 94
2.2.1 Figure 2-1: Pathway of Heme Metabolism .................................................................. 105
2.3.4.1 Figure 2-2: cFPI Device ........................................................................................... 113
2.4.1 Figure 2-3: Widefield Hemorrhage after cFPI 1-7d Post-Injury .................................. 121
2.4.2 Figure 2-4: Enlarged view of 3d Post-Injury Hemorrhage .......................................... 123
2.4.3 Figure 2-5: HO-1 Response to Injury Over Time ........................................................ 126
2.5.1 Figure 2-6: Acute Changes in HO-1 vs GFAP or IBA1 in Hippocampus and Neocortex
129
2.5.2 Figure 2-7: HO-1 Western Blot Time Course 1-15d.................................................... 133
2.5.3 Figure 2-8: HO-1 and Glial Reactivity in Reactive Neocortex 1-7d Post-Injury......... 136
2.5.4 Figure 2-9: HO-1 and Glial Reactivity in Necrotic Neocortex 3-7d ............................ 138
2.5.5 Figure 2-10: HO-1 and Reactive Glia in Hippocampus 1-7d Post-Injury.................... 141
2.6.1 Figure 2-11:FTL vs LCN2 in Neocortex 1-15d Post-Injury ........................................ 145
2.6.2 Figure 2-12:FTL vs LCN2 in Hippocampus 1-15d Post-Injury ................................... 147
2.6.3 Figure 2-13: FTL vs LCN2 Hippocampal Fissure 1-7d Post-Injury ............................ 149

14
2.6.4 Figure 2-14: FTL Western Blot 1-15d Post-Injury ...................................................... 152
2.7.1 Figure 2-15: Acute HO-1 vs LCN2 Hippocampus Widefield...................................... 156
2.7.2 Figure 2-16: Acute HO-1 vs LCN2 Hippocampus and Neocortex Confocal .............. 158
2.7.3 Figure 2-17: HO-1 vs LCN2 Hippocampus 1-7d Post-Injury Widefield ..................... 161
2.7.4 Figure 2-18: LCN2 Western Blot 1-7d Post-Injury ..................................................... 164
2.8.1 Figure 2-19: Zymography of MMP2 and MMP9 1-7d Post-Injury in Neocortex ....... 169
2.8.2 Figure 2-20: Zymography of MMP2 and MMP9 1-7d Post-Injury in Hippocampus .. 172
3.3.5 Figure 3-1: cFPI Device ............................................................................................... 203
3.3.10 Figure 3-2: Rotarod Device .......................................................................................... 209
3.3.13 Figure 3-3: Morris Water Maze Apparatus .................................................................. 213
3.5.1 Figure 3-4: Heme Procesing Cartoon: .......................................................................... 220
3.5.2 Figure 3-5: Loss of Heme Pigment After Drug Treatment 1d Post-Injury .................. 223
3.6.2 Figure 3-6: HO-1 Western Blot Results Drug Treated 1-15d Post-Injury ................... 227
3.6.4 Figure 3-7: HO-1 vs LCN2 Neocortex Drug Treated 1d Post-Injury .......................... 232
3.6.5 Figure 3-8: HO-1 vs LCN2 Hippocampus Drug Treated 1d Post-Injury ..................... 234
3.6.6 Figure 3-9: HO-1 vs IBA1 Neocortex Drug Treated 3d Post-Injury ........................... 237
3.6.7 Figure 3-10: HO-1 vs IBA1 Hippocampus Drug Treated 3d Post-Injury ................... 239
3.6.8 Figure 3-11: HO-1 vs GFAP Neocortex Drug Treated 7d Post-Injury ........................ 241
3.6.9 Figure 3-12: HO-1 vs FTL Neocortex Drug Treated 15d Post-Injury ......................... 243
3.8.1 Figure 3-13: LCN2 Western Blot Results Drug Treated 1-7d Post-Injury .................. 248
3.9.1 Figure 3-14: Rotarod Contact Time 1-7d Post-Injury .................................................. 253
3.9.3 Figure 3-15: Rotarod Max RPM 1-7d Post-Injury ....................................................... 256
3.9.5 Figure 3-16: Rotarod Contact Time Box Plots 1,3,5,7d Post-Injury............................ 260

15
3.9.6 Figure 3-17: Cumulative Rotarod Metrics ................................................................... 262
3.10.2 Figure 3-18: Zymography for MMP2, MMP9 in Drug Treated Neocortex ................. 268
3.10.3 Figure 3-19: Zymography for MMP2, MMP9 in Drug Treated Hippocampus ........... 270
3.10.6 Figure 3-20: FTL Western Blot Results Drug Treated 1-15d Post-Injury ................... 275
3.12.1 Figure 3-21: Morris Water Maze Path Length during Training 11-14d Post-Injury ... 280
3.12.2 Figure 3-22: Morris Water Maze Latency to Platform Post-Injury 11-14d ................. 282
3.12.3 Figure 3-23: Morris Water Maze Swim Speed 11-14d Post-Injury ............................. 284
3.12.5 Figure 3-24: Morris Water Maze Probe Trials for Individual Sham Animals ............. 288
3.12.6 Figure 3-25Morris Water Maze Probe Trials for Individual TBI Animals .................. 289
3.12.7 Figure 3-26Morris Water Maze Probe Trials for Individual TBI+HMN Animals ...... 290
3.12.8 Figure 3-27Morris Water Maze Probe Trials for Individual TBI+SFN Animals ........ 291
3.12.10 Figure 3-28: Morris Water Maze Probe Trial Heat Maps by Condition .................. 294
3.12.11 Figure 3-29: Morris Water Maze Probe Trial Quadrant Score by Group ................ 296
3.12.12 Figure 3-30: Morris Water Maze Proximity Score by Group .................................. 298
3.12.13 Figure 3-31: Morris Water Maze Relative Proximity Score by Group .................... 300

16
0.5 List of Tables
1.1.1 Table 1-1: TBI ED Visits, Hospitalizations, and Deaths by Age ................................... 27
1.2.1 Table 1-2: Categories of Neuropathological Damage .................................................... 30
1.5.2 Table 1-3: MMPs and Their Classifications .................................................................. 55
2.3.9 Table 2-1 Antibodies used in Western Blot Experiments ............................................ 118
2.3.10 Table 2-2: Antibodies used in Immunohistochemistry Experiments ........................... 118
3.3.15 Table 3-1: Antibodies Used in Western Blot Experiments .......................................... 216
3.3.16 Table 3-2 Antibodies Used in Immunohistochemistry Experiments ........................... 216
3.6.3 Table 3-3: HO-1 Western Blot Result Table 1-15d Post-Injury .................................. 229
3.8.2 Table 3-4: LCN2 Western Blot Result Table 1-7d ...................................................... 250
3.9.2 Table 3-5: Rotarod ANOVA Model ............................................................................ 255
3.9.4 Table 3-6: Rotarod Max RPM ANOVA Model ........................................................... 258
3.10.7 Table 3-7: FTL Western Blot ANOVA Model ............................................................ 277
3.12.14 Table 3-8: Morris Water Maze Training Quadrant Score ANOVA Model ............. 302
3.12.15 Table 3-9: Morris Water Maze Probe Trial Proximity Score ................................... 303
3.12.16 Table 3-10: Morris Water Maze All Days Relative Proximity Score ...................... 304

17
0.6 List of Abbreviations
ACH……………………………………………………………………...………...Acetylcholine
ADAM-10………………… A Disintegrin and metalloproteinase domain-containing protein-10
AD………………………………………………………………………….... Alzheimer’s Disease
AMPA……………………………...….. α-amino-3-hydroxy-5-methyl-4-isoxazolepropionic acid
ANOVA……………………………………………………………………...Analysis of Variance
APP…………………………………………………………………….Amyloid Precursor Protein
ARE………………………………………………………………..Antioxidant Response Element
BBB…………………...…………………………………………………….... Blood Brain Barrier
BDNF………………………………………………………….Brain Derived Neurotrophic Factor
CA……………………………………………………………………………… Cornu ammonis
CAM……………………………………………………………………..Cell Adhesion Molecules
CCI…………………………………………………………………….. Controlled cortical impact
CNS……………………………………………………………………... Central Nervous System
CO……………………………………………………………………………….Carbon Monoxide
CT…………………………………………………………………………Computed Tomography
CTE…………………………………………………………… Chronic traumatic encephalopathy
DAI…………………………………………………………………………. Diffuse axonal injury

18
DG…………………………………………………………………………………. Dentate Gyrus
DMSO……………………………………………………………………….... Dimethyl sulfoxide
DTI……………………………………………………………………Diffusion Tensor Imaging
EAA……………………………………………………………………….Excitatory Amino Acid
ECM…………………………………………………………………………. Extracellular matrix
ED………………………………………………………………………....Emergency Department
ER………………………………………………………………………....Endoplasmic Reticulum
Fe……………………………………………………………………………………………….Iron
fMRI……………………………………………………Functional magnetic resonance imaging
FTL………………………………………………………………………….Ferritin Light Chain
FPI……………………………………………………………………….Fluid Percussion Injury
GCL……………………………………………………………………………. Granule cell layer
GCS………………………………………………………………………….. Glasgow coma scale
GFAP……………………………………………………………….. Glial fibrillary acidic protein
HI………………………………………………………………….….. Hypoxic-ischemic injury
HIV…………………………………………………………...….Human Immunodeficiency Virus
HMN………………………………………………………………………………………...Hemin

19
HO……………………………………………………………………………..Heme Oxygenase
HO-1…………………………………………………...………………………Heme Oxygenase 1
HO-2……………………………………………………..…………………….Heme Oxygenase 2
HOAc………………………………………………………………………..…..Glacial acetic acid
HPF……………………………………………………………………….Hippocampal Formation
IACUC…………………………………………..Institutional Animal Care and Use Committee
IBA1…………………………………………….….. Ionized calcium binding adaptor molecule 1
IHC………………………………………………………………………... Immunohistochemistry
ICP…………………………………………………………………………... Intracranial pressure
IL………………………………………………………………………………………..Interleukin
IFN-γ…………………………………………………………………………………...Interferon-γ
IP………………………………………………………………………………… Intraperitoneal
IQR……………………………………………………………………………..Interquartile Range
KDa…………………………………………………………………………………..… Kilodalton
KO……………………………………………………………….…………………..…..Knock out
LCN2………………………………………………………….………………………..Lipocalin 2
LOC…………………………………………..……………………………. Loss of consciousness

20
LTP…………………………………………………………………….…..Long-term potentiation
LTD……………………………………………………………………….Long Term Depression
MANOVA…………………………………………………...…. Multivariate analysis of variance
MCAO……………………………………………………….…. Middle cerebral artery occlusion
MeOH……………………………………………………………………………...……. Methanol
MI……………………………………………………………………….….. Myocardial infarction
ML……………………………………………………..…………………………. Molecular layer
MMP………………………………………………………………….… Matrix metalloproteinase
MS…………………………………………………………………………….Multiple Sclerosis
mTBI…………………………………………………………………. Mild traumatic brain injury
mTBST…………………………………………………..….Tris Buffered Saline + Tween + milk
MWM……………………………………………………………………….… Morris water maze
MRI……………………………………………………………….Magnetic Resonance Imaging
MT-MMP…………………………………………...Membrane Type-Matrix Metalloproteinase
NAC………………………………………………………………………………N-acetylcysteine
NCC……………………………………………………………………………Neural Crest Cell
NGAL………………………….…… Neutrophil gelatinase-associated lipocalin (aka Lipocalin
2)

21
NO…………………………………………………………………………………..…Nitric Oxide
NMDA…………………………………………………………………..…..N-methyl-D-aspartate
NSC……………………………………………………………………………....Neural Stem Cell
OB…………………………………………………………………………………..Olfactory Bulb
PBS…………………………………………………………………….. Phosphate buffered saline
PD………………………………………………………………………….. Parkinson’s Disease
PET………………………………………………………………..Positron Emission Tomography
PNS……………………………………………………………………. Peripheral nervous system
PTA…………………………………………………………………….Post Traumatic Amnesia
PTSD…………………………………………………………..….Post Traumatic Stress Disorder
RES………………………………………………………………….Reticuloendothelial System
ROS………………………………………………………………….… Reactive oxygen species
ROD…………………………………………………………………….... Relative optical density
SAH………………………………………………………………..... Subarachnoid hemorrhage
SCI……………………………………………………………………..…….. Spinal cord injury
SEM………………………………………………………...……..….. Standard error of the mean
SFN…………………………………………………………………………………...Sulforaphane

22
SWI…………………………………………………………... Susceptibility Weighted Imaging
SWIM…………………………………………...Susceptibility Weighted Imaging and Mapping
TAI………………………………………………….………………….. Traumatic axonal injury
TBI…………………………………………………………………...….. Traumatic brain injury
TBI+HMN………………………………………..…Traumatic Brain Injury treated with Hemin
TBI+SFN………………………………….....Traumatic Brain Injury treated with Sulforaphane
TBS…………………………………………………………………………....Tris Buffered Saline
TBST…………………………………………………………….. Tris Buffered Saline + Tween
TGF-β……………………………………………………………..Transforming growth factor β
TIMP……………………………………………………...Tissue Inhibitor of Metalloproteinase
TJ……………………………………………………………………………….....Tight Junction
UEC………………………………………………………...Unilateral Entorhinal Cortex Lesion
VCU……………………………………………………..…Virginia Commonwealth University
VEGF………………………………………………………Vascular Endothelial Growth Factor
WB…………………………………………………………………………………… Western blot
WT……………………………………………………………………………………….Wild type
23
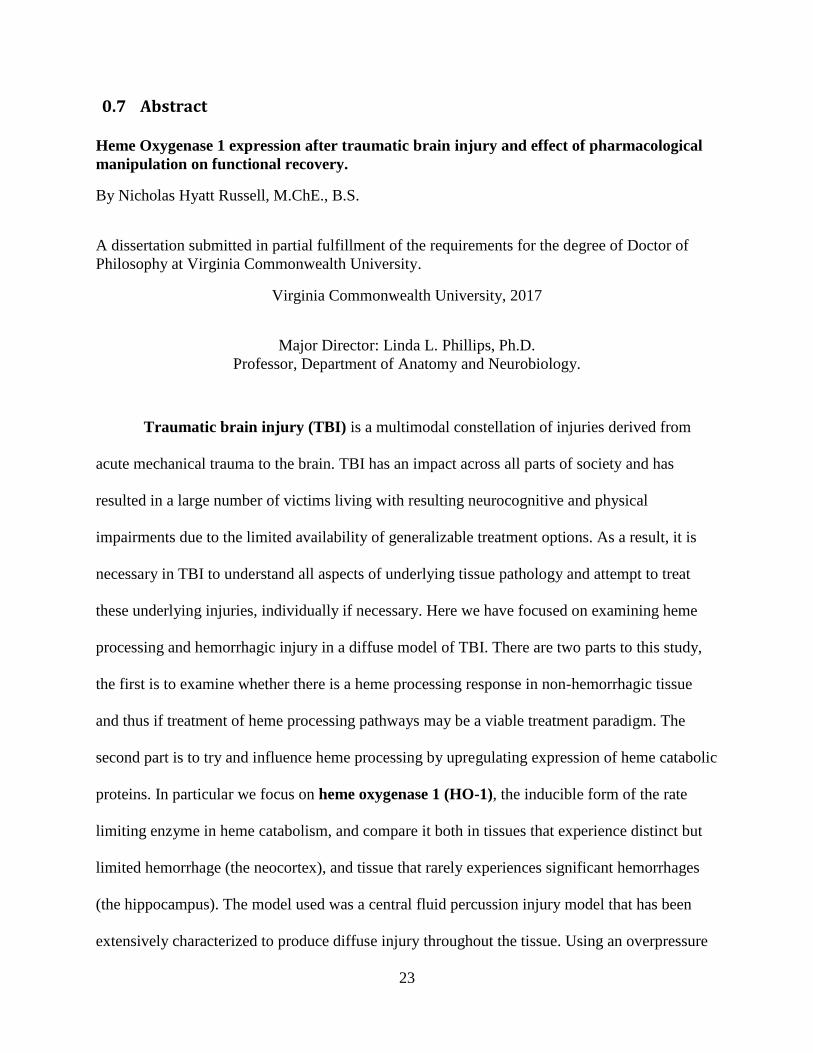
0.7 Abstract
Heme Oxygenase 1 expression after traumatic brain injury and effect of pharmacological
manipulation on functional recovery.
By Nicholas Hyatt Russell, M.ChE., B.S.
A dissertation submitted in partial fulfillment of the requirements for the degree of Doctor of
Philosophy at Virginia Commonwealth University.
Virginia Commonwealth University, 2017
Major Director: Linda L. Phillips, Ph.D.
Professor, Department of Anatomy and Neurobiology.
Traumatic brain injury (TBI) is a multimodal constellation of injuries derived from
acute mechanical trauma to the brain. TBI has an impact across all parts of society and has
resulted in a large number of victims living with resulting neurocognitive and physical
impairments due to the limited availability of generalizable treatment options. As a result, it is
necessary in TBI to understand all aspects of underlying tissue pathology and attempt to treat
these underlying injuries, individually if necessary. Here we have focused on examining heme
processing and hemorrhagic injury in a diffuse model of TBI. There are two parts to this study,
the first is to examine whether there is a heme processing response in non-hemorrhagic tissue
and thus if treatment of heme processing pathways may be a viable treatment paradigm. The
second part is to try and influence heme processing by upregulating expression of heme catabolic
proteins. In particular we focus on heme oxygenase 1 (HO-1), the inducible form of the rate
limiting enzyme in heme catabolism, and compare it both in tissues that experience distinct but
limited hemorrhage (the neocortex), and tissue that rarely experiences significant hemorrhages
(the hippocampus). The model used was a central fluid percussion injury model that has been
extensively characterized to produce diffuse injury throughout the tissue. Using an overpressure

24
of 2.0±0.1 ATM we produce a mild-moderate injury which characteristically shows limited
hemorrhage in white matter tracks laying above the lateral ventricles and which extend into the
layer VI and V neocortex overlaying. We tracked the temporal and spatial profile of HO-1
expression via western blot (WB) and immunohistochemistry (IHC), identifying that HO-1
peaks at 3d post-injury in both tissues examined and generally localizes within the reactive glia
with distinct profiles depending on distance from the necrotic bleed. In the hippocampus
expression was limited almost entirely within glial fibrillary acidic protein + (GFAP+)
astroglia while in the neocortex the immediate penumbra to the bleed results in extensive ionized
calcium binding adaptor molecule 1+ (IBA1+) microglial co-staining, with an outer penumbra
consisting of GFAP+ astroglia. We further characterized the temporal and spatial expression of
a small number of other heme processing related proteins. We examined Lipocalin 2 (LCN2), a
small iron sequestering siderocalin, which can be upregulated by the same promoter as HO-1 and
which is involved both in the acute iron sequestering response and in the extracellular matrix
response since it is known to persistently activate matrix metalloproteinases. We examined
Ferritin (FTL) as a marker of iron deposition (evidence of heme degradation) and long term
tissue damage. Further, we observed the timeline of heme pigment processing and the rise of iron
dense aggregates observed via Perls’ stain. Characterizing the expression of these additional
metrics demonstrated that the hippocampus exhibits a robust iron processing response which at
times shows protein elevation relative to Sham that is higher than in the neocortex. At the same
time there is a notable absence of heme pigment or iron aggregate formation. After
characterizing this response we next moved to influence heme processing via the post-injury
injection of either Hemin (HMN) or Sulforaphane (SFN), two known activators of the HO-1
transcriptional activator Nrf2. We observed that both drugs caused similar shifts in the heme

25
processing response. By 1d post-injury the majority of heme pigment typically observed after
injury was absent and the peak expression of HO-1 was shifted to 1d rather than 3d post-injury.
Behavioral testing via the rotarod 1-7d post-injury showed a robust improvement in the
Sulforaphane treated animals which approached Sham performance ability by 2d. In the later
term behavioral testing via the Morris water maze (MWM) 11-15d post-injury robust
improvement was demonstrated by the Hemin treated animals which showed focused search
patterns during their probe trial which were similar to the Sham performance. The Sulforaphane
treated animals did not appear to show improvement in the Morris water maze testing paradigm
however closer examination revealed that there is a marked shift in search pattern utilization that
occurs in the Sulforaphane group which demonstrates that even a single injection given in a
critical post-injury window can have profound effects on behavioral performance even 15d later.
Collectively the studies presented in these two chapters provide evidence that there is an
underlying hemorrhagic or hemorrhagic-like injury response which is generalizable to multiple
tissues even in circumstances of diffuse brain injury. Further, post-injury treatment targeted the
hemorrhagic response can produce robust behavioral effects if provided in a critical window
suggesting that heme pathology is a contributory factor to continued impairment following TBI.

26
1 Chapter 1: Introduction
1.1 Impact, Epidemiology, and Classification
Traumatic Brain Injury (TBI) is a constellation of largely mechanically induced injuries
that result in temporary or permanent neurological impairment including long term cognitive and
motor deficits. Though some injuries are relatively minor and resolve spontaneously many
require patients to undergo extensive psychological and physical therapy (Hyder et al., 2007;
Asikainen et al., 1998; Faul et al., 2010; Weightman et al., 2010). While TBI is a serious global
health issue with 2.2 million new incidents in the US (Faul et al., 2010) and 10 million
worldwide (Hyder et al., 2007), it is the potential long term sequelae that lead to nearly 5.3
million Americans living with the effects of TBI and contribute to TBI being associated with
52,000 deaths yearly (Table 1; Rutland-Brown et al., 2006). The cost of rehabilitation and loss
of productivity has resulted in a financial burden that currently exceeds $60 billion annually
(Langlois et al., 2006; Finkelstein et al., 2006; Rutland-Brown et al., 2006) with some estimates
as high as $221 billion annually when factoring in loss of quality of life (Coronado et al., 2011;
Coronado et al., 2014). It is important to note that these numbers are derived from clinical
contacts and do not include the large number of injuries that are more mild and do not result in
emergency department (ED) treatment (Goldstein, 1990; Coburn, 1992).
Due to its multimodal nature TBI affects a wide swath of American society impacting
every age group though the most likely source of injury changes with age and societal behavior.
The Centers for Disease Control and Prevention categorizes the most common causes of TBI as;
Motor Vehicle Traffic, Falls, Assault, Struck by/Against, Self-Inflicted, and Other. Young
children 0-4 most commonly experience TBI due to assault while older children through young
adults (5-14 and 15-24) primarily experience injury from motor vehicle traffic accidents. Older

27
adults (25-44 and 45-64) in contrast experience more self inflicted injuries while in patients over
65 years old the primary cause of injury is due to falls. When added together, TBI incidents
outnumber the combined cases of multiple sclerosis, breast cancer, and spinal cord injury (SCI)
and demonstrate wider distribution throughout society (Weber and Maas, 2007).
1.1.1 Table 1-1: TBI ED Visits, Hospitalizations, and Deaths by Age
TBI has historically been classified as mild, moderate, or severe based on various clinical guides
that tend to blur boundaries between categories making comparisons across studies somewhat
difficult due to variable clinical assessments (Malec et al., 2007). Additionally, the widespread
use of semi-appropriate scales, including the Glasgow Coma Scale (GCS), has resulted in
Table 1: Numbers and rates of traumatic brain injury-related emergency department visits, hospitalization,
and deaths, by age group, in United States, Reproduced with permission from Rutland-Brown 2006.

28
somewhat lumped categorization of larger symptom constellations [editor note: the GCS was
initially designed as a pre and post-operative scale of neurological function to determine if a
neurological surgical intervention was helpful, it was not originally intended as a clinical
assessment of injury or recovery]. Alternative or additional measurements, including post-
traumatic amnesia (PTA) and loss of consciousness (LOC), can be assessed to determine
relative severity of TBI. More data driven metrics also exist including the usage of computer
tomography (CT), magnetic resonance imaging (MRI), functional MRI (fMRI), positron
emission tomography (PET), diffusion tensor imaging (DTI), and susceptibility weighted
imaging (SWI) all of which can be used to more discretely classify injury.
In addition to the 2.2 million ED visits that are recorded each year there is also a
significantly larger population that is affected by mild TBI, including the majority of what would
be considered ‘concussions’ in a sports setting where the individual may seek out a degree of
medical help (e.g. from a sports trainer) but does not visit an ED and thus is not recorded. This
leads to a potentially unknown number of patients who may be experiencing progressive TBI
consequences (Goldstein, 1990; Coburn, 1992) which may include sensory deficits, movement
disorders, cognition changes, and memory loss. Severe TBI is obvious and frequently fatal and
even moderate TBI demonstrates clear neurological deficits that are fairly obvious in both the
immediate and long term to the average person. Mild TBI, in contrast, is more insidious with its
relatively minor initial presentation that may progress to or at least is associated with an array of
chronic delayed functional deficits and early onset typically age related neurological disorders
including forms of Parkinsonianism and Alzheimers disease. More recent epidemiological
studies have examined the effects of mild TBI due to sports or military related injuries (Pellman
et al., 2006; Phillips and Woessner, 2015) and have implicated TBI in the development of post-

29
traumatic stress disorder (Benedictus et al., 2010; Greenwald et al., 2012), chronic traumatic
encephalopathy (CTE) (Goldstein and McKee, 2012; Saulle and Greenwald, 2012; McKee et
al., 2009), epilepsy (Annegers et al., 1998; Ferguson et al., 2009; Frey, 2003), Parkinson’s
(Bower et al., 2003; Goldman et al., 2006), and Alzheimer’s (Mortimer et al., 1985; Fleminger,
2003; Sivanandam and Thakur, 2012). In a real and significant sense it seems that TBI induces
new neurological dysfunction, contributes to early age related dysfunction, or causes an
overlaying condition resulting in early diagnoses of other neurological diseases. This is
particularly concerning given a number of studies that have shown that repeated sub-concussive
injuries can result in similar outcomes to discrete injuries.
1.2 Traumatic Brain Injury Pathophysiology
TBI consists of largely mechanically induced injuries that include a wide range of events
varying from skull fractures and penetrating ballistic injury to whiplash and mid frequency
vibration. The amplitude, timing, direction, and energy of the applied force relates directly to
how and where mechanical stress is applied to the brain and where structural tissue damage
results. As a result of the diverse sources of TBI, a number of broad categories have been
developed to help divide the pathophysiology into more interpretable segments. Broad categories
include whether the injury is focal or diffuse and whether the molecular processes are primary or
secondary (Lovell et al., 1994; Granacher, 2008; Povlishock and Katz, 2005). Focal injury tends
to be local to the propagating pressure wave that resulted after the injury and tends to be
associated with gross tissue disruption and damage. Diffuse injury in contrast is characterized by
a generalized stretch injury that causes wide disruption of tissue cytoskeletal elements and causes
broad tissue level dysfunction by triggering necrotic and apoptotic cascades (Povlishock and
Katz, 2005). An example is diffuse axonal injury (DAI) where shear induced damage to the

30
axolemma leads to inappropriate ion dysregulation and protease activity which impairs axonal
transport and function (Povlishock and Katz, 2005). Primary injury is typified by the mechanical
damage occurring at the moment of impact while the secondary insults are the downstream
processes that result as the tissue attempts to recover (Werner and Engelhard, 2007).
1.2.1 Table 1-2: Categories of Neuropathological Damage
Table 2: Categories of neuropathological damage. Examples of different injury
pathologies that can be experienced after Traumatic Brain Injury. Reproduced with permission
from Povlishock & Katz, 2005.
An example of a classic generalizable focal injury is the whiplash related coup-
contrecoup injury that typically occurs in a motor vehicle or sports setting. In this injury a rapid
acceleration/deceleration event occurs (with or without striking an object), which generates focal
brain injuries on opposite sides of the brain in the plane of motion as the brain bounces and
rebounds off the interior of the cranium (Silver et al., 2011; Andriessen et al., 2010). Classically
this occurs in a forward motion injury and results in injury to the frontal lobe and the occipital
lobe on opposite sides of the brain. The focal injuries mentioned can include laceration,
contusion, or hemorrhage of the tissue; the hemorrhage that develops demonstrates significant
crossover with ischmia/reperfusion and hemorrhagic injury in stroke (Lin et al., 1993; del Zoppo
and Hallenbeck, 2000; Chodobski et al., 2011; Mark and Davis, 2002).

31
In contrast, a classic diffuse injury occurs due to rapid shaking or rotation that induces
large shear/stretch tensors in the tissue (www.biausa.org). Stretch injury results in diffuse axonal
injury (DAI) (Strich, 1961; Gennarelli et al., 1982; Adams et al., 1991; Adams et al., 1989;
Adams et al., 1982; Povlishock and Katz, 2005), which is a neuronal pathology characterized by
axonal bulb swellings due to disrupted microtubules and impaired intracellular transport
(Povlishock et al., 1983; Povlishock and Kontos, 1985). This process contemporaneously has
been linked to focal alterations of the axolemma (Pettus et al., 1994; Maxwell et al., 1997). DAI
is frequently associated with impaired neurological function in instances which lack focal injury;
impaired axonal transport results can result in neuronal death, axonal degeneration, or simply
deafferentation of the specific circuit leading to neurologic dysfunction. The process is mediated
by the uncontrolled influx of extracellular ions (e.g. Ca2+
) which activate cysteine proteases,
calpains, and caspases that in turn disrupt the cytoskeleton inhibiting axonal transport and thus
axonal function (Buki et al., 2000; Buki et al., 1999).
Current therapies are largely focused on molecular pathobiology underlying the
prolonged impairments seen in TBI with anti-inflammatory agents and a heavy dose of
nootropics used to mask underlying deficits (Povlishock and Katz, 2005; Silver, 2012; Silver and
Miller, 2004). A significant issue with attempting to treat TBI is the reality of pharmacopeia,
which can efficiently mask underlying deficits; e.g., treating neurologic dysfunction with
stimulants such as amphetamine improves patient outcome which doesn’t necessarily correlate
with recovery. There is a well-documented cascade of events that occurs after TBI including
initial cell membrane permeability and the release of excitatory amino acids (e.g. glutamate,
aspartate). This can cause neuroexcitation injury where extreme levels of neuronal firing lead to
inappropriate and dysfunctional output. An important consequence of this cell damage and

32
excessive neuroexcitation is the widespread disruption of the blood brain barrier (BBB) and
neurovascular unit (NVU), which impairs trophic support and dynamic response to energy
demand as well as the ability to expel cytotoxic materials efficiently. The result is an increased
local vulnerability to neurotoxicity and disruptions in the typical distribution of injury-induced
cytokines/chemokines (Farkas, 2006; Schmidt and Grady, 1993; Habgood et al., 2007).

33
1.2.2 Figure 1-1: Neurovascular Unit

34
Figure 1-1: Neurovascular unit (NVU) reorganization in response to pathogenic stimulus. Highly
structured multicellular anatomy of the NVU (shown in the upper right inset) undergoes
profound changes in response to pathogenic stimulus, such as tissue hypoxia, schematically
shown in the lower inset. The subsequent ‘sequence of events' leading to neuronal injury
includes the expression and release of pro-angiogenic factors, such as vascular endothelial
growth factor (VEGF), by astrocytes and surrounding cells and upregulation of their receptors
in brain endothelial cells, stimulating endothelial proliferation and migration with consequent
disruption of tight junctions and increased blood–brain barrier (BBB) permeability. Release of
metaloproteases by migrating endothelial cells and pericytes leads to proteolytic disruption of
the basement membrane and additional release of pro-angiogenic breakdown products of the
extracellular matrix. Accompanying influx of serum proteins and water through disrupted BBB
results in vasogenic edema, which further disconnects cellular interactions within the NVU;
toxic serum components cause astrocyte activation. Upregulation and secretion of inflammatory
mediators from both activated astrocytes and endothelial cells stimulates the expression of
adhesion molecules in endothelial cells and the recruitment of inflammatory cells into the brain.
Reactive oxygen species and proteases released from leukocytes and activated perivascular cells
cause oxidative injury to neurons. Secondary injury to neurons, if prolonged or repeated, could
cause dissociation of neuronal projections from the NVU, uncoupling and subsequent retrograde
degeneration. Some of the described events and their manifestation occur at specific sites of the
brain microcirculatory tree: uncoupling at the level of arterioles, BBB disruption at the level of
capillaries, and leukocyte recruitment at the level of postcapillary venules. Reproduced with
permission from Stanimirovic & Friedman, 2012.

35
In a functional sense, the NVU can be considered to be the critical component of the
vascular/brain interface that supports the BBB and its selective trophic support to the brain
parenchyma. The NVU (Figure 1-1) typically consists of endothelial cells linked by numerous
tight junction proteins which are non-fenestrated, wrapped with cytoplasm of associated
pericytes and covered by an extracellular matrix (ECM) basal lamina (comprised primarily of
type IV collagen). These in turn are wrapped by astrocytic end feet which are in direct contact
with adjacent neurons with the whole system monitored by immune cells on both sides of the
barrier. This setup provides a consistent steady state environment for efficient neuronal function
and is resistant to rapid transient variance in peripheral conditions. The corollary, however, is
that disruption of any one component can lead to neuronal dysfunction. This can range from
gross mechanical tissue disruption, where the NVU is physically torn apart, to instances of basal
lamina breakdown due to excess gelatinase activity or to the effects of inflammatory cytokines.
It is known that TBI can induce each of these responses. Of course, TBI vascular injury is
associated with the disruption of the NVU, but the analysis of post-injury vascular damage is
more typically made with reference to large global effects on brain circulation rather than
individual effects on the cells positioned at the brain/parenchyma interface. Chief among the
negative components of such global vascular injury (ignoring gross tissue disruption) is the loss
of vascular autoregulation which leads to inappropriate vasospasm and inefficient trophic
support. Numerous authors have demonstrated this impaired microcirculation in a variety of
traumatic central nervous system (CNS) models (Lin et al., 2001; Kenney et al., 2016; Bartnik-
Olson et al., 2014; Baranova et al., 2008; Park et al., 2009b; Gao et al., 2010; Wei et al., 2009;
Cherian et al., 2011). Central Fluid Percussion Injury (cFPI) models in particular have shown
microvascular losses through 2 weeks after injury (Schwarzmaier et al., 2010).

36
1.3 Molecular Mechanisms of Injury
Focal brain injury sets in motion a series of events following the initial insult, a pattern
that has been reasonably well studied both in vivo and in vitro. There is tissue wide damage
which affects not only neurons but all of the glial and vascular components supporting those
neurons, as well as the ground substance which enmeshes the tissue. Frank membrane disruption
occurs in a small number of cells, lysing and releasing cytosolic contents into the surrounding
tissue, which exposes cell organelles to the extracellular environment. Many of the molecules
released induce modulators of cell signaling including chemokines and cytokines which are also
intimately involved in the stabilization of the NVU. Their release leads to extensive disruption of
cerebral blood flow and oncotic dysregulation, leading to both impaired O2/CO2 exchange and
increased intracranial pressure (ICP).
Following TBI, primary mechanical disruption of the neuronal membrane results in
uncontrolled pre-synaptic depolarization causing excessive release of excitatory amino acids
(EAA, e.g. glutamate, aspartate) leading to neuroexcitatory impairments (Hayes et al., 1992;
Yoshino et al., 1992; Palmer et al., 1993). The excitation hypothesis was first proposed by
Rothman and Olney based on the observed neurotoxic potential of glutamate acting on N-
methyl-D-aspartate (NMDA) receptors (Rothman and Olney, 1987; Bullock et al., 1998). This
process occurs in conjunction with membrane ionic dysregulation, another pathophysiologic
condition which can occur for a variety of reasons, but directly leads to impaired cellular
function and neuronal signaling. It may follow neuronal cell membrane disruption, but can also
result from glial cell insult where supporting astrocytes ineffectively recycle neurotransmitters or
inappropriately release calcium into the extracellular space. Effects of this pathology are
manifest as damaged neuronal membranes and altered extracellular ionic gradients, often

37
characterized by rapid increases in extracellular EAA’s (Faden et al., 1989; Hayes et al., 1992).
The classic hypothesis of increased EAA receptor activation centers around a two phase process
driven by ionic gradient dysregulation. In the first phase Na+ and Cl
- gradients aberrantly fall
leading to osmotic swelling and occasional cell death. The second phase is more cell directed and
involves Ca2+
dependent cell degeneration driven by induced downstream neurotoxic cascades
triggering cell death responses (Arundine and Tymianski 2004). Excess transmitter release leads
to excessive activation of excitatory receptors (e.g. NMDA) causing dramatic post-synaptic
intracellular shifts in Na+, K
+, Ca
2+ ions (McIntosh, 1994; Katayama et al., 1990; Hayes et al.,
1992; Wolf et al., 2001). This excessive neuroexcitation has been identified as a significant
contributor to post-injury functional impairments. Interestingly, it has been reported that
mechanical cell deformation in isolation is sufficient to induce altered glutamate receptor
function (Zhang et al., 1996). Early studies with experimental animal models of TBI have
demonstrated excessive EAA release in the hippocampus, with later reports showing that
selective receptor blockade can mitigate long term cognitive deficits (Gorman et al., 1989;
Katayama et al., 1989; Hayes et al., 1986; Lyeth et al., 1988). Notably, the excessive release of
transmitters has been identified as being exacerbated by the breakdown in the BBB that occurs
after injury.
Towards identifying this as a root cause of continued impairment, both dopamine and
NMDA antagonists have been used in animal studies to help elucidate the mechanism of
impairment (Zhu et al., 2000; Massucci et al., 2004; Wagner et al., 2005; Faden et al., 1989;
Hayes et al., 1992; Hamm et al., 1993; Phillips et al., 1998; Bales et al., 2009). NMDA
antagonist therapies in animal models have demonstrated therapeutic efficacy but, as is
unfortunately typical in TBI translational therapies to date, clinical trials have had disappointing

38
results (Muir, 2006); to some extent this may be due to greater complexity of human injury or
simply the less controlled nature of injury relative to animal models. Dopamine agonists have
also been tested therapeutically, with promising experimental results in animal models (Dixon et
al., 1999; Kline et al., 2004; Wagner et al., 2005; Wagner et al., 2007), as have serotoninergic
receptor agonists (Cheng et al., 2008; Olsen et al., 2012) and stimulation of GABA receptors
(O'Dell et al., 2000), but each continue to show disappointing clinical results (Levin and Diaz-
Arrastia, 2015; Warden et al., 2006). Thus, pharmacologic targeting of specific mechanisms has
the potential to improve outcome following human TBI, but it seems abundantly obvious from
the current history of clinical failures that treating TBI as a mono-factorial condition, with a
single primary driving pathology, is unlikely to prove fruitful.
As discussed above, one hallmark of diffuse TBI models is the generation of DAI, where
a significant portion of the axon pathology is restricted to the long axons of white matter tracts.
It has been demonstrated that, even in the absence of loss of consciousness (LOC), mild TBI
(mTBI) can induce diffuse axonal injury (Browne et al., 2011), result in long term cognitive
impairment (Molgaard et al., 1990; Susan L. Hillier, 1997; Asikainen et al., 1998), and increase
risk of developing neurodegenerative conditions (Graves et al., 1990; Fleminger, 2003). Due to
the long term ramifications of tract disruption, DAI has been a much targeted research focus to
identify imaging or circulating biomarkers to aid in TBI diagnosis and ultimately treatment
(Smith et al., 2013). DAI has been described as being a result of acceleration-deceleration
causing shearing of tissue layers with long anisotropic axons being particularly vulnerable
compared to the more isotropic dendritic structures (Gennarelli et al., 1982; Meaney et al., 1995;
Smith et al., 1997; Smith and Meaney, 2000). Beyond primary mechanical disruption of the cell
membrane there are numerous secondary neurodegenerative effects directly tied to initial

39
disruption of axons, including deafferentation, neuronal death, and ECM breakdown. Some
neurons will experience mechanoporation of their axonal membrane mediated by a breakdown in
axonal transport proximal to cytoskeletal disruption. As noted above, rapid
acceleration/deceleration events mechanically deform long axons which, due to their cytoskeletal
structure, are selectively vulnerable to out of axis shear stress. This DAI is characterized by local
axonal swellings described as ‘beads on a string’, which occur most frequently in (but not limited
to) white matter tracts including the corpus callosum, parasagittal white matter, internal capsule,
and thalamus (Adams et al., 1989; Adams et al., 1991; Graham et al., 1995; Gultekin and Smith,
1994; Vascak et al., 2017). Much of the observed histological change can be attributed to a
breakdown in axonal transport dynamics. Amyloid precursor protein (APP), which pools as a
result of local disruption of anterograde axonal transport, is considered the gold standard in
identifying DAI or more specifically, traumatic axonal injury (Povlishock et al., 1992;
Povlishock and Christman, 1995). After TBI, APP has been primarily associated with two forms
of TAI pathology: retraction balls in disconnected axons, and varicosities in intact axons
(Adams et al., 1989; Smith and Meaney, 2000; Povlishock et al., 1983; Povlishock and Kontos,
1985; Povlishock and Becker, 1985; Povlishock and Katz, 2005). These axon varicosities can
develop into reactive axonal swellings within a few hours after injury, enlarging through at least
2d post injury. This process leads to severe ionic imbalance, Ca2+
influx and mechanical failure
of the axon cytoskeleton. The result is a sealed off distal end of the axonal swelling and
development of the characteristic axon retraction balls (Povlishock et al., 1983; Povlishock and
Becker, 1985; Povlishock and Kontos, 1985; Povlishock et al., 1992; Povlishock and Katz,
2005). The axon segment distal to the retraction ball undergoes Wallerian degeneration, a semi-
controlled ‘apoptosis’, leading to complete axotomy (Povlishock et al., 1992; Povlishock, 1992;

40
Povlishock and Pettus, 1996; Kelley et al., 2006; Büki and Povlishock, 2006). A consequence of
this axotomy is the eventual atrophy of the presynaptic terminal, dissociation of the synaptic
junction and deafferentation (Grady et al., 1989; Steward, 1989; Erb and Povlishock, 1991).
Together, these secondary pathologies affecting membrane and axon integrity have been
observed in a wide variety of brain regions both post experimentally and post mortem
(Povlishock, 1992; Povlishock and Katz, 2005).
TBI has also been shown to induce cell death among susceptible populations, although
with a wide range of intensity, depending on specific injury or model used. Certain brain regions
have been identified as being particularly vulnerable to cell death – largely white matter or
cortical structures including the hippocampus, neocortex, as well as the cerebellum, and
thalamus (Ross et al., 1993; Kotapka et al., 1992; Adams et al., 1985). Animal models have
demonstrated neurodegeneration as early as minutes to hours after insult and it is easy to
recognize that grossly damaged cells with disrupted membrane integrity rapidly necrose (Sutton
et al., 1993; Dietrich et al., 1994; Hicks et al., 1996). Ultrastructural analysis of dying neurons
due to secondary insult has also been examined by Dietrich and colleagues, demonstrating
neuronal profiles with pyknotic nuclei, swollen mitochondria, vacuolated cytoplasm, and
disrupted membranes (Dietrich et al., 1994). This cell loss due to secondary insult is particularly
robust in the peri-injury region surrounding a focal lesion, as well as with diffuse TBI. It has
been demonstrated in the same injury-susceptible regions seen histologically, including the
neocortex, hippocampus, dentate gyrus (DG), thalamus, and caudate/putamen (Farkas and
Povlishock, 2007). In each case, high vulnerability is likely due to the structural nature of the
fiber tracts involved, proximity to the applied injury, or unique anatomical location that results in
particularly damaging strain responses. Regardless of brain region, both apoptotic and necrotic

41
mechanisms of cell death are represented after TBI (Raghupathi et al., 2002; Portera-Cailliau et
al., 1997; Nicotera et al., 1999b; Nicotera et al., 1999a). That being said, injury severity is
probabilistic in these vulnerable brain regions, with apoptosis predominating for both mTBI and
ischemic injury (Raghupathi et al., 2002; Du et al., 1996), while moderate and severe TBI
demonstrating increased levels of necrotic cell death (Conti et al., 1998; Newcomb et al., 1999a;
Newcomb et al., 1999b). While TBI-induced cell death is often an acute process it has also been
observed as a chronic, delayed neurodegenerative event (Hicks et al., 1996; Conti et al., 1998).
Finally, it is important to note that while post-injury damage and death of neuronal populations
are well established, the majority of affected neurons in the injured brain do not die, and remain
capable of recovery after some period of time. This regenerative potential is an active area of
TBI research with some investigators identifying the onset of the regenerative process at the time
of initial axon disconnection from the synapse due to axonal swelling (Pettus et al., 1994;
Maxwell et al., 1997; Stone et al., 2004).
From a cellular perspective, much of the aforementioned TBI pathology might be linked
with trauma-induced change in the NVU. For example, the same gross mechanical insult that
damages axons also damages other anisotropic structures such as small intra-parenchymal
vessels and capillaries. Under normal circumstances the brain vasculature is a tightly controlled
structure that effectively permits the highly selective movement of certain metabolic and trophic
support molecules into the brain, while screening out many unwanted blood constituents.
Historically, this led to the concept of the brain as an ‘immune-privileged’ organ, and while this
view may no longer be fully accurate (Ransohoff and Brown, 2012), it is true that the brain
vasculature, NVU and BBB comprise an efficient structure, highly susceptible to insult within
any single component. After TBI, mechanical uncoupling of the NVU leads directly to the

42
movement of blood into the surrounding brain tissue, resulting in the release of red blood cell
heme and the activation of pathways responsible for recycling free iron. This process disrupts
critical metabolic support to affected neurons. Importantly, NVU damage also increases the
molecular signals stimulating local reactive neuroglia to increase their production and release of
pro inflammatory cytokines, leading to the breakdown of adjacent extracellular matrix
supporting injured neurons. In tandem, NVU disruption and BBB opening disrupts ionic
gradients in the local neuronal environment, further contributing to axon membrane damage,
deafferentation, cell death and major circuit dysfunction.
1.4 NVU and Inflammatory Response
Mechanisms that underpin NVU disruption are not well understood, but it is clear that a
combination of mechanical disruption, flow abnormalities, nitric oxide mediated vasodilation,
and inflammatory cytokines all play a role in loosening the tight junctions that normally
compartmentalize the vascular constituents from the brain parenchyma (Janigro et al., 1994;
Kobari et al., 1994; Cobbs et al., 1997; Lu et al., 2001; Kenney et al., 2016). The resulting
disruption impairs the stability of the neurochemical environment leading to highly variable
functional changes in specific cellular populations (Saunders et al., 1999; Habgood et al., 2007).
When functioning properly the NVU has numerous intercellular tight junctions between
endothelial cells and the small capillaries are wrapped by pericytes and astrocytic end feet
preventing the transmission of large molecules and the relatively selective uptake of contents
into the astroglia rather than into the brains extracellular space (Ek et al., 2003; Ek et al., 2006;
Kenney et al., 2016). Following injury this carefully ordered structure is disrupted and large
(potentially toxic) molecules are able to enter the CNS impairing normal functions (Habgood et
al., 2007). This is easily characterized in animal models and post mortem tissue by staining for

43
albumin – a large protein involved in the conjugation and trafficking of waste products which is
normally partitioned into the intravascular space. This can drastically affect the post-injury
change in oncotic pressure of the capillary beds resulting in local tissue swelling and an increase
in ICP.
The resident immune cells of the CNS (astroglia and microglia) are capable of producing
a robust immune response and releasing of associated cytokines (Ransohoff and Brown, 2012).
These cells typically reside at or near the NVU structure. Each glial type also exemplifies a
common immune and neural development function. As an example, microglia are involved in
embryonic development and normal synaptic striping serving a phagocyte-like role (Bilimoria
and Stevens, 2015; Fiske and Brunjes, 2000; Blinzinger and Kreutzberg, 1968; Kettenmann et
al., 2013). Astroglia similarly are involved in synapse formation and secrete soluble signals that
direct synaptogenesis and stabilize the resulting connections (Hughes et al., 2010; Ransohoff and
Brown, 2012). These resident immune cells are notable for having distinct morphologies when
immunologically active. While there are currently a large number of descriptors for microglia
engaged in more specific activities, the cells can generally be described as resting or active.
Resting microglia (synonymous with surveillant or ramified) possess small cell bodies with an
abundant surrounding web of long fine process that actively sample and survey the environment.
Activated microglia (or reactive) retract these processes, develop larger, rounded cell bodies and
become more mobile. Activated microglia are further divided into two main categories; M1
(classically active) and M2 (alternatively active). The different subtypes predominate at different
times post injury.
Classically active microglia (M1) are highly responsive to pro-inflammatory molecules
including TNF-α and LPS and in turn produce further pro-inflammatory cytokines (Ponomarev

44
et al., 2007). Alternatively active microglia (M2) in contrast are responsive to anti-inflammatory
molecules including IL-4 and IL-13 (Colton and Wilcock, 2010). Further, M2 microglia express
proteins (including Arginase-1) involved in ECM repair and remodeling (Colton, 2009). Both
types are activated after injury and are required to develop an appropriate immune response but
they can become harmful if expressed excessively and chronically (Holmin and Mathiesen,
1999; Bartfai et al., 2007; Ramlackhansingh et al., 2011). Excessive microglial activation has
been shown to decrease neurogenesis, be pro-apoptotic, and damage healthy neurons (Lazarini et
al., 2012; Block and Hong, 2007; Block and Hong, 2005; Ponomarev et al., 2007). Further,
reactive microglia have been linked to the induction and development of neurodegenerative
disease states including MS (Correale, 2014) and inducing aberrant synaptic striping (Ziebell et
al., 2015).
Similarly, astrocytes become reactive after injury and are characterized by cellular
hypertrophy and increased expression of vimentin and glial fibrillary acidic protein (GFAP;
(Herrmann et al., 2008). Astrocytes produce a different profile of secreted molecules after injury
compared to microglia and they tend towards greater secretion of ECM molecules and growth
factors (Zhao et al., 2004; Ransohoff and Brown, 2012). Astrocyte secreted Thrombospondins
are key signals for synapse formation. They are more heavily involved local maintenance of
nearby neurons and serve to buffer [K+]e, recycle glutamate, modulate blood flow, and secrete
anti-inflammatory cytokines (e.g. IL-1; (Ransohoff and Brown, 2012). Astrocytes reduce the
neurotoxic effect of excess glutamate (Schousboe et al., 2014; Schousboe and Waagepetersen,
2005; Kumar and Loane, 2012) and neuron dysfunction is exacerbated when astrocyte function is
impaired (Myer et al., 2006). Excessive astrocyte reactivity has also been shown to be damaging,

45
and knockout (KO) mice lacking vimentin and GFAP have shown impaired recovery after CNS
injury (Menet et al., 2003; Wilhelmsson et al., 2004).
As noted above, the disruption of the NVU allows blood constituents and brain specific
proteins to bilaterally cross the barrier triggering an immediate, local inflammatory response
(Morganti-Kossmann et al., 2001). Release of inflammatory cytokines from hemorrhagic sites
within the injured area and through fenestration of the NVU barrier permits inflammatory cells,
including neutrophils and other leukocytes, to infiltrate the brain parenchyma (Chodobski et al.,
2011). These cells selectively migrate to damaged brain tissue, and in turn release further
chemoattractants to recruit additional vascular cells (Bellander et al., 2001; Fluiter et al., 2014;
Lozano et al., 2015). This feeds a recurrent cycle of cytokine and chemokine production to
promote a sustained inflammatory response, further inducing barrier permeability (Chodobski et
al., 2011). Local release of both cytokines and chemokines also induces endogenous glial
activation which stimulates additional leukocyte recruitment, exacerbating NVU ‘leakiness’
(Ziebell and Morganti-Kossmann, 2010; Morganti-Kossmann et al., 2001; Kenney et al.,
2016)(Ziebell and Morganti Kossman, 2010, Morganti Kossman 2001, Kenney 2016, Shlosberg
2010). Experimental models and clinical data have specifically identified tissue, CSF and blood
elevations of both pro- and anti-inflammatory cytokines during the acute post-injury period
(Hofman, 1989; Shohami et al., 1994; Breder et al., 1988; Spangelo et al., 1990; Frugier et al.,
2010; Rothwell, 2000). Even diffuse injury models have shown cytokine/chemokine elevation
within 6 hours post-injury, the ‘acute phase’ of response, which has been characterized by
microglial activation near injured neurons (Kelley et al., 2007). Local glia have been shown to
be heavily involved in both monitoring the injured environment and secreting
cytokines/chemokines (Singhal et al., 2002; Cederberg and Siesjö, 2009).

46
Pro-inflammatory cytokines induced by TBI include not only TNF-α (an acute phase
regulator of inflammation; (Hofman, 1989; Shohami et al., 1994), but also IL-1β (a human
pyrogen; (Rothwell and Luheshi, 2000), IL-6 (pyrogen secreted by macrophages after trauma or
burn injury; (Breder et al., 1988; Frugier et al., 2010), IL-12 (a T-cell stimulating factor; (Stahel
et al., 1998), and IFN-γ (activator of macrophages and MHC II inducer; (Frugier et al., 2010;
Lozano et al., 2015; Hernandez-Ontiveros et al., 2013). Interestingly, each of these cytokines can
be linked to beneficial effects after peripheral trauma or infection but their sustained elevation
may be harmful and maladaptive, particularly within the brain. For example, it has been shown
that TNF-α inhibition does not improve long term neurocognitive outcomes after TBI, while IL-6
suppression impairs recovery (Penkowa et al., 2000; Scherbel et al., 1999; Sullivan et al., 1999).
This well-established immune response from systemic cytokines is also supported by the fact
that other brain expressed molecules can function as local cytokines, e.g. osteopontin (Shin et al.,
2012). The overall effect of these cytokines is to further increase the targeting of both peripheral
and resident immune cells to areas of injury.
As is typical for many other organ systems, there is mixed evidence for the role of
inflammation after TBI, particularly in regards to extent and timing (Correale and Villa, 2004;
Lucas et al., 2006; Shohami, 1999; Morganti-Kossmann et al., 2002). Cytokines in particular
have been identified as having both neurotoxic and neuroprotective effects (Morganti-Kossmann
et al., 2007). To a significant extent, this dual role is commonly observed in multiple peripheral
traumatic responses although the potential for deleterious outcomes is amplified in CNS injury.
Early inflammation is linked to the release of potentially toxic cytosolic contents into the
extracellular space. This triggers a number of responses some of which involve the generation of
reactive oxygen species (ROS) and nitric oxide (NO) by the surrounding tissue and is supported

47
by resident microglia and astroglia that monitor and maintain the extracellular space (Juliet et al.,
2008; Singhal et al., 2002; Cederberg and Siesjö, 2009). A number of studies have examined
the effects of attenuating specific portions of this acute phase inflammatory response, reporting
improvements in post-TBI outcomes. Several pro-inflammatory molecules have been targeted
including IL-1, IL-1 receptor, TNF-alpha and S-nitrosoglutathione. For example, IL-1
exacerbates neuronal injury (Rothwell, 1999) and treatment with an IL-1R antagonist improves
post TBI outcome (Relton and Rothwell, 1992; Loddick and Rothwell, 1996; Tehranian et al.,
2002; Lucas et al., 2006). Further, inhibiting elevated TNF-alpha levels improves post TBI
outcome (Shohami et al., 1997), and exposure to S-glutathione shows increased repair and
protection after TBI (Khan et al., 2011). By contrast, a number of pharmacologic studies that
have targeted post-injury elevation of IL-6 (Penkowa et al., 2000) and IL-10 (Knoblach and
Faden, 1998; Kremlev and Palmer, 2005) report improved outcome following TBI. Since
management of inflammation has long been considered a possible means to foster the post-injury
neuroplasticity underlying this improved outcome, several TBI studies have focused on the
interaction between inflammation, extracellular environment and successful neuroplasticity.
1.5 Neuroplasticity and the Extracellular Environment after TBI
While historically the CNS was considered a hard-wired and permanent structure in
adulthood, neural plasticity and modest regeneration in mature systems has become an accepted
theory (Hebb, 1950; Keyvani and Schallert, 2002). Plasticity has been observed in nearly every
form of traumatic neural injury studied, demonstrating the CNS is a plastic structure after injury
including in the spinal cord (Liu, 1958), hindbrain/midbrain (Goodman and Horel, 1966), septal
nuclei (Raisman, 1969), superior colliculus (Lund and Lund, 1971), the hippocampus (Steward,
1976; Lynch et al., 1976; Scheff et al., 1977; Christman et al., 1997; Hulsebosch et al., 1998;

48
Harris et al., 2010), and the neocortex (Bashir et al., 2012; D'Amato and Hicks, 1978; Levin et
al., 1994).
In addition to the previously described immunological cascades that occur after injury
there are also well defined phases of local ECM degradation and recovery which are directly
associated with restored neuronal function. Generally, recovery appears to be mediated through
the interactions of cytoskeletal proteins and the ECM mediated by cell adhesion molecules
(CAMs), Matrix Metalloproteinases (MMPs), and growth factors, each of which correlates
with separation of neuronal connections and their reintegration for cell/tissue stability after
injury. Of particular note is the stability requirements of dendritic and somatic synaptic contacts
which begin to dysregulate and separate when tissue stability is lost (Levy et al., 2014). Animal
models and human patients each demonstrate specific cellular and synaptic dysfunction
following injury (Cotman et al., 1977; Nadler and Cotman, 1978; Grady et al., 1989; Steward,
1989; Phillips and Reeves, 2001). Because neocortex, cerebellum, thalamus, and hippocampus
regions are susceptible to brain injury, and are easily injured and dissected for study in rodent
models, these animal models of synaptic deafferentation have been able to effectively document
time dependent stages of synaptic recovery (Adams et al., 1985; Kotapka et al., 1992; Ross et al.,
1993; Loesche and Steward, 1977).

49
1.5.1 Figure 1-2: Reactive Synaptogenesis

50
Figure 1-2: Stages of Reactive Synaptogenesis. Following deafferentation normal synapses (A)
first undergo a degenerative phase (1-5d postinjury; B) characterized by reactive glia (gl) which
remove degenerating terminals (d). Next, synapses enter the regenerative phase (6-15d
postinjury; C) where sprouting of new axons occurs (arrows) before maturing during
stabilization (15d+ postinjury; D) Reproduced with permission from Steward et al., 1988.

51
TBI induces axotomy and loss of presynaptic input, followed by the plasticity of
reinnervation. Synaptogenesis is the formation of new synapses among neurons and is a normal
process occurring during embryonic development. It has been shown that local synaptic
plasticity and synaptogenesis occurs in response to trauma, much as it does during loss and re-
emergence of long term potentiation (LTP) and long term depression (LTD) metrics
(Miyazaki et al., 1992; Reeves et al., 1995). DAI has been shown similarly to drive plasticity
(Grady et al., 1989; Levin, 1995; Povlishock et al., 1992) in a process guided by glia, matrix
proteins, and secreted growth factors. The term ‘reactive’ synaptogenesis describes the process
where a previously established synapse has been damaged or lost and the reorganization
/regeneration occurs over time, divided into distinct degenerative, regenerative, and stability
phases (1-5days, 6-15 days and 15+ days respectively; see Figure 1-2). A number of animal
models have been developed to focus on reactive synaptogenesis and have made frequent use of
the hippocampus as a model brain structure with well-characterized synaptic reorganization. An
example is the unilateral entorhinal cortex lesion (UEC) model developed by Steward 1979
which involves lesioning the entorhinal cortex on one side. Since the majority of EC input targets
ispilateral dentate gyrus via the perforant path, such lesions predominantly deafferent the
hippocampus of one hemisphere to induce unilateral reactive synaptogenesis. Between1-5 days
after injury degeneration and clearance of debris predominates: axon terminals die and retract;
cellular debris is removed by phagocytic cells. At 6-15 days after injury new axon terminals
appear as collateral sprouts of intact non EC projections and reinnervation of the deafferented
tissue begins (Lynch et al., 1976; Steward, 1976; Deller et al., 2007; Frotscher et al., 1997). By
15+ days after injury, the deafferented zone shows continued stabilization of newly formed
synapses as they mature and functionally strengthen (Steward and Vinsant, 1983). This process

52
has been identified in many other brain tissues and while the cellular events proceed in a similar
order the time course may shift, as in the olfactory bulb (OB) (Graziadei et al., 1978; Graziadei
et al., 1979) and neocortex (Stroemer et al., 1995).
It is known that reactive synaptogenesis occurs in response to a variety of brain insults
and including those resulting from effects of DAI and diffuse injury in general. Since these is
much evidence to suggest that hemorrhage is sufficient to cause injury and reactive
synaptogenesis (e.g. it is the basis for subarachnoid hemorrhage (SAH) animal models) and
TBI models generate varied degrees of brain hemorrhage, it is clear that perturbations of the
NVU play a role in the process of post-injury neuroplasticity. The most direct connection
between NVU and this plasticity lies in the role of reactive glia. It has been observed that the
supporting glia drive the process of post-injury synaptogenesis. Microglia become reactive and
migrate to the deinnervated zone within 24 hours after injury and peak in number around day 3
before returning to baseline conditions at day 8 (Cotman, 1999). Astrocytes similarly follow,
peaking at day 4 and remaining active through day 14. Both are involved in clearing degenerated
terminal and debris. Rate of synapse reformation correlates with rate of degenerated terminal
clearance and persistent degeneration delays glial reactivity and sprouting (Steward, 1992). At
sites of NVU disruption, highly reactive and mobile glia secrete a variety of injury-induced
molecules into the brain matrix, including both thrombospondins, which regulate endothelial cell
proliferation (Chamak et al., 1995; Moller et al., 1996; Christopherson et al., 2005) and matrix
metalloproteinases (MMPs), that modify the cytoarchitecture of the brain parenchyma around the
insult (Rosenberg, 1995; Phillips et al., 2014) .

53
Extracellular Matrix, Metalloproteinases and Neuroplasticity
The extracellular matrix (ECM) is the ground substance into which tissue is embedded
and provides the external structure and organization to brain tissue with its numerous adhesion
substrates that support growth, development, and maturation of synapses (Ruoslahti, 1996;
Venstrom and Reichardt, 1993; Dityatev and Schachner, 2003). In a field dominated by studies
of neural circuits and neuronal subpopulations, the CNS ECM has been described as being less
organized than other organ systems, possibly as a result of the continuous remodeling necessary
for a lifetime of ongoing neural plasticity (Pittman and Buettner, 1989; Romanic and Madri,
1994). The brain ECM does however contribute significantly to the structural stability of the
brain and in doing so supports neuronal homeostasis and mediates the interactions of cellular
components (Jones, 1996; Wee Yong et al., 1998). For example, integrin glycoproteins regulate
the adhesion and cell signaling of neurons, glia, meningeal epithelium and endothelial cells in
both cell-cell and cell-ECM interactions (Hynes, 1992; Milner and Campbell, 2002).
Just as ECM proteins play a major role in guiding and stabilizing synaptogenesis during
development, effective ECM maintenance is also required for successful synaptic recovery
following traumatic injury. A number of specific cell populations have been identified which
interact with ECM to direct different phases of synaptic reorganization including microglia,
astroglia, and olfactory ensheathing cells (Giulian et al., 1989; Chao et al., 1992; Bessis et al.,
2007; Ekdahl et al., 2009; Christopherson et al., 2005; Barnett, 2004; Steward, 1989; Ullian,
2001). Microglial injury response not only involves the production and release of cytokines, but
also generation of MMPs and proteoglycans in an effort to recruit additional macrophages,
debride damaged tissue and stabilize remaining viable tissue (Hanisch, 2002; Gottschall and Yu,
1995; Gottschall et al., 1995; Yokoyama et al., 2006). This microglial action facilitates in

54
reshaping the ECM during the acute degenerative phase (John et al., 2003; Ethell and Ethell,
2007). Astrocytes are also responsive after injury and take on a reactive form which secretes
growth factors and MMPs (Goss et al., 1998; Madathil et al., 2013; Wells et al., 1996; Muir et
al., 2002), molecules which stimulate neurite growth and modify local environment to permit
sprouting of terminals during the synapse regenerative phase (Falo et al., 2008; Warren et al.,
2012).
These participant MMPs are a family of secreted divalent cation (Zn2+
/Ca2+
) activated
proteolytic enzymes, best characterized by their ability to modify and degrade ECM during both
normal physiologic and pathogenic conditions (Romanic and Madri, 1994; Asahi et al., 2001).
This ability has broad ramifications at the tissue level and causes the modification in function of
membrane receptors, adhesion molecules, and growth factors during developmental processes
including embryonic development, wound healing, and angiogenesis (Van Hove et al., 2012;
Verslegers et al., 2013). Most relevant to traumatic brain injury, glial and neuronal sourced
MMPs may facilitate synaptic recovery after TBI through modification of the ECM (Wee Yong,
2010).

55
1.5.2 Table 1-3: MMPs and Their Classifications
Table 3: Matrix metalloproteinases and their domain composition. Reproduced with
permission from Nagase et al., 2006.

56
MMPs are classified based on their primary substrates and whether they are secreted or
membrane bound (see Table 1-3, Figure 1-3). These classes include collagenases, gelatinases,
stromelysins, matrilysins, and membrane-types (MT-MMPs) (NAGASE et al., 2006). They all
contain similar structural homology including a signaling peptide and a catalytic domain, and
they are produced as inactive zymogens (pro-MMPs) which must be cleaved to expose the Zn2+
-
cysteine bond at the catalytic site which characterizes the functionally active form (Van Wart and
Birkedal-Hansen, 1990; Becker et al., 1995). MMPs are thus regulated via proteolytic activation,
although they can also be regulated by post-translational modification, tissue inhibitors of
matrix metalloproteinases (TIMPs), and more indirectly by cell compartmentalization
(Chakraborti et al., 2003; Baker, 2002).
MMPs have been well studied as effectors of reorganization of synaptic plasticity (Yong
et al., 2001; Yong, 2005; Wlodarczyk et al., 2011; Dityatev and Schachner, 2003; Lo et al.,
2002). They have been identified as influencing axonal growth, synaptic modification, and
recovery after injury (Szklarczyk et al., 2002a; Vaillant, 2003; Fredrich and Illing, 2010; Yong et
al., 2001; Dityatev and Schachner, 2003). These effects have largely been identified as being a
result of glial reactivity and secretion (Oh et al., 1999; Giraudon et al., 1997; Sternlicht and
Werb, 2001). Studies in our laboratory have connected aberrant MMP activity to disrupted
synaptic reorganization post hippocampal deafferentation. These studies have indicated that
membrane type 5 matrix metalloproteinase (MT5-MMP) and a disintigrin and metalloproteinase-
10 (ADAM-10) are both capable of cleaving N-cadherin which is partially responsible for
synaptic stabilization (Warren et al., 2012). Warren et al., 2012 showed that when contrasting
models of adaptive and maladaptive plasticity, persistent ADAM-10 expression during
maladaptive plasticity is correlated with attenuated N-cadherin production and ultimately

57
reduced functional recovery. MMP inhibition was further found to reduce ADAM-10, shifting
the N-cadherin expression profile to one that begins to match the synaptic recovery profile. Other
gelatinases (MMP-2, MMP-9) and stromelysins (MMP-3, MMP-10, MMP-11) have also been
identified as critical to the pathophysiology of CNS injury. It is abundantly evident that the time
dependent nature of MMP expression underlies successful vs unsuccessful recovery after injury.
As an example, MMP-3 was found to disrupt the BBB/NVU and to promote injury via that
mechanism (Rosenberg et al., 1998; Van Hove et al., 2012), while other studies have found
MMP-3 to be associated with successful neuronal outgrowth following sciatic nerve crush injury
(Demestre et al., 2004; Shubayev and Myers, 2004). Elevated MMP-9 has similarly been
associated with both increased injury after TBI, as well as positive mediation of dendritic
remodeling during LTP in in vitro models of learning and memory (Dziembowska and
Wlodarczyk, 2012; Bozdagi et al., 2007).

58
1.5.3 Figure 1-3: Domain Structure of the MMP Family

59
Figure 1-3: Domain structures of the MMP family. See Table 3 for the domain arrangement for
each MMP. Sp, signal sequence; pro, pro-domain; cat, catalytic domain, FNII, fibronectin type
II motif; L1, linker 1; Hpx, hemopexin domain; L2, linker 2; Mb, plasma membrane; TM,
transmembrane domain; Cy, cytoplasmic tail; CysR, cysteine rich; Ig, immunoglobulin domain;
GPI, glycosylphosphatidilyinositol anchor. Reproduced with permission from Nagase et al.,
2006.

60
1.6 Gelatinases, NVU and TBI
Of the MMPs known to respond to brain injury, those that directly target the major
components of basal lamina ECM are most relevant to NVU disruption after TBI. Collagen is
one of the principal matrix proteins making up this basal lamina, which is degraded along with
NVU breakdown. One MMP family consistently associated with this degradation is the
gelatinases, MMP-2 (72 kDa, Gelatinase A), and MMP-9 (92 kDa, Gelatinase B). It should be
noted that these enzymes target a form of collagen different from the animal derived collagen
which, when irreversibly hydrolyzed, is used largely as a gelling thickening agent in food. Here
we are referring largely to type IV collagen (a large precursor to culinary gelatin) which is the
primary type of collagen within the extracellular matrix supporting the NUV, acting to stabilize
vascular epithelium.
MMP-2 and MMP-9 have been extensively associated with a variety of physiologic and
disease processes including blastocyst implantation, inflammatory disease, cancer, and
cardiovascular disorders (Van den Steen et al., 2002; Stamenkovic, 2003; Klein and Bischoff,
2010). Their structure consists of a hemopexin domain and fibronectin repeats that are located
upstream of the catalytic site (Handsley et al., 2005); see again Figure 1-3). Gelatinases have
been identified as targets for modulation and treatment of TBI pathobiology because their
elevated expression is linked to effective synaptic reorganization. Notably, neural development
occurs in the presence of high levels of gelatinase mRNA, especially during the first postnatal
week in vascular cell types including pericytes and endothelial cells (Ayoub et al., 2005; Planas
61
et al., 2001; Szklarczyk et al., 2002a) as well as in glial subpopulations: MMP-2 in astrocytes
and MMP-9 in white matter tracts (Planas et al., 2001; Szklarczyk et al., 2002a).
Another important cell function supported by gelatinases in the developing CNS is the
direction of tissue migration of neural crest cells (NCCs), neural stem cells (NSCs), neurons,
and astrocytes (Perris and Perissinotto, 2000; Perris, 1997; Kazanis and ffrench-Constant, 2011;
Barros et al., 2011). MMP9 inhibitors can impair migration of these NCC and NSC cells in avian
and rodent embryonic models (Duong and Erickson, 2003; Ingraham et al., 2011). MMP-9 KO
mice and in vitro assay models have shown altered granule cell migration (Vaillant, 2003; Ayoub
et al., 2005) and MMP-2 positive pericytes are associated with vascular sprouting (Girolamo et
al., 2004; Virgintino et al., 2007). Gelatinases are also highly expressed in dendrites; which is
unsurprising given that a large number of their substrates are cytoskeletal components, growth
factors, cell adhesion molecules, and axonal guidance receptors, and they have been linked to
dendritic and axonal outgrowth (Tian et al., 2007; Gonthier et al., 2009; Saygili et al., 2010; Lin
et al., 2008). Thus, gelatinases have the potential to direct CNS angiogenesis, including the
establishment/maintenance of NVUs. These brain/vascular interfaces can, in turn, influence cell
activation/migration after TBI, generating molecules which foster axonal outgrowth, myelination
and synaptogenesis crucial for post-injury recovery. For example, MMP-9 influences
emergence of LTP via regulating extracellular proteolysis and transmitter receptor
tracking/activation at the recovering synapse (Bozdagi et al., 2007; Michaluk et al., 2009) .
Further, MMP-9 mRNA has also been shown to be transported and activated during LTP (Sbai et
al., 2008; Dziembowska and Wlodarczyk, 2012). Similarly, MMP-9 KO animals display altered
hippocampal dependent function (Nagy, 2006; Meighan et al., 2006). Indeed, a number of
studies have demonstrated increased MMP expression following CNS injury in both

62
experimental animal models and human trauma victims (Clark et al., 1997; Rosenberg et al.,
1998; Heo et al., 1999). Overall, increased MMP expression correlates with increased damage,
which is thought to occur as a result of widespread proteolysis and the disruption of the basal
lamina (Rosenberg, 1995; Rosenberg et al., 1998; Wang, 2000; Gursoy-Ozdemir et al., 2004;
Michaluk and Kaczmarek, 2007). Additional studies have linked gelatinases to modulation of
growth factors and inflammatory cytokines (Rosell and Lo, 2008; Gottschall and Yu, 1995;
Giraudon et al., 1997). MMP-9 is considered the gelatinase most responsible for this effect since
studies with MMP-2 KO mice did not show reduce injury pathology (Asahi et al., 2001), while
loss of MMP-9 was protective against ischemia and TBI (Asahi et al., 2000b; Wang, 2000).
Such protection was posited to be through increased BBB/NVU integrity in the absence of
MMP-9 (Conant and Gottschall, 2005; Gidday, 2005) (Conant and Gottschall 2005, Gidday
2005). Together, these data would argue that loss of NVU integrity is a primary TBI
pathobiology and point to the critical role of tissue response pathways activated by local
hemorrhage at the breeched NVU. One of the most important first responders to this breech is
inducible Heme Oxygenase 1 (HO-1).
1.7 Heme Oxygenase
1.7.1 Discovery, Structure, Biological Role
Heme Oxygenase (HO) enzymes were initially discovered in 1968 and were largely
characterized as endoplasmic reticulum proteins due to their presence in microsomal fractions of
tissue homogenate (Ishikawa et al., 1991; Yoshida et al., 1988; Shibahara et al., 1989). Since that
time HO-1 has been identified as containing a hydrophobic terminal domain segment more
suggestive of membrane compartmentalization (Ishikawa et al., 1991; Shibahara et al., 1985;
Yoshida et al., 1988). The overall structure of HO-1 is a flexible bi-helical protein structure that

63
surrounds a central heme pocket (Lad et al., 2003; Schuller et al., 1999). A widely conserved
histidine imidazole functions as a heme iron ligand which is stabilized by two distal glycine
residues. A 32 kDa inducible protein, HO-1 is homologically similar to heme oxygenase 2 (HO-
2), a 36 kDa constituently expressed protein.
HO-1 and HO-2 both catalyze identical biochemical reactions. They are the canonical
enzymes that reduce molecular heme into biliverdin-IXa and though they have similar substrate
specificity and cofactor requirements they have different kinetic properties with Km values of
0.24 and 0.67 uM respectively among other physical differences (Maines, 1992; Maines et al.,
1986; Trakshel et al., 1986). A low Km indicates the enzyme requires only a small amount of
substrate to saturate and maximal velocity is reached at low substrate concentrations; a high Km
requires high substrate concentration to achieve maximal reaction volume. The substrate of an
enzyme with lowest Km is assumed to be the native substrate.
The primary biological role of HO is to reduce heme from senescent erythrocytes,
hemorrhage, or cytochrome enzymes (Tenhunen et al., 1969; Tenhunen et al., 1970; Pimstone et
al., 1971b; Pimstone et al., 1971a). It has been identified that HO-1 is highly upregulated during
inflammatory wound processes and responds to a variety of inflammatory and pro-oxidant
stimuli (Ryter et al., 2006; Chang et al., 2005). Despite the name, it is known that HO-1 is the
primary driving force behind erythrocyte related heme degradation both normally and
pathologically. While KO of HO-1 or HO-2 are viable, HO-1 KO animals experience impaired
wound healing and some degree of hemochromatosis despite elevated HO-2 throughout the
tissue, a phenotype observed in a human case report of an individual with HO-1 deficiency (Poss
and Tonegawa, 1997a; Poss and Tonegawa, 1997b; Kawashima et al., 2002; Yachie et al., 1999).
HO-2 KOs in contrast do not show any obvious phenotypic change beyond increased HO-1

64
expression. Normally, HO-1 is highly elevated in the reticuloendothelial system (RES or
mononuclear phagocyte system), a system of phagocytic cells located in reticular connective
tissue that processes damaged or senescent erythrocytes and is involved with the formation of
bile pigments and storage of iron. Major sites of RES activity include the spleen, liver, and
lymph nodes with additional small populations scattered throughout other tissues. During
traumatic vascular injury HO-1 is highly induced n the local tissue, typically expressed by
macrophages involved in erythrophagocytosis. In a typical hemorrhagic injury there is a delay of
~24-48 hours before HO-1 expression increases (Cao et al., 2016; Lu et al., 2014) and this
appears to be primarily driven by the lag in erythrocyte lysis after injury. Ultimately, when the
available heme substrate has been processed fully HO-1 returns to near baseline levels.
HO-1 is transcriptionally controlled by a variety of antioxidant/anti-ischemic
transcription factors (Ryter et al., 2006; Alam, 1994; Alam et al., 1994; Alam et al., 1995). Chief
among them is Nrf2, a constituently present transcription factor known to activate the consensus
ARE sequence which controls antioxidant response proteins, including HO-1(Figure 1-4). Under
normal conditions Nrf2 is continuously produced and resides in the cytoplasm bound by the
repressor protein Keap1 and experiencing continual steady state degradation via cullin3 mediated
ubiquitinization. Under oxidative stress (e.g. ROS, Fe, Electrophilic Attack) Keap1
conformationally changes due to cysteine mediated disulfide bond disruption (Hu et al., 2011).
This change releases Nrf2 which is sufficiently small to spontaneously cross the nuclear pore.
Once inside the nucleus Nrf2 binds to the consensus ARE sequence and promotes transcription
of downstream targets. In regards to HO-1 this largely functions as a feed-forward mechanism
which amplifies expression of HO-1 until HO-1 substrate is fully digested. This feed-forward
mechanism occurs because the breakdown products of HO-1 mediated heme B catabolism (Fe

65
specifically) are known to induce Keap1 conformational change releasing Nrf2 which in turn
increases HO-1, increases heme catabolic rate, and increases the local concentration of Fe which
drives expression in a closed loop. This whole process is initiated due to small quantities of HO
(e.g. HO-2) that are constituently present and provide the induction trigger. There are other
known mechanisms which induce HO-1 expression but to date there is no evidence that they play
a role in the selected model of TBI and the dominant focus of endogenous HO-1 induction has
settled on the Nrf2/Keap1 axis as the dominant mechanism.
1.7.2 NVU Breach, HO-1 and Cytotoxicity
During the reduction of Heme via HO-1 catalytic cleavage there are several molecules
that are released which have potential cytotoxic sequelae: carbon monoxide (CO), Iron (Fe),
and Biliverdin. Carbon monoxide has a number of well-known cytotoxic effects where it tends
to bind metalloproteins and heme moieties with high affinity preventing normotypic function. In
mass quantities this is the typical outcome seen in CO poisoning where a sufficient fraction of
erythrocyte hemoglobin becomes saturated with CO and fails to function normally in oxygen
exchange with the tissue. At the scale we are discussing this is less likely and more typical
dysfunction involves dysregulation of cytochrome enzymes and mimicry of NO on NO receptors
causing inappropriate vascular response. Iron similarly has a number of cytotoxic effects,
primary of which is the rapid cycling between oxidative states that encompasses the Fenton and
Haber Weiss cycles. In these cycles Fe acts as a charge receptor/donator and by rapidly cycling
between states generates hydroxyl radicals from metal catalyzed decomposition of hydrogen
peroxide (Halliwell and Gutteridge, 1999).

66
1.7.3 HO Genetics, Gene Regulation, and Signal Transduction
HO-1 and HO-2 are the products of the genes hmox1 and hmox2 which are 14 kb and 12
kb respectively and are both organized into 5 exons and 4 introns (Alam et al., 1994; Cruse and
Maines, 1988; Maines et al., 1986; McCoubrey and Maines, 1994; Shibahara et al., 1989). There
are a number of potential promoter regions that have been identified for HO-1 (Shibahara et al.,
1993), and the two major ones identified in the mouse are the E1 (268 bp) and E2 (161 bp)
regions located at -4kb and - 10kb respectively and similar sequences exist in humans (Alam and
Den, 1992; Alam, 1994; Alam et al., 1994; Alam et al., 1995; Alam and Cook, 2003). Both
regions contain the Stress Response Element (T/C)GCTGAGTCA and respond to a variety of
stimuli, being targets for Jun, Fos, CREB, ATF, Maf, and CNC-bZIP regulation (Alam and
Cook, 2003; Alam et al., 2000; Balogun et al., 2003; Elbirt et al., 1998; Kiemer et al., 2003;
Kietzmann et al., 2003; Kronke et al., 2003; Numazawa et al., 1997; Oguro et al., 1998;
Shibahara, 2003). This can be seen in Figure 1-4 adapted from Ryter et al., 2006. Signal
transduction is mediated through a wide variety of kinases including MAPKs, Tyrosine Kinases,
PI3K, and Protein Kinases A,G,C, generally operating through Keap1/Nrf2 or nuclear factors.
This can be seen in Figure 1-5 adapted from Ryter et al., 2006.

67
1.7.4 Figure 1-4: HO-1 Gene Regulation

68
Figure 1-4: Regulatory domains of the mouse and human ho-1 genes. The scheme depicts the
known regulatory elements in the mouse and human ho-1 genes. The -4 and -10 kb regions
(E1,E2) are marked for reference. Sequences identified primarily in the context of rat ho-1 are
shown in the hatched boxes. (…). Reproduced with permission from Ryter et al., 2006.

69
1.7.5 HO Subcellular Localization
Subcellular Localization HO-1 has typically been characterized as an endoplasmic
reticulum (ER) associated protein and both HO-1 and HO-2 contain C terminal hydrophobic
domains suggesting membrane compartmentalization (Ishikawa et al., 1991; Shibahara et al.,
1985; Yoshida et al., 1988). Evidence also exists for wider distribution including at the plasma
membrane caveolae, mitochondria (Kim et al., 2004), and nucleus (Li Volti et al., 2004; Maines
et al., 2001) in an inducer dependent fashion.
1.7.6 HO-1 Sources of Activation
Increased synthesis of HO-1 occurs as a general response to stress in biological systems.
Generally the increased synthesis is the result of transcriptional activation of the hmox1 gene
resulting in de novo synthesis of mRNA (Alam et al., 1989; Keyse et al., 1990; Lin et al., 1990;
Mitani et al., 1992; Mitani et al., 1993; Rizzardini et al., 1993; Sardana et al., 1982; Shibahara et
al., 1987). Table 3, adapted from Ryter et al., 2006 provides an only partially complete listing of
a wide variety of stressors. Ryter also note that there are three general hypotheses about HO-1
induction that will be discussed here.
The first general hypothesis is that an increase in intracellular heme content as a response
to a stressor will mediate induction of HO-1. This is primarily based on the observation that
heme is a potent inducer of HO-1 (and its enzymatic target) and that a number of chemicals
known to induce HO-1 are associated with transient increases in the hepatic heme pool (Kikuchi
and Yoshida, 1983). This hypothesis is, however, limited by the observation that inducers exist
which do not cause elevations in intracellular heme (Kikuchi and Yoshida, 1983). An interesting
point here is that an increase in the hepatic iron pool is suggestive of increased

70
erythrophagocytosis suggesting that either stressors are inducing erythrocyte senescence or that
HO-1 induces erythrocyte degradation.
The second general hypothesis is that an increase in intracellular reactive oxygen species
(ROS) causes induction of HO-1 in a redox regulated pathway. This hypothesis is founded on the
observation that many of the inducing agents are oxidants associated with the intracellular
production of reactive oxygen species (ROS) and further that induction of HO-1 by many
inducers can be inhibited by the antioxidant N-acetyl-L-cysteine (NAC) in millimolar
concentrations (Borger and Essig, 1998; Camhi et al., 1995; Durante et al., 1999; Favatier and
Polla, 2001; Foresti et al., 1997; Foresti et al., 1999; Gong and Hart, 1997; Hartsfield et al.,
1997; Hill-Kapturczak et al., 2003; Liu et al., 2004; Rizzardini et al., 1994; Terry et al., 1999).
The weakness in this hypothesis is that the ROS production of some inducers (particularly some
cytokines and hypoxia) is not settled and that antioxidants do not universally inhibit HO-1
induction. Even worse, some phenolic antioxidant compounds including quercetin and curcumin
induce HO-1 (Lim et al., 2001; Motterlini et al., 2000; Scapagnini et al., 2002; Tanigawa et al.,
2007). One of the HO-1 inducers utilized in this thesis (Sulforaphane) utilizes a similar
mechanism and it is worth mentioning that there is some confusion in the literature and generally
between molecules that are true antioxidants (aka are reductive a la N-Acetyl-L-Cysteine) or
molecules that are weak oxidants and instead activate redox triggers effectively without being
sufficiently oxidative to cause tissue damage.

71
1.7.7 Figure 1-5: HO-1 Activation Pathways

72
Figure 1-5. Signaling pathways leading to ho-1 activation. The scheme shows the potential
interrelationships between intracellular and nuclear signaling events that lead to transcriptional
activation of the ho-1 gene by various inducing agents. Increased of intracellular reactive
oxygen species lead to perturbation of intracellular thiol equilibrium, leading to reduction of
GSH/GSSG ratio, and redox regulation of Keap1. Treatment with heavy metals and/or heme
promotes Nrf2 nuclear translocation and nuclear export of the transcriptional repressor Bach1.
Activation of MAPK by environmental stresses and cytokines has also been implicated in ho-1
activation. (…) Reproduced with permission from Ryter et al., 2006.

73
The third general hypothesis is that alteration of intracellular thiol equilibrium via the
ratio of intracellular reduced vs. oxidized glutathione acts as a primary sensor for oxidative stress
(Ryter et al., 2006). This hypothesis originates in the observation that many inducers which
produce reactive oxidative species or can react with free thiol groups can consume, complex, or
reduce the availability of intracellular glutathione (Ewing and Maines, 1993; Lautier et al., 1992;
Naughton et al., 2002; Oguro et al., 1998; Rizzardini et al., 1994; Trakshel et al., 1991; Yoshida
et al., 1987). The main weakness in this hypothesis is requiring direct redox regulation of
transcription factors and while well characterized in bacteria they have been poorly investigated
in mammals. Ryter et al., suggest that the cytoplasmic factor Keap1 is a potential redox sensor
leading to the release of the bound substrate Nrf2, a transcription factor (Dinkova-Kostova et al.,
2002; Wakabayashi et al., 2004; Levonen et al., 2004) and may result in increased HO-1
expression.
1.8 Non Traumatic Role for HO-1
There is evidence that HO-1 plays a role in a variety of neurodegenerative conditions. In
Alzheimer disease (AD) it has been observed that plasma HO-1 and lymphocyte HO-1 mRNA
are reduced (Schipper et al., 2000), while at the same time senile plaques are known to display
elevated HO-1 co-localized with β-amyloid (Schipper et al., 1995) and it appears that β-amyloid
induces HO-1 expression (Pappolla et al., 1998). In Parkinson’s disease (PD) HO-1 is highly
expressed in Lewy bodies (Castellani et al., 1996) and oxidative stress has notably been shown to
increase HO-1 in a dopaminergic cell line (Yoo et al., 2003). In an intriguing study, a specially
modified form of HO-1 was shown to prevent MPTP induction of PD in a mouse model (Youn et
al., 2014). Other conditions including amyotrophic lateral sclerosis, Friedreich’s ataxia,

74
Huntington’s disease, and many others have also been studied, but less stringently than in AD
and PD and the current evidence in each case is unsettled.
1.9 HO-1 and Traumatic Brain Injury
As discussed above, TBI generates a heterogeneous collection of pathologies that can
often be broken down into two major types: focal or diffuse. Focal injury results in cortical
contusion, severe vascular damage, cell death and overt hemorrhage, frequently accompanied by
ischemia. Diffuse injury, in contrast, is primarily characterized by dispersed axonal injury,
minimal to moderate vascular disruption and reduced necrosis. This suggests that there are at
least two different injury paradigms where NVU and HO response may be linked to TBI.
Experimental models incorporating diffuse injury permit studies where the effects of the TBI on
the NVU can be more cleanly examined, as in the midline fluid percussion injury (Albert-
Weissenberger and Siren, 2010). Indeed NVU disruption and HO response are each
demonstrable in both grey and white matter sites within 24 hours following in a moderate level
midline fluid percussion injury as seen in Figure 1-6.

75
1.9.1 Figure 1-6: HO-1 Expression 1-7d Post-Injury

76
Figure 1-6. Showing HO-1 elevation 1-7d post midline fluid percussion TBI. Note
hemorrhagic/necrotic regions under the medial longitudinal fissure and in the white matter tracts
of corpus callosum. This is in contrast to non-hemorrhagic/necrotic regions in the auditory
cortex, hippocampus, thalamus, striatum and internal capsule.

77
Following midline fluid percussion injury (FPI) focal vascular hemorrhage and necrosis
causes an increase in HO-1, mostly likely through the gross efflux of red blood cells and release
of heme into the surrounding tissue. In regards to the NVU, the primary responsive cells are
leukocytes and microglia, which co-stain with both microglia/macrophage specific marker IBA1
and HO-1. These cells are found below the injury hub site and in white matter tracts (Phillips
Lab, unpublished data), an expected result given that heme can induce HO-1. This is in direct
contrast to the diffuse injury response seen in the hippocampus and auditory cortex of the same
animals. There, a more diffuse injury is expected which was, surprisingly, accompanied by
significant HO-1 up-regulation in cells co-staining with the astrocyte marker GFAP.
Interestingly, midline FPI is known to generate minimal hippocampal hemorrhage, with no gross
loss of either cell structure or evidence of cell death. This points to a parallel, non-hemorrhagic,
non-heme driven induction of HO-1.
HO-1 has been reported to increase after TBI by a variety of techniques including gene
chip, qRT-PCR, western blot, and immunofluorescence (Phillips Lab unpublished data,
(Raghavendra Rao et al., 2003; Fukuda et al., 1995)). Fukuda et al, observed HO-1 upregulation
within 24 hours following lateral FPI, leading to widespread signal at 72 hours before declining
at 5 days post-injury. Co-expression was primarily with microglia and astrocytes identified with
OX42 (microglia specific) and GFAP (Fukuda et al., 1996). The same group further observed
that a spinal cord injury model also demonstrated HO-1 elevation in microglia and macrophages
from 24 hours to at least 42 days post-injury (Mautes et al., 2000). They further established that
HO-1 was induced by hyperosmolar mannitol (Richmon et al., 1998) or heme injected into the
subarachnoid space (Turner et al., 1998). Further, HO-1 could be reduced by an Endothilin A

78
antagonist (Sato and Noble, 1998), stabilized the blood-spinal cord barrier (Lin et al., 2007a) and
reduced barrier disruption after injury (Yamauchi et al., 2004).
1.10 Novel Role in Traumatic Brain Injury Recovery
At the NVU HO-1 is most likely produced by astrocytes and microglia following TBI.
Indeed, the Noble group at UCSF has shown that after TBI HO-1 is elevated in both astrocytes
and microglia. HO-1 is at least partially induced as a result of direct heme interactions,
particularly at sites of microvascular bleeds and gross hemorrhage (Phillips Lab, unpublished
data). Conspicuously absent is HO-1 production in the endothelium, which is likely also elevated
but masked by the much greater response in the glia due to leakage of blood and its constituents
through the BBB. What is particularly interesting is that with midline FPI there is evidence of
HO-1 elevation in areas experiencing gross hemorrhage (such as the neocortex) as well as those
lacking hemorrhage (such as the hippocampus). This finding implies multiple activation
mechanisms are responsible for post-injury HO-1 increase or that there are hemorrhagic
processes currently unidentified. Transient ischemia or mild hypoxia present one potential
mechanism for NVU injury in the hippocampus but this is clouded by the alternatives of
increased inflammatory cytokines, eicosanoids, or ionic dysregulation, all driven by changes in
the BBB, perhaps resulting from local mechanical shear stress.
Diagram 1. A proposed novel pathway for HO-1 driven ECM modulation
It has become clear that HO-1 has a number of tissue effects that may play a role after
injury. The first is in heme clearance that has been addressed previously. A simple proposed
pathway for this role is outlined in Diagram 1 where free heme causes an increase in HO-1
Trauma ↑Heme ↑HO-1↑free iron↑LCN2↑MMP9 activation↑ECM modulation

79
leading to increased free ferrous iron. This in turn leads to an increase in the iron scavenger
Lipocalin 2 (LCN2) and resulting increased activation of MMP-9, a collagenase involved in
tissue remodeling. At each step there are also branch points with multiple additional effects
including local vasodilation as a result of CO release and antioxidant activity of biliverdin
mediated through biliverdin reductase. This suggested pathway provides an HO-1 driven effector
of tissue remodeling though this pathway is somewhat spatially restricted. It is expected that HO-
1 operating near the vasculature or within the luminal side of the NVU basal membrane would
allow for rapid egress of ferrous iron and other breakdown products from the brain while HO-1
operating further into the parenchyma may result in iron accumulation locally in the tissue. This
may explain the reported benefit from endothelial cell up-regulation of HO-1 via sulphoraphane
in an ischemic hypoxia/reperfusion model (Alfieri et al., 2013) while also addressing toxicity
concerns associated with Parkinson’s Disease (Castellani et al., 1996; Yoo et al., 2003).
A second role appears to be as a novel cytoprotective, anti-inflammatory protein with
neuroprotective potential, though this role is both spatially and situationally complex. In a
number of disease states that lack hemorrhage HO-1 pharmacologic up-regulation has been
shown to be beneficial, including in hepatic encephalopathy (Jiang et al., 2009), Alzheimer’s
Disease (Barone et al., 2014), and Parkinson’s Disease (Cuadrado and Rojo, 2008) . This may be
due to HO-1’s ability to degrade porphyrins and potentially prevent Cytochrome C heme C
degradation products from activating pro-apoptotic Bcl2 family proteins. This role is made more
difficult to understand, since baseline HO-1 increase in AD is associated with worse pathology.
These divergent views can be unified when considering HO-1 as both a sensor and effector of
pathology and recovery. In this view high HO-1 in AD indicates an underlying pathology that
activates HO-1, possibly in a glutathione mediated way, and further HO-1 induction can be

80
beneficial. However, this is in contrast to PD where HO-1 also likely indicates an underlying
pathology but further induction becomes negative due to the tendency of HO-1 to degrade heme
(including intracellular heme) and the weak ability of dopaminergic neurons to remove the
excess iron that results. The situation becomes even more complex when it is noted that even in
the absence of apparent hemorrhage LCN2, an iron scavenger and transporter, is significantly
up-regulated in areas also demonstrating increased HO-1 expression. Additionally, both CO and
Biliverdin/Bilirubin produced by HO-1 are known to be neuroprotective in low concentrations
and yet grossly neurotoxic at high concentrations.
From the previously observed expression of HO-1 after TBI and knowledge of the NVU
structure I propose three scenarios where HO-1 expression in the NVU affects injury recovery,
each characterized by a different primary cell response.
The first situation is an endothelial driven response where HO-1 pre-injury induction in
the endothelium occurs as a result of circulating HO-1 activators that act on the endothelial cells
without penetrating into the brain parenchyma. In this situation HO-1 acts to stabilize the
endothelial tight junctions (TJ) as noted previously (Lin et al., 2007a; Yamauchi et al., 2004).
This likely has two effects: reducing BBB disruption and also limiting heme efflux when
disruption occurs. Further, via receptor mediated transport free heme may be taken up by the
endothelium and processed with degradation products expelled back into the circulation limiting
buildup of Biliverdin or iron within the brain parenchyma.
The second situation causes a microglial driven response to gross heme influx in
situations of hemorrhage and necrosis, where microglia and other macrophages are selectively
recruited and highly express HO-1 in an effort to degrade heme. This would primarily follow the

81
most classical pathway of heme induction of HO-1 but HO-1 may also drive the activation of
MMP9 via LCN2 upregulation as described in Diagram 1. This case notably involves the gross
disruption of the NVU by MMP activation to result in significant degradation of basal the lamina
and cellular architecture.
The third situation would involve an astrocyte driven response where thiol/glutathione
disruption caused by the breakdown of endothelial TJ and basal lamina permits efflux of
undesired molecules. In this case HO-1 may be elevated in an effort to assist TJ integrity as well
as an anti-apoptotic to prevent astrocyte cell death after being flooded with undesirable
metabolic waste products not effectively removed from the brain parenchyma. This situation
lends itself to the possibility of persistent activation of HO-1 if trapped waste products
continually disrupt the glutathione redox balance. This would negatively impact the cell and
surrounding parenchyma by continual slow accumulation of iron from the degradation of
intracellular non-hemoglobin heme sources.
1.10.1 Pharmacological Inducers of HO-1
A number of chemical inducers of HO-1 expression have been identified by confirmation
of increases in mRNA, promotor activity, protein expression, or enzymatic activity. An excellent
summary chart of these compounds has been published by Ryter et al 2006, which is partially
reproduced below. It is noteworthy that generalized cell stress is frequently sufficient to cause an
induction somewhere along the HO-1 pathway though this level of induction is highly variable.
Of particular interest to my study are two inducers: Hemin (Heme) and Sulforaphane. The first
is the natural substrate of HO-1 and is commercially available as Heme Chloride or Heme
Arginate. In various forms it is approved for human medical use as a treatment of acute
intermittent porphyria. It has been shown to reliably increase HO-1 expression and is somewhat

82
selective in how it triggers the generalized antioxidant transcriptional response. In brief, Hemin
is processed identically to endogenous heme, it is taken in by phagocytic cells and is reduced
from Heme to Biliverdin and then Bilirubin releasing CO, and Fe along the way. Fe has been
identified as one of the major players in the feed-forward mechanism of HO-1 amplification and
as Hemin is degraded it induces increased expression of HO-1. The major proposed pathway for
heme driven HO-1 amplification revolves around the Nrf2 repressor protein Keap1. Keap1
functions as an antioxidant sensor and when disrupted it releases bound Nrf2 allowing for
increased transcription of the consensus ARE sequence genes which include HO-1. Along the
way Fe is also active in increasing reactive oxidant species locally and triggering iron response
element gene expression.
Sulforaphane, in contrast, has a different mechanism of action that ultimately increases
HO-1. Sulforaphane is an organosulfur isothiocyanate molecule that is derived from
Brassicaceae vegetables (e.g. mustards, brussels sprouts). The isothiocyanates generally function
as weak electrophiles and due to their properties are effective in triggering cellular antioxidant
sensors without providing a large pro-oxidant stimuli. Sulforaphane has been proposed to
activate HO-1 via the Nrf2 repressor protein Keap1 via specific cysteine residue binding and
appears to be effective at causing separation of Keap1 from Nrf2 leading to an increase in HO-1
expression (Hu et al., 2011). In this context the molecule does not trigger increased HO-1
expression through its action as a substrate and it does not produce potentially cytotoxic
molecules along the way.
1.10.2 A Proposed Mechanism for HO-1 Induced Cytoprotection after TBI
In a typical TBI there is local extravasation of erythrocytes from damaged blood vessels
into the surrounding brain parenchyma. The erythrocytes then proceed to spontaneously lyse

83
over the course of 24-72 hours with a significant initial delay after the injury which is coincident
with a decrease in CD47 (Cao et al., 2016; Lu et al., 2014). When the red cells begin to lyse they
do so in response to the local tissue environment (pH, stasis, temperature, cytokines, etc) and
appear to lyse en masse with a large bolus of hemoglobin and heme released simultaneously. The
result is quick saturation of the HO enzymes and rapid breakdown of heme which releases
cytotoxic species. As HO-1 processes the substrate it experiences feed forward amplification and
the ARE sequence is recruited to increase various buffering molecules that limit the potential
cytotoxic effects of heme catabolism. Due to the nature of the feed forward process the
production of buffering molecules necessarily lags behind the inducing stimulus which, in this
case, is a collection of molecules that need to be buffered proximally.
This provides a few key pieces of information that are fundamental to the present thesis
of HO-1 role in response to TBI. We know that: 1. a traumatic injury to the NVU has occurred
and that a bleed/s is/are likely concurrent, 2. the damaging effects of the bleed have a temporal
delay, 3. the enzyme responsible for heme degradation is controlled by a transcriptional
promotor that also controls expression of buffering compounds. As a direct result, we have
foreknowledge of future injury that the tissue is not yet responsive to. The underlying proposed
hypothesis is straightforward: early induction of HO-1 will be coincident with increased
production of buffering compounds which then limit peak of HO-1 feed-forward signal, resulting
in a net HO-1 reduction, attenuation of the ‘peak bolus’ of cytotoxic compounds and more stable
substrate processing. A corollary hypothesis is that if such regulation of HO-1 expression is
accomplished the reduction in cytotoxic insult will lead to improved histopathological and
behavioral outcomes after TBI.

84
The proposed experiments will first establish post-injury response of select HO-1
pathway molecules following diffuse midline FPI, then test if early HO-1 induction through IP
injection of either Hemin or Sulforaphane (delivered 1 hour after FPI) will affect extent of
pathobiology or behavioral deficits. This approach has potential for translational value in that it
could identify safe, acute post-injury treatments to reduce the consequences of initial NVU
damage and permit a greater functional recovery over time after injury.
1.11 Choice of FPI as Experimental Model
There are multiple experimental models of TBI and the midline FPI, using a mild-
moderate injury, was chosen as being most applicable to this study. Examples of other
commonly used injury models include Blast Injury, Controlled Cortical Impact (CCI), and
Weight Drop Models which will be addressed in turn.
Blast injury models seek to replicate the shockwave induced injury that originates from
high speed propagating air waves as a way to model blast injuries that typically occur from
explosives (e.g. in a wartime setting). The severity of injury is modified by adjusting the peak
overpressure and impulse that is experienced by the animal with typical injuries occurring in the
10-20 psi range (~0.7-1.5 ATM overpressure). The model is a closed head model that avoids
some of the concerns surrounding the surgical preparation involved in other TBI models but is
somewhat limited due to the substantial differences between shockwave induced injuries and
focal or diffuse impact injuries. The insult is effective at modeling blast damage to the brain but
has historically shown several unexpected differences when compared to other injury models
(VandeVord, P., 2017-03-01 VCU Traumatic Brain Injury Seminar Series).

85
Controlled Cortical Impact models provide a well characterized set of focal TBI injuries (Dixon
et al., 1991). A craniectomy surgery is performed to expose the intact dura and then an impactor
tip is forced against the surface of the brain with speed, depth, tip type, and dwell time all
varying to induce different degrees of highly reproducible injury. The resulting injury is focal in
nature and tends to be both grossly hemorrhagic and necrotic, typically applied laterally. When
adjusted to produce a mild insult there have been competing reports as to whether mTBI in this
model is able to produce behavioral deficits due to the required restrictions on speed, depth, and
dwell time.
Weight drop models use a free falling weight which strikes either the intact skull or
exposed dura to produce an injury. The height and mass of the object dropped can be adjusted to
alter the severity of the injury. The most popular variant of the weight drop insult is the
Marmarou model of Impact Acceleration (Petraglia et al., 2014; Marmarou et al., 1994; Foda and
Marmarou, 1994) which uses a plate attached to the animal skull to prevent fracture and gives
the animal a degree of freedom to allow the head to move resulting in a largely diffuse injury that
avoids contusion or hippocampal cell death.
The mechanics of the midline Fluid Percussion model are interrelated with each of the
other models, as they all share specific commonalities and differences (Petraglia et al., 2014). In
the fluid percussion model a craniectomy is performed and a fluid overpressure pulse is applied
to the intact dura (Sullivan et al., 1976). The result is a direct pressure wave injury contained
within the skull that avoids hemorrhage at the impact site while producing extensive diffuse
injury throughout the brain, including in the neocortex and hippocampus (Dixon et al., 1987).
Depending upon severity, the model can produce hemorrhage in specific susceptible tissue
regions while inducing widespread axonal and neuronal injury. The injury is characterized by the

86
overpressure that is used though some consider subject LOC time to be a better metric since the
in line position of the pressure sensor could influence the measurement of pressure delivered to
the animal. This model provides a diffuse tissue injury similar to some aspects of the blast and
CCI models and allows for a midline injury like the weight drop and blast injuries, however, it
avoids impact site hemorrhage, and generates a broad injury effect within many areas of the
brain that is well characterized.
We selected midline FPI as a model of choice for this study because we sought to model
human mild-moderate diffuse TBI. Although this rat model demonstrates reasonably sized white
matter hemorrhages characteristic of moderate injury, the model also provides a dynamic range
of tissue damage across other brain regions. For example, the hippocampus is largely non-
hemorrhagic, yet known to be functionally damaged in the model, while the neocortex which
frequently shows small frank petechial hemorrhages originating along the gray/white matter
interface and along a subset of radially oriented blood vessels (notably not at the hub site where
the overpressure is applied). Thus, FPI allows for the direct comparison between distinct injury
sites with and without overt hemorrhage. In this dissertation study I will first examine whether
such hemorrhagic differences affect the response of injury-induced HO-1 pathway proteins by
contrasting cortical and hippocampal regions (it is important to note here that while the
neocortex has overt hemorrhage it is not overwhelmingly hemorrhagic/necrotic). Next, I will
determine if acute pharmacological modulation of HO-1 response will change the time course of
structural and behavioral recovery. This approach has value in that it offers promise for
discriminating the role of HO-1 pathways in brain regions vulnerable to milder, non-contusional
forms of injury and probes whether HO-1 manipulation can alter TBI pathology or functional
outcome. Since the absolute size of the bleeds in this rat model are consistent with those seen in

87
human mTBI, we proffer that information about the recovery of rat hemorrhagic tissue in FPI
would also closely match that seen in milder forms of human TBI.
1.11.1 The Hippocampus as a TBI Model
1.11.1.1 Structure and Function
The hippocampus is a seahorse shaped structure in primates located in the medial
temporal lobe. It is selected for study in TBI models due to prominent its role in learning and
memory along with the associated cortical regions which make up the hippocampal formation.
The hippocampal formation is divided into six anatomical areas: the subiculum, the
hippocampus proper (further divided into four cornu ammonis (CA) sectors CA1-CA4), the
dentate gyrus, the presubiculum, the parasubiculum, and the entorhinal cortex. The CA fields are
comprised of pyramidal neurons whose cell bodies form the pyramidal later (stratum
pyramidale). Basal dendrites of these neurons are located in the stratum oriens while apical
dendrites extend to the stratum radiatum, lacunosum, and moleculare. CA dendrites receive a
variety of inputs from both the Direct and Trisynaptic (indirect) perforant pathways. The dentate
gyrus is divided into the hilus/polymorph layer, the granule cell layer (GCL; stratum granulare,
containing the cell bodies of the granule neurons), and the stratum moleculare containing the
dendrites of the granule cells. These granule cell dendrites receive stratified inputs from the
perforant pathway originating in the entorhinal cortex as the initial part of the Trisynaptic
pathway.
Circuitry in the hippocampus is both internal and external – externally information is
shared reciprocally with the structures of the limbic system as well as the entorhinal cortex, other
associated cortices, and the septum. Flow of information within the hippocampus is largely

88
unidirectional and the major pathway is known as the ‘Trisynaptic Circuit’. The main output
pathway of the entorhinal cortex is the perforant pathway which perforates the subiculum to
project mainly into the granule cell layer of the dentate gyrus (with some projections into CA1
and CA3). Dentate gyrus axons known as mossy fibers then pass information to CA3 pyramidal
cell dendrites. CA3 axons, known as Schaffer Collaterals, next loop to CA1, whereupon CA1
axons project back to the entorhinal cortex. This whole process involves three synapses EC-DG,
DG-CA3, and CA3-CA1 which provide the circuit with its name.
Damage to the hippocampus generally results in memory impairment and disorientation
(Eichenbaum et al., 2007; Nadel et al., 1975) and early observations led to the discovery of long
term potentiation or LTP (Bliss and Lomo, 1973). LTP was first identified by Bliss and Lomo in
1973 noting that repetitive stimulation of the performant path fibers to the dentate area of the
hippocampus led to reduced firing latency and increased spike amplitude in dentate granule
neurons (Bliss and Lomo, 1973). This has since been expanded into a more generalizable model
of synaptic/circuit development where increased stimulation leads to a strengthened pathway and
has been observed in all portions of the Trisynaptic pathway (Kandel et al., 2013). The corollary
of long term depression (LTD) also exists where loss of stimuli leads to decreased synapse
strength and functionality. There are three main historical theories of hippocampal function that
have come in and out of vogue over the years; Behavioral Inhibition, Memory, and Spatial
Theory. The behavioral inhibition theory was the first described by Jeffrey Gray (Gray and
McNaughton, 2003) who noted that animals with hippocampal damage tended to by hyperactive
leading to the conclusion that the hippocampus was useful in inhibiting overactive behavior. The
memory theory was produced from the treatment observations of a certain Patient HM who in an
attempt to alleviate his epileptic seizures had his hippocampi surgically destroyed. The result was

89
that Patient HM suffered from severe anterograde amnesia as well as partial retrograde amnesia
where he could not produce new memories moving forward but was still able to remember
events from his childhood leading up to several days/weeks before his surgery. The last theory is
the spatial map theory which is based off the observations that electrode recording data show that
specific hippocampal regions in a rat brain lit up when in specific spatial locations suggesting
that the hippocampus is involved in developing a spatial map of the surrounding environment
(O'Keefe and Conway, 1978). The specific cells have since been characterized as ‘place cells’
which in network form a ‘place field’ and they develop within minutes of entering a new
environment and maintain stability for weeks-months afterwards (Kandel et al., 2013). When
assembled together all three theories share commonalities in memory consolidation/encoding and
situational awareness.

90
1.11.2 Figure 1-7: Mid-Dorsal Coronal Section of Rodent Brain

91
Figure 1-7. This image is from the Allen mouse brain atlas. A section through the mid-dorsal
hippocampal formation (HPF) is illustrated, showing the major cell layers. In our FPI model
we primarily induce tissue damage in the somatosensory cortex and auditory cortex overlying the
hippocampus, as well as hemorrhagic bleeds in the white matter of the corpus callosum.

92
1.11.2.1 Hippocampal Plasticity
The two principle mechanisms of CNS plasticity, neurogenesis and synaptogenesis, are
both activated after injury in the hippocampus. The hippocampus is well established as one of the
limited adult brain regions with continued neurogenesis (Gould, 2007). In the DG the
subgranular zone generates neuronal precursors and the process is stimulated by CNS injuries
including both focal and diffuse TBI (Kernie et al., 2001; Dash et al., 2001; Bye et al., 2011).
The subgranular zone precursors are capable of differentiating into neurons/glia and migrate to
the injured tissue enhancing cognitive recovery (Magavi et al., 2000; Sun et al., 2005; Sun et al.,
2007). Treatments with VEGF after TBI have demonstrated increased neuronal differentiation
and improve neurological recovery in conjunction with decreased lesion volume (Thau-Zuchman
et al., 2010). New neurons migrate to the granule cell layer integrating into the circuits of the
dentate gyrus molecular layer (ML) and the cornus ammu of the hippocampus (Dash et al.,
2001; Emery et al., 2005).
Previous studies have well established injury induced synaptogenesis in the hippocampus
after TBI with associated synaptic sprouting and synapse replacement (Steward et al., 1988;
Scheff et al., 2005). Our laboratory has shown this is in part mediated by the ECM and its
interactions with MMPs and CAMs (Falo et al., 2006; Falo et al., 2008; Harris et al., 2011;
Warren et al., 2012; Chan et al., 2014). Others have demonstrated the acute phase of this process
is reliant on inflammatory processes to include cellular phagocytosis of damaged tissue
(Morganti-Kossmann et al., 2002). Neurogenesis and synaptogenesis has been directly linked to
robust microglial response following TBI (Sun et al., 2005; Bye et al., 2011). It has been
suggested that examining molecules with specific time dependent expression during the process
of post-injury repair may lead to identifying targets for possible therapeutic intervention.

93
1.11.3 The Neocortex as a TBI Model
1.11.3.1 Structure and Function
The neocortex is the outer layer of neural tissue in the brain and plays key roles in higher
order brain function including cognition, sensory perception, language, and memory. The
previously described hippocampus is part of the allocortex, characterized by having only 3-4
neuronal cell layers in contrast to the remaining neocortex, which has 6 layers of neuronal cell
bodies.

94
1.11.4 Figure 1-8: Simplified Cortical Excitatory Circuits

95
Figure 1-8. Simplified diagram of excitatory neurocortical circuits. Reproduced with permission
from Allene et al., 2015.

96
The various layers of the neocortex have extensive connections between adjacent regions
and layers and the size of each layer is highly dependent on specific region of the neocortex and
form of processing that locally occurs. Layer I (outermost) is the molecular layer and consists
mainly of apical dendritic tufts of pyramidal neurons and laterally oriented axons. Staining with
Golgi Stain demonstrates an absence of cell bodies in this layer. Layer II/III is the external
granule cell layer/external pyramidal layer consisting of small pyramidal neurons/stellate
neurons and midsized pyramidal neurons respectively that receive extensive input from Layer I
and layers IV/V. Layer IV is the internal granular layer and is the main recipient of thalamic
sensory input. Layer IV projects laterally and to layers II/III. Layer V is the internal pyramidal
cell layer which receives extensive input form layers II/III, and is the primary output pathway
from the neocortex. Lastly layer VI (innermost) is the polymorph/multiform layer which receives
input from sensory thalamus and projects to adjacent layer VI and IV. The cell bodies in Layer
VI are variable and blend into the white matter forming the deep limit of the neocortex. As may
be evident from the description, the structure of the neocortex is highly integrated with continued
projections within and between layers and within and between regions.
During traumatic brain injury a variety of models produce differing degrees of cortical damage.
For example, CCI injury if sufficiently severe can completely obliterate the neocortex on one
side down to layer VI. In our rat mild-moderate midline FPI model we observe frank hemorrhage
extending from the white matter into Layer VI, with small petechial disruption of vasculature
occasionally seen in the overlaying cortical field and on the pial surface (see Figure 1-6).
Relative to cell replacement after injury, there has been some debate over whether neurogenesis
exists in the neocortex, with some limited evidence shown that neural precursors can exist in the
neocortex (Li et al., 2015; Whitman and Greer, 2009). More recent studies in a rat model of

97
ischemia have found that during CNS injury neurogenesis does occur in the neocortex but the
neurons failure to mature (Li et al., 2015). Extension to humans is even weaker and a rather neat
experiment using adult subjects older than 18 in 1945 (and thus post radioisotopes released by
atomic weaponry; “bomb pulse” dating (Pravalie, 2014; Speller et al., 2012) however
demonstrated that while more C14 (radioactive Carbon Isotope) was found in some hippocampal
sub populations of neurons this increase was absent in the neocortex suggesting that adult
neurogenesis did not occur (Bhardwaj et al., 2006); admittedly, for our purposes, this was not in
the context of CNS injury.
1.11.4.1 Brain Injury and Cortical Plasticity
Cortical plasticity is dependent on both local synaptogenesis and long range axonal
sprouting. As previously mentioned neurogenesis is largely absent and the current dearth of
strong evidence suggests that the contribution of neurogenesis to recovery plasticity may be
trivial. It has been suggested that a large part of behavioral recovery after injury may be simply
due to alternative circuit reactivity underlying overall behavioral compensation (Whishaw et al.,
1991; Cirstea and Levin, 2000). There is also a suggestion that the peri-injury regions near
damaged tissue, particularly the vulnerable NVU, may play a more significant role in
neurological recovery (Cramer et al., 1997; Jaillard et al., 2005; Teasell et al., 2005).
Neuroanatomical changes occur with significant neurite outgrowth 3-14 days post injury
(Stroemer et al., 1995). To some extent the absence of a true neurogenic process can make
cortical recovery difficult to study due to an absence of definitive markers of neuronal
replacement. This particularly presents a problem when moving from small animal models into
human patients. As an example, the recovery of physically small (but appropriately sized)
infarcts in a rat model of stroke may be relatively easy to overcome due to the very limited

98
distance of axonal sprouting necessary to bridge the damaged or destroyed tissue. In a human
with a comparable proportionally sized injury, the distance required for regenerating axons to
achieve synaptic repair is significantly larger from a cellular perspective. To date, one of the few
treatments to show potential for cortical neuroprotection after TBI in human patients has been
the combination hypothermia and hematoma evacuation, in a study occurring at the University of
Pittsburgh (D. Okonkwo Neurotrauma 2016 presentation,
https://clinicaltrials.gov/ct2/show/NCT02064959)
1.11.5 Hypotheses Tested and Dissertation Organization by Chapter
Based upon established TBI pathobiology and the concurrent induction of HO-1, we
hypothesize that the time course of HO-1 response can be manipulated pharmacologically to
drive early post-injury rise in HO-1, attenuating the ‘peak bolus’ of cytotoxic compounds and
resulting in more stable substrate processing. Under such manipulation, the injured tissues will
have higher acute levels of iron buffering, which, in turn, would limit peak of HO-1 feed-forward
signal for a net HO-1reduction and more stable enzyme activity over time post-injury. We posit
that such regulation of HO-1 expression will reduce cytotoxic insult and lead to improved
histopathological and behavioral outcomes after TBI.
In the following chapters we report results of two studies which test these hypotheses,
examining post-injury consequences of HO-1 heme processing and the effects of acute
treatments to manipulate HO-1 response in a rat midline FPI model of mild-moderate traumatic
brain injury. Chapter 2 will discuss observed regional differences in heme processing proteins
between non-hemorrhagic (hippocampal) and hemorrhagic (neocortical) tissue. We find that
even tissue classically interpreted as non-hemorrhagic still demonstrates a robust HO-1/heme
processing-like response. Chapter 3 will discuss the effect of two heme processing treatment

99
paradigms, Hemin and Sulforaphane, exploring how they each affect HO-1 pathway response
and the extent of behavioral recovery after injury. We find that both treatment paradigms are
effective at attenuating the heme processing response and improving acute (1-3d) outcome in
motor behavior, but only one treatment is effective at inducing long term (11-15d) improvement
in cognitive behavior. Chapter 4 will then complete the document, providing a discussion of how
the present results extend our understanding of HO-1 role in TBI, suggest novel therapeutic
options and give direction for possible future studies in the field of neurotrauma.

100
2 Chapter 2
Chapter 2
HO-1 and Heme Processing Response Following Traumatic Brain Injury

101
2.1 Abstract Chapter 2
Heme Oxygenase 1 (HO-1) is the inducible form of the rate limiting enzyme in heme
catabolism. HO-1 is highly upregulated in circumstances of hemorrhage and undergoes forward
feedback amplification via the transcription factor Nrf2 which itself can be induced by the
products of heme catabolism. As such, an acute increase in HO-1 substrate (heme) causes an
acute spike in HO-1 expression in the tissue. Since there has been some uncertainty about the
extent of hemorrhage in diffuse injury after traumatic brain injury (TBI) we sought to examine
the expression of HO-1 along with several other markers of hemorrhage in tissues that are known
to experience limited frank hemorrhage (the neocortex) contrasted to tissues that are largely
absent of hemorrhage (the hippocampus). This work was performed in a central fluid percussion
model of TBI which generated a mild-moderate injury with characteristic diffuse axonal injury
throughout the tissue and limited hemorrhage originating in the white matter tracks overlaying
the lateral ventricles which typically extends into layers V and VI of the neocortex. We tracked
our observations through 15d post-injury. Our results showed striking similarities in the
hippocampal and cortical measures of HO-1 regardless of observed hemorrhage in the tissue. In
both cases HO-1 expression peaked at 3d and expression was notably higher relative to Sham in
the hippocampus compared to the neocortex. This finding was consistently supported by
measurements of other injury and hemorrhagic markers. The iron scavenging protein Lipocalin 2
(LCN2) was markedly elevated at 1d post-injury and had expression ~10 fold higher in the
hippocampus. Ferritin, an iron storage protein and marker of prior hemorrhagic injury, was
similarly elevated in both tissues, peaking at 7d and while expression was higher at 7d in the
neocortex the hippocampus showed persistent elevation through 15d that was higher than the

102
neocortical measure. These results appear to show that there is a consistent underlying
hemorrhagic processing response which occurs in both the hippocampus and neocortex and is
suggested that the underlying process may be generalizable in diffuse injury.

103
2.2 Introduction Chapter 2
Traumatic Brain Injury (TBI) is an enduring public health burden that to date has been
resistant to therapeutic intervention. Fundamental to understanding how to treat TBI is
deconstructing the multimodal injury that occurs into discrete parts that can be studied. Many
different animal models have been developed as a result, each tending to produce a characteristic
injury representative of one or another aspect of TBI. To further understand the diffuse injury
that frequently develops after TBI we have documented the post-injury time course of heme
processing using a central fluid percussion injury (FPI) model.
Classically diffuse injury has been characterized by extensive point disruptions of the
axolemma in long axons and has been interpreted to be relatively independent of other injury
process (e.g. gross tissue necrosis or hemorrhage related damage). It has been previously noted
in more hemorrhagic models of TBI that heme processing proteins, including HO-1, are
upregulated after injury. Our prior observations with gene chip assay showed that HO-1 was
consistently elevated in all brain regions examined and in both rat and mouse tissue. We found
this curious since the model used has been characterized as demonstrating limited hemorrhage
largely restricted to the corpus callosum and white/grey matter (WM/GM) interface. Nonetheless
our samples universally demonstrated upregulation even in tissue (the hippocampus) that has not
been described as hemorrhagic in this model.
This is interesting for a variety of reasons. Free heme has been well characterized as
inducing local tissue pathology (Chang et al., 2005). The blood brain barrier/neurovascular unit
(BBB/NVU) and its relative impermeability to blood constituents provides a unique condition for

104
tissue heme processing/elimination, and metabolites of heme are known to have cytotoxic
properties (Ryter et al., 2006; Chang et al., 2005). In our application of the FPI, we tend not to
observe overt bleeds in the hippocampus but it remains possible that there might be a minor,
undetected hemorrhagic process that underlies the injury. The role of this potentially undetected
change in the NVU is the main focus of the first portion of this study. We hypothesized that the
hippocampus may experience heme injury pathology that has not been previously identified and
this may be a secondary component of diffuse injury that, to date, has not been recognized as
significant. Towards this end we examined the change of heme driven response molecules within
the injured hippocampus and compared these results to change in the same proteins within the
neocortex overlaying the major WM/GM interface bleed, which includes small petechial
hemorrhages.
The characteristic injury in the FPI model is diffuse axonal injury, a process that occurs
through a mechanism whereby focal membrane disruption in the axolemma leads to ion
dysregulation, cytoskeletal disruption, and axonal functional impairment, resulting in persistent
neurocognitive dysfunction. It is possible that a similar effect may occur in the NVU since the
relatively fine membrane shearing that results in axolemmal damage could similarly result in
disruption of cell membrane-basal lamina connections, even in the absence of gross tissue
displacement. To date no successful treatments for TBI induced axonal injury have been
demonstrated and we are interested in exploring if an underlying heme processing response is
complicating the known injury process to affect treatment efficacy.

105
2.2.1 Figure 2-1: Pathway of Heme Metabolism

106
Figure 2-1: The pathway of heme metabolism. Heme oxygenase enzymes (HO; E.C. 1.14.99.3;
heme-hydrogen donor: oxygen oxidoreductase) catalyze the rate-limiting step in heme
metabolism. Both HO enzymes (HO-1 and HO-2) oxidize heme (ferriprotoporphyrin IX) to the
bile pigment biliverdin-IXα.The reaction requires 3 mol of molecular oxygen and
NADPH:cytochrome P-450 reductase as a source of electrons. The cleavage of the heme ring
releases the coordinated iron, as well as the α-methene bridge carbon as carbon monoxide (CO).
The principal HO reaction product, biliverdin-Ixα, is further metabolized to bilirubin-Ixα by
NAD(P)H:biliverdin reductase (BVR). M, methyl; V, vinyl; P, propionate. Pathway of Heme
Metabolism reproduced with permission from Ryter et al., 2006.

107
Heme Oxygenase 1 (HO-1) is the inducible form of the rate limiting enzyme in heme
catabolism. HO-1 catabolizes heme into the potential neurotoxins carbon monoxide (CO), Iron
(Fe), and Biliverdin by cleaving heme at the alpha-methene bridge which directly releases CO
and removes the binding stability of Fe in the center of the Heme structure leaving behind the
open metalloporphyrin Biliverdin (Figure 2-1). HO-1 is induced by a variety of stimuli, chief
amongst them heme substrate itself, and HO-1 has a high degree of specificity for free heme (e.g.
heme B unbound by hemoglobin or neuroglobin) over other forms of heme or metalloporphyrins
(Kutty and Maines, 1982; Maines et al., 1986; Maines, 1988; Yoshinaga et al., 1982). Heme B
only accumulates in tissue under pathologic conditions (Maines, 1988) and has known
pathogenicity that results both from its own effects and those of its breakdown products (Huang
et al., 2002; Maines and Trakshel, 1993; Regan and Panter, 1996; Ryter et al., 2000; Wu et al.,
2003). Heme and the products of heme catabolism have been shown to be individually bioactive
(Platt and Nath, 1998). Two major enzymes exist to degrade heme, HO-1 the inducible form and
HO-2 the constituently expressed form. HO-1 has been shown to be the dominant form involved
in erythrocyte senescence, but there have been conflicting reports after CNS injury as to which
form predominates. In large part this is likely to be due to time dependent changes in expression
as HO-1 requires an induction trigger. Additionally, a rather unique aspect of hemorrhage is that
extravasated erythrocytes require several days before they are lysed/phagocytosed and release
their cytosolic stores of heme in a process that appears to be mediated by CD47 loss.
Previous studies have shown elevations of HO-1 in grossly hemorrhagic models of brain
injury and in this study we examine HO-1 expression using a model of diffuse mixed
mild/moderate TBI with minimal hemorrhage, contrasting a region which experiences small

108
frank bleeds (neocortex) with a region that generally lacks hemorrhage (hippocampus). The
study is performed within rat midline FPI, a model that is frequently chosen to study the cellular
effects of diffuse brain injury. Here we examine time dependent differences of induced HO-1
expression and hemorrhage between two brain regions known to be selectively vulnerable to
diffuse injury: the neocortex and the hippocampus (Farkas and Povlishock, 2007). Both brain
regions are associated with the well characterized neurocognitive deficits that persist after injury,
showing variable recovery 7-30d post injury depending on injury severity, metric, and test
sensitivity. The well-defined time course of reactive synaptogenesis underlies the capacity for
this post-injury recovery, having clear early degenerative and later regenerative phases. Key to
our interest in the HO-1 pathway is the rapid rise in IBA1+ and GFAP+ reactivity that occurs ~3-
4d post-injury associated with debris clearance and axonal degeneration. Moreover, this early
degeneration exactly matches the rise in IBA1+, GFAP+ reactivity known to occur in response to
hemorrhage and suggests that there may be a mixed or co-signaling interaction between reactive
glia and HO-1pathways. That is, brain regions known to be particularly affected by aggressive
immune cell scavenging may be responding not only to local axonal pathology but also to nearby
heme driven activation.
In this first study, we propose to map time dependent changes in HO-1 after rat midline
FPI, correlating these measures with markers of heme catabolism, tissue damage and
extracellular matrix (ECM) proteins critical to tissue remodeling. To understand how these
molecules relate to the parallel process of synaptic recovery, animals were grouped into select
cohorts whose brains were harvested for fresh tissue homogenates (hippocampus and neocortex)
or aldehyde tissue perfusion (whole brain) on days 1, 3, 7, 14/15 post-injury.

109
2.3 Methods Chapter 2
2.3.1 Experimental Animals
The procedures in this study met national guidelines for the care and use of laboratory
animals with all experimental protocols approved by the VCU Institutional Animal Care and Use
Committee (IACUC). Male Sprague-Dawley rats (290-360g, ENVIGO, Huntingdon, UK) were
used in these experiments, housed in pairs when possible under a temperature (22oC) and
humidity (66%) controlled environment with food and water provided ad libitum and subjected
to a 12 hour dark-light cycle. Rats were randomly assigned to either TBI (n=26), or Sham-
injured (n=21) groups and evaluated at 1d, 3d, 7d, or 14d/15 post-injury by WB or
immunohistochemistry (IHC). For all analysis Sham-injured animals served as controls for the
TBI animals.
2.3.2 Surgical Preparation for Rat Central Fluid Percussion Injury
Twenty-four hours prior to central fluid percussion injury animals underwent surgical
preparation to mitigate acute inflammatory response confounding. Rats were anesthetized with
4% isoflurane in carrier gas (70% N2O, 30% O2) for 4 minutes, heads shaved, and maintained on
2% isoflurane in carrier gas delivered via nose cone for the duration of the surgery. Surgical site
is cleaned with iodine solution followed by 70% ethanol and a surgical drape placed over the
animal. Body temperature was maintained at 37oC via heating pad (Stryker, Kalamazoo, MI),
and animal vital signs (heart rate, arterial oxygen saturation, respiratory rate, pulse distention,
and breath distention) monitored via pulse oximeter (MouseOX; Starr Life Sciences, Oakmont,

110
PA). While under anesthesia rats were secured in a stereotaxic device (Harvard Apparatus,
Holliston, MA) via ear bars and a midline incision used to expose the cranium to permit a
midline sagittal craniectomy midway between the lambda and bregma sutures of 4.8 mm
diameter to allow visualization of intact dura mater. Two 3/16 in steel machine screws were
implanted into the skull 1 cm from craniectomy center in the 1st and 3
rd quadrants. The
craniectomy was fitted with a modified (tapered) Luer Lock hub (2.6 mm i.d.) fixed with
cyanoacrylate adhesive. Additional stability is provided using dental acrylic (Coltene/Whaledent,
Inc., Cuyahoga Falls, OH) to secure screws and Luer Lock hub into a single complex. The hub
was finally filled with saline to limit clotting and tissue damage prior to injury. The incision
wound was sutured over the complex and treated with triple antibiotic ointment and lidocaine.
Animals were monitored for post-surgical stress in a heated holding cage during the acute
recovery phase prior to being returned to their home cage.
2.3.3 Central Fluid Percussion Injury
The fluid percussion injury device consists of a weighted pendulum and a 0.9% saline
filled acrylic cylinder (Custom Design and Fabrication, Petersburg, VA) which is fitted with a
metal pressure transducer (Entram Devices, Inc., model EPN-0300-100A). Injury is induced by
releasing the weighted pendulum from a pre-determined empirically derived height which strikes
a greased rubber piston on one end of the cylinder producing a pressure wave which injects a
small volume of saline into the dura of the animal attached to the other end of the cylinder via
the Luer Lock fitting (Figure 2-2;(Dixon et al., 1987). Height of the pendulum corresponds
monotonically with injury peak pressure which in turn corresponds with injury severity. Twenty-
four hours after preparative surgery, animals were anesthetized 4% isoflurane in carrier gas for 4

111
minutes and given a scalp incision to expose the hub complex. Animals were then attached to the
fluid percussion device by filling the hub with sterile 0.9% saline to ensure a seal free of air
bubbles and clots. Animals then received a mild-moderate fluid percussion injury (2.0 ± 0.1
ATM overpressure) via saline injection into the closed cranial cavity. The pressure pulse was
measured by the transducer and displayed on an oscilloscope (Tektronix 1000 S, Beaverton, OR)
and the peak of the pressure wave recorded. Prior to recovery of consciousness, the hub was
removed and the incision sutured closed and treated with topical triple antibiotic and lidocaine.
To determine and confirm injury severity, reflexes (tail, paw, ear, corneal blink) and righting
times were recorded prior to acute recovery. Sham injured animals underwent the same surgical
preparation and hub removal procedures but did not receive central fluid percussion injury. For
Sham injured animals reflexes and righting time were not recorded as they do not differ from
naïve anesthesia treated animals.
2.3.4 Protein Extraction
Rats were anesthetized with 4% isoflurane in carrier gas (70% O2, 30% NO2) for 4 min
and sacrificed by decapitation at the appropriate experimental interval 1, 3, 7, 15d after
FPI/Sham injury. Neocortex trimmed of white matter and obvious hemorrhages sampled from
the central square of a 3x3 grid arranged on the surface was collected along with whole
hippocampal bulbs trimmed of any extraneous tissue (n=4-7/group). Tissue samples were
homogenized on ice in 250 uL of RIPA Lysis Buffer (EMD Millipore, Billerica, MA) with
cOmplete protease inhibitor + EDTA (Roche Diagnostics, Mannheim, Germany) prior to
separation via 14,000 g centrifugation for 20 min at 4oC. Supernatant was aliquoted and stored
with separated nuclear pellet at -80oC. Protein concentration of extract was determined using

112
Pierce BCA Protein Assay Reagent kit (Thermo-Fisher, Waltham, MA) on a Fluostar Optima
plate reader (BMG Labtech, Inc., Cary, NC).

113
2.3.4.1 Figure 2-2: cFPI Device

114
Figure 2-2: Diagram of fluid percussion model of brain injury. A 4 mm central craniectomy
central craniectomy is connected to one end of a Plexiglass cylinder filled with physiologic
saline. At the other end in the cylinder is a Plexiglas cork mounted on O-rings. Injury is
produced by striking the cork with a 4.8 kg pendulum dropped from a specific height. The
pressure transient is recorded on a storage oscilloscope with an extra-cranial transducer. Figure
and text reproduced with permission from Dixon et al., 1987. In our paradigm we note several
small changes including a central craniectomy 4.8 mm in diameter and the addition of a firm
rubber tip on the end of the cylinder cork.

115
2.3.5 Western Blotting
Western Blot (WB) analysis was carried out using Bio-Rad products on their Criterion
Gel system using 18 or 26 lane Criterion XT Bis-Tris Gels (Hercules, CA). 50 or 25 ug of
protein were prepared in XT Sample Buffer with XT Reducing Agent and homogenized prior
being denatured at 95oC for 5 mins. Samples were electrophoresed on 4-12% or 12% gels in
MOPS running buffer at 200v for 45 min (after 50v x 5 min stacking period) or until tracking
dye approached the gel foot. Protein was transferred onto PVDF or Nitrocellulose membranes at
100v for 1 hour in a Tris-Glycine buffer with 10% methanol (MeOH). Post-transfer the
remaining protein on the gels was stained with 0.1% Coomassie Brilliant blue in 40%
MeOH+10% glacial acetic acid (HOAc) overnight prior to de-stain and visualization to confirm
even protein load and transfer. Meanwhile, membranes were rinsed with nano-pure deionized
water before buffering with Tris-buffered saline (TBS) and blocking for 1 hour with 5% non-fat
milk in TBS with 0.5% Tween (mTBST). Membranes were incubated with appropriate antibody
at 1:1K or 1:2k (see Table 2-1) dilution overnight at 4oC. After incubation, membranes were
washed with mTBST and then incubated with the appropriate HRP-linked secondary for 1 hour
at room temperature. Membranes were then washed in TBST to remove excess non-specific
signal and finally in TBS to remove tween surfactant effects. Membranes were visualized via
chemiluminescence using Super Signal West Dura Extended Duration Substrate (Thermo-Fisher,
Waltham, MA). Quantitative data was collected using a Syngene G:Box with protein bands
subjected to densitometric analsysis using Gene Tools software (Syngene, Frederick, MD).
Protein data was expressed as fold change relative to time matched Sham control animals
processed on the same membrane. Confirmation of load control was determined using beta actin

116
(Sigma-Aldrich, St. Louis, MO) with a known caveat that signal may modestly change during
TBI.
2.3.6 Tissue Fixation
Rats were anesthetized with 4% isoflurane in carrier gas (70% O2, 30% NO2) for 4 min
with sodium pentobarbital (400 mg/kg IP) and sacrificed via transcardial perfusion; flushed with
0.9% saline with a clamped descending aorta and snipped right atrium. When perfusion runs
clear tissue is perfused with 4% paraformaldehyde in phosphate buffer (0.1 M NaHPO4,
pH=7.4). Once tissue was fixed whole intact brains were removed from the cranium and placed
in excess tissue fixative for 24 hours prior to transfer into 0.03% NaN3 in 1.0 M Phophate
Buffered Saline (PBS) and storage at 4o C. Prior to utilization for immunohistochemistry tissue
was blocked and sectioned into 40 um coronal slices using a Leica Vibratome (VT1000S; Leica
Biosystems Inc., Buffalo Grove, IL). Sections were stored separated and organized in PBS +
Azide at 4oC.
2.3.7 Immunohistochemistry
Free floating sections were selected based on rostral-caudal position and permeabilized in
5% peroxidase for 30 mins. Tissue was washed in PBS and the blocked using fish gelatin in PBS
+ 0.05% triton X-100. Tissue was incubated overnight with primary antibody in blocking buffer
(see Table 2-2) at 4oC. The following day sections were washed with PBS prior to further
blocking for 30 minutes and incubated with secondary fluorescently tagged antibody in blocking
buffer for 2 hours at room temperature. Sections were then washed in PBS, rinsed in Phosphate

117
Buffer to remove salt artifact and mounted on Superfrost Plus slides (Fisher Scientific,
Pittsburgh, PA), and allowed to air dry. When dry sections were coverslipped using Vectashield
+ DAPI (Vector Laboratories, Burlingame, CA). Fluorescent signal was visualized on a confocal
Zeiss LSM 700 (Carl Zeiss, Thornwood, NY), on an apotome Zeiss AxioImager M2 (Carl Zeiss,
Thornwood, NY), or on a widefield Olympus BX51 (Olympus, Tokyo, JP).
2.3.8 Statistics
The effects of injury condition and time post-injury were evaluated using the statistical
software R using 2-way Analysis of Variance (ANOVA) analysis with post hoc TukeyHSD
pairwise analysis of major effects. Pairwise analysis of timecourse interactions were computed
using t-tests with Benjamini-Hochberg correction. In circumstances where the assumption of
normality is violated, as observed via qualitative analysis Q-Q intervals and Cook’s distance,
data was normalized via log transform and timecourse interactions detected using Wilcoxon-
Mann-Whitney tests. Western Blot and Zymography results are reported as mean ± standard
error of the mean (SEM). In all cases the analysis is done using two tailed tests where
appropriate and with an alpha level of 0.05. Further, zymogram results involve multiple
gelatinase metrics located on the same gel and are further analyzed via Multivariate Analysis of
Variance (MANOVA) prior to subgroup ANOVA.

118
2.3.9 Table 2-1 Antibodies used in Western Blot Experiments
Antibody
Target
Antibody
Host and
Type
Antibody
Source and
Serial
Number
Typical
Secondary
Used 1:15k
Typical
Membrane
Used
Concentration
Used
HO-1 Rabbit,
Polyclonal
Stressgen,
ADI-OSA-
150
Harlan,
611-103-122,
Goat anti-
Rabbit
PVDF 1:1k
1:2k
FTL Goat,
Polyclonal
ABCAM AB
Thermofisher
Santa Cruz,
SC-2352,
Bovine anti-
Goat
PVDF 1:2k
LCN2 Goat,
Polyclonal
R&D
Systems
AF3508
Santa Cruz,
SC2352
Nitrocellulose 1:1k
2.3.10 Table 2-2: Antibodies used in Immunohistochemistry Experiments
Antibody Target Antibody Host
and Type
Antibody Source
and Serial Number
Typical
Secondary Used
1:1k
Concentration
Used
HO-1 Rabbit,
Polyclonal
Stressgen,
ADI-OSA-150
Alexa-488 1:300
FTL Goat,
Polyclonal
ABCAM AB
Thermofisher
Alexa-488/594 1:300
LCN2 Goat,
Polyclonal
R&D Systems
AF3508
Alexa-594 1:200
GFAP Chicken,
Polyclonal
Encor
Biotechnologies
Alexa-594 1:200
IBA1 Goat, Polyclonal AB5076 Alexa-594 1:300

119
2.4 Chapter 2 Data
We began our study of heme processing and manipulation by observing the endogenous
progression of a hemorrhagic injury over time. Rats were surgically prepared with a day -1
craniectomy with a hub implant attached to their skull midline between lambda and bregma. Rats
received a cFPI injury ~2.0 ATM overpressure with righting times ~7:00 minutes. After injury at
periodic survival intervals select animals were anesthetized and perfused for later tissue
histology.
We observed that heme pigment was easily identifiable in coronal tissue sections at 1d
and 3d post injury with a significant reduction to near absence at 7d post injury (Figure 2-3). At
1d we see a loose organization of bleeds that seem to originate in the white matter of the
callosum and along the grey/white interface into cortical layer VI. No observable bleeds are
found in the hippocampus though occasional heme pigment is observed adjacent to the alveus.
At 3d post injury the bleeds have both condensed cellularly and reached their point of maximum
expansion concurrently with cortical thinning compressing the bleed boundary and a portion of
the red heme pigment has shifted towards a yellowish color indicative of bilirubin, heme’s
degradative product (Figure 2-4). At 7d Heme pigment is largely absence though limited
quantities of bilirubin pigment are still observable and cortical thinning has continued.
In general even though we are using a midline cFPI model we only occasionally see signs
of injury or tissue disruption underneath the hub site. Instead the major locus of bleed in our
model appears to be in the white matter tracks of the corpus callosum and along the white

120
matter/gray matter interface with bleeds frequently extending into layer VI neocortex and
occasionally further to layers V & IV.

121
2.4.1 Figure 2-3: Widefield Hemorrhage after cFPI 1-7d Post-Injury
500 um

122
Figure 2-3: Widefield 4x single neocortex images (A-C) showing typical progression of bleed
resolution 1d (A), 3d(B), and 7d(C) post injury. At 1d pigment is typically seen as a reddish-
brown discoloration of the tissue. By 3d (B) some pigment has been reduced and deposits of iron
begin to appear via Perls stain (blue pigment). By 7d (C) minimal heme is seen with some
bilirubin (yellow pigment) observed and notable deposits of iron are observed.

123
2.4.2 Figure 2-4: Enlarged view of 3d Post-Injury Hemorrhage
1 mm

124
Figure 2-4: Widefield 4x single neocortex image showing a detailed perspective of a typical
bleed at 3d post-injury showing both reddish heme pigment and yellowish bilirubin concurrent
with Perls stain in higher detail. Particularly contrast the dense reddish pigment seen in the l inset
compared to the thinner and more processed r inset which shows generalized shift towards
yellow pigment with blue pigment (iron deposits) scattered around the periphery.

125
After examining the progression of heme pigment we next examined the expression of
HO-1, the inducible form of the enzyme responsible for heme processing in the tissue.
We observe that HO-1 is greatly elevated after TBI (Figure 2-5). In 4x widefield images
it is apparent that there is a high degree of immunoreactivity throughout the neocortex that
overlays bleed injuries in the WM-WM/GM interface. Frequently we found this injury to
variably lateralize and frequently one side demonstrated a more severe and expansive bleed.
Higher magnification (10x) reveals extensive expression directly adjacent to the bleed sites
(though with some autofluorescence artifact due to the bleed) and in the hippocampus. There is
increased expression in the dentate gyrus and molecular layer or CA1. Over time we see
consolidation of HO-1 expression; at 1d we see bright immunofluorescence that appears to
remain stable through 3d before declining from 7d-15d. We also observe that over time the cells
that most highly express HO-1 are found in different positions progressively. In the hippocampus
HO-1 expression in the inferior dentate molecular layer disappears after day 3 while expression
persists in the superior molecular layer and expands across the hippocampal fissure into the
molecular layer of CA1.

126
2.4.3 Figure 2-5: HO-1 Response to Injury Over Time
2 mm
1 mm

127
Figure 2-5: Widefield 4x (A-C) and 10x (D-G) tile scans of HO-1 progression overall (A-C) and
the hippocampus (D-G) over time. Note broad expression of HO-1 near the bleed with general
consolidation of signal 1-3d and signal reduction 7d+.

128
2.5 HO-1 Change Neocortex vs Hippocampus
We proceeded to utilize confocal microscopy at 20x to observe co-expression with other
cell marker proteins (Figure 2-6) we observed that HO-1 was highly reactive in both the
neocortex and the dentate gyrus after injury and in the concentrations of HO-1 used for staining
there is nearly no signal observed in Sham animals. In both the dentate gyrus and in reactive
neocortex HO-1 appears to primarily co-express with GFAP+ cells with only occasional IBA1+
crossover.

129
2.5.1 Figure 2-6: Acute Changes in HO-1 vs GFAP or IBA1 in Hippocampus and Neocortex
100 um

130
Figure 2-6: Confocal 20x 1d Injury (A-B, E-F) vs Sham (C-D, G-H) HO-1 expression paired
with cell marker labels for astrocytes (GFAP) and microglia (IBA1). Note essentially no HO-1
expression in Sham animals and prominent reactivity in injured animals. Further, note that HO-1
coexpresses most frequently with GFAP.

131
In order to examine net changes in tissue expression of HO-1 we sampled animals 1-15d
after injury at select intervals (1,3,7,15d) bilaterally taking cortical samples trimmed of white
matter and any observable interface bleeds as well as whole hippocampal bulb samples.
We observed that HO-1 significantly increased in both Neocortex and Hippocampus after
injury with an expression peak at 3d post-injury (Figure 2-7). In the neocortex ANOVA using
the model 𝑽𝒂𝒍𝒖𝒆~𝑫𝒂𝒚 ∗ 𝑪𝒐𝒏𝒅𝒊𝒕𝒊𝒐𝒏 showed significant main effects due to Day, Condition,
and their interaction (p =4.992e-07, 1.094e-07, 4.992e-07 respectively). TukeyHSD post-hoc
analysis of group effects showed a TBI-Sham comparison of p < 2e-16. Pairwise Wilcoxon daily
comparisons with Benjamini-Hochberg correction showed there is a significant increase in
expression vs Sham by 1d (555 ± 57%, p = 0.0257), peak expression at 3d (1317± 218%, p =
0.0065), declining at 7d (237± 42%, p = 0.0556), and dropping to near Sham levels though
maintaining significance at 15d (137± 11%, p = 0.0410).
In the hippocampus ANOVA using the model 𝑽𝒂𝒍𝒖𝒆~𝑫𝒂𝒚 ∗ 𝑪𝒐𝒏𝒅𝒊𝒕𝒊𝒐𝒏 showed
significant main effects due to Day, Condition, and their interaction (p = 0.0005406, 0.0036844,
0.0005406). TukeyHSD post-hoc analysis of group effects showed a TBI-Sham comparison of
p= 0.0017829. Pairwise Wilcoxon daily comparisons with Benjamini-Hochberg correction
showed there is a modest increase in expression by 1d post-injury (228± 50%, Not Significant),
peak expression at 3d (2037± 589%, p =0.033), declining at 7d (234± 33%, p = 0.049), and
dropping to near Sham levels at 15d (141± 25%, Not Significant).
In both tissues we demonstrated increases in HO-1 peaking at 3d which is consistent with
literature observations and the expected timeline of heme degradation but seems somewhat at
odds with our cell staining particularly in widefield images. In large part we attribute the

132
perceived brighter signal in the widefield images as a partial image artifact due to widespread
autofluorescence of heme in the necrotic site causing a washout effect paired with diffuse cell
reactivity that condenses and organizes 1-3d post-injury.

133
2.5.2 Figure 2-7: HO-1 Western Blot Time Course 1-15d

134
Figure 2-7: Western Blot expression of HO-1 in Sham vs TBI 1-15d post-injury. HO-1 is
significantly elevated by 1d in the neocortex and peaks in expression at 3d post-injury. The
hippocampus shows an early elevation at 1d which is significant and peaks at 3d. In the
neocortex this elevation drops to near Sham by 15d but is still significantly elevated. In the
hippocampus expression is significantly elevated through 7d and elevated but not significant at
15d. Note that 1d relative expression is higher in the neocortex but expression peaks highest in
the hippocampus. (Mean ± SEM, n=5-7/group; Wilcoxon-Test with Benjamini-Hochberg
correction, *, **, *** for p < .05, .005, .0005 respectively; ANOVA p < 5*10^-8 Neocortex, p <
5*10^-3 Hippocampus)

135
Having established the timeline of HO-1 expression in the tissue we next turned to
looking at which cells expressed HO-1 during the progression.
We observed that in the neocortex there are two distinct regions (here described as
hemorrhagic/necrotic and reactive) of HO-1 reactivity and their associated glia change
depending on location. Away from bleeds the reactive neocortex shows expression of HO-1 that
appears to organize and peak 1-3d post injury and is characterized by co-expression with GFAP+
cells that persists through 15d (Figure 2-8). There is occasional but limited co-expression
observed in IBA1+ cells and these instances increase when imaging closer to the necrotic injury
sites. In contrast when directly imaging near the necrotic site (Figure 2-9) there is extensive co-
expression of HO-1 in IBA1+ cells that are both on the boundary of the injury site and pervasive
through them. HO-1+ GFAP+ positive cells are observed directly backing against these HO-1+
IBA1+ cells. Of particular note is the correlation of HO-1+ IBA1+ cells with capillaries inside or
near the bleed site which appears to show IBA1+ cells highly reactive for HO-1 extravasating
into the tissue.

136
2.5.3 Figure 2-8: HO-1 and Glial Reactivity in Reactive Neocortex 1-7d Post-Injury
100 um

137
Figure 2-8: 20x Confocal images of reactive neocortex 1-7d showing expression of HO-1 with
IBA1 (A-C) or GFAP (D-F). Note co-expression of HO-1+ and GFAP+ cells 1-7d and general
absence of co-expression with IBA1.

138
2.5.4 Figure 2-9: HO-1 and Glial Reactivity in Necrotic Neocortex 3-7d
100 um

139
Figure 2-9: Confocal 20x images of neocortex near necrotic site 3-7d showing expression of
HO-1 with IBA1 (A-B) or GFAP (C-D). Note extensive coexpression of IBA1 and HO-1 at both
3d and 7d (A,B) and only limited coexpression with GFAP (C) which appears absent at 7d.
Insets (E,F) show HO-1+ IBA1+ cells with significant vessel association and possible
extravasation.

140
We then turned to the hippocampus and particularly the dentate gyrus which is spared of
any direct observable hemorrhagic injury. We observed that HO-1 shows an organizing response
in the hippocampus with increased expression at 1d post injury that is bright but largely confined
along the dentate gyrus polymorph layer/molecular layer boundary. At all time points HO-1
primarily co-stains with GFAP+ positive cells identified as astrocytes. As time continues at 3d
and 7d expression appears to shift towards the hippocampal fissure and at 7d and 15d post injury
the majority of expression is limited to the molecular layer of CA1. Throughout there appears to
also be an increase in HO-1 expression associated with the vessels of the hippocampal fissure
which occasionally co-stain with GFAP+ but in other instances are indeterminate in origin,
morphologically most likely endothelial cells or pericytes.

141
2.5.5 Figure 2-10: HO-1 and Reactive Glia in Hippocampus 1-7d Post-Injury
100 um

142
Figure 2-10: Confocal 20x images of the dentate gyrus 1-7d showing HO-1 co-expression with
IBA1 (A-C) or GFAP (E-G). Note that HO-1 appears to primarily co-express with GFAP+ cells
and appears over time to shift from directly adjacent to the granule cell layer outwards into the
molecular layer towards the hippocampal fissure. D,H show the 7d expression in the molecular
layer superior to C,G, showing that expression of HO-1 has shifted superiorly.
143
2.5.6 Summary of Observations in HO-1
HO-1 is significantly elevated after injury with significant elevation at 1d, peak
expression at 3d, and sustained elevation through 7d or 15d (Hippocampus and Neocortex
respectively). Reactivity in areas without bleeds appears to be primarily astrocytic (GFAP+) in
nature while near bleeds HO-1 expression is dominantly expressed by IBA1+ positive cells and
there are multiple instances of what appear to be transvasating macrophages highly expressing
HO-1.
The pattern of cellular expression also shifts over time. In the hippocampus initial
expression of HO-1 is largely restricted to the dentate gyrus molecular layer immediately
adjacent to the granule cell layer. As time proceeds expression shifts further out into the
molecular layer towards the hippocampal fissure and by 7d there is increased expression in the
molecular layer of CA1. Throughout this shift in location HO-1 is dominantly expressed by
GFAP+ cells.
In the neocortex there are two distinct regions of HO-1 expression: directly near bleed
sites (and their associated necrotic tissue), and in the cortical layers that overlay bleeds. Directly
near the bleed sites there is time dependent organization and recruitment of HO-1 expressing
cells that are predominantly IBA1+ cells that strongly express HO-1. This process appears to
peak at 3d and by 7d we see significant consolidation of expression and reduction in the necrotic
site with very reduced DNA karyorrhexis observed (DAPI shmear). In direct contrast the cortical
layers overlaying these bleeds primarily express HO-1 in astrocytes and are more uniformly
dispersed throughout the reactive tissue.

144
2.6 FTL Change Neocortex vs Hippocampus
After establishing the time course of HO-1 after injury we proceeded to examine the
effect that HO-1 driven heme processing had on the expression of the known iron storage protein
FTL and its association with the iron sequestration/trafficking protein LCN2. The intent is to
observe the paired responses of an acute iron sequestering protein that can be expected to be
upregulated with increased heme catabolism as well as a long term marker of iron deposition
associated with long term pathological damage. We observed that LCN2 peaked acutely at 1d in
the tissue and that FTL appeared to lag behind HO-1 and LCN2 expression before peaking at
around 7d after injury. After this point FTL declined through 15d as deposited iron is cleared. In
the neocortex (Figure 2-11) this is clearly seen in tile scans near the necrotic site. There is a
large halo of LCN2 surrounding the bleed and as time advances the periphery and then the center
begins to lose autofluorescense and begin to stain for FTL. This is similarly seen in the
hippocampus (Figure 2-12, Figure 2-13) where the 1d upregulation of LCN2 is associated with
the vessels in the hippocampal fissure and as time progresses shifts towards the superior granule
cell layer of the dentate gyrus concurrent with increased FTL expression.
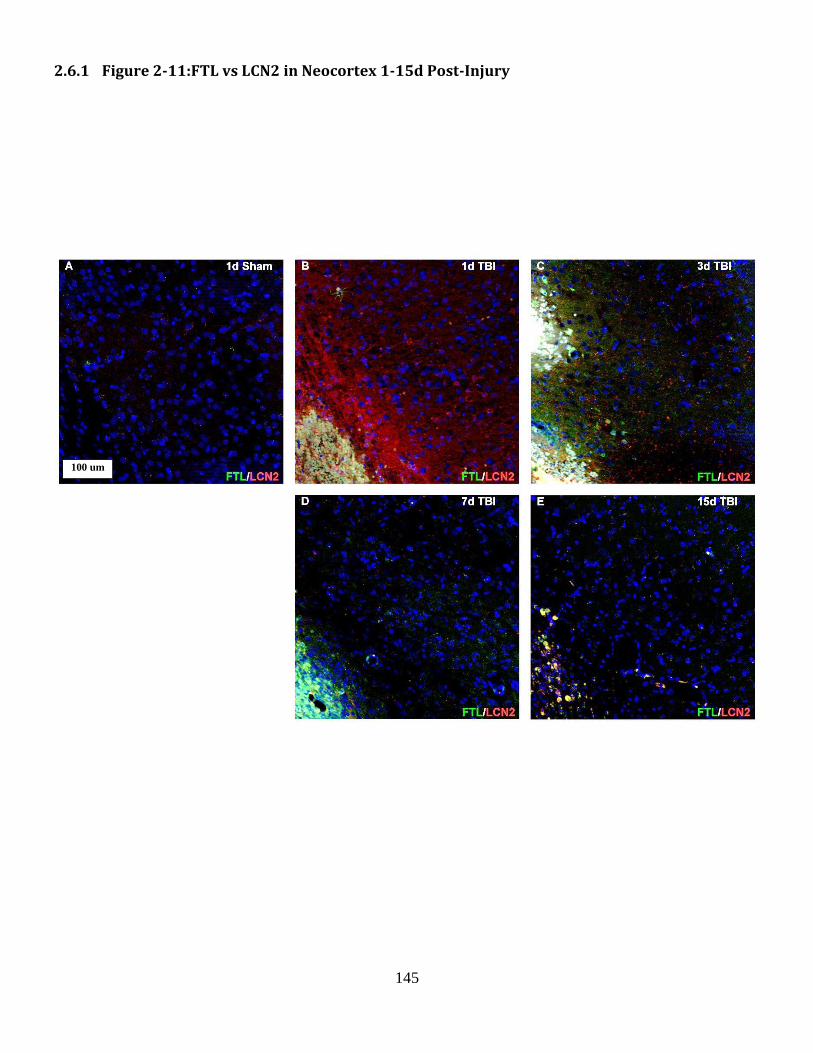
145
2.6.1 Figure 2-11:FTL vs LCN2 in Neocortex 1-15d Post-Injury
100 um

146
Figure 2-11: 20x Apotome tile scans of neocortex showing expression of FTL and LCN2 over
time after sham surgery (A), and 1d,3d, 7d, and 15d (B-E respectively), after TBI. Note minimal
expression of FTL in sham injured tissue or in 1d TBI that is markedly increased at 3d and 7d.
LCN2 expression that peaks at 1d declines as FTL increases. Note that autofluorescence of
erythrocytes and vessels is not out of imaging range in the 1d and 3d tissue. Further note extreme
focal points of high FTL expression at 3d which consolidates through day 7 (time of WB peak
expression), and declines through 15d while remaining notably elevated compared to Sham.

147
2.6.2 Figure 2-12:FTL vs LCN2 in Hippocampus 1-15d Post-Injury
100 um

148
Figure 2-12: 20x Apotome tile scans of hippocampus showing expression of FTL and LCN2
over time after sham surgery (A) and 1d,3d,7d,15d TBI (B-E). Note absence of FTL or LCN2 in
Sham animal with steady increases in FTL 1-7d in scattered populations. Additionally note
LCN2 expression peaking at 1d in the molecular layer and then organizing along the dentate
granule cell layer.

149
2.6.3 Figure 2-13: FTL vs LCN2 Hippocampal Fissure 1-7d Post-Injury
50 um

150
Figure 2-13: 20x Confocal images of the hippocampal fissure 1-7d showing association of
vessels with FTL and LCN2 and the switchover from acute to long term iron sequestration over
time.

151
Western blot analysis of FTL protein after injury shows a similar story. We observed that
Ferritin was significantly increased vs Sham in both the neocortex and hippocampus after injury
with peak expression at 7d. In the neocortex ANOVA using the model 𝑽𝒂𝒍𝒖𝒆~𝑫𝒂𝒚 ∗
𝑪𝒐𝒏𝒅𝒊𝒕𝒊𝒐𝒏 showed significant main effects due to Day, Condition, and their interaction
(p=0.001451, 4.062e-05, 0.001451). TukeyHSD post-hoc analysis of group effects showed a
TBI-Sham comparison of p= 0.000271. Pairwise Wilcoxon daily comparisons with Benjamini-
Hochberg correction showed there is no change in expression at 1d (95±20%, Not Significant),
rising at 3d (206±26%, p = 0.038), peaking at 7d (377±82%, p = 0.083), and declining to near
Sham levels by 15d (136±13%, p = 0.100).
In the hippocampus ANOVA using the model 𝑽𝒂𝒍𝒖𝒆~𝑫𝒂𝒚 ∗ 𝑪𝒐𝒏𝒅𝒊𝒕𝒊𝒐𝒏 showed
significant main effect only due to Condition (p= 0.0002949). TukeyHSD post-hoc analysis of
group effects showed a TBI-Sham comparison of p= 0.0002324). Compared to the neocortex
there is greater diversity in the injured sampling and pairwise Wilcoxon daily comparisons with
Benjamini-Hochberg correction show that by 1d after injury there is already an initial rise in
expression (163±28%, p = Not Significant) which continues to rise through 3d and 7d
(202±44%, p = 0.091, and 291±54%, p=0.089 respectively). Interestingly, peak expression from
7d is largely maintained through 15d in the hippocampus (237±68%, p = 0.089).

152
2.6.4 Figure 2-14: FTL Western Blot 1-15d Post-Injury

153
Figure 2-14: FTL is significantly elevated in the Neocortex at 3d, peaking at 7d and remaining
modestly elevated through 15d. In the Hippocampus FTL at 1d is elevated and progressively
increases through 7d largely maintain the 7d peak through 15d. (Mean ± SEM, n=5-7/group;
Wilcoxon-Test with Benjamini-Hochberg Correction. •,*, **, *** for p < .10, .05, .005, .0005
respectively; ANOVA p < 5*10^-4 Neocortex, p < 5*10^-4 Hippocampus)

154
2.6.5 Summary of Observations in FTL
Ferritin lags behind HO-1 in increased expression which is reasonably expected since the
primary driver of Ferritin expression is an increase in iron that results from HO-1 activity. In
immunohistochemistry it is difficult to identify increases in FTL expression over background
until significant organization of iron sequestration has been organized which is most easily seen
in the neocortex that experiences in situ bleeds.
The neocortex responds exactly as expected, lacking a significant driver of expression at
1d there is no rise in expression. By 3d (when HO-1 activity peaks), and especially at 7d (when
heme substrate has been depleted) FTL expression continues to rise before decreasing through
15d as iron is progressively cleared and consolidated in the tissue.
Rather unexpectedly we observe in western blot that FTL expression rises within 1d after
injury (though without significance). Further, while peak expression of FTL is less than in the
neocortex it appears to persist with greater effect through 15d. To some extent it is difficult to
ascertain the meaning of this rise since the increased FTL expression is widely dispersed and not
particularly remarkable histopathologically.

155
2.7 LCN2 Change Neocortex vs Hippocampus
Concurrent to our observations of FTL which had strong crossover with LCN2 we also
looked independently at LCN2 expression in the tissue.
We observed that LCN2 is highly expressed acutely after injury and is largely expressed
in the same regions as HO-1 (Figure 2-15). Expression of LCN2 is extraordinarily scarce in the
uninjured brain and is essentially undetectable in Sham animals. The expression of LCN2 also
appears to be entirely in the same set of cells that also express HO-1 at 1d after injury (Figure
2-16).

156
2.7.1 Figure 2-15: Acute HO-1 vs LCN2 Hippocampus Widefield
1 mm

157
Figure 2-15: 10x widefield hippocampus tile scans of HO-1 and LCN2 in 1d TBI or Sham
Animals. Note the extensive expression of HO-1 and LCN2 in the injured animal and the near
absence of signal in the Sham, particularly the LCN2 Sham.

158
2.7.2 Figure 2-16: Acute HO-1 vs LCN2 Hippocampus and Neocortex Confocal
100 um

159
Figure 2-16: 20x confocal 1d TBI (A,B) and Sham (C,D) stained for HO-1 and LCN2. Note that
in both the Hippocampus (A,C), and the Neocortex (B,D) there is a near complete absence of
expression in the Sham animal while there is extensive co-localization of HO-1+ LCN2+ cells in
the injured animal.

160
We further observed that while HO-1 appears to maintain expression 1-3d before
declining 7d+, LCN2 immediately declines in expression after 1d post injury (Figure 2-17). By
7d post-injury LCN2 is essentially unidentifiable in the samples observed.

161
2.7.3 Figure 2-17: HO-1 vs LCN2 Hippocampus 1-7d Post-Injury Widefield
1 mm

162
Figure 2-17: 10x widefield tile scans of HO-1 (Green) and LCN2 (Red) 1-7d post injury. Note
organizing expression of HO-1 with shifts of expression from the superior dentate molecular
layer into the molecular layer of CA1. Further, note the high expression of LCN2 1d post injury
steadily degrades to near absent signal by 7d.

163
In order to confirm and strengthen the observations of the immunohistochemistry data we
further examined LCN2 expression via western blot 1-7d post injury (Figure 2-18).
We observed that LCN2 expression vs Sham peaks by 1d after injury and declines
exponentially through 7d. In the neocortex ANOVA using the model 𝐥𝐨𝐠[𝑽𝒂𝒍𝒖𝒆]~𝑫𝒂𝒚 ∗
𝑪𝒐𝒏𝒅𝒊𝒕𝒊𝒐𝒏 showed significant main effects due to Day, Condition, and their interaction
(p=0.0002544, 1.040e-08, 5.188e-07 respectively). TukeyHSD post-hoc analysis of group effects
showed a TBI-Sham comparison of p<2e-16. Pairwise Wilcoxon daily comparisons with
Benjamini-Hochberg correction showed that LCN2 peaks at 1d post injury (5845±1328%, p =
0.0179), declines at 3d (618±203%, p = 0.0087), and is at Sham levels by 7d (109±3%, Not
Significant).
The hippocampus in contrast peaks much higher than the neocortex and persists in
significant elevations through 7d. ANOVA using the model 𝐥𝐨𝐠[𝑽𝒂𝒍𝒖𝒆]~𝑫𝒂𝒚 ∗ 𝑪𝒐𝒏𝒅𝒊𝒕𝒊𝒐𝒏
showed significant main effets due to Day, Condition, and their interaction (p=4.161e-09,
2.044e-13, 1.934e-09). TukeyHSD post-hoc analysis of group effects showed a TBI-Sham
comparison of p<2e-16. At 1d post injury we observed peak expression (47486±9761%, p =
0.0159), a decline at 3d (2893±976%, p = 0.0087) and approaching Sham levels at 7d (129±5%,
p = 0.0238).

164
2.7.4 Figure 2-18: LCN2 Western Blot 1-7d Post-Injury

165
Figure 2-18: LCN2 peaks immediately after injury notable for having ~10,000% elevations 1d
after injury. This peak progressively declines and is shown here in log scale. Elevation steadily
declines through 3 and 7d and in the neocortex is at Sham levels by 7d, while being significantly
but modestly elevated at 7d in the Hippocampus. (Mean ± SEM, n=5-7/group; Wilcoxon-Test
with Benjamini-Hochberg Correction, *, **, *** for p < .05, .005, .0005 respectively; ANOVA p
< 5*10^-5 Neocortex, p < 5*10^-4 Hippocampus).

166
2.7.5 Summary of Observations in LCN2
LCN2 is an acute phase protein involved in iron sequestration that is massively elevated
immediately after injury. To a good degree the extreme elevations seen are to an extent
trivialized due to the extreme paucity of LCN2 in Sham animals which is difficult to detect either
in IHC or western blot. In both the neocortex and hippocampus LCN2 is co-expressed with HO-1
in nearly every cell that expresses either protein though this effect is more difficult to detect as
LCN2 expression declines. This decline notably coincides with FTL increase which makes sense
given their respective roles in iron sequestration and storage.

167
2.8 Gelatinase Response Neocortex vs Hippocampus
To further study the impact of injury in the two tissue regions examined we also looked at
zymography of MMP2 and MMP9 which have been associated with post-TBI injury and
recovery (Figure 2-19). It is important to note that LCN2 (discussed previously) is known to be
a persistent activator of Active-MMP9 activity in both human and rodents.
We observed that in the neocortex MANOVA using the model
[𝑷𝒓𝒐𝑴𝑴𝑷𝟗,𝑨𝒄𝒕𝒊𝒗𝒆𝑴𝑴𝑷𝟗,𝑴𝑴𝑷𝟐]~𝑫𝒂𝒚 ∗ 𝑪𝒐𝒏𝒅𝒊𝒕𝒊𝒐𝒏 with Wilks correction showed
significant main effects due to Day, Condition, and their interaction (p=1.006e-07, 4.584e-09,
1.363e-07). Derivative single enzyme ANOVA show MMP2 with a significant main effect in
condition only (p= 7.616e-09) while Pro-MMP9 and Active-MMP9 have significant main effects
in Day, Condition, and their interaction (Pro-MMP9: p=6.669e-09, 5.565e-07, 5.389e-09
respectively; Active-MMP9: p=9.684e-05, 2.596e-05, 8.616e-05 respectively). TukeyHSD post-
hoc analysis for group effects showed TBI-Sham comparisons of p=3.96054e-07, 1.573818e-05
for Pro and Active MMP9 respectively. Pairwise Wilcoxon daily comparisons with Benjamini-
Hochberg correction were then applied. The gelatinase MMP2 was upregulated vs Sham by 1d
(148±2%, p = 0.0054), peaks at 3d (180±13%, p = 0.0325) and largely sustained elevation
through 7d (172±7%, p = 0.0054) post injury. MMP9 in both its pro-form, and active form are
elevated after injury. Pro-MMP9 peaks at 1d post injury (1305±179%, p = 0.0065) before
becoming non significant at 3d and 7d (116±19% and 92±17% respectively). The Active-MMP9
lags behind the pro-form and persists in elevation longer; Active-MMP9 peaks at 1d (340±43%,
p = 0.0081), declines at 3d (172±26%, p = 0.0557), and is not significant at 7d (93±24%).

168

169
2.8.1 Figure 2-19: Zymography of MMP2 and MMP9 1-7d Post-Injury in Neocortex

170
Figure 2-19: Zymogram expression of MMP2, Pro-MMP9, and Active MMP9 1-7d after injury
in the neocortex. Note MMP2 peak expression at 3d and significance across entire time course.
Pro-MMP9 peaks immediately at 1d before dropping to near Sham by 3d while the active form is
elevated significantly through 3d. (Mean ± SEM, n=6/group; Wilcoxon-Test with Benjamini-
Hochberg correction, ●,*, **, *** for p <.10, .05, .005, .0005 respectively)

171
Similar to the neocortex we observed that in the hippocampus (Figure 2-20) MANOVA
using the model [𝑷𝒓𝒐𝑴𝑴𝑷𝟗,𝑨𝒄𝒕𝒊𝒗𝒆𝑴𝑴𝑷𝟗,𝑴𝑴𝑷𝟐]~𝑫𝒂𝒚 ∗ 𝑪𝒐𝒏𝒅𝒊𝒕𝒊𝒐𝒏 with Wilks
correction showed significant main effects due to Day, Condition, and their interaction
(p=2.536e-07, 2.775e-12, 2.536e-07). Derivative single enzyme ANOVA show MMP2, Pro-
MMP9, and Active-MMP9 have significant main effects in Day, Condition, and their interaction
(MMP2: p=0.01424, 1.792e-13, 0.01424 respectively; Pro-MMP9: p=1.119e-08, 3.521e-07,
1.119e-08 respectively; Active-MMP9: p=0.02382, 2.64e-05, 0.02382 respectively). TukeyHSD
post-hoc analysis for group effects showed TBI-Sham comparisons of p=2.297051e-13,
3.521416e-07, 2.639918e-05 for MMP2, Pro-MMP9 and Active-MMP9 respectively. Pairwise
Wilcoxon daily comparisons with Benjamini-Hochberg correction were then applied.The
gelatinase MMP2 was upregulated vs Sham by 1d (153±5%, p = 0.0032), peaks at 3d (201±4%,
p = 0.0032) and largely sustained elevation through 7d (181±15%, p = 0.0032) post injury.
MMP9 in both its pro-form and active form are elevated after injury. Pro-MMP9 peaks at 1d
post-injury (1486±219%, p = 0.0065) before dropping to near Sham at 3d (194±29%, p =
0.0685) and is non-significant at 7d (84±21%). The Active-MMP9 lags behind the pro-form and
persists in elevation longer; peaking at 1d (258±225%, p = 0.0081), declines at 3d (175±12%, p
= 0.0649), and is not significant at 7d (133±28%).

172
2.8.2 Figure 2-20: Zymography of MMP2 and MMP9 1-7d Post-Injury in Hippocampus

173
Figure 2-20: Zymogram expression of MMP2, Pro-MMP9, and Active MMP9 1-7d after injury
in the hippocampus. Note MMP2 peak expression at 3d and significance across entire time
course. Pro-MMP9 peaks immediately at 1d before dropping but maintains significance through
3d in a pattern identical to the active form. (Mean ± SEM, n=6/group; Wilcoxon-Test with
Benjamini-Hochberg correction, ●,*, **, *** for p < .10,.05, .005, .0005 respectively)

174
2.8.3 Summary of Observations in Zymograms
MMP2 is significantly elevated after injury in both the neocortex and hippocampus
within 1d after injury, peak expression at 3d, and a relatively stable plateau through 7d that
remains significant. The Pro and Active forms of MMP9 similarly demonstrate matching
expression in the neocortex and the hippocampus with a very high acute rise in Pro-MMP9
expression at 1d which rapidly dies to near Sham while the active form shows a more sustained
expression that similarly peaks at 1d and is progressively weaker across the time course though
still significant at 3d post injury.

175
2.9 Chapter 2 Discussion
2.9.1 Summary of Results in Chapter 2
In Chapter 2 we have identified the time course of heme processing in hemorrhagic
(neocortical) and non-hemorrhagic (hippocampal) tissue after a cFPI injury. We critically
identified that the expression of proteins known to be elevated in response to heme processing
(HO-1, LCN2, FTL) are increased both in tissue with obvious gross hemorrhage and in a tissue
which does not demonstrate apparent hemorrhage. Further, gelatinases known to interact with
heme processing proteins and involved in angiogenic and synaptogenic processes also do not
show marked differences in the tissue observed.
When we compare our results to what has been demonstrated in the literature we find a
number of corollaries with several novel aspects of injury. Because we are examining a relatively
understudied aspect of diffuse brain injury much of the relevant literature extends into other TBI
injury models which are more grossly necrotic/hemorrhagic (e.g. CCI) as well as other grossly
hemorrhagic CNS injuries (e.g. intracerebral hemorrhage) (Yamauchi et al., 2004; Cao et al.,
2016; Alfieri et al., 2013; Lu et al., 2014; Chang et al., 2005). One of our most significant
findings is that there appears to be a heme processing response, characterized by sequential
elevations in LCN2, HO-1, and FTL, which occurs in non-hemorrhagic tissue and at comparable
orders of magnitude to tissue known to be hemorrhagic. To further understand the nature of this
finding we more closely examine the time dependent changes in heme processing proteins as
well as additional markers of hemorrhagic injury.

176
2.9.2 Hemorrhage and HO-1 Response to mild-moderate FPI
2.9.2.1 Extent of hemorrhage generated and sites (NVU) consistent with other reports
in TBI
The hemorrhage that we observe in our study is fairly reproducible between animals and
corresponds well with literature results which show that cFPI ~2 ATM is roughly the
overpressure where WM hemorrhage becomes consistently evident after injury (Dixon et al.,
1987). At higher overpressures than we used there is progressively greater hemorrhage and it is
known that overpressures in the 2.9-3.6 ATM range distinct hemorrhages in the hippocampus
occur. This demonstrates that the hippocampus is vulnerable to hemorrhagic injury and there
may be some threshold required before gross hemorrhage occurs or it may be a more gently
demarcated process.
A note should be made here that by a number of definitions our injury may be classified
as a purely moderate rather than mild injury because of the presence of any hemorrhage. We
accept that the injury can be classed in this mild-moderate range but would observe that mice
with comparable righting times do not demonstrate hemorrhage and it is likely that as an
organism becomes larger and requires more force to cause a diffuse injury there is a greater
propensity towards generating small hemorrhages (as might occur in the rat vs. mouse). In the
case of human mild TBI for example, small microbleeds are exceedingly common and are
frequently observed even in patients with no symptoms of injury (Park et al., 2009a). For a mild-
moderate injury we have a notable hemorrhagic area but if we contrast this to an ICH model of
hemorrhage it would be considered minor which is to say that hemorrhage is an ancillary injury
in our model, though one that should be examined. As a result of this categorical debate however
it appears that most research focusing on hemorrhagic outcomes in TBI has used other models,

177
particularly CCI models. These other models typically produce extensive focal damage and a
large contusional injury which may make it difficult to assign categorically different aspects of
the resulting injury (Petraglia et al., 2014).
2.9.2.2 Rapid post-injury HO-1 induction matches data for TBI, SCI and
stroke/ischemia
The early induction of HO-1 observed here fits well with prior observations that have
been made in other hemorrhagic injuries including CCI, SCI, ICH, H/I ((Chang et al., 2003;
Yamauchi et al., 2004; Alfieri et al., 2013; Lu et al., 2014; Cao et al., 2016). In nearly all cases
there is a rapid rise in HO-1 1-3d post-injury, a peak expression occurring variably between 3d
and 7d, with the later periods matching injuries having correspondingly larger bleeds and thus
greater quantities of HO-1’s substrate heme. Frequently papers provide only a brief snapshot of
HO-1 expression over time reproducing only one of the time points included in our sample
period. Our observations of HO-1 increases in a non-hemorrhagic tissue, however, have not been
previously reported. This is particularly interesting since the majority of models that observed
HO-1 increases have involved lateral injuries and as a result have used the contralateral ‘un-
injured’ side as a control of expression. Whether this leads to a suppression of effect is unknown
but using a non-hemorrhagic matched tissue in the same animal as a control may effectively
prevent the observation we have uncovered. As an example, in the circumstance of a lateral
injury that acutely damages the ipsilateral neocortex and hippocampus it would be unsurprising
if there was extensive hemorrhage throughout both tissues. If there is further HO-1 reactivity in
the contralateral neocortex it would be expected to be significantly reduced in comparison and
might reasonably appear to be sham like or absent.

178
2.9.2.3 Association of HO-1 with NVU and glial response: predicted patterns reflect
cell function
When we look at the glial presentation of HO-1 we observe that there is a strong
association with the primary bleed site and the cortical layers overlaying the frank hemorrhage.
This component is largely expected and correlates well with previous authors’ findings which
have demonstrated a strong association with hemorrhage and HO-1 expression (Ryter et al.,
1998; Ryter and Tyrrell, 2000; Ryter et al., 2006; Cao et al., 2016; Lu et al., 2014; Alfieri et al.,
2013; Yamauchi et al., 2004; Fukuda et al., 1995). In this region we primarily see GFAP+ HO-
1+ cells in the overlying neocortex and IBA1+HO-1+ cells adjacent and throughout the bleed,
with expression increasing over the course of ~3d as IBA1+ cells begin to infiltrate the bleed.
This general pattern of reactivity has been observed several times in other models of CNS injury
(Fukuda et al., 1995; Yamauchi et al., 2004; Cao et al., 2016). Astrocyte reactivity with HO-1
has been identified both in vitro, and in vivo in animal models and the same is true for microglial
reactivity (Li Volti et al., 2004; Fukuda et al., 1995; Fauconneau et al., 2002). Throughout the
neocortex there appear to be associations between HO-1 reactivity and markedly dilated cortical
blood vessels and in small capillaries adjacent to the bleed site which has also been previously
observed (Alfieri et al., 2013; Lu et al., 2014; Lin et al., 2007b; Chang et al., 2005). Remarkably
and currently unreported, we find that the hippocampus also demonstrates a profound
upregulation of HO-1 even in the absence of hemorrhage which is at least partially associated
with the vessels in the hippocampal fissure. It should be noted that it has been reported that HO-1
is modestly upregulated even in Sham animals in the neurons of the dentate gyrus (Vincent et al.,
1994) and yet when we stained for HO-1 we did not observe any detectable HO-1 in the Sham
dentate gyrus at the concentrations of antibody and laser power we used.

179
2.9.3 Correlated Post-injury changes in heme processing pathway molecules
2.9.3.1 Heme pigment over time post-injury
In the early post-injury period the most obvious gross change to the tissue is the easily
identifiable hemorrhages that occur at the white matter/grey matter interface along with scattered
petechial bleeds that occur throughout the neocortex and occasionally in fascial plane adjacent to
the alveus/fimbria of the hippocampus (it is important to note here that in our hippocampal
dissections we largely remove hemorrhagic blood from the surface fimbria). The bleeds in the
early post-injury period are markedly deep red in color and over 3-7d post-injury they appear to
progressively lighten and ebb as their reddish pigment heme is processed and either eliminated
locally or retained as the pigment Bilirubin which has a yellowish color. This progression of
pigments and gross discoloration is shared by hemorrhagic injury in essentially all tissues with
the exact timeline and pigment shifts being altered by the extent of hemorrhage (e.g. large,
dense, bleeds take longer to resolve than smaller dispersed bleeds, (Cao et al., 2016). It has been
found by other authors that the delayed process of erythrophagocytosis and resulting heme
processing may be driven by altered expression of CD47 which is progressively lost after
hemorrhage, disappearing by 3d post-injury (Cao et al., 2016; Xi et al., 1998; Oldenborg et al.,
2000). CD47 further has been associated with HO-1 as a regulator of erythrophagocytosis
(Schallner et al., 2015).
2.9.3.2 HO-1 expression and cell location over time post-injury
HO-1 expression correlates directly with heme pigment progression. We observed that
HO-1 was elevated by 1d after injury in hemorrhagic tissue rising to peak expression at 3d before
declining through 15d. This matches numerous observations in the literature with the timeline
marginally adjusted depending on the size of the bleed (Cao et al., 2016; Yamauchi et al., 2004;

180
Fukuda et al., 1995). It is notable again that we find a matching time course exists in the
hippocampus, which does not demonstrate remarkable hemorrhage, and rather than finding an
incidental increase we see a multifold elevation that similarly peaks at 3d. The underlying
process that drives expression in the hippocampus is somewhat uncertain but may either rely on
hemorrhage like activity that is limited to the immediate vascular wall or some form of paracrine
signals delivered from cortical areas connected via the vasculature. From the initial
characterization of the injury model by Dixon et al., (Dixon et al., 1987) we know that with
increased overpressure we will accomplish hemorrhage in the hippocampus. This suggests that
the tissue is susceptible and we are just barely on the edge of threshold for hemorrhage in our
cFPI application.
There is another current point of dispute in post-injury heme processing; Chang et al.,
2003 found that when they compared HO following CCI in HO-2 KO and WT mice, activity was
markedly reduced one day after injury (Chang et al., 2003). They concluded that HO-2, not HO-
1, was the dominant form of HO involved in processing heme after injury. While we did not
assay HO-2 in our experiments its activity could be elevated at the 1d post-injury interval, prior
to peak HO-1 expression and prior to erythrocyte CD47 loss. Further, HO-2 is known to be
elevated in specific brain regions, particularly in the hippocampus (Vincent et al., 1994; Verma
et al., 1993; Yamanaka et al., 1996) and it is possible the tissue sampled in that study had a
greater proportion of HO-2 relative to HO-1.
2.9.3.3 Ferritin expression and cell location over time post-injury
Following the appearance of heme pigment immediately after injury, and the peak
processing of heme pigment at 3d post injury, we find that ferritin expression promptly rises with
a peak at 7d in both brain regions studied. This is an expected sequelae to hemorrhage recovery

181
that has been observed many times and in large part is due to the iron accumulation in cells that
process heme (O'Shaughnessy et al., 1966; Strassmann, 1949; Wu et al., 2003). The timeline
indicates that FTL becomes elevated only after there is a robust iron related signal resulting from
heme processing.
Once again we observe that there is a similar matching FTL time course between the
hippocampus and the neocortex, though notably the hippocampus shows a rise 1d after injury
which is not observed in the neocortex. If one takes the view that there may be a widespread but
limited hemorrhagic process throughout the hippocampal tissue, it is possible that even 1d after
injury there may be sufficient heme accumulated and processed to the level of FTL storage such
that no prominent bleed is observed. Previous authors have at times characterized HO-2 as the
dominant heme processing protein in hemorrhage since it provides the bulk of heme processing
activity at 1d post-injury (Yamauchi et al., 2004) and while this finding is not inconsistent with
our results it may help to explain why there is early upregulation of FTL in certain tissues.
Alternately, it is known that HO-1 is constituently upregulated at low levels in the neurons of the
dentate gyrus (Vincent et al., 1994). These both support the idea that there is an inherent
constituently expressed mechanism for widespread tissue level processing of heme as long as it
is limited in quantity in any individual location. It is possible that, in circumstances of gross
hemorrhage which includes necrosis of tissue, heme processing may be delayed. In this case
local cell populations which might be able to process the insult in a limited fashion are unable to
do so due to debilitating cellular injury and functionally impaired vascular beds.
2.9.3.4 LCN2 expression and cell location over time post-injury
In addition to looking at proteins and pigments more canonically associated with heme
processing we also investigated Lipocalin 2 in order to understand the early iron sequestration

182
and trafficking that occurs after injury. LCN2 has been found in cells that express FTL and plays
a known role in cellular iron trafficking (Flower, 1996; Ratledge, 2007; Nairz et al., 2007).
Further we were well aware of the known interaction between LCN2 and matrix
metalloproteinases, effectors of degenerative/regenerative plasticity after TBI (Phillips et al.,
2014; Kjeldsen et al., 1993; Chan et al., 2014), particularly the gelatinase MMP9. LCN2 is
known to persistently activate MMP9 by preventing its degradation thus leading to MMP9
accumulation and substrate proteolysiss (Kjeldsen et al., 1993). We observed that LCN2 was
highly upregulated after injury with extraordinarily high expression at 1d, which is at least
partially the result of near complete absence of LCN2 in Sham animals. This is expected based
on a broader interpretation of the literature which has found LCN2 to be an acute phase protein
highly reactive in the hours after a traumatic insult (Zhao et al., 2016b; Huang et al., 2016; Li et
al., 2013; Flower, 1996). It also neatly validates the minimal influence of craniectomy surgery
on the HO-1 pathway at 1d post-injury, since there is a near absence of any LCN2 protein
expression in the Sham control animals.
Again we observed that both the neocortex and the hippocampus showed similar profiles
of LCN2 expression, with the hippocampus marginally more elevated. Expression declines
through 7d and this is expected as other iron transport and sequestering proteins become
upregulated culminating in elevated FTL expression. LCN2 functions by binding small
molecules that capture iron in an attempt to isolate soluble iron and these soluble iron carriers
from bacteria. LCN2 in turn is able to transport iron across cell membranes sequestering it out of
the interstitial fluid. We observed a pattern of expression that was highly correlated with this
function, showing broad tissue level expression which became more focal and cellular as time
progressed.

183
2.9.3.5 Gelatinase activation (MMP2 vs MMP9) over time post-injury
It has been previously shown that the gelatinases are upregulated after traumatic brain
injury and they have been highly correlated with dysfunction after injury and with repair
mechanisms associated with reactive synaptogenesis (Phillips et al., 2014; Chan et al., 2014).
Since there was a convergence between these known effectors of TBI and hemorrhagic injury
through LCN2, we were interested to see if gelatinase enzyme activity was correlated with the
HO-1 pathway response in our cFPI model. We discovered that, similar to our previous findings,
proteolysis in the post-injury neocortex and hippocampus was remarkably similar. MMP2
activity was consistent with HO-1 in that it peaked at 3d but with fewer extremes in expression,
evenly elevated at both 1d and 7d suggesting kinetic activity driven response rather than one tied
to hemorrhage particularly. MMP9 however showed a pattern of activity that was highly
correlated with LCN2 expression. The pro-form of MMP9 showed highly inducible activity at 1d
post injury as has been previously observed in a variety of CNS insults (Kyrkanides et al., 2001;
Lekic et al., 2011; Rosenberg et al., 2001; Gasche et al., 1999; Szklarczyk et al., 2002b). By
contrast, the active form of MMP9 more closely matches the expression profile of LCN2,
suggesting that the two proteins may indeed interact during the acute post-injury cellular
response to cFPI. However, to some extent this interaction effect remains unclear. For example,
LCN2 has a specific binding site on human MMP9, which could explain its persistent activation
of the enzyme, but in rodent models, while it has been shown that LCN2 persistently activates
MMP9, the same MMP9 binding site is no longer present and no clear alternative has been
established (Flower, 1996; Kjeldsen et al., 1993). Our enzyme activity findings do not agree with
some studies of MMP expression after injury (Shi et al., 2017), where MMP9 mRNA was
reported to peak at 3d post injury and MMP2 to peak at ~5-7d post-injury. Oddly however, this

184
study failed to show concurrent increases in MMP protein, where their ELISA results showed
MMP9 peak at 1d and MMP2 to be stable from 1-7d. It remains unclear how to interpret such
findings and whether those measures can reasonably be compared with our data.
After establishing these general baseline responses of the HO-1 pathway to cFPI, it is
important to compare similarities and differences between the two brain regions examined,
further considering their individual patterns in greater detail. Since analyzing response in both
regions simultaneously can be complicated, we first considered each tissue individually to
interpret the observed post-injury activation of heme processing proteins. The initial thesis was
that two tissues known to underlie persistent TBI deficits, one of which was hemorrhagic, and
one which was not, would show clear differences in the extent of HO-1 pathway activation. We
did not initially expect to find that the neocortex and hippocampus would be so consistent in HO-
1 pathway response to cFPI, but given these similarities, it is helpful to look at each tissue in
isolation.
2.9.4 Neocortical HO-1 Response Relative to Hemorrhagic Damage at NVU
Overall, our observations of post-injury neocortical HO-1 expression are consistent with
that reported for other models of TBI or CNS injury (Alfieri et al., 2013; Lu et al., 2014; Fukuda
et al., 1996; Yamauchi et al., 2004; Cao et al., 2016). In grossly damaged tissue there is a clear
disruption of the NVU, accompanied by an acute HO-1 upregulation that occurs 1-3d after
injury, which persists through at least 7d and in numerous cases 15d+. There is a known
association of this HO-1 induction with vessels likely driven by hemorrhage related triggers, in
the case of TBI, the release of heme from degenerating erythrocytes. The post-injury neocortical
expression of HO-1, LCN2, and FTL in our cFPI model reflects the predicted cellular response

185
for a moderately hemorrhagic injury. This cellular response is focused at GM/WM boundary
hemorrhage and areas of NVU disruption.
2.9.4.1 GM/WM interface hemorrhage and necrosis, mixed microglia + astrocyte
activation
The most notable pathological change which we observe in the neocortex is the grossly
disrupted WM tract that overlays the lateral ventricles and terminates in the grey matter. This
pattern has been observed since the initial characterization of the rodent cFPI model (Dixon et
al., 1987). Whether it is due to an interface effect or just some compartmental path of least
resistance there is considerable WM damage which enables a larger bleed to form, invading into
the grey matter through Layers V and VI. The shape and direction of the bleed may be driven by
the relatively fibrous wall of the lateral ventricle which constrains one boundary of the
hemorrhage. On limited occasions a larger blood vessel in the cerebrum will also be involved
extending hemorrhagic activity through layers IV and III but without reaching the outer surface
of the tissue. This provides an interesting perspective on the resulting injury– the stress strain
damage which causes gross primary tissue necrosis is relatively limited to the white matter while
the expanding hemorrhage produces heme related injury over a greater tissue area and
particularly in the region we examined. We can contrast this to diffuse axonal damage in the
tissue which has been observed to be spread out over a larger area and affecting a greater number
of tissues (Dixon et al., 1987).
In this region of primary hemorrhagic injury we see cellular necrosis and a generalized
DAPI related schmear of nuclear contents which progressively disappears over 3-7 days post
injury. In the cortical layers more distant from active bleed sites we see extensive GFAP+ HO-
1+ reactivity which approaches quite close to the distinct hemorrhagic sites but maintains a small

186
perimeter. Within this perimeter and within the bleed itself we observe numerous IBA1+ HO-1+
cells, which in a number of instances appear to be transvasating out of the nearby intact
capillaries. It is possible that since we are observing a snapshot in time that the GFAP+ perimeter
we observe represents the maximal extent of the bleed which has been recently processed by
phagocytic cells.
Throughout the neocortex in addition to the large primary bleed we also see small
examples of potential petechial bleeds which show autofluoresence during imaging. While it is
tempting to attribute them to a non-specific tissue signal, it is notable that they occur with
greatest frequency in the tissue which is 1-3d post injury, supporting a more pathologic nature.
They also have a tendency to show marked HO-1 reactivity nearby which is localized within
GFAP+ rather than IBA1+ cells, further suggesting that astroglia can be effective mediators of
heme processing under limited conditions. In general these petechial sites occur throughout the
reactive neocortex overlaying the lateral ventricles.
2.9.4.2 Predicted intensity and location of HO-1 based on extent of NVU damage
induced by injury
Disruption of the NVU is, to an extent, predictive of HO-1 expression though in the
context of a gross hemorrhage this is perhaps minimalized. While we did not directly analyze
specific NVU components it is notable that throughout the neocortex where we see petechial
HO-1 reactivity we observe dilated blood vessels that appear aberrantly large relative to Sham
controls suggestive of a vascular insult. It has been shown previously that TBI pathology
produces permeable blood vessels which are much leakier than the normo-pathological non-

187
fenestrated vessels in the brain (DeWitt and Prough, 2003; Kenney et al., 2015; Chodobski et al.,
2011). This suggests that the observed HO-1 reactivity near vessels is associated with increased
permeability of the vessels and in parts of the tissue which do not show increased HO-1
reactivity we also do not see instances of enlarged lumen vessels.
As mentioned previously there is a general shift in HO-1 expression from primarily
IBA1+ microglial to GFAP+ astroglial as we move further away from the center of focal bleeds.
To an extent this may be explained by the relative brightness of IBA1+ glia near the bleed site,
which itself is highly autofluorescent and may be obscuring reactive astrocytes. It may also be
that, since microglia are generally more mobile than astroglia, they are able to accumulate in
greater numbers near the bleed site and thus appear to be brighter in expression.
2.9.5 Hippocampal HO-1 Response Relative to Absence of Hemorrhagic Damage
2.9.5.1 Follows a post-injury time course and cell location similar to injured
hemorrhagic neocortex
The hippocampal response after injury is particularly remarkable when contrasted to the
neocortex. To our knowledge no one has attempted to examine heme processing in non-
hemorrhagic tissue in the context of brain injury and in many of the other TBI models there is
frequent hemorrhage into the hippocampus, particularly with lateral injury. We do see some
limited hemorrhage along the surface of the fimbria and in particular animals may see some local
HO-1 reactivity directly adjacent in CA3, but even in these select animals there is no evidence of
hemorrhage in the dentate gyrus and CA1, where we see extensive cellular reactivity and HO-1
pathway induction. As previously noted, when the cFPI model is generated with increasing
applied overpressure hemorrhages in the hippocampus do result (Dixon et al., 1987). Most

188
remarkable in our studies is the expression and organization of HO-1 within the dentate gyrus. At
early post injury time points (1d) there is widespread, diffuse HO-1 expression which
predominates directly adjacent to the granule cell layer. As post-injury time continues there is a
gradual aggregation of HO-1 into more punctate cellular expression, shifting outwards into the
molecular layer and towards the hippocampal fissure. By 7d, expression is largely limited to near
the hippocampal fissure and into the stratum moleculare layer of CA1. Notably, HO-1 appears
to be differentially expressed in microglia and astrocytes as a function of dentate subregion. The
hilus of the dentate gyrus shows limited expression of HO-1, which is more highly associated
with IBA1+ microglia than GFAP+ astrocytes. At the same time, in the synaptic rich dentate
molecular layer, expression of HO-1+ GFAP+ cells predominates. It is uncertain why these
cellular differences occur, however, one could speculate that hilar HO-1 may be induced in
microglia as a response to potential CA3-4 pyramidal cell damage after cFPI, while molecular
layer HO-1 response is more a result of focal NVU insult affecting associated astrocytes.
Concurrent with this process there is always an association of HO-1 with specific vessels
running through the hippocampal fissure. It is not generally associated with all vessels but at all
time points there are specific reactive vessels which show what appear to be astrocytic processes
wrapping the vessels and expressing relatively large amounts of HO-1. The underlying
mechanism for the organization of HO-1 expression or the association with vessels is at this
point unknown however potential causes included damaged/permeabilized blood vessels
exhibiting a slow form of hemorrhage or perhaps a loss of trophic support causing a hypoxic
related response. In gene chip assays of both mice and rats subjected to cFPI, however, we were
unable to identify upregulation in any hypoxia associated transcription factors known to
transcriptionally regulate HO-1.

189
2.9.5.2 HO-1, FTL and LCN2 observed together around non-hemorrhagic vessels
It is unsurprising that the mediator of heme processing (HO-1) and both acute and long
term iron storage proteins (LCN2 and FTL) are highly upregulated near focal hemorrhagic sites
within the injured neocortex. It is more surprising however to observe them all co-localized
around specific areas in non-hemorrhagic tissue. We observe that this association between HO-
1/LCN2, which progressively evolves into HO-1/FTL co-expression, occurs primarily along
select vessels in the hippocampal fissure. This is probably best explained by a tissue level
attempt to secrete excess iron into the vasculature for eventual recycling in the hematopoetic
tissue. This is also unlike what we see in the neocortex/white matter damage, where it appears
that vessel integrity is sufficiently lost such that there are notable aggregates of iron forming in
the center of the hemorrhagic bleed site.
2.9.5.3 Possible factors responsible for strong hippocampal HO-1 pathway response
Since we do not have apparent hemorrhage in the hippocampus to account for driving
HO-1 expression and yet we see that HO-1 expression is highly induced in this region, both
histologically and with western blot protein assay, we are forced to speculate possible causes of
the strong response. It is possible that, with permeabilized vessels and a high cell vulnerability to
TBI, we have identified a subthreshold, limited hemorrhagic process which is insufficiently large
to produce identifiable extravasation of blood or heme-related pigments. Perhaps there is a
shared mechanism with the penumbra of the cortical hemorrhagic injury, suggesting that the
penumbra represents a distinct injury state with respect to HO-1 response rather than simply an
injury related boundary based on tissue damage.

190
2.9.6 Impact of these results on post-injury management of hemorrhage
2.9.6.1 Identified vs unidentified NVU damage/hemorrhage must be considered
One of our major findings is that there appears to be a hemorrhagic or hemorrhage-like
process which occurs in tissue classically observed to lack identifiable bleeds. There is a distinct
timeline of HO-1 expression which is consistent in both hemorrhagic and specific non-
hemorrhagic tissues. Since previous studies using other models report HO-1 response in some
specific tissues and not in others, it is possible that diffuse injury generates an underlying
component of the hemorrhagic process which is difficult to detect and contributes significantly to
post-injury pathophysiologic cycle of damage and recovery. There has been a significant amount
of work with in vivo models attempting to replicate the extent of post-injury hemorrhage in order
to better classify incoming patients to the ED. These studies have repetitively shown that with
increased magnet power, enhanced processing, or simply more careful analysis that the extent of
microhemorrhage and the scope of the injury penumbra is larger than previously thought (Liu et
al., 2015; Chiara Ricciardi et al., 2017). Paired histological staining of iron deposition has
provided further evidence that the extent of injury far exceeds what can be feasibly obtained
through imaging of living tissue as exemplified by Dr. Latour’s research at NINDS recently
presented at the National Neurotrauma Meeting (Abstracts from the 34(th) annual national
neurotrauma symposium june 26-29, 2016 lexington, kentucky. 2016). A prerequisite to
identifying pathologic iron is that significant quantities be present to overwhelm predominate
innate iron recycling mechanisms under normal physiologic conditions. If this is true, then we
might predict that undetected diffuse limited hemorrhage could occur throughout the injured
tissue. This also suggests that it may be necessary to target underlying heme processing, even in
diffuse injury, as a means of effecting improved post-injury recovery.

191
2.9.6.2 Manipulation of heme processing pathways feasible next step
Traditionally the focus on injury related hemorrhage and clotting has revolved around
stopping active bleeds to prevent tissue trauma or degrading clots to permit tissue perfusion (Lin
et al., 2017; Peres et al., 2017). More recently, however, there has been interest in examining
how heme is processed after hemorrhagic stroke and how affecting heme processing can result in
post-injury improvement. The rationale is fairly straightforward in models of intracerebral
hemorrhage as an example where heme is a more dominant player in the post-injury tissue
pathology. In our studies of diffuse cFPI it is more likely that heme related injury is an ancillary
player though with significant potential to influence recovery. Since we are operating in a tissue
space where injury is known to be moderately recoverable, finding areas where even limited
improvement is possible may go a long way towards reducing the persistent loss of function and
lower quality of life which can occur. There is already limited research ongoing in the field of
hemorrhagic stroke which has been focused on modifying HO-1 through activation of its
upstream transcription factor Nrf2 with various pharmacological agents. In our initial gene chip
assays (see Appendix) we identified Nrf2 as the most likely transcription factor affecting HO-1
upregulation after injury. In models of stroke targeting of Nrf2, manipulation of the transcription
factor is reported to reduce the total hemorrhagic area, reduce BBB disruption and improve
behavioral outcome (Alfieri et al., 2013; Lu et al., 2014). While we do not expect hemorrhage
focused treatments to have quite as robust an effect in a TBI model where hemorrhage is a
smaller component of injury, they may provide a novel avenue of research which will help us to
better understand and attenuate persistent deficits after injury. Even more promising, the later
HO-1 expression (peaking at 3d) shown in our initial studies may be due to a delay in the lysis of
erythrocytes, providing an extended critical window for treatment targeting HO-1. We posit that

192
early upregulation of heme processing proteins prior to wide substrate availability (dependent on
lysis of erythrocytes) would be expected to provide more acute availability of intracellular
buffering compounds and limit cytotoxicity. There has already been some promising work done
in rodent models of stroke using this approach (Alfieri et al., 2013; Lu et al., 2014),
demonstrating both pathological and behavioral improvement and we proffer that similar
techniques may be beneficial in our model of diffuse cFPI.

193
3 Chapter 3
Chapter 3
Modulation of Heme Processing Response via Post-injury Induction with HO-1 Inducing
Agents

194
3.1 Abstract Chapter 3
In order to determine if HO-1 and the HO-1/Nrf2 heme processing pathway is a viable
target for post-injury therapeutic intervention we utilized a contrast dosing paradigm where we
examined hemorrhagic (neocortex) and non-hemorrhagic (hippocampus) tissue 1-15d post-cFPI
after 1hr post-injury treatment with either Sulforaphane, or Hemin. Both drugs are known HO-
1/Nrf2 activators and the choice to use both was designed to account for the inherently broad
spectrum effects that may occur since each is understood to target the pathway via a different
mechanism. We observed distinct effects in protein expression, behavior, and histology in the
treated vs untreated TBI animals. By 1d a significant portion of heme pigment is cleared out of
the hemorrhagic injury site in the drug treated animals and both groups showed similar shifts in
peak expression of HO-1 from 3d to 1d. Further, FTL, an iron storage protein and a marker of
long term injury in the tissue is temporally shifted in expression and demonstrates a reduction in
peak iron load in the neocortex. These changes in protein expression are matched in the histology
observed in the tissue and there is a generally greater organizing effect in the drug treated
animals vs the untreated animals which tend to show broader expression of all markers observed.
Behaviorally the TBI+SFN showed significant acute improvement in the rotarod test, performing
comparably to Sham controls by 2d post-injury. In this test the TBI+HMN group lagged behind
and was closer to the TBI in performance though consistently performing slightly better. When
behavior is extended out to 15d in the Morris water maze we see a profound improvement in the
TBI+HMN group which appears to closely match Sham metrics and is in contrast to the TBI and
TBI+SFN groups. Looking more closely however also reveals that both drug treated groups
develop distinct search profiles demonstrating that a single 1hr post-injury pharmacological

195
manipulation has a profound effect even 15d later. The data suggest that there is a critical
window after TBI which extends to at least 1hr post-injury where there is a potential window for
therapeutic intervention and further demonstrates support for treating even diffusely injured
patients for potential heme pathology.

196
3.2 Introduction Chapter 3
Heme Oxygenase 1 (HO-1) is the inducible form of the rate limiting enzyme in heme
catabolism. HO-1 catabolizes heme into the potential neurotoxins carbon monoxide (CO), Iron
(Fe), and Biliverdin. It does so by cleaving heme at the alpha-methene bridge which directly
releases CO and removes the binding stability of Fe in the center of the Heme structure leaving
behind the open metalloporphyrin Biliverdin. HO-1 has been shown to be induced by a variety of
stimuli, chief amongst them heme substrate itself, and HO-1 has a high degree of specificity for
heme B over other forms of heme or metalloporphyrins. HO-1 induction has been associated
with injury severity and, in Chapter 2, we previously identified the time course of HO-1
expression 1-15d in both a hemorrhagic (neocortex) and non-hemorrhagic (hippocampus) tissue.
Because prior studies have suggested both positive and negative associations of HO-1
induction with injury outcome we have utilized two known inducers of HO-1 to examine if an
elevation in acute post-injury HO-1might facilitate more efficient, less toxic heme processing,
thereby resulting in behavioral improvement relative to untreated injured cases. The choice of the
two rather broad HO-1 targeted agents was made due to the unavailability of highly selective
HO-1 inducers and because our goal was to trigger a robust activation of the HO-1 heme
processing response. Interestingly, there remains some uncertainty as to whether increased HO-1
will be beneficial or harmful in the FPI model. The two views are largely divide along the line of
whether increasing HO-1 pharmacologically will simultaneously increase the buffering capacity
of the local tissue or if the increased HO-1 activity in the absence of increased buffering capacity
will overwhelm the local cells causing increased tissue necrosis. The experiments of Chapter 3

197
will help clarify whether acute post-injury manipulation of HO-1 qualifies as a potential
neuroprotective therapy following TBI.
The two agents selected for our study are Hemin (HMN) and Sulforaphane (SFN).
Hemin is essentially the endogenous substrate of HO-1, an animal derived heme B that is
stabilized with a chloride atom. Hemin induces HO-1 expression via the complete endogenous
pathway. Hemin is degraded and releases Fe, which either directly or through the induction of
ROS causes a conformational change in the repressor protein keap1, leading to Nef2 release,
translocation to the nucleus for increased transcription of ARE consensus genes which include
HO-1. Sulforaphane in contrast is a brassicaceae derived organosulfur isothiocyanate which acts
as an antioxidant/weak oxidant. Sulforaphane is effective in directly inducing conformational
change in keap1 and does not require digestion nor does it produce ROS or other cytotoxic
species after injection. Both drugs have been used previously in animal models of stroke (Alfieri,
Lu) and Sulforaphane has been used in limited trials in TBI (Dash 2005). To date they appear,
while non-specific, to be among the best in vivo HO-1 inducers available.
The hypothesis is that early induction of HO-1 after injury via an upstream mechanism
also known to increase cellular buffering capacity to HO-1 degradation products will lead to
improved tissue pathology and behavioral recovery. This effect depends in part on the delay in
erythrocyte lysis after injury which normally drives post-injury HO-1 upregulation. In a sense,
we are providing a heme toxicity ‘pre-insult’ which can be given temporally after the traumatic
injury has occurred but before the heme toxicity insult has resulted. Towards this end, our dosage
scheme of IP 1 hour after injury is designed to mimic a best case real world paradigm where a
TBI could be diagnosed and treated within hours after injury.

198
We expect that HO-1 induction will lead to decreased heme pigment after the
injury and that overall tissue pathology will be reduced. Further, we expect both LCN2 and FTL
to be upregulated early, LCN2 as part of the same transcriptional mechanism and FTL in
response to the resulting available iron.

199
3.3 Methods Chapter 3
3.3.1 Experimental Animals
The procedures in this study met national guidelines for the care and use of laboratory
animals with all experimental protocols approved by the VCU Institutional Animal Care and Use
Committee (IACUC). Male Sprague-Dawley rats (290-360g, ENVIGO, Huntingdon, UK) were
used in these experiments, housed in pairs when possible under a temperature (22oC) and
humidity (66%) controlled environment with food and water provided ad libitum and subjected
to a 12 hour dark-light cycle. Rats were randomly assigned to either TBI (n=26), Sham-injured
(n=21), TBI+HMN treated (n=21), or TBI+SFN treated (n=24) groups and evaluated at 1d, 3d,
7d, or 14d post injury by WB or IHC. For all analysis Sham-injured animals served as controls
for the TBI animals.
3.3.2 Surgical Preparation for Rat Central Fluid Percussion Injury
24 hours prior to central fluid percussion injury animals underwent surgical preparation
to mitigate acute inflammatory response confounding. Rats were anesthetized with 4% isoflurane
in carrier gas (70% N2O, 30% O2) for 4 minutes, heads shaved, and maintained on 2% isoflurane
in carrier gas delivered via nose cone for the duration of the surgery. Surgical site is cleaned with
iodine solution followed by 70% ethanol and a surgical drape placed over the animal. Body
temperature was maintained at 37oC via heating pad (Stryker, Kalamazoo, MI), and animal vital
signs (heart rate, arterial oxygen saturation, respiratory rate, pulse distention, and breath
distention) monitored via pulse oximeter (MouseOX; Starr Life Sciences, Oakmont, PA). While
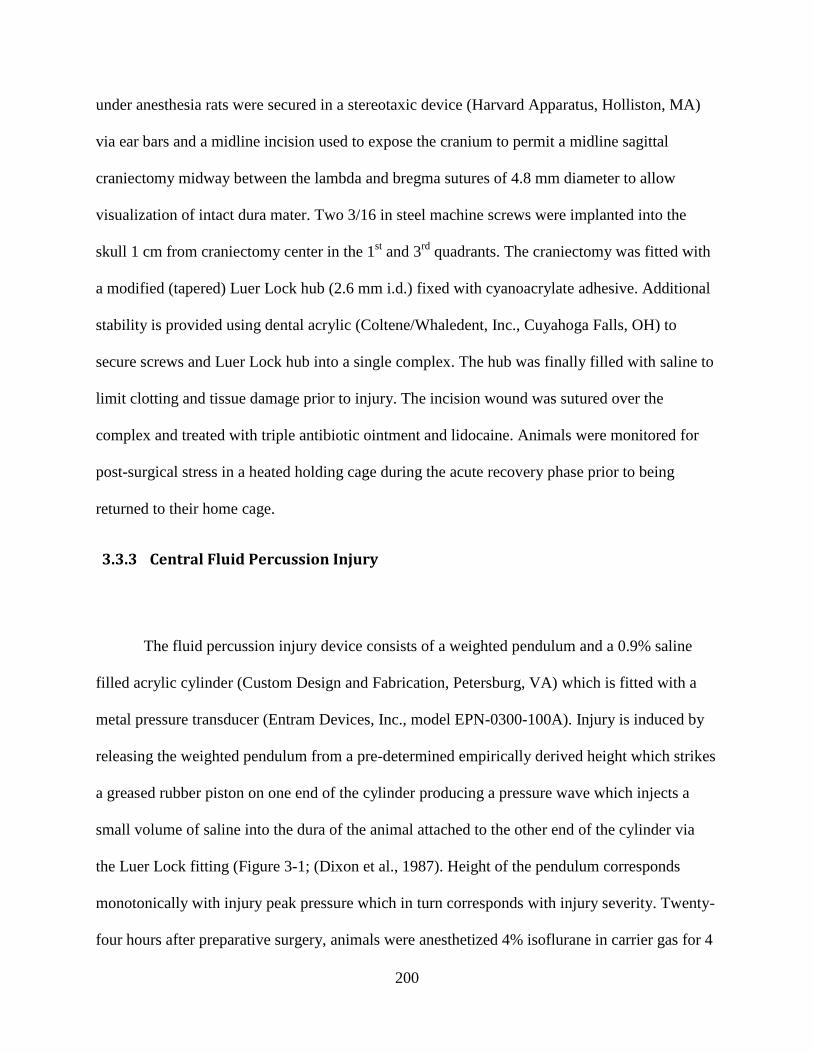
200
under anesthesia rats were secured in a stereotaxic device (Harvard Apparatus, Holliston, MA)
via ear bars and a midline incision used to expose the cranium to permit a midline sagittal
craniectomy midway between the lambda and bregma sutures of 4.8 mm diameter to allow
visualization of intact dura mater. Two 3/16 in steel machine screws were implanted into the
skull 1 cm from craniectomy center in the 1st and 3
rd quadrants. The craniectomy was fitted with
a modified (tapered) Luer Lock hub (2.6 mm i.d.) fixed with cyanoacrylate adhesive. Additional
stability is provided using dental acrylic (Coltene/Whaledent, Inc., Cuyahoga Falls, OH) to
secure screws and Luer Lock hub into a single complex. The hub was finally filled with saline to
limit clotting and tissue damage prior to injury. The incision wound was sutured over the
complex and treated with triple antibiotic ointment and lidocaine. Animals were monitored for
post-surgical stress in a heated holding cage during the acute recovery phase prior to being
returned to their home cage.
3.3.3 Central Fluid Percussion Injury
The fluid percussion injury device consists of a weighted pendulum and a 0.9% saline
filled acrylic cylinder (Custom Design and Fabrication, Petersburg, VA) which is fitted with a
metal pressure transducer (Entram Devices, Inc., model EPN-0300-100A). Injury is induced by
releasing the weighted pendulum from a pre-determined empirically derived height which strikes
a greased rubber piston on one end of the cylinder producing a pressure wave which injects a
small volume of saline into the dura of the animal attached to the other end of the cylinder via
the Luer Lock fitting (Figure 3-1; (Dixon et al., 1987). Height of the pendulum corresponds
monotonically with injury peak pressure which in turn corresponds with injury severity. Twenty-
four hours after preparative surgery, animals were anesthetized 4% isoflurane in carrier gas for 4

201
minutes and given a scalp incision to expose the hub complex. Animals were then attached to the
fluid percussion device by filling the hub with sterile 0.9% saline to ensure a seal free of air
bubbles and clots. Animals then received a mild-moderate fluid percussion injury (2.0 ± 0.1
ATM overpressure) via saline injection into the closed cranial cavity. The pressure pulse was
measured by the transducer and displayed on an oscilloscope (Tektronix 1000 S, Beaverton, OR)
and the peak of the pressure wave recorded. Prior to recovery of consciousness, the hub was
removed and the incision sutured closed and treated with topical triple antibiotic and lidocaine.
To determine and confirm injury severity, reflexes (tail, paw, ear, corneal blink) and righting
times were recorded prior to acute recovery. Sham injured animals underwent the same surgical
preparation and hub removal procedures but did not receive central fluid percussion injury. For
Sham injured animals reflexes and righting time were not recorded as they do not differ from
naïve anesthesia treated animals.
3.3.4 Protein Extraction
Rats were anesthetized with 4% isoflurane in carrier gas (70% O2, 30% NO2) for 4 min
and sacrificed by decapitation at the appropriate experimental interval 1, 3, 7, 15d after
FPI/Sham injury. Neocortex trimmed of white matter and obvious hemorrhages sampled from
the central square of a 3x3 grid arranged on the surface was collected along with whole
hippocampal bulbs trimmed of any extraneous tissue (n=4-7/group). Tissue samples were
homogenized on ice in 250 uL of RIPA Lysis Buffer (EMD Millipore, Billerica, MA) with
cOmplete protease inhibitor + EDTA (Roche Diagnostics, Mannheim, Germany) prior to
separation via 14,000 g centrifugation for 20 min at 4oC. Supernatant was aliquoted and stored
with separated nuclear pellet at -80oC. Protein concentration of extract was determined using

202
Pierce BCA Protein Assay Reagent kit (Thermo-Fisher, Waltham, MA) on a Fluostar Optima
plate reader (BMG Labtech, Inc., Cary, NC).

203
3.3.5 Figure 3-1: cFPI Device

204
Figure 3-1: Diagram of fluid percussion model of brain injury. A 4 mm central craniectomy
central craniectomy is connected to one end of a Plexiglass cylinder filled with physiologic
saline. At the other end in the cylinder is a Plexiglas cork mounted on O-rings. Injury is
produced by striking the cork with a 4.8 kg pendulum dropped from a specific height. The
pressure transient is recorded on a storage oscilloscope with an extra-cranial transducer. Figure
and text reproduced with permission from Dixon et al., 1987. In our paradigm we note several
small changes including a central craniectomy 4.8 mm in diameter and the addition of a firm
rubber tip on the end of the cylinder cork.

205
3.3.6 Western Blotting
Western Blot (WB) analysis was carried out using Bio-Rad products on their Criterion
Gel system using 18 or 26 lane Criterion XT Bis-Tris Gels (Hercules, CA). 50 or 25 ug of
protein were prepared in XT Sample Buffer with XT Reducing Agent and homogenized prior
being denatured at 95oC for 5 mins. Samples were electrophoresed on 4-12% or 12% gels in
MOPS running buffer at 200v for 45 min (after 50v x 5 min stacking period) or until tracking
dye approached the gel foot. Protein was transferred onto PVDF or Nitrocellulose membranes at
100v for 1 hour in a Tris-Glycine buffer with 10% methanol. Post-transfer the remaining protein
on the gels was stained with 0.1% Coomassie Brilliant blue in 40% MeOH+10% glacial acetic
acid overnight prior to de-stain and visualization to confirm even protein load and transfer.
Meanwhile, membranes were rinsed with nano-pure deionized water before buffering with Tris-
buffered saline (TBS) and blocking for 1 hour with 5% non-fat milk in TBS with 0.5% Tween
(mTBST). Membranes were incubated with appropriate antibody at 1:1K or 1:2k (see Table 3-1)
dilution overnight at 4oC. After incubation, membranes were washed with mTBST and then
incubated with the appropriate HRP-linked secondary for 1 hour at room temperature.
Membranes were then washed in TBST to remove excess non-specific signal and finally in TBS
to remove tween surfactant effects. Membranes were visualized via chemiluminescence using
Super Signal West Dura Extended Duration Substrate (Thermo-Fisher, Waltham, MA).
Quantitative data was collected using a Syngene G:Box with protein bands subjected to
densitometric analsysis using Gene Tools software (Syngene, Frederick, MD). Protein data was
expressed as fold change relative to time matched Sham control animals processed on the same

206
membrane. Confirmation of load control was determined using beta actin (Sigma-Aldrich, St.
Louis, MO) with a known caveat that signal may modestly change during TBI.
3.3.7 Tissue Fixation
Rats were anesthetized with 4% isoflurane in carrier gas (70% O2, 30% NO2) for 4 min
with sodium pentobarbital (400 mg/kg IP) and sacrificed via transcardial perfusion; flushed with
0.9% saline with a clamped descending aorta and snipped right atrium. When perfusion runs
clear tissue is perfused with 4% paraformaldehyde in phosphate buffer (0.1 M NaHPO4,
pH=7.4). Once tissue was fixed whole intact brains were removed from the cranium and placed
in excess tissue fixative for 24 hours prior to transfer into 0.03% NaN3 in 1.0 M Phophate
Buffered Saline (PBS) and storage at 4o C. Prior to utilization for immunohistochemistry tissue
was blocked and sectioned into 40 um coronal slices using a Leica Vibratome (VT1000S; Leica
Biosystems Inc., Buffalo Grove, IL). Sections were stored separated and organized in PBS +
Azide at 4oC.
3.3.8 Immunohistochemistry
Free floating sections were selected based on rostral-caudal position and permeabilized in
5% peroxidase for 30 mins. Tissue was washed in PBS and the blocked using fish gelatin in PBS
+ 0.05% triton X-100. Tissue was incubated overnight with primary antibody in blocking buffer
(see Table 3-2) at 4oC. The following day sections were washed with PBS prior to further
blocking for 30 minutes and incubated with secondary fluorescently tagged antibody in blocking
buffer for 2 hours at room temperature. Sections were then washed in PBS, rinsed in Phosphate

207
Buffer to remove salt artifact and mounted on Superfrost Plus slides (Fisher Scientific,
Pittsburgh, PA), and allowed to air dry. When dry sections were coverslipped using Vectashield
+ DAPI (Vector Laboratories, Burlingame, CA). Fluorescent signal was visualized on a confocal
Zeiss LSM 700 (Carl Zeiss, Thornwood, NY), on an apotome Zeiss AxioImager M2 (Carl Zeiss,
Thornwood, NY), or on a widefield Olympus BX51 (Olympus, Tokyo, JP).
3.3.9 Drug Injection Protocol
Certain animal cohorts were injected with either Hemin (26 mg/kg; from Bovine, Sigma-
Aldrich, St. Louis, MO) or Sulforaphane (5 mg/kg; LKT Laboratories Inc., St. Paul, MN) (see
appendix for further drug information). Injections were given intraperitoneal (IP) 1 hour post
injury to briefly anesthetized rats randomly selected from TBI animals. The drugs were given in
a PBS volume of 3 mL/kg body weight with 0.04% DMSO (~1 mL saline per animal). Both
drugs were prepared day of in low light conditions. Sulforaphane was added to PBS in a stock
solution of 400 mg/mL DMSO. Hemin was added to PBS as a powder and while Hemin
effectively wets at pH 7.4 it remains a slurry. Both drugs were vortexed to break up possible
clumps and mix solution. Prior to injection solutions were raised to human body temperature ~
37oC. [Note, prior attempts to use low pH to induce solubility simply resulted in the Hemin
dropping out of solution when pH was raised again].
To demonstrate proof of concept we ran a limited injection protocol in naïve animals
using dosages in a range that bracketed typically used values found in the literature. We
demonstrated that in the setting of a naïve animal with intact BBB/NVU that we were able to
detect an increase in HO-1 expression 24hr after injury using both Sulforaphane and Hemin (See

208
Appendix). The results demonstrate induction of HO-1 in a naïve setting. While we observed that
HO-1 was induced by the agents selected we must note that the mechanism by which either drug
is taken in or detected by the brain is uncertain. Further, since the barrier is grossly disrupted, or
generally more permeable, after injury it is unknown if the comparison is valid and whether drug
dosing in an uninjured brain is comparable. We generally proffer that given what is known about
barrier disruption after injury it is most likely that the regions that experience the greatest
exposure to drug are also those regions that are most damaged and thus have the least barrier
integrity.

209
3.3.10 Figure 3-2: Rotarod Device

210
Figure 3-2: Front and side views of the rotarod apparatus. Unless specified otherwise,
all dimensions are in centimeters. Reproduced with permission from Hamm et al., 1994. Note; it
is believed experiments were run on the legacy device characterized in the original paper
mentioned.

211
3.3.11 Rotarod
Rats were run on the rotarod apparatus 1-7d or 1-Sacrifice Day as appropriate. The
device consists of two large, clear, 46 cm diameter and 5mm thick plexiglass discs spaced 10 cm
apart which frame a walking area consisting of 18 1mm diameter stainless steel rods arranged in
an 8 cm diameter cylinder (Figure 3-2). The central pivot of the device is 50 cm above the table
surface and a control box (Bodine Electric Company) adjacent to the device has controls for
speed, direction of rotation, and a brake. Testing rotational velocities range from 0 rpm to a peak
of 30 rpm. The test paradigm as utilized was to place the rodent on the walking area, wait 10
seconds for habituation, and then apply a rotational velocity ramp from 0 to 30 rpm gaining 3
rpm every 10 seconds until maximum velocity is reached and then maintaining this maximum for
an additional 20 seconds. The test trial concludes when 1: a rat falls off the device 2: the rat is
spun around the device twice 3: the rat completes the full time (see appendix for exact scoring
criteria). Rats are given two trials per day with a third trial if the first two are inconsistent and
there is a minimum 10 minute delay between trials. Data is recorded for time spent on the device
for each trial with peak rotational speed computed from the time data. Group averages, ANOVA,
and TukeyHSD are further run on the resulting data.
3.3.12 Morris Water Maze
Rats were run in the Morris Water Maze 11-15d post injury when appropriate. The device
(Figure 3-3) consists of a 180 cm diameter, 60 cm high white plastic pool filled to a depth of 28
cm with water made opaque with non-toxic washable white paint (Crayola, Easton, PA). A clear

212
plexiglass platform 10 cm in diameter is fixed 2 cm below the surface as a hidden platform
located midway into the 4th
quadrant of the pool. The pool is located in a room with numerous
extra-maze cues that remain constant throughout the experiment. In order to assess spatial
memory function during the training phase (days 11-14) four trials per day are run for each
animal with the animals randomly cycling through North, South, East, and West starting
positions. Rats are given 120 seconds to find the platform and are manually placed on the
platform if they are unable to find it. The rats remain on the platform for 30 seconds before
removal to a heated incubator in between trials. The inter-trial interval was a minimum of 10
minutes. On the final day of the trial the hidden platform is removed and the rats are given 60
seconds to swim in the pool before removal. Throughout the test the rodent swim paths are
recorded using video and the Water Maze package for Videomex Systems (Columbus
Instrument, Columbus, OH). During the training phase swim speed, path length, and latency to
the platform are observed and recorded. During the trial day swim path is observed and swim
speed, quadrant time, proximity score, and relative proximity score are computed for each
animal. Further subjective analysis of search patterns is conducted after constructing individual
and group heat maps paired with trial path.

213
3.3.13 Figure 3-3: Morris Water Maze Apparatus

214
Figure 3-3: Cross-sectional diagram of pool, and its position in the laboratory. Note
support frame to ensure water level is at roughly waist height, and Perspex disc attached to
laboratory ceiling to limit field of view of TV camera. Reproduced with permission from Morris,
1984. Note that in our paradigm we use a pool that is 1.8 m in diameter made of plastic.

215
3.3.14 Statistics
The effects of injury condition and time post-injury were evaluated using the statistical
software R using 2-way Analysis of Variance (ANOVA) analysis with post hoc TukeyHSD
pairwise analysis of major effects. Pairwise analysis of timecourse interactions were computed
using t-tests with Benjamini-Hochberg correction. I circumstances where the assumption of
normality is violated, as observed via qualitative analysis Q-Q intervals and Cook’s distance,
data was normalized via log transform and timecourse interactions detected using Wilcoxon-
Mann-Whitney tests. Western Blot and Zymography results are reported as mean ± standard
error of the mean (SEM). In all cases the analysis is done using two tailed tests where
appropriate and with an alpha level of 0.05. Further, zymogram results involve multiple
gelatinase metrics located on the same gel and are further analyzed via Multivariate Analysis of
Variance (MANOVA) prior to subgroup ANOVA.

216
3.3.15 Table 3-1: Antibodies Used in Western Blot Experiments
Antibody
Target
Antibody
Host and
Type
Antibody
Source and
Serial
Number
Typical
Secondary
Used 1:15k
Typical
Membrane
Used
Concentration
Used
HO-1 Rabbit,
Polyclonal
Stressgen,
ADI-OSA-
150
Harlan,
611-103-122,
Goat anti-
Rabbit
PVDF 1:2k
FTL Goat,
Polyclonal
ABCAM AB
Thermofisher
Santa Cruz,
SC-2352,
Bovine anti-
Goat
PVDF 1:2k
LCN2 Goat,
Polyclonal
R&D
Systems
AF3508
Santa Cruz,
SC2352
Nitrocellulose 1:2k
3.3.16 Table 3-2 Antibodies Used in Immunohistochemistry Experiments
Antibody Target Antibody Host
and Type
Antibody Source
and Serial Number
Typical
Secondary Used
1:1k
Concentration
Used
HO-1 Rabbit,
Polyclonal
Stressgen,
ADI-OSA-150
Alexa-488 1:300
FTL Goat,
Polyclonal
ABCAM AB
Thermofisher
Alexa-488/594 1:300
LCN2 Goat,
Polyclonal
R&D Systems
AF3508
Alexa-594 1:200
GFAP Chicken,
Polyclonal
Encor
Biotechnologies
Alexa-594 1:200
IBA1 Goat, Polyclonal ABCAM
AB5076
Alexa-594 1:300

217
3.4 Chapter 3 Data
After observing the time dependent processing of heme and associating it with HO-1,
FTL, and LCN2 in Chapter 2 we turned towards manipulating the time course of post-injury
processing by injecting to known HO-1 activating agents – Hemin, and Sulforaphane. In brief,
lacking a source of a highly selective agent to target HO-1 processing and believing that the
endogenous expression of HO-1 during growth, development, and injury appears to be necessary
for typical rodent phenotype we attempted to influence HO-1 driven processing of Heme by
targeting upstream activation of the transcription factor Nrf2. Since there are known concerns
related to the variable kinetics and oxidative potential of Nrf2 activating agents (which largely
affect Nrf2 by triggering various redox sensors) we used two different agents, one known to be
fairly oxidative due to its release of the transition metal Fe (Hemin), and one known to be a weak
electrophile (Sulforaphane).

218
3.5 Heme Pigment Disappearance in Drug Treated Animals
Figure 3-4 A shows a simplified cartoon of ordered heme processing. Heme B from a
variety of potential sources (e.g. hemoglobin, neuroglobin) is taken up by a cell and is degraded
by heme oxygenase. When present in small quantities heme is frequently processed by HO-2, the
constituently present form of heme oxygenase, but in larger quantities or in the circumstance of
acute trauma the inducible form, HO-1, is rapidly amplified. Either enzyme functions identically
by cleaving Heme B at the alpha-methene bridge releasing 1 molecule each of Biliverdin, Fe (II),
and CO with some degree of selectivity for Heme B over other Heme variants (see Appendix). In
an appropriately buffered system Biliverdin is rapidly reduced to Bilirubin, conjugated, and
excreted from the cell, and the body. CO diffuses out of the cell and is ultimately bound to
circulating Heme B and released into the atmosphere after pulmonary gas exchange. Fe
meanwhile is buffered by iron storage proteins, acutely stored locally, and over time secreted
from the cell and incorporated into new metalloproteins e.g. new Heme B during erythropoiesis.
In the circumstance of acute elevations of Heme B degradation Fe additionally has been shown
to trigger redox sensors either directly or through reactive oxygen species that have been
generated via iron mediated reactions with water (the Fenton and Haber-Weiss reactions). In this
simplified cartoon, Fe affects the repressor protein keap1 which when modified releases the
transcription factor Nrf2 which translocates to the nucleus and increases expression of HO-1
enhancing Heme B degradation.
This general process is somewhat altered under the circumstances of trauma as illustrated
in Figure 3-4 B. In the situation of iron overload the buffering capacity of the cell can be
overwhelmed and each of the catabolic products of Heme B degradation can induce potentially

219
cytotoxic damage to the cell. CO can bind indiscriminately to a large variety of metalloproteins
inhibiting or modifying their normal functions and can cause lipid peroxidation in the cell
membrane. Bilirubin can intercalate into the lipid bilayer inducing aberrant fluidity and can
directly activate inflammatory receptors on the cell membrane. Fe(II) meanwhile behaves
essentially the same as it does normally, just with excess concentrations of iron driving greater
generation of reactive oxygen species than can be buffered acutely leading to extensive oxidative
damage to cell contents.

220
3.5.1 Figure 3-4: Heme Procesing Cartoon:
A
B

221
Figure 3-4: Simplified diagrams of heme processing under normal conditions (A), and after
traumatic injury (B). Under normal conditions heme B is taken in by a phagocytic cell and
degraded by HO-1, or constituently active HO-1 releasing Fe(II), CO, and Biliverdin/Bilirubin. If
there are sufficient initial quantities of heme B being processed Fe(II) accumulates and causes
Nrf2 to become released from its transcriptional repressor keap1 inducing forward feedback
amplifying HO-1 expression until the signal is exhausted. After traumatic injury there is a delay
of ~1-3 days before extravasated erythrocytes lyse their cell contents or undergo
erythrophagocytosis causing uptake of heme B. In this circumstance almost by definition of
heme excess/iron overload there are multiple additional considerations from ordered heme
processing. Each of the catabolic products of Heme B have known cytotoxic effects illustrated
along with their endogenous buffering mechanisms.

222
To establish feasibility of drug dosing paradigm we did a 1/3 log step ramp of drug doses
in the ranges that have been used in the literature (See Appendix). We found that in naïve
animals we saw an increase in HO-1 expression with our midrange dosage and a multifold
increase at our maximum doses. Since we interpreted these results to show that the drugs were
capable in influencing expression in a brain with intact barrier function, and in conjunction with
literature evidence which demonstrated consistent effects, we selected 5 mg/kg Sulforaphane,
and 26 mg/kg Hemin doses to use in the experiment moving forwards. In both cases we predict a
modest increase in expression in naïve animals and at the start of the experiment had expected to
ultimately see that HO-1 would be increased even further in barrier damaged TBI rat subjects
that received an additional HO-1 activating signal (the injury). To rephrase: we expected that
inducing HO-1 would cause an additive effect further increasing HO-1.
To study the effect of influencing heme processing we began by injecting 5 mg/kg of
Sulforaphane or 26 mg/kg of Hemin 1 hour after injury. 1d after injury both Hemin and
Sulforaphane treated animals show a remarkable reduction in heme pigment relative to TBI
animals (Figure 3-5). This can be observed in the primary bleed site after injury in the callosum
and into the grey matter in cortical layer VI. Additionally note that the tissue thinning in the
overlaying neocortex appears reduced in the drug treated animals. Also note that even though the
pigment is absent, there are still easily identifiable necrotic/bleed sites which contain some
yellowish pigment indicative of heme catabolism.

223
3.5.2 Figure 3-5: Loss of Heme Pigment After Drug Treatment 1d Post-Injury
2 mm
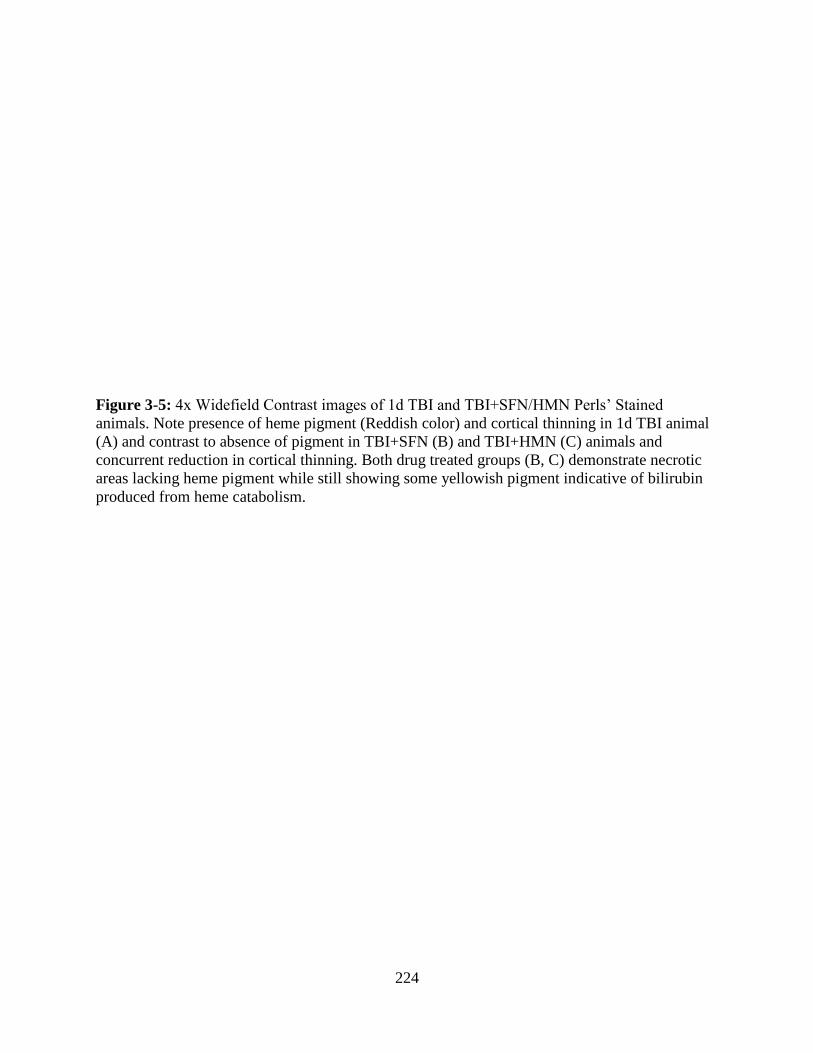
224
Figure 3-5: 4x Widefield Contrast images of 1d TBI and TBI+SFN/HMN Perls’ Stained
animals. Note presence of heme pigment (Reddish color) and cortical thinning in 1d TBI animal
(A) and contrast to absence of pigment in TBI+SFN (B) and TBI+HMN (C) animals and
concurrent reduction in cortical thinning. Both drug treated groups (B, C) demonstrate necrotic
areas lacking heme pigment while still showing some yellowish pigment indicative of bilirubin
produced from heme catabolism.

225
3.6 Drug Treated HO-1 Shift responding to pigment changes, LCN2
unaffected
3.6.1 HO-1 Results
We observed that drug treatment with both Hemin and Sulforaphane caused suppression
of peak HO-1 expression in both the neocortex and hippocampus (Figure 3-6, Table 3-3). In all
drug treated cases HO-1 expression in drug treated animals appeared to peak at 1d post injury or
possibly earlier, shifting the time course of peak expression at least 2 days prior to the peak seen
in untreated animals. In the neocortex, ANOVA using the model 𝒍𝒐𝒈[𝑽𝒂𝒍𝒖𝒆]~𝑫𝒂𝒚 ∗
𝑪𝒐𝒏𝒅𝒊𝒕𝒊𝒐𝒏 we have significant main effects in Day, Condition, and their interaction (p=2.2e-16,
2.381e-14, 1.131e-07 respectively). TukeyHSD of group effects showed significant differences
in Sham-HMN (p=0.0000007), Sham-SFN (p=0.0000003), Sham-TBI (p<2e-16), TBI-SFN
(p=0.0120846), and TBI-HMN (p=0.0132195). In the hippocampus, ANOVA using the model
𝒍𝒐𝒈[𝑽𝒂𝒍𝒖𝒆]~𝑫𝒂𝒚 ∗ 𝑪𝒐𝒏𝒅𝒊𝒕𝒊𝒐𝒏 we have significant main effects in Day, Condition, and their
interaction (p=1.313e-12, 4.154e-14, 4.154e-14 respectively). TukeyHSD of group effects
showed significant differences in Sham-HMN (p<2e-16), Sham-SFN (p=0.0000008), Sham-TBI
(p<2e-16), TBI-SFN (p=0.0049354), and low significance in TBI-HMN (p=0.0874031).
At 1d post injury we do not observed differences between the drug treated groups and
untreated animals in HO-1 expression however by 3d the expression diverges. Longer time
points demonstrate more variable effects and the effect sizes are sufficiently reduced to be less
important. In the neocortex after the initial suppression at 3d the TBI+HMN treated animals are
at Sham levels of expression while both the TBI and TBI+SFN groups are reduced from their

226
peaks but still elevated relative to Sham. By 15d the effect size is minimal and yet the variance
has become so tight in the Sham and treated groups that TBI is elevated relative to Sham but the
TBI+SFN group now shows significance vs the TBI group.
The hippocampus tells a similar story with significant differences between the TBI and
TBI+SFN or TBI+HMN groups at 3d. At longer time points however the Sulforaphane group is
more suppressed than the Hemin group and is not different from Sham at 7d or 15d while Hemin
and TBI groups maintain a significant difference though with a very modest effect size.

227
3.6.2 Figure 3-6: HO-1 Western Blot Results Drug Treated 1-15d Post-Injury

228
Figure 3-6: Western Blot expression of HO-1 in Sham, TBI, TBI+HMN, and TBI+SFN
presented as fold of control 1-15d post-injury. HO-1 is significantly elevated in the neocortex
and hippocampus following injury in both TBI and TBI+Drug treated animals. At 3d
significance vs Sham is maintained in all groups except the neocortex TBI+HMN group and drug
treated groups show reductions vs 1d levels and are significantly reduced relative to untreated
TBI animals. At longer time points expression drops to near Sham levels in treated animals while
TBI untreated animals decline but remain more elevated than treated animals through 15d post-
injury. (Mean ± SEM, n=4-7/group; T-Test with Benjamini-Hochberg correction, ●,*, **, ***
for p < .10, .05, .005, .0005 respectively vs Sham, $$$ for p<.0005 vs TBI).

229
3.6.3 Table 3-3: HO-1 Western Blot Result Table 1-15d Post-Injury
Neocortex
Mean±SEM
Day 1 Day 3 Day 7 Day 15
Sham 1.00±0.14 1.00±0.23 1.00±0.12 1.00±0.08
TBI 6.70±0.82 9.46±2.96 2.18±0.40 1.32±0.08
HMN 7.57±1.65 3.43±1.52 1.01±0.23 1.15±0.07
SFN 5.50±1.14 3.88±1.84 1.88±0.56 1.04±0.10
Hippocampus
Mean±SEM
Day 1 Day 3 Day 7 Day 15
Sham 1.00±0.11 1.00±0.29 1.00±0.10 1.00±0.12
TBI 7.88±1.31 16.42±7.48 2.41±0.29 1.58±0.21
HMN 8.55±1.53 2.42±0.65 1.93±0.22 1.70±0.15
SFN 6.88±1.48 4.07±0.27 1.45±0.42 1.34±0.13
Table 3-3: HO-1 mean expression over control of each condition by group and presented as
Mean ± SEM in Neocortex and Hippocampus. Note 1d elevations vs Sham consistent in all
groups and divergence between TBI and TBI+Drug groups at 3d with convergence of expression
through 15d.

230
We observed substantially altered HO-1 expression in the tissue after treatment with
either Hemin or Sulforaphane. At 1d post-injury treatment with either drug appeared to have a
direct impact on the proximity of reactive cells to the injury, the morphology of these cells, and
the fluorescent character of the bleed itself. We have previously posited that each of the agents
selected would cause an induction of HO-1 when injected post-injury and the image staining in
Figures 4 and 5 appear to support this theory. In figure 4 we see a substantial shift in
autofluorescense within the bleed site which seems to be strongly associated with increased HO-
1 expression in cells directly adjacent to the necrotic site. In the untreated animal as we have
seen previously there is high reactivity of the glia with an anisotropic arrangement to their
appendages which occurs some distance away from the bleed. In the TBI+SFN animal it appears
that HO-1+ cells are already present throughout the bleed and directly adjacent in the injury
penumbra. Further, the processes of the cells have been arranged in an isotropic form laying
largely parallel to the curvature of the WM/GM interface that contains the bleed. The TBI-HMN
animal appears to extend this trend with extremely focal expression of HO-1 concurrent with
extensive morphological change with a loss of somatic expression of HO-1 and LCN2 instead
presenting a focal process driven expression. It is helpful to note here that we have previously
shown that the majority of the LCN2+ HO-1+ cells located at some distance from the bleed are
largely GFAP+ positive while HO-1+ cells found inside the bleed site or directly adjacent are
strongly skewed towards IBA1+ cells.
The hippocampus experiences similar changes to the neocortex but lacking a bleed lacks
the same focal organization when drug treated (Figure 5). We observe that the untreated animal
shows a broad expression of HO-1 concurrent with an almost uniform spread of LCN2
throughout the tissue that creates a muted appearance to the staining. In the TBI+SFN animal we

231
begin to see organization of the response with increased LCN2 focus in the hippocampal fissure
concurrent with numerous discrete strongly HO-1+ cells in the dentate gyrus molecular layer.
The 1d TBI+HMN animal seems to show the greatest extent of this organization with LCN2
expression largely limited to the hippocampal fissure and extensive highly responsive HO-1+
cells throughout the dentate gyrus in both the molecular layer and the hilus.

232
3.6.4 Figure 3-7: HO-1 vs LCN2 Neocortex Drug Treated 1d Post-Injury
300 um

233
Figure 3-7: 20x Confocal tile scans showing major necrotic bleed and overlaying neocortex stained with HO-1,
LCN2, and DAPI at 1d post-injury. In the untreated animal (A) note broad distribution of HO-1+ and LCN2+
cells spaced somewhat distantly from the necrotic bleed and note the grossly purple color of the bleed site due
to a mixture of heme autofluorescence and DAPI staining. Reactive morphology of observed cells shows an
anisotropic distribution of cellular processes. The TBI+SFN treated animal (B) shows stratification of HO-1 and
LCN2 expression with HO-1 in close proximity to and throughout the injury. Further, the cell morphology has
become isotropic with processes arranged tangentially to the injury. The TBI+HMN treated animal (C) shows
extreme condensing of HO-1 expression into focal nodes in bleed sites. Note that red autofluorescence is lost in
bleed site. Further note that while there is limited somatic staining of HO-1 and LCN2, there is a broad level of
process expression which provides a relatively muted appearance of broadly responding fluorescence.

234
3.6.5 Figure 3-8: HO-1 vs LCN2 Hippocampus Drug Treated 1d Post-Injury
200 um

235
Figure 3-8: 20x Confocal tile scans showing the dentate gyrus of the hippocampal formation
stained with HO-1, LCN2, and DAPI at 1d post-injury. In the untreated animal (A) note fairly
broad expression of HO-1 and LCN2 throughout the tissue. In both the TBI+SFN and
TBI+HMN animals (B,C) note increased expression of HO-1 particularly in the hilus of the
dentate and expression of LCN2 which appears more restricted to the hippocampal fissure.

236
At later time points we continue to see an organizing process occurring in the TBI and TBI treated
animals which appears to be more advanced in the drug treated animals, particularly in the TBI+HMN treated
animals. This organization is best seen in the neocortex and along the WM/GM interface due to the necrotic
nature of that injury providing easier to identify tissue pathology. At 7d post-injury (Figure 3-11) we observe
that HO-1 expression is evident within the necrotic site particularly for the 7d TBI animals. Co-stain with GFAP
reveals a general absence of co-expression between astrocytes and HO-1+ cells. We observe that in the
TBI+SFN animal there is reduced HO-1 expression in the necrotic site though the total size of the area is
similar. The TBI+HMN animals show further progression of observation with substantially limited HO-1
expression in the necrotic site along with reduced area.
Remarkably, even though expression of HO-1 converges to Sham levels by 15d in the neocortex IHC
tile scans show dense granular expression largely restricted to the callosum and concurrent with high levels of
FTL expression (Figure 3-12). Both the TBI and TBI+SFN groups seem to show larger areas and increased
levels of expression compared to the TBI+HMN group which is consistent with the observations made at 1d and
7d.

237
3.6.6 Figure 3-9: HO-1 vs IBA1 Neocortex Drug Treated 3d Post-Injury
300 um

238
Figure 3-9: 20x Apotome tile scans showing the hemorrhagic and reactive neocortex stained with HO-1, IBA1,
and DAPI at 3d post-injury. In the untreated animal (A) note significant blown out signal in the bleed site and
broad expression of HO-1 throughout the tissue. Contrast in the TBI+SFN (B) and TBI+HMN (C) animals a
reduction in the size of the bleed site and a global reduction in HO-1 throughout the tissue though maintaining
numerous highly reactive cells.

239
3.6.7 Figure 3-10: HO-1 vs IBA1 Hippocampus Drug Treated 3d Post-Injury
300 um

240
Figure 3-10: 20x Apotome tile scans showing the dentate gyrus of the hippocampal formation stained with HO-
1, IBA1, and DAPI at 3d post-injury. In the untreated animal (A) note broad elevation of HO-1 throughout the
tissue in addition to numerous highly reactive cells. Contrast in the TBI+SFN (B) and TBI+HMN (C) animals
which show a reduction in the overall broad signal and more of an organizing response to the single cell
reactivity, particularly in the TBI+HMN treated animal.

241
3.6.8 Figure 3-11: HO-1 vs GFAP Neocortex Drug Treated 7d Post-Injury
100 um

242
Figure 3-11: 20x Apotome tile scans showing the major necrotic injury and overlaying
neocortex stained with HO-1, GFAP, and DAPI at 7d post-injury. Note absence of co-expression
between HO-1 and GFAP and dense somatic staining of HO-1 largely restricted to the WM tract
under the neocortex. Also note the difference in quantity of HO-1 expression which appears to be
most intense and broadly expressed in the untreated animal (A), more muted/less expansive in
the TBI+SFN animal (B), and most muted but with broad expression into the neocortex in the
TBI+HMN animal (C).

243
3.6.9 Figure 3-12: HO-1 vs FTL Neocortex Drug Treated 15d Post-Injury
400 um

244
Figure 3-12: 20x Apotome tile scans showing the major necrotic injury and overlaying
neocortex stained with HO-1, FTL, and DAPI at 15d post-injury. HO-1 is significantly reduced
compared to previous time points but there are notable changes that occur between the TBI (A)
and drug treated groups (B & C, TBI+SFN & TBI+HMN respectively). The total size of the FTL
staining region is comparable in the 15d TBI and 15d TBI+SFN animals and they have similar
limited expression of highly reactive cells scattered throughout the neocortex. These highly
reactive cells are absent in the 15d TBI+HMN tissue and the total area of FTL reactive tissue in
the callosum appears reduced compared to 15d TBI and 15d TBI+SFN animals.

245
3.7 Summary of Observations HO-1
In summary we have observed via contrast imaging, Perls staining, western blot, and
immunohistochemistry that injection with the known HO-1/Nrf2 activators Hemin and
Sulforaphane causes a shift in heme processing, and particularly a shift in HO-1 expression along
with concurrent heme processing markers.
HO-1 may be modestly induced by or before 1d post-treatment but is significantly
depressed by 3d relative to TBI in both the hippocampus and the neocortex with later levels of
expression converging with both TBI and Sham through 15 days.
This observation is supported by the immunohistochemistry, most clearly seen in the
neocortex near the necrotic site where there is obvious changes to glial morphology and
expression of heme processing proteins after drug treatment.

246
3.8 LCN2 Results
We continued our investigation by looking at potential changes in acute iron
sequestration via LCN2 expression after injury. Overall LCN2 expression is relatively
unchanged between TBI and drug treatment groups from a total protein perspective (as assayed
by WB). There are some differences however, in the cellularity and location of LCN2
expression, at least in part driven by differing morphology in the underlying glial cell
populations which has been shown previously in Figure 3-7 &
Figure 3-8 at 1d post-injury.
We observed in western blot that the drug treatment groups demonstrated almost no
variation from the TBI only group. In the neocortex, ANOVA using the model 𝑽𝒂𝒍𝒖𝒆~𝑫𝒂𝒚 ∗
𝑪𝒐𝒏𝒅𝒊𝒕𝒊𝒐𝒏 we have significant main effects due to Day, Condition, and their interaction (p
=7.593e-06, 7.898e-06, 0.02369 respectively). TukeyHSD of group effects showed significant
differences in Sham-HMN (p=0.0003823), Sham-SFN (p=0.0010063), Sham-TBI
(p<0.0000351), and no significance in the TBI-SFN, and TBI-HMN groups. In the hippocampus,
ANOVA using the model 𝑽𝒂𝒍𝒖𝒆~𝑫𝒂𝒚 ∗ 𝑪𝒐𝒏𝒅𝒊𝒕𝒊𝒐𝒏 we have significant main effects due to
Day, Condition, and weak significance in their interaction (p =0.0004352, 2.764e-06, 0.0584626
respectively). TukeyHSD of group effects showed significant differences in Sham-HMN
(p=0.0001023), Sham-SFN (p=0.0000333), Sham-TBI (p<0.0003554), and no significance in the
TBI-SFN, and TBI-HMN groups.

247
There are only two time points where the a drug treatment differs from the TBI, at 7d in
the neocortex where the drug treated groups lose significance vs Sham and appear to drop to near
sham levels though they are not significantly different from the TBI group. An interesting note
here is that compared to earlier in Chapter 2, all injured groups in this chapter demonstrate more
sustained LCN2 expression that is still elevated through day 7. Further, the peak expression at 1d
is 10-100 fold rather than 100-1000 fold which may indicate a baseline shift due to Sham stress
response when being behaviorally tested. Most interesting is that the expression of LCN2 no
longer peaks at 1d post injury before dropping off at 3d, but rather maintains a relatively constant
expression through 3d before only modestly declining.

248
3.8.1 Figure 3-13: LCN2 Western Blot Results Drug Treated 1-7d Post-Injury

249
Figure 3-13: Western Blot Expression of LCN2 in Sham, TBI, TBI+HMN, and TBI+SFN
presented as fold of control with log scale 1-7d post-injury. LCN2 expression appears largely
unchanged regardless of treatment group. LCN2 expression in all groups peaks 1-3d post-injury
and has decreased towards Sham levels by 7d post-injury in both the neocortex and the
hippocampus. The few specific values to note are drops to non-significnce relative to sham in the
drug treated neocortical samples. (Mean ± SEM, n=4-7/group; Wilcoxon-Test with Benjamini-
Hochberg correction, *, **, *** for p < .05, .005, .0005 respectively vs Sham, $ for p<.05 vs
TBI).
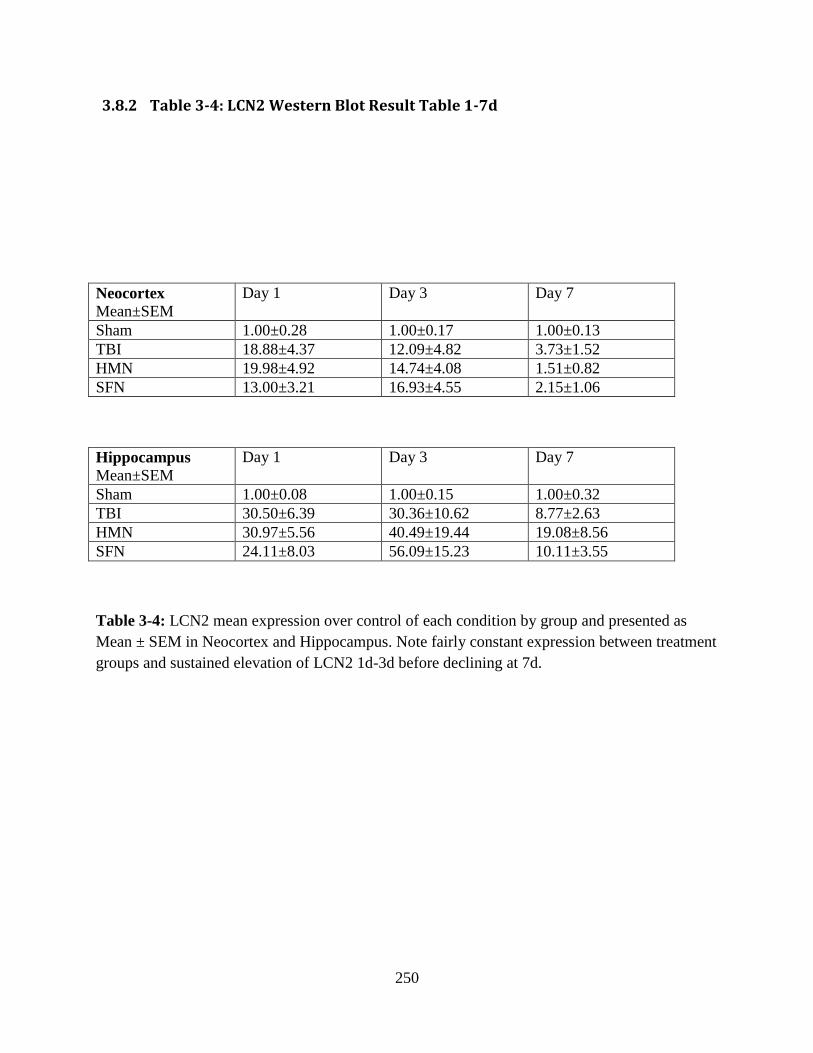
250
3.8.2 Table 3-4: LCN2 Western Blot Result Table 1-7d
Neocortex
Mean±SEM
Day 1 Day 3 Day 7
Sham 1.00±0.28 1.00±0.17 1.00±0.13
TBI 18.88±4.37 12.09±4.82 3.73±1.52
HMN 19.98±4.92 14.74±4.08 1.51±0.82
SFN 13.00±3.21 16.93±4.55 2.15±1.06
Hippocampus
Mean±SEM
Day 1 Day 3 Day 7
Sham 1.00±0.08 1.00±0.15 1.00±0.32
TBI 30.50±6.39 30.36±10.62 8.77±2.63
HMN 30.97±5.56 40.49±19.44 19.08±8.56
SFN 24.11±8.03 56.09±15.23 10.11±3.55
Table 3-4: LCN2 mean expression over control of each condition by group and presented as
Mean ± SEM in Neocortex and Hippocampus. Note fairly constant expression between treatment
groups and sustained elevation of LCN2 1d-3d before declining at 7d.

251
3.9 Rotarod Behavioral Results
In order to study potential behavioral outcomes of HO-1 induction with Hemin or
Sulforaphane we chose an acute metric of cortical function that has been shown to be inhibited
by traumatic brain injury. The test provides a well characterized measure of balance/coordination
and motor-planning. In our paradigm we used a velocity ramp which after a 10s habituation
delay increases at a rate of 0.3 RPM/s with a maximum velocity of 30 RPM held until a total trial
time of 130 seconds is reached (120 seconds of rotation). We recorded group differences in
device contact time or max rotational velocity before an animal fell, completed the test, or spun
around twice.
Rotarod Naïve animals were placed on the rotarod device and their performance tracked
over the next 7 days with daily trials conducted. The initial day 1 ability of the animals was
stratified by condition with the Sham animals performing best, the TBI animals performing the
worst, and both drug treated groups midway between the two untreated conditions (Figure 3-14
& Figure 3-15, Table 3-5 & Table 3-6). Largely as expected the Sham animals performed best
out of all groups, quickly learning the task with the majority of animals running the test to
completion by the third day (a special note must be mentioned however that a subset of animals
after learning the task then proceeded to attempt to escape the task; as a result the Sham scores
actually reduced after day 4). The TBI+SFN group performed next best overall, quickly reaching
performance ability that matched the Sham animal group and modestly outperforming the Sham
group by day 7 (due to the aforementioned escape attempts). The TBI+HMN group lagged a
little behind the TBI+SFN and Sham groups, more closely matching the TBI group until day 4
when it began to pull away. There are a couple of interesting points of stratification between the

252
various animals. The drug treated animals in both the TBI+SFN and TBI+HMN group had day1
performance that was roughly midway between the Sham and TBI groups. The TBI+SFN group
then proceeded to have an accelerated learning curve while the Hemin learning curve lagged. By
day 7 when the majority of the animals had successfully learned the task all groups except the
TBI+SFN group included animals that attempted to avoid the test. ANOVA results demonstrated
that across the full trial both the Sham and TBI-SFN groups were significantly different from the
TBI and TBI+HMN groups.

253
3.9.1 Figure 3-14: Rotarod Contact Time 1-7d Post-Injury

254
Figure 3-14: Rotarod Contact Time vs Trial Day. 50% Confidence Interval shown along with
mean values and individual data points for each animal by group. Of particular interest: note the
start position shift from TBI to Sham treated animal with both TBI+SFN and TBI+HMN treated
animals performing better at 1d post injury. TBI+SFN treated animals rapidly catch up to Sham
treated animals within 2-3 days of training while TBI+HMN treated animals show improvement
but lag. Of special note, there is a decline in Sham animal performance after 4d which largely
coincides with a subset of animals who became bored and attempted to escape or avoid the task.
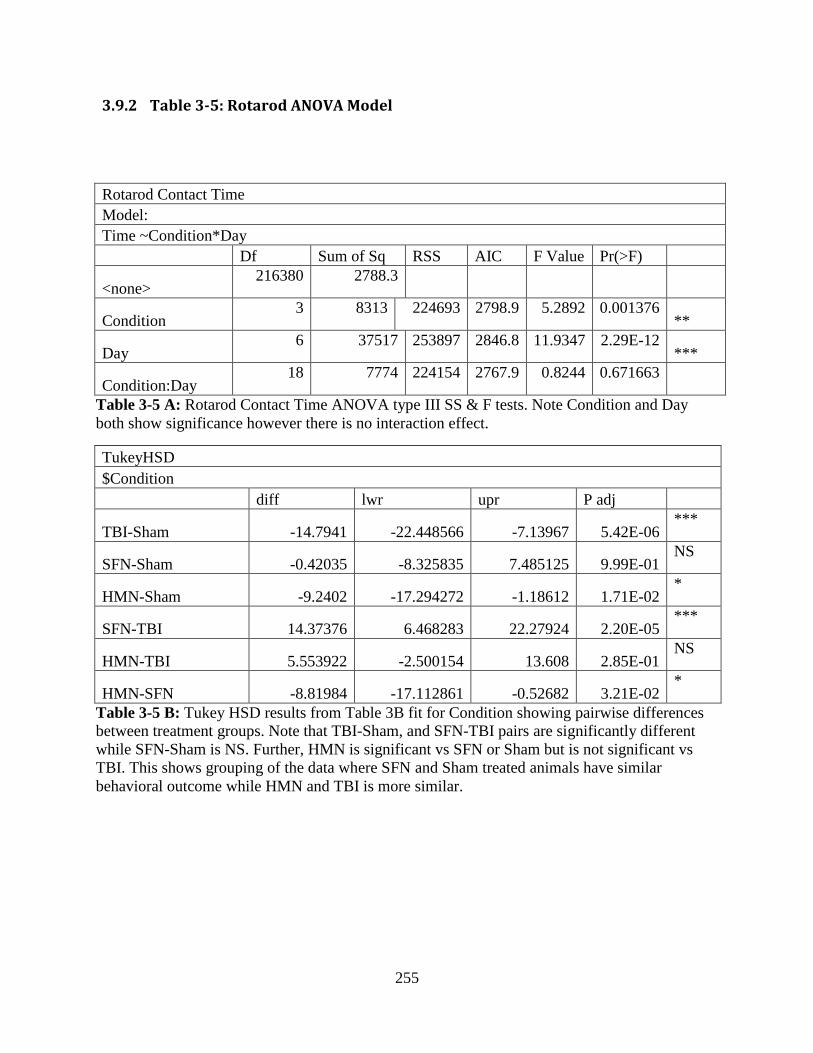
255
3.9.2 Table 3-5: Rotarod ANOVA Model
Rotarod Contact Time
Model:
Time ~Condition*Day
Df Sum of Sq RSS AIC F Value Pr(>F)
<none>
216380 2788.3
Condition
3 8313 224693 2798.9 5.2892 0.001376 **
Day 6 37517 253897 2846.8 11.9347 2.29E-12
***
Condition:Day 18 7774 224154 2767.9 0.8244 0.671663
Table 3-5 A: Rotarod Contact Time ANOVA type III SS & F tests. Note Condition and Day
both show significance however there is no interaction effect.
TukeyHSD
$Condition
diff lwr upr P adj
TBI-Sham -14.7941 -22.448566 -7.13967 5.42E-06 ***
SFN-Sham -0.42035 -8.325835 7.485125 9.99E-01 NS
HMN-Sham -9.2402 -17.294272 -1.18612 1.71E-02 *
SFN-TBI 14.37376 6.468283 22.27924 2.20E-05 ***
HMN-TBI 5.553922 -2.500154 13.608 2.85E-01 NS
HMN-SFN -8.81984 -17.112861 -0.52682 3.21E-02 *
Table 3-5 B: Tukey HSD results from Table 3B fit for Condition showing pairwise differences
between treatment groups. Note that TBI-Sham, and SFN-TBI pairs are significantly different
while SFN-Sham is NS. Further, HMN is significant vs SFN or Sham but is not significant vs
TBI. This shows grouping of the data where SFN and Sham treated animals have similar
behavioral outcome while HMN and TBI is more similar.

256
3.9.3 Figure 3-15: Rotarod Max RPM 1-7d Post-Injury

257
Figure 3-15: Rotarod Max RPM vs Trial Day. 50% Confidence Interval shown along with mean
values and individual data points for each animal by group. Very similar to the results shown
previously but there is slightly greater partition between the HMN and TBI animal results. This
test is different from previous in that the max RPM is held constant for the final 30 seconds of
the trial so some animals will hit the max RPM and still not hit the max time.

258
3.9.4 Table 3-6: Rotarod Max RPM ANOVA Model
Rotarod Max Velocity
Model:
Velocity ~Condition*Day
Df Sum of Sq RSS AIC F Value Pr(>F)
<none>
12589 1534
Condition
3 402.09 12991 1541.9 4.397 0.004636 **
Day 6 1896.55 14486 1583.9 10.3698 1.03E-10 ***
Condition:Day 18 402.65 12992 1511.9 0.7339 0.776342
Table 3-6 A: Rotarod Contact Time ANOVA type III SS & F tests. Note Condition and Day
both show significance however there is no interaction effect.
TukeyHSD
$Condition
diff lwr upr P adj
TBI-Sham -3.72348 -5.5697798 -1.87718 1.85E-06 ***
SFN-Sham -0.254 -2.1608539 1.652846 9.86E-01 NS
HMN-Sham -2.2249 -4.1675898 -0.28221 1.74E-02 *
SFN-TBI 3.469476 1.5626264 5.376326 2.17E-05 ***
HMN-TBI 1.498583 -0.4441096 3.441275 1.93E-01 NS
HMN-SFN -1.97089 -3.9712206 0.029433 5.52E-02 .
Table 3-6 B: Tukey HSD results from Table 4A fit for Condition showing pairwise differences
between treatment groups. Note that TBI-Sham, and SFN-TBI pairs are significantly different
while SFN-Sham is NS. Further, HMN is significant vs Sham and near significant vs SFN but is
not significant vs TBI. This shows grouping of the data where SFN and Sham treated animals
have similar behavioral outcome while HMN and TBI is more similar.

259
A number of additional metrics were calculated for the Rotarod to identify underlying
shifts in animal behavior at different time points and overall. In Figure 3-16 we calculated the
individual group box plots along with their means at 1,3,5, and 7d. We observed that at day 1
each of the groups demonstrates a fairly similar spread of variance between animals but by 3d
post-injury there is an impressive shift in behavior with the Sham and TBI+SFN groups
simultaneously improving while the TBI and Hemin groups similarly lag. By 5d we begin to see
major convergence of the groups that continues through 7d when all medians are the peak test
time and is a major artifact of having a hard cap on trial time/speed. Note that no group is devoid
of outliers at day 7 and yet the difference in the Sham/SFN and TBI/HMN group pairings is still
heavily influenced by the IQR.
We further looked at some cumulative measures of performance which provide neat
insights into the changes in animal performance over time (Figure 3-17). Cumulative rotarod
time which comprises the sum of each daily trial mean results in near identical construction of
plots for the Sham and TBI+SFN groups which are distinct from both the TBI and TBI+HMN
groups. In contrast, it is interesting in examining the time delta between day 1 and day 7 that
each of the groups have an almost identical spread of improvement suggesting that day 1
performance is characteristic of day 7. Since this would appear to be at odds with intuitive
observation of Figure 3-14 & Figure 3-15, we extended the analysis by looking at the delta
between the best and worst performance in each animals trials. This better accounts for animals
which begin to decline in performance at later time intervals as well as for animals that
demonstrated aberrant day 1 performance. The result is a clear shift in group IQR which suggests
that a large part of the performance lag in the TBI+HMN treated group may be due to more
variable animal performance compared to the other groups.

260
3.9.5 Figure 3-16: Rotarod Contact Time Box Plots 1,3,5,7d Post-Injury

261
Figure 3-16: Boxplots of Rotarod Contact Time at 1,3,5,7d intervals with group means
highlighted in blue. It is clear that at all time points the range in behavior is fairly overlapping, at
1d there are notable differences in the means of the various treatment groups but in all cases the
IQR of any two overlap and this persists with the sole possible exception of Sham-HMN at 3d
where the overlap is minimal. As time moves forward the means of all groups increase and due
to the hard cap on performance (130 seconds is the maximum regardless of ability to continue
further) there is a steady increase in outliers as time continues and the means of all groups
condense towards the same value of just under 130s.

262
3.9.6 Figure 3-17: Cumulative Rotarod Metrics

263
Figure 3-17: Boxplots of Cumulative Rotarod Performance Contact Time Metrics. (A) shows
Cumulative Rotarod Time by group condition demonstrating that the aggregate time spent on the
device diverges as expected into two similar sets of SHM-SFN and HMN-TBI. (B) shows the
improvement from Day 1 to Day 7. Note that the SHM group does not improve as strongly as the
other groups in part because the 1d performance is higher. (C) shows the difference between the
maximum and minimum performance of each animal by group. This is similar to (B) but better
accounts for animals that have variable early or late performance. The result is shows that all
TBI and TBI-Drug groups have similar performance improvements while the SHM group has
limited improvement to high 1d performance.

264
3.9.7 Summary of Observations Rotarod
The major observation of our Rotarod analysis appears to be a stratification of the
different groups into Sham/SFN and TBI/HMN pairs where the Sulforaphane treatment appears
to have a robust behavioral effect that improves performance within a few days of initiating the
trial. It is interesting that both groups showed an initial 1d improvement vs TBI and yet only the
TBI+SFN group showed a robust improvement in the following days with the TBI+HMN group
possibly showing an effect at later times that is largely washed out by too many animals hitting
the peak test performance. It is possible that initiating the rotarod later in the post-injury period
would show greater discrimination between the TBI and TBI+HMN groups if the lag in
performance is interpreted to be due to a lack of drug availability since Hemin is relatively
insoluble but this would be unexpected given the robust HO-1 and heme blanching effect
observed previously.

265
3.10 Zymogram changes and long term sequelae of tissue damage (FTL)
3.10.1 Zymogram Results
Drug treated groups show consistent depression of gelatinase activity with varying
degrees of significance. We observed that in the neocortex HMN and SFN samples were run
separately and MANOVA using the model [𝑷𝒓𝒐𝑴𝑴𝑷𝟗,𝑨𝒄𝒕𝒊𝒗𝒆𝑴𝑴𝑷𝟗,𝑴𝑴𝑷𝟐]~𝑫𝒂𝒚 ∗
𝑪𝒐𝒏𝒅𝒊𝒕𝒊𝒐𝒏 with wilks correction showed significant main effects in the HMN samples due to
Day and Condition (p=2.165e-06, 0.03758 respectively). The derivative ANOVAs for each
enzyme show significance in Pro-MMP9 for Day (p= 9.178e-08) and in Active-MMP9 in Day
and Condition (p=3.338e-07, 0.01435 respectively). In the SFN samples using the same model
we observed that there were significant main effects due to Day and Condition (p=2.165e-06,
0.0351 respectively). The derivative ANOVAs for each enzyme show significance in MMP2 for
Day and Condition (p=0.01990, 0.04495). Pro-MMP9 for Day (p= 1.781e-11), in Active-MMP9
in Day (p=3.149e-06). Isolating the MANOVA in the neocortex to just the TBI-Drug
comparisons we observed that TBI-HMN had significant main effects due to Day and Condition
(p=0.0004223, 0.0375755 respectively), the derivative ANOVAs showed Conditional
significance only in Active-MMP9 (p= 0.01435). TBI-SFN had significant main effects due to
Day and Condition (p= 3.968e-10, 0.0351 respectively), the derivative ANOVAs showed
Conditional significance only in MMP2 (p= 0.04495).
We observed that in the hippocampus HMN and SFN samples were run separately and
MANOVA using the model [𝑷𝒓𝒐𝑴𝑴𝑷𝟗,𝑨𝒄𝒕𝒊𝒗𝒆𝑴𝑴𝑷𝟗,𝑴𝑴𝑷𝟐]~𝑫𝒂𝒚 ∗ 𝑪𝒐𝒏𝒅𝒊𝒕𝒊𝒐𝒏 with
wilks correction showed significant main effects in the HMN samples due to Day only

266
(p=2.594e-12). The derivative ANOVAs for each enzyme show significance in MMP2 for Day
(p=1.202e-05), Pro-MMP9 for Day (p= 2.782e-09) and in Active-MMP9 in Day (p=0.0004085).
In the SFN samples using the same model we observed that there were significant main effects
due to Day and weak significance in Condition (p=1.967e-07, 0.05275 respectively). The
derivative ANOVAs for each enzyme show significance in MMP2 for Day and Condition
(p=2.496e-05, 0.01162). Pro-MMP9 for Day (p= 9.948e-06), in Active-MMP9 in Day
(p=0.0001648). Isolating the MANOVA in the hippocampus to just the TBI-Drug comparisons
we observed that TBI-HMN had significant main effects due to Day only (p= 2.594e-12), the
derivative ANOVAs do not show Conditional significance in any enzyme. TBI-SFN had
significant main effects due to Day and weak significance in Condition (p= 1.967e-07, 0.05275
respectively), the derivative ANOVAs showed Conditional significance only in MMP2 (p=
0.01162).
In the neocortex the hemin treated group shows weak significant depression from TBI in MMP2
activity at 7d. In the MMP9 metric there is significant depression by 3d to Sham levels in the
active form while the pro-form is depressed but not significantly.
The TBI+SFN treated group shows a very similar general trend though with different
points of significance. At 3d post injury MMP2 activity is weak-significantly reduced vs Sham
though this does not continue through 7d. More oddly, while there is reduction in Pro-MMP9
expression to Sham levels at 3d, there was anomalously high expression of Pro-MMP9 at 7d .
The active MMP9 form does not show significance vs TBI but nonetheless appears depressed at
3d post injury, midway between Sham and TBI expression.

267
The hippocampus demonstrates a similar pattern of gelatinase expression compared to the
neocortex – the major pattern difference is that the pro form of MMP9 does not peak nearly as
high in expression. Nonetheless a similar pattern of drug expression effects is seen with
generalized depression compared to TBI in the majority of metrics. Notably the TBI+SFN group
has significantly reduced MMP2 expression at 1d and 3d post injury compared to the TBI group.

268
3.10.2 Figure 3-18: Zymography for MMP2, MMP9 in Drug Treated Neocortex

269
Figure 3-18: Neocortical expression of the gelatinases MMP2 and MMP9 (Pro and Active
forms) 1d-7d post injury in TBI and TBI+HMN/SFN animals compared to Sham. Note
similarities in expression between TBI and TBI-Drug groups with generalized depression in most
metrics. (Mean ± SEM, n=4/group; T-Test with Benjamini-Hochberg correction, ●, *, **, ***
for p < .10, .05, .005, .0005 respectively vs Sham, ₵, $, for p<.10, .05 vs TBI).

270
3.10.3 Figure 3-19: Zymography for MMP2, MMP9 in Drug Treated Hippocampus

271
Figure 3-19: Hippocampal expression of the gelatinases MMP2 and MMP9 (Pro and Active
forms) 1d-7d post injury in TBI and TBI+HMN/SFN animals compared to Sham. Note
similarities in expression between TBI and TBI-Drug groups with generalized depression in most
metrics. (Mean ± SEM, n=4/group; T-Test with Benjamini-Hochberg correction, ●, *, **, ***
for p < .10, .05, .005, .0005 respectively vs Sham, $ for p<.05 vs TBI).

272
3.10.4 Summary of Observations Zymography
In the zymograms we observe that there seems to be a general suppression of expression
during drug treatment but that this is only rarely significant at any time point. In all cases the
expression of MMP2, and both Pro-MMP9 and Active-MMP9 appear to follow a similar time
dependent profile as the TBI group. The grouped comparisons via MANOVA however reveal
that there appear to be drug effects when considering the whole set of results and that these
effects appear to be different depending on the drug applied – Sulforaphane appears to have a
consistent effect on MMP2 in both the neocortex and the hippocampus while the effect of Hemin
appears to be more restricted to the active form of MMP9 and only found significant in the
neocortex.

273
3.10.5 FTL Results
In our FTL results we see that there are modest shifts in the neocortical which is expected
based on our previous HO-1 results and minimal shifts in our hippocampal measures. In the
neocortex, ANOVA using the model 𝑽𝒂𝒍𝒖𝒆~𝑫𝒂𝒚 ∗ 𝑪𝒐𝒏𝒅𝒊𝒕𝒊𝒐𝒏 we have significant main
effects in Day, Condition, and their interaction (p=1.514e-05, 6.477e-07, 0.0003856
respectively). TukeyHSD of group effects showed significant differences in Sham-HMN
(p=0.0142169), Sham-SFN (p=0.0174498), Sham-TBI (p<0.0000005), and near but no
significance in TBI-SFN (p=0.1211002), and TBI-HMN (p=0.1659528). In the hippocampus,
ANOVA using the model 𝑽𝒂𝒍𝒖𝒆~𝑫𝒂𝒚 ∗ 𝑪𝒐𝒏𝒅𝒊𝒕𝒊𝒐𝒏 we have significant main effects in Day,
Condition, but not their interaction (p=0.0001035, 6.571e-06, 0.1004482 respectively).
TukeyHSD of group effects showed significant differences in Sham-HMN (p=0.0002607),
Sham-TBI (p<0.0000119), weak significance in Sham-SFN (p=0.0716488), near but non
significance in TBI-SFN (p=0.1780772), and no significance in TBI-HMN (p=0.9981158).
FTL is significantly elevated in the drug treated neocortex 1d post injury while the TBI
group is not elevated. By 3d however this significance has disappeared in the drug groups and
both appear suppressed relative to the TBI which is significantly elevated vs Sham. The
TBI+SFN group is significantly different from the TBI at this time point. All groups peak in
expression at 7d post injury, with TBI peaking substantially higher than the TBI+Drug groups,
~50% higher, and by day 15 all TBI/TBI+Drug groups converge as expression declines.
Significance vs sham is lost in all groups except the TBI+SFN group but all the TBI groups are
similar in expression. In the Hippocampus FTL is unaffected at day 1 and is increased in all
groups at day 3, with weak significance in the TBI group, and significance occurs in all TBI
groups relative to sham by 7d which is largely maintained through day 15 with sustained

274
elevation of FTL compared to the neocortex. It is notable that the TBI+SFN group shows an
early modest increase in FTL compared to other TBI groups at 1d and from that point
consistently lags behind the other groups through 15d.

275
3.10.6 Figure 3-20: FTL Western Blot Results Drug Treated 1-15d Post-Injury

276
Figure 3-20: Western Blot expression of the iron storage protein Ferritin (FTL) in TBI,
TBI+HMN, and TBI+SFN animals compared to Sham 1-15d post-injury. Note similarities in
expression between TBI and TBI+Drug groups with acute depression at 3d in the neocortex and
at 7d in the TBI+SFN hippocampus. (Mean ± SEM, n=4-7/group; Wilcoxon-Test with
Benjamini-Hochberg correction, ●,*, **, *** for p < .10, .05, .005, .0005 respectively vs Sham,
$ for p<.05 vs TBI).

277
3.10.7 Table 3-7: FTL Western Blot ANOVA Model
Neocortex
Mean±SEM
Day 1 Day 3 Day 7 Day 15
Sham 1.00±0.06 1.00±0.10 1.00±0.18 1.00±0.08
TBI 1.20±0.14 2.25±0.23 3.81±0.81 1.45±0.16
HMN 1.65±0.18 1.35±0.25 2.15±0.19 1.55±0.26
SFN 1.47±0.14 0.93±0.14 2.45±0.51 1.65±0.10
Hippocampus
Mean±SEM
Day 1 Day 3 Day 7 Day 15
Sham 1.00±0.08 1.00±0.15 1.00±0.12 1.00±0.12
TBI 1.12±0.09 1.93±0.36 3.69±0.70 2.88±0.84
HMN 1.04±0.22 1.89±0.56 3.41±0.0.91 2.91±0.53
SFN 1.28±0.40 1.59±0.18 2.19±0.45 2.05±0.31
Table 3-7: FTL mean expression over control of each condition by group 1-15d and presented as
Mean ± SEM in Neocortex and Hippocampus. Note peak expression of FTL at 7d post injuryand
conversion of drug treated groups with TBI at at 15d.

278
3.11 Long Term Behavioral Shifts
3.11.1 Morris Water Maze
In order to study longer term behavioral effects of injury and HO-1 targeted
pharmacotherapy we utilized the Morris Water Maze as a metric of largely hippocampal function
which has been well characterized in a variety of rodent paradigms including traumatic brain
injury models. The Morris water maze is primarily a test focused on learning, memory, and
spatial awareness though there are minor crossovers with cortical motor function as is typical of
most physical tests.
In our paradigm we used a 1.8 m diameter pool with 60 cm high side walls filled with
opaque water ~28 cm deep which hides a 10cm diameter clear plexiglass platform 2 cm below
the surface in the south eastern quadrant of the pool. During 4 training days each animal is
randomly without duplication placed sequentially in each ordinal starting position and allowed to
search for the platform for 120s. After training, on the fifth testing day a probe trial is performed
where each animal is placed in an identical starting position and allowed for 60s to search for the
platform which has been removed. We recorded the latency of the animals to the platform as
well as their search patterns and after subsequently derived numerous derivative properties
including swim speed, quadrant time, platform proximity, and relative platform proximity and
contrasted the groups via ANOVA and post-hoc parametric tests.
We initially begin by characterizing the animals during their training phase, focusing in
on Path Length, Platform Latency, and Swim Speed. It should be noted that these metrics are
interrelated since ending the test necessarily truncates both the Path Length and Platform

279
Latency metrics while Swim Speed is directly calculated from dividing distance traveled by the
time. Path Length and Platform Latency provide a metric of whether the animals are successfully
mastering the test while Swim Speed is a screening metric to establish if there are any confounds
driven by something that impairs motor function.
During the Morris water maze training phase the general metrics of performance show
that the groups all appear to behave largely as expected. The interrelated measurements of Path
Length and Platform Latency show that the Sham group quickly learns the task by about day 2
and the injured groups lag behind with notably impaired performance on day 1. Interestingly,
both drug treated groups appear to have a similar 1d-2d performance improvement compared to
the Sham group though they start from an inferior performance. Further, both the Hemin and
Sulforaphane treated groups appear to have matching performance until day 4 when they diverge
with the TBI+HMN group improving further to near Sham metrics while the TBI+SFN treated
group oddly decreases in performance and has a final training day mean almost identical to the
TBI group. The swim speed metric shows that there are no significant motor differences between
the groups and swim speed is largely constant after a slight day 1 elevation.

280
3.12 General Metrics: Path Length, Platform Latency, Swim Speed
3.12.1 Figure 3-21: Morris Water Maze Path Length during Training 11-14d Post-
Injury

281
Figure 3-21: Morris Water Maze Path Length by Day during training phase of testing
contrasting group behavior. Mean performance within 1 SEM is shown as well as individual
animal performance scores. Note Sham path length is relatively constant after day 2 while other
groups continue to improve through the end of the training phase. Additionally note that the 1d-
2d improvement delta is comparable between Sham and both the TBI+HMN and TBI+SFN
groups while being different from the TBI group. Observe convergence towards 1m at day 4.

282
3.12.2 Figure 3-22: Morris Water Maze Latency to Platform Post-Injury 11-14d

283
Figure 3-22: Morris Water Maze Latency by Day during training phase of testing contrasting
group behavior. Mean performance within 1 SEM is shown as well as individual animal
performance scores. Note Sham latency is relatively constant after day 2 while other groups
continue to improve through the end of the training phase. This value is highly correlative to path
length and note convergence towards ~15 s at day 4.

284
3.12.3 Figure 3-23: Morris Water Maze Swim Speed 11-14d Post-Injury

285
Figure 3-23: Morris Water Maze Swim Speed by Day during training phase testing contrasting
group behavior. Mean performance within 1 SEM is shown as well as individual animal
performance scores. Note that swim speed is relatively constant among all groups with a modest
elevation during the first trial day which stabilizes 2-4 days.

286
3.12.4 Water Maze Heat Maps for Individual Groups
After noting the initial performance metrics for the training phase of the Morris water
maze test, we next moved on to examining the probe trial data. Since we no longer have a
latency score to compare animals by and given that relatively constant swim speed previously
identified suggests that path length is not a meaningful measure we used derivative metrics
obtained from the animal paths to distinguish between the overall profiles of their behavior. First
however, we looked at the individual tracks of the animals in the different groups noting general
behavioral trends as well as occasional extreme outliers.
We see in the Sham group (Figure 3-24) that the majority of animals appear to
demonstrate an intense focal search near the platform which largely consists of target scanning
behavior with a mixture of scanning surroundings and periodic wall touches. The animals
uniformly search the south eastern quadrant where the platform was previously located and all
animals quickly cross over the platform site before proceeding towards focal or moderately
expansive search patterns.
We see in the TBI group (Figure 3-25) that the majority but not all animals cross the
platform and the searches are remarkably different from the Sham group. There is still a small
subset of animals that engage in a target scanning behavior but more typically they demonstrate a
random focused search or a mixture of thigmotaxis (wall hugging) or incursion (wall bouncing)
behavior. In the majority of cases these behaviors still result in crossing the platform location but
it was observed that it seemed to take longer before this occurred relative to the Sham group.

287
The TBI+HMN (Figure 3-26) group shows a general reversal of TBI behavior which
appears much more closely related to Sham. All animals cross the platform site and the majority
engage in target scanning and scanning of surroundings with occasional deviation towards focal
scanning a moderate distance away from the platform. There is a general absence of thigmotaxis
with a single exception and only a moderate amount of incursion with an apparent preference for
broad scanning searches.
The TBI+SFN (Figure 3-27) group in contrast shows similar behavior to the TBI group.
All animals cross the platform but it takes them a while. Only 1/9 animals show any semblance
of a targeted search and only 2/9 (including previous) showed any focused search pattern.
Instead the animals strongly tended towards thigmotaxis, incursion, and chaining (concentric
paths a set distance from the walls) which show a distinct search pattern.
These heat maps demonstrate that not only do the animals have different success rates at
getting to the platform and learning the test as identified in the training phase, they also have
different behavior in how they attempt to search for the platform that appear to be influenced by
1d induction of HO-1.

288
3.12.5 Figure 3-24: Morris Water Maze Probe Trials for Individual Sham Animals
Figure 3-24: Heat Maps of Probe Trials for individual Sham animals showing general pattern of
behavior. Note that all animals search near the platform with some variance in how widely the
animals search. All animals concentrate their search patterns in the south eastern (lower right)
corner of the maze.

289
3.12.6 Figure 3-25Morris Water Maze Probe Trials for Individual TBI Animals
Figure 3-25: Heat Maps of Probe Trials for individual TBI animals showing general pattern of
behavior. Performance is markedly worse compared to the Sham group. Note that not all
animals cross the platform, unlike other groups shown and many of the search patterns are
focused on the center of the pool though in aggregate they tend towards the south and eastern
edges. Further note two identified outliers of NR95 which only exhibited wall searching behavior
and avoided the center of the pool, and NR93 who repetitively crossed the platform in a very
constrained search aberrant for the group.

290
3.12.7 Figure 3-26Morris Water Maze Probe Trials for Individual TBI+HMN Animals
Figure 3-26: Heat Maps of Probe Trials for individual TBI+HMN animals showing general
pattern of behavior. Performance is comparable to Sham performance with concentrated searches
in the south eastern corner of the maze. Note that the majority of animals search in a fairly
confined area near the platform location with the notable outlier of NRH14 which crosses the
platform but does not generally search near its location.

291
3.12.8 Figure 3-27Morris Water Maze Probe Trials for Individual TBI+SFN Animals
Figure 3-27: Heat Maps of Probe Trials for individual TBI+SFN animals showing general
pattern of behavior. Performance is markedly different from Sham and appears most similar to
TBI. Note that all animals appear to cross the platform at some point during their search but also
that they tend to search very broadly throughout the pool and in general show the broadest search
patterns of any group.

292
3.12.9 MWM Summaries and Analysis
After examining the individual behavior of the animals by condition in the Morris water
maze test we then moved from subjective observations of search patterns into derived numerical
scores of their search patterns. As our first step we generated a combined heat map that
condenses the performance of each group into a more easily digestible form (Figure 3-28). The
similarities between the Sham and TBI+HMN groups are apparent in the figure as well as the
contrasting similarities between the TBI and TBI+SFN groups. In all cases there is a general
focused search into the south eastern quadrant of the pool with a slight bias towards the southern
position which may be an artifact of all probe trial animals starting in the identical west position.
It is also quite clear that the Sham and TBI+HMN groups largely avoid the northern edge of the
pool while the TBI and TBI+SFN frequently pass through.
Converting this data into a numerical form we investigated the group differences in the
Quadrant Score (time spent in the south eastern quadrant, Figure 3-29), the Proximity Score
(average distance from the platform during the test, Figure 3-30), and the Relative Proximity
Score (a dimensionless inverse measure of proximity score divided by the line length from the
platform to the wall that lies through the given animal position, Figure 3-31). We see from the
quadrant score that there is a clear split between the Sham and TBI+HMN groups vs the TBI and
TBI+SFN groups which is largely expected from our previous observations. In the quadrant
score the Sham has the best performance with the TBI+HMN group close behind and both the
TBI and TBI+SFN group lagging substantially. The proximity scores show a similar story
although in this measure of proximity to the platform the TBI+HMN group appears moderately
better than the Sham group as a result of the TBI+HMN tendency to search from the center of the

293
pool rather than the wall. Both the TBI and TBI+SFN continue to lag in this metric. Finally, the
relative proximity score shows similar results to the proximity score with slightly modified
means and interquartile ranges.
We continued the analysis by running the ANOVA and TukeyHSD analysis on the group
data against the training phase and the probe trial individually and against the full time course.
Note that as the metrics chosen are all averages they are dependent on the test latency. The
Quadrant Score during the training phase (Table 3-8) shows that the Sham group is statistically
significant from all other groups while the other groups were all non significant. The
stratification during training was exactly along whether the animal received a TBI initially.
During the probe trial in contrast (Table 3-9), stratification appears to occur similar to
what would be expected from our observations in Figure 3-28. The Sham group is significant vs
TBI and TBI+SFN but not TBI+HMN while the TBI group is weakly significant vs the
TBI+HMN group and not different from the TBI+SFN group.
Here we find a bit of an interesting story – if analyzing the probe trial using relative
proximity we find the same pattern of significant and non-significant as the Quadrant Score with
the exception that the TBI-Sham group is now weakly significant while the TBI+HMN group is
significantly different. Further, analysis of the whole time course using the relative proximity
score shows the expected stratification with the TBI group different from all others except
TBI+SFN significantly and the Sham group different from all others except the TBI+HMN
group.

294
3.12.10 Figure 3-28: Morris Water Maze Probe Trial Heat Maps by Condition

295
Figure 3-28: Aggregate Heat Maps of Probe Trials by condition for Sham, TBI, TBI+HMN, and
TBI+SFN animal groups. Paths have been removed to allow for better interpretation of data and
the similarities between the SHM/HMN and TBI/SFN groups are easily apparent based on search
density. All groups in aggregate show a similar general search direction towards the south
eastern corner of the maze and note that all animals were started in the east (left side) position.
This data set has removed the outliers previously identified in the water maze tracks.

296
3.12.11 Figure 3-29: Morris Water Maze Probe Trial Quadrant Score by Group

297
Figure 3-29: Box Plot Comparisons of Quadrant Score by Condition during day 5 probe trial.
Note similarities between the SHM and HMN groups vs SFN and TBI groups. Note Normality of
SHM group. Since dropping outliers in HMN and SFN artificially restricted variance they were
maintained in the set.

298
3.12.12 Figure 3-30: Morris Water Maze Proximity Score by Group

299
Figure 3-30: Box Plot Comparisons of Proximity Score by Condition during day 5 probe trial.
Note similarities between the SHM and HMN groups vs SFN and TBI groups.

300
3.12.13 Figure 3-31: Morris Water Maze Relative Proximity Score by Group

301
Figure 3-31: Box Plot Comparisons of Relative Proximity Score by Condition during day 5
probe trial. Note similarities between the SHM and HMN groups vs SFN and TBI groups.

302
3.12.14 Table 3-8: Morris Water Maze Training Quadrant Score ANOVA Model
TukeyHSD
QSAve
Training
$Condition
diff lwr upr p
TBI-SHM -0.07548 -0.14618 -0.00477 0.031491 *
HMN-SHM -0.07192 -0.14262 -0.00121 0.044586 *
SFN-SHM -0.10115 -0.16955 -0.03276 0.001054 ***
HMN-TBI 0.003562 -0.07252 0.079643 0.99935 NS
SFN-TBI -0.02568 -0.09961 0.048259 0.802708 NS
SFN-HMN -0.02924 -0.10318 0.044697 0.732513 NS
Table 3-8: Training Phase Morris Water Maze TukeyHSD from ANOVA Quadrant Score
QSAve ~Day*Condition. Note that during training Sham is different from all other groups
significantly, but there are no other pairwise significant results. To some extent this is
unsurprising since the TBI and TBI-Drug groups all originate with a similar impediment that
strongly influences their ability to master the task.

303
3.12.15 Table 3-9: Morris Water Maze Probe Trial Proximity Score
TukeyHSD
PSAve
Probe Trial Day
$Condition
diff lwr upr p
TBI-SHM -0.10087 -0.19579 -0.00596 0.033826 *
HMN-SHM -0.00929 -0.1042 0.08563 0.993348 NS
SFN-SHM -0.15736 -0.24917 -0.06555 0.000312 ***
HMN-TBI 0.091587 -0.01055 0.193722 0.091669 .
SFN-TBI -0.05649 -0.15574 0.042772 0.425325 NS
SFN-HMN -0.14807 -0.24733 -0.04881 0.001689 ***
Table 3-9: Probe Trial Phase TukeyHSD from ANOVA Proximity Score PSAve ~Condition.
Note that HMN is different from SFN and from TBI group. SHM is different from SFN but only
weakly significant vs TBI which is interesting but due to the large spread in values.

304
3.12.16 Table 3-10: Morris Water Maze All Days Relative Proximity Score
$Condition
PHPAve
All days
diff lwr upr p
SFN-HMN -0.10414 -0.17831 -0.02997 2.03E-03 **
SHM-HMN 0.015193 -0.05573 0.08612 9.45E-01 NS
TBI-HMN -0.08391 -0.16023 -0.00759 2.49E-02 *
SHM-SFN 0.119333 0.050725 0.18794 7.15E-05 ***
TBI-SFN 0.020228 -0.05394 0.094399 8.94E-01 NS
TBI-SHM -0.09911 -0.17003 -0.02818 2.16E-03 **
Table 3-10: All Days TukeyHSD from ANOVA Relative Proximity Score
PHPAve~Condition*Day. Note that SHM-HMN and TBI-SFN are the only non significant pairs.
SHM and HMN essentially are the same, TBI-SFN are the same. This gives probably the best
score, is essentially a proximity score that has a modified back end.
305
3.12.16.1 Summary of MWM observations
We observe that there are multiple points where the Morris water maze behavior of the
animals tested appears to stratify along one or another factorial condition. During training it is
clear that TBI regardless of drug treatment causes impaired day 1 performance which has a
lasting impact throughout the test. Drug treated animals demonstrate a similar day 1-2
improvement in performance as the Sham and generally show a similar profile of improvement.
This may indicate that the animals were capable of learning the location of the platform
effectively but experienced some other non-motor inhibition to completing the task. As a partial
explanation – it was frequently observed, especially in the TBI+SFN animals, that some of the
drug treated animals would complete the test by reaching the platform, and then would promptly
jump off and continue swimming; which is to say that the animals learned to complete the task
but did not appropriately finish it.
When looking at the swim paths during their probe trials it is similarly clear that the
animal groups (and individually) develop different search pattern techniques. On aggregate they
are with only a single exception all successful patterns for finding the platform though some are
more effective than others. Why specific drug treated groups tended towards search patterns
aberrant from either the TBI or Sham search patterns is unknown. By the time we come to
calculating metrics it is abundantly obvious that there are two distinct groupings of
TBI/TBI+SFN and Sham/TBI+HMN but depending on which metric is used and the relative
weighting of the particular search pattern determines whether the TBI-Sham or TBI-TBI+HMN
comparisons are significant p <0.05 or significant p<0.10 via post-hoc TukeyHSD.
306
3.13 Discussion Chapter 3
3.13.1 Summary Chapter 3
In Chapter 3 we have identified the effects of pharmacologically upregulating Nrf2/HO-1
with either Hemin or Sulforaphane in a critical window after TBI. We found both treatment
paradigms produced robust changes in histology, protein expression, and behavioral outcomes.
Treatment appeared to shift the heme processing response to an earlier time course with net
reductions in heme processing protein expression generally observed at later time points. While
both drugs had highly similar effects on a number of critical measures, there were also numerous
cases where the two drugs demonstrated divergent outcomes suggesting that the causal
relationship between Nrf2/HO-1 induction and desirable outcomes is complex.
It is particularly interesting that throughout the time course we see changes in histology,
protein expression, and behavioral outcomes after a single 1hr post-injury dose with two
different Nrf2/HO-1 activating agents. To an extent this may be complicated in the Hemin
treated case since it persists in the peritoneal cavity through 15d. However, the robust 1d effect
in clearing the heme from the injury site indicates that there is an acute day 1 effect from the
drug. Further, the observation of long term behavioral changes in the Sulforaphane treated
animals demonstrates that there is an acute window where pharmacologic manipulation is
capable of producing change in long term outcome, even with an agent that is rapidly
metabolized.

307
3.13.2 Discussion Chapter 3
3.13.2.1 Targeted HO-1 Induction Premise
In this study we examined the temporal and spatial response of HO-1 and heme
processing when the Nrf2/HO-1 pathway is induced pharmacologically during the early post-
injury period. An underlying premise to this work is the delayed lysis and erythrophagocytosis
that occurs after a hemorrhagic injury, which in bulk occurs 48+ hours after in the initial loss of
vascular integrity (Cao et al., 2016; Lu et al., 2014; Xi et al., 1998). In this context early post-
injury dosing functions largely in a pre-conditioning role during what is posited as a critical
window of HO-1 activation. It has been well established in TBI and many other traumatic
injuries that a wide variety of pre-conditioning treatments are effective at mitigating post-injury
pathology (Yokobori et al., 2013). The fundamental problem has always been that predicting a
traumatic event is difficult and a fairly low effective yield proposition. In circumstances of well-
established etiologies such treatments have shown population wide effectiveness (e.g. low dose
aspirin) but such disease conditions are relatively rare to come by. In this circumstance, with a
known delayed pathological event that occurs a specific time after injury, there is the opportunity
to apply a pre-conditioning paradigm to a post-injury treatment since the insult being affected
(heme release) is delayed after the initial injury.
We have selected two somewhat broad range agents to induce this pre-conditioning,
Hemin and Sulforaphane, because there is a lack of highly specific agents that target Nrf2/HO-1
(Ryter et al., 2006). Development of such agents is currently a hot topic in research, and notably,
most Nrf2 activators are currently measured as a percentage of Sulforaphane effectiveness (Kuo
et al., 2016; Ahuja et al., 2016; Carreno-Velazquez et al., 2016). Each of the drugs targets HO-1
induction in a slightly different way. Sulforaphane is known to directly interact with the Nrf2

308
repressor protein Keap1, causing a conformational change and releasing Nrf2 to affect
downstream transcription (Ryter et al., 2006). Sulforaphane is highly soluble and readily taken
up by cells systemically. Hemin mechanism, in contrast, is less certain. It has been suggested that
hemin works by degrading circulating heme binding proteins, thus attenuating the expansion of
heme signals after traumatic insult to cause a limited local injury (Regan and Panter, 1996; Lu et
al., 2014). In this process locally generated heme acts on nearby cells and induces Nrf2/HO-1 via
the endogenous pathway. It has alternately been suggested that heme binding to hemopexin
rather than simply occupying circulating heme binding proteins instead acts to solubilize heme
allowing it to be distributed systemically (Mehta and Reddy, 2015).
It is important to note several distinctions between the data presented in this chapter and
that of Chapter 2. Here the animals were all exposed to behavioral testing of some kind prior to
tissue sampling. All animals were exposed to the rotarod until their protein extraction or
perfusion date and all animals that survived to 15d were run both on the rotarod and in the
Morris water maze. We expect that the addition of behavioral testing and stress will have a
modest effect on the resulting molecular measures due to an active learning process that occurs
in conjunction with required physical activity, both of which are known to affect recovery after
injury (Vanderbeken and Kerckhofs, 2017; Morris et al., 2016).
3.13.2.2 Drug Treated Heme Processing
We see a robust, immediate effect in our 1d contrast images of heme pigment in the
tissue. There is remarkable blanching of the necrotic site seen in both the TBI+SFN and
TBI+HMN animals and it is also easy to see the necrotic vacuolization that occurs after injury
and which normally contains significant heme pigment. In place of the normally reddish heme
pigment we instead see a pale yellow color indicative of residual bilirubin. In the sections shown

309
there is more yellow pigment in the TBI+SFN animals and a more translucent appearance in the
TBI+HMN animals. This suggests that either heme has been locally consumed/expelled from the
erythrocytes or erythrophagocytosis has been shifted to earlier to an earlier post-injury interval.
These results are consistent with images shown by Lu et al., in their Hemin treatment of the ICH
paradigm though they did not directly address heme pigment shifts in their paper (Lu et al.,
2014). Several authors have noted an association between HO-1 and erythrophagocytosis both
as the effector of ultimate processing of heme and also as a potential driver of increased
erythrocyte degradation (Cao et al., 2016; Alfieri et al., 2013; Lu et al., 2014).
3.13.2.3 Drug Treated HO-1 Expression
When we then look at the western blot time course of HO-1 expression 1-15d after injury
we see a similar story. 1d expression of HO-1 is similar in both the TBI and TBI+HMN/SFN
groups, however, there is a significant reduction in HO-1 in treatment groups at 3d post-injury
which demonstrates that peak expression of HO-1 has shifted in the drug treatment groups to ~1d
post-injury. Further, we see that the HO-1 expression in the TBI+HMN group is modestly
higher than TBI at 1d but is lower than even the TBI+SFN group by 3d further supporting the
idea that increased early HO-1 leads to decreased long term HO-1 level. TBI+SFN, in contrast,
has a gentler decline over time. Even with these decreases it should be noted that through 15d,
even when we lose significance vs the Sham, the TBI+HMN and TBI+SFN groups continue to
show modest increases in expression. This demonstrates that injured-treated animals continue to
show some HO-1 response, even if a significant portion of the heme-related injury process has
been preferentially cleared.
Interestingly, when we look at the peak cortical expression of HO-1 compared to the
hippocampus at 3d post-injury we see an effect similar to that reported in Chapter 2, where peak

310
expression of HO-1 is higher in the hippocampus than in the neocortex (16.42x in the
hippocampus, 9.46x in the neocortex). However, this is not observed in the drug treated groups
at 3d where nearly identical values are reported for the two regions in the TBI+SFN animals
(3.88x in neocortex, 4.07 in hippocampus) and the reverse pattern is seen in the TBI+HMN
group (3.43x neocortex, 2.42x hippocampus). Interestingly, if we make the same comparison at
1d post-injury we revert to the previous pattern with higher elevations in Hippocampal
expression compared to the neocortex. It appears that regardless of treatment peak HO-1
expression is consistently higher in the hippocampus.
We note the contrast between our results and those obtained by Alfieri et al in their
Sulforaphane treated paradigm of I/R in stroke (Alfieri et al., 2013). While we only have a
snapshot of their findings they identified a significant increase in HO-1 as a percentage of
ipsilateral hemispheric control at 1d post-injury vs untreated animals. Unfortunately we do not
have a good data comparison since they used a measure of HO-1 induction area rather than a
western blot analysis of HO-1 protein. Thus, it is unknown if there was an upregulation in
protein expression or a just broadening of HO-1 area. We have previously observed in Chapter 2
that there is wide dispersion of HO-1 expression during the immediate post-injury period, which
becomes more focal and organized over time. In IHC images we also observe that TBI+SFN
treated animals frequently show a broad degree of HO-1 background staining which is distinct
from both the TBI and TBI+HMN tissues.
We also note a few differences between the TBI/Sham data set in this chapter and that
previously described in Chapter 2. In this data set we see modestly lower 3d HO-1 expression
and higher 1d HO-1 expression in the hippocampus which more closely matched the cortical
time course. Further, we found persistent elevation through 15d in both the neocortex and

311
hippocampus. These shifts may be explained, in part, by additional stress of behavioral testing in
these animals. Moreover, the choice to employ data analysis with non-parametric tests, as the
reduced number of samples permitted single blot multi-group comparisons, created a less than
normally distributed data set with heavy tails due to central limit theorem considerations. If we
focus on the interpretation that behavioral stress was a factor, it can be noted that increased blood
pressure is known to have an effect on leakage of intravascular constituents into the parenchyma
simply due to fluid dynamics. As such, we may have effectively utilized a pump to increase net
perfusion into the tissue.
IHC of HO-1 supported our previous observation of blanching in the 1d drug treated
tissue. Notably, there is a clear pigment shift in the cortical necrotic site as we lose
autofluorescence in the red channel indicating a loss of heme or erythrocyte pigment at the
necrotic site. Further, this shift is sequential, with the TBI group showing extensive reddish
pigment, the TBI+SFN group showing some, and the TBI+HMN group showing essentially
none. In paired staining with LCN2 we also see that the morphology of the astrocytes (previously
identified via GFAP reactivity) has shifted from an anisotropic reactive appearance to a
progressively isotropic organization. Their processes extended parallel to the pial surface with a
shift in expression of both HO-1 and LCN2 from largely somatic to more process oriented
profiles. In general there appears to be more cellular organization of the HO-1 response in the
drug treated groups and the bleeds appear more resolved. In the hippocampus, where we do not
see necrosis, there is also a more organized response. In drug treated tissue it is notable that HO-
1 and LCN2 appear in more distinct laminar profiles, while expression appears broader across
the dentate gyrus in the 1d untreated animals. These observations continue through 3d post-
injury where in the neocortex we see a substantial reduction in bleed/necrotic site area and

312
concurrent reduction in general HO-1 reactivity. The hippocampus shows a similar shift though
we lack a direct comparison of a major hemorrhagic site.
By 7d, when we look at HO-1 vs GFAP near the necrotic site, there is loss of co-
expression, which we have seen previously, and the remaining HO-1 which is highly expressed
in the center of the bleed site, is much reduced in both the TBI+SFN and the TBI+HMN groups.
Further, there appear to be HO-1 halos that form around small vessels which are not cell
localized, suggesting an enhanced vascular or iron trafficking response in the drug treated tissue.
At 15d when we contrast HO-1 with FTL after the different treatments we see clear change from
TBI cases which show high expression of both HO-1 and FTL in cells scattered throughout the
damaged tissue. The TBI+HMN group seems particularly reduced in area and intensity vs the
TBI and the 15d TBI+SFN animal seems similar to TBI but with a greater shift towards HO-1 vs
FTL. In summary, the HO-1 data appears to show differences between the treated and untreated
animals, observed in both the quantitative measures of protein expression and in the IHC tissue
distribution.
3.13.2.4 Affected Iron Sequestration and Storage Proteins
When we look at LCN2, however, we see essentially no difference in total expression
between the TBI and TBI treated groups. There are a few modest points of significance in the
drug treated groups vs Sham but the effect size is low in those circumstances and inconsistent
across the time course. In general LCN2 is up by 1d, persists through 3d, and is still fairly
elevated at 7d post-injury. This pattern of expression is in contrast with the LCN2 data reported
in Chapter 2. While we still see that LCN2 expression in the hippocampus is roughly 10 fold
higher than the neocortex, the expression vs Sham in both tissues appears roughly 10 fold lower,
largely due to effects at the 1d post-injury period. Further, we see relatively constant expression

313
of LCN2 from 1-3d and sustained expression through 7d. A persistent 7d elevation suggests that
the stress of the behavioral testing may have altered LCN2 response. This could be explained by
increased LCN2 expression in the Sham animals, causing a upward shift in baseline protein
level, which manifests as sustained expression in the injured animals. At least two factors might
contribute to this LCN2 elevation. Given the increased cardiovascular requirements of running
the rotarod and Morris water maze, the animals may experience a greater amount of vascular
leak after injury, as the stressful requirements of activity lead to increased systemic blood
pressure. It is also possible that LCN2 expression has been shifted due to the induction of task
learning, starting when the animals are first exposed to the rotarod. LCN2 is associated with
dendritic spine plasticity and may be expected under the circumstances (Ferreira et al., 2013;
Skrzypiec et al., 2013; Mucha et al., 2011; Chattarji, 2011). We can contrast these measures of
acute iron sequestration (LCN2), where we saw minimal treatment effects, with our measure of
long term iron deposition (FTL), which demonstrates a clear shift after drug treatment.
The results observed for FTL are interesting in that they present the only major contrast
between neocortex and hippocampus observed. In our measures of HO-1, LCN2 and gelatinase
activity we regularly see similar results in terms of expression profile. This does not extend to
the results in the neocortex and hippocampus for FTL. In this metric, we see that by 1d post-
injury there are significant cortical increases of FTL expression in the TBI+drug groups
compared to Sham, and the TBI+HMN group is significantly higher vs the modest rise in TBI.
By 3d, however, we have a net FTL reduction in both drug treated groups and neither is different
from Sham while being significantly suppressed compared to the TBI. By 7d the suppression
continues although all TBI groups are elevated vs Sham and by 15d they are all declining in lock
step.

314
The hippocampal response is different. There is essentially no change in expression at 1d
following drug treatment. The metrics largely fluctuate in lockstep with a consistent pattern of
little to no rise at 1d, rising through 7d and then declining. The only outlier to this pattern is the
TBI+SFN group which both shows a modest but not significant increase in expression at 1d
which in turn leads to a consistent modest suppression of expression 3-15d with the decrease
significant vs TBI at 7d. It is uncertain why these differences exist but one possibility is the
disruption of the NVU being greater in the neocortex than the hippocampus. This line of thinking
concerns both the absorption and uptake of the drugs, and their potential effect. If we consider
Hemin to be a more insoluble compound that is poorly transported it may be unsurprising that a
less damaged barrier would fail to produce significant effect (hippocampus vs neocortex). In this
circumstance we would see a minor effect in the hippocampus with the Sulforaphane treated
group only, and that is what we see, a modest early rise which is not significant, followed by
suppression through 15d. This is in contrast to the neocortex, where a more grossly degraded
barrier is associated with significant rises in expression at 1d for both drugs. A greater
enhancement vs the hippocampal tissue suggests that the drugs are more capable of having an
effect due to the loss of barrier function. The following roller coaster of reduced cortical
expression at 3d followed by a rise at 7d is probably explained by early upregulation of FTL
helping to effectively clear the iron response element signal normally required for increasing
FTL expression. At later time points this effect may be lost but the persistent reduction may be
due to the prevention of protein expression overshoot during the initial forward amplification
cycle of FTL.
If we hold FTL as an indicator of long term damage, we would expect the hippocampus
to perform preferentially better at longer time behavioral tests while both drugs would perform

315
similarly at short time points. Interestingly, this is at odds with some of the other metrics
examined and ultimately at odds both with the rotarod and the Morris water maze data presented
below. As another point of interest – it is somewhat perplexing that FTL remains more
upregulated relative to Sham in the hippocampus than in the neocortex, when we know that there
is hemorrhagic injury associated with the neocortex. Further, while we have previously observed
Perls stain both inside the previous hemorrhagic injury and scattered in the neocortex, we have
not made the same observations within the hippocampus.
3.13.2.5 Early Behavioral Outcomes Post-Injury Assayed by Rotarod
Shifting to look at the results of early behavioral data via the rotarod test we observe that
there are distinct drug effects over the post-injury period. We designed our test protocol based on
the paradigm described by Hamm et al., (Hamm et al., 1994). Rotarod naïve animals are placed
on the device for the first time 1d after injury and as such the test functions as a combined metric
of cortical and hippocampal function. The animals both have to be able to successfully run the
test, requiring some degree of motor function ability, and must be able to learn and remember
how to run the test day to day. We observe that over the course of 7d after injury the animals
stratify into two distinct groups – a high performing Sham/TBI+SFN group, and a lower
performing TBI/TBI+HMN group. At 1d the treated TBI groups have an initial performance that
is roughly halfway between the TBI and Sham performance. This is probably a reasonable data
point for the day 1 motor function differences across groups. By day 2 and ongoing, the
TBI+SFN group almost exactly matches the Sham, while the trajectory of the TBI+HMN group
is flatter and looks very similar to the TBI group. The greatest difference between the TBI and
TBI+HMN groups occurs only when looking at the max RPM achieved, which shows some
separation at 5-6d post injury. It is possible that if animals were tested longer and at higher

316
rotational speed we could discern a difference between the TBI and TBI+HMN groups. By the
end of the test there is a suggestion of modest improved performance in the TBI+HMN group,
but the hard cap on performance due to testing limits ultimately causes a compression of the data
set by 7d. An important note here is that there is an anomalous decrease in performance for the
Sham controls after 4d. Some animals which performed very well on the test 1-4d post-injury
appeared to become bored by the test and began to develop techniques to avoid the test,
including jumping off the device or, in one case, wrapping his whole body around the rotating
rod and letting it slide under him without moving. Other authors looking at hemorrhage models
and using these drugs have demonstrated acute behavioral improvements though they did not use
this specific behavioral paradigm (Alfieri et al., 2013; Lu et al., 2014). Expanding the literature
search finds several authors who applied a form of the rotarod and showed behavioral
improvement using both Sulforaphane and Hemin in models of Parkinson’s disease (Morroni et
al., 2013) and Huntington’s disease (Khan et al., 2011). While the literature is sparse there are
consistent reports of Hemin and Sulforaphane causing improved outcomes in behavioral testing
over the acute post-injury period which is largely consistent with our observations; we find
significant improvement with Sulforaphane and suggestive, but not definitive, acute post-injury
improvement with the Hemin treated animals.
To some extent the behavioral data appears to contrast with what we saw in the
histological data; it appeared that HO-1 and heme were more cleared in the Hemin treated group
compared to the Sulforaphane treated group and yet in this early post-injury performance metric
it appears that the Sulforaphane treated animals performs better. The day 1 improvement
suggests that both drugs had an initial effect but the divergence at 2d onwards suggests there may
be another underlying process that has been affected. One possibility is that the blood brain

317
barrier and NVU are more stable in the Sulforaphane treated animals vs the Hemin treated
animals. This may explain why the Hemin performance lagged, particularly if this aspect of TBI
pathology remains for a longer period of time relative to the Sulforaphane group. It is also
possible that there is some effect on iron trafficking or glutathione generation which is different
between the groups. The observations also seem to better fit with the known kinetics of the
drugs, where Sulforaphane is rapidly absorbed and metabolized by the body, while Hemin
processing lags for multiple days, slowly being released into the body. There is also the
possibility that the mechanism of heme clearance causes the difference in effect. As an example,
the 1d post-injury improved performance could be directly related to initial heme clearance,
while longer term post-injury performance is more dependent on evolving iron load and
regulation. Interestingly, the neocortex and hippocampus show the TBI+HMN group as having
elevated FTL relative to the TBI+SFN group, possibly indicating alterations in iron homeostasis.
3.13.2.6 Drug Attenuated Gelatinase Activity
In order to further understand the pathology that develops after injury we observed the
activity of the gelatinases MMP2 and MMP9, each known to be upregulated after TBI. These
enzymes are important to consider since their activity is interrelated with some of the HO-1
pathway proteins. LCN2 is known to persistently activate MMP9 by preventing degradation of
its active form and leading to sustained proteolytic activity (Flower, 1996; Kjeldsen et al., 1993;
Yan et al., 2001). Additionally, both drugs used, Hemin and Sulforaphane have been associated
with alterations in gelatinase expression, most frequently MMP9. Hemin has been shown to
increase the shift of Pro-MMP9 to the active form via interaction with the hemopexin binding
domain (Geurts et al., 2008) and has been used in models of HO-1 knockdown to establish that
decreased HO-1 leads to increased MMP9 activity (Yu et al., 2013; Chen et al., 2013).

318
Sulforaphane meanwhile has been shown to suppress MMP9 activity in a number of different
models including SCI and Breast Cancer (Mao et al., 2010; Rose et al., 2005) and in an in vitro
tumor model was shown to inhibit secretion of MMP9 while not affecting MMP2 secretion
(Annabi et al., 2008). We see some similarities and some differences relative to these published
findings for both the neocortex and hippocampus when we review our zymography data 1-7d
post-injury and we will address each in turn.
Hemin and sulforaphane appear to affect post-injury gelatinase activity in the neocortex
and the hippocampus, but do so selectively, as a function of both of brain region and post-injury
interval. Overall, we observe a generalized suppression of enzymatic activity, with several
instances of non-significant elevations at 1d post-injury, which may indicate an earlier onset of
gelatinase expression/activity. To present our interpretation of these results, we will consider
each of the drug manipulations separately. With Hemin, treated animals show a generalized
suppression in activity except at 1d after injury, yet there are relatively infrequent instances of
significant change vs the TBI untreated. We see that the primary effects in neocortex after
TBI+HMN are significant reduction in 7d measurements of MMP2 versus TBI alone and in the
active form of MMP9 at 3d post-injury. In our hippocampal measurements we do not observe a
significant reduction of the gelatinases at any time point, placing this region in direct contrast to
the neocortex. Based on MMP literature we would have expected a greater activity of these
MMPs in the hemin treated animals with regions containing hemorrhagic tissue (neocortex).
Indeed, there is evidence that hemin via the hemopexin binding domain coordinates cleavage of
the propetide block to promote activation of Pro-MMP9. As a result of this process, we expected
to see reduced Pro-MMP9 activity, with concurrent increases in active lysis, yet we observed the
opposite (Geurts et al., 2008). Discriminating the details of Pro to active MMP9 transition

319
following injury and drug treatment would require additional studies with controlled analysis of
activation rate, which was not feasible in the present study.
We can better understand HO-1 pathway relationship to MMP activation by contrasting
hemin treatment to the sulforaphane treated animals. TBI+SFN again demonstrates a
generalized suppression of activity, but shows more frequent instances of significant effect vs
TBI untreated cases. In the neocortex we see significant reductions in both MMP2 and Pro-
MMP9 activity at 3d after TBI, along with an unusual significant elevation at 7d. In the
hippocampus we further observe that the Sulforaphane treated animals show significant
depression at 1d and 3d in measurements of MMP2. It should be noted that we may have
expected more instances of significant drug effects in our hippocampal measurements for both
pro and active MMP9, however, the Chapter 3 data set had an aberrantly high 3d variance in the
TBI alone group, which precluded statistical significance. This is perhaps best observed when
contrasting the gelatinase activity here with that seen in Chapter 2, and noting that while activity
progressively declines in the active MMP9 form we only are able to show significance vs Sham
at 1d and 7d. We would note that if the 3d TBI sample had been more tightly grouped we would
likely demonstrate a highly correlated pattern between the time course of drug affected HO-
1expression and early shift in MMP activity, resulting in a decreased expression/activity pairing
by 3d post-injury.
In summary, we have identified that both Hemin and Sulforaphane cause a consistent
generalized suppression in MMP2 and MMP9 1d+ after injury with significance identified at
numerous time points. The variance in certain sample groups suggests that increased sample size
might further elucidate differences between the TBI and TBI+Drug treated animals. We can
speculate that at least some portion of the divergence in drug treated activity is due to the
320
mechanistic differences between Hemin and Sulforaphane treatment. Since Hemin is the
endogenous substrate of HO-1 and can function both as an activator of Pro-MMP9 and an
effector of hemorrhage like injury we would expect that Hemin might cause an increase in
gelatinase activity at 1d which would be ameliorated as post-injury time continued. In general
this is what we observe with 1d activity in the Hemin group, with elevated in several metrics for
both tissues. We can contrast this mechanism with Sulforaphane, a non-ROS producing agent,
which is not associated with a direct MMP binding/activation site. We would expect
Sulforaphane instead to induce a generalized suppression and this is what we observe with the
notable aberrant elevated 7d Pro-MMP9 activity in the Neocortex. Interestingly, this modest
induction of Pro-MMP9 could be the result of indirect Sulforaphane action on gene expression
through increased Nrf2 accessibility to the nucleus.
3.13.2.7 Long Term Behavioral Outcomes Post-Injury Assayed by Morris Water Maze
Having tracked the expression of hemorrhage related protein expression, early behavioral
outcomes, and gelatinase activity post-injury we next shifted to observing long term behavioral
outcomes utilizing the Morris water maze paradigm first developed by Morris (Morris, 1984). In
brief our paradigm utilizes a training period of 4 days starting 11 days post-injury with a variable
start position and a final probe trial on day 5 with the platform removed. The Morris water maze
is a frequently used behavioral assessment for TBI and has previously been employed to assess
the cognitive effects of Sulforaphane and Hemin treatment in models of CCI, diabetes, okadaic
acid induced impairment, Alzheimer’s disease, and Scopolamine induced neurotoxicity (Wang et
al., 2016; Dwivedi et al., 2016; Zhang et al., 2015; Lee et al., 2014; Bhardwaj et al., 2016; Dash
et al., 2009). In each case the treated rats showed some degree of behavioral improvement after
injury though occasionally requiring an altered dosing paradigm. Interestingly, while hemin has

321
been more rarely applied in water maze studies, its use in an Alzheimer’s model demonstrated a
restoration of working memory (Bhardwaj et al., 2016).
In the Morris water maze we see clear delineations between the groups both during the
training phase (11-14d post injury → 1-4d training) and the probe trial run on the final day (15d
post-injury → 5d testing). We see during the training phase that the TBI and TBI+Drug animals
show similar performance deficits compared to the Sham. However, both drug treatment groups
show a similar 1-2d improvement delta in path length and latency to the platform. From this
point the TBI+SFN group largely plateaus while the TBI+HMN group continues to slowly
improve. The TBI group also improves over time, though at a slower rate than the drug treated
groups. By the end of training, the means of the TBI and TBI+SFN groups converge in contrast
to the merging means of the Sham and TBI+HMN groups. When we look at the possible
interrelated confound of swim speed we find that the rats do not demonstrate any significant
differences in swimming ability. It is notable however, that while swim speed converges through
3 days post-injury, in all groups at day 4 we see a noticeable uptick in swim speed in the
TBI+SFN group with multiple animals swimming faster than previously observed.
The paired group effect is similarly seen when we look at the aggregate heat maps of
position in the probe trials where it is clear that the Sham and the TBI+HMN groups show
concentrated search patterns that focus on or near the platform, while the TBI and TBI+SFN
groups show similar profiles of a general search in the direction of the platform but significant
exploration outside of the platform area. When we look at the results of quadrant score by
ANOVA we see that these same paired groups are also significantly different.

322
The observation that the groups show this paired response in the Morris water maze
probe trial is reasonable from the aggregate data but has important caveats when we examine the
individual tracks. While overall data within groups looks similar, the actual search patterns of
individual animals reveal distinct treatment related behavioral modalities. In the Sham treated
group we see that the majority of animals are involved in a focal target scanning search where
they identify the platform position and hover over it, repetitively searching. A small number of
animals also demonstrate a broader search pattern but still with a continually crossing of the
previous platform site. The TBI group shows a very different mix of patterns. Three of the
animals show some semblance of a search pattern though only one actually focuses on the site of
the platform. The rest of the animals show either heavy thigmotaxis (wall hugging), wall
bouncing, or random search behavior. Not all of the animals find the platform during the time
provided and some only find it at the very end of the trial period.
The TBI+HMN group, which previously paired well with the Sham, reveals that while
their search patterns are very similar and are highly focused, they frequently are focused some
distance away from the platform rather than directly over it. Animals move into the correct
general vicinity but they do not generally identify the correct exact position. On aggregate this
results in a search pattern slightly west of the true position but a number of animals also search
north, south, and even east of the platform.
These patterns are also all in contrast to those of the TBI+SFN group. These animals
repetitively search the pool. They frequently cross the platform position, and do so fairly early in
the testing paradigm but they do not persist in searching a focal area. It should be noted that even
in prior metrics, the TBI+SFN group did tend to have a modestly higher swim speed than the
other groups. Further, it was noted several times during testing that subjects in this group had a

323
tendency to find the platform (ending the test) and then spontaneously jump off and continue to
swim. It appears that while they can locate the platform they are less interested in escaping the
test or at least are more interested in searching their surroundings.
With the water maze data it appears that differentiating between the effects of drug
treatment depends, to some extent, upon the selection of outcome metric. It is fairly clear that
the TBI+HMN treated group demonstrates an improved search performance vs the TBI group
but the distinction between the TBI and TBI+SFN group performances is less clear. Further, it is
apparent that even at 15d post injury each drug exhibits a long lasting effect on cognitive
behavior. This is not surprising in the TBI+HMN group given that even at 15d post injury a
recognizable amount of heme persists in the peritoneal site of injection, whereas a long term
effect is surprising in the TBI+SFN treated animals since the molecule is relatively rapidly
processed. Describing behaviors as ‘better’ or ‘worse’ should be done with caution, since they
are inherently dependent upon the selected component of the behavioral test. If instead of
quadrant score we look at alternative metrics such as proximity score or relative proximity score
we see that the same effects largely persist, although greater or lesser differences between groups
might be revealed. In contrast, truncating the trial to 30 seconds rather than 60 or eliminating the
first 5 seconds to give the rodents time to orient themselves has a tendency to induce alternate
stratification of the data. For example, the TBI+SFN treated groups tend to show higher
numerical scores relative to the TBI group because they focus on the platform earlier in the probe
trial even if they do not persist in their interest.
Finally, our results show that not only choice of test metric, but also test design can
influence detection of Sulforaphane treatment effects on cognition. There has been some work in
TBI utilizing Nrf2 targeting agents, most notably by Dr. Dash at UT Houston. His group utilized

324
Sulforaphane in a number of different CNS injury paradigms and at one point studied the effects
of the drug on Morris water maze performance in a CCI model of injury. They found that with a
repeat dosing paradigm they were able to successfully induce behavioral improvement compared
to TBI during an extended training phase that occurred 14-22 days after injury. While we did not
see strong differentiation between the TBI and TBI+SFN groups during our training phase, we
did find that they are not identical and additionally that the resulting probe trial search patterns
are distinct even if they are not, on average, numerically separable. Since we used different
behavioral and dosing paradigms it is difficult to directly compare our results, however, it seems
clear that Sulforaphane delivered during the early post injury period is capable of producing
sustained changes in cognitive behavior. Moreover, several other authors have examined
Sulforaphane in models of diabetes, okadaic acid injury, Alzheimer’s Disease, and Scopolamine
induced neurotoxicity, and have consistently reported that Sulforaphane treatment produces
behavioral improvements (Wang et al., 2016; Dwivedi et al., 2016; Zhang et al., 2015; Lee et al.,
2014; Dash et al., 2009).

325
4 Chapter 4: Discussion
4.1 Summary of Results
In Chapter 2 we examined a number of elements of HO-1 and Nrf2 heme processing
pathway and contrasted their response to TBI in a tissue with a known large hemorrhagic
influence (neocortex), and a tissue with no overt hemorrhage (hippocampus). Two main findings
were reported: 1.) identification of the timeline for heme processing after cFPI and how it was
correlated with known timelines of hemorrhagic processing and synaptic recovery, and 2.)
demonstration that the tissue level response of HO-1 pathway proteins in both the neocortex and
hippocampus is remarkably similar, even when the amount of accumulated heme in the tissue
differs dramatically. To our knowledge this is the first time that heme processing has been shown
to be so highly activated in non-hemorrhagic tissue of a diffuse injury model.
In Chapter 3 we continued our contrast of hemorrhagic/non-hemorrhagic heme
processing response in the neocortex and hippocampus but also added the intervention of two
known HO-1 pathway inducers in a therapeutic window of 1 hour after injury. A couple of real
world limitations necessitated this multi-metric approach – there are to date a very limited
number of good Nrf2 activators and none of them are highly selective. Further, we first sought to
test interventional effect through an acute, single dose paradigm, using two unique agents with
differing kinetics but sharing a common pathway target. Towards this end, we repeated the
molecular measurements of Chapter 2 as metrics, adding a set of animals that were also
subjected to two behavioral outcome assays – the rotarod, an acute measure of largely cortical
recovery/deficit, and the Morris water maze, a longer term measure of largely hippocampal
recovery/deficit.

326
We found both treatment paradigms produced robust changes in histology, protein
expression, and behavioral outcomes. Treatment appeared to shift the heme processing response
to an earlier time course with net reductions in heme processing protein expression generally
observed at later time points. While both drugs had highly similar effects on a number of critical
measures, there were also numerous cases where the two drugs demonstrated divergent outcomes
suggesting that the causal relationship between Nrf2/HO-1 induction and desirable outcomes is
complex.
4.2 Post-Injury Heme Processing
Heme processing in our model fits well into the literature reports of small bleed
resolution (Cao et al., 2016; Chang et al., 2003; Yamauchi et al., 2004; Alfieri et al., 2013; Lu et
al., 2014; Regan and Panter, 1996). We see a steady progression of an evolving bleed which
reaches maximal size between 1-3d post-injury and is substantially reduced by 7d and absent by
15d. By 3d post-injury we begin to see the yellow pigment of Bilirubin (indicative of heme
catabolism) along the outer edges of the bleed as well as loose formation of Fe(II,III)
hexacyanoferrate (II,III) (Perls’ Prussian Blue) indicative of iron deposition and aggregation. By
7d and especially by 15d any remaining pigment is seen in dense sporadic cells that heavily dye
with Prussians blue indicating significant aggregation of any remaining heme as well as iron. It is
somewhat important to note here that pigments are only easily visualized when they form
aggregates. In low concentrations of Fe, Perls stain does not produce a remarkable effect, e.g. we
do not see universal evidence of Perls stain from normal cytochrome heme staining, we only see
the blue aggregates when there are larger densities of Fe.
A number of different models looking at hematoma in larger animals or small bleeds
have identified that HO-1 is significantly elevated by 3d post injury and peaks either at around

327
3d in the circumstance of smaller bleeds, or at 7d+ in larger hematomas where a large portion of
the erythrocyte mass is physically remote from phagocytic cells (Cao et al., 2016). It is likely
that this process is mediated by CD47 which is normally found on circulating erythrocytes and
which regulates target cell phagocytosis (Oldenborg et al., 2000). In fact, it has been shown that
the rate of erythrocyte phagocytosis is significantly increased when CD47 is lost, an experiment
which has been somewhat elegantly done via the injection of transgenic CD47 KO erythrocytes
(Ni et al., 2016). CD47 has in turn been associated with HO-1 which was identified as a
modulator of erythrophagocytosis (Schallner et al., 2015). It has been shown that erythrocyte
diameter decreases 4h-7days post injury, with a minimal diameter achieved by 3d, the same time
that CD47 is lost and HO-1 expression is elevated.
Interestingly, Dr. Cao et al., have noted that treatment with deferoxamine helped to
maintain CD47, hemoglobin, and decreased HO-1. They identified this as a positive response but
there may be some suggestion that by preventing HO-1 amplification they may acutely
demonstrate improved outcomes which later fail when the clot is eventually processed. This
speaks to a chicken or egg problem when it comes to heme processing. Heme itself can be
cytotoxic and damaging to the surrounding tissue, but at the same time the catabolic products of
heme can also be cytotoxic, or alternatively cytoprotective depending on concentration. Hemin
itself has been used as a model of intracerebral hemorrhage when injected locally or in vitro and
as a protective pre-treatment in ICH when applied systemically (Chen-Roetling et al., 2015).
This strongly suggests that a combination of time-dependent processing rate and ability to buffer
the resulting products is likely to be critical towards preventing cellular injury.
It should be noted that there is some controversy over whether or not heme is
predominantly processed by HO-1 or HO-2 after a traumatic injury. Dr. Noble-Haeusslein’s

328
group measured HO activity in a CCI model using HO-2 KO mice and noted that activity was
reduced one day after injury compared to wild type (WT) mice and thus, concludes HO-2 is
likely the dominant form of HO which processes heme (Chang et al., 2003). This is likely true at
the 1d post-injury interval, but our results suggest that HO-1 does not peak until several days
later and it is not unreasonable to suggest that prior to HO-1 elevation HO-2 plays a larger role.
Further, if the 1d HO-2 response is present in our cFPI model, it would occur at a time point
prior to CD47 loss on erythrocytes, and largely exists before the strong pro erythrophagocytotic
signals to release heme develop and prior to peak HO-1 induction.
4.3 Hemorrhagic Processing in the Neocortex vs Hippocampus
We see the induction of similar expression profiles of proteins known to be involved in
heme processing within both hemorrhagic and non-hemorrhagic tissue and at comparable levels.
It appears that the cFPI introduces a heme processing response even if there is limited heme
present in the tissue. We have noted previously that for FPI there is a gradation of severity with
increasing overpressures inducing ever increasing hemorrhagic injury (Dixon et al., 1987). Thus,
it is possible that we have introduced an injury in a specific non-hemorrhagic tissue (the
hippocampus) which is right at the edge of a hemorrhagic threshold with increased local
signaling a result of more limited vascular disruption or constituent leak into the surrounding
parenchyma. It is tempting to consider the hippocampus as an entirely non-hemorrhagic tissue
and thus likely to be driven by a non-hemorrhagic trigger e.g. hypoxia and there are certainly
known hypoxia induced transcription factors which upregulate HO-1 expression. However, we
did not observe any of these transcription factors being upregulated when we ran our initial gene
chip assays (see Appendix). Nor are they frequently identified as drivers of HO-1 expression,
even in ischemic models of stroke which is peculiar but may be primarily driven by later

329
reperfusion injury. It is also possible that the limited hemorrhage seen in the fimbria of the
hippocampus provides a more generalizable signal, but most importantly the initial expression of
HO-1 observed in molecular layer of the dentate gyrus adjacent to the granule cell layer is
spatially distant from any observed hemorrhagic site.
4.4 HO-1 Expression/Evidence of Bleeds
Outside of the visually identifiable bleed site, which extends from the lateral grey/white
matter interface into the neocortical layers, we see significant increases in HO-1 expression as
well as LCN2 and FTL even without any observable frank bleed. Indeed, expression in multiple
cases is even more elevated in the hippocampal tissue than in the cortical tissue.
There are several possible explanations for the observed these protein expression profiles.
The pattern and combination of acute iron sequestering protein, heme processing protein, and
iron storage protein in sequential succession is highly suggestive that they are involved with and
responding to local heme processing in the tissue. Further, while HO-1 and LCN2 can both be
amplified by Nrf2 driven transcription, FTL is not responsive to Nrf2 but rather to iron response
elements indicating the presence of free iron in the tissue. This suggests that heme may be
processed in the tissue even though it is not identifiable with standard histological techniques.
Currently there are a number of ways of identifying bleeds in tissue. In vivo methods
include CT and MRI techniques such as SWIM (Liu et al., 2016; Chiara Ricciardi et al., 2017;
Wintermark et al., 2013). These techniques tend to produce a relatively large voxel compared to
histological studies but are excellent at identifying moderately sized microbleeds. Dr. Latour’s
group demonstrated that in paired cadaveric experiments the bleed signatures identified via MRI

330
are substantially enlarged when the tissue is stained with Perls’ stain suggesting an imaging
limitation to only bleeds of sufficient size (Dr. Latour, NINDS, (Abstracts from the 34(th) annual
national neurotrauma symposium june 26-29, 2016 lexington, kentucky. 2016). It should be
noted here, that this enlarged tissue penumbra is the affected area where there is still sufficient
iron deposition/aggregation to cause an easily observable excess which can be stained. Smaller
quantities of iron or iron that is effectively trafficked out of the tissue would not demonstrate
Prussian blue formation. This speaks to a potential problem in trying to identify if there are
‘nano’ bleeds throughout the tissue, in circumstances where erythrocyte integrity is suspect we
may lack cell markers and simultaneously lack large aggregate pigments or signatures. If we
contrast the molecular weights of hemoglobin (~65 kilodaltons; kDa) with the molecular weights
of IgG (~150 kDa) we can see that in circumstances where there is free hemoglobin in the
vasculature (or bound via hemopexin ~63 kDa) it is likely to leak into the parenchyma after TBI.
While we see little evidence of direct bleeds in the hippocampus what we do see is large amounts
of iron trafficking proteins, heme processing proteins, and iron sequestering proteins. We may
also speculate that with increased image processing and tissue staining techniques it appears we
are ever expanding and more carefully delineating the parenchyma surrounding injured tissue. It
is always possible these molecules are responding to a more generalized signal but the specificity
of temporal expression to certain tissue locations and a tendency to occur near blood vessels
suggests an ongoing hemorrhagic or hemorrhage like process.

331
4.5 Lipocalin 2 and Gelatinase Role in Heme Processing and Recovery
4.5.1 Lipocalin 2 is a known effector of Angiogenesis and Dendritic Spine
Remodeling
We have primarily focused on HO-1 as a driver of recovery after traumatic injury,
utilizing agents known to preferentially target HO-1, including the application of its endogenous
substrate. From this perspective we posited LCN2 and the gelatinases MMP2 and MMP9 as
ancillary effectors of hemorrhagic processing driven by HO-1. Their role in the post-injury
response may be independent or interactive, and was predicted to be driven by upstream changes
in HO-1 activation. We did find that TBI increases both LCN2 expression and gelatinase
activity in a time-dependent manner which correlates with HO-1 induction. Interestingly, we
also found that drugs altering HO-1 induction do not profoundly change LCN2 expression and
only moderately affect gelatinase activity, suggesting that their response to injury in our model
may be less dependent on HO-1 or each other. While these results might be surprising, it is
important to note that LCN2 and the gelatinases each have known effects on the vascular system
that could alter post-injury response regardless of hemorrhage. Nevertheless, it remains possible
that LCN2 and these MMPs are highly interdependent during the evolution of TBI
pathophysiology, perhaps by sharing common stimulatory pathways and directly targeting injury
tissue at numerous levels.
In addition to its role as an acute iron sequestering protein LCN2 has also more recently
been identified as a significant player in angiogenesis, critical to post-injury vascular
stabilization and repair. We will again note here that we observe essentially no LCN2 in our
Sham animals by either western blot or IHC, thus making our observed 1-7d post-injury
increases in LCN2 extraordinarily easy to identify. The research group headed by Dr. Eng Lo at

332
Harvard has recently published several papers looking at the role of LCN2 during angiogenesis
and how it might serve as a secreted signaling factor to facilitate communication between
neurons and glia (Wu et al., 2015; Xing et al., 2014). In the paper by Xing they noted that LCN2
is secreted by neurons and appeared to activate reactive glia into pro-recovery phenotypes. They
found LCN2 expression was increased both in the forebrain of their rat ischemia injury model
and in human stroke tissue samples. It was also noted that LCN2 enhanced angiogenesis in vitro
via a mechanism that required increased iron and ROS (both byproducts of HO-1 heme
breakdown); interestingly, chelation or reduction of either reduced angiogenesis. They further
associated these findings with previous research that reporting LCN2 upregulation after CNS
injury (Jin et al., 2014; Rathore et al., 2011; Xing et al., 2014) and showing that the MMPs
associated with LCN2 appeared to be necessary for both neural and vascular remodeling (Yang
et al., 2011). To an extent some of these effects are unsurprising and even the nomenclature of
LCN2’s primary alternate name, NGAL (Neutrophil Gelatinase Associated Lipocalin), speaks to
its early identified role as a gelatinase associated protein. Recent publications on LCN2 have also
found angiogenic associations in both CNS and non-CNS tissue (Yang et al., 2013; Wu et al.,
2015). Thus, it is possible that a portion of the acute/subacute LCN2 and gelatinase elevation we
observed could serve to support the onset of angiogenesis for vascular recovery from TBI.
The LCN2 findings in our study can also be compared to a series of papers showing a
strong association between LCN2 and synaptic plasticity via regulation of dendritic spine
formation and maturation in the hippocampus and amygdala (Ferreira et al., 2013; Skrzypiec et
al., 2013; Mucha et al., 2011; Chattarji, 2011). Notably, we found maximal LCN2 response
within the non-hemorrhagic hippocampus, suggesting that plasticity induced by TBI synaptic
disruption might also contribute to post-injury elevation of the protein. In restraint models of

333
stress LCN2 increase was concurrent with higher dendritic spine density, however, in vitro
exposure of hippocampal neurons to LCN2 showed a paradoxical decrease in spine density,
suggesting that LCN2 supports a homeostatic mechanism for stabilizing synapses during periods
of neuronal stress (Skrzypiec et al., 2013; Chattarji, 2011; Mucha et al., 2011). Particularly
interestingly for our paradigm, Mucha and colleagues found that it was an iron free form of
LCN2 associated with dendritic spine formation and maturation in the hippocampus (Mucha et
al., 2011). When we compare our results with these findings it is important to consider the injury
and behavioral assessment paradigms used. We injure the rats via cFPI with an overpressure
known to induce hemorrhage and resulting iron overload. We then proceed to run the animals on
new behavioral tasks which they are incapable of mastering during the first testing day,
generating some degree of stress. As such we have a combined diffuse axonal injury,
hemorrhage, iron overload and acute stress in a model of CNS insult, all initiated by a single
fluid pulse across the intact dura. Thus, it might be predicted that TBI animals behaviorally
assessed in Chapter 3 would demonstrate an extended post-injury LCN2 upregulation, likely
related to synaptic plasticity induced by injury pathology, stress of behavioral testing and
learning.
Overall, if we consider our results against the work of previous authors we would expect
LCN2 induction during the acute post-injury intervals to not only serve as an iron buffering
mechanism, but also play an angiogenic and gelatinolytic role. In contrast to Dr. Lo’s studies,
we find that post-injury LCN2 is primarily expressed by glia rather than neurons, which would
support both roles. However, we do find a strong association of LCN2 induction with cortical
hemorrhagic injury, which is consistent with prior studies employing the lateral FPI model (Zhao
et al., 2016b; Zhao et al., 2016a), and supports the interpretation that acute LCN2 upregulation is

334
a hemorrhage driven, HO-1 correlated process in the cFPI model. Further, LCN2 induction
occurs during the early stages of iron overload, which may limit its role in the context of
dendritic spine management. Interestingly, IHC shows that the widespread dispersal of LCN2
signal at 1d post-injury progressively shifts to a more punctate and cellular-associated pattern by
3d, perhaps marking a change in LCN2 role from buffering of iron produced by heme processing
toward regulation of adaptive synaptic plasticity over time. Although we failed to detect LCN2
in our Sham animals, this could be a function of the reagents used and does not necessarily
negate the potential for a LCN2 role in maintaining baseline homeostasis of spine plasticity.
Again, it is important to note just how extraordinarily high the level of LCN2 induction was
during the early post-injury period.
4.5.2 Gelatinases as effective targets for both synaptic and vascular remodeling
Similar to the multiple roles which are possible for LCN2, the gelatinases MMP2, 9 are
known to affect cell function in multiple ways, all driven by temporo-spatial patterns of
proteolytic activity as reviewed by Phillips and colleagues (Phillips et al., 2014). It has been
known for some time that MMPs are associated with synapse formation (Ethell and Ethell,
2007). They appear to function in this role by preferentially breaking down ECM and inducing
stability in new favored neuronal connections (Reiss et al., 2005; Warren et al., 2012). MMPs
have been associated with various neurodegenerative conditions including Alzheimer’s disease
and Huntington’s disease (Asahina et al., 2001; Safciuc et al., 2007). Further, their activity has
been shown to influence the pathology/recovery cycles in stroke and ischemia models, as well as
SCI and traumatic brain injury (Rosenberg, 1995; Rosenberg and Navratil, 1997; Rosenberg,
2009; Asahi et al., 2000a; Zhang et al., 2010). In many cases only a small subset of MMPs are
identified, most typically MMP2,3,9, and MT-5 but it should be noted that these specific MMPs

335
are more conveniently assayed and may be more broadly represented in the literature. MMP9 in
particular has been highly studied and is associated with response to cortical stab wound and
hippocampal neuroexcitatory insult (Kyrkanides et al., 2001; Szklarczyk et al., 2002a), as well as
ICH (Lekic et al., 2011) SCI (Hsu et al., 2008; Zhang et al., 2011) and TBI (Kim et al., 2005;
Falo et al., 2006; Ding et al., 2009; Li et al., 2009). MMP9 is frequently identified as being
highly upregulated in the first 24 hours after injury or insult is applied. MMP2 is also associated
with numerous injuries including ICH (Lekic et al., 2011), SCI (Hsu et al., 2006), and TBI
(Truettner et al., 2005; Phillips et al., 2014). In addition to their known roles in synaptic
plasticity gelatinases have also been associated with the breakdown of the blood brain barrier and
appear to exacerbate hemorrhage (Montaner et al., 2001). Attenuation of expression and activity
appears to limit further hemorrhagic injury (Lo 04) and is associated with reduction of functional
deficits after brain injury (Lo et al., 2004).
While increased MMP expression and activity during a myriad of CNS injuries and
neurodegenerative conditions might suggest that these enzymes function in a largely destructive
manner it is important to note that they can also act in constructive roles. For example, they
appear to be critical for normal neurogenesis during gestation and postnatal neurodevelopment
and act as mediators of reactive synaptogenesis and in cortical circuit recovery after ipsilateral
stroke (Liu et al., 2011; Vaillant, 2003; Luo, 2005; Phillips and Reeves, 2001; Phillips et al.,
2014). A number of authors have attempted to reverse MMP mediated degradative processes and
produce neuroprotection by effectively knocking down expression of the various enzymes.
However, it is important to note that in our targeted treatment paradigm we probed for whether
manipulation of HO-1 can indirectly affect gelatinase response to NVU disruption, perhaps
through altering enzyme interaction with upregulated LCN2. While we found Hemin and

336
Sulforaphane efficacious in protecting tissue structure and improving behavioral outcome, there
was only modest reduction in gelatinase activity at selective time points and a general profile
more suggestive of shifting peak activity than necessarily reducing overall activity. Since we
found improved behavioral outcomes after treatment with each drug, we posit that even this low
level reduction in MMP activity at critical post-injury intervals might contribute to
neuroprotection.
In our current data set, definitive statements about the link between HO-1, LCN2 and gelatinase
activation were not warranted, however, the results did reveal some interesting points about this
interaction. We originally posited that LCN2 activation of MMP9 contributed to vascular
injury/expanded hemorrhage after TBI. While the post-injury time course of MMP9 activity
does closely match acute increase in expression of LCN2, supporting the potential for LCN2
activation of MMP9 with HO-1 upregulation, post-injury treatment with either Hemin or
Sulforaphane did not show correlated change in LCN2 expression and MMP9 activity.
However, unstressed animal data in Chapter 2 contrasted with stressed animal data in Chapter 3
may provide insight into the dual role of LCN2 in the early post-injury period; we see a flattened
expression of LCN2 in the stressed animals concurrent with a reduction in heme substrate by 1d
post-injury and this may directly correlate with the reduction of active-MMP9 at 3d to near Sham
levels via loss of hemopexin coordinated MMP9 activation.
At least one positive correlation between HO-1 reduction, attenuated LCN2 expression
and depressed gelatinase activity was found in the 7d post-injury neocortex. There Hemin
treatment essentially reversed injury-induced elevation of HO-1 and LCN2, accompanied by a
significant reduction in MMP2 enzyme activity. Interestingly, there also appears to be paired
MMP2 and HO-1 response in untreated TBI animals, both peaking at the 3d post-injury time

337
point, but this may simply represent a correlation of the zenith of catalytic processing in
hemorrhagic recovery and onset of extracellular remodeling. Clearly this potential correlation
between HO-1, LCN2 and MMP2 response must be further explored, however, it remains
possible that adjusting the net activity of the gelatinases or shifting the time course of their
activity might be accomplished by manipulation of the HO-1 pathway. Given that we
acknowledge throughout this document the multi-factorial, multi-modal nature of TBI injury, our
zymography results further support targeting of MMP activity as a possible effector of improved
recovery from both hemorrhagic and non-hemorrhagic vascular damage.
4.5.3 Mechanisms of Select Agents
Overall it appears that targeting HO-1 with either Hemin or Sulforaphane has a positive
net effect on behavior. Importantly, in no circumstance do we see any metric of injury deficit
increase after application of either agent. The two drugs do, however, work via distinct
mechanisms which are intended to more fully address the impact of targeting HO-1/Nrf2 when
there is a lack of highly specific agents. Sulforaphane is a highly soluble compound which is
applied in a carrier of DMSO and PBS via IP injection at 5 mg/kg. Prior evidence has shown
that it is rapidly taken up by cells and circulates systemically readily crossing the BBB and
affecting transcriptional change at just about every step along the way. Sulforaphane has been
shown to directly interact with the Nrf2 repressor binding protein Keap1 inducing a
conformational change and allowing Nrf2 translocation to the nucleus. At no point during this
process is ROS generated nor any catalytic heme products generated. Sulforaphane functions as a
non-hemorrhagic pre-conditioning agent and acts quickly upon injection. Hemin, in contrast, is a
largely insoluble compound injected IP as a slurry at 26 mg/kg. Through 15d post-injury there is
still observable hemin pigment in the peritoneal cavity, which shows progressive reduction over

338
time. Hemin ostensibly works via solubilization with hemopexin or other heme binding proteins
and is slowly absorbed into the blood stream and circulated systemically. Hemopexin and other
trafficking agents allow small quantities of heme to be deposited inside specific cells and it
functions as the endogenous substrate for HO-1, or with constitutive HO-2 as an initial pathway
trigger. During this process hemin acts like any peripherally deposited heme aggregate and
generates ROS and heme breakdown products both locally and wherever it is transited. It is
notable that Hemin itself is used occasionally as a model of ICH via direct intracerebral injection
and in excess can be cytotoxic.
It is quite possible that more selective agents or genetic manipulations may be more
effective in elucidating the underlying mechanism of hemorrhagic injury. Nevertheless, it is
important to note that single factorial genetic manipulations have so far not produced useful
therapies for human patients. With a multi-modal, multi-factorial injury it is quite possible that
‘messier’ agents are more effective on account of ancillary effects which play roles in alternative
pathways. Towards this end it is very useful to contrast multiple agents that ostensibly target the
same pathway but via modestly or entirely different mechanisms.
4.6 Behavioral outcomes after Treatment
After treatment with both Sulforaphane and Hemin we observed behavioral changes that
appeared to be induced by the applied pharmacologic agent. In the short 1-7d time course we
saw a robust improvement in the rotarod performance after 1hr post-injury dosing with
Sulforaphane at 5 mg/kg and at 11-15d we saw behavioral changes in the Morris water maze that
showed altered platform search behavior. Some improvements with Sulforaphane have been

339
reported previously, notable by Dash et al., 2009, where they demonstrated improved search
patterns in the Morris water maze though only after a specific dosing paradigm (1+24 hour
dosing but not 6 hour not 6+24 hour; Dash et al., 2009). A number of differences exist between
their model and ours, including the use of CCI vs cFPI and a different post-injury testing interval
(11-15d vs 14-22d). It is possible that with our Sulforaphane dosing paradigm we were able to
induce a short term protective effect that is lost over time or was an insufficiently large signal to
cause long term improvement. Our hemin treated group provides an essential contrast both in the
drug kinetics and the behavioral results. The rotarod appears to show no real improvement
(though the Hemin animals always out perform the TBI) and yet by 15d we see a robust
improvement and alteration in the Morris water maze search pattern of TBI+HMN animals
contrasting with the search patterns of the TBI animals. To date no studies have been published
on the effects of hemin therapy following traumatic brain injury so we lack any even partially
applicable model for contrast. Instead we can look at various studies focused on intracerebral
hemorrhage, although they tend not to focus on Morris water maze as an outcome metric.
4.7 HO-1 as a Therapeutic Target
HO-1 and the products of its heme metabolism have long been considered as therapeutic
targets in a variety of hemorrhagic and ischemic injuries including stroke, lung, and acute kidney
injuries (Ryter et al., 2006; Bolisetty et al., 2017). Ryter in particular has been quite effective in
linking the effects of heme metabolites to potential HO therapeutic utility. Rather unfortunately,
his closing statements noting the need for better pharma agents or gene therapy approaches have,
more than 10 years later, been unrealized. A brief sampling of abstracts from the most recent
Society for Neuroscience conference in 2016 revealed a number of papers commenting on Nrf2
function, but the majority use measurements of HO-1 to identify activity. Only two groups were

340
seeking development of Nrf2 targeting molecules, one group (Carreno-Velazquez et al., 2016)
was focused on finding non-oxidative molecules that had activity 15-100% of that of
Sulforaphane, while the other group (Ahuja et al., 2016) gave up on activating Nrf2 directly and
instead focused on disrupting Keap1.
One of the significant problems in working with HO-1 is the ability to identify
transcription factor upregulation via Nrf2. Many of the antibodies raised against Nrf2 have been
purified based on expected column migration and this has led, in many cases, to antibodies that
are non-specific (Lau et al., 2013). The result is a myriad of possibly erroneous data that has
likely hampered research in the area. Numerous researchers have solved this problem by simply
ignoring Nrf2 except to reference as the mechanism for how their pharmacologic manipulation
functions. In these cases outcome measures including HO-1, NQO1 and (glutathione synthase)
are used frequently as easily identifiable readouts of ARE transcriptional activation. This in fact
may not be a bad way to easily measure Nrf2 activity – in studies utilizing Nrf2 KO it has been
shown that protective effects otherwise observed and increases in protein expression of
downstream targets are eliminated (Zhao et al., 2007). It seems that our use of Sulforaphane and
Hemin is appropriate given the tools available but it is unfortunate that a more specific Nrf2
activator is not available and that there are no spectacular Nrf2 antibodies. Despite these
problems, modern lab on a chip screening of small molecules will likely cause a revolution in the
field of Nrf2 activated targets. Further, recent development of upstream alternative regulators
(e.g. via bach 1 or keap1 targeting) should provide an alternative method to activate HO-1/Nrf2
more selectively (Carreno-Velazquez et al., 2016; Ahuja et al., 2016).
To date, numerous animal studies in acute kidney injury, acute lung ischemia, and stroke
have demonstrated reductions in tissue pathology associated with pharma upregulation of HO-1

341
though the evidence becomes significantly more complex once the various metalloporphyrins
used as HO-1 inhibitors are considered. The difficulty is that the various substrate inhibitors (e.g.
ZnPPIX, CoPPIX) each release different metallic specie which can independently play a role in
cell signaling or development of pathology and in all cases still result in the release of both CO
and biliverdin. The result is a confusing challenge of trying to interpret just how oxidative Zn or
Co are relative to Fe and whether they sufficiently reduce ROS generation or if they are just
preventing or prolonging heme processing.
Our data suggests that early induction of HO-1 causes a suppression of the normally
evolving post-injury HO-1 peak and results in early processing of heme and erythrocytes after
injury, effectively clearing the presence of heme. Behavioral outcomes at both 1-7d and 11-15d
show functional improvement though there is some difference in the nature of behavioral
protection depending on the drug used while the clearance of heme appeared to occur regardless.
We have mentioned previously that there have been a small number of studies utilizing
Sulforaphane and TBI, particularly in CCI models (Dash et al., 2009). In general these studies
have employed CCI as an extension of ICH research and observe relatively similar metrics in
terms of lesion size and gross tissue loss. The one behavioral study was done by Dr. Dash’s
group and looked at latency to platform 14-22 days using a repeat dosing paradigm. They
showed that dosage at 6hr post injury and repeat dosing at 6 hrs and 24 hrs post injury had no
effect while dosing at 1hr and repeating at 24hr had an observable effect. It should be noted that
this was in a CCI model and extended for a longer period of time than our study in an injury with
worse motor function outcomes. Further, they did not provide a Sham comparison with the data
and it is somewhat difficult to interpret how significant an improvement occurred. This is
important since it introduces the question about whether Sulforaphane needs to be dosed ultra-

342
acutely after the injury. Our perspective of a 24-48 hour lag in erythrocyte degradation would
suggest that a window of ~24 hours may exist but the failure to find effect after a delay of 6
hours is concerning. That being said, it is still important to acknowledge that they used a
different model. We did not find a difference in latency in our TBI and TBI+SFN groups though
we started assessment earlier, and the major distinctions come in the search patterns that result.
The best quantitative discrimination behaviorally between the two groups was seen in the
rotarod. Thus, it is possible that our data is in agreement with what was previously found in a
different model of TBI with the added interpretation of comparative search patterns and acute
behavioral improvement. Further it appears that there is the suggestion that the available
treatment window may be reduced from a full 24 hours and may be limited to the ~1-6 hour
range after injury.
In contrast to the limited behavioral data which is available for Sulforaphane treatment in
TBI, we were unable to find any studies that looked at systemic hemin treatment after brain
injury. There are a small number of papers looking at SCI injury and systemic hemin therapy but
the majority of neural injury and hemin papers are focused on intracerebral hemorrhage where
locally applied hemin is a model of induced injury while hemin applied systemically is a
protective model of pre-treatment. Rather amazingly, there is even a paper looking at in vitro
neuronal death which found that Sulforaphane was protective against applied hemin (Soane et
al., 2010). With that said, there has been extensive research by Dr. Regan and colleagues focused
on intracerebral hemorrhage and hemin therapies. In these studies they largely focus on pre-
treatment but more recently several post injury applications have been studied (Lu et al., 2014).
Hemin appears to be excluded from most organs due to binding to hemopexin or albumin
(Linden et al., 1987) and as a result acts primarily on the microvasculature and has been

343
observed to attenuate blood spinal cord barrier permeability and CNS permeability (Lu et al.,
2014; Yamauchi et al., 2004).
4.8 Differential Drug Treatment Effects
Our initial hypothesis was that early induction of Nrf2/HO-1 via pharmacological means
would produce a net benefit by limiting heme toxicity after TBI. Somewhat implicit in this
hypothesis is that heme resolution would also have an effect on other recovery pathways that act
to recover cell and tissue function after injury by limiting added cell stress and by potentially
increasing cell vigor. Somewhat as expected, we found that the drugs we used produced
profound targeted effects on HO-1, and on heme pigment while generating more varied effects
on metrics which are progressively further away from the critical catabolic event targeted. Both
drugs caused a shift in HO-1 time course coincident with loss of heme pigment. In hemorrhagic
tissue (the neocortex) this appeared to have direct effects on the production of FTL which was
expected. A more variable result occurred in the hippocampus with divergence in drug behavior
suggesting that it is not just the drug which is required for altered FTL expression. There must be
some other co-signal which acts to affect transcription. We had limited expectations for the
gelatinase results due to conflicting theories on expression driven by heme substrate/injury and
known activation by the drugs applied. Only the MANOVA for SFN showed an effect on the
drugs suggesting that SFN more than HMN had a greater effect on gelatinase reduction which
may in part be driven by reduced oxidative cell damage.
Hemin and Sulforaphane are fundamentally different drugs and were expected to
intersect solely at their function on activating HO-1 via Nrf2. We see that both drugs have
extremely similar effects in shifting the time course of HO-1 expression, and in inducing heme
pigment loss. After that point it appears that there may be co-signals and alternate pathways

344
activated by the drugs which are different and numerous independent functions of each drug
have been identified by various authors. From the strictest sense we can note that in the dosing
paradigm used for each drug there did not appear to be a material difference in kinetics on a
timescale of days – both drugs were capable of inducing HO-1 expression shifts by 3d. With that
said we could observe HMN pigment in the peritoneal cavity for weeks after injury suggesting
that the drugs acts as a depot injection. We may thus expect that HMN has a continuous dosing
paradigm which continues throughout the time course of our study while SFN has only acute
effect. This may explain some of the differences between the observed results but even if we had
maintained a constant level of SFN in the tissue throughout the time course we suggest the
outcome would still vary. The drugs cross the barrier in different ways and it would be expected
that as barrier function recovers HMN would have greater difficulty in crossing the barrier.
More critically, the way that the drugs target the Nrf2/HO-1 pathway is different. SFN is
relatively more targeted – it is known to affect specific cysteine residues on a specific repressor
protein of Nrf2 though it admittedly has some general antioxidant activity. In marked contrast
HMN itself is cytotoxic and pro-oxidant and affects the expression of Nrf2 via mild oxidative
damage in an iron driven mechanism. We do not expect that our application of HMN is in itself
grossly cytotoxic but it is nonetheless remarkable that the two molecules themselves differ in
their oxidative/reductive potential. This may suggest that there are other mechanisms outside of
heme processing which play a role. Perhaps the grossly oxidative state of HMN causes increased
production of antioxidant buffering compounds (e.g. glutathione), or alterations to caspases and
cell cycle proteins. The ARE which is activated by Nrf2 is known to activate a number of
antioxidant response molecules but it has also been well established that transcription factors are
heavily influenced by co-signals and co-factors which more selectively activate specific targets.

345
If one takes the position that the long term behavioral outcome presented is that HMN has a
greater beneficial effect it may be reasonable to attribute this to the longer term dosing behavior
of HMN. Perhaps after loss of local heme pigment Nrf2 alters its transcriptional targeting from
HO-1 to a more glutathione synthase oriented axis. SFN treated animals may lack this effect and
have reduced long term benefits after the initial heme clearance.
The SFN treated animals however due appear to have an anxiogenic effect – they do
better on the acute motor behavior metric but the rotarod is essentially a running away task. They
swim well in the MWM pool 11 days after injury but they also seem to swim a little faster, and
they have a greater tendency to jump off the platform after finding it and continuing to swim.
This suggests that there may be a stabilized anxiogenic memory or response that has persisted
across the experimental period.
It is also possible that the early kinetics of heme processing play a strong role in later
outcomes though we find this idea somewhat suspect. The question revolves around the critical
window of processing and whether processing early or quickly is desirable. We can see from our
1d IHC results that the bleed looks more effectively processed in the HMN treated animals
which would be expected to possibly also generate an acutely toxic bolus of heme degradative
products, driving more efficient enzymatic processing. We expect our HMN induced mechanism
to produce concurrent buffering effects but it is always possible in the acute post-injury period
that these have had insufficient time to build in the acute post-injury period. Further, the drugs
are both known to have roles in the activation or expression of the gelatinases we studied though
differential comparisons are somewhat difficult in a time-dependent injury affected paradigm.

346
4.9 Future Directions
HO-1 and its Nrf2 activation axis are promising molecules for treating heme related
pathologies, including TBI, and currently exist in an un-targeted space. There are presently no
drugs FDA approved for targeting HO-1/Nrf2. Early HO-1 induction appears to reduce heme
related pathology and improves behavioral outcomes in the injury paradigm utilized in our study
but there are several avenues that should be examined moving forward. There are several
directions for future work which will help to better understand the pathway mechanism, the
pathway manipulation, and behavioral outcomes after treatement.
4.9.1 Pathway Mechanism Experiments
We focused on a fairly confined portion of the HO-1/Nrf2 heme processing pathway and
there are several experiments which would help to further elucidate the underlying processing
response. One of the major interperative concerns with our results is the appearance of heme
processing in a tissue that does not have apparent hemorrhage. We note that it is possible that in
circumstances where insufficient pigment has been deposited that you could have widespread
slow leakage and deposition of heme into the tissue but definitive evidence is currently lacking.
To our knowledge no one as of yet has used radiolabeled heme to identify maximal extent of
heme tissue deposition and this experiment may provide definitive proof of whether HO-1 in
non-hemorrhagic tissues is involved in heme processing or if there is an alternative process that
occurs. We suspect that there may be limited diffuse deposition of heme throughout the
hippocampus. Further, we have largely focused on the heme processing aspect of HO-1/Nrf2
activation but there are also a whole host of antioxidant proteins that can also be expressed via
the ARE sequence and understanding the oxidative buffering capacity of the tissue after injury is
likely to be important when considering possible treatment modalities. We expect, for example,

347
that glutathione synthase and glutathione will both be elevated after injury and that both of the
drugs we use will cause additional increases early post-injury.
We have also noted that there are concerns with genetic manipulation and antibody
blockade of the HO-1/Nrf2 pathway and that we chose multiple drugs to gain the most
information feasible in a translational paradigm. However, we acknowledge that it is important
to further elucidate the exact pathway mechanisms that occur after injury. Both Sulforaphane and
Hemin have potential confounds with triggering alternative redox sensors or producing reactive
oxygen species during their metabolism. The exact mechanism of drug targeting on Nrf2 is
poorly understood and it would be helpful to track the translocation of Nrf2 into the nucleus both
in TBI and in drug treated TBI. Further, the causative benefit of Nrf2 amplification may be better
elucidated through the targeting of Keap1 or the transcriptional repressor Bach1 through
alternative means and we are aware that recent effort has been made towards the development of
selective Bach1 repressor agents (Gazaryan and Thomas, 2016).
When the project was started there were no other pharma agents identified as being more
selective but recent presentations at the Society for Neuroscience national meeting have
identified multiple groups interested in developing Nrf2 selective agents. This recent interest in
Nrf2 agent development helps to explain why Nrf2 and HO-1 have lagged as potential
therapeutic avenues compared to other transcription factors more heavily researched in TBI –
that is to say, with no widely accepted selective agents currently available, rationalizing and
securing heavy investment in projects focused on the topic has failed to materialize.

348
4.9.2 Pathway Manipulation Experiments
The current study examined a single dosing paradigm in order to contrast two drugs with
drastically different kinetic profiles and metabolic properties. Future work should examine
whether more aggressive dosing protocols would produce better outcomes and whether Hemin,
or one of its metabolites, is responsible for increased HO-1 activation. Experiments performed
by Dr. Dash have previously looked at Sulforaphane dosage schemes in a study of glutathione
mediated TBI outcome effects and showed that a specific repeat dosing paradigm where animals
were dosed 1 hour after injury and then repeat dosed 24 hours after injury resulted in behavioral
improvements in the Morris water maze not seen with single dose paradigms at 6 or 24 hours
singly (Dash et al., 2009). In our study, it appears that IP Hemin resulted in a dosing model with
continued slow degradation of the largely insoluble compound, such that large, easily observed
quantities were retained within the peritoneal cavity. This suggests that Hemin itself may not be
entirely responsible for signaling in the brain – either an intermediary has been upregulated and
altered brain gene expression or a more soluble form of Hemin or one of its metabolites might be
responsible. This brings up an interesting question about the role of low molar concentrations of
systemic bilirubin after injury.
4.9.3 Behavioral Outcomes
We used only a small number of behavioral tests and found that there were interesting
results with both pharmacologic agents used. Behavioral recovery after TBI, however, has can be
assessed with a wide range of possible tests, each of which can be used to better elucidate
specific functional changes during the recovery process. The current study only examined rats
through 15d post injury and it is possible that, while heme pathology plays a role in reducing

349
rodent behavioral outcomes during this time, it may not continue to be effective at longer post-
injury time points. The underlying premise is that early treatment and resolution of a critical
aspect of injury pathobiology (heme accumulation) will result in long term outcome benefits.
This was examined here only through 15d. The current data shows that many of the metrics
directly tied to heme processing have converged to control levels by day 15 post-injury so the
expectation would be that any improvement achieved by that point would persist through longer
survival periods.
It is also possible that our behavioral testing onset at 1d post-injury induced early stress
in the animals, exacerbating heme-related injury via increased blood pressure and/or anxiety.
Testing the animals after a day or two delay post-injury might ameliorate these effects.
Alternatively, pre-training the animals on the behavioral tests may remove the ‘test-learning’
aspect of the assay making the rotarod and Morris water maze metrics a better measure of long-
term memory and long-term cortical function. Further, expanding the assessment of drug effects
on memory could include reversal goal testing in the water maze, which would determine the
effects of heme pathway manipulation on the process of extinguishing memory and re-learning
the task. Lastly, it may be of interest to include a behavioral measurement of anxiety during
testing. It was observed several times that the SFN treated animals occasionally exhibited
behavior that could be associated with increased anxiety and it would be helpful to know if there
has been some anxiogenic effect or if the observations are driven by slightly altered functional
recovery.

350
4.10 Final Remarks
Traumatic brain injury has long resisted effective post-injury treatment paradigms. As a
result of being a constellation of tissue pathology that is produced by dissipation of energy inside
the cranium, from seemingly any source, it is a widely multimodal injury that can take
innumerous forms. In the course of this thesis we have attempted to carve out greater knowledge
in a narrowly defined paradigm that allows for effective experimentation with the hope that some
of the information may prove to be generalizable for a heterogeneous population of TBI victims.
It appears from our findings that the hemorrhagic injury response occurring after TBI may be
generalizable to classically non-hemorrhagic tissues, and it appears that treating this response
can be beneficial for behavioral outcome, even in tests that assay protection linked to these same
injured tissues that typically lack hemorrhage. This suggests that further studies of the underlying
heme degradation process response or therapeutic intervention targeting HO-1/Nrf2 appear to be
warranted. The evidence shows that it may be possible to enact a treatment protocol in a critical
window that exists at least through 1 hour post-injury.

351
5 List of References
Abstracts from the 34(th) annual national neurotrauma symposium june 26-29, 2016 lexington,
kentucky. (2016) J Neurotrauma (United States) 33:A1-A139.
Adams JH, Graham DI, Gennarelli TA, Maxwell WL (1991) Diffuse axonal injury in non-
missile head injury. J Neurol Neurosurg Psychiatry (ENGLAND) 54:481-483.
Adams JH, Graham DI, Murray LS, Scott G (1982) Diffuse axonal injury due to nonmissile head
injury in humans: An analysis of 45 cases. Ann Neurol (UNITED STATES) 12:557-563.
Adams JH, Doyle D, Ford I, Gennarelli TA, Graham DI, McLellan DR (1989) Diffuse axonal
injury in head injury: Definition, diagnosis and grading. Histopathology (ENGLAND) 15:49-59.
Adams JH, Doyle D, Graham DI, Lawrence AE, McLellan DR, Gennarelli TA, Pastuszko M,
Sakamoto T (1985) The contusion index: A reappraisal in human and experimental non-missile
head injury. Neuropathol Appl Neurobiol (ENGLAND) 11:299-308.
Ahuja M, Ammal-Kaidery N, Morgan J, Igarashi K, Attucks OC (2016) Preclinical validation of
Bach1 inhibition for the development of parkinson’s disease therapy.
Alam J (1994) Multiple elements within the 5' distal enhancer of the mouse heme oxygenase-1
gene mediate induction by heavy metals. J Biol Chem (UNITED STATES) 269:25049-25056.
Alam J, Cook JL (2003) Transcriptional regulation of the heme oxygenase-1 gene via the stress
response element pathway. Curr Pharm Des (Netherlands) 9:2499-2511.
Alam J, Den Z (1992) Distal AP-1 binding sites mediate basal level enhancement and TPA
induction of the mouse heme oxygenase-1 gene. J Biol Chem (UNITED STATES) 267:21894-
21900.
Alam J, Camhi S, Choi AM (1995) Identification of a second region upstream of the mouse
heme oxygenase-1 gene that functions as a basal level and inducer-dependent transcription
enhancer. J Biol Chem (UNITED STATES) 270:11977-11984.
Alam J, Cai J, Smith A (1994) Isolation and characterization of the mouse heme oxygenase-1
gene. distal 5' sequences are required for induction by heme or heavy metals. J Biol Chem
(UNITED STATES) 269:1001-1009.
Alam J, Shibahara S, Smith A (1989) Transcriptional activation of the heme oxygenase gene by
heme and cadmium in mouse hepatoma cells. J Biol Chem (UNITED STATES) 264:6371-6375.
Alam J, Wicks C, Stewart D, Gong P, Touchard C, Otterbein S, Choi AM, Burow ME, Tou J
(2000) Mechanism of heme oxygenase-1 gene activation by cadmium in MCF-7 mammary
352
epithelial cells. role of p38 kinase and Nrf2 transcription factor. J Biol Chem (UNITED
STATES) 275:27694-27702.
Albert-Weissenberger C, Siren AL (2010) Experimental traumatic brain injury. Exp Transl
Stroke Med (England) 2:16-7378-2-16.
Alfieri A, Srivastava S, Siow RC, Cash D, Modo M, Duchen MR, Fraser PA, Williams SC,
Mann GE (2013) Sulforaphane preconditioning of the Nrf2/HO-1 defense pathway protects the
cerebral vasculature against blood-brain barrier disruption and neurological deficits in stroke.
Free Radic Biol Med (United States) 65:1012-1022.
Andriessen TMJC, Jacobs B, Vos PE (2010) Clinical characteristics and pathophysiological
mechanisms of focal and diffuse traumatic brain injury. 14:2381-2392.
Annabi B, Rojas-Sutterlin S, Laroche M, Lachambre MP, Moumdjian R, Beliveau R (2008) The
diet-derived sulforaphane inhibits matrix metalloproteinase-9-activated human brain
microvascular endothelial cell migration and tubulogenesis. Mol Nutr Food Res (Germany)
52:692-700.
Annegers JF, Hauser WA, Coan SP, Rocca WA (1998) A population-based study of seizures
after traumatic brain injuries. 338:20-24.
Asahi M, Asahi K, Jung JC, del Zoppo GJ, Fini ME, Lo EH (2000a) Role for matrix
metalloproteinase 9 after focal cerebral ischemia: Effects of gene knockout and enzyme
inhibition with BB-94. J Cereb Blood Flow Metab (United States) 20:1681-1689.
Asahi M, Sumii T, Fini ME, Itohara S, Lo EH (2001) Matrix metalloproteinase 2 gene knockout
has no effect on acute brain injury after focal ischemia. 12:3003-3007.
Asahi M, Asahi K, Jung J, del Zoppo GJ, Fini ME, Lo EH (2000b) Role for matrix
metalloproteinase 9 after focal cerebral ischemia: Effects of gene knockout and enzyme
inhibition with BB-94. 1681-1689.
Asahina M, Yoshiyama Y, Hattori T (2001) Expression of matrix metalloproteinase-9 and
urinary-type plasminogen activator in alzheimer's disease brain. Clin Neuropathol (Germany)
20:60-63.
Asikainen I, Kaste M, Sarna S (1998) Predicting late outcome for patients with traumatic brain
injury referred to a rehabilitation programme: A study of 508 finnish patients 5 years or more
after injury. 12:95-107.
Ayoub AE, Cai TQ, Kaplan RA, Luo J (2005) Developmental expression of matrix
metalloproteinases 2 and 9 and their potential role in the histogenesis of the cerebellar cortex. J
Comp Neurol (United States) 481:403-415.

353
Baker AH (2002) Metalloproteinase inhibitors: Biological actions and therapeutic opportunities.
115:3719-3727.
Bales JW, Wagner AK, Kline AE, Dixon CE (2009) Persistent cognitive dysfunction after
traumatic brain injury: A dopamine hypothesis. Neuroscience & Biobehavioral Reviews 33:981-
1003.
Balogun E, Hoque M, Gong P, Killeen E, Green CJ, Foresti R, Alam J, Motterlini R (2003)
Curcumin activates the haem oxygenase-1 gene via regulation of Nrf2 and the antioxidant-
responsive element. Biochem J (England) 371:887-895.
Baranova AI, Wei EP, Ueda Y, Sholley MM, Kontos HA, Povlishock JT (2008) Cerebral
vascular responsiveness after experimental traumatic brain injury: The beneficial effects of
delayed hypothermia combined with superoxide dismutase administration. J Neurosurg (United
States) 109:502-509.
Barnett SC (2004) Olfactory ensheathing cells: Unique glial cell types? 21:375-382.
Barone E, Di Domenico F, Butterfield DA (2014) Statins more than cholesterol lowering agents
in alzheimer disease: Their pleiotropic functions as potential therapeutic targets. Biochem
Pharmacol (England) 88:605-616.
Barros CS, Franco SJ, Muller U (2011) Extracellular matrix: Functions in the nervous system.
Cold Spring Harb Perspect Biol (United States) 3:a005108.
Bartfai T, Sanchez-Alavez M, Andell-Jonsson S, Schultzberg M, Vezzani A, Danielsson E, Conti
B (2007) Interleukin-1 system in CNS stress: Seizures, fever, and neurotrauma. Ann N Y Acad
Sci (United States) 1113:173-177.
Bartnik-Olson BL, Holshouser B, Wang H, Grube M, Tong K, Wong V, Ashwal S (2014)
Impaired neurovascular unit function contributes to persistent symptoms after concussion: A
pilot study. J Neurotrauma (United States) 31:1497-1506.
Bashir S, Vernet M, Yoo WK, Mizrahi I, Theoret H, Pascual-Leone A (2012) Changes in cortical
plasticity after mild traumatic brain injury. Restor Neurol Neurosci (Netherlands) 30:277-282.
Becker JW, Marcy AI, Rokosz LL, Axel MG, Burbaum JJ, Fitzgerald PMD, Cameron PM, Esser
CK, Hagmann WK, Hermes JD, Springer JP (1995) Stromelysin-1: Three-dimensional structure
of the inhibited catalytic domain and of the C-truncated proenzyme. 4:1966-1976.
Bellander BM, Singhrao SK, Ohlsson M, Mattsson P, Svensson M (2001) Complement
activation in the human brain after traumatic head injury. J Neurotrauma (United States)
18:1295-1311.
Benedictus MR, Spikman JM, van der Naalt J (2010) Cognitive and behavioral impairment in
traumatic brain injury related to outcome and return to work. 91:1436-1441.

354
Bessis A, Bechade C, Bernard D, Roumier A (2007) Microglial control of neuronal death and
synaptic properties. Glia (United States) 55:233-238.
Bhardwaj M, Deshmukh R, Kaundal M, Krishna Reddy BV (2016) Pharmacological induction of
hemeoxygenase-1 activity attenuates intracerebroventricular streptozotocin induced
neurocognitive deficit and oxidative stress in rats. Eur J Pharmacol (Netherlands) 772:43-50.
Bhardwaj RD, Curtis MA, Spalding KL, Buchholz BA, Fink D, Bjork-Eriksson T, Nordborg C,
Gage FH, Druid H, Eriksson PS, Frisen J (2006) Neocortical neurogenesis in humans is
restricted to development. Proc Natl Acad Sci U S A (United States) 103:12564-12568.
Bilimoria PM, Stevens B (2015) Microglia function during brain development: New insights
from animal models. Brain Res 1617:7-17.
Blinzinger K, Kreutzberg G (1968) Displacement of synaptic terminals from regenerating
motoneurons by microglial cells. Cell Tissue Res 85:145-157.
Bliss TV, Lomo T (1973) Long-lasting potentiation of synaptic transmission in the dentate area
of the anaesthetized rabbit following stimulation of the perforant path. J Physiol (England)
232:331-356.
Block ML, Hong JS (2007) Chronic microglial activation and progressive dopaminergic
neurotoxicity. Biochem Soc Trans (England) 35:1127-1132.
Block ML, Hong JS (2005) Microglia and inflammation-mediated neurodegeneration: Multiple
triggers with a common mechanism. Prog Neurobiol (England) 76:77-98.
Bolisetty S, Zarjou A, Agarwal A (2017) Heme oxygenase 1 as a therapeutic target in acute
kidney injury. Am J Kidney Dis (United States) 69:531-545.
Borger DR, Essig DA (1998) Induction of HSP 32 gene in hypoxic cardiomyocytes is attenuated
by treatment with N-acetyl-L-cysteine. Am J Physiol (UNITED STATES) 274:H965-73.
Bower JH, Maraganore DM, Peterson BJ, McDonnell SK, Ahlskog JE, Rocca WA (2003) Head
trauma preceding PD: A case-control study. Neurology (United States) 60:1610-1615.
Bozdagi O, Nagy V, Kwei KT, Huntley GW (2007) In vivo roles for matrix metalloproteinase-9
in mature hippocampal synaptic physiology and plasticity. 98:334-344.
Breder C, Dinarello C, Saper C (1988) Interleukin-1 immunoreactive innervation of the human
hypothalamus. 240:321-324.
Browne KD, Chen X, Meaney DF, Smith DH (2011) Mild traumatic brain injury and diffuse
axonal injury in swine. 28:1747-1755.

355
Büki A, Povlishock J (2006) All roads lead to disconnection?–Traumatic axonal injury revisited.
Acta Neurochir 148:181-194.
Buki A, Okonkwo DO, Wang KK, Povlishock JT (2000) Cytochrome c release and caspase
activation in traumatic axonal injury. J Neurosci (United States) 20:2825-2834.
Buki A, Siman R, Trojanowski JQ, Povlishock JT (1999) The role of calpain-mediated spectrin
proteolysis in traumatically induced axonal injury. J Neuropathol Exp Neurol (England) 58:365-
375.
Bullock R, Zauner A, Woodward JJ, Myseros J, Choi SC, Ward JD, Marmarou A, Young HF
(1998) Factors affecting excitatory amino acid release following severe human head injury.
89:507-518.
Bye N, Carron S, Han X, Agyapomaa D, Ng SY, Yan E, Rosenfeld JV, Morganti-Kossmann MC
(2011) Neurogenesis and glial proliferation are stimulated following diffuse traumatic brain
injury in adult rats. 89:986-1000.
Camhi SL, Alam J, Otterbein L, Sylvester SL, Choi AM (1995) Induction of heme oxygenase-1
gene expression by lipopolysaccharide is mediated by AP-1 activation. Am J Respir Cell Mol
Biol (UNITED STATES) 13:387-398.
Cao S, Zheng M, Hua Y, Chen G, Keep RF, Xi G (2016) Hematoma changes during clot
resolution after experimental intracerebral hemorrhage. Stroke (United States) 47:1626-1631.
Carreno-Velazquez T, Beswick P, Wahab B, Atack J (2016) A structure-based approach to
identifying novel modulators of the Nrf2 transcription pathway.
Castellani R, Smith MA, Richey PL, Perry G (1996) Glycoxidation and oxidative stress in
parkinson disease and diffuse lewy body disease. Brain Res (NETHERLANDS) 737:195-200.
Cederberg D, Siesjö P (2009) What has inflammation to do with traumatic brain injury?
26:221-226.
Chakraborti S, Mandal M, Das S, Mandal A, Chakraborti T (2003) Regulation of matrix
metalloproteinases: An overview. Mol Cell Biochem (Netherlands) 253:269-285.
Chamak B, Dobbertin A, Mallat M (1995) Immunohistochemical detection of thrombospondin in
microglia in the developing rat brain. 69:177-187.
Chan JL, Reeves TM, Phillips LL (2014) Osteopontin expression in acute immune response
mediates hippocampal synaptogenesis and adaptive outcome following cortical brain injury. Exp
Neurol (United States) 261:757-771.

356
Chang EF, Claus CP, Vreman HJ, Wong RJ, Noble-Haeusslein LJ (2005) Heme regulation in
traumatic brain injury: Relevance to the adult and developing brain. J Cereb Blood Flow Metab
(United States) 25:1401-1417.
Chang EF, Wong RJ, Vreman HJ, Igarashi T, Galo E, Sharp FR, Stevenson DK, Noble-
Haeusslein LJ (2003) Heme oxygenase-2 protects against lipid peroxidation-mediated cell loss
and impaired motor recovery after traumatic brain injury. J Neurosci (United States) 23:3689-
3696.
Chao CC, Hu S, Molitor TW, Shaskan EG, Peterson PK (1992) Activated microglia mediate
neuronal cell injury via a nitric oxide mechanism. J Immunol (United States) 149:2736-2741.
Chattarji S (2011) Lipocalin comes callin' on the hippocampus. Proc Natl Acad Sci U S A
(United States) 108:18197-18198.
Chen HW, Chao CY, Lin LL, Lu CY, Liu KL, Lii CK, Li CC (2013) Inhibition of matrix
metalloproteinase-9 expression by docosahexaenoic acid mediated by heme oxygenase 1 in 12-
O-tetradecanoylphorbol-13-acetate-induced MCF-7 human breast cancer cells. Arch Toxicol
(Germany) 87:857-869.
Cheng JP, Hoffman AN, Zafonte RD, Kline AE (2008) A delayed and chronic treatment regimen
with the 5-HT1A receptor agonist 8-OH-DPAT after cortical impact injury facilitates motor
recovery and acquisition of spatial learning. Behav Brain Res (Netherlands) 194:79-85.
Chen-Roetling J, Lu X, Regan RF (2015) Targeting heme oxygenase after intracerebral
hemorrhage. Ther Targets Neurol Dis (United States) 2:474.
Cherian L, Goodman JC, Robertson C (2011) Improved cerebrovascular function and reduced
histological damage with darbepoietin alfa administration after cortical impact injury in rats. J
Pharmacol Exp Ther (United States) 337:451-456.
Chiara Ricciardi M, Bokkers RP, Butman JA, Hammoud DA, Pham DL, Warach S, Latour LL
(2017) Trauma-specific brain abnormalities in suspected mild traumatic brain injury patients
identified in the first 48 hours after injury: A blinded magnetic resonance imaging comparative
study including suspected acute minor stroke patients. J Neurotrauma (United States) 34:23-30.
Chodobski A, Zink BJ, Szmydynger-Chodobska J (2011) Blood-brain barrier pathophysiology in
traumatic brain injury. Transl Stroke Res (United States) 2:492-516.
Christman CW, Salvant Jr. JB, Walker SA, Povlishock JT (1997) Characterization of a
prolonged regenerative attempt by diffusely injured axons following traumatic brain injury in
adult cat: A light and electron microscopic immunocytochemical study. 94:329-337.
Christopherson KS, Ullian EM, Stokes CCA, Mullowney CE, Hell JW, Agah A, Lawler J,
Mosher DF, Bornstein P, Barres BA (2005) Thrombospondins are astrocyte-secreted proteins
that promote CNS synaptogenesis. 120:421-433.

357
Cirstea MC, Levin MF (2000) Compensatory strategies for reaching in stroke. Brain (England)
123 ( Pt 5):940-953.
Clark AW, Krekoski CA, Bou S, Chapman KR, Edwards DR (1997) Increased gelatinase A
(MMP-2) and gelatinase B (MMP-9) activities in human brain after focal ischemia. 238:53-56.
Cobbs CS, Fenoy A, Bredt DS, Noble LJ (1997) Expression of nitric oxide synthase in the
cerebral microvasculature after traumatic brain injury in the rat. 751:336-338.
Coburn K (1992) Traumatic brain injury: The silent epidemic. AACN Clin Issues Crit Care Nurs
(United States) 3:9-18.
Colton CA, Wilcock DM (2010) Assessing activation states in microglia. CNS & Neurological
Disorders-Drug Targets (Formerly Current Drug Targets-CNS & Neurological Disorders) 9:174-
191.
Colton CA (2009) Heterogeneity of microglial activation in the innate immune response in the
brain. J Neuroimmune Pharmacol (United States) 4:399-418.
Conant K, Gottschall PE (2005) Matrix metalloproteinases in the central nervous system.
Conti AC, Raghupathi R, Trojanowski JQ, McIntosh TK (1998) Experimental brain injury
induces regionally distinct apoptosis during the acute and delayed post-traumatic period. J
Neurosci (United States) 18:5663-5672.
Coronado VG, Xu L, Basavaraju SV, McGuire LC, Wald MM, Faul MD, Guzman BR, Hemphill
JD, Centers for Disease Control and Prevention (CDC) (2011) Surveillance for traumatic brain
injury-related deaths--united states, 1997-2007. MMWR Surveill Summ (United States) 60:1-32.
Coronado VG, McGuire LC, Sarmiento K, Bell J, Lionbarger MR, Jones CD, Geller AI, Khoury
N, Xu L (2014) Corrigendum to “Trends in traumatic brain injury in the U.S. and the public
health response: 1995–2009 ☆― [J. saf. res. 43 (2012) 299-307]. 48:117.
Correale J (2014) The role of microglial activation in disease progression. Mult Scler (England)
20:1288-1295.
Correale J, Villa A (2004) The neuroprotective role of inflammation in nervous system injuries.
251:1304-1316.
Cotman C (1999) Axon sprouting and regeneration. In: Basic neurochemistry: Molecular,
cellular and medical aspects (Siegel G, Agranoff B, Albers R, eds), ppChapter 29. Philadelphia:
Lippincott-Raven.
Cotman C, Gentry C, Steward O (1977) Synaptic replacement in the dentate gyrus after
unilateral entorhinal lesion: Electron microscopic analysis of the extent of replacement of
synapses by the remaining entorhinal cortex. 6:455-464.

358
Cramer SC, Nelles G, Benson RR, Kaplan JD, Parker RA, Kwong KK, Kennedy DN, Finklestein
SP, Rosen BR (1997) A functional MRI study of subjects recovered from hemiparetic stroke.
Stroke (United States) 28:2518-2527.
Cruse I, Maines MD (1988) Evidence suggesting that the two forms of heme oxygenase are
products of different genes. J Biol Chem (UNITED STATES) 263:3348-3353.
Cuadrado A, Rojo AI (2008) Heme oxygenase-1 as a therapeutic target in neurodegenerative
diseases and brain infections. Curr Pharm Des (Netherlands) 14:429-442.
D'Amato CJ, Hicks SP (1978) Normal development and post-traumatic plasticity of corticospinal
neurons in rats. Exp Neurol (United States) 60:557-569.
Dash PK, Mach SA, Moore AN (2001) Enhanced neurogenesis in the rodent hippocampus
following traumatic brain injury. 63:313-319.
Dash PK, Zhao J, Orsi SA, Zhang M, Moore AN (2009) Sulforaphane improves cognitive
function administered following traumatic brain injury. Neurosci Lett (Ireland) 460:103-107.
del Zoppo GJ, Hallenbeck JM (2000) Advances in the vascular pathophysiology of ischemic
stroke. Thromb Res (UNITED STATES) 98:73-81.
Deller T, Del Turco D, Rappert A, Bechmann I (2007) Structural reorganization of the dentate
gyrus following entorhinal denervation: Species differences between rat and mouse. 501-528.
Demestre M, Wells GM, Miller KM, Smith KJ, Hughes RAC, Gearing AJ, Gregson NA (2004)
Characterisation of matrix metalloproteinases and the effects of a broad-spectrum inhibitor (BB-
1101) in peripheral nerve regeneration. 124:767-779.
DeWitt DS, Prough DS (2003) Traumatic cerebral vascular injury: The effects of concussive
brain injury on the cerebral vasculature. J Neurotrauma (United States) 20:795-825.
Dietrich WD, Alonso O, Halley M (1994) Early microvascular and neuronal consequences of
traumatic brain injury: A light and electron microscopic study in rats. 11:289-301.
Ding JY, Kreipke CW, Schafer P, Schafer S, Speirs SL, Rafols JA (2009) Synapse loss regulated
by matrix metalloproteinases in traumatic brain injury is associated with hypoxia inducible
factor-1alpha expression. Brain Res (Netherlands) 1268:125-134.
Dinkova-Kostova AT, Holtzclaw WD, Cole RN, Itoh K, Wakabayashi N, Katoh Y, Yamamoto
M, Talalay P (2002) Direct evidence that sulfhydryl groups of Keap1 are the sensors regulating
induction of phase 2 enzymes that protect against carcinogens and oxidants. Proc Natl Acad Sci
U S A (United States) 99:11908-11913.
Dityatev A, Schachner M (2003) Extracellular matrix molecules and synaptic plasticity. 4:456-
468.

359
Dixon CE, Clifton GL, Lighthall JW, Yaghmai AA, Hayes RL (1991) A controlled cortical
impact model of traumatic brain injury in the rat. J Neurosci Methods (Netherlands) 39:253-262.
Dixon CE, Kraus MF, Kline AE, Ma X, Yan HQ, Griffith RG, Wolfson BM, Marion DW (1999)
Amantadine improves water maze performance without affecting motor behavior following
traumatic brain injury in rats. Restor Neurol Neurosci (Netherlands) 14:285-294.
Dixon CE, Lyeth BG, Povlishock JT, Findling RL, Hamm RJ, Marmarou A, Young HF, Hayes
RL (1987) A fluid percussion model of experimental brain injury in the rat. J Neurosurg
(UNITED STATES) 67:110-119.
Du C, Hu R, Csernansky CA, Hsu CY, Choi DW (1996) Very delayed infarction after mild focal
cerebral ischemia: A role for apoptosis? 195-201.
Duong TD, Erickson CA (2003) MMP-2 plays an essential role in producing epithelial-
mesenchymal transformations in the avian embryo. 229:42-53.
Durante W, Peyton KJ, Schafer AI (1999) Platelet-derived growth factor stimulates heme
oxygenase-1 gene expression and carbon monoxide production in vascular smooth muscle cells.
Arterioscler Thromb Vasc Biol (UNITED STATES) 19:2666-2672.
Dwivedi S, Rajasekar N, Hanif K, Nath C, Shukla R (2016) Sulforaphane ameliorates okadaic
acid-induced memory impairment in rats by activating the Nrf2/HO-1 antioxidant pathway. Mol
Neurobiol (United States) 53:5310-5323.
Dziembowska M, Wlodarczyk J (2012) MMP9: A novel function in synaptic plasticity. 44:709-
713.
Eichenbaum H, Yonelinas AP, Ranganath C (2007) The medial temporal lobe and recognition
memory. Annu Rev Neurosci (United States) 30:123-152.
Ek CJ, Dziegielewska KM, Stolp H, Saunders NR (2006) Functional effectiveness of the blood-
brain barrier to small water-soluble molecules in developing and adult opossum (monodelphis
domestica). 496:13-26.
Ek CJ, Habgood MD, Dziegielewska KM, Saunders NR (2003) Structural characteristics and
barrier properties of the choroid plexuses in developing brain of the opossum (monodelphis
domestica). 460:451-464.
Ekdahl CT, Kokaia Z, Lindvall O (2009) Brain inflammation and adult neurogenesis: The dual
role of microglia. 158:1021-1029.
Elbirt KK, Whitmarsh AJ, Davis RJ, Bonkovsky HL (1998) Mechanism of sodium arsenite-
mediated induction of heme oxygenase-1 in hepatoma cells. role of mitogen-activated protein
kinases. J Biol Chem (UNITED STATES) 273:8922-8931.

360
Emery DL, Fulp CT, Saatman KE, Schütz C, Neugebauer E, McIntosh TK (2005) Newly born
granule cells in the dentate gyrus rapidly extend axons into the hippocampal CA3 region
following experimental brain injury. 22:978-988.
Erb DE, Povlishock JT (1991) Neuroplasticity following traumatic brain injury: A study of
GABAergic terminal loss and recovery in the cat dorsal lateral vestibular nucleus. 83:.
Ethell IM, Ethell DW (2007) Matrix metalloproteinases in brain development and remodeling:
Synaptic functions and targets. 85:2813-2823.
Ewing JF, Maines MD (1993) Glutathione depletion induces heme oxygenase-1 (HSP32) mRNA
and protein in rat brain. J Neurochem (UNITED STATES) 60:1512-1519.
Faden A, Demediuk P, Panter S, Vink R (1989) The role of excitatory amino acids and NMDA
receptors in traumatic brain injury. 244:798-800.
Falo MC, Fillmore HL, Reeves TM, Phillips LL (2006) Matrix metalloproteinase-3 expression
profile differentiates adaptive and maladaptive synaptic plasticity induced by traumatic brain
injury. 84:768-781.
Falo MC, Reeves TM, Phillips LL (2008) Agrin expression during synaptogenesis induced by
traumatic brain injury. 25:769-783.
Farkas O, Povlishock JT (2007) Cellular and subcellular change evoked by diffuse traumatic
brain injury: A complex web of change extending far beyond focal damage. Prog Brain Res
161:43-59.
Farkas O (2006) Mechanoporation induced by diffuse traumatic brain injury: An irreversible or
reversible response to injury? 26:3130-3140.
Fauconneau B, Petegnief V, Sanfeliu C, Piriou A, Planas AM (2002) Induction of heat shock
proteins (HSPs) by sodium arsenite in cultured astrocytes and reduction of hydrogen peroxide-
induced cell death. J Neurochem (England) 83:1338-1348.
Faul MD, Xu L, Wald MM, Coronado VG (2010) Traumatic brain injury in the united states:
Emergency department visits, hospitalizations and deaths 2002-2006. (Atlanta,(GA)) .
Favatier F, Polla BS (2001) Tobacco-smoke-inducible human haem oxygenase-1 gene
expression: Role of distinct transcription factors and reactive oxygen intermediates. Biochem J
(England) 353:475-482.
Ferguson PL, Smith GM, Wannamaker BB, Thurman DJ, Pickelsimer EE, Selassie AW (2009)
A population-based study of risk of epilepsy after hospitalization for traumatic brain injury.
51:891-898.

361
Ferreira AC, Pinto V, Da Mesquita S, Novais A, Sousa JC, Correia-Neves M, Sousa N, Palha JA,
Marques F (2013) Lipocalin-2 is involved in emotional behaviors and cognitive function. Front
Cell Neurosci (Switzerland) 7:122.
Finkelstein EA, Corso PS, Miller TR (2006) The burden of injuries. 160-174.
Fiske B, Brunjes P (2000) Microglial activation in the developing rat olfactory bulb.
Neuroscience 96:807-815.
Fleminger S (2003) Head injury as a risk factor for alzheimer's disease: The evidence 10 years
on; a partial replication. 74:857-862.
Flower DR (1996) The lipocalin protein family: Structure and function. Biochem J (ENGLAND)
318 ( Pt 1):1-14.
Fluiter K, Opperhuizen AL, Morgan BP, Baas F, Ramaglia V (2014) Inhibition of the membrane
attack complex of the complement system reduces secondary neuroaxonal loss and promotes
neurologic recovery after traumatic brain injury in mice. J Immunol (United States) 192:2339-
2348.
Foda MA, Marmarou A (1994) A new model of diffuse brain injury in rats. part II:
Morphological characterization. J Neurosurg (United States) 80:301-313.
Foresti R, Clark JE, Green CJ, Motterlini R (1997) Thiol compounds interact with nitric oxide in
regulating heme oxygenase-1 induction in endothelial cells. involvement of superoxide and
peroxynitrite anions. J Biol Chem (UNITED STATES) 272:18411-18417.
Foresti R, Sarathchandra P, Clark JE, Green CJ, Motterlini R (1999) Peroxynitrite induces haem
oxygenase-1 in vascular endothelial cells: A link to apoptosis. Biochem J (ENGLAND) 339 ( Pt
3):729-736.
Fredrich M, Illing R (2010) MMP-2 is involved in synaptic remodeling after cochlear lesion.
21:324-327.
Frey LC (2003) Epidemiology of posttraumatic epilepsy: A critical review. 44:11-17.
Frotscher M, Heimrich B, Deller T (1997) Sprouting in the hippocampus is layer-specific.
20:218-223.
Frugier T, Morganti-Kossmann MC, O'Reilly D, McLean CA (2010) In situ detection of
inflammatory mediators in post mortem human brain tissue after traumatic injury. 27:497-507.
Fukuda K, Panter SS, Sharp FR, Noble LJ (1995) Induction of heme oxygenase-1 (HO-1) after
traumatic brain injury in the rat. Neurosci Lett (IRELAND) 199:127-130.

362
Fukuda K, Richmon JD, Sato M, Sharp FR, Panter SS, Noble LJ (1996) Induction of heme
oxygenase-1 (HO-1) in glia after traumatic brain injury. Brain Res (NETHERLANDS) 736:68-
75.
Gao G, Oda Y, Wei EP, Povlishock JT (2010) The adverse pial arteriolar and axonal
consequences of traumatic brain injury complicated by hypoxia and their therapeutic modulation
with hypothermia in rat. J Cereb Blood Flow Metab (United States) 30:628-637.
Gasche Y, Fujimura M, Morita-Fujimura Y, Copin J, Kawase M, Massengale J, Chan PH (1999)
Early appearance of activated matrix metalloproteinase-9 after focal cerebral ischemia in mice: A
possible role in blood-brain barrier dysfunction. 1020-1028.
Gazaryan IG, Thomas B (2016) The status of Nrf2-based therapeutics: Current perspectives and
future prospects. Neural Regen Res (India) 11:1708-1711.
Gennarelli TA, Thibault LE, Adams JH, Graham DI, Thompson CJ, Marcincin RP (1982)
Diffuse axonal injury and traumatic coma in the primate. 12:564-574.
Geurts N, Martens E, Van Aelst I, Proost P, Opdenakker G, Van den Steen PE (2008) Beta-
hematin interaction with the hemopexin domain of gelatinase B/MMP-9 provokes autocatalytic
processing of the propeptide, thereby priming activation by MMP-3. Biochemistry (United
States) 47:2689-2699.
Gidday JM (2005) Leukocyte-derived matrix metalloproteinase-9 mediates blood-brain barrier
breakdown and is proinflammatory after transient focal cerebral ischemia. 289:H558-H568.
Giraudon P, Buart S, Bernard A, Belin M (1997) Cytokines secreted by glial cells infected with
HTLV-I modulate the expression of matrix metalloproteinases (MMPs) and their natural
inhibitor (TIMPs): Possible involvement in neurodegenerative processes. 2:107-110.
Girolamo F, Virgintino D, Errede M, Capobianco C, Bernardini N, Bertossi M, Roncali L (2004)
Involvement of metalloprotease-2 in the development of human brain microvessels. 122:261-
270.
Giulian D, Chen J, Ingeman JE, George JK, Noponen M (1989) The role of mononuclear
phagocytes in wound healing after traumatic injury to adult mammalian brain. J Neurosci
(United States) 9:4416-4429.
Goldman SM, Tanner CM, Oakes D, Bhudhikanok GS, Gupta A, Langston JW (2006) Head
injury and parkinson's disease risk in twins. Ann Neurol (United States) 60:65-72.
Goldstein LE, McKee AC (2012) Response to comment on "chronic traumatic encephalopathy in
blast-exposed military veterans and a blast neurotrauma mouse model". 4:157lr5-157lr5.
Goldstein M (1990) Traumatic brain injury: A silent epidemic. 27:327-327.

363
Gong Q, Hart BA (1997) Effect of thiols on cadmium-induced expression of metallothionein and
other oxidant stress genes in rat lung epithelial cells. Toxicology (IRELAND) 119:179-191.
Gonthier B, Koncina E, Satkauskas S, Perraut M, Roussel G, Aunis D, Kapfhammer JP, Bagnard
D (2009) A PKC-dependent recruitment of MMP-2 controls semaphorin-3A growth-promoting
effect in cortical dendrites. 4:e5099.
Goodman DC, Horel JA (1966) Sprouting of optic tract projections in the brain stem of the rat.
127:71-88.
Gorman L, Fu K, Hovda D, Becker D, Katayama Y (1989) Analysis of acetylcholine release
following concussive brain injury in the rat. J Neurotrauma 6:1-2.
Goss JR, O'Malley ME, Zou L, Styren SD, Kochanek PM, DeKosky ST (1998) Astrocytes are
the major source of nerve growth factor upregulation following traumatic brain injury in the rat.
149:301-309.
Gottschall PE, Yu X, Bing B (1995) Increased production of gelatinase B (matrix
metalloproteinase-9) and interleukin-6 by activated rat microglia in culture. 42:335-342.
Gottschall PE, Yu X (1995) Cytokines regulate gelatinase A and B (matrix metalloproteinase 2
and 9) activity in cultured rat astrocytes. 64:1513-1520.
Gould E (2007) How widespread is adult neurogenesis in mammals? 8:481-488.
Grady MS, Jane JA, Steward O (1989) Synaptic reorganization within the human central nervous
system following injury. 71:534-537.
Graham DI, Adams JH, Nicoll JAR, Maxwell WL, Gennarelli TA (1995) The nature, distribution
and causes of traumatic brain injury. 5:397-406.
Granacher RP (2008) Traumatic brain injury: Methods for clinical and forensic neuropsychiatric
assessment. (FL, USA) .
Graves AB, White E, Koepsell TD, Reifler BV, Van Belle G, Larson EB, Raskind M (1990) A
case-control study of alzheimer's disease. 28:766-774.
Gray J, McNaughton N (2003) The neuropsychology of anxiety: An enquiry into the function of
the septo-hippocampal system. OUP Oxford.
Graziadei PP, Levine RR, Monti Graziadei GA (1979) Plasticity of connections of the olfactory
sensory neuron: Regeneration into the forebrain following bulbectomy in the neonatal mouse.
Neuroscience (United States) 4:713-727.

364
Graziadei PP, Levine RR, Graziadei GA (1978) Regeneration of olfactory axons and synapse
formation in the forebrain after bulbectomy in neonatal mice. Proc Natl Acad Sci U S A (United
States) 75:5230-5234.
Greco T, Fiskum G (2010) Brain mitochondria from rats treated with sulforaphane are resistant
to redox-regulated permeability transition. J Bioenerg Biomembr (United States) 42:491-497.
Greenwald BD, Kapoor N, Singh AD (2012) Visual impairments in the first year after traumatic
brain injury. 26:1338-1359.
Gultekin SH, Smith TW (1994) Diffuse axonal injury in craniocerebral trauma. A comparative
histologic and immunohistochemical study. Arch Pathol Lab Med (United States) 118:168-171.
Gursoy-Ozdemir Y, Qiu J, Matsuoka N, Bolay H, Bermpohl D, Jin H, Wang X, Rosenberg GA,
Lo EH, Moskowitz MA (2004) Cortical spreading depression activates and upregulates MMP-9.
113:1447-1455.
Habgood MD, Bye N, Dziegielewska KM, Ek CJ, Lane MA, Potter A, Morganti-Kossmann C,
Saunders NR (2007) Changes in blood-brain barrier permeability to large and small molecules
following traumatic brain injury in mice. 25:231-238.
Halliwell B, Gutteridge JMC (1999) Free radicals in biology and medicine. Oxford, UK:
Oxford Univ. Press.
Hamm RJ, O'Dell DM, Pike BR, Lyeth BG (1993) Cognitive impairment following traumatic
brain injury: The effect of pre-and post-injury administration of scopolamine and MK-801.
Cognitive Brain Research 1:223-226.
Hamm RJ, Pike BR, O'Dell DM, Lyeth BG, Jenkins LW (1994) The rotarod test: An evaluation
of its effectiveness in assessing motor deficits following traumatic brain injury. J Neurotrauma
(UNITED STATES) 11:187-196.
Handsley MM, Cross J, Gaviloric J, Edwards DR (2005) The matrix metalloproteinases and their
inhibitors. In: Matrix metalloproteinases in the central nervous system (Conant K, Gottschall PE,
eds), pp3. London: Imperial College Press.
Hanisch U (2002) Microglia as a source and target of cytokines. 40:140-155.
Harris JL, Reeves TM, Phillips LL (2011) Phosphacan and receptor protein tyrosine phosphatase
beta expression mediates deafferentation-induced synaptogenesis. Hippocampus (United States)
21:81-92.
Harris NG, Mironova YA, Hovda DA, Sutton RL (2010) Chondroitinase ABC enhances
pericontusion axonal sprouting but does not confer robust improvements in behavioral recovery.
27:1971-1982.

365
Hartsfield CL, Alam J, Cook JL, Choi AM (1997) Regulation of heme oxygenase-1 gene
expression in vascular smooth muscle cells by nitric oxide. Am J Physiol (UNITED STATES)
273:L980-8.
Hayes RL, Jenkins LW, Lyeth BG (1992) Neurotransmitter-mediated mechanisms of traumatic
brain injury: Acetylcholine and excitatory amino acids. J Neurotrauma (United States) 9 Suppl
1:S173-87.
Hayes RL, Stonnington HH, Lyeth BG, Dixon CE, Yamamoto T (1986) Metabolic and
neurophysiologic sequelae of brain injury: A cholinergic hypothesis. Cent Nerv Syst Trauma
(United States) 3:163-173.
He AW, Yang T, Chen SQ, Li ZP, Li HP, Huang WJ, Cheng JY, Zhang J, Yang P, Wang WT
(2011) Effects of hemin on neuroglobin expression after cardiopulmonary resuscitation in rats.
World J Emerg Med (China) 2:54-58.
Hebb DO (1950) Organization of behavior. new york: Wiley, 6:307-307.
Heo JH, Lucero J, Abumiya T, Koziol JA, Copeland BR, del Zoppo GJ (1999) Matrix
metalloproteinases increase very early during experimental focal cerebral ischemia. 624-633.
Hernandez-Ontiveros DG, Tajiri N, Acosta S, Giunta B, Tan J, Borlongan CV (2013) Microglia
activation as a biomarker for traumatic brain injury. Front Neurol (Switzerland) 4:30.
Herrmann JE, Imura T, Song B, Qi J, Ao Y, Nguyen TK, Korsak RA, Takeda K, Akira S,
Sofroniew MV (2008) STAT3 is a critical regulator of astrogliosis and scar formation after
spinal cord injury. J Neurosci (United States) 28:7231-7243.
Hicks R, Soares H, Smith D, McIntosh T (1996) Temporal and spatial characterization of
neuronal injury following lateral fluid-percussion brain injury in the rat. 91:236-246.
Hill-Kapturczak N, Voakes C, Garcia J, Visner G, Nick HS, Agarwal A (2003) A cis-acting
region regulates oxidized lipid-mediated induction of the human heme oxygenase-1 gene in
endothelial cells. Arterioscler Thromb Vasc Biol (United States) 23:1416-1422.
Hofman FM (1989) Tumor necrosis factor identified in multiple sclerosis brain. 170:607-612.
Holmin S, Mathiesen T (1999) Long-term intracerebral inflammatory response after
experimental focal brain injury in rat. Neuroreport (England) 10:1889-1891.
Hsu JY, McKeon R, Goussev S, Werb Z, Lee JU, Trivedi A, Noble-Haeusslein LJ (2006) Matrix
metalloproteinase-2 facilitates wound healing events that promote functional recovery after
spinal cord injury. J Neurosci (United States) 26:9841-9850.

366
Hsu JY, Bourguignon LY, Adams CM, Peyrollier K, Zhang H, Fandel T, Cun CL, Werb Z,
Noble-Haeusslein LJ (2008) Matrix metalloproteinase-9 facilitates glial scar formation in the
injured spinal cord. J Neurosci (United States) 28:13467-13477.
Hu C, Eggler AL, Mesecar AD, van Breemen RB (2011) Modification of keap1 cysteine
residues by sulforaphane. Chem Res Toxicol (United States) 24:515-521.
Huang C, Sakry D, Menzel L, Dangel L, Sebastiani A, Kramer T, Karram K, Engelhard K,
Trotter J, Schafer MK (2016) Lack of NG2 exacerbates neurological outcome and modulates
glial responses after traumatic brain injury. Glia (United States) 64:507-523.
Huang FP, Xi G, Keep RF, Hua Y, Nemoianu A, Hoff JT (2002) Brain edema after experimental
intracerebral hemorrhage: Role of hemoglobin degradation products. J Neurosurg (United States)
96:287-293.
Hughes EG, Elmariah SB, Balice-Gordon RJ (2010) Astrocyte secreted proteins selectively
increase hippocampal GABAergic axon length, branching, and synaptogenesis. Molecular and
Cellular Neuroscience 43:136-145.
Hulsebosch CE, DeWitt DS, Jenkins LW, Prough DS (1998) Traumatic brain injury in rats
results in increased expression of gap-43 that correlates with behavioral recovery. 255:83-86.
Hyder AA, Wunderlich CA, Puvanachandra P, Gururaj G, Kobusingye OC (2007) The impact of
traumatic brain injuries: A global perspective. NeuroRehabilitation (Netherlands) 22:341-353.
Hynes RO (1992) Integrins: Versatility, modulation, and signaling in cell adhesion. 69:11-25.
Ingraham CA, Park GC, Makarenkova HP, Crossin KL (2011) Matrix metalloproteinase (MMP)-
9 induced by wnt signaling increases the proliferation and migration of embryonic neural stem
cells at low O2 levels. 286:17649-17657.
Ishikawa K, Sato M, Yoshida T (1991) Expression of rat heme oxygenase in escherichia coli as a
catalytically active, full-length form that binds to bacterial membranes. Eur J Biochem
(GERMANY) 202:161-165.
Jaillard A, Martin CD, Garambois K, Lebas JF, Hommel M (2005) Vicarious function within the
human primary motor cortex? A longitudinal fMRI stroke study. Brain (England) 128:1122-
1138.
Janigro D, West GA, Nguyen TS, Winn HR (1994) Regulation of blood-brain barrier endothelial
cells by nitric oxide. 75:528-538.
Jiang W, Desjardins P, Butterworth RF (2009) Minocycline attenuates oxidative/nitrosative
stress and cerebral complications of acute liver failure in rats. Neurochem Int (England) 55:601-
605.

367
Jin M, Kim JH, Jang E, Lee YM, Soo Han H, Woo DK, Park DH, Kook H, Suk K (2014)
Lipocalin-2 deficiency attenuates neuroinflammation and brain injury after transient middle
cerebral artery occlusion in mice. J Cereb Blood Flow Metab (United States) 34:1306-1314.
John GR, Lee SC, Brosnan CF (2003) Cytokines: Powerful regulators of glial cell activation.
9:10-22.
Jones LS (1996) Integrins: Possible functions in the adult CNS. 19:68-72.
Juliet PAR, Mao X, Del Bigio MR (2008) Proinflammatory cytokine production by cultured
neonatal rat microglia after exposure to blood products. 1210:230-239.
Kandel E, Schwartz J, Jessell T, Siegelbaum S, Hudspeth A (2013) Principles of neural science.
(USA) .
Katayama Y, Becker DP, Tamura T, Ikezaki K (1990) Early cellular swelling in experimental
traumatic brain injury: A phenomenon mediated by excitatory amino acids. 271-273.
Katayama Y, Cheung MK, Alves A, Becker DP (1989) Ion fluxes and cell swelling in
experimental traumatic brain injury: The role of excitatory amino acids. 584-588.
Kawashima A, Oda Y, Yachie A, Koizumi S, Nakanishi I (2002) Heme oxygenase-1 deficiency:
The first autopsy case. Hum Pathol (United States) 33:125-130.
Kazanis I, ffrench-Constant C (2011) Extracellular matrix and the neural stem cell niche. Dev
Neurobiol (United States) 71:1006-1017.
Kelley BJ, Farkas O, Lifshitz J, Povlishock JT (2006) Traumatic axonal injury in the perisomatic
domain triggers ultrarapid secondary axotomy and wallerian degeneration. Exp Neurol 198:350-
360.
Kelley BJ, Lifshitz J, Povlishock JT (2007) Neuroinflammatory responses after experimental
diffuse traumatic brain injury. 66:989-1001.
Kenney K, Amyot F, Haber M, Pronger A, Bogoslovsky T, Moore C, Diaz-Arrastia R (2016)
Cerebral vascular injury in traumatic brain injury. Exp Neurol 275:353-366.
Kenney K, Amyot F, Haber M, Pronger A, Bogoslovsky T, Moore C, Diaz-Arrastia R (2015)
Cerebral vascular injury in traumatic brain injury. Exp Neurol .
Kernie SG, Erwin TM, Parada LF (2001) Brain remodeling due to neuronal and astrocytic
proliferation after controlled cortical injury in mice. 66:317-326.
Kettenmann H, Kirchhoff F, Verkhratsky A (2013) Microglia: New roles for the synaptic
stripper. Neuron 77:10-18.

368
Keyse SM, Applegate LA, Tromvoukis Y, Tyrrell RM (1990) Oxidant stress leads to
transcriptional activation of the human heme oxygenase gene in cultured skin fibroblasts. Mol
Cell Biol (UNITED STATES) 10:4967-4969.
Keyvani K, Schallert T (2002) Plasticity-associated molecular and structural events in the injured
brain. J Neuropathol Exp Neurol (England) 61:831-840.
Khan M, Sakakima H, Dhammu TS, Shunmugavel A, Im Y, Gilg AG, Singh AK, Singh I (2011)
S-nitrosoglutathione reduces oxidative injury and promotes mechanisms of neurorepair
following traumatic brain injury in rats. 8:78.
Kiemer AK, Bildner N, Weber NC, Vollmar AM (2003) Characterization of heme oxygenase 1
(heat shock protein 32) induction by atrial natriuretic peptide in human endothelial cells.
Endocrinology (United States) 144:802-812.
Kietzmann T, Samoylenko A, Immenschuh S (2003) Transcriptional regulation of heme
oxygenase-1 gene expression by MAP kinases of the JNK and p38 pathways in primary cultures
of rat hepatocytes. J Biol Chem (United States) 278:17927-17936.
Kikuchi G, Yoshida T (1983) Function and induction of the microsomal heme oxygenase. Mol
Cell Biochem (NETHERLANDS) 53-54:163-183.
Kim HJ, Fillmore HL, Reeves TM, Phillips LL (2005) Elevation of hippocampal MMP-3
expression and activity during trauma-induced synaptogenesis. Exp Neurol (United States)
192:60-72.
Kim HP, Wang X, Galbiati F, Ryter SW, Choi AM (2004) Caveolae compartmentalization of
heme oxygenase-1 in endothelial cells. FASEB J (United States) 18:1080-1089.
Kjeldsen L, Johnsen AH, Sengelov H, Borregaard N (1993) Isolation and primary structure of
NGAL, a novel protein associated with human neutrophil gelatinase. J Biol Chem (United
States) 268:10425-10432.
Klein T, Bischoff R (2010) Physiology and pathophysiology of matrix metalloproteases. 41:271-
290.
Kline AE, Massucci JL, Ma X, Zafonte RD, Dixon CE (2004) Bromocriptine reduces lipid
peroxidation and enhances spatial learning and hippocampal neuron survival in a rodent model
of focal brain trauma. J Neurotrauma (United States) 21:1712-1722.
Knoblach SM, Faden AI (1998) Interleukin-10 improves outcome and alters proinflammatory
cytokine expression after experimental traumatic brain injury. 153:143-151.
Kobari M, Fukuuchi Y, Tomita M, Tanahashi N, Konno S, Takeda H (1994) Dilatation of
cerebral microvessels mediated by endothelin ETB receptor and nitric oxide in cats. 176:157-
160.

369
Kotapka MJ, Graham DI, Adams JH, Gennarelli TA (1992) Hippocampal pathology in fatal non-
missile human head injury. 83:530-534.
Kremlev SG, Palmer C (2005) Interleukin-10 inhibits endotoxin-induced pro-inflammatory
cytokines in microglial cell cultures. 162:71-80.
Kronke G, Bochkov VN, Huber J, Gruber F, Bluml S, Furnkranz A, Kadl A, Binder BR,
Leitinger N (2003) Oxidized phospholipids induce expression of human heme oxygenase-1
involving activation of cAMP-responsive element-binding protein. J Biol Chem (United States)
278:51006-51014.
Kumar A, Loane DJ (2012) Neuroinflammation after traumatic brain injury: Opportunities for
therapeutic intervention. Brain Behav Immun (Netherlands) 26:1191-1201.
Kuo P, Scofield BA, Brown DA, Yen J (2016) Amelioration of cerebral ischemic stroke by
induction of Nrf2/HO-1 pathway.
Kutty RK, Maines MD (1982) Oxidation of heme c derivatives by purified heme oxygenase.
evidence for the presence of one molecular species of heme oxygenase in the rat liver. J Biol
Chem (United States) 257:9944-9952.
Kyrkanides S, O'Banion MK, Whiteley PE, Daeschner JC, Olschowka JA (2001) Enhanced glial
activation and expression of specific CNS inflammation-related molecules in aged versus young
rats following cortical stab injury. J Neuroimmunol (Netherlands) 119:269-277.
Lad L, Schuller DJ, Shimizu H, Friedman J, Li H, Ortiz de Montellano PR, Poulos TL (2003)
Comparison of the heme-free and -bound crystal structures of human heme oxygenase-1. J Biol
Chem (United States) 278:7834-7843.
Langlois JA, Rutland-Brown W, Wald MM (2006) The epidemiology and impact of traumatic
brain injury. 21:375-378.
Lau A, Tian W, Whitman SA, Zhang DD (2013) The predicted molecular weight of Nrf2: It is
what it is not. Antioxid Redox Signal (United States) 18:91-93.
Lautier D, Luscher P, Tyrrell RM (1992) Endogenous glutathione levels modulate both
constitutive and UVA radiation/hydrogen peroxide inducible expression of the human heme
oxygenase gene. Carcinogenesis (UNITED STATES) 13:227-232.
Lazarini F, Gabellec MM, Torquet N, Lledo PM (2012) Early activation of microglia triggers
long-lasting impairment of adult neurogenesis in the olfactory bulb. J Neurosci (United States)
32:3652-3664.
Lee S, Kim J, Seo SG, Choi BR, Han JS, Lee KW, Kim J (2014) Sulforaphane alleviates
scopolamine-induced memory impairment in mice. Pharmacol Res (Netherlands) 85:23-32.

370
Lekic T, Rolland W, Hartman R, Kamper J, Suzuki H, Tang J, Zhang JH (2011) Characterization
of the brain injury, neurobehavioral profiles, and histopathology in a rat model of cerebellar
hemorrhage. Exp Neurol (United States) 227:96-103.
Levin HS, Diaz-Arrastia RR (2015) Diagnosis, prognosis, and clinical management of mild
traumatic brain injury. The Lancet Neurology 14:506-517.
Levin BE, Pan S, Dunn-Meynell A (1994) Chronic alterations in rat brain alpha-adrenoceptors
following traumatic brain injury. Restor Neurol Neurosci (Netherlands) 7:5-12.
Levin HS (1995) Prediction of recovery from traumatic brain injury. J Neurotrauma (United
States) 12:913-922.
Levonen AL, Landar A, Ramachandran A, Ceaser EK, Dickinson DA, Zanoni G, Morrow JD,
Darley-Usmar VM (2004) Cellular mechanisms of redox cell signalling: Role of cysteine
modification in controlling antioxidant defences in response to electrophilic lipid oxidation
products. Biochem J (England) 378:373-382.
Levy AD, Omar MH, Koleske AJ (2014) Extracellular matrix control of dendritic spine and
synapse structure and plasticity in adulthood. Front Neuroanat (Switzerland) 8:116.
Li Volti G, Ientile R, Abraham NG, Vanella A, Cannavo G, Mazza F, Curro M, Raciti G, Avola
R, Campisi A (2004) Immunocytochemical localization and expression of heme oxygenase-1 in
primary astroglial cell cultures during differentiation: Effect of glutamate. Biochem Biophys Res
Commun (United States) 315:517-524.
Li N, Zhao WG, Xu FL, Zhang WF, Gu WT (2013) Neutrophil gelatinase-associated lipocalin as
an early marker of acute kidney injury in patients with traumatic brain injury. J Nephrol (Italy)
26:1083-1088.
Li QQ, Qiao GQ, Ma J, Fan HW, Li YB (2015) Cortical neurogenesis in adult rats after ischemic
brain injury: Most new neurons fail to mature. Neural Regen Res (India) 10:277-285.
Li RB, Guo XC, Liang HX, Wang FY, Zhu BL (2009) Study on changes of MMP-3 expression
after brain contusion in rats. Leg Med (Tokyo) (Ireland) 11 Suppl 1:S176-9.
Lim GP, Chu T, Yang F, Beech W, Frautschy SA, Cole GM (2001) The curry spice curcumin
reduces oxidative damage and amyloid pathology in an alzheimer transgenic mouse. J Neurosci
(United States) 21:8370-8377.
Lin B, Ginsberg MD, Zhao W, Alonso OF, Belayev L, Busto R (2001) Quantitative analysis of
microvascular alterations in traumatic brain injury by endothelial barrier antigen
immunohistochemistry. J Neurotrauma (United States) 18:389-397.
Lin JH, Villalon P, Martasek P, Abraham NG (1990) Regulation of heme oxygenase gene
expression by cobalt in rat liver and kidney. Eur J Biochem (GERMANY) 192:577-582.

371
Lin K-, Sloniowski S, Ethell DW, Ethell IM (2008) Ephrin-B2-induced cleavage of EphB2
receptor is mediated by matrix metalloproteinases to trigger cell repulsion. 283:28969-28979.
Lin TN, He YY, Wu G, Khan M, Hsu CY (1993) Effect of brain edema on infarct volume in a
focal cerebral ischemia model in rats. 24:117-121.
Lin WS, Lin TC, Hung Y, Lin WY, Lin CS, Lin CL, Cheng SM, Kao CH (2017) Traumatic
intracranial haemorrhage is in association with an increased risk of subsequent atrial fibrillation.
Heart (England) .
Lin Y, Vreman HJ, Wong RJ, Tjoa T, Yamauchi T, Noble-Haeusslein LJ (2007a) Heme
oxygenase-1 stabilizes the blood-spinal cord barrier and limits oxidative stress and white matter
damage in the acutely injured murine spinal cord. J Cereb Blood Flow Metab (United States)
27:1010-1021.
Lin Y, Vreman HJ, Wong RJ, Tjoa T, Yamauchi T, Noble-Haeusslein LJ (2007b) Heme
oxygenase-1 stabilizes the blood-spinal cord barrier and limits oxidative stress and white matter
damage in the acutely injured murine spinal cord. J Cereb Blood Flow Metab (United States)
27:1010-1021.
Linden IB, Tokola O, Karlsson M, Tenhunen R (1987) Fate of haem after parenteral
administration of haem arginate to rabbits. J Pharm Pharmacol (England) 39:96-102.
Liu C (1958) Intraspinal sprouting of dorsal root axons. 79:46.
Liu HS, Shen H, Harvey BK, Castillo P, Lu H, Yang Y, Wang Y (2011) Post-treatment with
amphetamine enhances reinnervation of the ipsilateral side cortex in stroke rats. Neuroimage
(United States) 56:280-289.
Liu J, Xia S, Hanks R, Wiseman N, Peng C, Zhou S, Haacke EM, Kou Z (2016) Susceptibility
weighted imaging and mapping of micro-hemorrhages and major deep veins after traumatic brain
injury. J Neurotrauma (United States) 33:10-21.
Liu J, Xia S, Hanks RA, Wiseman NM, Peng C, Zhou S, Haacke EM, Kou Z (2015)
Susceptibility weighted imaging and mapping of micro-hemorrhages and major deep veins after
traumatic brain injury. J Neurotrauma .
Liu JD, Tsai SH, Lin SY, Ho YS, Hung LF, Pan S, Ho FM, Lin CM, Liang YC (2004) Thiol
antioxidant and thiol-reducing agents attenuate 15-deoxy-delta 12,14-prostaglandin J2-induced
heme oxygenase-1 expression. Life Sci (England) 74:2451-2463.
Lo EH, Broderick JP, Moskowitz MA (2004) tPA and proteolysis in the neurovascular unit.
Stroke (United States) 35:354-356.
Lo EH, Wang X, Cuzner ML (2002) Extracellular proteolysis in brain injury and inflammation:
Role for plasminogen activators and matrix metalloproteinases. 69:1-9.

372
Loddick SA, Rothwell NJ (1996) Neuroprotective effects of human recombinant interleukin-1
receptor antagonist in focal cerebral ischaemia in the rat. 932-940.
Loesche J, Steward O (1977) Behavioral correlates of denervation and reinnervation of the
hippocampal formation of the rat: Recovery of alternation performance following unilateral
entorhinal cortex lesions. 2:31-39.
Lovell M, Franzen M, Silver JM, Yudofsky S, Hales RE (1994) Neuropsychiatry of traumatic
brain injury. American Psychiatric Press 133-160.
Lozano D, Gonzales-Portillo GS, Acosta S, de la Pena I, Tajiri N, Kaneko Y, Borlongan CV
(2015) Neuroinflammatory responses to traumatic brain injury: Etiology, clinical consequences,
and therapeutic opportunities. Neuropsychiatr Dis Treat (New Zealand) 11:97-106.
Lu J, Moochhala S, Kaur C, Ling E (2001) Cellular inflammatory response associated with
breakdown of the blood-brain barrier after closed head injury in rats. 18:399-408.
Lu X, Chen-Roetling J, Regan RF (2014) Systemic hemin therapy attenuates blood-brain barrier
disruption after intracerebral hemorrhage. Neurobiol Dis (United States) 70:245-251.
Lucas S, Rothwell NJ, Gibson RM (2006) The role of inflammation in CNS injury and disease.
147:S232-S240.
Lund RD, Lund JS (1971) Synaptic adjustment after deafferentation of the superior colliculus of
the rat. 171:804-807.
Luo J (2005) The role of matrix metalloproteinases in the morphogenesis of the cerebellar
cortex. Cerebellum (United States) 4:239-245.
Lyeth BG, Dixon CE, Hamm RJ, Jenkins LW, Young HF, Stonnington HH, Hayes RL (1988)
Effects of anticholinergic treatment on transient behavioral suppression and physiological
responses following concussive brain injury to the rat. 448:88-97.
Lynch G, Gall C, Rose G, Cotman C (1976) Changes in the distribution of the dentate gyrus
associational system following unilateral or bilateral entorhinal lesions in the adult rat. 110:57-
71.
Madathil SK, Carlson SW, Brelsfoard JM, Ye P, D’Ercole AJ, Saatman KE (2013)
Astrocyte-specific overexpression of insulin-like growth factor-1 protects hippocampal neurons
and reduces behavioral deficits following traumatic brain injury in mice. 8:e67204.
Magavi SS, Leavitt BR, Macklis JD (2000) Induction of neurogenesis in the neocortex of adult
mice. Nature (England) 405:951-955.
Maines MD (1992) Heme oxygenase: Clinical applications and functions.. Boca Raton, FL:
CRC.

373
Maines MD (1988) Heme oxygenase: Function, multiplicity, regulatory mechanisms, and
clinical applications. FASEB J (United States) 2:2557-2568.
Maines MD, Trakshel GM (1993) Purification and characterization of human biliverdin
reductase. Arch Biochem Biophys (UNITED STATES) 300:320-326.
Maines MD, Trakshel GM, Kutty RK (1986) Characterization of two constitutive forms of rat
liver microsomal heme oxygenase. only one molecular species of the enzyme is inducible. J Biol
Chem (UNITED STATES) 261:411-419.
Maines MD, Ewing JF, Huang TJ, Panahian N (2001) Nuclear localization of biliverdin
reductase in the rat kidney: Response to nephrotoxins that induce heme oxygenase-1. J
Pharmacol Exp Ther (United States) 296:1091-1097.
Malec JF, Brown AW, Leibson CL, Flaada JT, Mandrekar JN, Diehl NN, Perkins PK (2007) The
mayo classification system for traumatic brain injury severity. J Neurotrauma (United States)
24:1417-1424.
Mao L, Wang HD, Wang XL, Qiao L, Yin HX (2010) Sulforaphane attenuates matrix
metalloproteinase-9 expression following spinal cord injury in mice. Ann Clin Lab Sci (United
States) 40:354-360.
Mark KS, Davis TP (2002) Cerebral microvascular changes in permeability and tight junctions
induced by hypoxia-reoxygenation. Am J Physiol Heart Circ Physiol (United States) 282:H1485-
94.
Marmarou A, Foda MA, van den Brink W, Campbell J, Kita H, Demetriadou K (1994) A new
model of diffuse brain injury in rats. part I: Pathophysiology and biomechanics. J Neurosurg
(United States) 80:291-300.
Massucci JL, Kline AE, Ma X, Zafonte RD, Dixon CE (2004) Time dependent alterations in
dopamine tissue levels and metabolism after experimental traumatic brain injury in rats.
Neurosci Lett 372:127-131.
Mautes AE, Bergeron M, Sharp FR, Panter SS, Weinzierl M, Guenther K, Noble LJ (2000)
Sustained induction of heme oxygenase-1 in the traumatized spinal cord. Exp Neurol (UNITED
STATES) 166:254-265.
Maxwell WL, Povlishock JT, Graham DL (1997) A mechanistic analysis of nondisruptive axonal
injury: A review. J Neurotrauma (United States) 14:419-440.
McCoubrey WK,Jr, Maines MD (1994) The structure, organization and differential expression of
the gene encoding rat heme oxygenase-2. Gene (NETHERLANDS) 139:155-161.
McIntosh TK (1994) Neurochemical sequelae of traumatic brain injury: Therapeutic
implications. Cerebrovasc Brain Metab Rev (United States) 6:109-162.

374
McKee AC, Cantu RC, Nowinski CJ, Hedley-Whyte ET, Gavett BE, Budson AE, Santini VE,
Lee H, Kubilus CA, Stern RA (2009) Chronic traumatic encephalopathy in athletes. 68:709-735.
Meaney DF, Smith DH, Shreiber DI, Bain AC, Miller RT, Ross DT, Gennarelli TA (1995)
Biomechanical analysis of experimental diffuse axonal injury. 12:689-694.
Mehta NU, Reddy ST (2015) Role of hemoglobin/heme scavenger protein hemopexin in
atherosclerosis and inflammatory diseases. Curr Opin Lipidol (England) 26:384-387.
Meighan SE, Meighan PC, Choudhury P, Davis CJ, Olson ML, Zornes PA, Wright JW, Harding
JW (2006) Effects of extracellular matrix-degrading proteases matrix metalloproteinases 3 and 9
on spatial learning and synaptic plasticity. 96:1227-1241.
Menet V, Prieto M, Privat A, Gimenez y Ribotta M (2003) Axonal plasticity and functional
recovery after spinal cord injury in mice deficient in both glial fibrillary acidic protein and
vimentin genes. Proc Natl Acad Sci U S A (United States) 100:8999-9004.
Michaluk P, Kaczmarek L (2007) Matrix metalloproteinase-9 in glutamate-dependent adult brain
function and dysfunction. 14:1255-1258.
Michaluk P, Mikasova L, Groc L, Frischknecht R, Choquet D, Kaczmarek L (2009) Matrix
metalloproteinase-9 controls NMDA receptor surface diffusion through integrin  1 signaling.
29:6007-6012.
Milner R, Campbell IL (2002) The integrin family of cell adhesion molecules has multiple
functions within the CNS. 69:286-291.
Mitani K, Fujita H, Kappas A, Sassa S (1992) Heme oxygenase is a positive acute-phase reactant
in human Hep3B hepatoma cells. Blood (UNITED STATES) 79:1255-1259.
Mitani K, Fujita H, Fukuda Y, Kappas A, Sassa S (1993) The role of inorganic metals and
metalloporphyrins in the induction of haem oxygenase and heat-shock protein 70 in human
hepatoma cells. Biochem J (ENGLAND) 290 ( Pt 3):819-825.
Miyazaki S, Katayama Y, Lyeth BG, Jenkins LW, DeWitt DS, Goldberg SJ, Newlon PG, Hayes
RL (1992) Enduring suppression of hippocampal long-term potentiation following traumatic
brain injury in rat. Brain Res (Netherlands) 585:335-339.
Molgaard CA, Stanford EP, Morton DJ, Ryden LA, Schubert KR, Golbeck AL (1990)
Epidemiology of head trauma and neurocognitive impairment in a multi-ethnic population.
9:233-242.
Moller JC, Klein MA, Haas S, Jones LL, Kreutzberg GW, Raivich G (1996) Regulation of
thrombospondin in the regenerating mouse facial motor nucleus. Glia (United States) 17:121-
132.

375
Montaner J, Alvarez-Sabin J, Molina C, Angles A, Abilleira S, Arenillas J, Gonzalez MA,
Monasterio J (2001) Matrix metalloproteinase expression after human cardioembolic stroke:
Temporal profile and relation to neurological impairment. Stroke (United States) 32:1759-1766.
Morganti-Kossmann MC, Rancan M, Stahel PF, Kossmann T (2002) Inflammatory response in
acute traumatic brain injury: A double-edged sword. Curr Opin Crit Care (United States) 8:101-
105.
Morganti-Kossmann MC, Satgunaseelan L, Bye N, Kossmann T (2007) Modulation of immune
response by head injury. 38:1392-1400.
Morganti-Kossmann MC, Rancan M, Otto VI, Stahel PF, Kossmann T (2001) ROLE OF
CEREBRAL INFLAMMATION AFTER TRAUMATIC BRAIN INJURY: A REVISITED
CONCEPT. 16:165-177.
Morris R (1984) Developments of a water-maze procedure for studying spatial learning in the
rat. J Neurosci Methods (Netherlands) 11:47-60.
Morris T, Gomes Osman J, Tormos Munoz JM, Costa Miserachs D, Pascual Leone A (2016) The
role of physical exercise in cognitive recovery after traumatic brain injury: A systematic review.
Restor Neurol Neurosci (Netherlands) 34:977-988.
Morroni F, Tarozzi A, Sita G, Bolondi C, Zolezzi Moraga JM, Cantelli-Forti G, Hrelia P (2013)
Neuroprotective effect of sulforaphane in 6-hydroxydopamine-lesioned mouse model of
parkinson's disease. Neurotoxicology (Netherlands) 36:63-71.
Mortimer JA, French LR, Hutton JT, Schuman LM (1985) Head injury as a risk factor for
alzheimer's disease. 35:264-264.
Motterlini R, Foresti R, Bassi R, Green CJ (2000) Curcumin, an antioxidant and anti-
inflammatory agent, induces heme oxygenase-1 and protects endothelial cells against oxidative
stress. Free Radic Biol Med (UNITED STATES) 28:1303-1312.
Mucha M, Skrzypiec AE, Schiavon E, Attwood BK, Kucerova E, Pawlak R (2011) Lipocalin-2
controls neuronal excitability and anxiety by regulating dendritic spine formation and
maturation. Proc Natl Acad Sci U S A (United States) 108:18436-18441.
Muir EM, Adcock KH, Morgenstern DA, Clayton R, von Stillfried N, Rhodes K, Ellis C,
Fawcett JW, Rogers JH (2002) Matrix metalloproteases and their inhibitors are produced by
overlapping populations of activated astrocytes. 100:103-117.
Muir KW (2006) Glutamate-based therapeutic approaches: Clinical trials with NMDA
antagonists. Curr Opin Pharmacol (England) 6:53-60.
Myer DJ, Gurkoff GG, Lee SM, Hovda DA, Sofroniew MV (2006) Essential protective roles of
reactive astrocytes in traumatic brain injury. Brain (England) 129:2761-2772.

376
Nadel L, O'Keefe J, Black A (1975) Slam on the brakes: A critique of altman, brunner, and
bayer's response-inhibition model of hippocampal function. Behav Biol (United States) 14:151-
162.
Nadler JV, Cotman CW (1978) Interactions between afferents to the dentate gyrus after
entorhinal lesion during development: Long-term regulation of choline acetyl-transferase
activity. Brain Res (Netherlands) 142:174-181.
NAGASE H, VISSE R, MURPHY G (2006) Structure and function of matrix metalloproteinases
and TIMPs. 69:562-573.
Nagy V (2006) Matrix metalloproteinase-9 is required for hippocampal late-phase long-term
potentiation and memory. 26:1923-1934.
Nairz M, Theurl I, Ludwiczek S, Theurl M, Mair SM, Fritsche G, Weiss G (2007) The co-
ordinated regulation of iron homeostasis in murine macrophages limits the availability of iron for
intracellular salmonella typhimurium. Cell Microbiol (England) 9:2126-2140.
Naughton P, Foresti R, Bains SK, Hoque M, Green CJ, Motterlini R (2002) Induction of heme
oxygenase 1 by nitrosative stress. A role for nitroxyl anion. J Biol Chem (United States)
277:40666-40674.
Newcomb JK, Pike BR, Zhao X, Banik NL, Hayes RL (1999a) Altered calpastatin protein levels
following traumatic brain injury in rat. J Neurotrauma 16:1-11.
Newcomb JK, Zhao X, Pike BR, Hayes RL (1999b) Temporal profile of apoptotic-like changes
in neurons and astrocytes following controlled cortical impact injury in the rat. 158:76-88.
Ni W, Mao S, Xi G, Keep RF, Hua Y (2016) Role of erythrocyte CD47 in intracerebral
hematoma clearance. Stroke (United States) 47:505-511.
Nicotera P, Leist M, Manzo L (1999a) Neuronal cell death: A demise with different shapes.
Trends Pharmacol Sci 20:46-51.
Nicotera P, Leist M, Ferrando-May E (1999b) Apoptosis and necrosis: Different execution of the
same death. 66:69-73.
Numazawa S, Yamada H, Furusho A, Nakahara T, Oguro T, Yoshida T (1997) Cooperative
induction of c-fos and heme oxygenase gene products under oxidative stress in human
fibroblastic cells. Exp Cell Res (UNITED STATES) 237:434-444.
O'Dell DM, Gibson CJ, Wilson MS, DeFord SM, Hamm RJ (2000) Positive and negative
modulation of the GABA(A) receptor and outcome after traumatic brain injury in rats. Brain Res
(Netherlands) 861:325-332.

377
Oguro T, Hayashi M, Nakajo S, Numazawa S, Yoshida T (1998) The expression of heme
oxygenase-1 gene responded to oxidative stress produced by phorone, a glutathione depletor, in
the rat liver; the relevance to activation of c-jun n-terminal kinase. J Pharmacol Exp Ther
(UNITED STATES) 287:773-778.
Oh LY, Larsen PH, Krekoski CA, Edwards DR, Donovan F, Werb Z, Yong VW (1999) Matrix
metalloproteinase-9/gelatinase B is required for process outgrowth by oligodendrocytes. J
Neurosci (United States) 19:8464-8475.
O'Keefe J, Conway DH (1978) Hippocampal place units in the freely moving rat: Why they fire
where they fire. Exp Brain Res (Germany) 31:573-590.
Oldenborg PA, Zheleznyak A, Fang YF, Lagenaur CF, Gresham HD, Lindberg FP (2000) Role
of CD47 as a marker of self on red blood cells. Science (United States) 288:2051-2054.
Olsen AS, Sozda CN, Cheng JP, Hoffman AN, Kline AE (2012) Traumatic brain injury-induced
cognitive and histological deficits are attenuated by delayed and chronic treatment with the 5-
HT1A-receptor agonist buspirone. J Neurotrauma (United States) 29:1898-1907.
O'Shaughnessy MC, Brunstrom GM, Fielding J (1966) Iron chelation in haematomas at fracture
sites. J Clin Pathol (England) 19:364-367.
Palmer AM, Marion DW, Botscheller ML, Swedlow PE, Styren SD, DeKosky ST (1993)
Traumatic brain injury-induced excitotoxicity assessed in a controlled cortical impact model. J
Neurochem (England) 61:2015-2024.
Pappolla MA, Chyan YJ, Omar RA, Hsiao K, Perry G, Smith MA, Bozner P (1998) Evidence of
oxidative stress and in vivo neurotoxicity of beta-amyloid in a transgenic mouse model of
alzheimer's disease: A chronic oxidative paradigm for testing antioxidant therapies in vivo. Am J
Pathol (UNITED STATES) 152:871-877.
Park JH, Park SW, Kang SH, Nam TK, Min BK, Hwang SN (2009a) Detection of traumatic
cerebral microbleeds by susceptibility-weighted image of MRI. J Korean Neurosurg Soc (Korea
(South)) 46:365-369.
Park K-, Rosell A, Foerch C, Xing C, Kim WJ, Lee S, Opdenakker G, Furie KL, Lo EH (2009b)
Plasma and brain matrix metalloproteinase-9 after acute focal cerebral ischemia in rats. 40:2836-
2842.
Pellman EJ, Viano DC, National Football League's Committee on Mild Traumatic Brain Injury
(2006) Concussion in professional football: Summary of the research conducted by the national
football league's committee on mild traumatic brain injury. Neurosurg Focus (United States)
21:E12.

378
Penkowa M, Giralt M, Carrasco J, Hadberg H, Hidalgo J (2000) Impaired inflammatory response
and increased oxidative stress and neurodegeneration after brain injury in interleukin-6-deficient
mice. 32:271-285.
Peres CM, Caldas JG, Puglia P,Jr, de Andrade AF, da Silva IA, Teixeira MJ, Figueiredo EG
(2017) Endovascular management of acute epidural hematomas: Clinical experience with 80
cases. J Neurosurg (United States) 1-7.
Perris R (1997) The extracellular matrix in neural crest-cell migration. Trends Neurosci
(England) 20:23-31.
Perris R, Perissinotto D (2000) Role of the extracellular matrix during neural crest cell migration.
Mech Dev (Ireland) 95:3-21.
Petraglia AL, Dashnaw ML, Turner RC, Bailes JE (2014) Models of mild traumatic brain injury:
Translation of physiological and anatomic injury. Neurosurgery (United States) 75 Suppl 4:S34-
49.
Pettus EH, Christman CW, Giebel ML, Povlishock JT (1994) Traumatically induced altered
membrane permeability: Its relationship to traumatically induced reactive axonal change. J
Neurotrauma (United States) 11:507-522.
Phillips L, Lyeth B, Hamm R, Reeves T, Povlishock J (1998) Glutamate antagonism during
secondary deafferentation enhances cognition and axo-dendritic integrity after traumatic brain
injury. Hippocampus 8:390-401.
Phillips LL, Reeves TM (2001) Interactive pathology following traumatic brain injury modifies
hippocampal plasticity. Restor Neurol Neurosci (Netherlands) 19:213-235.
Phillips LL, Chan JL, Doperalski AE, Reeves TM (2014) Time dependent integration of matrix
metalloproteinases and their targeted substrates directs axonal sprouting and synaptogenesis
following central nervous system injury. Neural Regen Res (India) 9:362-376.
Phillips S, Woessner D (2015) Sports-related traumatic brain injury. Prim Care (United States)
42:243-248.
Pimstone NR, Tenhunen R, Seitz PT, Marver HS, Schmid R (1971a) The enzymatic degradation
of hemoglobin to bile pigments by macrophages. J Exp Med (UNITED STATES) 133:1264-
1281.
Pimstone NR, Engel P, Tenhunen R, Seitz PT, Marver HS, Schmid R (1971b) Inducible heme
oxygenase in the kidney: A model for the homeostatic control of hemoglobin catabolism. J Clin
Invest (UNITED STATES) 50:2042-2050.
Pittman RN, Buettner HM (1989) Degradation of extracellular matrix by neuronal proteases.
11:361-375.

379
Planas AM, Solé S, Justicia C (2001) Expression and activation of matrix metalloproteinase-2
and -9 in rat brain after transient focal cerebral ischemia. 8:834-846.
Platt JL, Nath KA (1998) Heme oxygenase: Protective gene or trojan horse. Nat Med (United
States) 4:1364-1365.
Ponomarev ED, Maresz K, Tan Y, Dittel BN (2007) CNS-derived interleukin-4 is essential for
the regulation of autoimmune inflammation and induces a state of alternative activation in
microglial cells. J Neurosci (United States) 27:10714-10721.
Portera-Cailliau C, Price DL, Martin LJ (1997) Excitotoxic neuronal death in the immature brain
is an apoptosis-necrosis morphological continuum. 378:10-87.
Poss KD, Tonegawa S (1997a) Reduced stress defense in heme oxygenase 1-deficient cells. Proc
Natl Acad Sci U S A (United States) 94:10925-10930.
Poss KD, Tonegawa S (1997b) Heme oxygenase 1 is required for mammalian iron reutilization.
Proc Natl Acad Sci U S A (UNITED STATES) 94:10919-10924.
Povlishock JT, Pettus E (1996) Traumatically induced axonal damage: Evidence for enduring
changes in axolemmal permeability with associated cytoskeletal change. In: Mechanisms of
secondary brain damage in cerebral ischemia and trauma Traumatically induced axonal damage:
Evidence for enduring changes in axolemmal permeability with associated cytoskeletal change.
pp81-86.Springer.
Povlishock JT (1992) Traumatically induced axonal injury: Pathogenesis and pathobiological
implications. Brain Pathol (Switzerland) 2:1-12.
Povlishock JT, Kontos HA (1985) Continuing axonal and vascular change following
experimental brain trauma. Cent Nerv Syst Trauma (United States) 2:285-298.
Povlishock JT, Becker DP (1985) Fate of reactive axonal swellings induced by head injury. Lab
Invest (United States) 52:540-552.
Povlishock JT, Erb DE, Astruc J (1992) Axonal response to traumatic brain injury: Reactive
axonal change, deafferentation, and neuroplasticity. J Neurotrauma (United States) 9 Suppl
1:S189-200.
Povlishock JT, Becker DP, Cheng CLY, Vaughan GW (1983) Axonal change in minor head
injury. 42:225-242.
Povlishock JT, Katz DI (2005) Update of neuropathology and neurological recovery after
traumatic brain injury. 20:76-94.
Povlishock JT, Christman CW (1995) The pathobiology of traumatically induced axonal injury
in animals and humans: A review of current thoughts. 12:555-564.

380
Pravalie R (2014) Nuclear weapons tests and environmental consequences: A global perspective.
Ambio (Sweden) 43:729-744.
Raghavendra Rao VL, Dhodda VK, Song G, Bowen KK, Dempsey RJ (2003) Traumatic brain
injury-induced acute gene expression changes in rat cerebral cortex identified by GeneChip
analysis. J Neurosci Res (United States) 71:208-219.
Raghupathi R, Conti AC, Graham DI, Krajewski S, Reed JC, Grady MS, Trojanowski JQ,
McIntosh TK (2002) Mild traumatic brain injury induces apoptotic cell death in the cortex that is
preceded by decreases in cellular bcl-2 immunoreactivity. 110:605-616.
Raisman G (1969) Neuronal plasticity in the septal nuclei of the adult rat. 14:25-48.
Ramlackhansingh AF, Brooks DJ, Greenwood RJ, Bose SK, Turkheimer FE, Kinnunen KM,
Gentleman S, Heckemann RA, Gunanayagam K, Gelosa G, Sharp DJ (2011) Inflammation after
trauma: Microglial activation and traumatic brain injury. 70:374-383.
Ransohoff RM, Brown MA (2012) Innate immunity in the central nervous system. J Clin Invest
(United States) 122:1164-1171.
Rathore KI, Berard JL, Redensek A, Chierzi S, Lopez-Vales R, Santos M, Akira S, David S
(2011) Lipocalin 2 plays an immunomodulatory role and has detrimental effects after spinal cord
injury. J Neurosci (United States) 31:13412-13419.
Ratledge C (2007) Iron metabolism and infection. Food Nutr Bull (United States) 28:S515-23.
Reeves TM, Lyeth BG, Povlishock JT (1995) Long-term potentiation deficits and excitability
changes following traumatic brain injury. Exp Brain Res (Germany) 106:248-256.
Regan RF, Panter SS (1996) Hemoglobin potentiates excitotoxic injury in cortical cell culture. J
Neurotrauma (UNITED STATES) 13:223-231.
Reiss K, Maretzky T, Ludwig A, Tousseyn T, de Strooper B, Hartmann D, Saftig P (2005)
ADAM10 cleavage of N-cadherin and regulation of cell-cell adhesion and beta-catenin nuclear
signalling. EMBO J (England) 24:742-752.
Relton JK, Rothwell NJ (1992) Interleukin-1 receptor antagonist inhibits ischaemic and
excitotoxic neuronal damage in the rat. 29:243-246.
Richmon JD, Fukuda K, Maida N, Sato M, Bergeron M, Sharp FR, Panter SS, Noble LJ (1998)
Induction of heme oxygenase-1 after hyperosmotic opening of the blood-brain barrier. Brain Res
(NETHERLANDS) 780:108-118.
Rizzardini M, Carelli M, Cabello Porras MR, Cantoni L (1994) Mechanisms of endotoxin-
induced haem oxygenase mRNA accumulation in mouse liver: Synergism by glutathione
depletion and protection by N-acetylcysteine. Biochem J (ENGLAND) 304 ( Pt 2):477-483.

381
Rizzardini M, Terao M, Falciani F, Cantoni L (1993) Cytokine induction of haem oxygenase
mRNA in mouse liver. interleukin 1 transcriptionally activates the haem oxygenase gene.
Biochem J (ENGLAND) 290 ( Pt 2):343-347.
Romanic AM, Madri JA (1994) Extracellular matrix-degrading proteinases in the nervous
system. 4:145-156.
Rose P, Huang Q, Ong CN, Whiteman M (2005) Broccoli and watercress suppress matrix
metalloproteinase-9 activity and invasiveness of human MDA-MB-231 breast cancer cells.
Toxicol Appl Pharmacol (United States) 209:105-113.
Rosell A, Lo E (2008) Multiphasic roles for matrix metalloproteinases after stroke. 8:82-89.
Rosenberg GA (1995) Matrix metalloproteinases in brain injury. 12:833-842.
Rosenberg GA (2009) Matrix metalloproteinases and their multiple roles in neurodegenerative
diseases. Lancet Neurol (England) 8:205-216.
Rosenberg GA, Navratil M (1997) Metalloproteinase inhibition blocks edema in intracerebral
hemorrhage in the rat. Neurology (United States) 48:921-926.
Rosenberg GA, Estrada EY, Dencoff JE, Hsu CY (1998) Matrix metalloproteinases and TIMPs
are associated with blood-brain barrier opening after reperfusion in rat brain  editorial
comment. 29:2189-2195.
Rosenberg GA, Cunningham LA, Wallace J, Alexander S, Estrada EY, Grossetete M, Razhagi
A, Miller K, Gearing A (2001) Immunohistochemistry of matrix metalloproteinases in
reperfusion injury to rat brain: Activation of MMP-9 linked to stromelysin-1 and microglia in
cell cultures. 893:104-112.
Ross D, Graham D, Adams JH (1993) Selective loss of neurons from the thalamic reticular
nucleus following severe human head injury. J Neurotrauma 10:151-165.
Rothman SM, Olney JW (1987) Excitotoxity and the NMDA receptor. 10:299-302.
Rothwell N (2000) Interleukin 1 in the brain: Biology, pathology and therapeutic target. 23:618-
625.
Rothwell NJ, Luheshi GN (2000) Interleukin 1 in the brain: Biology, pathology and therapeutic
target. Trends Neurosci (England) 23:618-625.
Rothwell NJ (1999) Cytokines - killers in the brain? 514:3-17.
Ruoslahti E (1996) Brain extracellular matrix. 6:489-492.

382
Rutland-Brown W, Langlois JA, Thomas KE, Xi YL (2006) Incidence of traumatic brain injury
in the united states, 2003. 21:544-548.
Ryter S, Kvam E, Richman L, Hartmann F, Tyrrell RM (1998) A chromatographic assay for
heme oxygenase activity in cultured human cells: Application to artificial heme oxygenase
overexpression. Free Radic Biol Med (UNITED STATES) 24:959-971.
Ryter SW, Tyrrell RM (2000) The heme synthesis and degradation pathways: Role in oxidant
sensitivity. heme oxygenase has both pro- and antioxidant properties. Free Radic Biol Med
(United States) 28:289-309.
Ryter SW, Alam J, Choi AM (2006) Heme oxygenase-1/carbon monoxide: From basic science to
therapeutic applications. Physiol Rev (United States) 86:583-650.
Ryter SW, Kvam E, Tyrrell RM (2000) Heme oxygenase activity. current methods and
applications. Methods Mol Biol (UNITED STATES) 99:369-391.
Safciuc F, Constantin A, Manea A, Nicolae M, Popov D, Raicu M, Alexandru D, Constantinescu
E (2007) Advanced glycation end products, oxidative stress and metalloproteinases are altered in
the cerebral microvasculature during aging. Curr Neurovasc Res (Netherlands) 4:228-234.
Sardana MK, Sassa S, Kappas A (1982) Metal ion-mediated regulation of heme oxygenase
induction in cultured avian liver cells. J Biol Chem (UNITED STATES) 257:4806-4811.
Sato M, Noble LJ (1998) Involvement of the endothelin receptor subtype A in neuronal
pathogenesis after traumatic brain injury. Brain Res (NETHERLANDS) 809:39-49.
Saulle M, Greenwald BD (2012) Chronic traumatic encephalopathy: A review. 2012:1-9.
Saunders N, Habgood M, Dziegielewska K (1999) BARRIER MECHANISMS IN THE BRAIN,
I. ADULT BRAIN. 26:11-19.
Saygili E, Schauerte P, Pekassa M, Saygili E, Rackauskas G, Schwinger RHG, Weis J, Weber C,
Marx N, Rana OR (2010) Sympathetic neurons express and secrete MMP-2 and MT1-MMP to
control nerve sprouting via pro-NGF conversion. 31:17-25.
Sbai O, Ferhat L, Bernard A, Gueye Y, Ould-Yahoui A, Thiolloy S, Charrat E, Charton G,
Tremblay E, Risso J, Chauvin J, Arsanto J, Rivera S, Khrestchatisky M (2008) Vesicular
trafficking and secretion of matrix metalloproteinases-2, -9 and tissue inhibitor of
metalloproteinases-1 in neuronal cells. 39:549-568.
Scapagnini G, Foresti R, Calabrese V, Giuffrida Stella AM, Green CJ, Motterlini R (2002)
Caffeic acid phenethyl ester and curcumin: A novel class of heme oxygenase-1 inducers. Mol
Pharmacol (United States) 61:554-561.

383
Schallner N, Pandit R, LeBlanc R,3rd, Thomas AJ, Ogilvy CS, Zuckerbraun BS, Gallo D,
Otterbein LE, Hanafy KA (2015) Microglia regulate blood clearance in subarachnoid
hemorrhage by heme oxygenase-1. J Clin Invest (United States) 125:2609-2625.
Scheff S, Benardo I, Cotman C (1977) Progressive brain damage accelerates axon sprouting in
the adult rat. 197:795-797.
Scheff SW, Price DA, Hicks RR, Baldwin SA, Robinson S, Brackney C (2005) Synaptogenesis
in the hippocampal CA1 field following traumatic brain injury. 22:719-732.
Scherbel U, Raghupathi R, Nakamura M, Saatman KE, Trojanowski JQ, Neugebauer E, Marino
MW, McIntosh TK (1999) Differential acute and chronic responses of tumor necrosis factor-
deficient mice to experimental brain injury. 96:8721-8726.
Schipper HM, Cisse S, Stopa EG (1995) Expression of heme oxygenase-1 in the senescent and
alzheimer-diseased brain. Ann Neurol (UNITED STATES) 37:758-768.
Schipper HM, Chertkow H, Mehindate K, Frankel D, Melmed C, Bergman H (2000) Evaluation
of heme oxygenase-1 as a systemic biological marker of sporadic AD. Neurology (UNITED
STATES) 54:1297-1304.
Schmidt RH, Grady MS (1993) Regional patterns of Blood–Brain barrier breakdown following
central and lateral fluid percussion injury in rodents. 10:415-430.
Schousboe A, Waagepetersen HS (2005) Role of astrocytes in glutamate homeostasis:
Implications for excitotoxicity. Neurotox Res (United States) 8:221-225.
Schousboe A, Scafidi S, Bak LK, Waagepetersen HS, McKenna MC (2014) Glutamate
metabolism in the brain focusing on astrocytes. Adv Neurobiol (United States) 11:13-30.
Schuller DJ, Wilks A, Ortiz de Montellano PR, Poulos TL (1999) Crystal structure of human
heme oxygenase-1. Nat Struct Biol (UNITED STATES) 6:860-867.
Schwarzmaier SM, Kim SW, Trabold R, Plesnila N (2010) Temporal profile of thrombogenesis
in the cerebral microcirculation after traumatic brain injury in mice. J Neurotrauma (United
States) 27:121-130.
Shi WZ, Ju JY, Xiao HJ, Xue F, Wu J, Pan MM, Ni WF (2017) Dynamics of MMP9, MMP2 and
TIMP1 in a rat model of brain injury combined with traumatic heterotopic ossification. Mol Med
Rep (Greece) 15:2129-2135.
Shibahara S (2003) The heme oxygenase dilemma in cellular homeostasis: New insights for the
feedback regulation of heme catabolism. Tohoku J Exp Med (Japan) 200:167-186.
Shibahara S, Muller RM, Taguchi H (1987) Transcriptional control of rat heme oxygenase by
heat shock. J Biol Chem (UNITED STATES) 262:12889-12892.

384
Shibahara S, Sato M, Muller RM, Yoshida T (1989) Structural organization of the human heme
oxygenase gene and the function of its promoter. Eur J Biochem (GERMANY, WEST) 179:557-
563.
Shibahara S, Muller R, Taguchi H, Yoshida T (1985) Cloning and expression of cDNA for rat
heme oxygenase. Proc Natl Acad Sci U S A (UNITED STATES) 82:7865-7869.
Shibahara S, Yoshizawa M, Suzuki H, Takeda K, Meguro K, Endo K (1993) Functional analysis
of cDNAs for two types of human heme oxygenase and evidence for their separate regulation. J
Biochem (JAPAN) 113:214-218.
Shin EJ, Kim E, Lee JA, Rhim H, Hwang O (2012) Matrix metalloproteinase-3 is activated by
HtrA2/omi in dopaminergic cells: Relevance to parkinson’s disease. 60:249-256.
Shohami E (1999) Dual role of tumor necrosis factor alpha in brain injury. 10:119-130.
Shohami E, Gallily R, Mechoulam R, Bass R, Ben-Hur T (1997) Cytokine production in the
brain following closed head injury: Dexanabinol (HU-211) is a novel TNF-α inhibitor and an
effective neuroprotectant. 72:169-177.
Shohami E, Novikov M, Bass R, Yamin A, Gallily R (1994) Closed head injury triggers early
production of TNFα and IL-6 by brain tissue. 14:615-619.
Shubayev VI, Myers RR (2004) Matrix metalloproteinase-9 promotes nerve growth factor-
induced neurite elongation but not new sprout formation in vitro. 77:229-239.
Silver JM (2012) Effort, exaggeration and malingering after concussion. J Neurol Neurosurg
Psychiatry (England) 83:836-841.
Silver J, Miller JH (2004) Regeneration beyond the glial scar. 5:146-156.
Silver JM, McAllister TW, Yudofsky SC (2011) Textbook of traumatic brain injury.
Washington, DC: American Psychiatric Pub.
Singhal A, Baker AJ, Hare GMT, Reinders FX, Schlichter LC, Moulton RJ (2002) Association
between cerebrospinal fluid interleukin-6 concentrations and outcome after severe human
traumatic brain injury. 19:929-937.
Siow RC, Mann GE (2010) Dietary isoflavones and vascular protection: Activation of cellular
antioxidant defenses by SERMs or hormesis? Mol Aspects Med (England) 31:468-477.
Sivanandam TM, Thakur MK (2012) Traumatic brain injury: A risk factor for alzheimer's
disease. 36:1376-1381.

385
Skrzypiec AE, Shah RS, Schiavon E, Baker E, Skene N, Pawlak R, Mucha M (2013) Stress-
induced lipocalin-2 controls dendritic spine formation and neuronal activity in the amygdala.
PLoS One (United States) 8:e61046.
Smith DH, Meaney DF (2000) Axonal damage in traumatic brain injury. 6:483-495.
Smith DH, Hicks R, Povlishock JT (2013) Therapy development for diffuse axonal injury.
30:307-323.
Smith DH, Chen X, Xu B, McIntosh TK, Gennarelli TA, Meaney DF (1997) Characterization of
diffuse axonal pathology and selective hippocampal damage following inertial brain trauma in
the pig. 56:822-834.
Soane L, Li Dai W, Fiskum G, Bambrick LL (2010) Sulforaphane protects immature
hippocampal neurons against death caused by exposure to hemin or to oxygen and glucose
deprivation. J Neurosci Res (United States) 88:1355-1363.
Spangelo BL, Judd AM, MacLeod RM, Goodman DW, Isakson PC (1990) Endotoxin-induced
release of interleukin-6 from rat medial basal hypothalami*. 127:1779-1785.
Speller CF, Spalding KL, Buchholz BA, Hildebrand D, Moore J, Mathewes R, Skinner MF,
Yang DY (2012) Personal identification of cold case remains through combined contribution
from anthropological, mtDNA, and bomb-pulse dating analyses. J Forensic Sci (United States)
57:1354-1360.
Stahel PF, Kossmann T, Joller H, Trentz O, Morganti-Kossmann MC (1998) Increased
interleukin-12 levels in human cerebrospinal fluid following severe head trauma. Neurosci Lett
(Ireland) 249:123-126.
Stamenkovic I (2003) Extracellular matrix remodelling: The role of matrix metalloproteinases.
200:448-464.
Sternlicht MD, Werb Z (2001) How matrix metalloproteinases regulate cell behavior. Annu Rev
Cell Dev Biol (United States) 17:463-516.
Steward O (1992) Signals that induce sprouting in the central nervous system: Sprouting is
delayed in a strain of mouse exhibiting delayed axonal degeneration. Exp Neurol (United States)
118:340-351.
Steward O (1976) Reinnervation of dentate gyrus by homologous afferents following entorhinal
cortical lesions in adult rats. Science (United States) 194:426-428.
Steward O, Banker GA, Davis L, Phillips LL (1988) The process of reinnervation of CNS
neurons: Evidence for local synthesis of synaptic constituents at postsynaptic sites. 469-480.

386
Steward O (1989) Reorganization of neuronal connections following CNS trauma: Principles and
experimental paradigms. 6:99-152.
Steward O, Vinsant SL (1983) The process of reinnervation in the dentate gyrus of the adult rat:
A quantitative electron microscopic analysis of terminal proliferation and reactive
synaptogenesis. 214:370-386.
Stone JR, Okonkwo DO, Dialo AO, Rubin DG, Mutlu LK, Povlishock JT, Helm GA (2004)
Impaired axonal transport and altered axolemmal permeability occur in distinct populations of
damaged axons following traumatic brain injury. 190:59-69.
Strassmann G (1949) Formation of hemosiderin and hematoidin after traumatic and spontaneous
cerebral hemorrhages. Arch Pathol (Chic) (United States) 47:205-210.
Strich S (1961) SHEARING OF NERVE FIBRES AS A CAUSE OF BRAIN DAMAGE DUE
TO HEAD INJURY A pathological study of twenty cases. 278:443-448.
Stroemer RP, Kent TA, Hulsebosch CE (1995) Neocortical neural sprouting, synaptogenesis, and
behavioral recovery after neocortical infarction in rats. Stroke (United States) 26:2135-2144.
Sullivan HG, Martinez J, Becker DP, Miller JD, Griffith R, Wist AO (1976) Fluid-percussion
model of mechanical brain injury in the cat. J Neurosurg (United States) 45:521-534.
Sullivan PG, Bruce-Keller AJ, Rabchevsky AG, Christakos S, Clair DK, Mattson MP, Scheff
SW (1999) Exacerbation of damage and altered NF-kappaB activation in mice lacking tumor
necrosis factor receptors after traumatic brain injury. J Neurosci (United States) 19:6248-6256.
Sun D, McGinn MJ, Zhou Z, Harvey HB, Bullock MR, Colello RJ (2007) Anatomical
integration of newly generated dentate granule neurons following traumatic brain injury in adult
rats and its association to cognitive recovery. 204:264-272.
Sun D, Colello RJ, Daugherty WP, Kwon TH, McGinn MJ, Harvey HB, Bullock MR (2005)
Cell proliferation and neuronal differentiation in the dentate gyrus in juvenile and adult rats
following traumatic brain injury. 22:95-105.
Susan L. Hillier MHS (1997) Outcomes 5 years post traumatic brain injury (with further
reference to neurophysical impairment and disability). 11:661-675.
Sutton RL, Lescaudron L, Stein DG (1993) Unilateral cortical contusion injury in the rat:
Vascular disruption and temporal development of cortical necrosis. 10:135-149.
Szklarczyk A, Lapinska J, Rylski M, McKay RD, Kaczmarek L (2002a) Matrix
metalloproteinase-9 undergoes expression and activation during dendritic remodeling in adult
hippocampus. J Neurosci (United States) 22:920-930.

387
Szklarczyk A, Lapinska J, Rylski M, McKay RD, Kaczmarek L (2002b) Matrix
metalloproteinase-9 undergoes expression and activation during dendritic remodeling in adult
hippocampus. J Neurosci (United States) 22:920-930.
Takizawa S, Hirabayashi H, Matsushima K, Tokuoka K, Shinohara Y (1998) Induction of heme
oxygenase protein protects neurons in cortex and striatum, but not in hippocampus, against
transient forebrain ischemia. J Cereb Blood Flow Metab (UNITED STATES) 18:559-569.
Tanaka N, Ikeda Y, Ohta Y, Deguchi K, Tian F, Shang J, Matsuura T, Abe K (2011) Expression
of Keap1-Nrf2 system and antioxidative proteins in mouse brain after transient middle cerebral
artery occlusion. Brain Res (Netherlands) 1370:246-253.
Tanigawa S, Fujii M, Hou DX (2007) Action of Nrf2 and Keap1 in ARE-mediated NQO1
expression by quercetin. Free Radic Biol Med (United States) 42:1690-1703.
Teasell R, Bayona NA, Bitensky J (2005) Plasticity and reorganization of the brain post stroke.
Top Stroke Rehabil (England) 12:11-26.
Tehranian R, Andell-Jonsson S, Beni SM, Yatsiv I, Shohami E, Bartfai T, Lundkvist J, Iverfeldt
K (2002) Improved recovery and delayed cytokine induction after closed head injury in mice
with central overexpression of the secreted isoform of the interleukin-1 receptor antagonist.
19:939-951.
Tenhunen R, Marver HS, Schmid R (1970) The enzymatic catabolism of hemoglobin:
Stimulation of microsomal heme oxygenase by hemin. J Lab Clin Med (UNITED STATES)
75:410-421.
Tenhunen R, Marver HS, Schmid R (1969) Microsomal heme oxygenase. characterization of the
enzyme. J Biol Chem (UNITED STATES) 244:6388-6394.
Terry CM, Clikeman JA, Hoidal JR, Callahan KS (1999) TNF-alpha and IL-1alpha induce heme
oxygenase-1 via protein kinase C, Ca2+, and phospholipase A2 in endothelial cells. Am J
Physiol (UNITED STATES) 276:H1493-501.
Thau-Zuchman O, Shohami E, Alexandrovich AG, Leker RR (2010) Vascular endothelial
growth factor increases neurogenesis after traumatic brain injury. 30:1008-1016.
Tian L, Stefanidakis M, Ning L, Van Lint P, Nyman-Huttunen H, Libert C, Itohara S, Mishina
M, Rauvala H, Gahmberg CG (2007) Activation of NMDA receptors promotes dendritic spine
development through MMP-mediated ICAM-5 cleavage. 178:687-700.
Trakshel GM, Ewing JF, Maines MD (1991) Heterogeneity of haem oxygenase 1 and 2
isoenzymes. rat and primate transcripts for isoenzyme 2 differ in number and size. Biochem J
(ENGLAND) 275 ( Pt 1):159-164.

388
Trakshel GM, Kutty RK, Maines MD (1986) Purification and characterization of the major
constitutive form of testicular heme oxygenase. the noninducible isoform. J Biol Chem
(UNITED STATES) 261:11131-11137.
Truettner JS, Alonso OF, Dietrich WD (2005) Influence of therapeutic hypothermia on matrix
metalloproteinase activity after traumatic brain injury in rats. J Cereb Blood Flow Metab (United
States) 25:1505-1516.
Tulis DA, Durante W, Peyton KJ, Evans AJ, Schafer AI (2001) Heme oxygenase-1 attenuates
vascular remodeling following balloon injury in rat carotid arteries. Atherosclerosis (Ireland)
155:113-122.
Turner CP, Bergeron M, Matz P, Zegna A, Noble LJ, Panter SS, Sharp FR (1998) Heme
oxygenase-1 is induced in glia throughout brain by subarachnoid hemoglobin. J Cereb Blood
Flow Metab (UNITED STATES) 18:257-273.
Ullian EM (2001) Control of synapse number by glia. 291:657-661.
Vaillant C (2003) MMP-9 deficiency affects axonal outgrowth, migration, and apoptosis in the
developing cerebellum. 24:395-408.
Van den Steen PE, Dubois B, Nelissen I, Rudd PM, Dwek RA, Opdenakker G (2002)
Biochemistry and molecular biology of gelatinase B or matrix metalloproteinase-9 (MMP-9).
37:375-536.
Van Hove I, Lemmens K, Van de Velde S, Verslegers M, Moons L (2012) Matrix
metalloproteinase-3 in the central nervous system: A look on the bright side. 123:203-216.
Van Wart HE, Birkedal-Hansen H (1990) The cysteine switch: A principle of regulation of
metalloproteinase activity with potential applicability to the entire matrix metalloproteinase gene
family. 87:5578-5582.
Vanderbeken I, Kerckhofs E (2017) A systematic review of the effect of physical exercise on
cognition in stroke and traumatic brain injury patients. NeuroRehabilitation (Netherlands) 40:33-
48.
Vascak M, Jin X, Jacobs KM, Povlishock JT (2017) Mild traumatic brain injury induces
structural and functional disconnection of local neocortical inhibitory networks via parvalbumin
interneuron diffuse axonal injury. Cereb Cortex (United States) 1-20.
Venstrom KA, Reichardt LF (1993) Extracellular matrix. 2: Role of extracellular matrix
molecules and their receptors in the nervous system. FASEB J (United States) 7:996-1003.
Verma A, Hirsch DJ, Glatt CE, Ronnett GV, Snyder SH (1993) Carbon monoxide: A putative
neural messenger. Science (United States) 259:381-384.

389
Verslegers M, Lemmens K, Van Hove I, Moons L (2013) Matrix metalloproteinase-2 and -9 as
promising benefactors in development, plasticity and repair of the nervous system. 105:60-78.
Vincent SR, Das S, Maines MD (1994) Brain heme oxygenase isoenzymes and nitric oxide
synthase are co-localized in select neurons. Neuroscience (United States) 63:223-231.
Virgintino D, Girolamo F, Errede M, Capobianco C, Robertson D, Stallcup WB, Perris R,
Roncali L (2007) An intimate interplay between precocious, migrating pericytes and endothelial
cells governs human fetal brain angiogenesis. 10:35-45.
Wagner AK, Kline AE, Ren D, Willard LA, Wenger MK, Zafonte RD, Dixon CE (2007) Gender
associations with chronic methylphenidate treatment and behavioral performance following
experimental traumatic brain injury. Behav Brain Res (Netherlands) 181:200-209.
Wagner AK, Sokoloski JE, Ren D, Chen X, Khan AS, Zafonte RD, Michael AC, Dixon CE
(2005) Controlled cortical impact injury affects dopaminergic transmission in the rat striatum. J
Neurochem (England) 95:457-465.
Wakabayashi N, Dinkova-Kostova AT, Holtzclaw WD, Kang MI, Kobayashi A, Yamamoto M,
Kensler TW, Talalay P (2004) Protection against electrophile and oxidant stress by induction of
the phase 2 response: Fate of cysteines of the Keap1 sensor modified by inducers. Proc Natl
Acad Sci U S A (United States) 101:2040-2045.
Wang G, Fang H, Zhen Y, Xu G, Tian J, Zhang Y, Zhang D, Zhang G, Xu J, Zhang Z, Qiu M,
Ma Y, Zhang H, Zhang X (2016) Sulforaphane prevents neuronal apoptosis and memory
impairment in diabetic rats. Cell Physiol Biochem (Switzerland) 39:901-907.
Wang KKW (2000) Calpain and caspase: Can you tell the difference? 23:20-26.
Wang W, Wu Y, Zhang G, Fang H, Wang H, Zang H, Xie T, Wang W (2014) Activation of
Nrf2-ARE signal pathway protects the brain from damage induced by epileptic seizure. Brain
Res (Netherlands) 1544:54-61.
Warden DL, Gordon B, McAllister TW, Silver JM, Barth JT, Bruns J, Drake A, Gentry T,
Jagoda A, Katz DI (2006) Guidelines for the pharmacologic treatment of neurobehavioral
sequelae of traumatic brain injury. J Neurotrauma 23:1468-1501.
Warren KM, Reeves TM, Phillips LL (2012) MT5-MMP, ADAM-10, and N-cadherin act in
concert to facilitate synapse reorganization after traumatic brain injury. 29:1922-1940.
Weber J, Maas A (2007) Neurotrauma: New insights into pathology and treatment, volume
161. (NY, USA) .
Wee Yong V (2010) Inflammation in neurological disorders: A help or a hindrance? 16:408-420.

390
Wee Yong V, Forsyth PA, Bell R, Krekoski CA, Edwards DR (1998) Matrix metalloproteinases
and diseases of the CNS. 21:75-80.
Wei EP, Hamm RJ, Baranova AI, Povlishock JT (2009) The long-term microvascular and
behavioral consequences of experimental traumatic brain injury after hypothermic intervention. J
Neurotrauma (United States) 26:527-537.
Weightman MM, Bolgla R, McCulloch KL, Peterson MD (2010) Physical therapy
recommendations for service members with mild traumatic brain injury. 25:206-218.
Wells GMA, Catlin G, Cossins JA, Mangan M, Ward GA, Miller KM, Clements JM (1996)
Quantitation of matrix metalloproteinases in cultured rat astrocytes using the polymerase chain
reaction with a multi-competitor cDNA standard. 18:332-340.
Werner C, Engelhard K (2007) Pathophysiology of traumatic brain injury. 99:4-9.
Whishaw IQ, Pellis SM, Gorny BP, Pellis VC (1991) The impairments in reaching and the
movements of compensation in rats with motor cortex lesions: An endpoint, videorecording, and
movement notation analysis. Behav Brain Res (Netherlands) 42:77-91.
Whitman MC, Greer CA (2009) Adult neurogenesis and the olfactory system. Prog Neurobiol
(England) 89:162-175.
Wilhelmsson U, Li L, Pekna M, Berthold CH, Blom S, Eliasson C, Renner O, Bushong E,
Ellisman M, Morgan TE, Pekny M (2004) Absence of glial fibrillary acidic protein and vimentin
prevents hypertrophy of astrocytic processes and improves post-traumatic regeneration. J
Neurosci (United States) 24:5016-5021.
Wintermark M et al (2013) Acute stroke imaging research roadmap II. Stroke (United States)
44:2628-2639.
Wlodarczyk J, Mukhina I, Kaczmarek L, Dityatev A (2011) Extracellular matrix molecules, their
receptors, and secreted proteases in synaptic plasticity. 71:1040-1053.
Wolf JA, Stys PK, Lusardi T, Meaney D, Smith DH (2001) Traumatic axonal injury induces
calcium influx modulated by tetrodotoxin-sensitive sodium channels. J Neurosci (United States)
21:1923-1930.
Wu J, Hua Y, Keep RF, Nakamura T, Hoff JT, Xi G (2003) Iron and iron-handling proteins in
the brain after intracerebral hemorrhage. Stroke (United States) 34:2964-2969.
Wu L, Du Y, Lok J, Lo EH, Xing C (2015) Lipocalin-2 enhances angiogenesis in rat brain
endothelial cells via reactive oxygen species and iron-dependent mechanisms. J Neurochem
(England) 132:622-628.

391
Xi G, Keep RF, Hoff JT (1998) Erythrocytes and delayed brain edema formation following
intracerebral hemorrhage in rats. J Neurosurg (UNITED STATES) 89:991-996.
Xing C, Wang X, Cheng C, Montaner J, Mandeville E, Leung W, van Leyen K, Lok J, Wang X,
Lo EH (2014) Neuronal production of lipocalin-2 as a help-me signal for glial activation. Stroke
(United States) 45:2085-2092.
Yachie A, Niida Y, Wada T, Igarashi N, Kaneda H, Toma T, Ohta K, Kasahara Y, Koizumi S
(1999) Oxidative stress causes enhanced endothelial cell injury in human heme oxygenase-1
deficiency. J Clin Invest (United States) 103:129-135.
Yamanaka M, Yamabe K, Saitoh Y, Katoh-Semba R, Semba R (1996) Immunocytochemical
localization of heme oxygenase-2 in the rat cerebellum. Neurosci Res (Ireland) 24:403-407.
Yamauchi T, Lin Y, Sharp FR, Noble-Haeusslein LJ (2004) Hemin induces heme oxygenase-1 in
spinal cord vasculature and attenuates barrier disruption and neutrophil infiltration in the injured
murine spinal cord. J Neurotrauma (United States) 21:1017-1030.
Yan L, Borregaard N, Kjeldsen L, Moses MA (2001) The high molecular weight urinary matrix
metalloproteinase (MMP) activity is a complex of gelatinase B/MMP-9 and neutrophil
gelatinase-associated lipocalin (NGAL): MODULATION OF MMP-9 ACTIVITY BY NGAL.
276:37258-37265.
Yang J, McNeish B, Butterfield C, Moses MA (2013) Lipocalin 2 is a novel regulator of
angiogenesis in human breast cancer. FASEB J (United States) 27:45-50.
Yang Y, Hill JW, Rosenberg GA (2011) Multiple roles of metalloproteinases in neurological
disorders. Prog Mol Biol Transl Sci (Netherlands) 99:241-263.
Yokobori S, Mazzeo AT, Hosein K, Gajavelli S, Dietrich WD, Bullock MR (2013)
Preconditioning for traumatic brain injury. Transl Stroke Res (United States) 4:25-39.
Yokoyama A, Sakamoto A, Kameda K, Imai Y, Tanaka J (2006) NG2 proteoglycan-expressing
microglia as multipotent neural progenitors in normal and pathologic brains. 53:754-768.
Yong VW (2005) Metalloproteinases: Mediators of pathology and regeneration in the CNS.
6:931-944.
Yong VW, Power C, Forsyth P, Edwards DR (2001) Metalloproteinases in biology and
pathology of the nervous system. 2:502-511.
Yoo MS, Chun HS, Son JJ, DeGiorgio LA, Kim DJ, Peng C, Son JH (2003) Oxidative stress
regulated genes in nigral dopaminergic neuronal cells: Correlation with the known pathology in
parkinson's disease. Brain Res Mol Brain Res (Netherlands) 110:76-84.

392
Yoshida T, Oguro T, Numazawa S, Kuroiwa Y (1987) Effects of phorone (diisopropylidene
acetone), a glutathione (GSH) depletor, on hepatic enzymes involved in drug and heme
metabolism in rats: Evidence that phorone is a potent inducer of heme oxygenase. Biochem
Biophys Res Commun (UNITED STATES) 145:502-508.
Yoshida T, Biro P, Cohen T, Muller RM, Shibahara S (1988) Human heme oxygenase cDNA
and induction of its mRNA by hemin. Eur J Biochem (GERMANY, WEST) 171:457-461.
Yoshinaga T, Sassa S, Kappas A (1982) Purification and properties of bovine spleen heme
oxygenase. amino acid composition and sites of action of inhibitors of heme oxidation. J Biol
Chem (UNITED STATES) 257:7778-7785.
Yoshino A, Hovda DA, Katayama Y, Kawamata T, Becker DP (1992) Hippocampal CA3 lesion
prevents postconcussive metabolic dysfunction in CA1. J Cereb Blood Flow Metab (United
States) 12:996-1006.
Youn JK, Kim DW, Kim ST, Park SY, Yeo EJ, Choi YJ, Lee HR, Kim DS, Cho SW, Han KH,
Park J, Eum WS, Hwang HS, Choi SY (2014) PEP-1-HO-1 prevents MPTP-induced
degeneration of dopaminergic neurons in a parkinson's disease mouse model. BMB Rep .
Yu H, Huang J, Wang S, Zhao G, Jiao X, Zhu L (2013) Overexpression of Smad7 suppressed
ROS/MMP9-dependent collagen synthesis through regulation of heme oxygenase-1. Mol Biol
Rep (Netherlands) 40:5307-5314.
Zhang H, Adwanikar H, Werb Z, Noble-Haeusslein LJ (2010) Matrix metalloproteinases and
neurotrauma: Evolving roles in injury and reparative processes. Neuroscientist (United States)
16:156-170.
Zhang H, Chang M, Hansen CN, Basso DM, Noble-Haeusslein LJ (2011) Role of matrix
metalloproteinases and therapeutic benefits of their inhibition in spinal cord injury.
Neurotherapeutics (United States) 8:206-220.
Zhang L, Rzigalinski BA, Ellis EF, Satin LS (1996) Reduction of voltage-dependent Mg2+
blockade of NMDA current in mechanically injured neurons. 274:1921-1923.
Zhang R, Miao QW, Zhu CX, Zhao Y, Liu L, Yang J, An L (2015) Sulforaphane ameliorates
neurobehavioral deficits and protects the brain from amyloid beta deposits and peroxidation in
mice with alzheimer-like lesions. Am J Alzheimers Dis Other Demen (United States) 30:183-
191.
Zhang R, Zhang J, Fang L, Li X, Zhao Y, Shi W, An L (2014) Neuroprotective effects of
sulforaphane on cholinergic neurons in mice with alzheimer's disease-like lesions. Int J Mol Sci
(Switzerland) 15:14396-14410.
Zhao J, Moore AN, Redell JB, Dash PK (2007) Enhancing expression of Nrf2-driven genes
protects the blood brain barrier after brain injury. J Neurosci (United States) 27:10240-10248.

393
Zhao J, Xi G, Wu G, Keep RF, Hua Y (2016a) Deferoxamine attenuated the upregulation of
lipocalin-2 induced by traumatic brain injury in rats. Acta Neurochir Suppl (Austria) 121:291-
294.
Zhao J, Chen H, Zhang M, Zhang Y, Qian C, Liu Y, He S, Zou Y, Liu H (2016b) Early
expression of serum neutrophil gelatinase-associated lipocalin (NGAL) is associated with
neurological severity immediately after traumatic brain injury. J Neurol Sci (Netherlands)
368:392-398.
Zhao Z, Alam S, Oppenheim RW, Prevette DM, Evenson A, Parsadanian A (2004)
Overexpression of glial cell line-derived neurotrophic factor in the CNS rescues motoneurons
from programmed cell death and promotes their long-term survival following axotomy. Exp
Neurol (United States) 190:356-372.
Zhu J, Hamm R, Reeves T, Povlishock J, Phillips L (2000) Postinjury administration of L-
deprenyl improves cognitive function and enhances neuroplasticity after traumatic brain injury.
Exp Neurol 166:136-152.
Ziebell JM, Adelson PD, Lifshitz J (2015) Microglia: Dismantling and rebuilding circuits after
acute neurological injury. Metab Brain Dis (United States) 30:393-400.
Ziebell JM, Morganti-Kossmann MC (2010) Involvement of pro- and anti-inflammatory
cytokines and chemokines in the pathophysiology of traumatic brain injury. 7:22-30.

394
6 Appendices
6.1 Description of Injury Model
In our hands the cFPI rat model produces a moderate injury with righting time ~7:00
minutes. In general animals that have righting times longer than ~9:00 minutes tend to either die
or demonstrate remarkable hemorrhage which excludes them from further testing.
We frequently see that the hemorrhage induced by the cFPI has a tendency to lateralize.
Although in many instances the hemorrhage is roughly equivalent in size on both sides of the
brain for the purposes of presentation in circumstances where the hemorrhages are of unequal
size we always represent the hemisphere with the larger hemorrhage.
We rarely observed animals with significant edema (identified by the brain swelling at the
craniectomy site) and such animals were excluded from our studies.
6.2 Commentary on Randomization, Blinding, Animal Sex Selection
Where possible animals were randomized during surgery, behavioral testing, and western
analysis and during behavioral testing were blinded to the extent possible. Unfortunately in the
context of cFPI injury and drug treatment there were several relatively obvious changes that
occurred in the animals after injury and during recovery. As an example Sham animals and drug
treated TBI animals tended to recover faster and had noticeably better grooming ability.
Male rats were used without paired female counterparts due to concerns about the injury
model with physically smaller animals and possible concerns about hormonal fluctuations in a
drug treatment model. At the age of rat used female rats are roughly 2/3 the size of the male rats
whielt he size of the craniectomy surgical tools would be unchanged and we had concerns that

395
changes to the cFPI impact overpressure to standardize for righting time may cause a reduction
in hemorrhagic injury. We believe that future work should include the addition of female animals
to establish if the injury and treatment effects observed are generalizable.
6.3 Drug Blood Brain Barrier Transport
There have been limited studies with either Hemin or Sulforaphane looking at how
exactly they each cross the blood brain barrier. The majority of researchers have opted instead
to inject the drugs peripherally and note changes that occur in the CNS as evidence of barrier
transport. In the context of Sulforaphane it is interpreted that as a small relatively soluble
molecule that barrier transport is relatively efficient and it has been observed in numerous
models that sulforaphane given peripherally is capable of inducing a CNS response (Greco and
Fiskum, 2010; Wang et al., 2014; Siow and Mann, 2010; Zhao et al., 2007; Tanaka et al., 2011;
Morroni et al., 2013; Zhang et al., 2014; Alfieri et al., 2013). Hemin in contrast is considered to
be a largely insoluble molecule which must be bound by some carrier to allow it to circulate
systemically, typically either via binding to hemopexin or an albumin protein. Similar to
sulforaphane most researchers have simply injected hemin peripherally and observed central
effects and this has been observed reliably (He et al., 2011; Tulis et al., 2001; Yamauchi et al.,
2004; Takizawa et al., 1998; Bhardwaj et al., 2016; Lu et al., 2014; Chen-Roetling et al., 2015)

396
6.4 Sham Drug Treated Animal Behavior
6.4.1 Morris Water Maze
0
10
20
30
40
50
60
70
80
90
100
Day 1 Day 2 Day 3 Day 4
Pla
tfo
rm L
aten
cy (
s)
Training Phase Latency by Day
Vehicle
Hemin
Sulforaphane
0
500
1000
1500
2000
2500
3000
3500
Prox Tot
Cumulative Proximity (m*s)
Vehicle
Hemin
Sulforaphane

397
0
0.2
0.4
0.6
0.8
1
1.2
1.4
1.6
Prox Tot Prox Ave Q4 Time Q4c Time
Probe Trial Perfomance Metrics
Vehicle
Hemin
Sulforaphane

398
6.5 Appendix Data for Chapter 3
6.5.1.1 HO-1 ANOVA Tables
Cortex
Model:
Value~Day*Condition
Df Sum of
Sq
RSS AIC F Value Pr(>F) Significance
Code
<none> 297.5 139.6
Day 3 283.79 581.29 193.89 23.5299 8.46E-11 ***
Condition 3 180.59 478.09 176.3 14.9733 1.04E-07 ***
Day:Condition 9 178.69 476.19 163.94 4.9385 3.41E-05 ***
Hippocampus
Model:
Value~Day*Condition
Df Sum of
Sq
RSS AIC F Value Pr(>F) Significance
Code
<none> 815.76 224.22
Day 3 397.84 1213.6 251.99 11.2168 4.41E-06 ***
Condition 3 386.19 1201.95 251.17 10.8885 6.09E-06 ***
Day:Condition 9 562.04 1377.8 250.78 5.2822 1.82E-05 ***
Combined Tissue
Model:
Value~Day*Condition
Df Sum of
Sq
RSS AIC F Value Pr(>F) Significance
Code
<none> 1113.3 387.8
Day 3 676.49 1789.8 464.88 28.9655 1.08E-14 ***
Condition 3 548.54 1661.8 451.9 23.487 2.03E-12 ***
Tissue 1 13.78 1127 387.95 1.77 0.1855
Day:Condition 9 662.22 1775.5 451.48 9.4515 3.26E-11 ***
Day:Tissue 3 6.73 1120 382.85 0.2881 0.8339
Condition:Tissue 3 32.59 1145.8 386.85 1.3953 0.2467
Day:Condition:Tissue 9 80.84 1194.1 382.06 1.1538 0.3293

399
6.5.1.2 HO-1 TukeyHSD Table
Cortex
$Condition
diff lwr upr p
SFN-HMN -0.22792 -1.89656 1.440714 0.98403
SHAM-HMN -2.18211 -3.78609 -0.57813 0.003401
TBI-HMN 1.296586 -0.30739 2.900562 0.154848
SHAM-SFN -1.95419 -3.51416 -0.39421 0.008126
TBI-SFN 1.524509 -0.03547 3.084484 0.057865
TBI-SHAM 3.478696 1.988089 4.969303 2E-07
Hippocampus
$Condition
diff lwr upr p
SFN-HMN -0.608749 -3.549841 2.3323434 0.947608
SHAM-HMN -2.491284 -5.289596 0.3070273 0.0981019
TBI-HMN 2.745812 -0.131258 5.6228835 0.0667616
SHAM-SFN -1.882535 -4.598283 0.8332122 0.2705424
TBI-SFN 3.3545618 0.5577293 6.1513943 0.0123381
TBI-SHAM 5.2370972 2.5908176 7.8833768 0.000011
Combined
$Condition
diff lwr upr p
SFN-HMN -0.4138939 -2.0585479 1.23076 0.9139269
SHAM-HMN -2.3374022 -3.9102757 -0.7645288 0.0009637
TBI-HMN 1.9705039 0.3764247 3.564583 0.008715
SHAM-SFN -1.9235083 -3.4516506 -0.395366 0.0072447
TBI-SFN 2.3843978 0.8344378 3.9343579 0.0005832
TBI-SHAM 4.3079061 2.8343321 5.7814802 0

400
6.5.1.3 FTL ANOVA Tables
Cortex
Model:
Value~Day*Condition
Df Sum of
Sq
RSS AIC F Value Pr(>F) Significance
Code
<none> 45.37 -45.248
Day 3 15.869 61.239 -21.554 9.6771 1.51E-05 ***
Condition 3 20.845 66.214 -13.82 12.7112 6.48E-07 ***
Day:Condition 9 19.09 64.459 -28.48 3.8803 0.0003856 ***
Hippocampus
Model:
Value~Day*Condition
Df Sum of
Sq
RSS AIC F Value Pr(>F) Significance
Code
<none> 99.626 30.617
Day 3 27.793 127.419 49.468 7.9042 0.0001035 ***
Condition 3 36.64 136.266 56.248 10.4203 6.57E-06 ***
Day:Condition 9 17.979 117.605 29.373 1.7044 0.1004482
Combined Tissue
Model:
Value~Day*Condition
Df Sum of
Sq
RSS AIC F Value Pr(>F) Significance
Code
<none> 145 -0.323
Day 3 36.649 181.65 38.748 14.1547 2.87E-08 ***
Condition 3 54.747 199.74 57.743 21.1445 1.14E-11 ***
Tissue 1 3.038 148.03 1.825 3.5204 0.0623535 .
Day:Condition 9 28.579 173.57 17.658 3.6792 0.0003153 ***
Day:Tissue 3 6.885 151.88 2.956 2.6592 0.0499465 *
Condition:Tissue 3 2.375 147.37 -3.073 0.9174 0.4338092
Day:Condition:Tissue 9 8.648 153.64 -6.736 1.1133 0.3559105

401
6.5.1.4 FTL TukeyHSD Table
Cortex
$Condition
diff lwr upr p
SFN-HMN -0.02568808 -0.64668855 0.59531238 0.9995398
SHAM-HMN -0.66979575 -1.23814073 -0.10145076 0.0142169
TBI-HMN 0.45234532 -0.11599966 1.02069031 0.1659528
SHAM-SFN -0.64410767 -1.20368588 -0.08452945 0.0174498
TBI-SFN 0.4780334 -0.08154481 1.03761162 0.1211002
TBI-SHAM 1.12214107 0.6216391 1.62264304 0.0000005
Hippocampus
$Condition
diff lwr upr p
SFN-HMN -0.58554771 -1.4944497 0.32335424 0.3361946
SHAM-HMN -1.34850479 -2.1701982 -0.52681134 0.0002607
TBI-HMN 0.05520891 -0.776626 0.88704381 0.9981158
SHAM-SFN -0.76295709 -1.5716585 0.04574434 0.0716488
TBI-SFN 0.64075661 -0.1782472 1.45976039 0.1780772
TBI-SHAM 1.4037137 0.6827112 2.12471617 0.0000119
Combined
$Condition
diff lwr upr p
SFN-HMN -0.3050221 -0.85112471 0.2410805 0.4705268
SHAM-HMN -1.0049598 -1.501622 -0.5082976 0.0000027
TBI-HMN 0.254434 -0.24536383 0.7542318 0.550874
SHAM-SFN -0.6999377 -1.18884104 -0.2110344 0.0015619
TBI-SFN 0.5594561 0.06736769 1.0515445 0.0188519
TBI-SHAM 1.2593938 0.82282047 1.6959671 0

402
6.5.1.5 LCN2 ANOVA Tables
Cortex
Model:
Value~Day*Condition
Df Sum of
Sq
RSS AIC F Value Pr(>F) Significance
Code
<none> 3208.4 297.37
Day 2 1544.29 4752.6 321.66 14.44 7.59E-06 ***
Condition 3 1755.25 4963.6 322.79 10.9417 7.90E-06 ***
Day:Condition 6 852.23 4060.6 302.33 2.6563 0.02369 *
Hippocampus
Model:
Value~Day*Condition
Df Sum of
Sq
RSS AIC F Value Pr(>F) Significance
Code
<none> 18771 424.57
Day 2 5524.8 24296 439.14 8.8298 0.0004352 ***
Condition 3 11332.7 30104 452.57 12.0746 2.76E-06 ***
Day:Condition 6 4071.9 22843 426.7 2.1692 0.0584626 .
Combined Tissue
Model:
Value~Day*Condition
Df Sum of
Sq
RSS AIC F Value Pr(>F) Significance
Code
<none> 21980 772.04
Day 2 5862.9 27842 802.09 16.0046 6.90E-07 ***
Condition 3 10856.2 32836 823.84 19.757 1.78E-10 ***
Tissue 1 4972.3 26952 799.41 27.1472 7.94E-07 ***
Day:Condition 6 3913.8 25893 783.64 3.5613 0.002785 **
Day:Tissue 2 1206.2 23186 775.73 3.2928 0.040534 *
Condition:Tissue 3 2231.7 24211 779.97 4.0614 0.008674 **
Day:Condition:Tissue 6 1010.3 22990 766.51 0.9193 0.483632

403
6.5.1.6 LCN2 TukeyHSD Table
Cortex
$Condition
diff lwr upr p
SFN-HMN -1.2548569 -8.856656 6.346942 0.9719759
SHAM-HMN -11.0792453 -17.911112 -4.247379 0.0003823
TBI-HMN -0.3646 -7.299207 6.570007 0.9990321
SHAM-SFN -9.8243883 -16.32279 -3.325987 0.0010063
TBI-SFN 0.8902569 -5.716073 7.496587 0.984374
TBI-SHAM 10.7146453 5.011081 16.418209 0.0000351
Hippocampus
$Condition
diff lwr upr p
SFN-HMN 0.437978 -17.949427 18.825384 0.9999095
SHAM-HMN -29.177887 -45.702961 -12.652812 0.0001023
TBI-HMN -6.692791 -23.466377 10.080795 0.7182618
SHAM-SFN -29.615865 -45.334346 -13.897383 0.0000333
TBI-SFN -7.130769 -23.110311 8.848772 0.6422002
TBI-SHAM 22.485095 8.689185 36.281006 0.0003554
Combined
$Condition
diff lwr upr p
SFN-HMN -0.4084395 -10.2171 9.400217 0.9995406
SHAM-HMN -20.128566 -28.94377 -11.313359 0.0000002
TBI-HMN -3.5286957 -12.47647 5.419078 0.7336988
SHAM-SFN -19.7201265 -28.10506 -11.335192 0.0000001
TBI-SFN -3.1202562 -11.64445 5.403939 0.7758367
TBI-SHAM 16.5998703 9.24052 23.95922 0.0000002

404
6.5.1.7 Zymogram Data Tables Mean ± SEM
Hippocampus
HMN Series
Day 1
Day 3
Day 7
MMP2
Sham 100.00 ± 15.98 100.00 ± 15.20 100.00 ± 2.89
TBI 152.78 ± 12.01 260.71 ± 24.05 165.06 ± 4.74
HMN 158.43 ± 7.19 230.79 ± 13.24 168.53 ± 17.45
Day 1
Day 3
Day 7
Pro-MMP9
Sham 100.00 ± 35.30 100.00 ± 30.36 100.00 ± 15.40
TBI 769.01 ± 87.03 233.58 ± 107.17 85.65 ± 16.38
HMN 763.17 ± 37.64 179.00 ± 19.25 123.55 ± 15.19
Day 1
Day 3
Day 7
Active-MMP9
Sham 100.00 ± 10.39 100.00 ± 13.56 100.00 ± 2.13
TBI 253.53 ± 33.99 180.04 ± 40.01 119.02 ± 23.40
HMN 264.74 ± 39.79 134.98 ± 21.89 103.41 ± 12.87
Hippocampus
SFN Series
Day 1
Day 3
Day 7
MMP2
Sham 100.00 ± 10.64 100.00 ± 24.19 100.00 ± 4.36
TBI 165.09 ± 5.24 239.06 ± 5.98 164.35 ± 7.64
SFN 133.56 ± 11.46 196.50 ± 12.98 162.17 ± 12.14
Day 1
Day 3
Day 7
Pro-MMP9
Sham 100.00 ± 57.95 100.00 ± 30.82 100.00 ± 5.89
TBI 605.64 ± 57.34 197.05 ± 85.63 100.96 ± 6.50
SFN 489.86 ± 120.39 124.45 ± 33.07 102.26 ± 32.98
Day 1
Day 3
Day 7
Active-MMP9
Sham 100.00±31.16 100.00±15.15 100.00±8.76
TBI 253.58±39.29 157.52±35.66 123.92±20.67
SFN 222.50±23.66 119.46±20.65 95.56±9.53

405
Neocortex
HMN Series
Day 1
Day 3
Day 7
MMP2
Sham 100.00 ± 8.44 100.00 ± 9.56 100.00 ± 9.18
TBI 141.60 ± 11.47 184.23 ± 8.99 177.03 ± 5.01
HMN 157.37 ± 7.45 175.18 ± 23.22 141.68 ± 17.46
Day 1
Day 3
Day 7
Pro-MMP9
Sham 100.00 ± 24.53 100.00 ± 26.38 100.00 ± 27.16
TBI 2064.72 ± 203.07 411.21 ± 163.14 114.16 ± 36.44
HMN 2268.62 ± 512.59 177.45 ± 96.87 106.54 ± 19.07
Day 1
Day 3
Day 7
Active-MMP9
Sham 100.00 ± 12.47 100.00 ± 3.43 100.00 ± 3.61
TBI 338.72 ± 16.06 191.78 ± 25.19 126.09 ± 9.90
HMN 280.95 ± 43.90 104.19 ± 14.99 116.47 ± 11.35
Neocortex
SFN Series
Day 1
Day 3
Day 7
MMP2
Sham 100.00 ± 5.19 100.00 ± 11.25 100.00 ± 15.67
TBI 145.96 ± 7.06 199.58 ± 3.89 181.22 ± 10.38
SFN 147.24 ± 13.90 163.39 ± 14.27 156.61 ± 13.92
Day 1
Day 3
Day 7
Pro-MMP9
Sham 100.00 ± 38.74 100.00 ± 13.92 100.00 ± 23.53
TBI 2088.49 ± 136.02 315.00 ± 57.03 103.23 ± 17.05
SFN 1789.10 ± 267.62 76.57 ± 15.23 201.33 ± 25.71
Day 1
Day 3
Day 7
Active-MMP9
Sham 100.00 ± 7.27 100.00 ± 4.08 100.00 ± 12.41
TBI 316.23 ± 16.37 194.89 ± 32.51 114.22 ± 10.90
SFN 267.84 ± 44.79 147.43 ± 9.93 106.42 ± 12.16

406
6.5.1.8 Appendix Figure 2: Drug dosing Proof of Concepts
6.5.1.9 Figure 3: Proof of concept of drug dosing influence on HO-1 in naïve untreated animals using 1/3 log ramp (4.6 mg/kg Hemin and 1 mg/kg Sulforaphane doses not shown since equal effect to next ramp step).
1/3 log unit steps
Proof of concept
Hemin Doses: 10, 21.5, 46.4 mg/kg
Sulforaphane Doses: 2.2, 4.6, 10 mg/kg

407
6.6 Affymetric Rat Genome Microarray Screening
Gene Significant? Nrf2 Target? H 24h Cx 24h CC 24h H 7d
HO-1 Yes Yes 2.5 3.8 4.3 2.7
HO-2 No No - - - -
LCN2 Yes Yes 36 34.2 10.9 1.9
Trf Yes Yes 1.7 2 -3.51 1.3
FTL No Yes - - - -
Mgst1 Yes Yes 1.8 1.8 1.26 2.5
Ugt1a1 Yes Yes 1.4 1.6 1.31 1.5
Known HO-1 Transcription Factors
Nrf2 No
1.1 1 -1.06 1.4
HIF1α No
- - - -
AP-1 No
- - - -
(-) denotes no significance in Nrf2 target or no observed change
Bold denotes significant upregulation at time point indicated

408
7 Vita
Nicholas Hyatt Russell was born on 1987 August 25 in Houston, Texas, and is a citizen of the
United States of America. He graduated from St. John’s School in Houston, Texas, in 2006. He
received his B.S. in Mechanical Engineering with an Additional Major in Biomedical
Engineering in 2010 and his M.ChE in Chemical Engineering in 2011 both from Carnegie
Mellon University. He then entered the M.D.-Ph.D. program at Virginia Commonwealth
University in 2011, and anticipates a thesis defense in Neuroscience in May 2017 and a
graduation date of May 2019.
Copyright © 2022 FDOKUMEN