Fingerprinting electronic structure of heme iron by ab initio ...
Upload
independentCategory
view
0download
0
ORIGINAL PAPER
Isoniazid and rifampicin inhibit allosterically heme bindingto albumin and peroxynitrite isomerization by heme–albumin
Paolo Ascenzi • Alessandro Bolli • Alessandra di Masi •
Grazia R. Tundo • Gabriella Fanali •
Massimo Coletta • Mauro Fasano
Received: 28 April 2010 / Accepted: 27 August 2010 / Published online: 25 September 2010
� SBIC 2010
Abstract Human serum heme–albumin (HSA-heme) dis-
plays globin-like properties. Here, the allosteric inhibition of
ferric heme [heme-Fe(III)] binding to human serum albumin
(HSA) and of ferric HSA–heme [HSA-heme-Fe(III)]-med-
iated peroxynitrite isomerization by isoniazid and rifam-
picin is reported. Moreover, the allosteric inhibition of
isoniazid and rifampicin binding to HSA by heme-Fe(III)
has been investigated. Data were obtained at pH 7.2 and
20.0 �C. The affinity of isoniazid and rifampicin for HSA
[K0 = (3.9 ± 0.4) 9 10-4 and (1.3 ± 0.1) 9 10-5 M,
respectively] decreases by about 1 order of magnitude upon
heme-Fe(III) binding to HSA [Kh = (4.3 ± 0.4) 9 10-3
and (1.2 ± 0.1) 9 10-4 M, respectively]. As expected, the
heme-Fe(III) affinity for HSA [H0 = (1.9 ± 0.2) 9
10-8 M] decreases by about 1 order of magnitude in the
presence of saturating amounts of isoniazid and rifampicin
[Hd = (2.1 ± 0.2) 9 10-7 M]. In the absence and presence
of CO2, the values of the second-order rate constant (lon) for
peroxynitrite isomerization by HSA-heme-Fe(III) are
4.1 9 105 and 4.3 9 105 M-1 s-1, respectively. Moreover,
isoniazid and rifampicin inhibit dose-dependently perox-
ynitrite isomerization by HSA-heme-Fe(III) in the absence
and presence of CO2. Accordingly, isoniazid and rifampicin
impair in a dose-dependent fashion the HSA-heme-Fe(III)-
based protection of free L-tyrosine against peroxynitrite-
mediated nitration. This behavior has been ascribed to the
pivotal role of Tyr150, a residue that either provides a polar
environment in Sudlow’s site I (i.e., the binding pocket of
isoniazid and rifampicin) or protrudes into the heme-Fe(III)
cleft, depending on ligand binding to Sudlow’s site I or to the
FA1 pocket, respectively. These results highlight the role
of drugs in modulating heme-Fe(III) binding to HSA and
HSA-heme-Fe(III) reactivity.Electronic supplementary material The online version of thisarticle (doi:10.1007/s00775-010-0706-2) contains supplementarymaterial, which is available to authorized users.
P. Ascenzi (&) � A. Bolli � A. di Masi
Department of Biology and Interdepartmental
Laboratory for Electron Microscopy,
University Roma Tre,
Viale Guglielmo Marconi 446,
00146 Rome, Italy
e-mail: [email protected]
P. Ascenzi
National Institute for Infectious Diseases I.R.C.C.S.
‘Lazzaro Spallanzani’,
Via Portuense 292,
00149 Rome, Italy
G. R. Tundo � M. Coletta
Department of Experimental Medicine
and Biochemical Sciences,
University of Roma ‘Tor Vergata’,
Via Montpellier 1, 00133 Rome, Italy
G. R. Tundo � M. Coletta
Interuniversity Consortium for the Research
on the Chemistry of Metals in Biological Systems,
Via Celso Ulpiani 27, 70126 Bari, Italy
G. Fanali � M. Fasano
Department of Structural and Functional Biology,
Center of Neuroscience, University of Insubria,
Via Alberto da Giussano 12,
21052 Busto Arsizio (VA), Italy
123
J Biol Inorg Chem (2011) 16:97–108
DOI 10.1007/s00775-010-0706-2

Keywords Allostery � Ferric human serum heme–
albumin � Human serum albumin � Isoniazid � Rifampicin
Abbreviations
FA Fatty acid
Heme–Fe(III) Ferric heme
HSA Human serum albumin
HSA-heme Human serum heme–albumin
HSA-heme-Fe(II)-NO Ferrous nitrosylated human serum
heme–albumin
HSA-heme-Fe(III) Ferric human serum heme–
albumin
Introduction
Human serum albumin (HSA) is the most abundant protein
in plasma and provides a depot and carrier for many
compounds. As a consequence, HSA affects the pharma-
cokinetics of many drugs, holds some ligands in a strained
orientation that results in their metabolic modification, and
renders potential toxins harmless, transporting them to
disposal sites. Moreover, HSA accounts for most of the
antioxidant capacity of human serum and displays enzy-
matic properties [1–9].
HSA is a single nonglycosylated all-a-chain protein,
constituted by 585 amino acids, containing three homolo-
gous domains (labeled I, II, and III). Each domain is made
up of two separate subdomains (named A and B) connected
by random coils. Interdomain helical regions link subdo-
main IB to subdomain IIA and subdomain IIB to subdo-
main IIIA (Fig. 1) (see [2, 8–11]).
The structural organization of HSA provides several
ligand binding sites (Fig. 1). HSA displays seven binding
clefts hosting chemically diverse ligands including fatty
acids (FAs), and are therefore labeled FA1–FA7 (Fig. 1).
In particular, FA1 is located within the IB subdomain
contacting the IB–IIA polypeptide linker and the long IB–
IIA transdomain helix; FA2 is located at the interface
between subdomains IA, IB, and IIA; FA3 and FA4 toge-
ther contribute to Sudlow’s site II (i.e., the ibuprofen pri-
mary site) in subdomain IIIA; FA5 is located within
subdomains IIIA and IIIB; FA6 is a solvent-accessible
linear slot located at the interface between subdomains IIA
and IIB; and FA7 corresponds to Sudlow’s site I (i.e., the
warfarin binding site) in subdomain IIA. FA2 and FA6
clefts appear to be the secondary binding sites of ibuprofen.
Moreover, HSA binds ligands (e.g., thyroxine) in the cleft
between domains I and III and the bacterial HSA-binding
modules to domain II [7, 9, 10, 12–19].
The FA1 binding site has evolved to selectively
bind the ferric heme [heme-Fe(III)] with a high affinity
(H0 = 1.3 9 10-8 M), so HSA participates physiologi-
cally to heme scavenging [20–23]. The tetrapyrrole ring is
arranged in a D-shaped cavity limited by Tyr138 and
Tyr161 residues that provide p–p stacking interaction with
the porphyrin and supply a donor oxygen (from Tyr161) for
the heme atom. The heme is secured to HSA by the long
IA–IB connecting loop that fits into the cleft opening [9,
24–26]. In turn, heme endows HSA with reactivity and
spectroscopic properties similar to those of hemoglobin
and myoglobin [9, 12, 26–41]. Remarkably, both heme-
Fe(III) binding to HSA and human serum heme–albumin
(HSA-heme) reactivity are modulated allosterically [8, 9,
19, 24, 29, 32–34, 38, 39, 42, 43].
Here, the effect of isoniazid and rifampicin, two widely
used antituberculosis drugs [44], on heme-Fe(III) binding
to HSA and ferric HSA-heme [HSA-heme-Fe(III)]-medi-
ated peroxynitrite1 isomerization is reported. Isoniazid and
rifampicin impair heme-Fe(III) binding to HSA and vice
versa, according to linked functions [45]. Moreover,
isoniazid and rifampicin inhibit dose-dependently perox-
ynitrite isomerization by HSA-heme-Fe(III), and the HSA-
heme-Fe(III)-based protection of free L-tyrosine against
Fig. 1 Three-dimensional structure of human serum albumin (HSA).
Subdomains are labeled as follows: blue IA, cyan IB, purple IIA,
green IIB, yellow IIIA, and red IIIB. Ligand binding clefts are shown
and labeled FA1–FA7; FA1 is occupied by the heme (red sticks),
whereas FA2–FA7 are occupied by myristate ions (black sticks). The
spectroscopically active Trp214 residue (W214) is rendered in orangesticks and labeled. FA7 corresponds to Sudlow’s site I (i.e., the
warfarin site). The FA3 and FA4 sites form Sudlow’s site II (i.e., the
ibuprofen site). Atomic coordinates were taken from Protein Data
Bank code 1O9X [78]. For further details, see the text
1 The recommended IUPAC nomenclature for peroxynitrite is
oxoperoxonitrate(1-) and for peroxynitrous acid is hydrogen oxoper-
oxonitrate. The term ‘‘peroxynitrite’’ is used in the text to refer
generically to both ONOO- and its conjugate acid ONOOH (see
[33, 53, 59, 77]).
98 J Biol Inorg Chem (2011) 16:97–108
123

peroxynitrite-mediated nitration. These results highlight
the role of drugs in modulating both heme binding to HSA
and HSA-heme reactivity.
Materials and methods
Materials
Hemin [iron(III) protoporphyrin IX] chloride was purchased
from Sigma–Aldrich (St. Louis, MO, USA). The heme-
Fe(III) stock solution (5.0 9 10-3 M) was prepared by dis-
solving heme-Fe(III) in 1.0 9 10-2 M NaOH [46]. The
heme-Fe(III) concentration was determined spectrophoto-
metrically at 535 nm after converting heme-Fe(III) to the
heme-Fe(III) bisimidazolate derivative in sodium dodecyl
sulfate micelles (e535 nm = 14.5 9 103 M-1 cm-1) [47].
HSA (purity 96% or better, essentially FA free) was
obtained from Sigma–Aldrich. The HSA concentration was
determined spectrophotometrically at 280 nm (e280 nm =
3.82 9 104 M-1 cm-1) [46]. The HSA stock solution
(2.0 9 10-4 M) was prepared by diluting the hydrophobic
ligand-free HSA solution with 2.0 9 10-2 M sodium
phosphate buffer, at pH 7.2 and 20.0 �C. The HSA-heme-
Fe(III) stock solution (2.0 9 10-4 M) was prepared by
adding a 0.8 M defect of the heme-Fe(III) stock solution to
the HSA solution (pH 7.2, 1.0 9 10-1 M sodium phos-
phate buffer) at 20.0 �C [33–36, 39–41, 46, 48]. The final
HSA and HSA-heme-Fe(III) concentrations ranged
between 1.0 9 10-8 and 5.0 9 10-6 M.
Isoniazid and rifampicin (Fig. S1) were purchased from
Sigma–Aldrich. The isoniazid stock solution (2.0 9
10-1 M) was prepared by dissolving the drug in 95%
water–5.0% methanol (v/v). The rifampicin stock solution
(2.0 9 10-2 M) was prepared by dissolving the drug in
methanol [49]. The final isoniazid and rifampicin concen-
trations ranged between 1.0 9 10-5 and 2.0 9 10-2 M
and between 1.0 9 10-6 and 2.0 9 10-3 M, respectively.
Peroxynitrite was synthesized from KO2 and NO and from
HNO2 and H2O2 and was stored in small aliquots at -80.0 �C
[50, 51]. The peroxynitrite stock solution (2.0 9 10-3 M)
was diluted immediately before use with degassed
5.0 9 10-2 M NaOH to reach the desired concentration
[33, 48, 52–55]. Nitrate and nitrite contaminations were in
the ranges 0–7% and 8–19% of the peroxynitrite concentra-
tion, respectively (see ‘‘Methods’’). The concentration of
peroxynitrite was determined spectrophotometrically prior
to each experiment by measuring the absorbance at 302 nm
(e302 nm = 1.705 9 103 M-1 cm-1) [50, 51, 55, 56].
Experiments in the presence of CO2 were carried out by
adding to the protein solutions the required amount of a
5.0 9 10-1 M NaHCO3 solution. After the addition of
bicarbonate, the protein solutions were allowed to
equilibrate for at least 5 min [33, 48, 52–55]. For the
experiments carried out in the absence of CO2, all solutions
were thoroughly degassed and kept under nitrogen or
helium [33, 48, 52–55].
All the other chemicals were obtained from Sigma–
Aldrich and Merck (Darmstadt, Germany). All products
were of analytical or reagent grade and were used without
further purification.
Methods
Isoniazid and rifampicin binding to HSA
Values of the dissociation equilibrium constant for isonia-
zid and rifampicin binding to HSA (i.e., K0) were obtained
spectrofluorimetrically at pH 7.2 (1.0 9 10-1 M phosphate
buffer) and 20.0 �C. The intrinsic tryptophan fluorescence
of HSA in the absence and presence of isoniazid and rif-
ampicin was recorded between 290 and 700 nm; the exci-
tation wavelength was 280 nm. The excitation and emission
slit widths were 5 nm. Small aliquots of either isoniazid
(2.0 9 10-1 M) or rifampicin (2.0 9 10-2 M) stock solu-
tions were added to the HSA (5.0 9 10-6 M) solution, and
the drug-dependent changes of the intrinsic fluorescence of
HSA were recorded after incubation for 10 min after each
addition. The intrinsic fluorescence of both drugs was
recorded between 290 and 700 nm (the excitation wave-
length was 280 nm) to evaluate the interference with the
intrinsic tryptophan fluorescence of HSA [6, 21, 22, 57, 58].
No intrinsic fluorescence of isoniazid and rifampicin
between 290 and 700 nm (the excitation wavelength was
280 nm) was observed. Test measurements performed after
2 h of HSA–drug incubation excluded slow kinetic effects.
Isoniazid and rifampicin binding to HSA was analyzed
by plotting the molar fraction of the drug–HSA complex
(i.e., Y) as a function of the free drug concentration. Data
were analyzed according to Eq. 1 [6, 21, 22, 57, 58]:
Y ¼ DF=DFmax ¼ drug½ �= K0 þ drug½ �ð Þ ð1Þ
where DF is the fluorescence change at a given drug con-
centration, and DFmax is the fluorescence change at the
saturating drug concentration.
Isoniazid and rifampicin binding to HSA-heme-Fe(III)
Values of the dissociation equilibrium constant for isoniazid
and rifampicin binding to HSA-heme-Fe(III) (i.e., Kh) were
obtained spectrophotometrically at pH 7.2 (1.0 9 10-1 M
phosphate buffer) and 20.0 �C. Heme-Fe(III)-based drug-
dependent absorbance changes were recorded between
350 and 450 nm. Small aliquots of either isoniazid
(2.0 9 10-1 M) or rifampicin (2.0 9 10-2 M) stock solu-
tions were added to the HSA-heme-Fe(III) (5.0 9 10-6 M)
J Biol Inorg Chem (2011) 16:97–108 99
123

solution and the drug-dependent absorbance changes of
HSA-heme-Fe(III) were recorded after incubation for
10 min after each addition [21, 22]. Test measurements
performed after 2 h of HSA-heme-Fe(III)–drug incubation
excluded slow kinetic effects.
Isoniazid and rifampicin binding to HSA-heme-Fe(III)
was analyzed by plotting the molar fraction of the drug–
HSA-heme-Fe(III) complex (i.e., Y) as a function of the
free drug concentration. Data were analyzed according to
Eq. 2 [21, 22]:
Y ¼ DA=DAmax ¼ drug½ �= Kh þ drug½ �ð Þ ð2Þ
where DA is the absorbance change at a given drug con-
centration, and DAmax is the absorbance change at the
saturating drug concentration.
Heme-Fe(III) binding to HSA and HSA–drug complexes
Values of the dissociation equilibrium constant for heme-
Fe(III) binding to HSA in the absence and presence of
isoniazid and rifampicin (i.e., H0 and Hd, respectively) were
obtained spectrophotometrically at pH 7.2 (1.0 9 10-1 M
phosphate buffer) and 20.0 �C. Heme-Fe(III)-dependent
absorbance changes were recorded between 350 and
450 nm. Small aliquots of the HSA (2.0 9 10-4 M) stock
solution were added to the heme-Fe(III) (5.0 9 10-7 M)
solution in the absence and presence of isoniazid
(3.0 9 10-5–3.0 9 10-2 M) and rifampicin (3.0 9 10-6–
3.0 9 10-3 M). The heme-Fe(III)-dependent absorbance
changes accompanying HSA-heme-Fe(III) formation were
recorded after incubation for 10 min after each addition [21,
22]. Test measurements performed after 2 h of HSA-heme-
Fe(III) and HSA-heme-Fe(III)–drug incubation excluded
slow kinetic effects.
Heme-Fe(III) binding to HSA in the absence and pres-
ence of isoniazid and rifampicin was analyzed by plotting
the molar fraction of HSA-heme-Fe(III) (i.e., Y) as a
function of the HSA concentration. Data were analyzed
according to Eq. 3 [21, 22]:
Y ¼ DA=DAmax ¼ ½HSA�=ðH þ ½HSA]Þ ð3Þ
where H corresponds to either H0 or Hd.
The dependence of the dissociation equilibrium constant
H for heme-Fe(III) binding to HSA as a function of the
isoniazid or rifampicin concentration was analyzed
according to Eq. 4 [21, 22, 45]:
log H ¼ log H�1d þ log drug½ � þ Khð Þ= drug½ � þ K0ð Þf g ð4Þ
Peroxynitrite isomerization in the absence and presence
of HSA-heme-Fe(III), CO2, isoniazid, and rifampicin
The kinetics of peroxynitrite isomerization in the absence
and presence of HSA-heme-Fe(III), CO2, isoniazid, and
rifampicin was recorded with SMF-20 and SMF-400 rapid-
mixing stopped-flow apparatus (Bio-Logic, Claix, France).
The light path of the observation cuvette was 10 mm, and
the dead time was 1.4 ms. The kinetics was monitored at
302 nm, the characteristic absorbance maximum of perox-
ynitrite (e302 nm = 1.705 9 103 M-1 cm-1) [50, 51, 55,
56]. Kinetic data were obtained in the absence and presence
of HSA-heme-Fe(III) (final concentration 5.0 9 10-6–
4.0 9 10-5 M), CO2 (final concentration 1.2 9 10-3 M)
isoniazid (final concentration 2.0 9 10-4–1.0 9 10-2 M),
and rifampicin (final concentration 4.0 9 10-5–5.0 9
10-4 M) by rapid mixing of the HSA-heme-Fe(III) buffered
solution with the peroxynitrite solution (final concentration
2.5 9 10-4 M). The kinetics was obtained at pH 7.2
(1.0 9 10-1 M phosphate buffer) and 20.0 �C; no gaseous
phase was present.
The kinetics of peroxynitrite isomerization by HSA-
heme-Fe(III) in the absence and presence of CO2, isonia-
zid, and rifampicin was analyzed in the framework of the
minimum reaction mechanism (Scheme 1) [33, 53, 59].
Values of the pseudo-first-order rate constant for HSA-
heme-Fe(III)-mediated peroxynitrite isomerization (i.e.,
lobs) were determined in the absence and presence of CO2,
isoniazid, and rifampicin, at pH 7.2 and 20.0 �C, from the
analysis of the time-dependent absorbance decrease at
302 nm, according to Eq. 5 [33, 53, 59]:
peroxynitrite½ �t¼ peroxynitrite½ �i�e�lobs� t ð5Þ
Values of the second-order rate constant for HSA-heme-
Fe(III)-mediated peroxynitrite isomerization (i.e., lon) and
of the first-order rate constant for peroxynitrite isom-
erization in the absence of HSA-heme-Fe(III) (i.e., l0) were
determined in the absence and presence of CO2, isoniazid,
and rifampicin, at pH 7.2 and 20.0 �C, from the linear
dependence of lobs on the HSA-heme-Fe(III) concentration
according to Eq. 6 [33, 53, 59, 60]:
lobs ¼ lon � HSA-heme-Fe IIIð Þ½ � þ l0 ð6Þ
Values of l0 for peroxynitrite isomerization in the
absence of HSA-heme-Fe(III) were also determined in the
Scheme 1 Minimum reaction
mechanism for peroxynitrite
isomerization by HSA-heme-
Fe(III)
100 J Biol Inorg Chem (2011) 16:97–108
123

absence and presence of CO2, isoniazid, and rifampicin, at
pH 7.2 and 20.0 �C, from the analysis of the time-
dependent absorbance decrease at 302 nm, according to
Eq. 7 [33, 53, 59]:
peroxynitrite½ �t¼ peroxynitrite½ �i � e�l0 � t ð7Þ
Values of Kh were determined, at pH 7.2 and 20.0 �C,
from the dependence of lon on the drug concentration (i.e.,
isoniazid concentration ranging between 2.0 9 10-4 and
1.0 9 10-2 M, and rifampicin concentration ranging
between 4.0 9 10-5 and 5.0 9 10-4 M). The effect of
the drug concentration on lon was analyzed according to
Eq. 8 [33, 53, 59, 60]:
lon ¼ lonðtopÞ � lonðtopÞ � drug½ �� �
= Kh þ drug½ �ð Þ� �
ð8Þ
where lon(top) represents the value of lon under conditions
where [drug] = 0 (i.e., lon(top) = lon).
Determination of NO2- and NO3
- concentration
NO2- and NO3
- analysis was carried out spectrophoto-
metrically at 543 nm by using the Griess reagent and VCl3to catalyze the conversion of NO3
- to NO2-, as described
previously [33, 59, 61, 62]. Calibration curves were
obtained by measuring four to eight standard sodium nitrite
and sodium nitrate solutions in 1.0 9 10-1 M phosphate
buffer, pH 7.2 and 20.0 �C. The samples were prepared by
mixing 500 lL of a HSA-heme-Fe(III) solution (initial
concentration 1.0 9 10-4 M in 2.0 9 10-1 M phosphate
buffer, pH 7.2) with 500 lL of a peroxynitrite solution
(initial concentration 4.0 9 10-4 M in 0.01 M NaOH)
with vortexing, at 20.0 �C, in the absence and presence of
CO2 (1.2 9 10-3 M), isoniazid (1.0 9 10-2 M), and
rifampicin (5.0 9 10-4 M). The reaction mixture was
analyzed within approximately 10 min.
Peroxynitrite-mediated formation of nitro-L-tyrosine
in the absence and presence of HSA-heme-Fe(III),
CO2, isoniazid, and rifampicin
The reaction of peroxynitrite with free L-tyrosine was
carried out at pH 7.2, at both 20.0 and 37.0 �C, by adding
0.2 mL of an alkaline (1.0 9 10-2 M NaOH) solution of
peroxynitrite (2.0 9 10-3 M) to 1.8 mL of a buffered
(1.0 9 10-1 M phosphate buffer) solution of L-tyrosine
(final concentration 1.0 9 10-4 M) in the absence and
presence of HSA-heme-Fe(III) (final concentration 5.0 9
10-6–5.0 9 10-5 M), CO2 (final concentration 1.2 9
10-3 M), isoniazid (final concentration 2.0 9 10-4
–1.0 9 10-2 M), and rifampicin (final concentration
4.0 9 10-5–5.0 9 10-4 M). The amount of nitro-L-tyro-
sine was determined by high-performance liquid chroma-
tography, as previously reported [33].
Values of Kh were determined from the dependence on
the drug concentration of the relative yield of nitro-L-
tyrosine formed from the reaction of peroxynitrite with free
L-tyrosine in the absence and presence of HSA-heme-
Fe(III), i.e., Y = [yield with added HSA-heme-Fe(III)/
yield with no HSA-heme-Fe(III)] 9 100 [33]. The effect of
the isoniazid and rifampicin concentration on Y was ana-
lyzed according to Eq. 9 [33]:
Y ¼ 100 � Rð Þ � drug½ �ð Þ= Kh þ drug½ �ð Þð Þ þ R ð9Þ
where R corresponds to Y in the absence of the drug.
Data analysis
Kinetic and thermodynamic data were analyzed using the
MATLAB program (The MathWorks, Natick, MA, USA).
The results are given as mean values of at least four exper-
iments plus or minus the corresponding standard deviation.
Docking analysis
Simulated automatic flexible ligand docking to HSA was
performed by using Autodock 4.0 and the graphical user
interface AutoDockTools [63–65]. The structure of HSA–
warfarin was downloaded from the Protein Data Bank
(code 2BXD) [7]. The isoniazid structure bound to cyto-
solic soybean ascorbate peroxidase was downloaded from
the Protein Data Bank (code 2VCF) [66]. The rifampicin
geometry in complex with Thermus aquaticus core RNA
polymerase was downloaded from the Protein Data Bank
(code 1I6V) [67]. Single bonds were allowed to rotate
freely during the Monte Carlo simulated annealing proce-
dure. The analysis of the conformational space was
restricted to a cubic box of 60 A edge centered on the
coordinates of warfarin. Monte Carlo simulated annealing
was performed by starting from a temperature of 900 K
with a relative cooling factor of 0.95 per cycle to reach the
temperature of 5 K in 100 cycles [63–65].
Results
Isoniazid and rifampicin binding to HSA
Isoniazid and rifampicin binding to HSA was investigated
by analyzing the perturbation of the intrinsic tryptophan
fluorescence of HSA that arises from the unique tryptophan
residue located near Sudlow’s site I in subdomain IIA, at
position 214 (Fig. 1). Isoniazid induces a perturbation of
the intrinsic tryptophan fluorescence of HSA similar to that
induced by rifampicin [58] (data not shown), as already
reported for the binding of several drugs, including war-
farin, to Sudlow’s site I [2, 6, 8, 9, 21, 22, 57, 68, 69].
J Biol Inorg Chem (2011) 16:97–108 101
123

Therefore, the perturbation of the tryptophan fluorescence
of HSA appears to be essentially drug-independent [2, 6, 8,
9, 21, 22, 57, 68].
Figure 2 shows the binding isotherms for isoniazid and
rifampicin association to HSA at pH 7.2 and 20.0 �C. The
analysis of the data given in Fig. 2, according to Eq. 1,
allowed the determination of K0 values for isoniazid and
rifampicin binding to HSA [(3.9 ± 0.4) 9 10-4 and
(1.3 ± 0.1) 9 10-5 M, respectively]. The Hill coefficient
(n) for isoniazid and rifampicin binding to HSA is
1.00 ± 0.02, indicating that drug binding to HSA is a
noncooperative event.
Isoniazid and rifampicin binding to HSA-heme-Fe(III)
Isoniazid and rifampicin binding to HSA-heme-Fe(III) was
investigated by analyzing the perturbation of the electronic
absorption spectra of HSA-heme-Fe(III). Note that Sud-
low’s site I and the heme cleft (Fig. 1) are spectroscopi-
cally and structurally linked [8, 9, 21, 22, 34]. Isoniazid
and rifampicin induce a very similar decrease in the
absorption coefficient and a superimposable blueshift of
the maximum of the electronic absorption spectrum of
HSA-heme-Fe(III) (data not shown), as already reported
for drug binding to Sudlow’s site I (e.g., warfarin).
Therefore, the perturbation of the electronic absorption
spectra of HSA-heme-Fe(III) appears to be essentially
drug-independent [8, 9, 21, 22, 34, 69].
Figure 2 shows the binding isotherms for isoniazid and
rifampicin association to HSA-heme-Fe(III) at pH 7.2 and
20.0 �C. The analysis of the data given in Fig. 2, according to
Eq. 2, allowed the determination of Kh values for isoniazid
and rifampicin binding to HSA-heme-Fe(III) [(4.3 ±
0.4) 9 10-3 and (1.2 ± 0.1) 9 10-4 M, respectively].
0 2500 5000 75000.00
0.25
0.50
0.75
1.00
Y
a
[Isoniazid] ×106 (M)0 50 100 150 200
0.00
0.25
0.50
0.75
1.00
Y
b
[Rifampicin] ×106 (M)
0 1 2 3 40.00
0.25
0.50
0.75
1.00
Y
c
[HSA] ×107 (M)-6 -5 -4 -3 -2 -1
6.5
7.0
7.5
8.0d
Log[Drug]
logH
-1
Fig. 2 Isoniazid and rifampicin binding to HSA and ferric human
serum heme–albumin [HSA-heme-Fe(III)]. a Thermodynamics of
isoniazid binding to HSA (circles) and HSA-heme-Fe(III) (squares).
The lines were calculated according to Eqs. 1 and 2 by nonlinear
regression curve fitting with K0 = (3.9 ± 0.4) 9 10-4 M and
Kh = (4.3 ± 0.4) 9 10-3 M. The isoniazid concentration corre-
sponds to that of the free ligand. The HSA and HSA-heme-Fe(III)
concentrations were 5.0 9 10-6 M. b Thermodynamics of rifampicin
binding to HSA (circles) and HSA-heme-Fe(III) (squares). The lineswere calculated according to Eqs. 1 and 2 by nonlinear regression
curve fitting with K0 = (1.3 ± 0.1) 9 10-5 M and Kh = (1.2 ±
0.1) 9 10-4 M. The rifampicin concentration corresponds to that of
the free ligand. The HSA and HSA-heme-Fe(III) concentrations were
5.0 9 10-6 M. c Thermodynamics of ferric heme [heme-Fe(III)]
binding to HSA in the absence (diamonds) and presence of isoniazid
(upward triangles) and rifampicin (downward triangles). The lineswere calculated according to Eq. 3 by nonlinear regression curve
fitting with H0 = (1.9 ± 0.2) 9 10-8 M and Hd = (2.1 ±
0.2) 9 10-7 M. The HSA concentration corresponds to that of the
free ligand; the heme-Fe(III) concentration was 5.0 9 10-7 M, the
isoniazid concentration was 3.0 9 10-2 M, and the rifampicin con-
centration was 3.0 9 10-3 M. d Dependence of the apparent asso-
ciation equilibrium constant H for heme-Fe(III) binding to HSA on
the isoniazid (upward triangles) and rifampicin (downward triangles)
concentrations. The diamond indicates the H0-1 value for HSA binding
to heme-Fe(III) in the absence of drugs. The lines were calculated
according to Eq. 4 by nonlinear regression curve fitting with the
following sets of parameters: isoniazid––Hd-1 = (4.8 ± 0.5) 9
106 M-1, K0 = (3.9 ± 0.4) 9 10-4 M, and Kh = (4.3 ± 0.4) 9
10-3 M; and rifampicin––Hd-1 = (4.8 ± 0.5) 9 106 M-1, K0 =
(1.3 ± 0.1) 9 10-5 M, and Kh = (1.2 ± 0.1) 9 10-4 M. The isoni-
azid and rifampicin concentrations correspond to the concentration of
the free ligand. Where not shown, the standard deviation is smaller
than the symbol. Data were obtained at pH 7.2 and 20.0 �C. For
further details, see the text
102 J Biol Inorg Chem (2011) 16:97–108
123

The Hill coefficient (n) for isoniazid and rifampicin binding
to HSA-heme-Fe(III) is 1.00 ± 0.03, indicating that drug
binding to HSA-heme-Fe(III) is a noncooperative event.
As already reported for the association of several drugs
to Sudlow’s site I, heme-Fe(III) inhibits isoniazid and rif-
ampicin binding to HSA, K0 being lower than Kh by about
1 order of magnitude (Fig. 2). Notably, this phenomenon is
essentially drug-independent [8, 9, 21, 22, 26, 34, 38, 69].
Heme-Fe(III) binding to HSA and HSA–drug
complexes
Heme-Fe(III) binding to HSA in the absence and presence
of isoniazid and rifampicin was investigated by analyzing
the perturbation of the electronic absorption spectrum of
heme-Fe(III). The absorption coefficient and the maximum
of the electronic absorption spectra of HSA-heme-Fe(III)–
isoniazid and HSA-heme-Fe(III)–rifampicin complexes are
lower and blueshifted with respect to those of the drug-free
HSA-heme-Fe(III). Furthermore, the electronic absorption
spectra of HSA-heme-Fe(III)–drug complexes appear to be
drug-independent [8, 9, 21, 22, 34].
Figure 2 shows the binding isotherms for heme-Fe(III)
association to HSA in the absence and presence of isoniazid
and rifampicin at pH 7.2 and 20.0 �C. The analysis of data
given in Fig. 2, according to Eq. 3, allowed the determination
of H0 and Hd values for heme-Fe(III) binding to HSA in the
absence and presence of the drugs, respectively. The value of
H0 for heme-Fe(III) binding to HSA (1.9 ± 0.2 9 10-8 M)
agrees with the values reported in the literature [2, 8, 21, 22,
34]. Isoniazid and rifampicin inhibit heme-Fe(III) binding to
HSA, H0 being lower than Hd by about 1 order of magnitude
(Fig. 2). The values of Hd for heme-Fe(III) binding to HSA in
the presence of saturating levels of isoniazid and rifampicin
[Hd = (2.1 ± 0.2) 9 10-7 M; present study], as well as of
several drugs all binding to Sudlow’s site I (e.g., warfarin),
appear to be essentially drug-independent [8, 9, 21, 22, 26, 34,
38, 69]. Both in the absence and in the presence of isoniazid
and rifampicin, the Hill coefficient (n) for heme-Fe(III)
binding to HSA is 1.00 ± 0.03, indicating that drug binding
to HSA-heme-Fe(III) is a noncooperative event.
According to linked functions [45], the values of Hd, K0,
and Kh obtained experimentally (Fig. 2) are in excellent
agreement with those calculated according to Eq. 4 (Fig. 2),
thus giving confidence that the assumptions underlying
Eq. 4 are correct.
Effect of isoniazid and rifampicin
on HSA-heme-Fe(III)-mediated
peroxynitrite isomerization
The kinetics of peroxynitrite isomerization in the absence
and presence of HSA-heme-Fe(III), CO2, isoniazid, and
rifampicin was recorded by single-wavelength stopped-
flow apparatus. Under all the experimental conditions, a
decrease of the absorbance at 302 nm was observed, as
previously reported [33]. The kinetics of peroxynitrite
isomerization was fitted to a single-exponential decay for
more than 95% of its course (see Eq. 5). According to the
literature [33], this indicates that no intermediate species
[e.g., HSA-heme-Fe(III)-OONO; see Scheme 1] accumu-
late(s) in the course of peroxynitrite isomerization. In
particular, the formation of the transient HSA-heme-
Fe(III)–OONO species represents the rate-limiting step in
catalysis, the conversion of the HSA-heme-Fe(III)–OONO
complex to HSA-heme-Fe(III) and NO3- being faster by at
least 1 order of magnitude.
In the absence and presence of CO2, isoniazid, and rif-
ampicin, the observed rate constants for HSA-heme-
Fe(III)-catalyzed isomerization of peroxynitrite (i.e., lobs)
increase linearly with the HSA-heme-Fe(III) concentration
(Fig. S2). The analysis of the data reported in Fig. 3,
according to Eq. 6, allowed the determination of the values
of the second-order rate constant for peroxynitrite isom-
erization by HSA-heme-Fe(III) (i.e., lon, corresponding to
the slope of the linear plots) and of the first-order rate
constant for peroxynitrite isomerization in the absence of
HSA-heme-Fe(III) (i.e., l0, corresponding to the y intercept
of the linear plots). The values of l0 obtained according to
Eq. 6 are in excellent agreement with those experimentally
determined according to Eq. 7 (see Table 1). In the
absence of the drugs, the values of lon and l0 for perox-
ynitrite isomerization in the absence and presence of CO2
are in excellent agreement with those reported in the
literature [33].
The values of lon for HSA-heme-Fe(III)-catalyzed
isomerization of peroxynitrite are essentially unaffected by
CO2 (Fig. 3, Table 1). In contrast, the value of l0 for per-
oxynitrite isomerization obtained in the presence of CO2
(15.9 s-1) is higher by about 2 orders of magnitude than
that obtained in the absence of CO2 (2.8 9 10-1 s-1)
(Table 1). The lack of a CO2-linked effect on peroxynitrite
isomerization by HSA-heme-Fe(III) is likely related to the
fact that peroxynitrite reacts faster with HSA-heme-Fe(III)
(lon = 4.1 9 105 and Ion = 4.3 9 105 M-1 s-1 in the
absence and presence of CO2, respectively; Table 1) than
with CO2 (lon = 3 9 104 M-1 s-1) [55, 56, 70, 71].
In the absence and presence of CO2, isoniazid and rif-
ampicin affect dose-dependently the lon values for HSA-
heme-Fe(III)-mediated isomerization of peroxynitrite
(Fig. 3). Indeed, the values of lon for HSA-heme-Fe(III)-
catalyzed isomerization of peroxynitrite decrease from
4.1 9 105 M-1 s-1 in the absence of drugs and CO2 to
1.3 9 105 M-1 s-1 at an isoniazid concentration of 1.0 9
10-2 M, and to 1.1 9 105 M-1 s-1 at a rifampicin
concentration of 5.0 9 10-4 M. Moreover, the values of
J Biol Inorg Chem (2011) 16:97–108 103
123
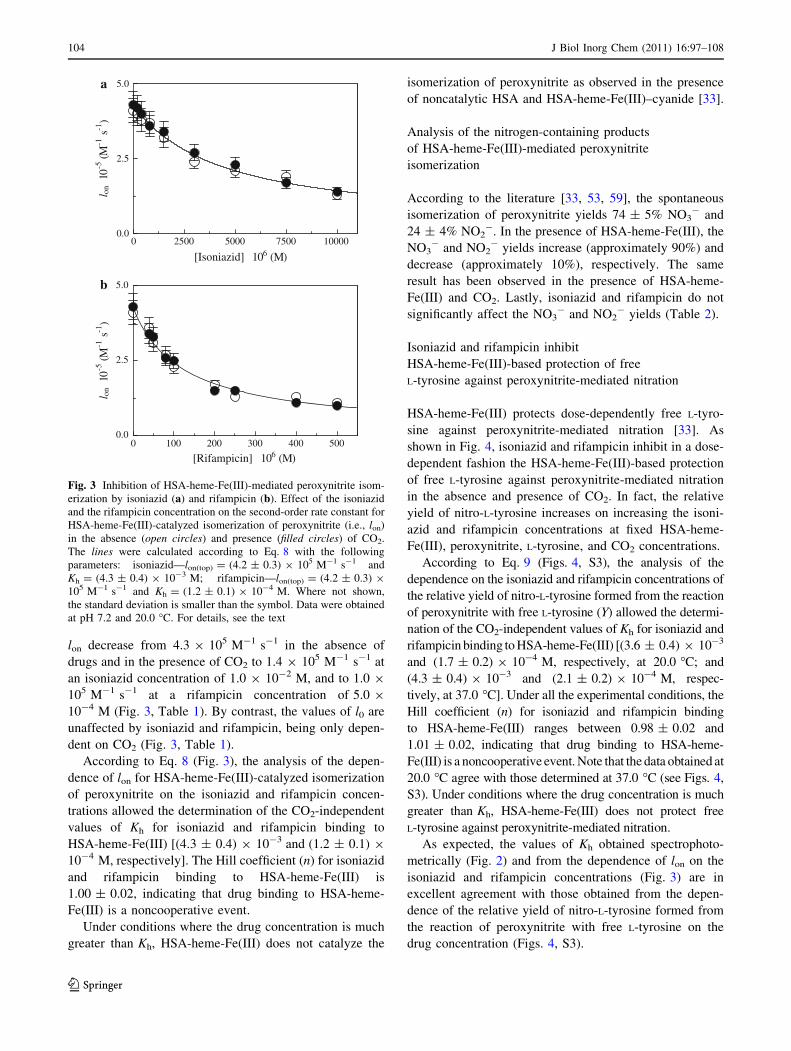
lon decrease from 4.3 9 105 M-1 s-1 in the absence of
drugs and in the presence of CO2 to 1.4 9 105 M-1 s-1 at
an isoniazid concentration of 1.0 9 10-2 M, and to 1.0 9
105 M-1 s-1 at a rifampicin concentration of 5.0 9
10-4 M (Fig. 3, Table 1). By contrast, the values of l0 are
unaffected by isoniazid and rifampicin, being only depen-
dent on CO2 (Fig. 3, Table 1).
According to Eq. 8 (Fig. 3), the analysis of the depen-
dence of lon for HSA-heme-Fe(III)-catalyzed isomerization
of peroxynitrite on the isoniazid and rifampicin concen-
trations allowed the determination of the CO2-independent
values of Kh for isoniazid and rifampicin binding to
HSA-heme-Fe(III) [(4.3 ± 0.4) 9 10-3 and (1.2 ± 0.1) 9
10-4 M, respectively]. The Hill coefficient (n) for isoniazid
and rifampicin binding to HSA-heme-Fe(III) is
1.00 ± 0.02, indicating that drug binding to HSA-heme-
Fe(III) is a noncooperative event.
Under conditions where the drug concentration is much
greater than Kh, HSA-heme-Fe(III) does not catalyze the
isomerization of peroxynitrite as observed in the presence
of noncatalytic HSA and HSA-heme-Fe(III)–cyanide [33].
Analysis of the nitrogen-containing products
of HSA-heme-Fe(III)-mediated peroxynitrite
isomerization
According to the literature [33, 53, 59], the spontaneous
isomerization of peroxynitrite yields 74 ± 5% NO3- and
24 ± 4% NO2-. In the presence of HSA-heme-Fe(III), the
NO3- and NO2
- yields increase (approximately 90%) and
decrease (approximately 10%), respectively. The same
result has been observed in the presence of HSA-heme-
Fe(III) and CO2. Lastly, isoniazid and rifampicin do not
significantly affect the NO3- and NO2
- yields (Table 2).
Isoniazid and rifampicin inhibit
HSA-heme-Fe(III)-based protection of free
L-tyrosine against peroxynitrite-mediated nitration
HSA-heme-Fe(III) protects dose-dependently free L-tyro-
sine against peroxynitrite-mediated nitration [33]. As
shown in Fig. 4, isoniazid and rifampicin inhibit in a dose-
dependent fashion the HSA-heme-Fe(III)-based protection
of free L-tyrosine against peroxynitrite-mediated nitration
in the absence and presence of CO2. In fact, the relative
yield of nitro-L-tyrosine increases on increasing the isoni-
azid and rifampicin concentrations at fixed HSA-heme-
Fe(III), peroxynitrite, L-tyrosine, and CO2 concentrations.
According to Eq. 9 (Figs. 4, S3), the analysis of the
dependence on the isoniazid and rifampicin concentrations of
the relative yield of nitro-L-tyrosine formed from the reaction
of peroxynitrite with free L-tyrosine (Y) allowed the determi-
nation of the CO2-independent values of Kh for isoniazid and
rifampicin binding to HSA-heme-Fe(III) [(3.6 ± 0.4) 9 10-3
and (1.7 ± 0.2) 9 10-4 M, respectively, at 20.0 �C; and
(4.3 ± 0.4) 9 10-3 and (2.1 ± 0.2) 9 10-4 M, respec-
tively, at 37.0 �C]. Under all the experimental conditions, the
Hill coefficient (n) for isoniazid and rifampicin binding
to HSA-heme-Fe(III) ranges between 0.98 ± 0.02 and
1.01 ± 0.02, indicating that drug binding to HSA-heme-
Fe(III) is a noncooperative event. Note that the data obtained at
20.0 �C agree with those determined at 37.0 �C (see Figs. 4,
S3). Under conditions where the drug concentration is much
greater than Kh, HSA-heme-Fe(III) does not protect free
L-tyrosine against peroxynitrite-mediated nitration.
As expected, the values of Kh obtained spectrophoto-
metrically (Fig. 2) and from the dependence of lon on the
isoniazid and rifampicin concentrations (Fig. 3) are in
excellent agreement with those obtained from the depen-
dence of the relative yield of nitro-L-tyrosine formed from
the reaction of peroxynitrite with free L-tyrosine on the
drug concentration (Figs. 4, S3).
0 2500 5000 7500 100000.0
2.5
5.0a
[Isoniazid] ×106 (M)
l on×
10-5
(M-1
s-1
)
0 100 200 300 400 5000.0
2.5
5.0b
[Rifampicin] ×106 (M)
l on×
10-5
(M-1
s-1
)
Fig. 3 Inhibition of HSA-heme-Fe(III)-mediated peroxynitrite isom-
erization by isoniazid (a) and rifampicin (b). Effect of the isoniazid
and the rifampicin concentration on the second-order rate constant for
HSA-heme-Fe(III)-catalyzed isomerization of peroxynitrite (i.e., lon)
in the absence (open circles) and presence (filled circles) of CO2.
The lines were calculated according to Eq. 8 with the following
parameters: isoniazid––lon(top) = (4.2 ± 0.3) 9 105 M-1 s-1 and
Kh = (4.3 ± 0.4) 9 10-3 M; rifampicin––lon(top) = (4.2 ± 0.3) 9
105 M-1 s-1 and Kh = (1.2 ± 0.1) 9 10-4 M. Where not shown,
the standard deviation is smaller than the symbol. Data were obtained
at pH 7.2 and 20.0 �C. For details, see the text
104 J Biol Inorg Chem (2011) 16:97–108
123

Automated docking simulation of isoniazid
and rifampicin binding to HSA
An automated docking analysis of isoniazid and rifampicin
was performed in Sudlow’s site I (FA7) of HSA to confirm
that these drugs could easily bind to this site (Fig. 5).
Isoniazid, a small ligand, binds to the FA7 subchamber,
where the coumarinic ring of warfarin is located, with an
interaction energy of -24.3 kJ mol-1, in agreement with
that calculated from K0. On the other hand, rifampicin only
partially enters into Sudlow’s site I opening that recognizes
the benzyl group of warfarin. Therefore, this prevents the
Table 1 Effect of the isoniazid and rifampicin concentrations on l0 and lon values for ferric human serum heme–albumin [HSA-heme-Fe(III)]-
mediated peroxynitrite isomerization in the absence and presence of CO2 at pH 7.2 and 20.0 �C
Isoniazid (M) l0 or l0d (s-1)a lon or lon
d (M-1 s-1) Rifampicin (M) l0 or l0d (s-1)a lon or lon
d (M-1 s-1)
-CO2 ?CO2b -CO2 ?CO2
b -CO2 ?CO2b -CO2 ?CO2
b
0.0c 0.28c 15.9c 4.1 9 105c 4.3 9 105c 0.0c 0.28c 15.9c 4.1 9 105c 4.3 9 105c
0.26 16.3 0.26 16.3
2.0 9 10-4 0.29 17.2 4.0 9 105 4.2 9 105 4.0 9 10-5 0.29 17.2 3.6 9 105 3.4 9 105
0.31 15.9 0.28 18.9
4.0 9 10-4 0.27 16.9 3.8 9 105 4.0 9 105 5.0 9 10-5 0.27 16.9 3.1 9 105 3.3 9 105
0.25 18.4 0.24 17.5
8.0 9 10-4 0.31 15.2 3.7 9 105 3.6 9 105 8.0 9 10-5 0.31 15.2 2.7 9 105 2.6 9 105
0.28 16.9 0.23 15.8
1.5 9 10-3 0.26 18.4 3.2 9 105 3.4 9 105 1.0 9 10-4 0.26 18.4 2.3 9 105 2.5 9 105
0.27 16.3 0.27 19.1
3.0 9 10-3 0.25 20.3 2.4 9 105 2.7 9 105 2.0 9 10-4 0.25 20.3 1.7 9 105 1.5 9 105
0.28 18.4 0.26 19.8
5.0 9 10-3 0.30 17.6 2.1 9 105 2.3 9 105 2.5 9 10-4 0.30 17.6 1.3 9 105 1.5 9 105
0.27 16.5 0.28 16.9
7.5 9 10-3 0.28 18.1 1.9 9 105 1.7 9 105 4.0 9 10-4 0.28 18.1 1.3 9 105 1.1 9 105
0.26 19.3 0.29 17.4
1.0 9 10-2 0.26 16.5 1.3 9 105 1.4 9 105 5.0 9 10-4 0.26 16.5 1.1 9 105 1.0 9 105
0.27 18.8 0.25 16.6
a In regular style are shown values of l0 and l0d for HSA-heme-Fe(III)-catalyzed peroxynitrite isomerization. In italics are shown values of l0 and
l0d for peroxynitrite isomerization obtained in the absence of HSA-heme-Fe(III)
b The CO2 concentration was 1.2 9 10-3 Mc Under conditions where the drug concentration is 0.0 M, l0 = l0
d, and lon = lond
Table 2 NO3- and NO2
- distribution of peroxynitrite isomerization in the absence and presence of HSA-heme-Fe(III), CO2, isoniazid, and
rifampicin at pH 7.2 and 20.0 �C
HSA-heme-Fe(III) (M) CO2 (M) Isoniazid (M) Rifampicin (M) NO3- (%) NO2
- (%) NO3- ? NO2
- (%)
– – – – 74 ± 5 24 ± 4 98
– 1.2 9 10-3 – – 86 ± 5 15 ± 3 101
– – 1.0 9 10-2 – 77 ± 5 23 ± 3 100
– 1.2 9 10-3 1.0 9 10-2 85 ± 3 15 ± 3 100
– – – 5.0 9 10-4 73 ± 5 28 ± 3 101
– 1.2 9 10-3 – 5.0 9 10-4 84 ± 8 15 ± 3 99
5.0 9 10-5 – – – 88 ± 5 13 ± 3 101
5.0 9 10-5 1.2 9 10-3 – – 92 ± 4 7 ± 3 99
5.0 9 10-5 – 1.0 9 10-2 91 ± 5 9 ± 3 100
5.0 9 10-5 1.2 9 10-3 1.0 9 10-2 89 ± 4 12 ± 3 101
5.0 9 10-5 – – 5.0 9 10-4 92 ± 3 7 ± 4 99
5.0 9 10-5 1.2 9 10-3 – 5.0 9 10-4 90 ± 4 12 ± 3 102
J Biol Inorg Chem (2011) 16:97–108 105
123

determination of the rifampicin docking energy. It should
be noticed, however, that the simulation does not take into
account induced-fit conformational changes involving the
protein backbone [64].
Discussion
Isoniazid and rifampicin bind noncooperatively to Sud-
low’s site I, as suggested by the drug-dependent quenching
of the intrinsic HSA fluorescence [6, 21, 22, 57, 58, 69]. As
expected for Sudlow’s site I ligands, both antituberculosis
drugs modulate allosterically heme-Fe(III) binding to HSA
as well as peroxynitrite isomerization by HSA-heme-
Fe(III), highlighting the role of heterotropic ligands in
modulating the HSA(-heme) reactivity [8, 32, 48, 72].
The affinity of isoniazid and rifampicin for HSA
decreases by about 1 order of magnitude in the presence of
saturating amounts of heme-Fe(III) (Fig. 2). Further, as
expected on the basis of linked functions [45], the heme-
Fe(III) affinity for HSA decreases by about 1 order of
magnitude in the presence of saturating amounts of isoni-
azid and rifampicin (Fig. 2). Accordingly, the difference in
the reaction free energy for drug binding to HSA in the
absence and presence of heme-Fe(III) [dDG� =
-RT ln(K0/Kh) = 5.6 ± 0.2 kJ mol-1] is similar to the
difference in the reaction free energy for heme-Fe(III)
binding to HSA in the absence and presence of drugs
[dDG� = -RT ln(H0/Hd) = 5.8 kJ mol-1] at pH 7.2 and
20.0 �C. This value, which is essentially drug-independent
[8, 9, 21, 22, 26, 34, 38, 69], indicates that the interaction
energy between the Sudlow’s site I and FA1, where the
heme binds, is 5.7 kJ mol-1 independent of the affinity of
the drug for Sudlow’s site I; this value likely reflects the
free energy associated with the conformational change(s)
required for the structural communication between the two
sites.
Peroxynitrite isomerization is facilitated by HSA-heme-
Fe(III) (see the present study and [33]). However, unlike
ibuprofen inhibition of HSA-heme-Fe(III) action by bind-
ing to Sudlow’s site II [33], isoniazid and rifampicin impair
allosterically HSA-heme-Fe(III)-mediated peroxynitrite
isomerization by binding to Sudlow’s site I (Fig. 5). This
behavior could reflect drug-dependent structural changes
occurring at the heme binding pocket of HSA. Indeed,
abacavir binding to Sudlow’s site I modulates peroxyni-
trite-mediated oxidation of ferrous nitrosylated HSA-heme
[HSA-heme-Fe(II)-NO] [48]. Moreover, abacavir binding
and warfarin binding to Sudlow’s site I facilitate HSA-
heme-Fe(II)-NO denitrosylation [31]. Both events reflect
the drug-dependent neutral-to-basic conformational transi-
tion in HSA-heme-Fe(II)-NO [31, 48]. Sudlow’s site I
ligands interact with Tyr150 and Arg252 residues, two key
residues positioned in the center of the drug binding site. In
turn, Tyr150 drives the reorientation of Phe149, which is
no longer available for the stabilization of the heme-Fe(III)
porphyrin ring by p–p stacking, with a consequent effect
on the heme-Fe(III)-based catalysis (see the present study
and [9, 31, 33, 48]).
Peroxynitrite isomerization by heme-Fe(III) proteins
[e.g., HSA-heme-Fe(III)] could represent a physiological
detoxification mechanism, protecting cells from reactive
nitrogen and oxygen species [70, 71]; this potential role is
reinforced by the evidence that enzymatically active HSA-
heme-Fe(III) indeed protects L-tyrosine from the nitrosy-
lation (see Figs. 4, S3). Note that the rate of peroxynitrite
isomerization by HSA-heme-Fe(III) is faster by about
1 order of magnitude than the rates reported for ferric horse
heart myoglobin, sperm whale myoglobin, and human
hemoglobin [33, 53, 59]. Moreover, peroxynitrite isomer-
ization by HSA-heme-Fe(III) is faster than peroxynitrite
0 2500 5000 7500 100000
25
50
75
100
a
[Isoniazid] ×106 (M)
Rel
ativ
e ni
tro-
L-t
yros
ine
yiel
d (%
)
0 100 200 300 400 5000
25
50
75
100
b
[Rifampicin] ×106 (M)
Rel
ativ
e ni
tro-
L-t
yros
ine
yiel
d (%
)
Fig. 4 Effect of isoniazid (a) and rifampicin (b) concentrations on
the relative yield of nitro-L-tyrosine formed from the reaction of
peroxynitrite with free L-tyrosine at pH 7.2 and 20.0 �C in the
presence of HSA-heme-Fe(III) and in the absence (open circles) and
presence (filled circles) of CO2. The lines were calculated according
to Eq. 9 with the following parameters: a Kh = (3.6 ± 0.4) 9
10-3 M and R = 19.3 ± 1.7%; and b Kh = (1.7 ± 0.2) 9 10-4 M
and R = 21.3 ± 2.0%. The concentrations of HSA-heme-Fe(III),
peroxynitrite, free L-tyrosine, and CO2 were 2.5 9 10-5, 2.0 9 10-3,
1.0 9 10-4, and 1.2 9 10-3 M, respectively. Where not shown, the
standard deviation is smaller than the symbol. For details, see the text
106 J Biol Inorg Chem (2011) 16:97–108
123

scavenging by ferrous nitrosylated heme proteins, which
appears to be strongly limited by (1) the dissociation of the
heme-Fe(III)–NO transient and (2) the reduction of the
final heme-Fe(III) species to the ferrous heme derivative
[33, 48].
Owing to the role of HSA in human plasma [1–9], some
in vivo implications could be argued from the present
results:
1. Peroxynitrite isomerization by HSA-heme-Fe(III) could
occur only in patients affected by diseases where a
relevant intravascular hemolysis takes place. Under
these pathological conditions, the HSA-heme-Fe(III)
plasma level increases from the physiological concen-
tration (approximately 1 9 10-6 M) to approximately
4 9 10-5 M [20, 73]. To mimic as much as possible this
condition, the HSA-heme-Fe(III) concentration here
used ranged from 5.0 9 10-6 to 5.0 9 10-5 M.
2. Although the in vivo concentration of peroxynitrite is
openly debated, the level of peroxynitrite in the
reperfused ischemic heart has been reported to be much
higher than micromolar concentration, at least over a
brief period of time [70, 71], overlapping the lowest
peroxynitrite concentration here used (2.5 9 10-5 M).
3. Accounting for the plasma HSA concentration
(approximately 7.5 9 10-4 M) [2], the plasma levels
of isoniazid and rifampicin (ranging between
1 9 10-5 and 1 9 10-4 M [74, 75]), and the values
of K0 and Kh determined here, the molar fraction of the
drug-bound HSA and HSA-heme-Fe(III) could range
between 10 and 50%.
Any inhibitory effect on peroxynitrite isomerization by
HSA-heme-Fe(III) results in a relevant effect on the puta-
tive HSA detoxification role. The fact that several drugs
binding at different sites of HSA might reduce this
potentially important role should induce some caution for
the simultaneous drug administration employed for several
therapeutic protocols. Thus, this control should be carried
out routinely to avoid some paradoxical therapeutic effect,
as for the management of antituberculosis therapy. Indeed,
the increase of the plasma levels of heme-Fe(III) under
pathological conditions [20, 72] may induce a release of
antituberculosis drugs; accordingly, the toxic free-heme
plasma concentration could increase in patients under
antituberculosis drug therapy. Moreover, the protective
role of HSA-heme-Fe(III), catalyzing peroxynitrite detox-
ification, could be impaired by antituberculosis drugs;
this could facilitate the peroxynitrite-mediated nitration
of aromatic residues (such as Tyr), which represents a
relevant posttranslational protein modification process
[70, 71, 76].
Acknowledgments This work was partially supported by grants
from the Ministero dell’Istruzione, dell’Universita e della Ricerca of
Italy (PRIN 2007ECX29E_002 and University Roma Tre, CLAR
2009, to P.A.) and from the Ministero della Salute of Italy (Istituto
Nazionale per le Malattie Infettive I.R.C.C.S. ‘Lazzaro Spallanzani’,
Ricerca corrente 2009 to P.A.).
References
1. Sudlow G, Birkett DJ, Wade DN (1975) Mol Pharmacol
11:824–832
2. Peters T Jr (ed) (1996) All about albumin: biochemistry, genetics
and medical applications. Academic Press, San Diego
3. Curry S (2002) Vox Sang 83(Suppl 1):315–319
4. Kragh-Hansen U, Chuang VT, Otagiri M (2002) Biol Pharm Bull
25:695–704
5. Sakurai Y, Ma SF, Watanabe H, Yamaotsu N, Hirono S, Kurono
Y, Kragh-Hansen U, Otagiri M (2004) Pharm Res 21:285–292
6. Sułkowska A, Bojko B, Rownicka J, Sułkowski W (2004) Bio-
polymers 74:256–262
7. Ghuman J, Zunszain PA, Petitpas I, Bhattacharya AA, Otagiri M,
Curry S (2005) J Mol Biol 353:38–52
Fig. 5 Binding mode of isoniazid and rifampicin to the FA7 site of
HSA. Isoniazid and rifampicin are rendered in magenta sticks.
Warfarin, the prototypical ligand of the FA7 site (i.e., Sudlow’s site
I), is rendered in green sticks. Structural models have been obtained
by simulation of automated docking of drugs into the FA7 binding
cleft of the HSA structure (Protein Data Bank code 2BXD [7]). For
details, see the text
J Biol Inorg Chem (2011) 16:97–108 107
123

8. Ascenzi P, Bocedi A, Notari S, Fanali G, Fesce R, Fasano M
(2006) Mini Rev Med Chem 6:483–489
9. Ascenzi P, Fasano M (2010) Biophys Chem 148:16–22
10. Curry S, Mandelkov H, Brick P, Franks N (1998) Nat Struct Biol
5:827–835
11. Sugio S, Kashima A, Mochizuki S, Noda M, Kobayashi K (1999)
Protein Eng 12:439–446
12. Yamasaki K, Maruyama T, Yoshimoto K, Tsutsumi Y, Narazaki
R, Fukuhara A, Kragh-Hansen U, Otagiri M (1999) Biochim
Biophys Acta 1432:313–323
13. Bhattacharya AA, Curry S, Franks NP (2000) J Biol Chem
275:38731–38738
14. Bhattacharya AA, Grune T, Curry S (2000) J Mol Biol
303:721–732
15. Petitpas I, Bhattacharya AA, Twine S, East M, Curry S (2001) J
Biol Chem 276:22804–22809
16. Chuang VTG, Otagiri M (2002) Pharm Res 19:1458–1464
17. Hamilton JA (2004) Prog Lipid Res 43:177–199
18. Lejon S, Frick IM, Bjorck L, Wikstrom M, Svensson S (2004) J
Biol Chem 279:42924–42928
19. Curry S (2009) Drug Metab Pharmacokinet 24:342–357
20. Miller YI, Shaklai N (1999) Biochim Biophys Acta 1454:153–164
21. Ascenzi P, Bocedi A, Notari S, Menegatti E, Fasano M (2005)
Biochem Biophys Res Commun 334:481–486
22. Bocedi A, Notari S, Menegatti E, Fanali G, Fasano M, Ascenzi P
(2005) FEBS J 272:6287–6296
23. Fasano M, Fanali G, Leboffe L, Ascenzi P (2007) IUBMB Life
59:436–440
24. Fasano M, Baroni S, Vannini A, Ascenzi P, Aime S (2001) J Biol
Inorg Chem 6:650–658
25. Wardell M, Wang Z, Ho JX, Robert J, Ruker F, Ruble J, Carter
DC (2002) Biochem Biophys Res Commun 291:813–819
26. Nicoletti FP, Howes BD, Fittipaldi M, Fanali G, Fasano M, As-
cenzi P, Smulevich G (2008) J Am Chem Soc 130:11677–11688
27. Komatsu T, Matsukawa Y, Tsuchida E (2000) Bioconjug Chem
11:772–776
28. Monzani E, Bonafe B, Fallarini A, Redaelli C, Casella L,
Minchiotti L, Galliano M (2001) Biochim Biophys Acta
1547:302–312
29. Kamal JK, Behere DV (2002) J Biol Inorg Chem 7:273–283
30. Komatsu T, Ohmichi N, Nakagawa A, Zunszain PA, Curry S,
Tsuchida E (2005) J Am Chem Soc 127:15933–15942
31. Ascenzi P, Imperi F, Coletta M, Fasano M (2008) Biochem
Biophys Res Commun 369:686–691
32. Fasano M, Fanali G, Fesce R, Ascenzi P (2008) In: Bolognesi M,
di Prisco G, Verde C (eds) Dioxygen binding and sensing pro-
teins. Springer, Heidelberg, pp 121–131
33. Ascenzi P, di Masi A, Coletta M, Ciaccio C, Fanali G, Nicoletti FP,
Smulevich G, Fasano M (2009) J Biol Chem 284:31006–31017
34. Baroni S, Mattu M, Vannini A, Cipollone R, Aime S, Ascenzi P,
Fasano M (2001) Eur J Biochem 268:6214–6220
35. Mattu M, Vannini A, Coletta M, Fasano M, Ascenzi P (2001) J
Inorg Biochem 84:293–296
36. Fasano M, Mattu M, Coletta M, Ascenzi P (2002) J Inorg Bio-
chem 91:487–490
37. Monzani E, Curto M, Galliano M, Minchiotti L, Aime S, Baroni
S, Fasano M, Amoresano A, Salzano AM, Pucci P, Casella L
(2002) Biophys J 83:2248–2258
38. Fanali G, Fesce R, Agrati C, Ascenzi P, Fasano M (2005) FEBS J
272:4672–4683
39. Fanali G, Bocedi A, Ascenzi P, Fasano M (2007) FEBS J
274:4491–4502
40. Fanali G, De Sanctis G, Gioia M, Coletta M, Ascenzi P, Fasano
M (2009) J Biol Inorg Chem 14:209–217
41. Fanali G, Pariani G, Ascenzi P, Fasano M (2009) FEBS J
276:2241–2250
42. Kragh-Hansen U, Watanabe H, Nakajou K, Iwao Y, Otagiri M
(2006) J Mol Biol 363:702–712
43. Simard JR, Zunszain PA, Hamilton JA, Curry S (2006) J Mol
Biol 361:336–351
44. du Toit LC, Pillay V, Danckwerts MP (2006) Respir Res 7:118
45. Wyman J Jr (1964) Adv Protein Chem 19:223–286
46. Kharitonov VG, Sharma VS, Magde D, Koesling D (1997) Bio-
chemistry 36:6814–6818
47. Boffi A, Das TK, Della Longa S, Spagnolo C, Rousseau DL
(1999) Biophys J 77:1143–1149
48. Ascenzi P, Fasano M (2007) Biochem Biophys Res Commun
353:469–474
49. Notari S, Mancone C, Sergi M, Gullotta F, Bevilacqua N, Tem-
pestilli M, Urso R, Lauria FN, Pucillo LP, Tripodi M, Ascenzi P
(2010) IUBMB Life 62:387–393
50. Bohle DS, Glassbrenner PA, Hansert B (1996) Methods Enzymol
269:302–311
51. Koppenol WH, Kissner R, Beckman JS (1996) Methods Enzymol
269:296–302
52. Herold S, Exner M, Boccini F (2003) Chem Res Toxicol
16:390–402
53. Herold S, Kalinga S, Matsui T, Watanabe Y (2004) J Am Chem
Soc 126:6945–6955
54. Ascenzi P, Visca P (2008) Methods Enzymol 436:317–337
55. Goldstein S, Merenyi G (2008) Methods Enzymol 436:49–61
56. Goldstein S, Lind J, Merenyi G (2005) Chem Rev
105:2457–247057. Bocedi A, Notari S, Narciso P, Bolli A, Fasano M, Ascenzi P
(2004) IUBMB Life 56:609–614
58. Yang JD, Deng SX, Liu ZF, Kong L, Liu SP (2007) Lumines-
cence 22:559–566
59. Herold S, Kalinga S (2003) Biochemistry 42:14036–14046
60. Herold S, Matsui T, Watanabe Y (2001) J Am Chem Soc
123:4085–4086
61. Miranda KM, Espey MG, Wink DA (2001) Nitric Oxide 5:62–71
62. Ascenzi P, Bocedi A, Bolognesi M, Fabozzi G, Milani M, Visca
P (2006) Biochem Biophys Res Commun 339:450–456
63. Goodsell DS, Olson AJ (1990) Proteins 8:195–202
64. Goodsell DS, Morris GM, Olson AJ (1998) J Mol Recogn 9:1–5
65. Morris GM, Goodsell DS, Halliday RS, Huey R, Hart WE, Belew
RK, Olson AJ (1998) J Comput Chem 19:1639–1662
66. Metcalfe C, Macdonald IK, Murphy EJ, Brown KA, Raven EL,
Moody PC (2008) J Biol Chem 283:6193–6200
67. Campbell EA, Korzheva N, Mustaev A, Murakami K, Nair S,
Goldfarb A, Darst SA (2001) Cell 104:901–912
68. Maes V, Engelborghs Y, Hoebeke J, Maras Y, Vercruysse A
(1982) Mol Pharmacol 21:100–107
69. Fanali G, Rampoldi V, di Masi A, Bolli A, Lopiano L, Ascenzi P,
Fasano M (2010) IUBMB Life 62:371–376
70. Herold S, Fago A (2005) Comp Biochem Physiol A Mol Integr
Physiol 142:124–129
71. Ascenzi P, di Masi A, Sciorati C, Clementi E (2010) Biofactors
36:264–273
72. Fasano M, Curry S, Terreno E, Galliano M, Fanali G, Narciso P,
Notari S, Ascenzi P (2005) IUBMB Life 57:787–796
73. Muller-Eberhard U, Javid J, Liem HH, Hanstein A, Hanna M
(1968) Blood 32:811–815
74. Houin G, Beucler A, Richelet S, Brioude R, Lafaix C, Tillement
JP (1983) Ther Drug Monit 5:67–72
75. Delahunty T, Lee B, Conte JE (1998) J Chromatogr B Biomed
Sci Appl 705:323–329
76. Alvarez B, Radi R (2003) Amino Acids 25:295–311
77. Pfeiffer S, Gorren AC, Schmidt K, Werner ER, Hansert B, Bohle
DS, Mayer B (1997) J Biol Chem 272:3465–3470
78. Zunszain PA, Ghuman J, Komatsu T, Tsuchida E, Curry S (2003)
BMC Struct Biol 3:6
108 J Biol Inorg Chem (2011) 16:97–108
123
Copyright © 2022 FDOKUMEN