Kinetics and thermodynamics of human serum albumin adsorption on
10
Kinetics and thermodynamics of human serum albumin adsorption on silicon doped diamond like carbon Mukhtar H. Ahmed * , John A. Byrne, James McLaughlin Nanotechnology Integrated Bio-Engineering Centre, University of Ulster, Shore Road, BT37 0QB Belfast, United Kingdom highlights graphical abstract Diamond Like Carbon (DLC) and Sili- con doped DLC were synthesised and characterised. Si-DLC increases the hydrophobicity and decreases the surface free energy. Adsorption study using human serum albumin (HSA). The adsorbed amount of HSA in- creases with increasing of Silicon content DLC. Adsorption process follow pseudo first order and Freundlich adsorption isotherm. article info Article history: Received 19 August 2014 Received in revised form 2 December 2014 Accepted 19 January 2015 Available online 21 January 2015 Keywords: Biomaterials Chemical vapour deposition Adsorption Thermodynamic abstract To gain a better understanding of protein adsorption onto biomaterial surfaces is required for the control of biocompatibility and bioactivity. Various samples of diamond like carbon (DLC) and silicon-doped DLC were synthesised using plasma enhanced chemical vapour deposition (PECVD). The effects of surface morphology on the interaction of human serum albumin (HSA) with doped and undoped DLC films was investigated using spectroscopic ellipsometry (SE) and other surface analysis techniques. The results highlighted an increase in both contact angle and hydrophobicity with increasing silicon dopant levels. A reduction on the contact angle values. After adsorption of HSA, the films showed a reduction in the contact angle with a significant change in the cosD and this gap increased with increasing surface coverage of HSA. The adsorption kinetics of HSA were also investigated and revealed that the maximum adsorption occurred at pH 5.0 and the process involved chemisorption. The experimental isotherm data were analysed using the Langmuir and Freundlich models. The amount of HSA adsorbed increased with contact time and reached saturation after 30 min. The adsorption process was found to be pseudo first order with respect to the bulk con- centration and was dependent on both the concentration of protein and surface characteristics of the samples. The amount of adsorbed HSA was higher with higher levels of silicon doping of the DLC. Therefore, doping DLC may provide an approach to controlling the protein adsorption. © 2015 Elsevier B.V. All rights reserved. 1. Introduction Protein interaction is central to many biological processes including the interaction of cells with the surfaces of biomaterials. * Corresponding author. E-mail address: [email protected] (M.H. Ahmed). Contents lists available at ScienceDirect Materials Chemistry and Physics journal homepage: www.elsevier.com/locate/matchemphys http://dx.doi.org/10.1016/j.matchemphys.2015.01.048 0254-0584/© 2015 Elsevier B.V. All rights reserved. Materials Chemistry and Physics 154 (2015) 84e93
Transcript of Kinetics and thermodynamics of human serum albumin adsorption on

lable at ScienceDirect
Materials Chemistry and Physics 154 (2015) 84e93
Contents lists avai
Materials Chemistry and Physics
journal homepage: www.elsevier .com/locate/matchemphys
Kinetics and thermodynamics of human serum albumin adsorption onsilicon doped diamond like carbon
Mukhtar H. Ahmed*, John A. Byrne, James McLaughlinNanotechnology Integrated Bio-Engineering Centre, University of Ulster, Shore Road, BT37 0QB Belfast, United Kingdom
h i g h l i g h t s
* Corresponding author.E-mail address: [email protected] (M.H
http://dx.doi.org/10.1016/j.matchemphys.2015.01.0480254-0584/© 2015 Elsevier B.V. All rights reserved.
g r a p h i c a l a b s t r a c t
� Diamond Like Carbon (DLC) and Sili-con doped DLC were synthesised andcharacterised.
� Si-DLC increases the hydrophobicityand decreases the surface freeenergy.
� Adsorption study using humanserum albumin (HSA).
� The adsorbed amount of HSA in-creases with increasing of Siliconcontent DLC.
� Adsorption process follow pseudofirst order and Freundlich adsorptionisotherm.
a r t i c l e i n f o
Article history:Received 19 August 2014Received in revised form2 December 2014Accepted 19 January 2015Available online 21 January 2015
Keywords:BiomaterialsChemical vapour depositionAdsorptionThermodynamic
a b s t r a c t
To gain a better understanding of protein adsorption onto biomaterial surfaces is required for the controlof biocompatibility and bioactivity. Various samples of diamond like carbon (DLC) and silicon-doped DLCwere synthesised using plasma enhanced chemical vapour deposition (PECVD). The effects of surfacemorphology on the interaction of human serum albumin (HSA) with doped and undoped DLC films wasinvestigated using spectroscopic ellipsometry (SE) and other surface analysis techniques. The resultshighlighted an increase in both contact angle and hydrophobicity with increasing silicon dopant levels. Areduction on the contact angle values.
After adsorption of HSA, the films showed a reduction in the contact angle with a significant change inthe cosD and this gap increased with increasing surface coverage of HSA. The adsorption kinetics of HSAwere also investigated and revealed that the maximum adsorption occurred at pH 5.0 and the processinvolved chemisorption. The experimental isotherm data were analysed using the Langmuir andFreundlich models. The amount of HSA adsorbed increased with contact time and reached saturationafter 30 min. The adsorption process was found to be pseudo first order with respect to the bulk con-centration and was dependent on both the concentration of protein and surface characteristics of thesamples. The amount of adsorbed HSA was higher with higher levels of silicon doping of the DLC.Therefore, doping DLC may provide an approach to controlling the protein adsorption.
© 2015 Elsevier B.V. All rights reserved.
. Ahmed).
1. Introduction
Protein interaction is central to many biological processesincluding the interaction of cells with the surfaces of biomaterials.

Table 1Process conditions for DLC and Si-DLC.
Parameters Samples
DLC S-1 S-2 S-3
rf. Power (Watt) 102 106 116 123Pressure in Process � 10�2 (Torr) 0.77 0.91 1.28 1.71TMS (sccm) 0 2 5 10Film thickness (nm) 163 ± 16 170 ± 15 194 ± 14 213 ± 18
(rf): radio frequency, (W): watt, (TMS): Tetramethylsilane, (sccm): standard centi-metre cube per minute, (nm): nanometre. Bias voltage: 400 V, deposition time:5 min, Initial chamber pressure: ~5 � 10�6 Torr; argon to acetelene gas (10:20)sccm, Film thicknesses taken from spectroscopic ellipsometry (SE), (±) is SD forn ¼ 7 samples.
M.H. Ahmed et al. / Materials Chemistry and Physics 154 (2015) 84e93 85
The adsorption of proteins on surfaces is an important fundamentalproblem involving interplay between electrostatic, van der Waals,steric and solvation interactions that result in very large competingenergy scales and very long time scales. Furthermore, an under-standing of protein adsorption is important in the biomedical fieldfor drug delivery, biomaterials, extracorporeal therapy and solid-phase diagnostics [1].
The nature of the biomaterial and the protein affects theadsorption process. The chemical and physical properties of thesurface such as the elemental composition, functional groups andsurface energy are very important and play a role in enhancing ordecreasing the adsorption of proteins or biological compounds ofthe implant.
Many different surface analytical techniques have been appliedto study adsorption kinetics of proteins on a variety material [2e4].Although the rates of adsorption of proteins on the surfaces arewellknown, the conformational changes occurring upon adsorption onthe surfaces are not fully understood.
Diamond-like carbon (DLC) is an attractive biomaterial forcoating human implantable devices [5,6], due to its unique com-bination of desirable properties including chemical inertness, highdensity, hemo-compatibility and low coefficient of friction [7].Comparative studies showed that DLC has better biocompatibilityand wear resistance than stainless steel, Poly-methyl mehtacrylate(PMMA) and cobalt chrome alloys [8e10]. Doping DLC with nitro-gen, fluorine, titanium and silicon has been used to enhance theeffectiveness of DLC as a biologically compatible coating [11e14].
Silicon doping has been reported to have a significant effect onthe chemical stability of DLC [15]. Si-DLC overcomes some of thedrawbacks mentioned, including low intrinsic compressive stressand mechanical resistance [16], which are beneficial for biomedicalapplications. It has previously been shown that the silicon incor-poration can improve the adhesion between DLC films and theirsubstrates [17,18], which indicates a good degree of biocompati-bility for DLC coatings.
Improvements in blood compatibility with silicon doped DLCfilm where a decrease of inflammatory reactions was observedcompared to undoped DLC [19].
The aim of this work is to investigate the adsorption of humanserum albumin (molecular weight ~66,550, isoelectric point PI ~4.7)on doped and undoped DLC prepared by plasma enhanced chem-ical vapour deposition (PECVD).
2. Experimental
2.1. Film preparation and modification
Before deposition of the films, coupons of silicon 1.5 � 1.5 cm2
were cleaned using ultrasound in acetone and isopropanol (1:1) for5 min, followed by washing with distilled water, and then driedusing nitrogen gas.
DLC and Si-DLC were deposited on the silicon by the radio fre-quency (RF) 13.56 MHz PECVD using a Diavac model 320PA (ACMLtd.), with negative electrode self-bias voltages set at 400 V. Theexperimental equipment had been described in detail previously[4]. The cleaned substrates were placed in the deposition chamberon top of a water-cooled electrode driven by an RF power supply.
When the chamber pressure reached ~5 � 10�6 Torr, the glowdischarge argon plasma (60 cm3/min) was used to clean substrateand make the surface rough and to deposit evaporated coatingmaterial. In order to obtain a smooth, compact and uniform coatingof DLC films [20], the deposition was performed under thefollowing conditions: C2H2 was used as source gas, and argon (Ar)with tetramethylsilane (TMS) (Si(CH3)4 [%99.8 SigmaeAldrich]were used as dopant gas. The (Ar:C2H2) flow ratio was fixed at
(10:20) standard cubic centimetre (sccm), and the deposition timewas fixed for 5 min. For Si-DLC, the various doping concentrationsof silicon were achieved using different ratios of Ar:TMS toAr:CH2CH2 were used. Detailed parameters are given in Table 1.
2.2. Surface characterisation
2.2.1. Spectroscopic ellipsometryThe dielectric constant and film thickness of DLC and Si-DLC
films were investigated before and after exposure to HSA using aSOPRA GES-5E spectroscopic ellipsometery, in the photon energyrange 1.25e7.75 eVwith 0.05 eV steps. A system has been describedin our previous work [12]. The laser wavelength (l) was fixed at532 nm, and the angle of incidence 4 was set to 68.0�. A singlebeam of polarized light is incident on the surface and the polari-zation state of the light modified after reflection. This change in thepolarization state is recorded in terms of the ellipsometric angles,Psi (J) and delta (D) which are related to the optical and structuralproperties of the samples and defined by:
tanJ expðiDÞ ¼ Rp�Rs: (1)
Rp and Rs are the complex Fresnel reflection coefficients of theparallel and perpendicular polarized light, respectively. Thedielectric constant (ε) of the films can be obtained by the followingequation:
ε ¼ sin2qh1þ tan2q
nð1� pÞ2
.ð1þ pÞ2
oi(2)
where (q) is angle of incidence and p is the complex reflectanceratio Rp/Rs [21]. The film thickness calculations were carried outusing the installed (sopra) software. The silicon substrates wereplaced on the polar laser light to measure the basic thickness, fol-lowed the coated samples of DLC and Si-DLC before and afterexposure to HSA; and then after the polar light parameters wereobtained.
2.2.2. Contact angle and surface wettabilityA goniometer KSV CAM 200 system was used to perform the
contact angle (q) measurements for samples before and afteradsorption of HSA. The contact angle was processed by an imageanalysis system, which calculated both the left and right contactangles from the shape of the drop. Surface free energy of doped DLCwas assessed by the Owens-Wendt-Rabel-Kaelble (OWRK) methodusing as testing liquids with known surface tension parameterssuch as: distilled water (H2O), diiodomethane (C2I2) (from Sigma-eAldrich) and ethylene glycol C2H4(OH)2 (from SigmaeAldrich).The polar and dispersive components of the surface tension of theliquids were taken from the literature [22], the details are given in(Table 2). Drops of 5 mL of solvents were generated with a

Table 2Surface tension parameters for solvents taken from reference [22].
Solvent gs mJ/m2 gDs mJ/m2 gPs mJ/m2 gþ mJ/m2 g� mJ/m2
H2O 72.8 21.8 51.0 25.5 25.5CH2I2 50.8 50.8 0 0 0C2H4(OH)2 48.0 29.0 19.0 1.9 47.0
M.H. Ahmed et al. / Materials Chemistry and Physics 154 (2015) 84e9386
micrometric syringe and deposited on the substrate surfaces. Fivedifferent locations on each of the sample surfaces were chosen, andthe values averaged.
The surface energy was obtained using contact-angle goniom-etry. The solideliquid interfacial tension of solid surfaces wasstudied using contact angle measurements using a technique forthe investigation of the characteristics of solid surfaces. A smallvalue of (q�) is correspondent to a high surface energy, whilst alarge value of (q�) is correspondent to low surface energy [23].
2.2.2.1. Theory. The contact angle (q) of a liquid droplet resting on asolid surface can be expressed by Young's equation (Eq. (3)):
gL$Cosq ¼ gS � gSL (3)
where gL is the known surface tension of the liquid, q is the contactangle, gSL is the solid/liquid interfacial energy. In order to obtain thesolid surface free energy gS, gSL has to be determined. According tothe Dupr�e relation, the thermodynamic work of adhesion (WSL) canbe given by Eq. (4);
WSL ¼ gS þ gL � gSL (4)
The combining of both Young and Dupr�e equations gives:
WSL ¼ gLð1þ CosqÞ (5)
On the other hand, Israelachvili et al. [24] defined the work ofadhesion (WSL) between the solid and the liquid phase as:
WSL ¼ 2ffiffiffiffiffiffiffiffiffiffigSgL
p(6)
In general, the surface energy gl of liquid and solid phase can beexpressed by the addition of the two components; dispersioncomponent gd1 and polar component gp1.
gS ¼ gdS þ gpS (7)
gL ¼ gdL þ gpL (8)
Based on electronic interactions, the dispersive component ofthe surface energy is described by Van-der Waals forces, and thepolar component represented as an interaction of the surfaces,which is mainly based on dipoles.
Combining the relationships of Eqs. (6)e(8), an interfacial en-ergetic state equation between the liquid and solid phase isobtained:
gLð1þ CosqÞ ¼ 2� ffiffiffiffiffiffi
gdS
q$
ffiffiffiffiffiffigdL
q �þ 2
� ffiffiffiffiffiffigpS
q$
ffiffiffiffiffiffigPL
q �(9)
The measured values of g1ð1þ COSqÞ=2ðgd1Þ1=2 were plottedagainst ðgp1=gd1Þ1=2 and a linear fitting was carried. gds and g
ps were
obtained from the slope and intercept respectively.In order to determine polar and apolar components, such as
acid-base polar component and Lifshiz van der Waals (gLW) ofsurface energy were calculated using the Van Oss equation [25]. Thesurface free energy (gS) is the sum of a Lifshitzevan-der-Waals non-polar component gLWS (corresponding to gdS) and a Lewis acidebase
polar component gABS (corresponding to gpS):
g ¼ gLW þ gAB (10)
The acid-base polar component gAB can further be subdividedusing specific subcomponent; an electron acceptor (gþ) and elec-tron donor (g�), which is illustrated in Eq. (11):
gAB ¼ 2� ffiffiffiffiffiffi
g�p
$ffiffiffiffiffiffigþ
p �(11)
The solid/liquid interfacial energy is then given by the followingequation:
gSL ¼ gS þ gL � 2�� ffiffiffiffiffiffiffiffiffiffiffiffiffiffiffiffiffiffiffiffi
gLWS $gLWL
q �þ� ffiffiffiffiffiffiffiffiffiffiffiffi
gþS g�L
q �þ� ffiffiffiffiffiffiffiffiffiffiffiffi
g�S gþL
q ��
(12)
Combining the Eqs (3), (4) and (12), a relationship between themeasured contact angle and the solid and liquid surface free energyterms can be obtained:
gLð1þ CosqÞ ¼ 2ffiffiffiffiffiffiffiffiffiffiffiffiffiffiffiffiffiffiffiffigLWS $gLWL
qþ 2
ffiffiffiffiffiffiffiffiffiffiffiffigþS g
�L
qþ 2
ffiffiffiffiffiffiffiffiffiffiffiffig�S g
þL
q(13)
In order to determine the surface free energy components wehave chosen three liquids with known surface tension components,the details are given in Table 2.
The free energy of aggregation (DGsws) is the sum of the Lif-schitzeVan der Waals interaction free energy and polar interactionfree energy which can be calculated by the following equation [26]:
DGsws ¼ �2�� ffiffiffiffiffiffiffiffiffi
gLWS
q ��� ffiffiffiffiffiffiffiffiffi
gLWL
q ��2� 4
�� ffiffiffiffiffiffiffiffiffiffiffiffiffiffig�S $g
þS
q �
þ� ffiffiffiffiffiffiffiffiffiffiffiffiffiffi
g�L $gþL
q ��� ffiffiffiffiffiffiffiffiffiffiffiffiffiffi
gþS $g�L
q ��� ffiffiffiffiffiffiffiffiffiffiffiffiffiffi
g�S $gþL
q ��(14)
Whereas DGsws is the free energy of interaction between thesurface (s) immersed in water (w).
2.3. Adsorption studies
HSA solution (100 mg/ml) was prepared in the 0.01 M pH 7.4phosphate buffer saline (PBS tablets; from SigmaeAldrich). The DLCcoated samples were immersed in 10 ml of the HAS solutions. Thesample was incubated for 30 min at37 ± 1 �C. At the end of theadsorption period, the samples were rinsed and washed usingdistilled water and then dried. The HSA layer thickness was esti-mated using spectroscopic ellipsometry. The residual HSA con-centrations were determined by absorbance at l 280 nm, using aspectrophotometer (Perkin Elmer Lambda 11 with PC controlUVeVis Win-lab software 2.0). The amount of adsorption per unitsurface area was determined using the mass balance of the protein.Similar experiments were performed for different initial concen-trations of HSA solutions of (0.1, 0.25, 0.5, 0.75, 1.0, 2.5 and 5.0) mg/ml.
The effect of pH on the adsorption was studied using differentbuffer solutions ranging from pH 4 to 10; potassium hydrogenphthalate (C8H5O4 K) for pH 4 and 5, potassium phosphate(K2HPO4/KH2PO4) for pH 6e8, sodium tetra-borate(Na2B4O7.10H2O) for pH 9 and sodium bicarbonate (NaHCO3) forpH 10. All the chemicals used were purchased fromSigmaeAldrich).
The effect of temperature on the adsorption was studied at 20,25, 30, 35, 40, 45, 50 �C using thermostatic shaker bath.

M.H. Ahmed et al. / Materials Chemistry and Physics 154 (2015) 84e93 87
3. Results and discussion
3.1. Spectroscopic ellipsometry (SE)
The relative dielectric function (ε) depends on the polarizabilityof a material under the influence of an external electric field. Thepolarizability is the summation of the electronic, ionic and dipolarcomponents [27]. The electronic polarizability refers to the oscil-lation of electrons in chemical bonds whilst the ionic and dipolarpolarizabilities constitute the nuclear response.
The dielectric function (ε) spectrum of doped and undoped DLCobtained from the fitting procedure of ellipsometric measurementsis shown in Fig. 1. The results of this study show a strong peaklocated at 2.05 eV, with a broad band at 3.15 eV and 4.3 eV, whichare related to the p / p* transition due graphitic carbon and sp2
hybridisation [12]. The band at 5.15 eV is related with the combinedelectronic absorption from both sp2 and sp3 configurations [28].
In case of doped silicon, the p / p* transition band wasobserved at 1.95 eV and this peak position is shifted towards lowerenergy with increasing silicon content. The broad bands of dielec-tric function (ε) showed at 4.25 eV and 4.9 eV, which is returned tothe direct and indirect of sp2 and sp3 hybridisation, respectively,due to the presence of two different contributions of inter bandelectronic transitions, such as the p / p* correlated to sp2
hybridisation and s/ s* corresponding to both sp2 and sp3 carbonhybridization. Fig. 1 also shows that both the dielectric function (ε)and the area under the curve are slightly decreased with increasingsilicon content. These results demonstrate that change in thedensity of states at the Fermi level, could affect on the filmcomposition [29]. These findings correspond with results of ourprevious studies, suggesting that incorporation of silicon into DLCfilms tends to increase sp3 hybridisation fraction [4].
By solving themultilayer model using the Sopra system, the filmthicknesses of DLC and Si-DLC samples were obtained. The undo-ped DLC film thickness was determined to be 163 nm. The additionof silicon to the films lead to an increase in the film thickness, i.e.170, 194 and 213 nm for TMS flow rates of 2, 5 and 10 sccmrespectively (Table 1). The increasing film thickness with increasingamounts of silicon doping may be related to the atomic radius; dueto silicon has larger atomic radius than carbon [13].
The ellipsometry spectra of the doped and un-doped DLC films
Fig. 1. Spectroscopic ellipsometry (SE) of doped and undoped DLC samples.
after protein adsorption have been performed. The data shows thatthe phase shift value (D) is very sensitive to changes in the filmthickness, whereas the change of amplitude ratio (J) is very small(Fig. 2). Following the adhesion of HSA, the surface of samplesexhibited a dramatic change in cosD value and this divergence in-creases with increasing the surface coverage of HSA layers on sur-face of samples. This result is in agreement with those of previousstudies that reported a significant decrease in the (D) value andslight increase of (J) value, with increasing surface coverage ofprotein layers on SiO2 [30].
The spectroscopic ellipsometry (SE) is very sensitive to thepresence of surface layers on the order of just a fraction of ananometre [31]. Sensitivity primarily comes from changes in (D).On the other hand, the upper thickness limit for spectroscopicellipsometry measurements depends on the measurement wave-lengths. In this study the light source was performed as a visiblewavelength, which is preferred for film thickness up to 5 microns.The layer thickness of the adsorbed HSA on the samples is showedin Fig. 3. For the undoped DLC, the HSA layer was around 12.6 nm,whereas in case of silicon doped samples, the layer thickness ofadsorbed HSA were 14.1, 15.7 and 19.4 nm, for S-1, S-2 and S-3,respectively. These differences might partly be explained by thesurface composition and surface roughness of the films [32].Furthermore, this finding is consistent with our previous studywhich investigated that the root mean square (Rq) values of the Si-DLC films increased from about 0.49 nm to 1.04 nmwith increasedsilicon flow rate from 3 to 7 sccm [13].
3.2. Contact angle and surface energy
Fig. 4 represents the mean values of water contact angles (q�) onthe DLC and Si-DLC surfaces with corresponding standard de-viations. The water contact angle of DLC surface was found to be79.3� ± 1.4�. The surface can be considered as a mildly hydrophobic.The data obtained agrees well with our previous results [11]. For Si-DLC the values of H2O (q) are closely related to the atomic con-centration ratio of silicon to carbon. The water contact angleincreased with increasing silicon content in the DLC. The resultsshow that the H2O (q) of S-1, S-2 and S-3 is 80.1�, 82.7� and 86.4�,respectively (Fig. 4). The Si-DLC surfaces are more hydrophobicthan undoped DLC [33]. The surface energy (gs) of the samplessynthesized were obtained and the value was around 41.7 mJ/m2
Fig. 2. Spectroscopic ellipsometry (SE) of adsorbed HSA on DLC, S-1, S-2 and S-3.
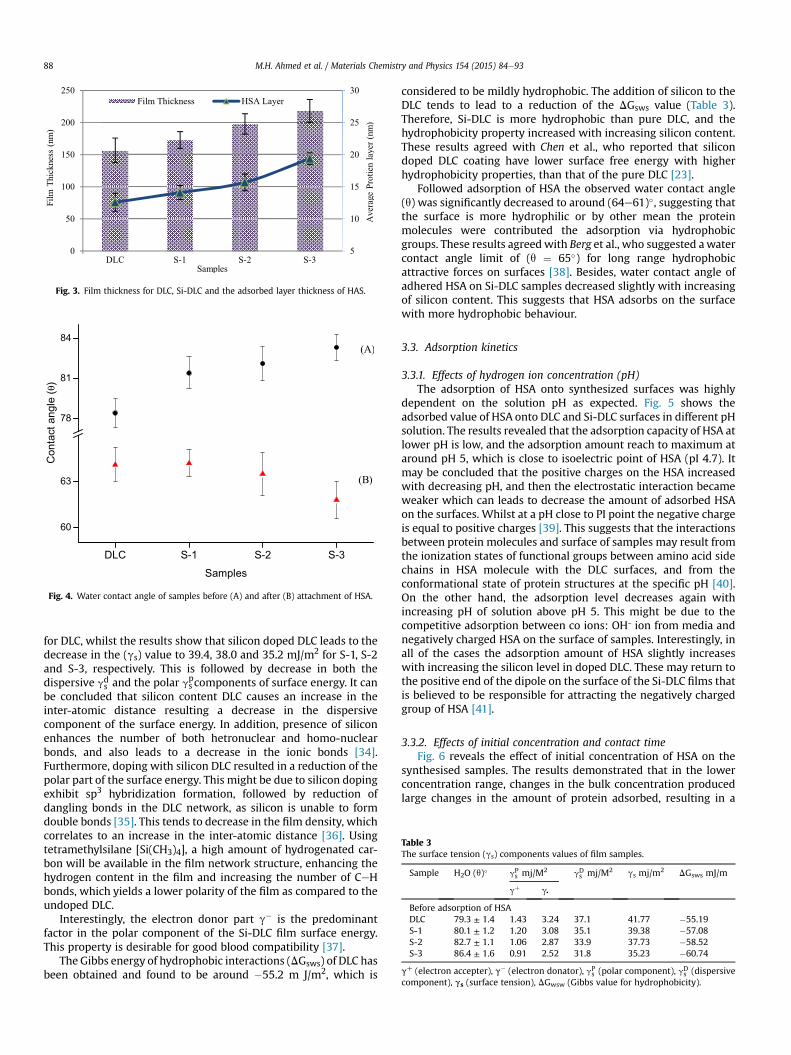
Fig. 3. Film thickness for DLC, Si-DLC and the adsorbed layer thickness of HAS.
Fig. 4. Water contact angle of samples before (A) and after (B) attachment of HSA.
Table 3The surface tension (gs) components values of film samples.
Sample H2O (q)� gPs mj/M2 gDs mj/M2 gs mj/m2 DGsws mJ/m
gþ g
Before adsorption of HSADLC 79.3 ± 1.4 1.43 3.24 37.1 41.77 �55.19S-1 80.1 ± 1.2 1.20 3.08 35.1 39.38 �57.08S-2 82.7 ± 1.1 1.06 2.87 33.9 37.73 �58.52S-3 86.4 ± 1.6 0.91 2.52 31.8 35.23 �60.74
gþ (electron accepter), g� (electron donator), gPs (polar component), gDs (dispersivecomponent), g (surface tension), DG (Gibbs value for hydrophobicity).
M.H. Ahmed et al. / Materials Chemistry and Physics 154 (2015) 84e9388
for DLC, whilst the results show that silicon doped DLC leads to thedecrease in the (gs) value to 39.4, 38.0 and 35.2 mJ/m2 for S-1, S-2and S-3, respectively. This is followed by decrease in both thedispersive gds and the polar gps components of surface energy. It canbe concluded that silicon content DLC causes an increase in theinter-atomic distance resulting a decrease in the dispersivecomponent of the surface energy. In addition, presence of siliconenhances the number of both hetronuclear and homo-nuclearbonds, and also leads to a decrease in the ionic bonds [34].Furthermore, doping with silicon DLC resulted in a reduction of thepolar part of the surface energy. This might be due to silicon dopingexhibit sp3 hybridization formation, followed by reduction ofdangling bonds in the DLC network, as silicon is unable to formdouble bonds [35]. This tends to decrease in the film density, whichcorrelates to an increase in the inter-atomic distance [36]. Usingtetramethylsilane [Si(CH3)4], a high amount of hydrogenated car-bon will be available in the film network structure, enhancing thehydrogen content in the film and increasing the number of CeHbonds, which yields a lower polarity of the film as compared to theundoped DLC.
Interestingly, the electron donor part g� is the predominantfactor in the polar component of the Si-DLC film surface energy.This property is desirable for good blood compatibility [37].
The Gibbs energy of hydrophobic interactions (DGsws) of DLC hasbeen obtained and found to be around �55.2 m J/m2, which is
considered to be mildly hydrophobic. The addition of silicon to theDLC tends to lead to a reduction of the DGsws value (Table 3).Therefore, Si-DLC is more hydrophobic than pure DLC, and thehydrophobicity property increased with increasing silicon content.These results agreed with Chen et al., who reported that silicondoped DLC coating have lower surface free energy with higherhydrophobicity properties, than that of the pure DLC [23].
Followed adsorption of HSA the observed water contact angle(q) was significantly decreased to around (64e61)�, suggesting thatthe surface is more hydrophilic or by other mean the proteinmolecules were contributed the adsorption via hydrophobicgroups. These results agreedwith Berg et al., who suggested awatercontact angle limit of (q ¼ 65�) for long range hydrophobicattractive forces on surfaces [38]. Besides, water contact angle ofadhered HSA on Si-DLC samples decreased slightly with increasingof silicon content. This suggests that HSA adsorbs on the surfacewith more hydrophobic behaviour.
3.3. Adsorption kinetics
3.3.1. Effects of hydrogen ion concentration (pH)The adsorption of HSA onto synthesized surfaces was highly
dependent on the solution pH as expected. Fig. 5 shows theadsorbed value of HSA onto DLC and Si-DLC surfaces in different pHsolution. The results revealed that the adsorption capacity of HSA atlower pH is low, and the adsorption amount reach to maximum ataround pH 5, which is close to isoelectric point of HSA (pI 4.7). Itmay be concluded that the positive charges on the HSA increasedwith decreasing pH, and then the electrostatic interaction becameweaker which can leads to decrease the amount of adsorbed HSAon the surfaces. Whilst at a pH close to PI point the negative chargeis equal to positive charges [39]. This suggests that the interactionsbetween protein molecules and surface of samples may result fromthe ionization states of functional groups between amino acid sidechains in HSA molecule with the DLC surfaces, and from theconformational state of protein structures at the specific pH [40].On the other hand, the adsorption level decreases again withincreasing pH of solution above pH 5. This might be due to thecompetitive adsorption between co ions: OH⁻ ion from media andnegatively charged HSA on the surface of samples. Interestingly, inall of the cases the adsorption amount of HSA slightly increaseswith increasing the silicon level in doped DLC. These may return tothe positive end of the dipole on the surface of the Si-DLC films thatis believed to be responsible for attracting the negatively chargedgroup of HSA [41].
3.3.2. Effects of initial concentration and contact timeFig. 6 reveals the effect of initial concentration of HSA on the
synthesised samples. The results demonstrated that in the lowerconcentration range, changes in the bulk concentration producedlarge changes in the amount of protein adsorbed, resulting in a
s wsw
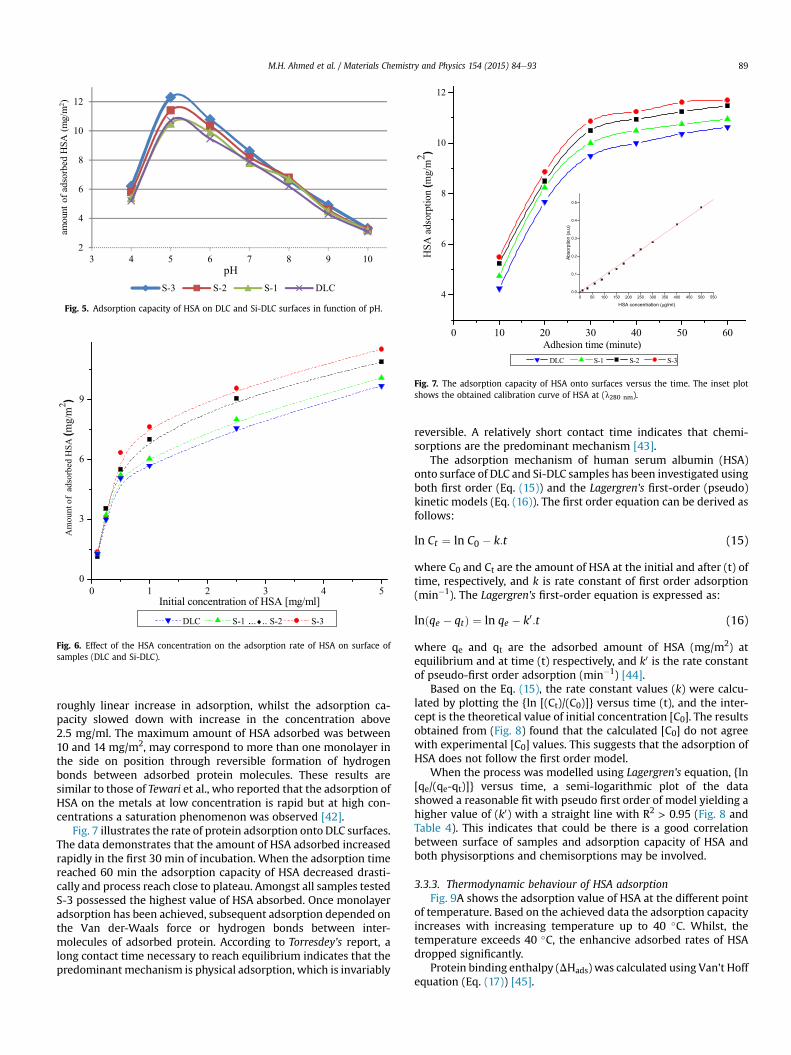
Fig. 5. Adsorption capacity of HSA on DLC and Si-DLC surfaces in function of pH.
Fig. 6. Effect of the HSA concentration on the adsorption rate of HSA on surface ofsamples (DLC and Si-DLC).
Fig. 7. The adsorption capacity of HSA onto surfaces versus the time. The inset plotshows the obtained calibration curve of HSA at (l280 nm).
M.H. Ahmed et al. / Materials Chemistry and Physics 154 (2015) 84e93 89
roughly linear increase in adsorption, whilst the adsorption ca-pacity slowed down with increase in the concentration above2.5 mg/ml. The maximum amount of HSA adsorbed was between10 and 14 mg/m2, may correspond to more than one monolayer inthe side on position through reversible formation of hydrogenbonds between adsorbed protein molecules. These results aresimilar to those of Tewari et al., who reported that the adsorption ofHSA on the metals at low concentration is rapid but at high con-centrations a saturation phenomenon was observed [42].
Fig. 7 illustrates the rate of protein adsorption onto DLC surfaces.The data demonstrates that the amount of HSA adsorbed increasedrapidly in the first 30 min of incubation. When the adsorption timereached 60 min the adsorption capacity of HSA decreased drasti-cally and process reach close to plateau. Amongst all samples testedS-3 possessed the highest value of HSA absorbed. Once monolayeradsorption has been achieved, subsequent adsorption depended onthe Van der-Waals force or hydrogen bonds between inter-molecules of adsorbed protein. According to Torresdey's report, along contact time necessary to reach equilibrium indicates that thepredominantmechanism is physical adsorption, which is invariably
reversible. A relatively short contact time indicates that chemi-sorptions are the predominant mechanism [43].
The adsorption mechanism of human serum albumin (HSA)onto surface of DLC and Si-DLC samples has been investigated usingboth first order (Eq. (15)) and the Lagergren's first-order (pseudo)kinetic models (Eq. (16)). The first order equation can be derived asfollows:
ln Ct ¼ ln C0 � k:t (15)
where C0 and Ct are the amount of HSA at the initial and after (t) oftime, respectively, and k is rate constant of first order adsorption(min�1). The Lagergren's first-order equation is expressed as:
lnðqe � qtÞ ¼ ln qe � k0:t (16)
where qe and qt are the adsorbed amount of HSA (mg/m2) atequilibrium and at time (t) respectively, and k0 is the rate constantof pseudo-first order adsorption (min�1) [44].
Based on the Eq. (15), the rate constant values (k) were calcu-lated by plotting the {ln [(Ct)/(C0)]} versus time (t), and the inter-cept is the theoretical value of initial concentration [C0]. The resultsobtained from (Fig. 8) found that the calculated [C0] do not agreewith experimental [C0] values. This suggests that the adsorption ofHSA does not follow the first order model.
When the process was modelled using Lagergren's equation, {ln[qe/(qe-qt)]} versus time, a semi-logarithmic plot of the datashowed a reasonable fit with pseudo first order of model yielding ahigher value of (k0) with a straight line with R2 > 0.95 (Fig. 8 andTable 4). This indicates that could be there is a good correlationbetween surface of samples and adsorption capacity of HSA andboth physisorptions and chemisorptions may be involved.
3.3.3. Thermodynamic behaviour of HSA adsorptionFig. 9A shows the adsorption value of HSA at the different point
of temperature. Based on the achieved data the adsorption capacityincreases with increasing temperature up to 40 �C. Whilst, thetemperature exceeds 40 �C, the enhancive adsorbed rates of HSAdropped significantly.
Protein binding enthalpy (DHads) was calculated using Van't Hoffequation (Eq. (17)) [45].
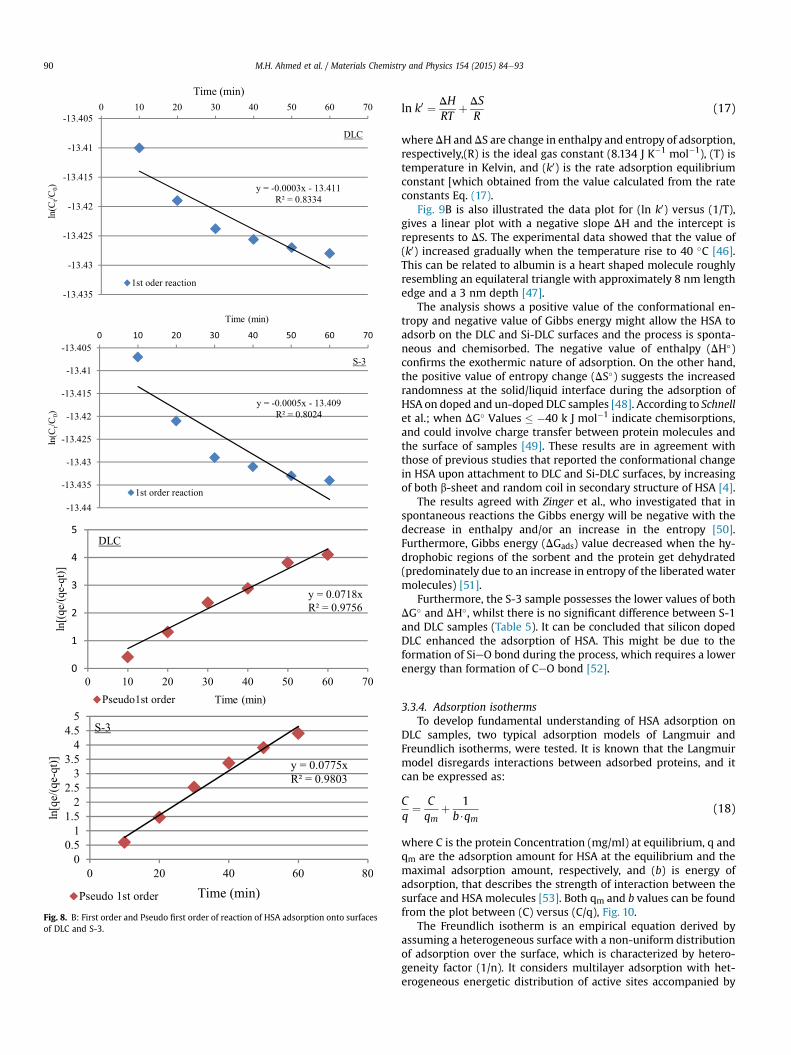
Fig. 8. B: First order and Pseudo first order of reaction of HSA adsorption onto surfacesof DLC and S-3.
M.H. Ahmed et al. / Materials Chemistry and Physics 154 (2015) 84e9390
ln k0 ¼ DHRT
þ DSR
(17)
whereDH and DS are change in enthalpy and entropy of adsorption,respectively,(R) is the ideal gas constant (8.134 J K�1 mol�1), (T) istemperature in Kelvin, and (k0) is the rate adsorption equilibriumconstant [which obtained from the value calculated from the rateconstants Eq. (17).
Fig. 9B is also illustrated the data plot for (ln k0) versus (1/T),gives a linear plot with a negative slope DH and the intercept isrepresents to DS. The experimental data showed that the value of(k0) increased gradually when the temperature rise to 40 �C [46].This can be related to albumin is a heart shaped molecule roughlyresembling an equilateral triangle with approximately 8 nm lengthedge and a 3 nm depth [47].
The analysis shows a positive value of the conformational en-tropy and negative value of Gibbs energy might allow the HSA toadsorb on the DLC and Si-DLC surfaces and the process is sponta-neous and chemisorbed. The negative value of enthalpy (DH�)confirms the exothermic nature of adsorption. On the other hand,the positive value of entropy change (DS�) suggests the increasedrandomness at the solid/liquid interface during the adsorption ofHSA on doped and un-doped DLC samples [48]. According to Schnellet al.; when DG� Values � �40 k J mol�1 indicate chemisorptions,and could involve charge transfer between protein molecules andthe surface of samples [49]. These results are in agreement withthose of previous studies that reported the conformational changein HSA upon attachment to DLC and Si-DLC surfaces, by increasingof both b-sheet and random coil in secondary structure of HSA [4].
The results agreed with Zinger et al., who investigated that inspontaneous reactions the Gibbs energy will be negative with thedecrease in enthalpy and/or an increase in the entropy [50].Furthermore, Gibbs energy (DGads) value decreased when the hy-drophobic regions of the sorbent and the protein get dehydrated(predominately due to an increase in entropy of the liberated watermolecules) [51].
Furthermore, the S-3 sample possesses the lower values of bothDG� and DH�, whilst there is no significant difference between S-1and DLC samples (Table 5). It can be concluded that silicon dopedDLC enhanced the adsorption of HSA. This might be due to theformation of SieO bond during the process, which requires a lowerenergy than formation of CeO bond [52].
3.3.4. Adsorption isothermsTo develop fundamental understanding of HSA adsorption on
DLC samples, two typical adsorption models of Langmuir andFreundlich isotherms, were tested. It is known that the Langmuirmodel disregards interactions between adsorbed proteins, and itcan be expressed as:
Cq¼ C
qmþ 1b$qm
(18)
where C is the protein Concentration (mg/ml) at equilibrium, q andqm are the adsorption amount for HSA at the equilibrium and themaximal adsorption amount, respectively, and (b) is energy ofadsorption, that describes the strength of interaction between thesurface and HSA molecules [53]. Both qm and b values can be foundfrom the plot between (C) versus (C/q), Fig. 10.
The Freundlich isotherm is an empirical equation derived byassuming a heterogeneous surface with a non-uniform distributionof adsorption over the surface, which is characterized by hetero-geneity factor (1/n). It considers multilayer adsorption with het-erogeneous energetic distribution of active sites accompanied by

Table 4First and Pseudo first order rate constant (K) and theoretical initial concentrationwith (R2) which obtained from kinetic plot.
Samples Pseudo first order First order
k0 (min�1) (x10�2) R2 k (min�1) (x10�3) R2
DLC 3.62 0.9957 6.6 0.972S-1 4.05 0.9926 6.8 0.973S-2 2.82 0.987 5.1 0.98S-3 2.12 0.987 4.3 0.971
Co; initial concentration of HSA, k′; pseudo-first order rate constant, k; first orderrate constant, R2; linear regression.
Fig. 9. The effect of temperature on the adsorption process of HSA.
Table 5Activation energy (DG�), enthalpy (DH) and entropy change (DS) for adsorption ofHSA onto surface of samples, with compare the obtained.
Samples DG� k J mol�1 DH at (37 �C) k J mol�1 DS K J mol�1 K�1
DLC �291.1 �42.015 0.656S-1 �281.05 �40.53 0.635S-2 �309.75 �45.015 0.688S-3 �352.8 �52.125 0.757
Fig. 10. Langmuir isotherm for adsorption of HSA onto surface of samples.
M.H. Ahmed et al. / Materials Chemistry and Physics 154 (2015) 84e93 91
interactions between adsorbed molecules [54]. The Freundlichisotherm model is given by the following equation:
ln q ¼ ln KF þ1nln C (19)
where, q and C are the adsorbed amount and concentration ofprotein at certain time, respectively. KF is the capacity of theadsorption, and (n) is the intensity of adsorption [49]. Both KF and(n) values were obtained from the intercept and slope of plottingLnq versus LnC (Fig. 11).
The values of qm and b with KF and n are shown in (Table 6)which were indicated by the regression coefficient values (R2), theexperimental data for all surfaces tested, showed a higher corre-lation fit for Freundlich model than for Langmuir adsorption iso-therms. Based on results obtained from initial concentration ofHSA, the increase in adsorption at higher concentration does notstop entirely, but presents a slow rise. This is good evidence thatthis type of adsorption behaviour is referred to a Freundlich model.
Furthermore, the (n) values were close to zero this suggests thatthe adsorption becoming more heterogeneous. According to Robertet al., the Freundlich's (n) parameter correlates with the averagedenergies of adsorption; the lower the (n) the higher the affinitybetween solid and adsorbates [55].
4. Conclusions
DLC and Si doped DLC have been synthesised and showed thatsilicon content in the DLC tends to increase in the hydrophobicbehaviour of samples. Followed the adhesion of HSA the kineticsmodel was applied in the present investigation to describe theadsorption behaviour of HSA on the surface of doped and undopedDLC. The results from ionic concentration of hydrogen showed thatthe adsorption was poor at low pH, whilst the amount of HSAadsorbed increased up to an optimum pH of around 5. Increasingthe pH further resulted in a decrease in the adsorption of protein.The experimental values of DG�, DH�, and DS� revealed that theadsorption involves charge transfer between surface and solution.For example, negative values of both DG� and DH� with positive

Fig. 11. Frendulich Isotherm model of HSA adsorption onto DLC and S-3 samples.
Table 6Langmuir and Freundlich isotherm parameters of adsorbed HSA onto surface ofsamples.
Sample Langmuir isotherm Freundlich isotherm
b m2 mg�1 Qm mg m�2 r2 n KF mg m�2 r2
DLC 0.0208 5.8 0.93 1.61 0.58 0.97S-1 0.0212 6.5 0.92 1.54 0.618 0.96S-2 0.0247 7.2 0.97 1.35 0.49 0.98S-3 0.0338 10.4 0.98 1.23 0.43 0.99
M.H. Ahmed et al. / Materials Chemistry and Physics 154 (2015) 84e9392
values for DS� were found. This is good evidence that the adsorp-tion of HSA on DLC samples is spontaneous and involvedchemisorptions.
From the results of time dependent found that the interactionbetween surfaces of the samples with HSA fitted with pseudo firstorder of reaction and the rate of reaction constant (k) with goodvalues for the correlation coefficient (R2) were obtained. Theadsorption of HSA to the surfaces leads to an increase in the surfacetension, because presence of functional groups of carboxyl andamine interact with one another to produce the hydrogen bond,this could be increase the surface tension of samples. In this study,human serum albumin adsorption isotherms fit the Freundlichmodel and were correlated with the chemistry and morphology ofsurfaces, and the results suggest that the adsorption of HSA ontothe surface of DLC and doped DLC is following the multilayeradsorption characteristics.
Acknowledgements
The authors would like to thank all the staff of NanotechnologyIntegrated Bio-Engineering Centre (NIBEC), University of Ulster for
their help and assistance.
References
[1] C.M. Alves, R.L. Reisand, J.A. Hunt, The competitive adsorption of humanproteins onto natural-based biomaterials, J. R. Soc. Interface 7 (2010)1367e1377.
[2] M.H. Ahmed, T.E. Keyes, J.A. Byrne, The photocatalytic inactivation effect ofAgeTiO2 on b-amyloid peptide (1e42), J. Photochem. Photobiol. A Chem. 254(2013) 1e11.
[3] B. Lassen, M. Malmsten, Competitive protein adsorption studied with TIRF andellipsometry, J. Colloid Interface Sci. 179 (1996) 470e477.
[4] M.H. Ahmed, J.A. Byrne, J. McLaughlin, W. Ahmed, Study of human Serumalbumin adsorption and conformational change on DLC and silicon doped DLCUsing XPS and FTIR Spectroscopy, J. Biomater. Nanobiotechnol. 4 (2013)194e203.
[5] T. Hasebe, A. Shimada, T. Suzuki, Y. Matsuoka, T. Saito, S. Yohena, A. Kamijo,N. Shiraga, M. Higuchi, K. Kimura, H. Yoshimura, S. Kuribayashi, Fluorinateddiamond-like carbon as antithrombogenic coating for blood-contacting de-vices, J. Biomed. Mater. Res. 76A (2006) 86e94.
[6] H.W. Choi, R.H. Dauskardt, S.C. Lee, K.R. Lee, K.H. Oh, Characteristic of silverdoped DLC films on surface properties and protein adsorption, Diam. Relat.Mater. 17 (2008) 252e257.
[7] S. Lousinian, S. Logothetidis, A. Laskarakis, M. Gioti, Haemo-compatibility ofamorphous carbon thin films, optical properties and adsorption mechanismsof blood plasma proteins, Biomol. Eng. 24 (2007) 107e112.
[8] B.G. Keselowsky, D.M. Collard, A.J. García, Surface chemistry modulatesfibronectin conformation and directs integrin binding and specificity to con-trol cell adhesion, J. Biomed. Mater. Res. 66A (2003) 247e259.
[9] F.Z. Cui, D.J. Li, A review of investigations on biocompatibility of diamond-likecarbon and carbon nitride films, Surf. Coat. Technol. 131 (2000) 481e487.
[10] W.J. Ma, J.A. Ruys, R.S. Mason, P.J. Martin, A. Bendavid, Z. Liu, M. Ionescu,H. Zreiqat, DLC coatings: effects of physical and chemical properties on bio-logical response, Biomaterials 28 (2007) 1620e1628.
[11] M.H. Ahmed, J.A. Byrne, Effect of surface structure and wettability of DLC andN-DLC thin films on adsorption of HSA, Appl. Surf. Sci. 258 (2012) 5166e5174.
[12] M.H. Ahmed, J.A. Byrne, J. McLaughlin, Evaluation of HSA adsorption on dia-mond like carbon (DLC) and fluorinated DLC deposited by plasma-enhancedchemical vapour deposition (PECVD), Surf. Coat. Technol. 209 (2012) 8e14.
[13] M. Ahmed, A.J. Byrne, J. McLaughlin, A. Elhissi, D.A. Phoenix, W. Ahmed,Vibrational and AFM studies of adsorption of HSA on DLC and silicon-dopedDLC, J. Mater. Sci. 47 (2012) 1729e1736.
[14] W.-C. Feng, C.-H. Wang, H.-C. Cheng, S.-Y. Chiou, C.-S. Chen, K.-L. Ou,Enhancement of hemocompatibility on titanium implant with titanium-doped diamond-like carbon film evaluated by cellular reactions using bonemarrow cell cultures in vitro, J. Vac. Sci. Technol. B 27 (32) (2009) 1559e1565.
[15] G.H. Hsiue, S.D. Lee, P.C.T. Chang, C.Y. Kao, Surface characterization and bio-logical properties study of silicone rubber membrane grafted with phospho-lipid as biomaterial via plasma induced graft copolymerization, J. Biomed.Mater. Res. 42 (1998) 134e147.
[16] J.C. Damasceno, S.S. Camargo Jr., F.L. Freire Jr., R. Carius, Deposition of Si-DLCfilms with high hardness, low stress and high deposition rates, Surf. Coat.Technol. 133e134 (2000) 247e252.
[17] A. Grill, Review of the tribology of diamond-like carbon, Wear 168 (1993)143e153.
[18] J. Robertson, Diamond like amorphous carbon, Mater. Sci. Eng. R 37 (2002)129e281.
[19] R.K. Roy, H.W. Choi, J.W. Yi, M.W. Moon, K.R. Lee, D.K. Han, J.H. Shin, A. Kamijo,T. Hasebe, Hemocompatibility of surface-modified, silicon-incorporated,diamond-like carbon films, Acta Biomater. 5 (2009) 249e256.
[20] Z. Zhang, R. Song, G. Li, G. Hu, Y. Sun, Improving Barrier properties of PET bydepositing a layer of DLC films on surface, Adv. Mater. Sci. Eng. (2013), http://dx.doi.org/10.1155/2013/861804. Article ID 861804, 6 pages.
[21] S.S. Mahajan, H.C. Barshilia, B.R. Mehta, V.D. Vankar, On the determination ofthe sp3 to sp2 ratio in diamond-like carbon thin films, Thin Solid Films 302(1997) 250e255.
[22] M.L. Kerkeb, F.G. lez-Caballero, E. Chibowski, Changes in cholesterol surfacefree energy components due to its phase transition, J. Colloid Interface Sci. 159(1993) 439e443.
[23] L.Y. Chen, F.C. Nan Hong, Surface tension studies of (Si, N)-containing dia-mond-like carbon films deposited by hexamethyldisilazane, Diam. Relat.Mater. 12 (2003) 968e973.
[24] J.N. Israelachvili, Intermolecular and Surface Forces, third ed., Academic Press,London, 2011, ISBN 978-0-12-391927-4.
[25] C.J. Van Oss, R.J. Good, M.K. Chaudhury, Additive and nonadditive surfacetension components and the interpretation of contact angles, Langmuir 4 (4)(1988) 884e891.
[26] E.M. Harnett, J. Alderman, T. Wood, The surface energy of various biomaterialscoated with adhesion molecules used in cell culture, Colloids Surf. B Bio-interfaces 55 (2007) 90e97.
[27] J.H. Golden, C.J. Hawker, P.S. Ho, Designing porous low-k dielectrics, Semi-cond. Int. 79 (2001).
[28] S. Logothetidis, M. Gioti, S. Lousinian, S. Fotiadou, Haemocompatibility studieson carbon-based thin films by ellipsometry, Thin Solid Films 482 (2005)

M.H. Ahmed et al. / Materials Chemistry and Physics 154 (2015) 84e93 93
126e132.[29] G. Fedosenko, D. Korzec, J. Engemann, D. Lyebyedyev, H.-C. Scheer, Investi-
gation of diamond-like carbon films synthesized by multi-jet hollow cathoderf plasma source, Thin Solid Films 406 (2002) 275e281.
[30] J. Benesch, A. Askendal, P. Tengvall, The determination of thickness and sur-face mass density of mesothick immunoprecipitate layers by null ellipsometryand protein 125iodine labeling, J. Colloid Interface Sci. 249 (2002) 84e90.
[31] H. Arwin, D.E. Aspnes, Unambiguous determination of thickness and dielectricfunction of thin films by spectroscopic ellipsometry, Thin Solid Films 113(1984) 101e113.
[32] D. Chan, B. Schulz, K. Gloystein, H.H. Muller, M. Rubhausen, In vivo spectro-scopic ellipsometry measurements on human skin, J. Biomed. Opt. 12 (2007)014023.
[33] T.I.T. Okpalugo, H. Murphy, A.A. Ogwu, G. Abbas, S.C. Ray, P.D. Maguire,J. McLaughlin, R.W. McCullough, Human microvascular endothelial cellularinteraction with atomic N-doped DLC compared with Si-doped DLC thin films,J. Biomed. Mater. Res. Part B Appl. Biomater. 78 (2) (2006) 222e229.
[34] W.J. Yan, T.H. Gao, X.T. Guo, Y.X. Qin, Q. Xie, Structural properties of liquid SiCduring rapid solidification, Sci. World J. (2013), http://dx.doi.org/10.1155/2013/273023. Article ID 273023, 7 pages.
[35] M.C. Howland, A.W. Szmodis, B. Sanii, A.N. Parikh, Characterization of physicalproperties of supported phospholipid membranes using imaging ellipsometryat optical wavelengths, Biophysical J. 92 (2007) 1306e1317.
[36] S.E. Ong, S. Zhang, H. Du, H.C. Too, K.N. Aung, Influence of silicon concentra-tion on the haemocompatibility of amorphous carbon, Biomaterials 28 (2007),4033e4038S.
[37] S. Zhang, H. Du, S.E. Ong, K.N. Aung, H.C. Too, X. Miao, Bonding structure andhaemocompatibility of silicon-incorporated amorphous carbon, Thin SolidFilms 515 (2006) 66e72.
[38] J.M. Berg, L.G.T. Eriksson, P.M. Claesson, K.G.N. Borve, 3-Component Lang-muireBlodgett-films with a controllable degree of polarity, Langmuir 10 (4)(1994) 1225e1234.
[39] G. Bayramoglu, F.B. Senkal, G. Celik, M. Yakup Arica, Preparation and char-acterization of sulfonyl-hydrazine attached poly (styrene-divinylbenzene)beads for separation of albumin, Colloids Surf A Physicochem. Eng. Asp. 294(2007) 56e63.
[40] A. Kassab, H. Yavuz, M. Odabasi, A. Denizli, Human serum albumin chroma-tography by Cibacron Blue F3GA-derived microporous polyamide hollow-fiber affinity membranes, J. Chromatogr. B Biomed. Sci. Appl. 746 (2) (2000)123e132.
[41] A.A. Ogwu, T.I.T. Okpalugo, N. Ali, P.D. Maguire, J.A.D. McLaughlin, Endothelial
cell growth on silicon modified hydrogenated amorphous carbon thin films,J. Biomed. Mater. Res. Part B Appl. Biomater. 85B (2008) 105e113.
[42] B.B. Tewari, N. Hamid, Interaction of glycine and b-alanine with nickel, cobaltand cadmium ferrocyanides, Colloids Surf. A Physicochem. Eng. Asp. 296(2007) 264e269.
[43] J.L. Gardea-Torresdey, L. Tang, J.M. Salvador, Copper adsorption by esterifiedand unesterified fractions of Sphagnum peat moss and its different humicsubstances, J. Hazard. Mater. 48 (1996) 191e206.
[44] S. Goswami, U. Ch Ghosh, Studies on adsorption behaviour of Cr(VI) ontosynthetic hydrous stannic oxide, Water SA 31 (4) (2005) 597e602.
[45] M. Liu, E.P.C. Lai, Y. Yang, Removal of 17 b-Estrodiol by nylon filter membrane:adsorption kinetics and thermodynamics, Int. J. Res. Rev. Appl. Sci. 11 (1)(2012) 67e73.
[46] G. Bayramoglu, E. Yalcin, M.Y. Arica, Adsorption of serum albumin and g-globulin from single and binary mixture and characterization of pHEMA-based affinity membrane surface by contact angle measurements, Biochem.Eng. J. 26 (2005) 12e21.
[47] M. Mohsen-Nia, M. Massah Bidgoli, M. Behrashi, A. Mohsen Nia, Human serumprotein adsorption onto synthesis Nano-Hydroxyapatite, Protein J. 31 (2012)150e157.
[48] D.Q. Zhang, Q.R. Cai, X.M. He, L.X. Gao, G.D. Zhou, Inhibition effect of someamino acids on copper corrosion in HCl solution, Mater. Chem. Phys. 112(2008) 353e358.
[49] S. Schnell, C. Mendoz, The condition for pseudo-first-order kinetics to be validin transient-phase studies of enzymatic reactions is independent of the initialenzyme concentration, Biophys. Chem. 107 (2004) 165e174.
[50] O. Zinger, G. Zhao, Z. Schwartz, J. Simpson, M. Wieland, D. Landolt, B.D. Boyan,Differential regulation of osteoblasts by substrate microstructural features,Biomaterials 26 (2005) 1837e1847.
[51] X.L. Ji, S.Q. Liu, Is stoichiometry-driven protein folding getting out of ther-modynamic control? J. Biomol. Struct. Dyn. 28 (2011) 621e623.
[52] G. Martra, S. Horikoshi, Masakazuanpo, S. Coluccia, H. Hidaka, FTIR study ofadsorption and photodegradation of L-a-alanine on TiO2 powder, Res. Chem.Intermed. 28 (4) (2002) 359e371.
[53] B. Liu, S. Cao, X. Deng, S. Li, R. Luo, Adsorption behaviour of protein ontosiloxane microspheres, Appl. Surf. Sci. 252 (2006) 7830e7836.
[54] B.H. Hameed, D.K. Mahmoud, A.L. Ahmad, Equilibrium modeling and kineticstudies on the adsorption of basic dye by a low-cost adsorbent: Coconut(Cocos nucifera) bunch waste, Journal Hazard. Mater. 158 (2008) 65e72.
[55] D. Robert, S. Parra, C. Pulgarin, A. Krzton, J.V. Weber, Chemisorption of phenolsand acids on TiO2 surface, Appl. Surf. Sci. 167 (2000) 51e58.