Interpreting the adsorption of serum albumin and lactoglobulin onto ZnS nanopaticles: Effect of...
8
Interpreting the adsorption of serum albumin and lactoglobulin onto ZnS nanopaticles: Effect of conformational rigidity of the proteins Jiban Saikia a , Bedabrata Saha b , Gopal Das a,b,⇑ a Department of Chemistry, Indian Institute of Technology Guwahati, Assam 781039, India b Centre for the Environment, Indian Institute of Technology Guwahati, Assam 781039, India article info Article history: Received 24 August 2013 Accepted 24 October 2013 Available online 9 November 2013 Keywords: ZnS nanoparticle BSA b-Lactoglobulin Protein adsorption Hard and soft proteins abstract The work we have undertaken is to investigate the adsorption of two different proteins (BSA and BLG) having near same IEP and differing in their conformational flexibility, onto the surface of ZnS nanoparti- cles (ZnS NPs). BSA and BLG both have an IEP value around pH 5. BSA is more prone to conformational deformation and considered ‘‘soft’’ while BLG holds the conformational rigidity and considered as ‘‘hard’’ protein. To ascertain the differences in surface coverage and conformation of the protein onto ZnS surface (PZC 3.7), we have evaluated the adsorption profile at pH 7, where the entire surface behaves nega- tively. An integrated approach was taken by incorporating zeta (f) potential, fluorescence and CD for ana- lyzing the adsorption process. In both systems, an increase in protein surface coverage was observed with the increase in free protein concentration in the solution and f values approaching that of native protein at high surface coverage. An alteration in the tertiary structure was observed for both BSA and BLG. The CD spectra analysis reveals that the secondary structure of the BSA was more deviated from the native protein structure, accommodating the increased adsorption value. For BLG no such prominent structural alteration was observed. These findings help us to understand better, how adjustment of the protein adsorption amount can be achieved onto the surface of nanoparticles having like charges. Ó 2013 Elsevier Inc. All rights reserved. 1. Introduction Protein adsorption is the prima facie credibility in the construct of bio–nano-composite for implication in various fields. It is a com- plex process involving various factors such as van der Waals, hydrophobic and electrostatic interactions, and hydrogen bonding [1]. On the other hand, different proteins act differently with the introduced surface in the adsorption process depending on their physio-chemical and structural stability. Structural reorientation (both secondary and tertiary) is accompanied by the adsorption for most of the protein while some appears to resist significant conformational change [2,3]. This sort of conformational flexibility and conformation rigidity of proteins classified them into class of ‘‘soft’’ and ‘‘hard’’ proteins. Proteins that have a tendency to under- go major surface-induced conformational change are termed as ‘‘soft’’ and those less vulnerable to conformational change are coined as ‘‘hard’’ protein [4,5]. Based on this property of protein, different proteins (‘‘soft’’ and ‘‘hard’’) are likely to show different adsorption behavior after adsorption onto same surface. A lot of studies have been made to understand how ‘‘soft’’ and ‘‘hard’’ proteins interact with different surface. Norde and Haynes investigated the structural perturbation of lysozyme (hard) and a-lactalbumin (soft) on negatively charged polystyrene latex (PS ) and variably charged hematite (a-Fe 2 O 3 ) surfaces [6]. Norde and Haynes also studied the change in secondary structural com- ponent of BSA (soft) and lysozyme (hard) upon adsorption onto finely dispersed silica particles [7]. Turci et al. elaborated the con- sequence of adsorption of four proteins:BSA (soft), lysozyme (hard), bovine pancreatic ribonuclease (hard) and bovine lactoper- oxidase (soft), onto two amorphous pyrogenic silica nanoparticles [8]. Further, Wertz et al. substantiated that lysozyme, despite its recognized ‘‘hardness’’ on hydrophilic surfaces, compromises its structural integrity upon adsorption onto hydrophobic surfaces [9]. Cole et al. found the well-structured molecule of collagen undergoes structural perturbations when interacting with the hydrophilic SiO 2 surface, but it weakly interacts with a hydropho- bic derivative of the same surface, which may be explained by its rigid molecular structure [10]. From the above observation it could be concluded that the consequences of adsorption is a very com- plex phenomenon and is very difficult to predict how a ‘‘soft’’ or ‘‘hard’’ protein would behave to a given surface. To quench our inquisitiveness of knowing the adsorption pro- cess better, we have taken two different protein having near same isoelectric point (IEP) but different structural stability for the adsorption interaction study. Two globular, highly abundant proteins, Bovine serum albumin (BSA) and b-lactoglobulin (BLG) 0021-9797/$ - see front matter Ó 2013 Elsevier Inc. All rights reserved. http://dx.doi.org/10.1016/j.jcis.2013.10.053 ⇑ Corresponding author at: Department of Chemistry, Indian Institute of Technology Guwahati, Assam 781039, India. Fax: +91 361 258 2349. E-mail address: [email protected] (G. Das). Journal of Colloid and Interface Science 416 (2014) 235–242 Contents lists available at ScienceDirect Journal of Colloid and Interface Science www.elsevier.com/locate/jcis
-
Upload
independent -
Category
Documents
-
view
2 -
download
0
Transcript of Interpreting the adsorption of serum albumin and lactoglobulin onto ZnS nanopaticles: Effect of...
Journal of Colloid and Interface Science 416 (2014) 235–242
Contents lists available at ScienceDirect
Journal of Colloid and Interface Science
www.elsevier .com/locate / jc is
Interpreting the adsorption of serum albumin and lactoglobulin onto ZnSnanopaticles: Effect of conformational rigidity of the proteins
0021-9797/$ - see front matter � 2013 Elsevier Inc. All rights reserved.http://dx.doi.org/10.1016/j.jcis.2013.10.053
⇑ Corresponding author at: Department of Chemistry, Indian Institute ofTechnology Guwahati, Assam 781039, India. Fax: +91 361 258 2349.
E-mail address: [email protected] (G. Das).
Jiban Saikia a, Bedabrata Saha b, Gopal Das a,b,⇑a Department of Chemistry, Indian Institute of Technology Guwahati, Assam 781039, Indiab Centre for the Environment, Indian Institute of Technology Guwahati, Assam 781039, India
a r t i c l e i n f o a b s t r a c t
Article history:Received 24 August 2013Accepted 24 October 2013Available online 9 November 2013
Keywords:ZnS nanoparticleBSAb-LactoglobulinProtein adsorptionHard and soft proteins
The work we have undertaken is to investigate the adsorption of two different proteins (BSA and BLG)having near same IEP and differing in their conformational flexibility, onto the surface of ZnS nanoparti-cles (ZnS NPs). BSA and BLG both have an IEP value around pH � 5. BSA is more prone to conformationaldeformation and considered ‘‘soft’’ while BLG holds the conformational rigidity and considered as ‘‘hard’’protein. To ascertain the differences in surface coverage and conformation of the protein onto ZnS surface(PZC � 3.7), we have evaluated the adsorption profile at pH 7, where the entire surface behaves nega-tively. An integrated approach was taken by incorporating zeta (f) potential, fluorescence and CD for ana-lyzing the adsorption process. In both systems, an increase in protein surface coverage was observed withthe increase in free protein concentration in the solution and f values approaching that of native proteinat high surface coverage. An alteration in the tertiary structure was observed for both BSA and BLG. TheCD spectra analysis reveals that the secondary structure of the BSA was more deviated from the nativeprotein structure, accommodating the increased adsorption value. For BLG no such prominent structuralalteration was observed. These findings help us to understand better, how adjustment of the proteinadsorption amount can be achieved onto the surface of nanoparticles having like charges.
� 2013 Elsevier Inc. All rights reserved.
1. Introduction
Protein adsorption is the prima facie credibility in the constructof bio–nano-composite for implication in various fields. It is a com-plex process involving various factors such as van der Waals,hydrophobic and electrostatic interactions, and hydrogen bonding[1]. On the other hand, different proteins act differently with theintroduced surface in the adsorption process depending on theirphysio-chemical and structural stability. Structural reorientation(both secondary and tertiary) is accompanied by the adsorptionfor most of the protein while some appears to resist significantconformational change [2,3]. This sort of conformational flexibilityand conformation rigidity of proteins classified them into class of‘‘soft’’ and ‘‘hard’’ proteins. Proteins that have a tendency to under-go major surface-induced conformational change are termed as‘‘soft’’ and those less vulnerable to conformational change arecoined as ‘‘hard’’ protein [4,5]. Based on this property of protein,different proteins (‘‘soft’’ and ‘‘hard’’) are likely to show differentadsorption behavior after adsorption onto same surface. A lot ofstudies have been made to understand how ‘‘soft’’ and ‘‘hard’’proteins interact with different surface. Norde and Haynes
investigated the structural perturbation of lysozyme (hard) anda-lactalbumin (soft) on negatively charged polystyrene latex(PS�) and variably charged hematite (a-Fe2O3) surfaces [6]. Nordeand Haynes also studied the change in secondary structural com-ponent of BSA (soft) and lysozyme (hard) upon adsorption ontofinely dispersed silica particles [7]. Turci et al. elaborated the con-sequence of adsorption of four proteins:BSA (soft), lysozyme(hard), bovine pancreatic ribonuclease (hard) and bovine lactoper-oxidase (soft), onto two amorphous pyrogenic silica nanoparticles[8]. Further, Wertz et al. substantiated that lysozyme, despite itsrecognized ‘‘hardness’’ on hydrophilic surfaces, compromises itsstructural integrity upon adsorption onto hydrophobic surfaces[9]. Cole et al. found the well-structured molecule of collagenundergoes structural perturbations when interacting with thehydrophilic SiO2 surface, but it weakly interacts with a hydropho-bic derivative of the same surface, which may be explained by itsrigid molecular structure [10]. From the above observation it couldbe concluded that the consequences of adsorption is a very com-plex phenomenon and is very difficult to predict how a ‘‘soft’’ or‘‘hard’’ protein would behave to a given surface.
To quench our inquisitiveness of knowing the adsorption pro-cess better, we have taken two different protein having near sameisoelectric point (IEP) but different structural stability for theadsorption interaction study. Two globular, highly abundantproteins, Bovine serum albumin (BSA) and b-lactoglobulin (BLG)
236 J. Saikia et al. / Journal of Colloid and Interface Science 416 (2014) 235–242
were taken as model protein for the study. The main properties ofthe two proteins are summarized in Table 1 to get a brief ideaabout the proteins.
Serum albumin is the most abundant protein in mammalianplasma and BSA (bovine serum albumin) is the most studied serumprotein due to its wide availability, low cost and high structuralresemblance with HSA (human serum albumin) [13]. BSA is awater-soluble monomeric protein of single polypeptide chain with583 amino acid residues and a molar mass of 66.4 kDa [14]. BLG isalso one of the most extensively studied proteins due to its highabundance in cow’s milk [15]. At neutral pH BLG exists as a non-covalent dimer consisting of two identical monomers of molecularmass 18.3 kDa. Table 1 summarizes the physio-chemical propertiesof the two proteins.
In continuation to our previous work of protein nanoparticleinteraction study [16], herein, we focus to see the effect of theadsorption of the two proteins (BSA and BLG) onto the surface ofZnS nanoparticle (NPs). Different surfaces have different potential-ity that could be exploited for the further utility. Physio-chemicalnature, different size and curvature of adsorbent can give very dif-ferent results. Surface nature of ZnS is soft and to the best of ourknowledge no such comparison of protein adsorption based onhard and soft properties have been reported with ZnS NPs. Hencewe studied the effect of such an interaction and to notice the plau-sible change and to derive an outcome out of it which would throwsome light into the protein–nanoparticle interaction domain. ZnSNPs of size �100 nm and having a high specific surface area of141.69 m2 g�1 was taken as the substrate for the adsorption atpH 7. ZnS having PZC (point of zero charge) value aroundpH � 3.7, retains a negative surface at the study regime, likewisethe proteins also possess a net negative charge at this pH point.We have incorporated various experimental approaches such aszeta (f) potential, fluorescence and CD for analyzing the adsorptionprocess. From the experimental results and based on the physio-chemical nature of the proteins and ZnS NPs, we have tried to drawa plausible conclusion of the adsorption system.
2. Materials and methods
2.1. Reagents and chemicals
Zinc acetate dehydrate Zn(CH3COO)2�2H2O, Pyridine-2,3-dicar-boxylic acid (PDC) and aniline were obtained from Merck-India(99%) and were of analytical grade. Lyophilized powders of bovineserum albumin (BSA; A2153 P 96%) and b-lactoglobulin (BLG;L0130 P 90%) were obtained from Sigma–Aldrich. All the chemi-cals and reagents were used as obtained without further purifica-tion. All the solvents used for spectroscopic studies were ofspectroscopy grade and the distilled water and deionized water(Milli-Q system at 18.2 MX cm�1, Millipore, USA) was used in allexperiments. Prior to each adsorption experiment, fresh aqueousprotein solutions of different concentrations were prepared usingphosphate buffer of pH 7 (50 mM).
2.2. Synthesis and characterization of ZnS NPs
A simple precursor mediated synthesis has been used for thesynthesis of ZnS NPs. Zn(II)-PDC was synthesized in aqueous
Table 1Properties of the proteins BSA and BLG taken for the study.
Protein Isoelectric point (IEP) Molecular mass (Da) Resistance to deformatio
BSA [11] 4.9 68,000 Low (soft)BLG [12] 5.1 18,300 High (hard)
medium. In a usual synthesis procedure, aqueous solution of PDC(5.6 mmol, 0.954 gm) was added drop-wise to the aqueous solu-tion of Zn(OAc)2�2H2O (2.8 mmol, 0.626 gm) with constant stirringat room temperature for a period of 6 h. White precipitate thusformed was filtered, washed with water and dried in vacuum[16]. The complex was made soluble adding few drops of aniline.H2S gas was purged through the solution to give a white colloidalsuspension which on centrifugation yielded white precipitates ofZnS NPs. The precipitate was washed with methanol, water andvacuum dried prior to characterization.
ZnS NPs synthesized were characterized by several techniques.The Powder XRD analysis of the ZnS NPs was conducted on Seifertpowder X-ray diffractometer (XRD 3003TT) with a Cu Ka source(k = 1.54 Å). The accelerating voltage during the measurementwas 30 kV. FT-IR spectra were recorded at 4 cm�1 resolution with10 scans with a Perkin–Elmer spectrum one FT-IR spectrometerfrom 4000 to 450 cm�1. A background spectrum was correctedwith pure KBr. The transmission electron micrographs (TEM) wereobtained with a JEOL 2100 UHR-TEM microscope. An amount of5 lL of as-synthesized ZnS NPs solution was drop-cast on car-bon-coated copper grids and subsequently air-dried before TEManalysis. The surface charge was monitored using Zetasizer NanoZS apparatus (Malvern Instruments, UK). Specific surface areaand pore volume of ZnS NPs were determined using a BeckmanCoulter SA3100 surface area analyzer by measuring N2 adsorptionand adopting the wellknown BET procedure.
2.3. Sample preparation for the adsorption study
A buffer solution, consisting of 50 mM sodium phosphate at pH7, was used in all the experiments. Adsorption experiments of pro-tein onto ZnS NPs were carried out in batch mode. The concentra-tion of the protein was varied from 10 to 500 lg ml�1 and ZnS NPsconcentration was kept constant at 0.5 lg ml�1. The adsorptionstudies were carried out in small centrifuging tubes. ZnS NPs wereadded to the protein solution in the centrifuging tubes and allowedto shake to reach equilibrium. After equilibrium is reached thenanoparticles were separated from the solution in a 15,000 rpmcentrifuge. The supernatant solution was then analyzed for theremaining protein concentration using the Bradford assay measur-ing the absorbance at 595 nm. The amount of protein adsorbed perunit weight of adsorbent (qe) was calculated using the mass bal-ance from the initial and steady state protein concentrations (Eq.(1)):
qe ¼ðC0 � CeÞV
mð1Þ
where, C0 and Ce are the initial and equilibrium protein concen-tration in aqueous medium (mg L�1), V is volume of the sample (L)and m is the amount of ZnS NPs added in gm.
2.4. Zeta potential and DLS measurement
Zeta potential (f) analysis of ZnS NPs and interaction system ofthe two proteins with the nanoparticles were measured using aZetasizer nano ZS apparatus (Malvern Instruments) auto-monitored at different protein coverage. Samples were re-dispersed and diluted in 10 mM phosphate buffer and titrated with
n (hard/soft) Dimension (nm) Net charge at pH 7 Zeta potential (f) mV
9.0 � 6.0 � 5.0 Negative �14.66.5 � 3.6 � 3.6 Negative �19.5
J. Saikia et al. / Journal of Colloid and Interface Science 416 (2014) 235–242 237
0.1 M NaOH and 0.1 M HCl using the auto titrator, and circulatedsimultaneously in the analytical cell for zeta potential measure-ment. The temperature of the scattering cell was fixed at 25 �C.Three zeta potential measurements were performed for erroranalysis.
2.5. Circular dichroism (CD)
CD spectra of native and adsorbed protein were measured toevaluate the secondary structural change. Four different concen-tration of ZnS was taken for CD spectral analysis. The CD spectrawere obtained using JASCO-815 spectro polarimeter in the region190–240 nm. The concentration of protein was 50 lg ml�1 and fi-nal ZnS NPs concentration was 10, 25, 50 and 100 lM respectively.Phosphate buffer concentration of 50 mM was used for this study.Spectra were recorded in a 0.1 cm path length quartz cuvette. Forall the samples data were collected by averaging three scans withthe scan rate of 50 nm min�1 at 20 �C. The resolution and the timeconstant were 0.2 nm and 0.125 s respectively. Blank spectra of thesolution and of the nanoparticles suspension without protein wereobtained at identical conditions to correct the protein spectra atthe adsorbed state. Spectra were analyzed for secondary structureusing CONTIN in the Dichroweb online analysis. An average molarmass of 105 Da per amino acid residue was used for calculating themolar ellipticity, [h].
2.6. Fluorescence emission spectroscopy
Tertiary structural changes were measured using intrinsic tryp-tophan fluorescence emission technique in a fluorescence spectro-photometer Horiba Fluoromax 4 (JOBIN VYON). The protein wasexcited at 295 nm and tryptophan emission fluorescence spectrawere collected from 300 to 500 nm. We have done the fluorescencetitration of the protein with the continuous addition of aliquots ofZnS NPs into the protein solution. The ZnS NPs concentration var-ied from 3.3 to 31.1 lM whereas a 50 mg ml�1 concentration ofprotein was taken. Steady state anisotropy was also measured inthe same instrument.
3. Results and discussion
3.1. ZnS characterization
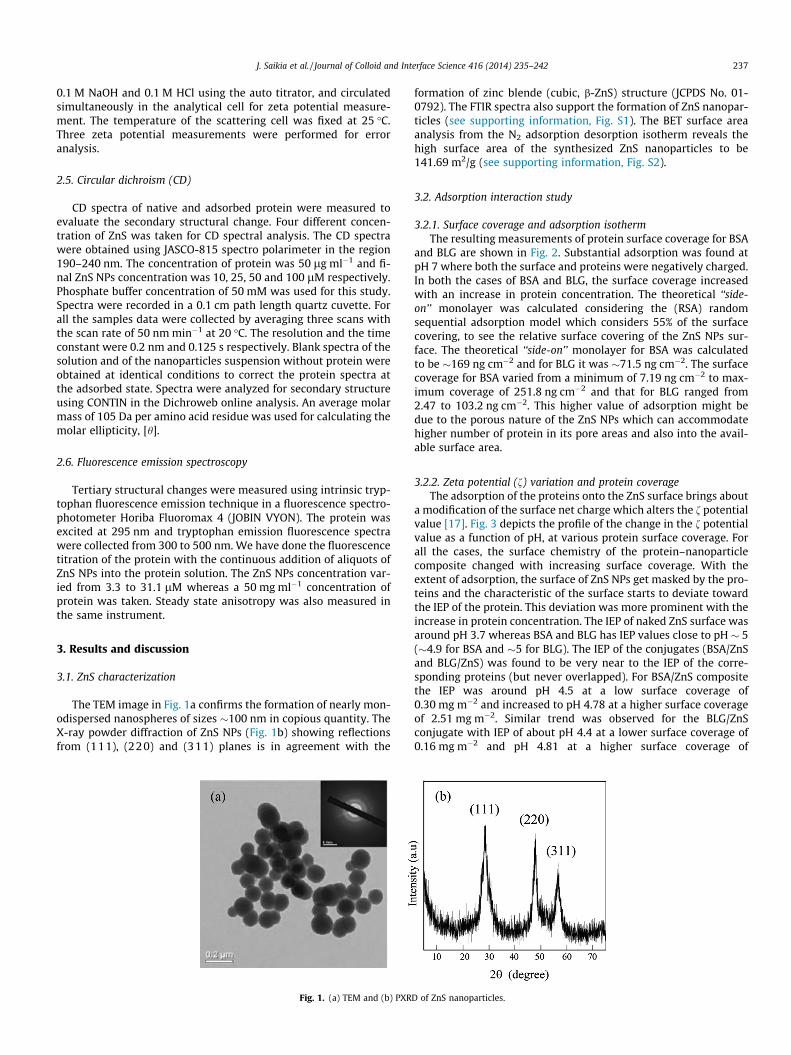
The TEM image in Fig. 1a confirms the formation of nearly mon-odispersed nanospheres of sizes �100 nm in copious quantity. TheX-ray powder diffraction of ZnS NPs (Fig. 1b) showing reflectionsfrom (111), (220) and (311) planes is in agreement with the
Fig. 1. (a) TEM and (b) PXR
formation of zinc blende (cubic, b-ZnS) structure (JCPDS No. 01-0792). The FTIR spectra also support the formation of ZnS nanopar-ticles (see supporting information, Fig. S1). The BET surface areaanalysis from the N2 adsorption desorption isotherm reveals thehigh surface area of the synthesized ZnS nanoparticles to be141.69 m2/g (see supporting information, Fig. S2).
3.2. Adsorption interaction study
3.2.1. Surface coverage and adsorption isothermThe resulting measurements of protein surface coverage for BSA
and BLG are shown in Fig. 2. Substantial adsorption was found atpH 7 where both the surface and proteins were negatively charged.In both the cases of BSA and BLG, the surface coverage increasedwith an increase in protein concentration. The theoretical ‘‘side-on’’ monolayer was calculated considering the (RSA) randomsequential adsorption model which considers 55% of the surfacecovering, to see the relative surface covering of the ZnS NPs sur-face. The theoretical ‘‘side-on’’ monolayer for BSA was calculatedto be �169 ng cm�2 and for BLG it was �71.5 ng cm�2. The surfacecoverage for BSA varied from a minimum of 7.19 ng cm�2 to max-imum coverage of 251.8 ng cm�2 and that for BLG ranged from2.47 to 103.2 ng cm�2. This higher value of adsorption might bedue to the porous nature of the ZnS NPs which can accommodatehigher number of protein in its pore areas and also into the avail-able surface area.
3.2.2. Zeta potential (f) variation and protein coverageThe adsorption of the proteins onto the ZnS surface brings about
a modification of the surface net charge which alters the f potentialvalue [17]. Fig. 3 depicts the profile of the change in the f potentialvalue as a function of pH, at various protein surface coverage. Forall the cases, the surface chemistry of the protein–nanoparticlecomposite changed with increasing surface coverage. With theextent of adsorption, the surface of ZnS NPs get masked by the pro-teins and the characteristic of the surface starts to deviate towardthe IEP of the protein. This deviation was more prominent with theincrease in protein concentration. The IEP of naked ZnS surface wasaround pH 3.7 whereas BSA and BLG has IEP values close to pH � 5(�4.9 for BSA and �5 for BLG). The IEP of the conjugates (BSA/ZnSand BLG/ZnS) was found to be very near to the IEP of the corre-sponding proteins (but never overlapped). For BSA/ZnS compositethe IEP was around pH 4.5 at a low surface coverage of0.30 mg m�2 and increased to pH 4.78 at a higher surface coverageof 2.51 mg m�2. Similar trend was observed for the BLG/ZnSconjugate with IEP of about pH 4.4 at a lower surface coverage of0.16 mg m�2 and pH 4.81 at a higher surface coverage of
D of ZnS nanoparticles.

Fig. 2. Protein adsorption isotherms plotted as a function of initial proteinconcentration at pH 7. The dotted horizontal lines indicate the calculated amountof proteins needed for ‘‘side-on’’ adsorption modes to cover the surface area withone monolayer.
Fig. 4. Fluorescence quenching spectra of tryptophan residues of (a) BSA and (b)BLG upon addition of ZnS nanoparticles at pH 7. (Inset: Stern–Volmer plot derivedfrom the quenching data).
238 J. Saikia et al. / Journal of Colloid and Interface Science 416 (2014) 235–242
1.03 mg m�2. The maximum adsorption values of both the proteinsexceeded the theoretical ‘‘side-on’’ monolayer value for both theproteins while the zeta potential values never leveled to the IEPof the proteins. These two findings lead to a probable conclusionthat the high porous nature of ZnS NPs accommodates a higherfraction of proteins into it. Thus increasing the adsorption valueand the complete masking of the ZnS NPs surface never happened.
3.2.3. Tryptophan fluorescence quenching and anisotropymeasurement
The quenching of fluorescence emission originates either fromstatic or dynamic interaction of quencher with the fluorophore.In order to get an insight of the quenching mechanism of the pro-teins (BSA and BLG) with ZnS, we have monitored the emission oftryptophan residues in the protein solution at different concentra-tions of the quencher (ZnS). BSA has two Trp residues at positions134 and 212 which are responsible for the intrinsic fluorescence.Trp212 residue is located in hydrophobic cavity, whereas Trp134is located on the surface. The binding close to these can alter thefluorescence intensity of the species [18]. BLG also has two Trp unit(Trp19 and Trp61). The Trp19 is buried in the hydrophobic corewhereas the latter is exposed to the solvent [19]. The fluorescenceintensity was found to decrease gradually with the increase in thequencher concentration and shown in Fig. 4. We have further em-ployed the classical Stern–Volmer equation for the fluorescenceintensity data to calculate the Stern–Volmer constant [20]:
I0=I ¼ 1þ Ksv ½Q � ð2Þ
where, I0 and I are the fluorescence intensities of protein in theabsence and presence of the quencher, respectively. Ksv is theStern–Volmer constant and [Q] is the concentration of the quencher
Fig. 3. f potential measurement of pure ZnS nanoparticles and pr
(ZnS in this case). The Ksv values obtained from the equation aresummarized in Table 2. Moreover, the di-molecular quenchingequation is:
Ksv ¼ Kqs0 ð3Þ
where Kq represents the quenching rate constant and s0 is the aver-age photoluminescence lifetime of protein (usually �10�8 to �10�9
for BSA and BLG respectively) [21,22]. The Kq value lies in the rangeof �1012 to �1013 (L mol�1 s�1) for both BSA and BLG, which is fargreater compared with the value obtained for biological macromol-ecules due to the collision mechanism (2.0 � 1010 L mol�1 s�1)implying the static nature of the quenching process [23]. Usingthe method described by Shao et al., one can calculate the number
otein coated ZnS nanoparticles at different surface coverage.
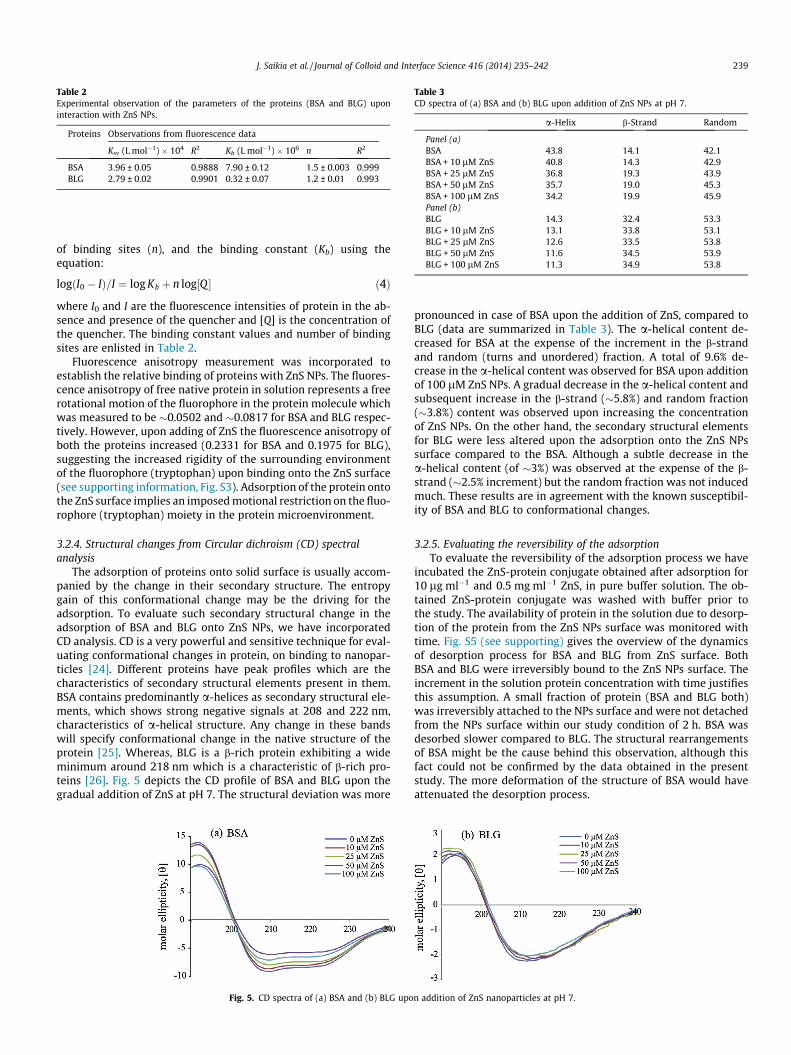
Table 2Experimental observation of the parameters of the proteins (BSA and BLG) uponinteraction with ZnS NPs.
Proteins Observations from fluorescence data
Ksv (L mol�1) � 104 R2 Kb (L mol�1) � 106 n R2
BSA 3.96 ± 0.05 0.9888 7.90 ± 0.12 1.5 ± 0.003 0.999BLG 2.79 ± 0.02 0.9901 0.32 ± 0.07 1.2 ± 0.01 0.993
Table 3CD spectra of (a) BSA and (b) BLG upon addition of ZnS NPs at pH 7.
a-Helix b-Strand Random
Panel (a)BSA 43.8 14.1 42.1BSA + 10 lM ZnS 40.8 14.3 42.9BSA + 25 lM ZnS 36.8 19.3 43.9BSA + 50 lM ZnS 35.7 19.0 45.3BSA + 100 lM ZnS 34.2 19.9 45.9Panel (b)BLG 14.3 32.4 53.3BLG + 10 lM ZnS 13.1 33.8 53.1BLG + 25 lM ZnS 12.6 33.5 53.8BLG + 50 lM ZnS 11.6 34.5 53.9BLG + 100 lM ZnS 11.3 34.9 53.8
J. Saikia et al. / Journal of Colloid and Interface Science 416 (2014) 235–242 239
of binding sites (n), and the binding constant (Kb) using theequation:
logðI0 � IÞ=I ¼ log Kb þ n log½Q � ð4Þ
where I0 and I are the fluorescence intensities of protein in the ab-sence and presence of the quencher and [Q] is the concentration ofthe quencher. The binding constant values and number of bindingsites are enlisted in Table 2.
Fluorescence anisotropy measurement was incorporated toestablish the relative binding of proteins with ZnS NPs. The fluores-cence anisotropy of free native protein in solution represents a freerotational motion of the fluorophore in the protein molecule whichwas measured to be �0.0502 and �0.0817 for BSA and BLG respec-tively. However, upon adding of ZnS the fluorescence anisotropy ofboth the proteins increased (0.2331 for BSA and 0.1975 for BLG),suggesting the increased rigidity of the surrounding environmentof the fluorophore (tryptophan) upon binding onto the ZnS surface(see supporting information, Fig. S3). Adsorption of the protein ontothe ZnS surface implies an imposed motional restriction on the fluo-rophore (tryptophan) moiety in the protein microenvironment.
3.2.4. Structural changes from Circular dichroism (CD) spectralanalysis
The adsorption of proteins onto solid surface is usually accom-panied by the change in their secondary structure. The entropygain of this conformational change may be the driving for theadsorption. To evaluate such secondary structural change in theadsorption of BSA and BLG onto ZnS NPs, we have incorporatedCD analysis. CD is a very powerful and sensitive technique for eval-uating conformational changes in protein, on binding to nanopar-ticles [24]. Different proteins have peak profiles which are thecharacteristics of secondary structural elements present in them.BSA contains predominantly a-helices as secondary structural ele-ments, which shows strong negative signals at 208 and 222 nm,characteristics of a-helical structure. Any change in these bandswill specify conformational change in the native structure of theprotein [25]. Whereas, BLG is a b-rich protein exhibiting a wideminimum around 218 nm which is a characteristic of b-rich pro-teins [26]. Fig. 5 depicts the CD profile of BSA and BLG upon thegradual addition of ZnS at pH 7. The structural deviation was more
Fig. 5. CD spectra of (a) BSA and (b) BLG upo
pronounced in case of BSA upon the addition of ZnS, compared toBLG (data are summarized in Table 3). The a-helical content de-creased for BSA at the expense of the increment in the b-strandand random (turns and unordered) fraction. A total of 9.6% de-crease in the a-helical content was observed for BSA upon additionof 100 lM ZnS NPs. A gradual decrease in the a-helical content andsubsequent increase in the b-strand (�5.8%) and random fraction(�3.8%) content was observed upon increasing the concentrationof ZnS NPs. On the other hand, the secondary structural elementsfor BLG were less altered upon the adsorption onto the ZnS NPssurface compared to the BSA. Although a subtle decrease in thea-helical content (of �3%) was observed at the expense of the b-strand (�2.5% increment) but the random fraction was not inducedmuch. These results are in agreement with the known susceptibil-ity of BSA and BLG to conformational changes.
3.2.5. Evaluating the reversibility of the adsorptionTo evaluate the reversibility of the adsorption process we have
incubated the ZnS-protein conjugate obtained after adsorption for10 lg ml�1 and 0.5 mg ml�1 ZnS, in pure buffer solution. The ob-tained ZnS-protein conjugate was washed with buffer prior tothe study. The availability of protein in the solution due to desorp-tion of the protein from the ZnS NPs surface was monitored withtime. Fig. S5 (see supporting) gives the overview of the dynamicsof desorption process for BSA and BLG from ZnS surface. BothBSA and BLG were irreversibly bound to the ZnS NPs surface. Theincrement in the solution protein concentration with time justifiesthis assumption. A small fraction of protein (BSA and BLG both)was irreversibly attached to the NPs surface and were not detachedfrom the NPs surface within our study condition of 2 h. BSA wasdesorbed slower compared to BLG. The structural rearrangementsof BSA might be the cause behind this observation, although thisfact could not be confirmed by the data obtained in the presentstudy. The more deformation of the structure of BSA would haveattenuated the desorption process.
n addition of ZnS nanoparticles at pH 7.

240 J. Saikia et al. / Journal of Colloid and Interface Science 416 (2014) 235–242
4. Discussion
Substantial amount of adsorption was seen for BSA and BLG atpH 7, where both the proteins and the ZnS NPs surface werenegatively charged and electrostatic repulsion was expected. Thesurface of protein contains different ionisable groups (carboxylgroups and the amino groups) which are ionized at different pH.The net charge the protein carries at a definite pH is governed bythe number of ionized carboxyl or the amino groups they possess.These ionized groups form local positive and negative chargeregimes within the protein molecule. These local positively andnegatively charged regimes on the protein surface could beinvolved in the adsorption mechanism, although the net chargesuggests an electrostatic repulsion [27–29]. The zeta potential dataalso account for the substantial adsorption of BSA and BLG ontoZnS NPs surface. All the IEPs of the protein treated ZnS NPs suspen-sions were shifted toward the IEPs of the adsorbed proteinsalthough the IEP of the protein-NPs composite never leveled tothe IEP of the native proteins. From the calculation of the adsorp-tion capacity it was also found that the maximum surface coveragevalue for BSA and BLG, was above the theoretical monolayer (side-on) calculation value. These two results combined together fetchesthe conclusion that the highly porous ZnS NPs can accommodate ahigh amount of proteins into its pores which in turn increases theadsorption value, while complete masking of the ZnS NPs surfacedo not happen in both cases of BSA and BLG adsorption, leavingto the exposure of ZnS patches and non-overlapping of the IEP val-ues of protein and protein-NPs composite. Similar sort of heteroge-neous distribution of protein on hydrophilic surface at pH whereall the species were of same charge was reported by Rabe et al.,even though they showed the co-operativity effect for the outcome[30].
From fluorescence quenching at wavelength �345 nm, it wasestablished that the tertiary structure of both BSA and BLG waspartially altered upon the adsorption onto ZnS NPs. An insight intothe protein residual structure can throw some light upon thequenching mechanism of the two. BSA has two tryptophan moie-ties, Trp residues at positions 134 and 212. Trp212 residue is lo-cated in hydrophobic cavity, whereas Trp134 is located on thesurface. The quenching could be attributed to both Trp134 andTrp212 interacting with the ZnS NPs. But from the secondary struc-tural analysis (CD spectra) it was substantiated that BSA undergoesa significant structural reorientation. This could probably lead tothe Trp212, residing in the hydrophobic pocket to bulge and signif-icantly interact with the ZnS surface resulting the fluorescencequenching. The binding constant Kb was calculated to be7.9 � 106 L mol�1 and number of the binding sites was �1.5. Thisstructural re-adjustment of BSA for maximizing the accommoda-tion onto the ZnS surface could also justify the higher adsorption
Fig. 6. Cartoon representation of (a) BSA and (b) BLG showing the relative positioning trThe structure was made using pyMol).
value. BLG also showed some tertiary structural change uponadsorption. The magnitude of the interaction of the tryptophanmoiety with ZnS NPs was less compared to the BSA. BLG containstwo tryptophan residues at 19 and 61. The Trp19 resides in thehydrophobic core and Trp61 protrudes into the surface and sitsquite close to the Cys66 to Cys160 di-sulfide bridge. The Cysteineresidues could be an effective Trp fluorescence quencher. Thusthe intrinsic fluorescence of BLG is attributed to Trp19 [31]. Thequenching of fluorescence could rise from the binding of Trp19with the ZnS or the Trp61. Although Trp61 has some contributionbut the Trp19 contribute more to the total seen quenching value.For the Trp19 to have an effective interaction it needs to come tothe vicinity of the ZnS surface from the hydrophobic pocket. Fromthe secondary structure analysis a very less structural change (�3%decrease in the a-helical content at the expense of �2.5% incre-ment in the b-strand) was observed. This subtle change in thestructure could induce the Trp19 to interact efficiently resultingthe quenching. Fig. 6 is the cartoon representation of BSA andBLG showing the Trp residues. From the figure it is quite clear that,even though the Trp19 of BLG is in the hydrophobic cavity but it ismore accessible than the Trp212 of the BSA. Hence with the lessdeformation a significant interaction could be achieved for BLGwhere BSA undergoes a high deformation for achieving the same.The anisotropy value also support the strong interaction of BSAover BLG onto ZnS NPs.
Thus, compiling the results an assumption could be drawn toget the overview of the adsorption phenomenon. The chemical–physical characteristics of the ZnS surface and protein structure de-cide the relative predominance of the force responsible for theadsorption. At pH 7 the electrostatic attraction could be ruled outto some extent, as all the surfaces are negatively charge. Similarprotein-particle adsorption under non-attractive electrostatic con-ditions was also found on hydrophobic surfaces and reported in theliterature [32,33]. The hydrophobic nature of the ZnS NPs could in-duce some hydrophobic interaction for BSA and BLG adsorption.BSA showed higher adsorption compared to BLG. Higher adsorp-tion of BSA despite electrostatic repulsion is attributed to increasein entropy resulting from perturbations in the relatively ‘‘soft’’ a-helical structure of serum albumin [34]. On the other hand, BLGprobably interacted with the negative surface of ZnS NPs withthe positive patches on its surface. Similar sort of interaction ofthe positive and negative patches of the protein surface involvinginteraction is reported in the literature [27]. Also, proteins adsorb-ing at positively or negatively charged interfaces tend to exposeoppositely charged regions to the surface although the overallcharges of both the species are same [35]. Further supportive evi-dence in favor of the structural deformation and the basis of suchdeformation for BSA and BLG could be drawn from Fig. 7. It (Fig. 7)represents the surface potential of BSA and BLG at pH 7 [36]. The
yptophan residues at pH 7. (BSA pdb code: 3V03 and BLG pdb code: 3BLG was used.
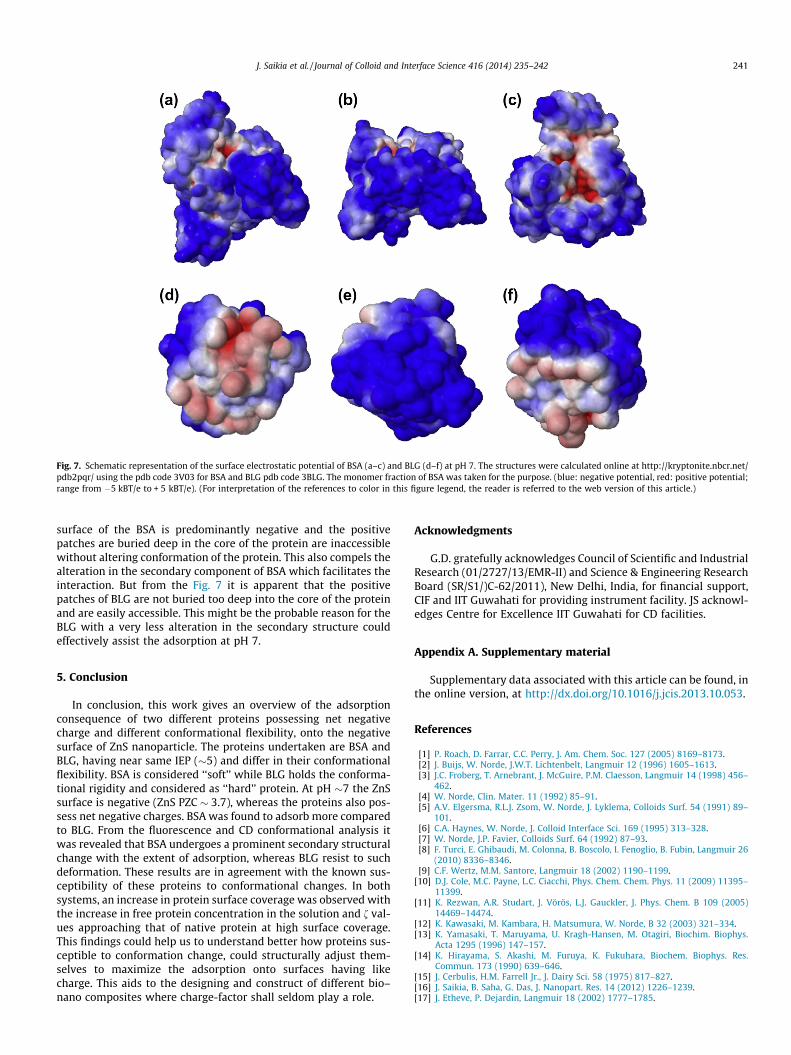
Fig. 7. Schematic representation of the surface electrostatic potential of BSA (a–c) and BLG (d–f) at pH 7. The structures were calculated online at http://kryptonite.nbcr.net/pdb2pqr/ using the pdb code 3V03 for BSA and BLG pdb code 3BLG. The monomer fraction of BSA was taken for the purpose. (blue: negative potential, red: positive potential;range from �5 kBT/e to + 5 kBT/e). (For interpretation of the references to color in this figure legend, the reader is referred to the web version of this article.)
J. Saikia et al. / Journal of Colloid and Interface Science 416 (2014) 235–242 241
surface of the BSA is predominantly negative and the positivepatches are buried deep in the core of the protein are inaccessiblewithout altering conformation of the protein. This also compels thealteration in the secondary component of BSA which facilitates theinteraction. But from the Fig. 7 it is apparent that the positivepatches of BLG are not buried too deep into the core of the proteinand are easily accessible. This might be the probable reason for theBLG with a very less alteration in the secondary structure couldeffectively assist the adsorption at pH 7.
5. Conclusion
In conclusion, this work gives an overview of the adsorptionconsequence of two different proteins possessing net negativecharge and different conformational flexibility, onto the negativesurface of ZnS nanoparticle. The proteins undertaken are BSA andBLG, having near same IEP (�5) and differ in their conformationalflexibility. BSA is considered ‘‘soft’’ while BLG holds the conforma-tional rigidity and considered as ‘‘hard’’ protein. At pH �7 the ZnSsurface is negative (ZnS PZC � 3.7), whereas the proteins also pos-sess net negative charges. BSA was found to adsorb more comparedto BLG. From the fluorescence and CD conformational analysis itwas revealed that BSA undergoes a prominent secondary structuralchange with the extent of adsorption, whereas BLG resist to suchdeformation. These results are in agreement with the known sus-ceptibility of these proteins to conformational changes. In bothsystems, an increase in protein surface coverage was observed withthe increase in free protein concentration in the solution and f val-ues approaching that of native protein at high surface coverage.This findings could help us to understand better how proteins sus-ceptible to conformation change, could structurally adjust them-selves to maximize the adsorption onto surfaces having likecharge. This aids to the designing and construct of different bio–nano composites where charge-factor shall seldom play a role.
Acknowledgments
G.D. gratefully acknowledges Council of Scientific and IndustrialResearch (01/2727/13/EMR-II) and Science & Engineering ResearchBoard (SR/S1/)C-62/2011), New Delhi, India, for financial support,CIF and IIT Guwahati for providing instrument facility. JS acknowl-edges Centre for Excellence IIT Guwahati for CD facilities.
Appendix A. Supplementary material
Supplementary data associated with this article can be found, inthe online version, at http://dx.doi.org/10.1016/j.jcis.2013.10.053.
References
[1] P. Roach, D. Farrar, C.C. Perry, J. Am. Chem. Soc. 127 (2005) 8169–8173.[2] J. Buijs, W. Norde, J.W.T. Lichtenbelt, Langmuir 12 (1996) 1605–1613.[3] J.C. Froberg, T. Arnebrant, J. McGuire, P.M. Claesson, Langmuir 14 (1998) 456–
462.[4] W. Norde, Clin. Mater. 11 (1992) 85–91.[5] A.V. Elgersma, R.L.J. Zsom, W. Norde, J. Lyklema, Colloids Surf. 54 (1991) 89–
101.[6] C.A. Haynes, W. Norde, J. Colloid Interface Sci. 169 (1995) 313–328.[7] W. Norde, J.P. Favier, Colloids Surf. 64 (1992) 87–93.[8] F. Turci, E. Ghibaudi, M. Colonna, B. Boscolo, I. Fenoglio, B. Fubin, Langmuir 26
(2010) 8336–8346.[9] C.F. Wertz, M.M. Santore, Langmuir 18 (2002) 1190–1199.
[10] D.J. Cole, M.C. Payne, L.C. Ciacchi, Phys. Chem. Chem. Phys. 11 (2009) 11395–11399.
[11] K. Rezwan, A.R. Studart, J. Vörös, L.J. Gauckler, J. Phys. Chem. B 109 (2005)14469–14474.
[12] K. Kawasaki, M. Kambara, H. Matsumura, W. Norde, B 32 (2003) 321–334.[13] K. Yamasaki, T. Maruyama, U. Kragh-Hansen, M. Otagiri, Biochim. Biophys.
Acta 1295 (1996) 147–157.[14] K. Hirayama, S. Akashi, M. Furuya, K. Fukuhara, Biochem. Biophys. Res.
Commun. 173 (1990) 639–646.[15] J. Cerbulis, H.M. Farrell Jr., J. Dairy Sci. 58 (1975) 817–827.[16] J. Saikia, B. Saha, G. Das, J. Nanopart. Res. 14 (2012) 1226–1239.[17] J. Etheve, P. Dejardin, Langmuir 18 (2002) 1777–1785.

242 J. Saikia et al. / Journal of Colloid and Interface Science 416 (2014) 235–242
[18] S. Chakraborti, P. Joshi, D. Chakravarty, V. Shanker, Z.A. Ansari, S.P. Singh, P.Chakrabarti, Langmuir 28 (2012) 11142–11152.
[19] K. Sakurai, T. Konuma, M. Yagi, Y. Goto, Biochim. Biophys. Acta 1790 (2009)527–537.
[20] J.R. Lakowicz, Principles of Fluorescence Spectroscopy, Third ed., Plenum Press,New York, 2006.
[21] G.Z. Chen, X.Z. Huang, J.G. Xu, Z.Z. Zheng, Z.B. Wang, The Methods ofFluorescence Analysis, Second ed., Beijing Science Press, Beijing, 1990.
[22] S.M. Andrade, T.I. Carvalho, M.I. Viseu, S.M. Costa, Eur. J. Biochem. 271 (2004)734–744.
[23] D. Wu, Z. Chen, X. Liu, Spectrochim. Acta A 84 (2011) 178–183.[24] S. Laera, G. Ceccone, F. Rossi, D. Gilliland, R. Hussain, G. Siligardi, L. Calzolai,
Nano Lett. 11 (2011) 4480–4484.[25] M.A. Tam, K. Hamad-Schifferli, Langmuir 21 (2005) 12080–12084.[26] N. Taulier, T.V. Chalikian, J. Mol. Biol. 314 (2001) 73–89.[27] F. Meder, C. Brandes, L. Treccani, K. Rezwan, Acta Biomater. 9 (2013) 5780–
5787.
[28] R.A. Hartvig, M. van de Weert, J. Ostergaard, L. Jorgensen, H. Jensen, Langmuir27 (2011) 2634–2643.
[29] Z. Adamczyk, M. Nattich, M. Wasilewska, M. Zaucha, Adv. Colloid Interface Sci.168 (2011) 3–28.
[30] M. Rabe, D. Verdes, J. Zimmermann, S. Seeger, J. Phys. Chem. B 112 (2008)13971–13980.
[31] M.S. Andrade, M.B. Costa, Biophys. J. 82 (2002) 1607–1619.[32] W. Norde, Colloids Surf. B 61 (2008) 1–9.[33] S. Tenzer, D. Docter, S. Rosfa, A. Wlodarski, J. Kuharev, A. Rekik, S.K. Knauer, C.
Bantz, T. Nawroth, C. Bier, J. Sirirattanapan, W. Mann, L. Treuel, R. Zellner, M.Maskos, H. Schild, R.H. Stauber, ACS Nano 5 (2011) 7155–7167.
[34] W. Norde, J. Lyklema, J. Colloid Interf. Sci. 66 (1978) 295–302.[35] M. Rabe, D. Verdes, S. Seeger, Adv. Colloid Interface Sci. 162 (2011) 87–106.[36] T.J. Dolinsky, J.E. Nielsen, J.A. McCammon, N.A. Baker, Nucleic Acids Res. 32
(2004) 665–667.