Optical and Dispersion Parameters of ZnS Thin Films Prepared by Flash Evaporation Method
12
Available online at www.ilcpa.pl International Letters of Chemistry, Physics and Astronomy 20(1) (2014) 52-63 ISSN 2299-3843 Optical and Dispersion parameters of ZnS Thin Films Prepared by Flash Evaporation Method Nabeel A. Bakr 1 , Nidhal N. Jandow 2 , Nadir F. Habubi 2, * 1 Department of Physics, College of Science, University of Diyala, Diyala, Iraq 2 Department of Physics, College of Education, Al-Mustansiriyah University, Baghdad, Iraq *E-mail address: [email protected] ABSTRACT Zns thin films are obtained by flash evaporation method onto preheated glass substrates. The transmittance analysis allowed the determination of refractive index and thickness using envelope method. It was found that the refractive dispersion data obeyed the single oscillator model. The calculated value of the refractive index (n o ) was found to be equal to 2.27, which is in a good agreement with the value obtained from Cauchy’s fitting. Also the value of the optical energy gap, extinction coefficient, real and imaginary parts of the dielectric constant and optical conductivity have been measured. Keywords: ZnS thin film; flash evaporation; Swanepoel technique; single oscillator model 1. INTRODUCTION Recently there has been a considerable attention on Zinc sulphide (ZnS) due to its wide applications. ZnS with a wide optical gap (~3.7 eV) has unique physical properties, such as high refractive index (2.3), low optical absorption in the visible and infrared spectral region (0.4-13 m) and high effective dielectric constant (9) [1,2]. The use of a wider band gap S.C., such as ZnS instead of CdS could cause to decrease in window absorption losses and improve the short circuit current [3,4]. There has been a considerable progress to use ZnS in CIGS thin film solar cells with efficiency up to 18.6 % [5]. It can be used as a light emitting diode (LED) in blue to ultraviolet spectrum region [6]. ZnS is a promising material that can be used as a beam splitting and a band pass filter over the region between 400 and 1400 nm [7], also, it can be used in the future of data storage and data transfer. ZnS has a low excitonic Bohr radius of (2.5 nm) that makes its nanoparticle interesting as small biomoleculer probes for laser scanning microscope [8]. Various techniques have been used to prepare ZnS such as close-spaced vacuum sublimation technique (CSVS) [9], pulse plated [10], thermal evaporation [11], successive ionic layer adsorption and reaction (SILAR) [12], RF magnetron sputtering [13], chemical
Transcript of Optical and Dispersion Parameters of ZnS Thin Films Prepared by Flash Evaporation Method

Available online at www.ilcpa.pl
International Letters of Chemistry, Physics and Astronomy
20(1) (2014) 52-63 ISSN 2299-3843
Optical and Dispersion parameters of ZnS Thin Films Prepared by Flash Evaporation Method
Nabeel A. Bakr1, Nidhal N. Jandow2, Nadir F. Habubi2,* 1Department of Physics, College of Science, University of Diyala, Diyala, Iraq
2Department of Physics, College of Education, Al-Mustansiriyah University, Baghdad, Iraq
*E-mail address: [email protected]
ABSTRACT
Zns thin films are obtained by flash evaporation method onto preheated glass substrates. The
transmittance analysis allowed the determination of refractive index and thickness using envelope
method. It was found that the refractive dispersion data obeyed the single oscillator model. The
calculated value of the refractive index (no) was found to be equal to 2.27, which is in a good
agreement with the value obtained from Cauchy’s fitting. Also the value of the optical energy gap,
extinction coefficient, real and imaginary parts of the dielectric constant and optical conductivity have
been measured.
Keywords: ZnS thin film; flash evaporation; Swanepoel technique; single oscillator model
1. INTRODUCTION
Recently there has been a considerable attention on Zinc sulphide (ZnS) due to its
wide applications. ZnS with a wide optical gap (~3.7 eV) has unique physical properties, such
as high refractive index (2.3), low optical absorption in the visible and infrared spectral region
(0.4-13 m) and high effective dielectric constant (9) [1,2]. The use of a wider band gap S.C.,
such as ZnS instead of CdS could cause to decrease in window absorption losses and improve
the short circuit current [3,4].
There has been a considerable progress to use ZnS in CIGS thin film solar cells with
efficiency up to 18.6 % [5]. It can be used as a light emitting diode (LED) in blue to
ultraviolet spectrum region [6]. ZnS is a promising material that can be used as a beam
splitting and a band pass filter over the region between 400 and 1400 nm [7], also, it can be
used in the future of data storage and data transfer. ZnS has a low excitonic Bohr radius of
(2.5 nm) that makes its nanoparticle interesting as small biomoleculer probes for laser
scanning microscope [8].
Various techniques have been used to prepare ZnS such as close-spaced vacuum
sublimation technique (CSVS) [9], pulse plated [10], thermal evaporation [11], successive
ionic layer adsorption and reaction (SILAR) [12], RF magnetron sputtering [13], chemical

International Letters of Chemistry, Physics and Astronomy 20(1) (2014) 52-63
-53-
vapor deposition [14], electrodeposition [15], spray pyrolysis [16], and flash evaporation
technique [17].
In this work, we report the preparation of ZnS thin films on glass substrates by using
flash evaporation method and subsequently the optical properties of ZnS thin films were
characterized by a transmission spectrum to utilize Swanepoel method and Wemple
Didomenico model for dispersion relation, etc. [32-37].
2. EXPERIMENTAL PROCEDURE
ZnS thin films were prepared by the flash evaporation method on a preheated glass
substrate at 100 °C in order to get uniform films which was clearly seen in the transmittance
spectra. High purity of ZnS (from the Sigma - Aldirch company) were evaporated by using a
molybdenum boat filament in a high vacuum chamber evacuated to ~ 10-6
Torr. During the
deposition, the filament and the substrate were kept about 10 cm apart from the target.
According to this distance the resultant films were quite uniform. The thickness of the
deposited films was measured by Gravimetric method and was compared with the thickness
obtained from the envelope method. Optical transmittance spectra were recorded by a double
beam UV/Vis spectrophotometer (Shimdzu-1650 U-probe, Japan) in the wavelength range
(340-900 nm).
3. RESULTS AND DISCUSSION
300 400 500 600 700 800 900
0.0
0.2
0.4
0.6
0.8
1.0
0.0
0.2
0.4
0.6
0.8
1.0
Ts T
M
Tra
nsm
itta
nce
Wavelength (nm)
Tm
Fig. 1. The optical transmission spectrum of ZnS film vs. wavelength.

International Letters of Chemistry, Physics and Astronomy 20(1) (2014) 52-63
-54-
Figure 1 represents the optical transmission spectrum of ZnS film of 300 nm thickness
measured by Gravimetric method. The interference maxima and minima due to multiple
reflection on film surface can be observed. According to Swanepoel [18], the transmission T
for normal incidence is given by [19,20]:
)1(..........cos 2DxCxB
AxT
where A = 16n2ns, B = (n+1)
3(n+ns)
2, = 4πnd, and x = exp (-d)
The interference fringes can be obtained from Eq.1 by setting the interference condition
cos φ = 1 and cos φ = 1 for T maxima (TM (λ)) and T minima (Tm(λ)) respectively.
The refractive index (n) of the film with uniform thickness can be calculated from the
two envelopes, (TM (λ)) and (Tm(λ)), by considering the extremes of the interference fringes,
Maxima )2(..........2DxCxB
AxTM
Minima )3(..........2DxCxB
AxTm
Subtracting the reciprocals of Eq. 2 into Eq. 3 yields an expression that is independent of the
absorbance, x:
)4......(..........211
A
C
TT Mm
Rearranging it for n, one can get the expression:
)5(..........])([ 2/12/122
11 sNNn
where )6(..........2
12
2
1
s
TT
TTsN
mM
mM
TM and Tm are the two envelopes constructed from the measured transmission spectrum
using a suitable computer program to cover the original transmission spectrum, and ns is the
refractive index of the substrate. Since the last equation is not valid in the strong absorption
region, where there are no maxima and minima, the calculated refractive index was fitted to a
dispersion model, such as two-term Cauchy dispersion relationship, for extrapolation to
shorter wavelengths before it can be used to obtain other optical constants. The substrate
refractive index (ns) can be easily calculated by measuring the transmittance of the substrate
alone (Ts) using the well known equation:
)7........(..........)11
(1 2/1
ss TTs

International Letters of Chemistry, Physics and Astronomy 20(1) (2014) 52-63
-55-
The values of TM and Tm shown in table (1) are the transmission maximum and the
corresponding minimum at a certain wavelength (λ), one being measured and the other
calculated from the envelopes. The refractive index values can be obtained from (Eq. 5) are
shown as n1 for demonstration in the Table 1 and these values will be improved after
calculating film thickness (d) as will be explained below.
If ne1 and ne2 are the refractive indices of two adjacent maxima and minima at λ1 and λ2
then, the film thickness is given by the expression:
)8........(..........)(2 1221
21
ee nnd
The values of the determined (d) using this equation are listed in Table 1. The average
value of d1 )( 1d can be used now along with the values of λ and n1 to estimate the values of
interference order (mo) using the equation below:
)9........(..........2 mnd
The values of mo must be corrected to the exact integers or half integers. These
corrected values (m) can be used to calculate new values of thickness (d2). The average
thickness )( 2d can be used now along with the values of λ and m to calculate the improved
values of n which are shown in the Table 1as n2. Now the values of n2 can be fitted to two-
term Cauchy dispersion relationship [21].
)10........(..........2
ban
where a and be are coefficients that can be determined for a material by fitting the equation to
measure refractive indices at known wavelengths. This can be used for extrapolation to short
wavelengths. It is clear that the calculated thickness using the envelope method is in good
agreement with the thickness value which is measured by gravimetric method and the
difference is ~ 4 %.
Table 1. A summary of the values of TM, Tm, s, n1, d1, mo, m, d2, n2 for ZnS thin film the underlined
and bold values are calculated from the envelopes. The values of refractive index and film thickness
are calculated according to the envelope method.
(nm) TM Tm s n1 d1
(nm) mo m
d2
(nm) n2
775.0 0.889 0.631 1.533 2.402 ……. 2.333 1.790 1.500 242.0
595.0 0.863 0.614 1.533 2.416 ……. 2.350 2.000 246.3 2.388
486.8 0.854 0.606 1.533 2.428 264.9 2.890 2.500 250.6 2.442

International Letters of Chemistry, Physics and Astronomy 20(1) (2014) 52-63
-56-
422.5 0.844 0.593 1.533 2.458 314.9 3.370 3.000 257.9 2.543
)1(d =
289.9
)( 2d =
249.2
200 300 400 500 600 700 800 900 1000
2.0
2.2
2.4
2.6
2.8
3.0
3.2
Re
fra
ctive
In
de
x (
n)
Wavelength (nm)
no = 2.24
Cauchy dispersion function
Fig. 2. the variation of refractive index obtained from the Cauchy relation vs. wavelength.
According to the single- effective oscillator model proposed by Wemple and
DiDomenico [22,23] the optical data can be described to an excellent approximation by the
relation:
)11........(..........122
2
EE
EEn
o
od
where (E = h is the photon energy, n is the refractive index, Eo is the single- effective
oscillator energy and Ed is the dispersion energy which is a measure of the average strength of
the inter-band optical transitions. Plotting (n2-1)
-1 against E
2 gives the oscillator parameters by
fitting a straight line. Figure 3 shows the Plot of (n2-1)
-1 versus E
2 for ZnS sample. The values
of Eo and Ed can be then calculated from the slope (EoEd)-1
which is the intercept on the
vertical axis (Eo/Ed). The calculated values of Eo and Ed were found to be 6.256 eV and 25.99
eV respectively.
Furthermore, the values of the static refractive index (no) can be calculated by
extrapolating the Wemple-DiDomenic dispersion equation to Eo. The calculated value of no
was found equal to 2.27 and this value is in a good agreement with the obtained value from

International Letters of Chemistry, Physics and Astronomy 20(1) (2014) 52-63
-57-
Cauchy fitting (see Fig. 2).In addition, the optical band gap (Eg) can be also determined from
the Wemple-DiDomenic dispersion parameter Eo, which can be related in a close
approximation Eo ≈ 2Eg [23].
0 2 4 6 8 10 12 14 16 18
0.12
0.14
0.16
0.18
0.20
0.22
0.24
0.26
(1-n
2)-1
(h (eV
2)
Fig. 3. (1-n2)
-1 versus (hυ)
2 for ZnS thin film.
The absorption coefficient () can be calculated using the equation [24]:
)12.........().........ln(1
xd
where d is the film thickness and x is the absorbance which is given by the well known
formula [25]:
)13........(..........)1(2[ 2/1
32
2
Q
RRQTppx
where )1)(1)(1( 321 RRRP
and )2(2 3213121 RRRRRRRTQ
R1, R2, and R3 are the reflectance of the air-film, film-substrate and substrate-air interfaces
respectively and are given by:
International Letters of Chemistry, Physics and Astronomy 20(1) (2014) 52-63
-58-
2
11
1
n
nR ,
2
2
sn
snR and )14.(..........
1
12
3
s
sR
In the spectral region with the interference the interference fringes, Ta is the geometric
mean of TM and Tm and is given by:
)15....(..........)( 2/1
mM TTT
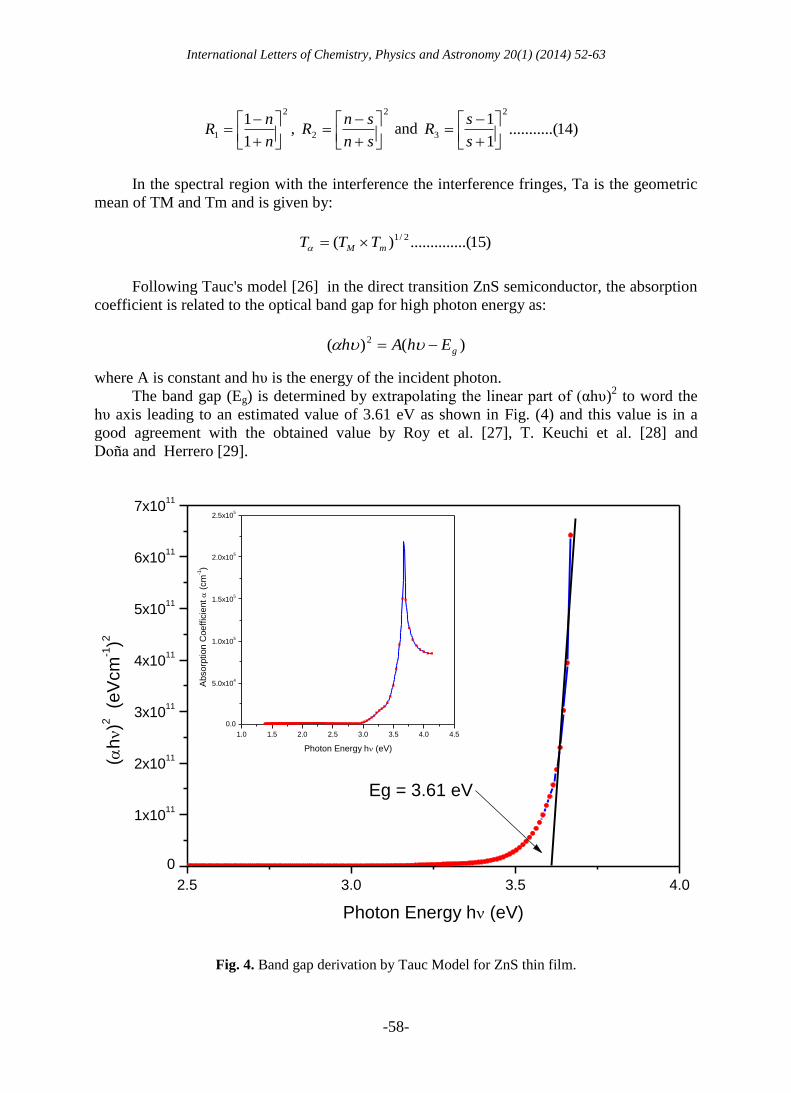
Following Tauc's model [26] in the direct transition ZnS semiconductor, the absorption
coefficient is related to the optical band gap for high photon energy as:
)()( 2
gEhAh
where A is constant and hυ is the energy of the incident photon.
The band gap (Eg) is determined by extrapolating the linear part of (αhυ)2 to word the
hυ axis leading to an estimated value of 3.61 eV as shown in Fig. (4) and this value is in a
good agreement with the obtained value by Roy et al. [27], T. Keuchi et al. [28] and
Doña and Herrero [29].
Fig. 4. Band gap derivation by Tauc Model for ZnS thin film.
2.5 3.0 3.5 4.0
0
1x10¹¹
2x10¹¹
3x10¹¹
4x10¹¹
5x10¹¹
6x10¹¹
7x10¹¹
1.0 1.5 2.0 2.5 3.0 3.5 4.0 4.5
0.0
5.0x10⁴
1.0x10⁵
1.5x10⁵
2.0x10⁵
2.5x10⁵
(h)2
(e
Vcm
-1)2
Photon Energy h (eV)
Eg = 3.61 eV
Absorp
tion C
oeff
icie
nt
(cm
-1)
Photon Energy h (eV)

International Letters of Chemistry, Physics and Astronomy 20(1) (2014) 52-63
-59-
The imaginary part of the complex index of refraction k is a measure of the fraction of
light lost due to scattering and absorption per unit distance of the penetration medium. It can
be estimated from the values of α and λ using the relation [30]: From Fig. 5, it can be seen
that the extinction coefficient decreases as the wavelength increases.
200 300 400 500 600 700 800 900 1000
0.0
0.1
0.2
0.3
0.4
0.5
0.6
0.7
Extin
ctio
n C
oe
ffic
ien
t K
Wavelength (nm)
Fig. 5. The variation of extinction coefficient of ZnS thin film on wavelength.
22 knr and nki 2
where the real part describes the propagation characteristics, while the imaginary part
describes the rate of attenuation along the propagation direction. Figures 6 and 7 present the
dependence of the dielectric constant of ZnS thin film. The values of the real part are higher
than those of the imaginary part, Fig. 6 also shows that the real decreases exponentially as the
wavelength increases while Fig. 7 shows that the imaginary part also decrease as the
wavelength increases in the range of 300 to 420 nm and then keep with a constant value in the
range above 420 to 900 nm. The optical response of the ZnS is mainly studied in terms of the
optical conductivity (σ) which is given by the relation [24]:
4
nc
Figure 8 shows the dependence of the optical conductivity on the wavelength, from the
figure we can see that the optical conductivity decreases with the increasing of wavelength
which could be related to the decrease in the extinction coefficient and the density of localized
states in the gap [31].

International Letters of Chemistry, Physics and Astronomy 20(1) (2014) 52-63
-60-
200 300 400 500 600 700 800 900 1000
5.0
5.5
6.0
6.5
7.0
7.5
8.0
Re
al p
art
of d
iele
ctr
ic c
on
sta
nt r
Wavelength (nm)
Fig. 6. The variation of real part of of the dielectric constant of ZnS thin film on wavelength.
200 300 400 500 600 700 800 900 1000
0.0
0.5
1.0
1.5
2.0
2.5
3.0
3.5
4.0
Ima
gin
ary
pa
rt o
f d
iele
ctr
ic c
on
sta
nt i
Wavelength (nm)
Fig. 7. The variation of imaginary part of the dielectric constant of ZnS thin film on wavelength.

International Letters of Chemistry, Physics and Astronomy 20(1) (2014) 52-63
-61-
200 300 400 500 600 700 800 900 1000
0.0
2.0x10¹²
4.0x10¹²
6.0x10¹²
8.0x10¹²
1.0x10¹³
1.2x10¹³
1.4x10¹³
1.6x10¹³
Op
tica
l co
nd
uctivity
(S
-1)
Wavelength (nm)
Fig. 8. The dependence of the optical conductivity on wavelength.
4. CONCLUSIONS
In summary, ZnS thin films were prepared successfully by flash evaporation technique.
The refractive index and the thickness were obtained from the transmission data by using
Swanepoel method. It was found that the calculated value of the thickness, which obtained by
using the envelope method was in a good agreement with the thickness value which measured
by gravimetric method and the difference was ~ 4 %. The results also showed that the the
static refractive index value which obtained from the dispersion relation was in a good
agreement with the value which calculated from Cauchy’s relation. The optical energy gap
was found to be equal to 3.61 eV.
References
[1] X. Wu, F. Lai, L. L. Jing Lv, B. Zhuang, Q. Yan, Z. Huang, Appl. Surf. Sci. 254 (2008)
6455.
[2] A. Oliva, I. onz lez-Chan, V. ej n, J. Rojas, R. Patiño, D. Aguilar, CCE, IEEE,
(2010) 500-503.
[3] P. O'Brien, D. J. Otway, D. Smyth-Boyle, Thin solid Films 361 (2000) 17.
[4] Tokio Nakada, Masashi Hongo, Eiji Hayashi, Thin Solid Films 431-432 (2003)
242-248.
[5] M.A. Contreras, T. Nakada, M. Hongo, A.O. Pudov, J.R. Sites, Proceedings 3rd World
Conference of Photovoltaic Energy Conversion,Osaka, Japan, (2003) 570.

International Letters of Chemistry, Physics and Astronomy 20(1) (2014) 52-63
-62-
[6] S. Yamaga, A. Yoshokawa, H. Kasain, J. Cryst. Growth 86 (1998) 252.
[7] J . Cheng, D.B. Fan, H. Wang1, B.W. Liu, Y. C. Zhang, H. Yan, Semicond. Sci.
Technol. 18 (2003) 676.
[8] P. J.Borah, C. K.Sarma, Acta Phys. Pol. A 114 (2008) 713.
[9] D. Kurbatov, S. Kshnyakina, A. Opanasyuk, V. Melnik, V. Nesprava, Rom. J. Phys. 55
(2010) 213.
[10] R. K. Murali, S. Vasantha, K. Rajamma, Mater. Lett. 2 (12-13) (2008) 1823.
[11] X. Wu, F. Lai, L. Lin, J. Lv, B. Zhuang, Q. Yan, Z. Huang, Appl. Surf. Sci. 254 (2008)
6455-6460.
[12] A. Ateş, M. Ali Yıldırım, M. Kundakcı, A. Astam, Mater. Sci. Semicond. Process. 10
(2007) 281.
[13] P. K. Ghosh, S. Jana, S. Nandy, K. K. Chattopadhyay, Mater. Res. Bull. 42 (2007) 505.
[14] T. Kryshtab, V.S. Khomchenko, J.A. Andraca-Adame, L.V. Zavyalova, N.N.
Roshchina, V.E. Rodionov, V.B. Khachatryan, Thin Solid Films 515(2) (2006) 513-516.
[15] B. A. Bhalerao, D. C. Lokhande, G. B.Wagh, IEEE. Trans. Nanotechnol. 12(6)
(2013) 996-1001.
[16] D. Balamurugan, B.G. Jeyaprakash, R. Chandiramouli, J. Appl. Sci. 12 (2012) 1701-
1705.
[17] N. F. Haubi, K. A. Midhjil, H. G. Rashid, H. L, Mansour, Mod. Phys. Let. B 24 (2010)
28.
[18] R. Swanepoel, J. Phys. E: Sci. Instrum. 17 (1984) 896.
[19] Nabeel Ali Bakr, PhD. Thesis Pune university India (2010).
[20] R. Swanepoel, J. Phys. E: Sci. Instrum. 16 (1983) 1214.
[21] T. S. Moss, Optical properties of semiconductors (Butterworths, London, 1959).
[22] S. H. Wemple, M. DiDomenico, Phys. Rev. Lett. 23 (1969) 1156.
[23] S. H. Wemple, M. DiDomenico, Phys. Rev. B 3 (1971) 1338.
[24] J. L. Pankove, " Optical processes on semiconductors Dover publication", New York
1967.
[25] N. A. Bakr, A. M. Fund, V S Waman, M. M. Kamble, R. R Hawaldar, D. P.
Amalnerkar, S. W. Gosavi, Pramana - J. Phys. 76(3) (2011) 519-531.
[26] J. Tauc, The optical properties of solids (North-Holland, Amsterdam, 1970).
[27] P. Roy, J.R. Ota, S.K. Srivastava, Thin Solid Films 515 (2006) 1912.
[28] K. Takeuchi, M. Ichimura, E. Arai, Y. Yamazaki, Sol. Energy Mater. Sol. Cells
75 (2003) 427.
[29] J. M. Doña, J. Herrero, J. Electrochem. Soc. 141 (1994) 205.
[30] J. C. Manifacier, J. Gasiot, J. P. Fillard, J. Phys. E 9 (1976) 1002.
[31] E.R. Shaaban, J. Phys. Chem. 73 (2012) 1131.

International Letters of Chemistry, Physics and Astronomy 20(1) (2014) 52-63
-63-
[32] Raid A. Ismail, Nadir F. Habubi, Hussam R. Abid, International Letters of Chemistry,
Physics and Astronomy 4 (2014) 37-47.
[33] Ali M. Mous, Selma M. Al-Jawad, Suad M. Kadhim Al-Shammari, International
Letters of Chemistry, Physics and Astronomy 6 (2014) 16-25.
[34] Hanan R. A. Ali, International Letters of Chemistry, Physics and Astronomy 8 (2014)
47-55.
[35] Raghad Y. Mohammed, S. Abduol, Ali M. Mousa, International Letters of Chemistry,
Physics and Astronomy 11(2) (2014) 146-158.
[36] S. M. Patil, P. H. Pawar, International Letters of Chemistry, Physics and Astronomy
17(1) (2014) 21-36.
[37] S. M. Patil, P. H. Pawar, International Letters of Chemistry, Physics and Astronomy
17(2) (2014) 153-167.
( Received 05 September 2014; accepted 14 September 2014 )


![Fluorescent cellulose aerogels containing covalently immobilized (ZnS) ₓ (CuInS ₂) ₁₋ ₓ/ZnS (core/shell) quantum dots [2013]](https://static.fdokumen.com/doc/165x107/63372dc94554fe9f0c05b209/fluorescent-cellulose-aerogels-containing-covalently-immobilized-zns-cuins.jpg)


![0 [Type the document subtitle] [Pick the date] Dasar-Dasar Membuat Media Pembelajaran Dengan Dengan Dengan Dengan Flash Flash Flash Flash](https://static.fdokumen.com/doc/165x107/632259f164690856e109202b/0-type-the-document-subtitle-pick-the-date-dasar-dasar-membuat-media-pembelajaran.jpg)

