Evaporation from Porous Surfaces into Turbulent Airflows
266
ETH Library Evaporation from porous surfaces into turbulent airflows Doctoral Thesis Author(s): Haghighi, Erfan Publication date: 2015 Permanent link: https://doi.org/10.3929/ethz-a-010489645 Rights / license: In Copyright - Non-Commercial Use Permitted This page was generated automatically upon download from the ETH Zurich Research Collection . For more information, please consult the Terms of use .
-
Upload
khangminh22 -
Category
Documents
-
view
1 -
download
0
Transcript of Evaporation from Porous Surfaces into Turbulent Airflows

ETH Library
Evaporation from porous surfacesinto turbulent airflows
Doctoral Thesis
Author(s):Haghighi, Erfan
Publication date:2015
Permanent link:https://doi.org/10.3929/ethz-a-010489645
Rights / license:In Copyright - Non-Commercial Use Permitted
This page was generated automatically upon download from the ETH Zurich Research Collection.For more information, please consult the Terms of use.

Evaporation from Porous Surfaces into Turbulent Airflows From Pores to Eddies
Erfan Haghighi
Diss. ETH No. 22804


DISS. ETH No. 22804
EVAPORATION FROM POROUS SURFACES INTO TURBULENT AIRFLOWS
FROM PORES TO EDDIES
A thesis submitted to attain the degree of
DOCTOR OF SCIENCES of ETH ZURICH (Dr. sc. ETH Zurich)
Presented by
ERFAN HAGHIGHI MSc in Mechanical Engineering, Sharif University of Technology
born on 27.07.1985 citizen of Iran
accepted on the recommendation of
Prof. Dr. Dani Or Prof. Dr. Rainer Helmig
Prof. Dr. Jan Vanderborght
2015


To Maryam and my parents


Abstract Evaporation from porous media is a ubiquitous process appearing in many applications from soil and hydrology to biological and food processing, thermally enhanced oil recovery, drying of textiles and granular materials, and many other engineering applications. Evaporation is a key process in land-atmosphere mass and energy exchange driving the hydrological cycle and affecting energy balance of terrestrial surfaces. Evaporative drying of terrestrial surfaces involves coupled heat and mass transfer and depends on hydraulic properties of the medium, energy input, and vapor exchange between the porous medium surface and the atmosphere. Despite the importance of landscape-scale evaporative water loss from terrestrial surfaces that affects water availability for plants and microorganisms inhabiting the soil, predictions remain a challenge due to complex interactions between ambient (e.g., airflow turbulence and incoming shortwave radiation) and soil (e.g., internal hydraulic properties and surface relief) conditions resulting in rich surface evaporation dynamics.
This PhD thesis presents physically based models and experimental methods addressing links between surface-atmosphere interactions and evaporation dynamics during stage-I evaporation (vaporization plane at the surface) to account for new fundamental aspects of evaporative water losses from porous surfaces defining landscape-scale fluxes and drying dynamics. We specifically focused on exchange rates across a thin boundary layer adjacent to the surface (termed viscous sublayer) where water vapor fluxes are dominated by molecular diffusion, and often give rise to nonlinear surface wetness-dependent resistances that must be considered properly for estimating evaporative fluxes from drying porous surfaces.
Representing a porous surface by a single effective pore size where surface water content (density of evaporating pores per surface) varies to mimic surface drying enabled us to systematically assess dominant contribution of vapor diffusion in vertical and longitudinal directions (over advection) in flux generation for most practical conditions. This, in turn, provided the opportunity to formulate a generalized top boundary condition for an effective resistance to water vapor transfer from porous surfaces linking surface properties (pore size and hydraulic properties), surface water content and boundary layer characteristic into a simple
i

and physically based analytical expression using the pore-scale diffusion model of Schlünder [1988]. To extend the diffusion-based surface resistance model with explicit account of airflow turbulence effects on evaporative fluxes from natural porous surfaces, we invoked concepts from the surface renewal theory and established a mechanistic diffusion-turbulence model for vapor transfer from drying smooth porous surfaces into well-mixed turbulent airflows. The model accounts for localized (and intermittent) variations in the viscous sublayer thickness as determined by airflow turbulence characteristics (parameterized by eddy residence time distribution) that directly affect local and instantaneous evaporative fluxes into surface-interacting eddies.
Considering that highly localized and intermittent eddy-induced variations in evaporative fluxes leave distinct thermal signatures observable by infrared thermography, we capitalized on measured thermal fluctuations of evaporating surfaces to determine the eddy residence time distribution (a momentum field characteristic) and evaporative fluxes. We first focused on thin porous surfaces with low thermal capacity to illustrate experimentally direct links between characteristics of thermal fluctuations and momentum-based turbulent eddy residence times. Our analyses revealed that the inferred statistical properties of surface thermal fluctuations (and turbulence) are independent of the measured location over homogeneously wet surfaces such that a single-point measurement over the surface could provide necessary information for deducing the eddy residence time distribution, and facilitate estimates of surface evaporation. The results also showed that the effects of surface hydro-thermal properties (including surface water content) on the attenuation of surface temperature fluctuations result in a predictable shift in thermally-deduced residence time distribution of eddies. These relations were formalized in theoretical expressions for remotely predicting surface water content and evaporative fluxes from bare soil surfaces during stage-I.
To broaden applicability of the mechanistic pore-scale model to evaporation from bare soil surfaces at the field-scale, we explicitly incorporated the role of atmospheric stability and surface topography (relief and roughness of natural surfaces) on near-surface boundary conditions influencing surface fluxes. Considering continuity of the water vapor flux from the surface across the atmospheric boundary layer (under quasi-steady-state conditions), we proposed a reconciliation procedure to revise the simplistic assumption of a well-mixed turbulent airflow (reflected in the upper water vapor concentration boundary conditions at the border of the viscous sublayer) in the proposed surface-based model by incorporating atmospheric stability considerations from Monin-Obukhov similarity theory (MOST). The proposed reconciliation procedure improved
ii

estimation capabilities of both MOST- and surface-based approaches, and considerably enhanced their accuracy of flux estimation when applied to drying bare soil surfaces. We finally developed physically based models for quantifying interactions of regular sinusoidal wavy and bluff-rough porous surfaces (with different geometrical characteristics) affecting heat and vapor transport into prescribed turbulent airflows. Theoretical predictions and observations (experiments in a wind tunnel) suggested that evaporative fluxes from smooth wavy bare soil surfaces can be either enhanced or reduced (relative to a flat surface under similar conditions) due to interplay between local boundary layer variations and internal limitations to capillary water supply to the evaporating surface. The preliminary results of evaporation from sand surfaces with isolated cylindrical elements (bluff bodies) subjected to constant turbulent airflows also showed a consistent enhancement of evaporative fluxes relative to a similar smooth flat surface due to formation of vortices inducing a thinner boundary layer adjacent to the surface.
Keywords: Evaporation; Porous media; Surface resistance; Turbulent airflow; Surface renewal theory; Thermal signatures; Flux reconciliation; Monin-Obukhove similarity theory; Wavy surface; Surface decoupling; Bluff-body obstacle.
iii


Zusammenfassung Verdunstung aus porösen Medien ist ein allgegenwärtiger Prozess. In zahlreichen Gebieten wie der Bodenkunde, der Hydrologie, der Biologie, bei der Lebensmittel-herstellung oder sekundären Ölfördertechniken, beim Trocknen von Textilien oder körnigen Materialien und in vielen weiteren technischen Anwendungen spielt Ver-dunstung eine zentrale Rolle. Verdunstung ist ein Schlüsselprozess beim Stoff- und Energieaustausch zwischen Erdoberfläche und Atmosphäre. Verdunstung ist zentral im hydrologischen Kreislauf und beeinflusst die Energiebilanz der Erdoberfläche. Oberflächenverdunstung ist mit gekoppeltem Wärme- und Stoffaustausch verbun-den. Die Prozesse beruhen auf den hydrologischen Eigenschaften der porösen Ober-fläche, der Energiezufuhr sowie dem Dampfaustausch zwischen Oberfläche und At-mosphäre. Trotz der Bedeutung der Verdunstungsverluste für die Wasserverfügbar-keit für Pflanzen und Bodenmikroorganismen auf Landschaftsebene bleiben Vorher-sagen weiterhin eine grosse Herausforderung, aufgrund von komplexen Wechselwir-kungen zwischen atmosphärischen (z.B. Turbulenzen und Einstrahlung) und Boden-bedingungen (z.B. hydraulische Bodeneigenschaften und Relief), welche zu vielfälti-ger Verdunstungsdynamik führen.
Diese Dissertation präsentiert physikalische Modelle und experimentelle Methoden, welche das Zusammenspiel der Oberflächen-Atmosphäre-Interaktion und der Ver-dunstungsdynamik auf Landschaftsebene abbilden. Wir haben neue grundlegende Faktoren des Wasserverlusts durch Verdunstung von porösen Oberflächen bei Pha-se-I-Verdunstungsprozessen (Verdampfungsschicht an der Oberfläche) integriert. Dabei haben wir uns auf Austauschraten in einer dünnen Grenzschicht über der Oberfläche, der sogenannten viskosen Teilschicht, konzentriert. Dort werden Was-serdampfflüsse von der molekularen Diffusion dominiert und unterliegen häufig nicht-linearen Beziehungen zwischen Oberflächenfeuchte und Transportwiderstän-den. Zur verbesserten Abschätzung der Verdunstungsflüsse von porösen Oberflächen müssen diese Beziehungen berücksichtigt werden.
Um Oberflächenverdunstung zu simulieren, haben wir eine poröse Oberfläche mit einer einzigen Porengrösse verwendet. Der Oberflächenwassergehalt variiert auf-grund der unterschiedlichen Anordnung und damit der räumlichen Dichte der ver-dunstenden Poren pro Oberfläche. Dies hat uns ermöglicht, den dominanten Beitrag der Dampfdiffusion in vertikaler und horizontaler Richtung (via Advektion) und de-ren Anteil am gesamten Verdunstungsfluss für die meisten Anwendungsbedingungen
iv

zu beurteilen. Wir konnten eine generelle Randbedingung für den effektiven Wider-stand des Wasserdampftransfers von porösen Oberflächen formulieren. Diese inte-griert auf Porenskala die hydraulischen Eigenschaften der Oberfläche, die Poren-grössen, den Oberflächenwassergehalt und Charakteristiken der Grenzschicht in ei-ner einfachen physikalisch basierten analytischen Formel unter Verwendung des Dif-fusionsmodels von Schlünder [1988]. Um das diffusionsbasierte Oberflächenwider-standsmodell mit expliziter Berücksichtigung der Effekte von Windturbulenzen auf Verdunstungsflüsse von natürlichen porösen Oberflächen zu erweitern, haben wir die Konzepte der Oberflächenerneuerungstheorie verwendet. Damit haben wir ein me-chanistisches Diffusionsturbulenz-Modell zur Abbildung des Dampfaustausches zwi-schen glatten, porösen Oberflächen und gut durchmischten turbulenten Luftströmen entwickelt. Das Modell berücksichtigt lokale (und dynamische) Schwankungen der Dicke der viskosen Teilschicht, die durch Charakteristiken der Windturbulenzen be-stimmt wird (parametrisiert durch die Verteilung der Luftwirbel-Verweilzeiten). Die Verweilzeit der Luftwirbel beeinflusst direkt den lokalen und spontanen Wasser-dampfübertritt in oberflächennahe Wirbel.
Berücksichtigt man die lokal stark eingegrenzten durch Luftwirbel verursachten Va-riationen in den Verdunstungsströmen, ergibt sich ein klar ausgeprägtes thermisches Muster, welches mit Infrarot-Thermographie beobachtet werden kann. Um die Ver-teilung der Verweilzeit der Luftwirbel (Charakterisierung der Eigendynamik) und die Verdunstungsflüsse zu bestimmen, haben wir uns auf die messbaren thermischen Fluktuationen der Verdunstungsoberfläche konzentriert. Zuerst haben wir mit einer dünnen, porösen Oberfläche mit tiefer Wärmekapazität gearbeitet. Wir konnten ex-perimentell zeigen, dass ein Zusammenhang zwischen den thermischen Schwankun-gen und der Verweilzeit der Luftwirbel besteht. Unsere Analysen haben gezeigt, dass auf einer homogen feuchten Oberfläche die abgeleiteten, statistischen Eigenschaften der Schwankung von Oberflächentemperatur und Turbulenzen unabhängig vom Ort der Messung sind. Eine Punktmessung enthält damit die nötige Information, um die Verteilung der Verweilzeit der Luftwirbel abzuleiten, was die Abschätzung der Ober-flächenverdunstung wesentlich vereinfacht. Die Resultate zeigen weiter den Dämp-fungseffekt der hydro-thermalen Eigenschaften der Oberfläche (u. a. Oberflächen-wassergehalt) auf die Schwankungen der Oberflächentemperatur. Dies resultiert in einer vorhersagbaren Verlagerung der aus dem thermischen Signal abgeleiteten Ver-teilung der Luftwirbelverweilzeit. Die gefundenen Beziehungen konnten in einer the-oretischen Formel ausgedrückt werden, um den Oberflächenwassergehalt und die Verdunstungsflüsse des vegetationslosen Bodens während der Verdunstungsphase I mittels Fernerkundung vorherzusagen.
Um die Anwendbarkeit des mechanistischen Porenskalenmodells auf Verdunstung von vegetationslosen Bodenoberflächen auf Feldskala zu erweitern, haben wir den
v

Einfluss der atmosphärischen Stabilität und der Oberflächentopographie (Relief, Rauigkeit der natürlichen Oberfläche) auf oberflächennahe Randbedingungen expli-zit einbezogen. Unter Berücksichtigung der Kontinuität der Wasserdampfflüsse von der Oberfläche in die atmosphärische Grenzschicht (unter quasi-stationären Bedin-gungen) entwickelten wir ein Integrationsverfahren, um die vereinfachende Annahme gut durchmischter, turbulenter Flüsse (ausgedrückt in der Grenzbedingung der Wasserdampfkonzentration am Rand der viskosen Teilschicht) zu analysieren, wobei die atmosphärischen Stabilitätsannahmen von Monin-Obukhow's Änlichkeitstheorie (Monin-Obukhov similarity theory, MOST) einbezogen wurden. Das vorgeschlagene Integrationsverfahren verbesserte die jeweilige Schätzgenauigkeit des MOST- und des oberflächenbasierten Ansatzes und verbesserte wesentlich die Genauigkeit zur Verdunstungsschätzung für austrocknende, vegetationslose Bodenoberflächen. Schlussendlich entwickelten wir ein physikalisches Modell, um die Interaktion zwi-schen rauen, regelmässig gewellten Oberflächen mit unterschiedlichen geometrischen Eigenschaften zu quantifizieren und den Einfluss der Oberflächenrauigkeit auf den Wärme- und Dampftransport in die turbulenten Luftströme zu modellieren. Theore-tische Vorhersagen und Beobachtungen im experimentellen Windkanal haben erge-ben, dass – verglichen mit einer ebenen Oberfläche unter gleichen Bedingungen – die Verdunstungsflüsse aus gewellten vegetationslosen Bodenoberflächen im Wech-selspiel mit lokaler Variation in der Grenzschicht und Limitation des kapillaren Wassertransports an die Verdunstungsoberfläche erhöht oder reduziert werden kön-nen. Erste Resultate der Verdunstung bei konstantem turbulentem Luftstrom von Sandoberflächen mit freistehenden, zylinderförmigen Elementen (Wirbelkörper) zei-gen zudem eine konsistente Erhöhung der Verdunstungsflüsse verglichen mit einer Oberfläche ohne Wirbelkörper. Dies liegt an starker Wirbelbildung, welche eine dünne Grenzschicht direkt über der Oberfläche erzeugt.
Schlagworte: Verdunstung; Evaporation; poröses Medium; Oberflächenwiderstand; turbulente Grenzschicht; Oberflächenerneuerungstheorie; thermische Signaturen; Monin-Obukhove Änlichkeitstheorie; gewellte Oberflächen; Oberflächenentkoppe-lung; Wirbelkörper.
vi


Acknowledgement One of the joys of PhD completion is to look back over the past journey leading to this dissertation and to thank all the people who made this challenging journey worth to be traveled.
First and foremost, I would like to express my deepest gratitude to my supervisor, Prof. Dr. Dani Or, for giving me the outstanding opportunity to join his dynamic pioneering research group as a PhD student and work on the fascinating field of evaporation from porous media. His exceptional knowledge, hard work, inspiration, and visionary judgments have been of paramount significance to my professional development and academic growth over the past four years. I enjoyed many hours of fruitful discussions during these past years and benefited a lot from his never ending guidance and support in all aspects of my PhD life. I would also like to thank him for letting me express my points of views and advising me in a very friendly way once a decision had to be taken.
I would like to extend my thanks to two external members of my PhD committee, Prof. Dr. Rainer Helmig and Prof. Dr. Jan Vanderborght, for accepting to review and evaluate the present work. I am also grateful to Prof. Dr. Rainer Schulin for chairing the examination session.
My sincere thanks goes to Ms. Christina Häfliger, Mrs. Sabine Dürig, and Ms. Ursula Baldenweg for all their generous administrative support. A warm and friendly thank to all my colleagues and fellow PhD students at the STEP (ETHZ), who I could not all mention by their name here, for the memorable time we spent together. They have made a wonderful place to work and helped me go through the challenging journey of PhD. In particular, I would like to thank Dr. Peter Lehmann, Dr. Stan Schymanski, Milad Aminzadeh, and Ali Ebrahimi for their valuable support and many insightful comments and discussions during my PhD studies. I would like to acknowledge the tremendous technical support from Daniel Breitenstein and Hans Wunderli who helped me a lot and provided great assistance in several laboratory measurements. I would also like to show my appreciation to Madlene Nussbaum and Dr. Stan Schymanski for their very kind assistance in the German translation of the abstract among many other things.
vii

In the course of this PhD work, I was fortunate enough to meet a lot of colleagues and making a lot of friends. Too many names to mention, but among those I would like to specially thank Dr. Nima Shokri and Dr. Ebrahim Shahraeeni for many fruitful and joyful discussions. I benefited a lot from their support and encouragement to accomplish this milestone in my life.
Last but certainly not least, I am incredibly thankful to my family for their unconditional and continuous love and support. I indeed owe my parents, Batool and Eisa, for all they did for me to be whom I am today. My brother, Aref, deserves my warm appreciations. I truly cannot put my gratitude into words to thank Maryam, my lovely wife, who filled my life with love, joy, and success. She stood shoulder to my shoulder through all ups and downs of PhD life and patiently endured the many long evenings and working weekends that have been necessary to complete this work, and for that I am deeply thankful.
Erfan Haghighi Zürich, July 2015
viii

Contents
Chapter 1 Introduction……………………………………………………………………………………………………………………. 1
1.1 Landscape Evaporation Challenges………………………………………………................... 1 1.2 Outline of the Dissertation…………………………………………………………………………………. 3
Part I: Diffusive Evaporation Fluxes into Turbulent Airflows
Chapter 2 Evaporation Rates across a Convective Air Boundary Layer are dominated by Diffusion…………………………………………………………………………….……………………………………………. 6
2.1 Introduction………………………………………………………………………………………………………. 6 2.2 Theoretical Considerations……………………………………………………………………………… 9 2.2.1 Diffusion vs. Advection………………………………………….…………………………………. 9 2.2.2 Analytical Solutions for Diffusion from Discrete Pores…………………….... 12 2.3. Results and Discussion………………………………………………………………………………………. 13 2.3.1 Comparing Diffusion Only and ADE Solutions for Evaporation from
Porous Surfaces………………………………………………........................................ 13 2.3.2 Diffusion-based Top Boundary Condition for Evaporation from
Drying Partially Wet Soil Surfaces…………………………………………………………. 15 2.4 Summary and Conclusions………………………………………………………………………………. 20 Appendix A: Numerical Solution of the Complete ADE……………………………………… 21 Appendix B: Effective Hydraulic Conductivity of Unsaturated Zone………………… 23 Acknowledgements…………………………………………………………………………………………………….. 25
Chapter 3 Evaporation from Porous Surfaces into Turbulent Airflows: Coupling Eddy Characteristics with Pore-scale Vapor Diffusion……………………………………………........... 26
3.1 Introduction………………………………………………………………………………………………………. 26 3.2 Theoretical Considerations……………………………………………….……………………………… 30 3.2.1 Evaporative Coupling between a Drying Surface and Turbulent
Airflow…………………………………………………………………….................................. 31 3.2.1.1 Evaporation from a Smooth Free Water Surface…………………………..... 32 3.2.1.2 Evaporation from a Smooth Porous Surface……………………………………… 33 3.2.2 Surface Renewal and Mean Viscous Sublayer Thickness……………………….. 36 3.2.3 Model Closure……………………………………………………………………………………………….. 38 3.3 Results and Discussion………………………………………………………………………………………… 39 3.3.1 The Dynamics of Mean Viscous Sublayer Thickness………………………………. 39 3.3.2 Free Water Evaporation: Comparison with Brutsaert’s [1975a] Model.. 41 3.3.3 Evaporation Dynamics from Drying Porous Surfaces……………….............. 43 3.4 Summary and Conclusions…………………………………………………………………………………. 45
ix

Appendix A: Friction Velocity and Turbulent State………………………….................. 47 Acknowledgements…………………………………………………………………………………………………….. 48
Part II: Infrared Thermography of Surface-Turbulence Interactions
Chapter 4 Thermal Signatures of Turbulent Airflows Interacting with Evaporating Thin Porous Surfaces…………………………………………………………………......................................... 50
4.1 Introduction……………………………………………………………………………………………………… 50 4.2 Theoretical Analysis of Surface Temperature Dynamics due to
Turbulent Airflows…………………………………………………………………………………………… 54 4.2.1 Eddy Renewal Characteristics and Air Viscous Sublayer
Thickness............................................................................................ 54 4.2.2 An Instantaneous Surface Energy Balance Model………………………………… 57 4.2.2.1 The Sensible Heat Flux…………………………………………………................... 60 4.2.2.2 Evaporation and Latent Heat Fluxes…………………………….................. 60 4.2.3 Intermittent Surface Temperature Fluctuations…………………………………… 62 4.3 Experimental Considerations……………………………………………………..................... 64 4.4 Results and Discussion……………………………………………………………………………………… 66 4.4.1 Surface Temperature and Turbulent Air Velocity Fluctuations………… 67 4.4.2 Surface-Temperature-based Characterization of Turbulent Airflows... 69 4.4.2.1 Thermal Manifestation of Eddy Renewal Events…………................ 69 4.4.2.2 Thermally-deduced Eddy Residence Time Distribution……………….. 72 4.4.2.2.1 Extracting α and β Parameters from Surface
Temperature Fluctuations…………………………………………………………. 73 4.4.2.2.2 Effects of Surface Thermal Properties……………………………………… 76 4.4.3 Turbulent Evaporative Fluxes Quantified by Surface Thermal
Fluctuations………………………………………………………………………………………………. 77 4.4.3.1 Acetone Evaporation from the Thin Cotton Cloth……………………….. 77 4.4.3.2 Plant Leaves and Canopy Interactions……………………………………………. 78 4.5 Summary and Conclusions………………………………………………………………………………. 80 Appendix A: Evaluation of the Analytical Approximation for the Effective
Thermal Thickness…………………………………………………....................... 81 Appendix B: Detection Limits for Infrared Thermography of Evaporating
Surfaces……………………………………………………………………………………………. 84 Appendix C: Wavelet Spectral Analysis…………………………………………………………….. 88 Acknowledgements……………………………………………………………………………………………….……. 89
Chapter 5 Turbulence-induced Thermal Signatures over Smooth Evaporating Bare Soil Surfaces………………………………………………………………………….............................................. 91
5.1 Introduction…………………………………………………………………………………………..…….……. 91 5.2 Theoretical Considerations…………………………………………………………………….……….. 92 5.2.1 Turbulence-induced Surface Temperature Fluctuations…………….......... 92 5.2.2 Thermally-deduced Surface Water Content………………………………………….. 97 5.2.3 Evaporative Fluxes from Natural Porous Surfaces into Turbulent
Airflows………………………………………………………………………………………................ 99 5.3 Materials and Methods…………………………………………………………………………………….. 100
x

5.4 Results and Discussions……………………………………………………………………………………. 103 5.4.1 Surface Thermal Signatures and the Eddy Residence Time
Distribution……………………………………………………………………..…………………………. 103 5.4.2 Surface Wetness and Turbulent Evaporative Fluxes……………………………. 105 5.5 Summary and Conclusions……………………………………………………………….…………….. 107 Appendix A: Thermal Estimation of Low Surface Water Contents…………......... 108 Appendix B: The Dependency of the Rate Parameter β on Surface Wetness.. 110 Acknowledgements…………………………………………………………………………………….………………. 111
Part III: Linking Pore-scale Phenomena with Landscape Processes
Chapter 6 Linking Evaporative Fluxes from Bare Soil across Surface Viscous Sublayer with the Monin-Obukhov Atmospheric Flux-profile Estimates………………............... 112
6.1 Introduction………………………………………………………………………………………………………. 113 6.2 Theoretical Considerations…………………………………………….……………………………….. 117 6.2.1 MOST- and Surface BL-based Estimates of Evaporative Fluxes from
Bare Soil………………………………………………………………….………………………………….. 117 6.2.2 Physically based Reconciled Estimate of Evaporative Fluxes from
Bare Soil…………………………………………………………………………........................... 122 6.3 Evaluation for Drying Soil Surfaces at the Field-Scale………………….…………... 126 6.4 Summary and Conclusions……………………………………………………………….…………….. 128 Appendix A: Eddy Renewal and Water Vapor Density Dynamics at the
Top of the Viscous Sublayer……………….……………………………………….. 129 Acknowledgements…………………………………………………………………………...…………………………. 132
Chapter 7 Evaporation from Wavy Porous Surfaces into Turbulent Airflows………………......... 134
7.1 Introduction………………………………………………………………………………………………………. 135 7.2 Modeling Evaporation from Wavy Porous Surfaces………….………………………... 139 7.2.1 Local Variations of the Viscous Sublayer Thickness along a Wavy
Surface………………………………………………………………………………………………………… 141 7.2.2 Local Evaporative Fluxes along a Wavy Porous Surface………..………….. 145 7.2.2.1 Resistances to Evaporative Fluxes from Porous Surfaces…….……... 146 7.2.2.2 Local Variations of Surface Water Content along Wavy Porous
Surfaces………………………………………………………………………………………………… 148 7.2.3 Mean Evaporation Flux and Rate from Wavy Porous Surfaces……..... 149 7.3 Experimental Setup for Turbulent Evaporation from Wavy Sand
Surfaces………………………………………………………..……………………………………………………. 150 7.4 Results and Discussion……………………………………………………………………............... 152 7.4.1 Localized Evaporative Fluxes…………………………………………………............... 152 7.4.1.1 Thermal Manifestation of Localized Evaporative Fluxes………....... 152 7.4.1.2 Localized External and Internal Boundary Conditions…………........ 156 7.4.2 Mean Evaporation Fluxes and Mass Loss Rates…………………….............. 159 7.5 Summary and Conclusions………………………………………………………………….………….. 161 Acknowledgements……………………………………………………………………………………………………. 163
xi

Chapter 8 Interactions of Bluff-body Obstacles with Turbulent Airflows Affecting Evaporative Fluxes from Porous Surfaces………………………………………………….……………… 164
8.1 Introduction………………………………………………………………………………………………………. 165 8.2 Modeling Evaporation from Porous Surfaces with a few Bluff-body
Obstacles……………………………………………………………………………………………………………. 168 8.2.1 Localized Viscous Sublayer Thickness……………………………………………………. 169 8.2.2 Local and Mean Evaporative Fluxes………………………………………………………. 172 8.2.3 Drag Partitioning and Model Generalization………………………………………… 176 8.3 Experimental Considerations………………………………………………………………………….. 179 8.4 Results and Discussion……………………………………………………………………………………… 181 8.4.1 Surface Evaporation Dynamics Affected by a Protruding Circular
Cylinder………………………………………………………………………………………………………. 181 8.4.1.1 Thermal Manifestation of Enhancing Mechanisms………………………… 181 8.4.1.2 Localization of Airflow Turbulence and Viscous Sublayer…………… 183 8.4.1.3 Localized and Mean Evaporative Fluxes…………………………………………. 185 8.4.2 Evaporation from Sand Surfaces with Multiple Protruding Cylinders. 188 8.4.3
Generalized Bluff-body Model Predictions for Mean Evaporation Rates……………………………………………………………………………………………………………. 191
8.5 Summary and Conclusions………………………………………………………………………………. 194 Acknowledgements…………………………………………………………………………………………………….. 195
Chapter 9 Concluding Remarks and Outlook………………………………………………….……………………….…. 196
9.1 Main Findings and New Insights………………………………………………………………….. 196 9.2 Future Perspective………………………………………………………................................... 200
References……………………………………………………………………………………………………………….……... 203
Curriculum Vitae…………………………………………………………………………………………………….……. 229
xii

Chapter 1
Introduction
Evaporation from porous surfaces into turbulent airflows is common in many natural and engineering applications (from drying of food, paper and building materials to evaporative losses from terrestrial surfaces). Evaporative water loss from porous media involves simultaneous heat and mass exchanges at rates dictated by internal water transport capacity of the porous medium, energy input, and external evaporative demand. The early stages of evaporation from an initially-saturated porous medium are often marked by high and relatively constant drying rate (the so-called stage-I evaporation) during which the vaporization plane remains at the surface and is supplied by capillary liquid flow from a receding drying front. The porous medium internal transport capacity during this stage is often high and exceeds the diffusive resistance to transport across an air viscous sublayer adjacent to the surface. Constraints to hydraulic continuity of internal liquid phase within the porous medium may induce large changes in observed evaporation rates and subsequent transition of dominating transport mechanisms from capillary flow to vapor diffusion (stage-II). While many aspects of evaporation dynamics from flat (and smooth) porous media into laminar airflows have been studied experimentally and theoretically, interactions between turbulent airflows and natural evaporating surfaces (with inherent surface irregularities) bring several complexities to propose mechanistic models for quantifying turbulent evaporative fluxes from drying natural surfaces.
1.1 Landscape Evaporation Challenges
The parameterization of evaporative fluxes at the Earth’s surface that is majorly covered with complex terrain (such as urban areas, hilly and mountainous terrain, and vegetated surfaces) has received great attention and remains an important issue in hydrological and climatic models. Evaporation is a key process in land-atmosphere mass and energy exchange driving the hydrological cycle and affecting energy balance of terrestrial surfaces. Globally, evaporation consumes about 25% of

Chapter 1 2 the incoming solar energy, and returns 60% of terrestrial precipitation back to the atmosphere by the processes of evapotranspiration. The magnitude and spatial distribution of evaporative fluxes from terrestrial surfaces are considerably affected by the interaction of land surface heterogeneity with incoming solar (shortwave) radiation and atmospheric boundary layer turbulence. At the atmospheric side of the land-atmosphere interface, gradients in momentum, air temperature, and water vapor concentration occur primarily in the vertical direction near the surface and sustained by turbulent exchange. The quantification of vertical fluxes from measured profiles of wind speed, air temperature, and water vapor concentration at a distance above evaporating surfaces has been a central focus of “atmospheric-based” micrometeorological research in the context of Monin-Obukhov similarity theory (MOST).
Nevertheless, even the simplest scenario of bare soil evaporation may exhibit complex dynamics due to internal transport mechanisms unrelated to atmospheric boundary conditions that have to be accounted for. Evaporation from porous or perforated surfaces differs fundamentally from free water evaporation due to pore-scale diffusive processes at the surface-air boundary layer (with a thickness of few millimeters) that give rise to complex vapor concentration fields that, in turn, induce nonlinear behavior between surface wetness and evaporative flux. These “surface wetness-dependent” nonlinear interactions are exemplified by the fact that despite gradual surface drying and a receding drying front, evaporation rates from porous surfaces under low atmospheric demand (< 5 mm/day) may remain remarkably constant for extended periods (stage-I evaporation). Despite the reasonably good performance of pore-scale “surface-based” methods that explicitly consider the effects of surface wetness and subsurface properties on evaporation rates across the viscous sublayer under controlled laboratory conditions, they lack direct consideration of airflow turbulence and atmospheric stability conditions (as incorporated in atmospheric-based methods) that may hinder their applicability for large scales of interest.
Although many studies have addressed the gap between atmospheric- and surface-based approaches considering different mechanisms affecting surface evaporative fluxes, the basic reconciliation procedures remain empirical. The main objective of this PhD thesis was to propose a more complete “mechanistic” flux estimation scheme for evaporation from natural porous surfaces into turbulent airflows by incorporating advantages of atmospheric-based (robust formulation including airflow turbulence and atmospheric stability effects and testing for large scales) and

3 Introduction surface-based (explicit consideration of surface wetness, hydraulic properties of the soil, estimation of evaporation dynamics, and direct links to energy exchange at the surface) methodologies. The proposed physically based pore-scale methodology would essentially offer new building blocks for interpreting direct impacts of surface-turbulence interactions on evaporation dynamics at this critical interface where most of the exchange processes originate, and consistently upscaling evaporative fluxes from discrete pores (as a surface that progressively dries out) to macroscopic evaporative losses from terrestrial surfaces.
1.2 Methodology and Layout of the Thesis
As discussed in the previous section, evaporation dynamics in the context of hydrology may be studied from atmospheric perspective which often requires semi-empirical treatment of the porous medium (soil) controls. Alternatively one could take a soil-centric approach for known atmospheric boundary conditions and study the dynamics governed by properties and flow processes in the soil and their coupling to various atmospheric boundary conditions which is our approach in different sections of this work.
The first part of the thesis (chapters 2 and 3) addresses joint effects of surface and aerodynamic conditions on evaporative fluxes from porous surfaces. Our dimensional analysis of a complete advection-diffusion equation for isothermal evaporation from porous surfaces revealed the dominant contribution of vapor diffusion to surface evaporative fluxes into a convective airflow boundary layer for a practical range of surface and airflow conditions. We have shown that application of the analytical diffusion-based solution of Schlünder [1988] offers a means for accurately describing evaporation from drying porous surfaces as a superposition of diffusion solutions from pores. The result was cast as a practical resistance boundary condition for macroscopic representation of evaporation rates, linking the surface water content and the boundary layer thickness (defined by wind speed), and including the internal viscous resistance. To account for the role of turbulent airflows over natural surfaces, that could be represented by populations of fluid parcels (termed eddies) comprised of a range of sizes and intensities, in defining nature of the viscous sublayer and its influence on evaporation dynamics, aspects of turbulent exchange were also incorporated by using a detailed formulation of the surface renewal (SR) theory with explicit account of surface-eddy exchange during a certain eddy residence time over the surface. As eddies are swept along the evaporating surface, they gradually accumulate water vapor (or exchange energy) at rates determined by diffusion across a viscous sublayer forming beneath their

Chapter 1 4 footprint, and by the mean water vapor gradient between the surface and the well-mixed turbulent airflow. Eddies are eventually ejected back to the turbulent flow and subsequently replaced by new eddies drawn from an eddy population defined by flow conditions.
The phase transition inherent to evaporation processes consumes considerable amounts of energy and alters the thermal field at vaporization planes. Consequently, an evaporating surface subjected to turbulent renewal eddies may be locally cooled down or warmed up relative to air temperature, and the resulting intermittent and spatial surface temperature dynamics can be resolved using rapid and high resolution infrared thermography (IRT). The intermittent regime associated with turbulent eddy-surface interactions gives rise to structured temperature fluctuations; these were linked via the SR formalism and parametrically by the gamma distribution parameters. We extended the diffusion-turbulence model established in the first part for turbulent exchange from evaporating surfaces to explicitly consider instantaneous and local variations in surface energy balance induced by evaporative cooling beneath eddy footprints. Results of acetone evaporation from a thin cotton cloth (with low thermal capacity) revealed inherent coupling between airflow turbulence characteristics and surface temperature fluctuations that, in turn, offered opportunities for using a resolved thermal regime to estimate (invert for) the momentum field fluctuations (turbulent structures). The results also showed independency of inferred statistical properties of surface thermal fluctuations (and turbulence) from the measured location over homogeneously wet surfaces such that a single-point measurement over the surface could provide necessary information for prescribing turbulent momentum field (parameterized by the eddy residence time distribution), and facilitate estimates of surface evaporation. This characteristic of surface thermal fluctuations along with a predictable shift in thermally-deduced residence time distribution of events (thermal eddies) with surface hydro-thermal properties (including surface wetness) finally provided the opportunity to expand applicability of the approach for remotely predicting surface water content and evaporative fluxes from bare soil surfaces (with relatively high thermal capacity) using surface thermal information during stage-I evaporation. These IRT-based analyses and applications to evaporation from bare soil surfaces are discussed in more details in the second part of this work in chapters 4 and 5.
In the last part (chapters 6 to 8), the role of landscape processes (atmospheric stability and interactions between land surface heterogeneity and incoming solar

5 Introduction radiation and atmospheric boundary layer turbulence) in drying dynamics of terrestrial surfaces and their incorporation into pore-scale surface-based methods have been addressed. Atmospheric stability that is a measure of atmospheric tendency to reduce or intensify vertical motion or alternatively, to suppress or augment existing turbulence affects vertical variations of water vapor concentration (as well as air temperature and wind speed) with height influencing surface evaporative fluxes accordingly. Considering continuity of the water vapor flux from the surface across the atmospheric boundary layer (under quasi-steady-state conditions) and invoking concepts from MOST, we proposed a reconciliation (flux matching) procedure to improve surface-based estimates where water vapor concentration at the top of the viscous sublayer was modified to include atmospheric stability considerations (chapter 6). The proposed flux matching scheme also provided a modified lower boundary condition for atmospheric-based methods that links characteristics of drying evaporating surfaces considering nonlinearities between wetness and evaporative fluxes and obviates reliance on both profile measurements and empirical surface resistances. We finally incorporated the effects of land surface relief and irregularities on localization of external (airflow turbulence near the surface and incoming solar radiation) and internal (soil hydraulic properties and surface wetness) boundary conditions directly affecting surface evaporative fluxes by extending applications of the proposed mechanistic model to wavy (chapter 7) and bluff-rough (chapter 8) bare soil surfaces with prescribed geometries. Although preliminary results from laboratory-scale evaporative drying of roughened sand surfaces subjected to constant turbulent airflows were in good agreement with model predictions, additional evaluations and improvements would be needed prior to field-scale applications.


Part I: Diffusive Evaporation Fluxes into Turbulent
Airflows


Chapter 2
Evaporation Rates across a Convective Air Boundary Layer are dominated by Diffusion1
Abstract: The relative contributions of advection and diffusion to isothermal mass transfer from drying porous surfaces across a constant air boundary layer have been quantified. Analysis has shown that neglecting diffusion in longitudinal direction (often justified by high Peclet number) may lead to underestimation of evaporative mass losses from porous surfaces. Considering diffusion only from individual pores across a constant boundary layer accounts for most of the evaporation rates predicted by the full advection-diffusion equation (ADE). The apparent decoupling between diffusion and advection, and the relatively small role of advection in flux generation (other than defining boundary layer thickness) greatly simplifies analytical description of drying surfaces. Consequently, evaporation rates from porous surfaces may be represented by superposition of readily-available analytical diffusion solutions from discrete pores considering different patterns and spacing between surface pores. Results have been used to formulate a generalized top boundary condition for effective resistance to evaporation linking soil type, surface water content and boundary layer characteristic into a simple and physically based analytical expression.
2.1 Introduction
Evaporation is a key process in land-atmosphere mass and energy exchange driving the hydrological cycle and affecting energy balance of terrestrial surfaces. Evaporation from porous media involves simultaneous heat and mass exchanges at rates dictated by atmospheric demand, energy input, and internal water transport capacity of the porous medium. Constraints to hydraulic continuity of internal liquid phase within a porous medium may induce large changes in observed
1published as: Haghighi, E., E. Shahraeeni, P. Lehmann, and D. Or (2013), Evaporation rates across a connective air boundary layer are dominated by diffusion, Water Resour. Res., 49, 1602-1610.

Chapter 2 7 evaporation rates [Idso et al., 1974; van Brakel, 1980] and subsequent transition of dominating transport mechanisms from capillary flow to vapor diffusion [Lehmann et al., 2008; Shokri et al., 2009; Shahraeeni and Or, 2010a, 2012a,b]. In addition to internal constraints, evaporation rates from partially wet porous surfaces may be limited by the vapor transport across the air boundary layer adjacent to the surface [Suzuki and Maeda, 1968; Shahraeeni et al., 2012]. While relations between air velocity and the viscous sublayer over smooth free water surfaces are well-known [Bird et al., 2002], quantifying vapor exchange from drying porous surfaces across such a boundary layer remains a challenge [Suzuki and Maeda, 1968; Cooke, 1969; Schlünder, 1988; Yiotis et al., 2007; Shahraeeni et al. 2012].
Various approaches have been used to represent evaporating porous surfaces and to establish a relationship between surface water content and drying rate for different boundary conditions (Table 2.1 and Figure 2.1). Cooke [1969] investigated evaporation from perforated surfaces considering the influence of pore spacing on diffusive mass transfer rate. Schlünder [1988] developed a simple expression for drying surfaces considering the roles of diffusive boundary layer resistances on rates of vapor transfer from arrays of pores. In a pioneering study, Suzuki and Maeda [1968] (denoted in the following as S&M) addressed the problem of vapor transport from arrays of identical pores (or line sources in 2-D x z− plane in Figure 2.1) considering different air flow regimes. In a first case, they considered diffusion only across a stagnant boundary layer and solved analytically the Laplace equation for the concentration field defined in Eq. (i) in Table 2.1. They also considered evaporation into steady air flow (constant or linear velocity profile), taking into account advection but neglecting vapor diffusion in the direction of flow (Eq. (ii) in Table 2.1), justifying the approximation with large Peclet numbers. Their analytical solutions enable systematic evaluation of the effects of different water contents (determined by the density of evaporating pores) on the relative evaporative mass transfer coefficient (evaporation from porous surface relative to free water surface evaporation).

8 Diffusion-dominant evaporation rates
Figure 2.1: Surface coverage of different unit cells and boundary conditions in the basic solutions of mass transfer from a partially wet surface. Suzuki and Maeda [1968] considered a 1-D solid line as the evaporative surface while Cooke [1969] and Schlünder [1988], developed their models using a 2-D cylindrical pore surrounded by an impermeable cylindrical and square area, respectively. Considering the condition of equal surface area, π =2 2
pr P , where p
r (m) is the radius of cylindrical pores, one may obtain θ θ= =2 2
2 1( )
surf D surf DP W . Thus, the
solution of Suzuki and Maeda [1968] is comparable with those over a 2-D wet surface at θ θ=
1 2surf D surf D .
The primary objective of this study is to highlight the dominance of diffusion in determining drying rates from porous or perforated surfaces considering different

Chapter 2 9 pore sizes, water contents, and boundary layers (air velocities) by comparing diffusion solutions with a complete form of the advection-diffusion equation (ADE) (see Eq. (iii) in Table 2.1). A secondary objective is to capitalize on available diffusion solutions to formulate a generalized and physically based evaporative top boundary condition linking surface wetness with evaporative resistance for macroscopic description of evaporation rate from drying porous surfaces.
Table 2.1: Mass transfer equations used to quantify vapor flux from porous surfaces
Pure Diffusion Equations* Incomplete and Full ADEs* S&M [1968]
∂ ∂+ =
∂ ∂
2 2
2 20
C C
x z (i)
S&M [1968]
∂ ∂− =
∂ ∂
2
2( ) 0
C Cu z D
x z (ii)
Cooke [1969]
∂ ∂ ∂+ + = → ≥
∂∂ ∂
2 2
2 2
10 , 0
C C Cx r z
r rr z
Full ADE
∂ ∂ ∂− + =
∂ ∂ ∂
2 2
2 2( ) 0
C C Cu z D
x x z(iii)
*The corresponding boundary conditions are shown in Figure 2.1.
The mathematical description of the evaporation problem based on the ADE for constant and unidirectional air flow considers diffusive vapor transport along and transverse to mean air flow, as well as vapor advection along air flow direction. The aim is to quantify the relative contributions of advection and diffusion, and to examine the simplifying assumption made by S&M, i.e. neglecting diffusion along flow direction in favor of advection. Diffusion-dominant transport from porous surfaces provides an opportunity to establish a general boundary condition linking surface wetness with the evaporation rate through one simple expression combining the effects of both surface water content and presence of viscous sublayer on evaporation rate together.
Following this introduction, we summarize in section 2.2 the different approaches to quantify evaporation rate as a function of surface water content. In section 2.3, first we show that diffusion-based solutions are accurate enough to describe vapor transport across boundary layer under practical conditions. Then, these findings are applied to formulate new boundary conditions for evaporative fluxes from a drying soil surface to the atmosphere.
2.2 Theoretical Considerations 2.2.1 Diffusion vs. Advection
Considering a laminar boundary layer with zero velocity perpendicular to the surface, the 2-D steady state vapor concentration distribution across the boundary

10 Diffusion-dominant evaporation rates layer could be specified in dimensionless form as
∂ ∂ ∂+ − =
∂∂ ∂
2 2
1 22 2( ) 0N N U ∂
XX ∂ (2.1)
with dimensionless variables
δ∞
∞ ∞
−= = = =
−
( ), , , and ( )s m
C C x z u zX ∂ U ∂C C W U
where, ( )u z (m/s) is the velocity profile of the fluid in x direction, ∞U (m/s) is the free air stream velocity, δm (m) is the thickness of the mass boundary layer, W (m) is the unit length of the discontinuous evaporating sources (with water-filled 1-D pore of length P (m) and dry spacing), = cx nW (m) is the distance from the leading edge of the wet surface, where cn is the number of unit cells considered along the air flow direction, and sC and ∞C (kg/m3) are the vapor concentrations of the air at the water menisci and the border of the mass boundary layer in the drying air flow, respectively. We note that even for micrometric pore sizes the potential reduction in vapor pressure above curved water/air-menisci (the so-called Kelvin effect) is negligible and should be considered for nanometric pores [Metzger and Tsotsas, 2005], we therefore neglect the Kelvin effect in this study and consider saturated vapor concentration everywhere at = 0∂ (similar to Shahraeeni and Or [2012b]). The parameters ∞=1N D WU (-) and δ ∞= 2
2 mN DW U (-) with D (m2/s) the water vapor diffusion coefficient are, respectively, the coefficients of diffusion terms in longitudinal (∂ ∂
2 2X ) and transverse (∂ ∂
2 2∂ ) directions indicating their order of contribution to the mass exchange process. Note that the thickness of the laminar mass boundary layer δm decreases with increasing free air stream velocity, with δ −
∞∝ 1/2m U [Shahraeeni et al., 2012].
Considering Eq. (2.1), the relative mass transfer coefficient, ok k (-), as the ratio of the mass transfer coefficient (hereafter called MTC) from a partially wet area k(m/s) to that from a free water surface ok (m/s), is
=
− ∂ ∂= − + ∂ ∂
∫ ∫
21
202 2 0
1 ( ) ( )cn
oc ∂
Nk U ∂ d∂ H X dXn N X Nk X
(2.2)
where the integrand represents the concentration gradient at the surface ( = 0∂ ) with ( )H X the integral constant, obtained by integrating Eq. (2.1) with respect to ∂ . One could obtain evaporation flux across the boundary layer BLJ (kg/m2s) as
( )∞= −BL sJ k C C (2.3)

Chapter 2 11 The contributions of the different diffusive and advective terms in Eq. (2.2) to transport across the boundary layer depend on the relative magnitudes of the ratios
2( )U ∂ N and 1 2N N at the surface ( = 0∂ ). The ratio 1 2N N defines the ratio of diffusive vapor transfer in longitudinal direction to that in vertical direction and is equal to ( )δ
2
m W , suggesting that for fine textured media (small pores) or for low air velocity (thick boundary layer), the first term in Eq. (2.1) corresponding to diffusion in flow direction becomes more important relative to the second term. Considering a boundary layer thickness of δ − −
∞= × 3 1/22.26 10m U [Shahraeeni et al., 2012] with thickness in mm and velocity in m/s, we plot in Figure 2.2a the ratio of
1 2N N versus mean air stream velocity for different pore sizes.
Figure 2.2: Quantification of the dimensionless coefficients affecting ok k to investigate the contribution of different transport mechanisms to the mass exchange process. (a) The ratio of diffusive transport coefficients along and transverse to air flow 1 2N N versus mean air stream velocity for different pore sizes; (b) The ratio of the longitudinal diffusion coefficient to that of advection for different mean air velocities considering a linear velocity profile, δ∞=( ) mu z U z . Note that the lines in (b) have the same order as in (a).
For example, for the pore size of 500 micron and the air velocity of 1 m/s, the contribution of vapor diffusion in the x -direction to the flux is 20 times larger than diffusive transport in the z -direction. This dominant component of vapor diffusion in the x -direction has been neglected by S&M in their pursuit of an analytical solution (we will elaborate more on this point in section 2.3.1). We consider next the ratio of advective and diffusive transport in the flow direction expressed by
δ= 22( ) ( ) mU ∂ N u z DW , where ( )u z varies linearly from zero at the surface to
∞U at the top of the boundary layer (i.e., δ∞=( ) mu z U z ). The contribution of the advective term to mass exchange within the boundary layer depends on the

12 Diffusion-dominant evaporation rates elevation above the surface. The no-slip boundary condition at the surface ( = 0z ), which is an acceptable assumption for a porous surface with water-filled pores (quite similar to a flat surface), dictates =( ) 0u z and thus diffusion is the only transport mechanism for vapor leaving the surface. The contribution of the advection term is comparable with the longitudinal diffusion only for high atmospheric demand (thin boundary layer) as shown in the results in Figure 2.2b where the ratio
1 ( )N U ∂ was calculated for a finite height above the surface of δ= = 0.01m∂ z . In summary, the results confirm the dominance of diffusion over
advection for isothermal evaporation from porous surfaces under practical conditions in the context of soil science (low airflow velocities).
2.2.2 Analytical Solutions for Diffusion from Discrete Pores
The analysis presented in the previous subsection shows that diffusion dominates advection for isothermal evaporation from relatively fine textured porous surfaces (pore sizes < 1000 micron) under natural conditions ( ∞U < 4 m/s). Next we present three diffusion-based solutions for evaporation from discrete pores. Suzuki and Maeda [1968] solved for evaporative fluxes across a stagnant 2-D boundary layer from an array of pores (in Cartesian coordinates) as depicted in Figure 2.1. They finally expressed ok k that depends only on two dimensionless parameters δm W and 1-D surface water content, θsurf (-), as
ξ ωξ ω
′=
′S&M
( ) ( )( ) ( )
o I Ik kI I
(2.4) δ ω ξ ξξ θ
ξ ξ
− ′ ′ ′= =
′ ′
1( , )( ) and2 ( ) ( )
msurf
snIW I I
where I ’s are the complete elliptic integral of the first kind [Abramowitz and Stegun, 1972], sn is the Jacobian elliptic function, and ω and ξ are the moduli of these functions. The relationship between primed and unprimed quantities can be found in Suzuki and Maeda, [1968, p. 28, Eqs. (8) and (9)].
Considering similar boundary conditions as S&M, Cooke [1969] provided an analytical solution for the steady state diffusion from a pore in cylindrical coordinates considering interactions with identical neighboring pores. The relative mass transfer coefficient, ok k , based on the Cooke’s [1969] solution is given as

Chapter 2 13
δ
δ ∞
=
=+ ∑Cooke
1
o m
m nn
k kA
(2.5)
in which the coefficients nA are determined as [Cooke, 1969]
= − Γ + Γ Γ Γ
2 2
12 2
1 sin( ) 2 ( )( )
p pbn n p n p
p b bn b o n b
r rrA r J r
r r rr J r (2.6)
where π=br W [m] is the radius of the cylindrical building block (half pore spacing), π=pr P [m] is the radius of the cylindrical pores, and Γn br are the positive roots of the Bessel function Γ1( )n bJ r . It should be noted that one may rewrite Eq. (2.6) as a function of 2-D surface water content by applying
( )θ =2
surf p br r .
Schlünder [1988] also considered vapor diffusion through an array of identical circular pores across a constant boundary layer above a porous surface and obtained a simple analytical expression for evaporation rate dependency on 2-D surface water content given as
θδ
=+
Schlünder
1
1 ( )
o
surfm
k kP f
(2.7)
where
πθπ θ θ
= −
2 1( ) 14 4surf
surf surf
f (2.8)
Note that the solution of Schlünder [1988] is valid only for the range of θ π π≤ =2 24 4surf r r due to the square shape of the unit cell assumed in the derivation (Figure 2.1). In the following section, we compare the three diffusion-based solutions with the complete ADE form (iii) shown in Table 2.1.
2.3 Results and Discussion 2.3.1 Comparing Diffusion Only and ADE Solutions for
Evaporation from Porous Surfaces
We compared solutions considering diffusion only with the numerical solution of the

14 Diffusion-dominant evaporation rates complete ADE under low and high atmospheric demand, as illustrated in Figure 2.3.
Figure 2.3: Comparison between two analytical stagnant solutions, the incomplete ADE solution of S&M, and the numerical solution of the complete ADE above a partially wet surface under low (a and b, ∞ = 0.1U m/s) and high (c and d, ∞ = 3.5U m/s) atmospheric demand. The air boundary layer thickness is obtained as a function of air velocity using the correlation derived by Shahraeeni et al. [2012], δ −
∞= 1/22.26m U with thickness in mm and velocity in m/s.
We have implemented a finite difference numerical scheme to solve the 2-D steady state ADE in Eq. (iii). The close agreement between numerical and S&M analytical solutions of the ADE confirmed the accuracy of the numerical code used for the solution of ADE problem (see the Appendix A). The comparison in Figure 2.3 highlights the effects of the boundary layer thickness and pore size on relative mass transfer coefficient, ok k , depicting close agreement between the diffusion-based solutions and the full ADE solutions, especially for low air velocities (thick boundary layers). As we eluded earlier, neglecting longitudinal diffusion as assumed by S&M (see Eq. (ii) in Table 2.1) results in an underestimation of ok k for thick

Chapter 2 15 boundary layers. The deviations in ok k between the full ADE and the diffusion-based solutions increase for high air velocities, but generally do not exceed 10% for large pores and are typically less than 2% for fine pores.
2.3.2 Diffusion-based Top Boundary Condition for Evaporation from Drying Partially Wet Soil Surfaces
The nonlinear relationships between evaporation rate and surface water content (rooted in the flux compensation mechanisms discussed by Shahraeeni et al. [2012]) have been expressed using empirical relationships (considering top soil layer of a few centimeters) [e.g., Kondo et al., 1990; van de Griend and Owe, 1994; Yamanaka and Yonetani, 1999]. Most of these studies have expressed resistance to evaporation as a series of (i) resistance in the soil and (ii) resistance of mass transport from the surface to the atmosphere, postulating that the soil water content affects solely internal transport capacity to the surface (resistance i) but not transport to the atmosphere. Consequently, these studies have assumed that the “aerodynamic resistance” was not a function of surface water content. Considering the results of the previous sections where we have shown that vapor transport through the boundary layer is strongly affected by the surface water content (through pore size and spacing – see also [Shahraeeni et al., 2012]), the traditional notion of the “aerodynamic resistance” must be updated. We argue that the resistance to evaporation consists of two water content-dependent mechanisms, one (resistance ii) associated with the interactions between discrete pores and the boundary layer defining the resistance for vapor transport from the surface to the atmosphere, BLr(s/m), and the internal capillary-viscous resistance (resistance i) imposed on water transfer controlled by hydraulic properties, svr (s/m).
To extract the boundary layer resistance BLr , one possibility is to express the evaporation flux across the boundary layer BLJ (kg/m2s) in the form of the Ohm’s law and write
∞−= s
BLBL
C CJ
r (2.9)
Comparing Eq. (2.9) with (2.3) reveals that the boundary layer resistance is analogous to the inverse of the MTC, i.e.,
=1
BLrk
(2.10)
Employing the expression for the MTC according to Schlünder [1988] defined in Eq. (2.7), and considering the Fick’s first law revealing δ=o
mk D , the boundary layer

16 Diffusion-dominant evaporation rates resistance BLr (s/m) becomes
δ θ+=
( )m surfBL
Pfr
D (2.11)
where θ( )surff defined in Eq. (2.8) reflects the inherent coupling between the surface water content and the diffusive resistance.
In the following we simplify the analysis of the internal soil resistance by focusing on viscous flow and neglecting vapor diffusion within the porous medium. This simplification can be justified by the mechanisms described by Lehmann et al. [2008] and Shokri et al. [2009]. As long as water evaporated from the surface is supplied by capillary flow, the vapor fluxes are marginal compared to the liquid flow. When the evaporative demand exceeds capillary flow capacity, water supply to the surface is interrupted and a receding vaporization plane is formed below the surface, with evaporative fluxes limited by vapor diffusion through progressively thicker dry soil layer [Shokri and Or, 2011]. In summary, as long as certain amount of liquid water persists at the surface, capillary water supply dominates and (in most cases) vapor diffusion can be neglected. A transition period takes place after interruption of hydraulic continuity (end of stage-1 evaporation) after which the residual water remaining at the surface evaporates (this short-lived period is neglected in the present study).
Quantification of the internal soil resistance to unsaturated water flow towards the surface requires liquid capillary flux balanced with an equivalent vapor flux across the boundary layer so that the resulting soil viscous resistance svr is comparable with the boundary layer resistance BLr imposed on vapor (rather than liquid). Invoking an extension of the Darcy’s law to unsaturated flow and considering Eq. (2.3), one may formulate the flux as
( )ρ ∞
∂ ′= −∂w eff shK k C Cz
(2.12)
where, ρw (kg/m3) is the water density (≈ 1000 kg/m3), effK (m/s) is the effective hydraulic conductivity supporting capillary flow between the drying front and the evaporating surface, ∂ ∂h z (-) is the gradient of the hydraulic head driving capillary flow, and ′k (m/s) is a virtual MTC for liquid flow balancing liquid flux with equivalent vapor flux across the boundary layer. Returning to the resistance analogy through the Ohm’s law, the internal viscous resistance svr (s/m) can be obtained as

Chapter 2 17
ρ
∞−= =
′ ∂∂
1 1ssv
effw
C Cr
k h Kz
(2.13)
Expressing the vapor concentration difference between the capillary surface and top of the boundary layer as difference in vapor mass per volume and assuming a unit hydraulic gradient (i.e., ∂ ∂ ≈ 1h z ), we introduce the proportionality constant, γ (-), reconciling units for capillary liquid to vapor fluxes (considering SI units) as
( )s m
w
p p MRT
γρ
∞−= (2.14)
where, ( )sp p∞− (Pa) is the vapor pressure difference, mM (kg/mol) is the molar mass of water (≈ 0.018 kg/mol), R (J/mol K) is the universal gas constant (≈ 8.314 J/mol K), and T (K) is the air temperature. Under a given condition (e.g., = 298T K and relative humidity of 30%), ∞−( )sp p can be calculated through
psychometric charts (≈ 2400 Pa) and consequently the proportionality constant under normal conditions is γ −= × 51.73 10 (-).
Considering Eq. (2.13), the internal soil resistance is proportional to the inverse of the effective conductivity of the unsaturated region. We have established numerically (see the Appendix B) that for a wide range of soil types, the effective hydraulic conductivity effK (m/s) governing capillary flow between the drying front and the surface is linked with the hydraulic conductivity at the surface according to
θ= 4 ( )eff surfK K . Expressing the hydraulic conductivity at the surface as [Mualem, 1976; van Genuchten, 1980]
( )τθ−
− = Θ − − Θ
21 1/1/(1 1/ )( ) 1 1nn
surf s surf surfK K (2.15)
θ θ
φ θ
−Θ =
−surf r
surfr
where, the effective surface water saturation Θsurf is expressed as a function of surface water content θsurf , with θr the residual water content, φ the porosity (saturated water content), the parameter n linked with pore size distribution, the parameter τ related to the flow path geometry and connectivity (generally set to 0.5 [Mualem, 1976]), and sK (m/s) the saturated hydraulic conductivity.
To provide simple estimates of this internal resistance to evaporation, we minimize the number of input parameters to those associated with general soil textural group.

18 Diffusion-dominant evaporation rates Considering a typical pore size of roughly a third of particle diameter, the saturated hydraulic conductivity sK is estimated based on the Kozeny-Carman formulation [Dullien, 1979] as follows
φφ ν
=−
2 3(3 )180(1 )s
P gK (2.16)
where, g (m/s2) is the gravitational acceleration (≈ 9.81 m/s2) and ν (m2/s) is the kinematic viscosity of water ( −≈ × 61.0 10 m2/s @ 20 oC).
Finally, the internal soil viscous resistance svr (s/m) can be expressed as a function of surface water content by combining Eqs. (2.13) to (2.16) as
γθ
=4 ( )sv
surf
rK
(2.17)
Since the two resistances are in series, one may obtain the total resistance to evaporation rate tr (s/m) as
δ θ γθ
+= + = +
( )4 ( )
m surft BL sv
surf
Pfr r r
D K (2.18)
Eq. (2.18) is the main result of the analysis representing a general boundary condition that includes the surface water content θsurf , soil type (as defined by the pore size P , the residual and saturated water contents θr and φ , and the shape parameter n ), and the wind speed (δ −
∞∝ 1/2m U ) in a physically based expression
(that was previously tested with the full ADE solution). Such a boundary condition enables estimates of the total evaporation flux, tJ (kg/m2s), from different types of wet top soils with known surface water content exposed to different air velocities as
( )∞= −t t sJ k C C (2.19)
with = 1t tk r the total mas transfer coefficient.
Figures 2.4 and 2.5 compare measured and simulated total resistance to evaporation from partially wet surfaces with different pore sizes (expressed by a mean or an effective pore size) under various evaporative demands during the period of drying. A fair agreement between the proposed resistance model and experimental data is depicted in Figure 2.4, inspiring confidence in the approach.

Chapter 2 19
Figure 2.4: Variation of the boundary layer resistance, BLr , and the total resistance, tr , to surface evaporation against surface water content; Laboratory data of Shokri et al. [2008] and Lee et al. [1992] were processed as = ∆t tr C J , where they measured total evaporation flux tJ (kg/m2s), respectively, from a cell filled with coarse sand with particle sizes ranging from 300 to 900 micron with porosity of 0.42 exposed to an air velocity of 1.5 m/s, and from saturated glass beads with sizes of 120 micron with porosity of 0.37 under air velocity of 4.9 m/s.
By comparing results for different pore sizes (P =40 and 200 micron), we can state that the evaporation from a coarse medium remained coupled with the boundary layer resistance over the entire range of the surface water contents. In contrast, the internal viscous resistance in the fine porous medium becomes dominant as surface water content approaches its residual value resulting in a sharp increase in the total resistance (i.e., a sharp decrease in the rate of evaporation). In conclusion, prior to formation of a dry surface soil layer at low water contents, the internal viscous resistance is relatively small and the boundary layer resistance dominates the evaporation process. As the topsoil dries out, the internal resistance imposed on the water supply from the drying front beneath the soil becomes dominant with increased resistance until the disruption of the capillary flow at the residual water content as predicted by the evaporative characteristic length of Lehmann et al. [2008]. The capability of the present approach is also evaluated through comparisons with field-scale measurements, as depicted in Figure 2.5.

20 Diffusion-dominant evaporation rates
Figure 2.5: Variation of the total resistance, tr , to surface evaporation against surface water content using published field data. The model captures well the data of Kondo et al. [1990] using realistic values for soil classes ( = 2.4n and = 200P micron for loamy sand, and = 1.6n and = 60P micron for loam), air velocity ( ≈ 1 m/s) and residual water content (0.02 for loamy sand and 0.05 for loam). Even though the data published by van de Griend and Owe [1994] and Yamanaka and Yonetani [1999] are not strongly affected by the viscous resistance at the residual water content, the present model is still able to cover them through a practical range of air velocities for a median soil class ( = 2n and = 100P micron), as illustrated by the gray shaded region.
The model predicts the resistance data published by Kondo et al. [1990] reasonably well, however, data measured by van de Griend and Owe [1994] and Yamanaka and Yonetani [1999] seems to be affected by other factors such as soil aggregation, air velocity fluctuations, etc., which are inevitable in field-scale measurements. Nevertheless, considering a practical extreme for the air velocity ( ∞ = −0.5 4.0U m/s), the model is also able to cover these data, as indicated by the gray shaded region.
2.4 Summary and Conclusions
The dimensional analysis of the complete advection-diffusion equation (ADE) for isothermal evaporation from perforated surfaces enabled separation of advective and

Chapter 2 21 diffusive contributions to the rate of evaporative mass transfer. Under typical natural conditions (air flow velocity ∞U < 4 m/s), the contribution of advection is relatively minor compared to diffusion especially for fine textured porous media (pore sizes < 1000 micron). We also compared three analytical diffusion-based solutions for evaporation from arrays of discrete pores with numerical solution of the ADE, confirming the dominance of diffusion in nearly all practical scenarios related to evaporation from natural porous surfaces. These findings invalidate a central assumption made by Suzuki and Maeda [1968], namely neglecting longitudinal diffusion (motivated by large Peclet number), to enable derivation of an analytical solution for the truncated ADE.
Considering the dominant contribution of diffusion to evaporation from porous surfaces and availability of simple analytical diffusion solutions, we derived a general resistance description for drying porous surfaces in the presence of a constant boundary layer. We have shown that application of the analytical solution of Schlünder [1988] offers a means for accurately describing evaporation from drying porous surfaces as a superposition of diffusion solutions from pores [Shahraeeni et al., 2012]. The result was cast as a practical resistance boundary condition for macroscopic representation of evaporation rates, linking the surface water content and the boundary layer thickness (defined by wind speed), and including the internal viscous resistance. Limited tests of the diffusion-based evaporative resistance model for linking surface water content with evaporation rate (as a top boundary condition for numerical models) show promising results for a wide range of experimental conditions. Nevertheless, more tests are needed to evaluate predictability of various resistance terms at different scales and under a range of well controlled experiments.
Appendix A: Numerical Solution of the Complete ADE
We used a finite difference scheme to solve the complete 2-D ADE defined in Eq. (iii) (Table 2.1). A schematic of the 2-D steady state mass transfer problem and the solution domain along with boundary conditions are illustrated in Figure A.1.
Considering the definition of the nodal points shown in Figure A.1 and using centered difference approximation the discretized form of the 2-D advection-diffusion equation is written as

22 Diffusion-dominant evaporation rates
+ − + − + − − − + − +
= + ∆ ∆ ∆
1, 1, 1, , 1, , 1 , , 12 2
2 2( )
2m n m n m n m n m n m n m n m nC C C C C C C C
u z Dx x z
(A.1)
Figure A.1: Schematic of the solution domain ( ×5 5 mm2) for 2-D steady state advection-diffusion water vapor transfer from discrete pores subjected to a laminar airflow along with boundary conditions used in the finite difference numerical solution.
Considering even grid spacing (i.e., ∆ = ∆x z ) and rearranging Eq. (A.1), the concentration at node ,m n is obtained from
( )+ − + −= + + − + +, , 1 , 1 1, 1,1 (1 ) (1 )4m n m n m n m n m nC C C R C R C
with ∆
= <( ) 12
u z xRD
(A.2)
where < 1R is the so-called cell Reynolds number ensuring the stability of the numerical solution. Eq. (A.2) yields a linear system of algebraic equations for water vapor concentration at each node that can be solved for with a suitable iterative or matrix solution technique. Here the successive-over-relaxation iterative technique was used to obtain the solution. We note that the Navier-Stokes equations for laminar airflow field (in x -direction) were solved simultaneously to provide ( )u z value at each grid points.
C=Cs ∂C/∂z=0
C=
C∞
C=C∞
∂C
/∂x=
0
m,n
m+1,n m-1,n
m,n-1
m,n+1
Δz
Δx x
z

Chapter 2 23 To evaluate accuracy of the finite difference scheme used to solve the 2-D steady state ADE, two benchmark problems (Eqs. (i) and (ii)) were solved and numerical results were compared with analytical solutions obtained by Suzuki and Maeda [1968]. Figure A.2 shows numerical solution of the water vapor concentration field above discrete evaporating pores and the good agreement between analytical and numerical relative mass transfer coefficients, ok k (-), calculated by employing Eq. (2.2).
Figure A.2: Comparison between numerical and analytical solutions of (a) steady state pure diffusion equation and (b) steady state incomplete ADE.
Appendix B: Effective Hydraulic Conductivity of Unsaturated Zone
We assume that the relationship between the hydraulic head h (m) and the water content θ (-) for the region between the drying front and the surface is determined by hydrostatic equilibrium and can be defined by the soil water characteristics. For the parameterization according to Brooks and Corey [1964] the effective water
(a) C/Cs (-)
0.75
0.85
1.00
0.95
0.90
0.80
(b) C/Cs (-)
0.0
0.4
1.0
0.8
0.6
0.2
0.0

24 Diffusion-dominant evaporation rates content Θ can be expressed as
λθ θθ θ
−Θ = = −
( )( ) r b
s r
h hh
h (B.1)
with the residual and saturated water contents θr and θs , respectively, the air-entry value bh at the drying front and the parameter λ defining the width of the pore size distribution. The profile of the hydraulic conductivity for the Brooks and Corey’s model [1964] in the same region equals
( )λ
λ
+
+ Θ = Θ =
3 2
3 2/( ) ( ) bs s
hK h K h K
h (B.2)
with the saturated hydraulic conductivity sK (m/s). During evaporation, water is withdrawn from the saturated region below the drying front at head bh and transported to the surface with head surfh (m) across a partially water saturated region of length −surf bh h and an effective hydraulic conductivity effK (m/s). To determine the effective hydraulic conductivity, we describe the water flow through this water unsaturated region as a series of resistances according to
λ
λ
λ
λ λ
λ
λ
− +
=
+=
+
+ +
− = =
+Θ
− +→ =
−
∫
(2 3 )
3 2/
2 3
3 3 3 3
3 (1 )( )
3 ( ) (1 )
surf
surf
b
b
h
bh h
surf b
h heff ss
h
b b surf seff
b surf
hh
h h hdhK KK h
h h h KK
h h
(B.3)
To express the effective conductivity effK as a function of effective surface water saturation Θsurf , we use λ−= Θ 1/
surf b surfh h and define a ratio of conductivity as follows
( )λ
λ
λα
+
+ Θ −= =
Θ Θ −
1/
3 3/
3(1 ) 1
( ) 1surfeff
surf surf
KK
(B.4)
For the range of the parameter values λ reported for natural soils by Rawls et al. [1982] between 0.1 and 0.6, the ratio is shown in Figure B.1. A ratio of 4 represents a wide range of textures and surface water contents and was chosen in the present study.

Chapter 2 25
Figure B.1: Ratio between the effective hydraulic conductivity of the region between the drying front and the evaporating surface and the hydraulic conductivity, α , corresponding to the effective surface water saturation, Θsurf , for different soil textures parameterized by the Brooks and Corey’s model [1964]. For a wide range of textures and surface saturations, the ratio of the conductivity is close to 4.
Acknowledgements
The authors gratefully acknowledge funding by the Swiss National Science Foundation of the project “Evaporation from terrestrial surfaces – linking pore scale phenomena with landscape processes” (SNSF; 200021-113442), and the financial support of the German Research Foundation DFG of the project “Multi-Scale Interfaces in Unsaturated Soil” (MUSIS; FOR 1083).

Chapter 3
Evaporation from Porous Surfaces into Turbulent Airflows: Coupling Eddy Characteristics with Pore-scale Vapor Diffusion1
Abstract: Evaporative fluxes from terrestrial porous surfaces are determined by interplay between internal capillary and diffusive transport, energy input, and mass exchange across the land-air interface. Turbulent airflows near the Earth’s surface introduce complex boundary conditions that affect vapor, heat, and momentum exchange rates with the atmosphere. The impact of turbulent airflow on evaporation from porous surfaces was quantified using surface renewal theory coupled with a physically based pore scale model for vapor transfer from partially wet surfaces to individual eddies. The model considers diffusive vapor exchange with individual eddies interacting intermittently with a drying surface to quantify mean surface evaporative fluxes. The model captures nonlinearities between surface water content and evaporation flux during drying of porous surfaces, yielding close agreement with experimental results. This new diffusion-turbulence evaporation model provides a basic building block for improving estimation of field-scale evaporative fluxes from drying soil surfaces under natural airflows.
3.1 Introduction
Evaporation from porous media is a coupled heat and mass exchange process that occur at rates that depend on internal transport, input energy, evaporative demand, and exchange rates with the flowing air over the surface. Studies have shown that evaporation rates may be constrained by vapor transport from wet surfaces across the air viscous sublayer adjacent to the surface [Schlünder, 1988; Shahraeeni et al., 2012]. The characteristics of airflow play an important role in defining nature of the
1published as: Haghighi, E., and D. Or (2013), Evaporation from porous surfaces into turbulent airflows: Coupling eddy characteristics with pore scale vapor diffusion, Water Resour. Res., 49, 8432-8442.

Chapter 3 27 viscous sublayer and its influence on evaporation dynamics. Environmental flows such as airflow above natural surfaces, or water flow in mountain streams, are often turbulent and involve populations of fluid parcels (termed eddies) with a range of sizes and intensities [Panofsky and Dutton, 1984]. An eddy is a fluid parcel “akin to a vortex or a whirl in common terminology” [Arya, 2001]. The resulting highly intermittent and irregular character of the turbulence challenges prediction of fluxes and transfer rates, necessitating numerous simplifying assumptions for obtaining tractable models.
A potential simplification of surface-turbulent flow exchange processes is offered by the surface renewal theory (denoted as SR). The SR theory was originally introduced to chemical engineering by Higbie [1935] and subsequently modified by Danckwerts [1951] to study liquid-gas interfacial heat transfer. The original SR theory inspired a class of related models based on various heuristic depictions of the near-wall turbulent fluid flows. Some of the well-known variants of the SR theory include film-penetration models [Toor and Marchello, 1958; Brusset et al., 1973], periodic growth-breakdown models [Einstein and Li, 1956; Ruckenstein, 1958; Meek and Baer, 1970; Pinczewski and Sideman, 1974], random surface renewal models [Hanratty, 1956; Fortuin and Klijn, 1982; Fortuin et al., 1992], and surface rejuvenation models [Harriott, 1962; Bullin and Dukler, 1972; Thomas et al., 1975; Loughlin et al., 1985]. These eddy renewal models assume that the replacement of individual fluid elements near a surface may be represented as a stochastic process driven by a turbulent flow field away from the surface. Individual eddies intermittently move from the fully turbulent region to the proximity of a transport surface, where they replace older eddies. During an eddy residence time near the surface, energy and mass are exchanged across the viscous sublayer over the eddy’s footprint. Subsequently, the SR framework facilitates simple schemes for integration of local and intermittent fluxes into individual eddies into estimates of average fluxes from the entire surface.
Brutsaert [1975a] employed a SR-based scheme to quantify evaporation rates from free water surfaces into turbulent airflows. Brutsaert’s [1975a] model calculates vapor transfer from smooth and rough free water surfaces into the smallest eddies of the Kolmogorov length scale [Kolmogorov, 1962], that are assumed to be in direct contact with the evaporating surface (no boundary layer is assumed to form between the eddy and the evaporating surface). The exchange process is governed by one-dimensional (vertical) transient diffusion equation coupled with a steady advection field along the mean airflow. The model successfully predicts evaporation

28 Diffusion-turbulence evaporation model rates from free water surfaces [Brutsaert, 1975a]; however, certain simplifications such as the neglect of vapor diffusion along the mean flow direction, and the absence of treatment of vapor fluxes from pores preclude its use for predicting evaporation from drying porous surfaces due to nonlinearities introduced by changes in surface water content (as elaborated next).
Evaporation from porous or perforated surfaces differs from evaporation from free water surfaces due to pore scale diffusive processes at the surface-air boundary layer that give rise to complex vapor concentration fields that, in turn, induce nonlinear behavior between surface wetness and evaporative flux [Suzuki and Maeda, 1968; Schlünder, 1988; Assouline et al., 2010; Shahraeeni et al., 2012]. These nonlinear interactions are exemplified by the fact that despite gradual surface drying and a receding drying front, evaporation rates from porous surfaces under low atmospheric demand (< 5 mm/day) may remain remarkably constant for extended periods (the so-called stage-I evaporation) [Suzuki and Maeda, 1968; Schlünder, 1988; Shokri et al., 2008; Shahraeeni et al., 2012]. Our study focuses on stage-I evaporation defined as the period during which the vaporization plane remains at the surface and supplied by continuous liquid pathways [e.g., Yiotis et al., 2004; Shahraeeni et al., 2012; Or et al., 2013]. For relatively high evaporative demand (> 5 mm/day), even when capillary flows to the surface are not limiting, evaporation rates may decrease continuously reflecting limitations to vapor exchange across the air boundary layer [e.g., Suzuki and Maeda, 1968; Schlünder, 1988; Shahraeeni et al., 2012; Yiotis et al., 2007].
Considering the ubiquity of turbulent conditions over evaporating terrestrial surfaces, our primary objective was to quantify evaporation rates from drying porous surfaces into turbulent airflows during stage-I evaporation. We focus on interactions between pore scale vapor diffusion from a drying surface and eddies sweeping over the surface. To facilitate a mathematically tractable description of the exchange, we discretize the turbulent flow into a population of eddies drawn from a statistical distribution (defined by turbulence characteristics), and then calculate diffusive fluxes into individual eddies. A schematic of the SR theory applied in the present study is illustrated in Figure 3.1. Eddies that arrive to surface and form a viscous sublayer are assumed to possess a uniform vapor concentration and sweep away vapor mass from the sublayer out to the mixed flow and subsequently being replaced by fresh eddies. During the residence time of an eddy near the surface, water vapor is assumed to be transferred from pores by molecular diffusion across a viscous sublayer that forms between the eddy and the

Chapter 3 29 surface.
Figure 3.1: Schematic of the surface renewal by turbulent eddies and associated coupling of internal and external transport mechanisms. The turbulent flow interacts with the evaporating surface as a collection of eddies with different characteristics drawn from a distribution (varies with flow regime). Water vapor transfer (during stage-I evaporation) through a unit surface of the building block into individual eddies is governed by 3-D diffusion from individual pores across a local viscous sublayer formed below an eddy footprint (green dashed line). It is postulated that the sublayer is of a finite thickness above the surface, the face of which is then assumed to be periodically renewed with fresh fluid. The diffusive vapor fluxes from the drying surface into individual eddies are finally integrated for their exposure time and over the entire surface to quantify the mean vapor flux into the turbulent airflow. We note that the blue dashed lines indicate the transition zone separating the air boundary layer into two distinct laminar and fully turbulent regions.
In a pioneering study, Suzuki and Maeda [1968] modeled vapor transport from an

30 Diffusion-turbulence evaporation model array of pores under different airflow regimes. The governing equation in their model is similar to that used by Brutsaert [1975a], namely considering steady advection along the surface (along mean airflow direction) supplemented by a 1-D (vertical) diffusion into the airflow. Due to the typically large Peclet number for these two modes of transport, Suzuki and Maeda [1968] neglected vapor diffusion in the direction of flow in favor of using an advection term only. This assumption was unwarranted could lead to significant underestimation of evaporative fluxes from porous surfaces as was shown recently by Haghighi et al. [2013]. Fortuitously, the relatively minor contribution of advection to the generation of evaporative fluxes enables considerable simplification of the representation of evaporation from porous surfaces relying solely on diffusion from individual pores [Shahraeeni et al., 2012; Haghighi et al., 2013]. We thus used the analytical diffusion-based model of Schlünder [1988] to quantify diffusive evaporative fluxes across the air viscous sublayer from pores of known size and surface density which may reflect the effects of the soil texture and the surface water content on evaporative fluxes.
The present study thus considered a population of eddies that contribute to evaporative exchange (rather than only the smallest scales as in Brutsaert [1975a]) through their local effect on the thickness of the viscous sublayer. The specific objectives of the study were to: (1) characterize key parameters of the SR model (specifically the viscous sublayer thickness and eddy exposure times) with airflow characteristics [Mathpati and Joshi, 2007]; (2) link pore scale vapor diffusion into individual eddies with local thicknesses of the viscous sublayer and surface wetness; and (3) integrate fluxes over a population of eddies and derive an expression for macroscopic turbulent evaporation dynamics from smooth porous surfaces.
Following this introduction, section 3.2 presents the theoretical background and modeling details for coupling pore scale evaporation with a collection of eddies forming the turbulent airflow. Based on selected datasets published in literature, we evaluate the proposed model in section 3.3 by first considering turbulent evaporation from free water surfaces and a comparison with the Brutsaert’s [1975a] model, then comparisons of model predictions for drying porous surfaces using experimental data. Finally, we provide summary and concluding remarks in section 3.4.
3.2 Theoretical Considerations
The proposed model was inspired by surface rejuvenation concepts (a variant of SR models) that preclude fluid elements from directly contacting the surface.

Chapter 3 31 Danckwerts [1951] discussed aspects of surface rejuvenation whereby an undisturbed sublayer of fluid remains at the surface with its face being periodically renewed with fresh fluid eddies. The mathematical formulation of the concept by Harriott [1962] considers random eddy modification of the penetration theory with fluctuations within a wall region characterized by a mean renewal frequency and a mean distance from the surface at which fluid is ejected. Harriott [1962] noted that shortcomings of some earlier theories (including the film-penetration theory employed by Brutsaert [1975a]) involve the tacit assumption that renewal eddies make contact with the surface, and argued that the no-slip conditions at the surface precludes fluid eddies from sweeping away all fluid layers right down to the surface.
A sketch of the SR concept used in the physical model is illustrated in Figure 3.1. Specifically, we consider eddies that during their residence time near the surface become gradually loaded by diffusing vapor across a viscous sublayer over the eddies’ footprint area. These eddies are subsequently ejected/renewed by the turbulent airflow. In the following section, we discuss the coupling between an evaporating surface and a turbulent airflow above the surface through local sublayer thicknesses formed by eddies of various characteristics.
3.2.1 Evaporative Coupling between a Drying Surface and Turbulent Airflow
The vapor flux from the surface into the i th renewal eddy per unit area in unit time, iE (kg/m2s), can be described as
=
∂= −
∂ @ 0i
i z
CE Dz
(3.1)
where =
∂ ∂@ 0i z
C z is the vapor concentration gradient at the surface induced by the i th eddy across the local viscous sublayer, and D (m2/s) is the vapor diffusion coefficient in air. Taking the expected (average) vapor flux over all eddy exposure times using the eddy exposure time distribution, φ τ( ) , the average vapor flux E(kg/m2s) is expressed as
φ τ τ∞
=
∂= − ∂
∫0@ 0
( )i z
CE D dz
(3.2)
A useful form of φ τ( ) is based on the gamma distribution [Bullin and Dukler, 1972; Seo and Lee, 1988] expressed as
ααβφ τ τ βτ
α
+
= −Γ +
1
( ) exp( )( 1)
(3.3)

32 Diffusion-turbulence evaporation model where
αβτ+
=1
(3.4)
Γ = −( ) ( 1)!n n is the gamma function, α (-) is the gamma shape parameter (hereafter referred to as the eddy spectrum parameter), and τ (s) is the mean eddy exposure time. The gamma distribution for eddy exposure times offers several advantages such as: (1) the residence times are defined over an interval from zero to infinity; (2) the shape of the gamma distribution conforms with physical intuition and offers flexibility using a single parameter,α ; and (3) the gamma distribution provides convenient operational properties for calculating various average transport quantities [Seo and Lee, 1988].
Considering Eq. (3.2), some assumptions, concerning evaporation dynamics from the surface under study, are required to obtain the vapor concentration gradient at the surface. This requires a clear distinction between evaporation from free water and drying porous surfaces.
3.2.1.1 Evaporation from a Smooth Free Water Surface
Motivated by flow visualization studies [Kline et al., 1967; Corino and Brodkey, 1969; Kim et al., 1971], Brutsaert [1975a] developed a model in which diffusion into a fresh eddy sweeping over the interface is governed by
∂ ∂− =
∂ ∂
2
20a
C CU Dx z
(3.5)
where aU (m/s) is the linear wind velocity profile in the viscous sublayer region. By introducing a similarity variable, Brutsaert [1975a] solved Eq. (3.5) along with the boundary conditions to obtain an expression for the mean gradient at the surface over the distance swept by the eddy of the size of the Kolmogorov length scale,
τ −
=
∂= − ∂
1/3
1/3=0
@ 0
( )i s ai z
uC c C Cz vD
(3.6)
where 0c (-) is a constant, v (m2/s) is the air kinematic viscosity, and sC and aC(kg/m3) are the vapor concentrations of air at the water surface and at the border of the viscous sublayer in the drying airflow, respectively. Finally, substitution of Eq. (3.6) into Eq. (3.2) and considering the eddy exposure time distribution proposed by Danckwerts [1951], αφ τ =@ 0( ) , yields the mean vapor flux from a smooth free water surface as [Brutsaert, 1975a]

Chapter 3 33
−= − 2/31 =( )s aE c u C C Sc (3.7)
where ≈1 0.07c is an empirical dimensionless constant. As discussed in the introduction, successful tests of Eq. (3.7) for prediction of turbulent evaporation fluxes from free water surfaces [Brutsaert, 1975a] conceal limitations of its application to representing evaporative fluxes from drying surfaces due to nonlinear interactions (surface resistance) and the neglect of longitudinal diffusion (along flow direction) implicit in Eq. (3.5) above (see also Haghighi et al. [2013]).
3.2.1.2 Evaporation from a Smooth Porous Surface
Evaporation rates from drying porous surfaces are typically not proportional to the reduction in surface water content, and often remain constant for extended periods [Suzuki and Maeda, 1968; Schlünder, 1988; Shahraeeni et al., 2012]. The mechanisms responsible for the maintenance of a constant evaporation rate were studied by Suzuki and Maeda [1968], Schlünder [1988], and more recently by Shahraeeni et al. [2012] elucidating the role of enhanced diffusive fluxes from active pores (as spacing between pores increases with surface drying) which accordingly compensate for loss of evaporating pores. Unlike the detailed study by Shahraeeni et al. [2012] that considered pore emptying sequence during drying, we consider here a simpler scenario in which the porous surface is represented by a single effective pore size and the surface water content (density of evaporating pores per surface) varies to mimic surface drying. We ignore in this simplified approach potential limitations imposed by capillary flow to the surface which become important at very low surface water contents [Shahraeeni et al., 2012; Haghighi et al., 2013], and focus on the limitations due to vapor transfer across the viscous sublayer [Suzuki and Maeda, 1968; Schlünder, 1988; Shahraeeni et al., 2012; Haghighi et al., 2013].
As discussed previously, the turbulent eddies are never in direct contact with the surface (Figure 1), hence, we do not consider interactions with roughness on the order of grain sizes. In other words, we treat the porous surface as an equivalent smooth surface where renewal eddies are swept and with no trapping within roughness elements [Brutsaert, 1975a]. Shahraeeni et al. [2012] and Haghighi et al. [2013] have recently shown that the contribution of air advection on the evaporation flux from porous surfaces is relatively minor as compared to gaseous diffusion across the viscous sublayer. Hence, considering vapor diffusion only from individual pores accounts for most of the evaporation fluxes. The resulting governing equation for steady-state diffusion into a fresh eddy sweeping the surface

34 Diffusion-turbulence evaporation model is given as
∂ ∂+ =
∂ ∂
2 2
2 20C C
x z (3.8)
In fact, it is assumed that mass diffusion rates from the surface are rapidly established and reach steady state before an eddy is ejected back to the turbulent air mass above [Brutsaert, 1975a]. Accordingly, the local mean gradient at the surface induced by the i th eddy during its residence time can be obtained from a simple analytical expression as [Schlünder, 1988; Haghighi et al., 2013]
δ θ=
∂ −= −
∂ +@ 0
1 ( )P ( ) s a
i surfi z
C C Cz f
(3.9)
where δi (m) is the thickness of the viscous sublayer formed by the i th eddy, P(m) is the 1-D mean effective pore size ( π=P r ; with r (m) as the pore radius) [Haghighi et al., 2013], and the surface wetness-depended coefficient θ( )surff is obtained from [Schlünder, 1988]
πθθπ θ
= −
1( ) 14surf
surfsurf
f (3.10)
with θsurf (-) as the surface water content (represented conceptually in this approximation by identical pores on a regular lattice with relative evaporating pore area equal to θsurf ). Although in the original derivation, the application of Eq. (3.10) was limited to pore radii larger than 0.01 mm (i.e., > 0.01r mm or δ > 0.01ir ) [Schlünder, 1988], subsequent tests using a highly resolved numerical
solution of the 3-D diffusion problem reveals that the solution remains accurate down to = 0.001r mm (results not shown here). Due to the square unit cell assumed in the derivation [Schlünder, 1988], Eq. (3.10) is valid for the range of
θ π≤ ≤0 4surf such that θ( )surff varies from zero at θ π= 4surf (“free water surface”) to infinity at θ = 0surf (completely dry surface).
We note that the decrease in surface water content during drying is associated with increased spacing between active (water-filled) pores, which, for very large pore spacing, could reach the range of small eddies size. Nevertheless, such a scenario is highly unlikely for evaporation from most natural porous surfaces ( < 500r micron), and even for low surface water contents (e.g., θ = 0.1surf ), the remaining water-filled pores are likely to be on order of 1 to10 micron in size with spacing on the order of 10-100 micron. Hence, for most scenarios of interest, the likelihood of an eddy footprint over a completely dry surface is negligible even for the smallest eddies of the order of viscous sublayer thickness (≈ 1 mm at air velocities larger

Chapter 3 35 than 2 m/s).
The potential effects of the so-called “turbulent pumping” [Kimball and Lemon, 1971; Massman et al., 1997] on mass exchange were not considered in this study. Such turbulence-driven pressure pumping effects are minor in wet porous surfaces with small water-filled pores, as both wetness and small pore size act to dampen convection into the porous medium. In contrast to the turbulent pumping effects, the explicit consideration of variations in the viscous sublayer thickness (Eq. (3.9)) plays an important role in mass exchange with turbulent airflow as shown next.
Based on the studies of Meek and Baer [1970 and 1973] concerning the cyclical nature of the viscous sublayer under turbulent flows, we estimate (to a first approximation) the thickness of the viscous sublayer formed under an eddy footprint as a function of the eddy residence time τ i (reflecting also its velocity), as
δ τ= 2i ic v (3.11)
where τ i (s) is the residence time of the i th eddy and 2c (-) is a proportionality constant that varies from 1.6 to 3.64 depending on flow geometry [Popovich and Hummel, 1967; Meek and Baer, 1973; Tuoc and Keey, 1992].
Considering Eq. (3.11), Eq. (3.9) reflects the dependency of the vapor concentration gradient on the eddy residence time τ i (s), so it may be substituted into Eq. (3.2) to derive the average evaporative flux over all eddy renewals. However, substituting Eqs. (3.9) and (3.11) into (3.2) results in an integral with no closed-form solution, due to the additional term in the denominator for the effects of surface properties
θP ( )surff , requiring numerical evaluation. Nevertheless, to obtain a useful analytical approximation, we make the following simplification and rewrite the mean (expected) value of the vapor gradient over N eddy replacements defined in Eq. (3.2) as [Bullin and Dukler, 1972]
→∞= =
∂= − ∂
∑1 @ 0
1limN
N i i z
CE DN z
(3.12)
Considering Eq. (3.9) and the averaging approximation used by Bullin and Dukler [1972], we obtain the mean evaporation flux as
δ θ= −
+( )
P ( ) s asurf
DE C Cf
(3.13)
This expression requires an estimate for the mean (effective) viscous sublayer thickness δ over the surface.

36 Diffusion-turbulence evaporation model 3.2.2 Surface Renewal and Mean Viscous Sublayer Thickness
As discussed previously, the determination of surface fluxes into turbulent airflows requires quantification of the viscous sublayer across which such fluxes are transported [Cooke, 1969; Schlünder, 1988; Shahraeeni et al., 2012; Haghighi et al., 2013]. The viscous sublayer is the region close to the surface that underlies the turbulent airflow where momentum transfer is dominated by viscous processes. Classical concepts of eddy diffusivity often treat this sublayer as the result of an essentially steady mean flow upon which small turbulent fluctuations are imposed. Detailed studies indicate existence of well-ordered periodic motions suggesting that this region consists of a mosaic of periodically replaced local fluid elements [e.g., Kline et al., 1967; Kim et al., 1971; Wallace et al., 1972].
Meek and Baer [1970] derived Eq. (3.11) by considering the edge of the viscous sublayer (wall region) as the position where the velocity is 99% of the bounding velocity. Although SR-based concepts do not differentiate among time scales at the wall region (emerging from different transfer mechanisms), momentum and mass transfer across the viscous sublayer must be renewed simultaneously by the incoming eddies. In other words, the momentum time scale defines the instance where an eddy ejection occurs and therefore sets the lifetime for the development of a viscous sublayer. Strictly speaking, the depth of penetration of viscous momentum and mass from a smooth surface differs due to the difference in momentum and mass diffusivities; nevertheless the Schmidt number ( =Sc v D ) for water evaporation into air is of the order of unity which implies that there is only one characteristic time scale for the viscous sublayer.
Taking φ τ( ) as the probability density of eddy exposure times defined in Eq. (3.3), the expected value of the viscous sublayer thickness over all eddy lifetimes is defined as
ααβδ τ τ βτ τ
α
+∞= −
Γ +∫1
1/22 0
exp( )( 1)
c v d (3.14)
with β α τ= +( 1) . The mean cycle period of the viscous sublayer τ (s) can be approximated with the surface parameters, the friction velocity =u (m/s), and the air kinematic viscosity v (m2/s), as [Meek, 1972; Meek and Baer, 1973; Iritani et al., 1985]
τ = 3 2=
vcu
(3.15)
where the proportionality constant, 3c (-), varies from 112 to 324 determined from

Chapter 3 37 the data for flow over smooth plates and in smooth tubes ( × < < ×4 52 10 Re 5 10 ) [Meek, 1972; Pinczewski and Sideman, 1974; Iritani et al., 1985]. As a rough estimate, we use the value of =3 112c in this study which is in agreement with those inferred from the visualization studies of turbulent liquid flow over smooth plates [Kline et al., 1967; Kim et al., 1971; Iritani et al., 1985].
We may now estimate the most important variable for evaporation, the mean thickness of the viscous sublayer, by combining Eqs. (3.14) and (3.15) yielding
δ = 4=
vcu
(3.16)
where 4c (-) is a dimensionless coefficient as function of the eddy (residence time) spectrum parameter, α ,
α
π αα α αα+
== × Γ + Π + >+
2 34 ( 1)
1 01( 1) (2 1) 02 1
c cc (3.17)
in which
α α α α αΠ + = + × − + × − + × × − +(2 1) (2 1) (2( 1) 1) (2( 2) 1) ... (2( ) 1)n (3.18)
with α<n as the largest integer smaller than α . Evaluating Eqs. (3.17) and (3.18) for α values varying from 0 to 5 (with =2 2.2c and =3 112c ) yield a range of 4c values that vary from 20.6 to 22.8.
Finally, substitution of Eq. (3.16) into (3.13) provides the mean evaporation flux from a drying surface, as
θ= −
+4=
( )P ( )
s a
surf
DE C Cvc fu
(3.19)
Eq. (3.19) is the main result of the present study representing a simple and general formulation for predicting turbulent evaporation flux from a (smooth) drying surface. The model includes the effects of surface water content, θsurf , the pore size, P , and turbulence characteristics (through the flow-dependent constant 4c and the friction velocity =u ) within a physically based expression.
The effect of the simplification made in Eq. (3.12) (for facilitating the analytical expression in Eq. (3.19)) was compared with a full numerical solution of Eq. (3.2).

38 Diffusion-turbulence evaporation model The relative error for pore sizes ranging from 10 to 500 microns, and for surface water contents in the range of 0.6 to 0.0 did not exceed 8%.
3.2.3 Model Closure
For a given effective pore size (characterizing soil type) and for a known surface water content, one may predict evaporative fluxes from the surface using Eq. (3.19); provided D , v , =u , and ∆C are known or estimated. D (m2/s) and v (m2/s) can be parameterized based on mean air temperature, ∞T (K), by an empirical linear relationship [Monteith and Unsworth, 2007; Shymanski et al., 2013] as
− −∞= × − ×7 5(1.49 10 ) 1.96 10D T (3.20)
− −∞= × − ×8 5(9 10 ) 1.13 10v T (3.21)
Considering the law of the wall in the turbulent flow field near a solid wall, the friction velocity =u (m/s) is known to depend on the turbulent state of the flow [Weber, 1999; Pope, 2000]. Thus, for given airflow conditions, one can link the friction velocity to the turbulent flow nature (parameterized by α ) as
α ∞=+=
0.31
u U (3.22)
where ∞U (m/s) is the mean air velocity (see also the Appendix).
Finally, the vapor concentration difference ∆C (kg/m3) in Eq. (3.19) is a function of temperature and vapor pressure differences between the surface and the flowing air mass. Considering water vapor as an ideal gas, we may express the water vapor concentration difference as
∞
∞
− = −
( ) ( )w s s ss a
s
M P T P TC C RH
R T T (3.23)
where wM (kg/mol) is the molar mass of water ( 0.018≈ kg/mol), R (J/mol K) is the universal gas constant (8.314 J/mol K), sT (K) is the surface temperature, sP(Pa) is the vapor pressure at the evaporating surface assumed to be the saturation vapor pressure at the surface temperature, and RH (-) is the air relative humidity. In this study, the vapor pressure sP (Pa) is computed using the Clausius-Clapeyron relation as [Hartmann, 1994]
λ = −
1 1( ) 611exp273
ws
MP T
R T (3.24)

Chapter 3 39 where λ (J/g) is the latent heat of vaporization (2450 J/g under atmospheric pressure). Note that even for micrometric pore sizes, the reduction in vapor pressure above a curved water/air-menisci (the so-called Kelvin effect) is negligibly small for most pore sizes (it becomes important only for nanometric pores [Metzger and Tsotsas, 2005]). We therefore neglect the Kelvin effect in this study and consider saturated vapor concentration at the evaporating water menisci.
3.3 Results and Discussion 3.3.1 The Dynamics of Mean Viscous Sublayer Thickness
The functional form of the viscous sublayer thickness established in Eq. (3.16) is similar to formulations found in many fluid mechanics textbooks. Kundo and Cohen [2002] considered δ = =5v u for the region in which the velocity profile is strictly laminar and labels the region between =5v u and =30v u as the buffer layer, the transition zone between laminar and fully turbulent flow. The present approach incorporates a flow-dependent constant ( 4c ) and friction velocity that control the thickness of the sublayer for different turbulence regimes (with different eddy exposure time distributions). Turbulent flows far away from solid walls are often defined as “free shear flows” (unbounded turbulence), whereas turbulence near solid surfaces is referred to as “shear flows” and often exhibits different characteristics relative to the unbounded turbulence [Pope, 2000]. This difference implies that eddy distributions parameterized by large values of α could describe free shear flows, as turbulent away from the surface is expected to be composed of larger size (low renewal frequency) eddies. For processes within the wall-bounded turbulence, smaller values of the parameter α (e.g., to the limit of the exponential form of the eddy exposure time distribution) provide a better representation as the eddy spectrum contains smaller scales of eddies, as expected for shear flows.
Figure 3.2 represents the variations in the viscous sublayer thickness with air velocity and the eddy spectrum parameter α . The reasonable agreement between the model predictions and experimental results (for air velocities larger than 1 m/s) reported by Hisatake et al. [1995] inspires a confidence to the approach. Furthermore, the comparison of the results obtained for different eddy spectrum parameters clearly shows that increasing occurrence of larger eddies with longer exposure times (increasing α ), the mean viscous sublayer thickness becomes thicker consistent with the studies of Meek and Baer [1970] (see Eq. (3.11)). For comparison, we also include laminar representation of the viscous sublayer thickness based on the studies by Hisatake et al. [1995] and the well-known Blasius laminar solution [White, 2003]. The comparison shown in Figure 3.2 also reveals certain

40 Diffusion-turbulence evaporation model aspects of turbulent flows effects on mass transfer relative to corresponding laminar flows ( ∞ > 1U m/s) through thinning of the viscous sublayer and thus enhancing vapor pressure gradient at the surface [Schlünder, 1988]. The results also indicate that the minimum velocity below which the flow is no longer turbulent increases with increasing the eddy spectrum parameter α . This implies that a turbulent airflow including small-scale eddies (e.g., α = 0 ) can be sustained at lower wind velocities in agreement with the studies of Seo and Lee [1988]. We note that for low wind velocities at which the flow is no longer turbulent and is of mixed properties [Lim et al., 2012], the present turbulent model may not be appropriate for prediction of evaporation, and a simpler laminar flow-based description similar to Shahraeeni et al. [2012] would suffice.
Figure 3.2: Variation of the mean viscous sublayer thickness as function of the mean air velocity and the eddy residence time distribution (shape parameter α ). Considering the processed experimental data reported by Hisatake et al. [1995], the proposed model provides reasonably accurate estimates of the mean viscous sublayer thickness especially with α = 2 . The results shown in the inset present a typical eddy residence time (τ ) distribution with a mean value of τ = 2
=112v uevaluated at a typical mean air velocity of ∞ = 2U m/s. For low wind velocities below which the flow is no longer turbulent (compared to the Blasius laminar solution), the present turbulent model may not be appropriate for prediction of evaporation and the comparison should be truncated.
Lam
inar
dat
a
Turb
ulen
t dat
a

Chapter 3 41 In conclusion, the proposed eddy spectrum parameter α indicates the role of different eddy populations (with different characteristics) in turbulent airflows through adjusting the viscous sublayer thickness. Even though the eddy exposure time distribution (parameterized by α ) varies with momentum field measurement height (discussed in the Appendix), that complicates the determination of this parameter for the eddy distribution interacting with the surface, we envision that surface thermal fluctuations provide a reliable and direct means for determining the parameter at the surface where eddy interactions takes place. These thermally deduced shape parameters also yield a value of α = 2 providing an estimate applicable for most of practical scenarios and in agreement with values deduced from experimental data of Hisatake et al. [1995] (Figure 3.2).
3.3.2 Free Water Evaporation: Comparison with Brutsaert’s [1975a] Model
Eq. (3.19) enables estimates of the mean evaporation flux, E (kg/m2s), from evaporating surfaces with known surface water content exposed to different turbulent airflow regimes. Moreover, the same surface wetness-dependent resistance function, θ( )surff , facilitates estimation of evaporative fluxes also from free water surfaces at θ = 1surf ( π= 4 in the present model) resulting in
−= − 1=
4
1 ( )s aE u C C Scc
(3.25)
A comparison of Eq. (3.25) with Eq. (3.7) (established by Brutsaert [1975a]) reveals that the functional form of the two models is similar. The main differences with Brutsaert’s [1975a] model involve the proportionality constant and the exponent of the Schmidt number for which Brutsaert [1975a] obtained, respectively, ≈1 0.07c and an exponent of -2/3 (see Eq. (3.7) above), whereas we obtained an airflow-dependent coefficient 41 / c , and the exponent of -1, respectively. Unlike the model of Brutsaert [1975a], we derived the coefficient 4c analytically (as a function of the parameter α ) which provides insights into origins and flow regime effects on this parameter. Interestingly, despite differences in these coefficients and the exponent for the diffusivity (resulted from different governing equations used for the derivations), the two models provide quite similar predictions for evaporation from free water surfaces (Figure 3.3).

42 Diffusion-turbulence evaporation model
Figure 3.3: Log-log comparison of theoretical turbulent evaporation fluxes in kg/m2s from a free water surface with the experimental results of Shepherd [1938] and Yu and Brutsaert [1967]. The predictions obtained by the Brutsaert’s [1975a] model and by the new model are in reasonable agreement with the experimental data. The agreement reaffirms the dominance of diffusion (new model) over advection [Haghighi et al., 2013].
The results shown in Figure 3.3 reveal that both models are in reasonable agreement with the experimental data of Shepherd [1938] and Yu and Brutsaert [1967] reaffirming the dominance of diffusion processes (in the core of the new model) over advection [Haghighi et al., 2013]. We have noted a constant bias between evaporative fluxes over free water surfaces predicted by the proposed new model and Brutsaert’s [1975a] derivations as =NewModel Brutsaert0.85E E attributed to the differences between the constants and the exponent of the Schmidt number in the two models. Considerng Eqs. (3.7) and (3.25) for the same experimental conditions ( =u and ∆C ) for = 0.6Sc (for water evaporation into air), the constant bias between the two models is simply
( ) −≈ × ≈1/3NewModel Brutsaert 0.05 0.07 0.6 0.85E E .
We note that the experimental data used for this comparison were taken from Shepherd [1938] and Yu and Brutsaert [1967]. The measurements of Shepherd [1938] were performed in a dryer-type wind-tunnel (46 cm width and 61 cm height)

Chapter 3 43 with air passing over the samples parallel to the test surface. The key parameters for these experiments involved: air temperature, 338.7 K; relative humidity of air, 30 to 60%; air velocity, 0.8 to 6.7 m/s; and the depth of the insulated water-filled trays was 2.54 cm (with cork insulator of 2.54 cm thickness). Detailed information on the experimental setup is provided by Shepherd [1938] (p. 390, Table II). Similarly, Yu and Brutsaert [1967] studied different aspects of evaporation from small water surfaces (2.54 cm deep square pans) exposed to natural turbulent airflows. Experiments were conducted in insulated pans (Styrofoam) of different sizes, among which we used the first 10 runs with the pan of size 122 cm for the comparisons. The ranges of the variables during evaporation tests were: the air temperature, 292.45 to 304.45 K; the relative humidity of air, 40 to 76.5%; and the air velocity, 1 to 3 m/s [Yu and Brutsaert, 1967; pp. 266-268, Tables 1a and 1b].
3.3.3 Evaporation Dynamics from Drying Porous Surfaces
Following the agreement of model predictions with evaporation measurements from free water surfaces, we evaluated model performance for evaporative fluxes from drying porous surfaces into turbulent airflows using literature experimental results. Shepherd [1938] performed drying experiments using sands placed in trays to study the effects of various drying conditions on the constant drying rate (stage-I evaporation). The porous media consisted of Ottawa sand of two different particle sizes, with average particle diameters of 0.8 mm and 0.3 mm and porosity (saturated water content) of 40% and 44%, respectively. The physical characteristics of the two sand samples are reported in Shepherd [1938] (p. 389, Table I). The ranges of drying variables were: air temperature, 319 to 422 K; air relative humidity, 10 to 60%; air velocity, 0.8 to 7 m/s; sand depth, 1.3 to 5 cm; and experiments were done in insulated (2.54 cm thick cork) and non-insulated trays (see Shepherd [1938]).
Additionally, we have used results obtained by van Brakel [1980] and Lee et al. [1992] that studied effects of air velocity on stage-I evaporation during drying of a sintered pack of glass beads. The measurements of van Brakel [1980] and Lee et al [1992] were, respectively, conducted under the conditions: air temperature, 345.5 K and 338.15 K; air velocity, 17.8 m/s and 4.9 m/s; particle diameter, 0.4 to 0.5 mm and 0.12 mm; porosity, 37.4% and 35.5 %; and material depth, 5 cm and 2.54 cm. Considering the range of the air velocities (> 5 m/s corresponding to mean viscous sublayer thicknesses < 1 mm), and the mean effective pore sizes (> 0.1 mm), the ratio of δr is larger than 0.1 ( 0.001) which is well within the range of applicability of the Schlünder’s [1988] formulation used to establish surface wetness

44 Diffusion-turbulence evaporation model resistance to vapor exchange in the model.
Figure 3.4 depicts a comparison between measured and predicted turbulent evaporation fluxes from porous surfaces as function of the surface water content for various evaporative demands. The agreement between the proposed model and the experimental data of Shepherd [1938] (Figure 3.4a), van Brakel [1980], and Lee et al. [1992] (Figure 3.4b) was generally good and the model predictions required relatively simple input parameters. The nonlinearities between evaporative fluxes and surface water content are not included in free water based models, assuming that evaporation from a partially wet surface is simply linearly related to the surface water content, and thus limit their applicability to the broader problem of drying surfaces (Figure 3.4a). Based on the recent analyses by Shahraeeni et al. [2012] and Haghighi et al. [2013], we also expect that the results derived from a nonlinear model including the diffusion-advection equation (5) used by Brutsaert [1975a] underestimate evaporative fluxes due to the neglect of vapor diffusion along the mean flow direction.
An important input parameter for the model is the surface pore size distribution required for representation of pore drying sequence and for more complete account of capillarity, gravity, and viscous forces [Lehmann et al., 2008; Lehmann and Or, 2009; Shahraeeni et al., 2012]. In the absence of complete information on pore size distribution, we simplified the requirement to a single value of a characteristic pore size (r ) used as input for the diffusion solution in Eq. (3.19). Evidence suggests that evaporation dynamics (especially towards the end of the constant rate evaporation) are dominated by the smallest water-filled pores active at the drying surface [Shahraeeni et al., 2012]. We thus arbitrarily estimated the characteristic pore size for evaporative exchange as 1/10 of the mean particle diameter (1/3 of mean diameter is considered as representative of mean pore for coarse media and could be related to air entry value). Studies are underway to establish more rigorous criteria for selection of a pore size that controls stage-I evaporation dynamics.

Chapter 3 45
Figure 3.4: Predicted turbulent evaporative fluxes from partially wet surfaces, as a function of the surface water content, by the new model (lines) compared with the experimental data (symbols) measured by (a) Shepherd [1938] and (b) van Brakel [1980] and Lee et al. [1992]. The blue thin lines in (a) are estimates of evaporative fluxes from a free water surface of an area equivalent to the surface water content (1-D diffusion), as θ= BrutsaertsurfE E .
3.4 Summary and Conclusions
We developed a physically based analytical model for quantifying evaporative fluxes from drying porous surfaces into turbulent airflows. A simplified representation of

46 Diffusion-turbulence evaporation model the nonlinear effects of different surface water contents on evaporative fluxes was quantified using the pore scale diffusion model of Schlünder [1988]. The primary focus on evaporative fluxes from porous surfaces into turbulent eddies required simplifications of surface drying dynamics. In contrast with the physically based surface drying mechanistic model of Shahraeeni et al. [2012], we represented the surface using a single effective pore size, and represented drying by varying the number of uniformly distributed pores to mimic reduction in surface water content during evaporative drying.
The present model explicitly accounts for localized (and intermittent) variations in the viscous sublayer thickness as determined by eddy characteristics that directly affect local and instantaneous evaporative fluxes into a surface-interacting eddy. The average surface evaporative flux reflects interactions between surface diffusive fluxes and a population of eddies with different exposure times. Considering the eddy exposure time distribution (based on the gamma distribution), we are able to extract an effective viscous sublayer thickness as function of turbulent flow characteristics that explicitly considers the effect of eddy spectrum on the mass exchange process. Although we discussed that there are some uncertainties in reliably determination of the eddy spectrum parameter, which plays a key role in the proposed approach, we believe that this can be resolved through deducing this parameter from surface thermal fluctuations (rather than momentum field fluctuations) providing information exactly at the interaction surface.
Integration across the eddy population and derivation of the mean viscous sublayer thickness, the model successfully described turbulent evaporation rates from smooth free water surfaces (at θ π= 4surf ) very similar to the model of Brutsaert [1975a]. The main application of the model, however, was to turbulent evaporation rates from drying porous surfaces under natural boundary conditions. The agreement with experimental results reported in the literature confirms that both vertical and longitudinal vapor diffusion terms contributing to diffusive fluxes from gradually drying porous surfaces have to be taken into account so the associated nonlinearities can be captured properly.
Clearly, additional tests of the model are required, especially at the field-scale; nevertheless, the methodology presented herein offers new opportunities for describing the direct impact of turbulent airflows on evaporative fluxes from smooth porous surfaces. We envision that with the addition of roughness considerations and reliably determination of the eddy spectrum parameter using (intermittent) thermal

Chapter 3 47 signatures over the evaporating surface, the model could potentially provide a building block for upscaling to field and landscape scale applications.
Appendix A: Friction Velocity and Turbulent State
In the following, we clarify the relationship between the friction velocity and the eddy spectrum shape parameter (α ). A commonly used similarity relationship in the surface layer under neutral stability conditions is the logarithmic wind profile as [Weber, 1999; Pope, 2000]
=
=
0
lnu zuk z
(A.1)
where u (m/s) is the mean wind velocity ( ∞=u U ), k (-) is the von Karman constant ( ≈ 0.4k ), z (m) is height, and 0z (m) is roughness length scale. While k is a universal constant and 0z depends only on surface properties, the friction velocity may vary depending on the nature of the turbulent flow [Weber, 1999; Pope, 2000].
For given turbulent airflow conditions, one can obtain the friction velocity using Eq. (A.1) as
∞=
=
0
ln
ku Uzz
(A.2)
Eq. (A.2) expresses variations in the friction velocity with surface properties and height above the surface. The distribution of eddy sizes (or exposure times) parameterized by α also varies with distance from the surface (e.g., the two distinct regions namely shear and free shear flows mentioned above [Pope, 2000]). These codependences of these key parameters suggest potential relationship between the friction velocity and characteristics of turbulent flow expressed by the parameter α for different heights (distances) from the surface.
We reanalyzed data of Telesca and Lovallo [2011] for wind time series measured at different heights above the ground surface and deduced the variations of the eddy spectrum parameter α with height, as shown in Figure A.1. We note that eddy exposure time distributions (required for estimating α ) were obtained from the time difference between two consecutive peak and valley in the wind velocity time series, as described in Seo and Lee [1988]. The results shown in Figure A.1 reveal

48 Diffusion-turbulence evaporation model that the eddy spectrum parameter is an increasing function of the measurement height as
α = −00.75 ln( ) 1z z (A.3)
Note that this expression is only valid for ≥0ln( ) 4 3z z returning positive values of α .
Figure A.1: Variation of calculated eddy spectrum parameter (from wind data reported by Telesca and Lovallo [2011]) with height above the ground.
Combining Eqs. (A.2) and (A.3), we finally obtain an empirical relation between the friction velocity and the eddy spectrum parameter α as
α ∞=+=
0.31
u U (A.4)
This relation has been used in the present study (Eq. (3.22)) and its generality will be further evaluated in a subsequent study.
Acknowledgements
The authors thank the associate editor and three reviewers for their many insightful comments that helped improve the manuscript; and Mr. Fabian Rüdy for his assistance with the illustration in Figure 3.1. We also thank Dr. Luciano Telesca

Chapter 3 49 (Institute of Methodologies for Environmental Analysis, National Research Council, Italy) for providing us with the wind data analyzed in the Appendix. The funding by the Swiss National Science Foundation of the project “Evaporation from terrestrial surfaces – linking pore scale phenomena with landscape processes” (SNSF; 200021-113442), and the financial support of the German Research Foundation DFG of the project “Multi-Scale Interfaces in Unsaturated Soil” (MUSIS; FOR 1083) are gratefully acknowledged.

Part II: Infrared Thermography of Surface-
Turbulence Interactions


Chapter 4
Thermal Signatures of Turbulent Airflows Interacting with Evaporating Thin Porous Surfaces1
Abstract: Evaporative drying of porous surfaces interacting with turbulent airflows is common in various natural (hydrology, climate) and industrial (food, paper, and building materials) applications. Turbulent airflows induce spatially-complex and highly intermittent boundary conditions that affect surface evaporation rates and associated near-surface thermal regimes. Such interactions are particularly significant during stage-I evaporation (vaporization plane at the surface) where turbulent eddies induce highly localized and intermittent variations in evaporative fluxes that leave distinct thermal signatures observable by infrared thermography (IRT). A theoretical framework supported by an experimental method was proposed to capitalize on measured thermal fluctuations of evaporating porous surfaces to determine airflow turbulence characteristics and evaporative fluxes. The study focuses on thin surfaces with low thermal capacity to illustrate experimentally direct links between characteristics of surface thermal fluctuations and momentum-based turbulent eddy residence times. For most practical applications, the method could be applied using rapid IR measurements from a single sensor aimed at the surface. The theoretical links between surface wetness and characteristics of surface temperature fluctuations offer opportunities for remote quantification of drying and energy exchange processes from engineered and natural porous surfaces.
4.1 Introduction
The rates and patterns of vapor transfer from evaporating surfaces into airflows are determined by interplay between water supply to the surface, energy input, and interacting air boundary layer conductance. The early stages of evaporation from an
1published as: Haghighi, E., and D. Or (2015), Thermal signatures of turbulent airflows interacting with evaporating thin porous surfaces, Int. J. Heat Mass Trans., 87, 429-446.

Chapter 4 51 initially-saturated porous medium are often marked by high and relatively constant drying rate (the so-called stage-I evaporation) during which the vaporization plane remains at the surface and is supplied by capillary liquid flow from a receding drying front [Yiotis et al., 2004; Lehmann et al., 2008; Shahraeeni et al., 2012; Or et al., 2013]. The porous medium internal transport capacity during this stage is often high and exceeds the diffusive resistance to transport across an air viscous sublayer adjacent to the surface (i.e., the drying rate is governed by external aerodynamic conditions) [van Brackel, 1980; Schlünder, 1988; Shahraeeni et al., 2012; Haghighi et al., 2013, Haghighi and Or, 2013; Mosthaf et al., 2014].
The characteristics of airflow play an important role in defining nature of the viscous sublayer and its influence on evaporation dynamics. Turbulent flows over surfaces could be represented by populations of fluid parcels (termed eddies) comprised of a range of sizes and intensities [Panofsky and Dutton, 1984] that interact with surfaces and affect the rates of vapor, heat, and momentum exchange [Iritani et al., 1985; Oyakawa et al., 2000; Nakamura et al., 2011; Nakamura et al., 2012; Haghighi and Or, 2013]. The complex and often localized interactions between turbulent eddies and surfaces induce distinct surface thermal signatures [Schols et al., 1985; Hetsroni and Rozenblit, 1994; Balick et al., 2003; Gurka et al., 2004; Vogt, 2008; Nakamura, 2011; Christen et al., 2012; Garai et al., 2013]. Such surface thermal signatures are affected by surface properties (wetness, thermal capacity), and offer a means for remote quantification of instantaneous heat and mass exchange into turbulent flows [Iritani et al., 1985; Hetsroni and Rozenblit, 1994; Haußecker et al., 1998; Garbe et al., 2003; Atmane et al., 2004; Hara et al., 2007; Nakamura, 2011; Kräuter et al., 2014].
Infrared imaging of such interactions between coherent turbulence structures (eddies) and surfaces was first studied by Derksen [1974] and Schols et al. [1985] revealing streaky patterns of surface temperatures along airflow directions. Similar patterns in surface temperatures were subsequently observed by Hetsroni and Rozenblit [1994], Hetsroni et al. [2001], Gurka et al. [2004], Nakamura [2011], and Nakamura et al. [2012]. According to Katul et al. [1998] and Renno et al. [2004], rapid surface temperature fluctuations may be attributed to inactive eddy motions due to turbulence in the outer region and convective mixed layer processes [Townsend, 1961]. Such interactions could be detected from near-surface pressure fluctuations and from the lower wave-number region of the longitudinal velocity spectra [Katul et al., 1996 and 1998].

52 Thermal signatures of turbulent airflows In contrast with numerous studies focusing on turbulent coherent structures forming the convective turbulent boundary layer [Kline et al., 1967; Wallace et al., 1972; Wark and Nagib, 1991; Falco, 1991; Jeong et al., 1997; Schoppa and Hussain, 2002; Adrian, 2007; Schlatter et al., 2014], the impacts on surface temperature fluctuations and the role of these intermittent interactions on surface fluxes is generally less studied. To systematically consider surface thermal signatures characteristics and their links with surface fluxes [van de Griend et al., 1985; Gaikovich and Troitsky, 1997; Gaikovich, 2000; Kustas and Anderson, 2009], this study aims to use the model of Haghighi and Or [2013] and augment it by considering instantaneous energy exchange (due to eddy interactions) to quantify the resulting surface fluxes and the corresponding localized temperature dynamics.
Haghighi and Or [2013] have used the surface renewal (SR) formalism [Higbie, 1935; Danckwerts, 1951; Harriott, 1962; Brutsaert, 1975a; Seo and Lee, 1988] to develop a mechanistic model for evaporative fluxes from drying porous surfaces into turbulent airflows (Figure 4.1). The model considers surface-eddy interactions during their finite residence/exposure time over the surface. As eddies are being swept along the surface, they become gradually enriched by diffusing vapor (or exchange heat) across a viscous sublayer that forms over the footprint area (the interacting area with the surface). Eddies are eventually ejected back to the turbulent flow and subsequently replaced by new eddies. Consequently, an evaporating surface may be locally cooled down or warmed up relative to air temperature, and the resulting intermittent and spatial surface temperature dynamics can be resolved using rapid and high resolution infrared thermography (IRT).
Technological advances in IRT methods contributed to its rapidly expanding range of applications including remote sensing and hydrology, thermal efficiency of infrastructure, and numerous industrial and medical applications [Anderson et al., 1995; Atmane et al., 2004; Lu and Shen, 2007; Shahraeeni and Or, 2010b; Gurudatt et al., 2010; Song and Shida, 2010; Lahiri et al., 2012]. Kalma et al. [2008], Qiu and Zhao [2010], and Shahraeeni and Or [2010b] have shown how IRT measurements could be used to remotely estimate spatially variable evaporative fluxes from heterogeneous terrestrial surfaces. Focusing on rapid thermal dynamics, Schimpf et al. [1999], Garbe et al. [2004], and Asher et al. [2012] exploited surface IRT measurements to characterize micro turbulence (in water) and estimate air-sea heat and gas fluxes from the statistics of ocean skin temperatures.

Chapter 4 53
Figure 4.1: Schematic of an idealized surface renewal process by turbulent air parcels. The turbulent airflow interacts with the evaporating surface as a collection of individual parcels (eddies) with different characteristics drawn from a distribution. Vapor transfer through a unit surface into individual eddies is governed by 3D diffusion from individual pores across a local viscous sublayer forming below an eddy’s footprint (see the inset). Depending on the temperature difference between the surface and the renewal eddy, the surface can either cool down or warm up due to the completion between inward sensible and outward latent heat fluxes. A typical variation in the surface temperature (surface response to temperature depression) as a function eddy residence time and surface thermal thickness is shown in the graph. The lines mark different values of effective “thermal thickness” for surface temperature fluctuations with the dotted line indicating “thicker” interacting surface layer.
Eddy Residence Time, τ
T0
Teq
Surf
ace
Tem
pera
ture
, Ts
Increasing ω
δi
G
S
H Rn λE
∂T/∂x=0
Ts
Ua, Ta
U∞, T∞
Laminar Turbulent
z x
ω

54 Thermal signatures of turbulent airflows Considering the potential offered by these recent developments, the primary objective of this study was to establish quantitative links between momentum exchange induced by turbulent airflows and the resulting temperature fluctuation patterns forming over evaporating porous surfaces and observable by IR imaging. The specific objectives of the study were to: (1) establish theoretical links between turbulent flow field characteristics and surface temperature fluctuations over evaporating surfaces; (2) use the theoretical framework and reconstruct characteristics of turbulent airflows from rapid measurements of surface temperature fluctuations; and (3) use the method and dynamic thermal information to remotely estimate surface evaporation rates (and other scalar exchange). We defer complexities related to surface roughness on turbulent interactions [Perry et al., 1987; Chen, 1990; Lin et al., 1997; Bhaganagar et al., 2004] to future studies, and focus here on interactions with “smooth” evaporating surfaces.
Following this introductory section, we present in section 4.2 the modeling framework and discuss the nature of coupling between surface temperature dynamics and a turbulent momentum field. Section 4.3 is devoted to describing experimental considerations used for exploring similarities between turbulent airflows and surface temperature fluctuations. Experimental results addressing the research objectives are presented in section 4.4, followed by summary and concluding remarks in section 4.5.
4.2 Theoretical Analysis of Surface Temperature Dynamics due to Turbulent Airflows
4.2.1 Eddy Renewal Characteristics and Air Viscous Sublayer Thickness
The intermittent nature of turbulent airflows gives rise to fluctuations in the thickness of viscous sublayers forming beneath interacting eddies [Einstein and Li, 1956; Meek and Baer, 1970 and 1973; Haghighi and Or, 2013]. Based on own characteristics (size and residence time), each eddy forms a well-defined viscous sublayer that provides the boundary conditions for heat and vapor transfer by thermal conduction and molecular-diffusion, respectively [Gaikovich, 2000; Shahraeeni et al., 2012; Haghighi et al., 2013; Haghighi and Or, 2013]. The resulting scalar transfer rates are determined by temperature and water vapor gradients across the viscous sublayer. We assume that the eddy properties above this thin boundary remain as those of the fully mixed turbulent airflow regime. Consequently, we tacitly assume that scalars in the turbulent flow are well mixed, and vertical gradients in scalar values (for purposes of exchange with the surface)

Chapter 4 55 occur primarily across the viscous sublayer [Gaikovich, 2000; Haghighi and Or, 2013]. For brevity, we recap the main results from Haghighi and Or [2013] that are directly relevant for this study.
Motivated by studies of Meek and Baer [1970 and 1973] on the fluctuating nature of the viscous sublayer thickness under turbulent regimes, Haghighi and Or [2013] estimated the thickness of the viscous sublayer forming below an eddy’s footprint, δi (m), as a function of eddy residence time, τ ,m i (s), as
δ ν τ= ,i a m ic (4.1)
where = 2.2c is a proportionality constant depending on flow geometry [Popovich and Hummel, 1967; Meek and Baer, 1973; Tuoc and Keey, 1992; Haghighi and Or, 2013], νa (m2/s) is the kinematic viscosity of air, and τ ,m i (s) is the “momentum” residence time of the i th eddy. Studies have shown that the distribution of eddy residence times follows the gamma statistical distribution [Brutsaert, 1975a; Seo and Lee; 1988; Atmane et al., 2004] that is of practical interest for various natural applications facilitating parametric and analytical modeling [Thom, 1958; Jury and Gruber, 1989; Nadarajah and Gupta, 2007; Ebrahimi and Or, 2014]. The well-established SR-based approaches coupled with the gamma distribution offers a convenient representation of eddy residence time distribution φ τ( ) as [Danckwerts, 1951; Brutsaert, 1975a; Seo and Lee; 1988; Atmane et al., 2004]
ααβφ τ τ βτ
α
+
= −Γ +
1
( ) exp( )( 1)
(4.2a)
αβτ+
=1
(4.2b)
where Γ = −( ) ( 1)!n n is the gamma function, and α (-) and β (1/s) are, respectively, the shape and rate parameters that control the shape of the distribution and provide insights on the nature of interactions between turbulent airflows and the surface (e.g., a turbulent regime characterized by small or large α (for a constant β ) is referred to as small- or large-scale eddy dominated, respectively [8]), and τ (s) is the mean residence time of the eddy residence time distribution.
Considering Eqs. (4.1) and (4.2), an effective viscous sublayer thickness as a function of turbulent flow characteristics that explicitly considers the influence of the eddy spectrum on mass exchange processes is established according to [Haghighi and Or, 2013]

56 Thermal signatures of turbulent airflows
νδ α=
=
( ) afu
(4.3)
where =u (m/s) is the friction velocity estimated as [Haghighi and Or, 2013]
α ∞=+=
0.31
u U (4.4)
with ∞U (m/s) the mean air velocity, and α( )f is obtained from [Haghighi and Or, 2013]
α
απαα α αα+
== × Γ + Π + >+ ( 1)
1 02.2 112 1( )( 1) (2 1) 02 1
f (4.5a)
α α α α αΠ + = + × − + × − + × × − +(2 1) (2 1) (2( 1) 1) (2( 2) 1) ... (2( ) 1)n (4.5b)
with α<n the largest integer smaller than α . According to Haghighi and Or [2013], the occurrence of larger eddies with longer residence times in a turbulent airflow regime increases by increasing α and the mean viscous sublayer thickness becomes thicker. Considering the importance of the eddy spectrum shape parameter α in determining the viscous sublayer thickness that, in turn, affects heat and mass exchange rates from the surface [Shahraeeni et al., 2012; Haghighi and Or, 2013], the study aims to reliably extract values of the eddy spectrum shape parameter α (a momentum field characteristic) from measurements of turbulence-induced surface temperature fluctuations (a remotely-sensed surrogate variable) induced by momentum field fluctuations. Addressing this first research objective requires a better understanding of the coupling between fluctuations in turbulence velocity (momentum) field and the resulting surface temperature dynamics.
The Reynolds’ analogy that implies a unique mechanism for the transport of momentum, heat, and mass suggests the dominance of a single characteristic time scale for transport across the viscous sublayer. It is the momentum time scale that governs the intermittent ejection events of surface interacting eddies back into the fully mixed region [Trinh, 1992] and thus defines the residence time for the viscous sublayer across which heat and mass exchanges are renewed simultaneously. Although penetration depths for momentum, heat and mass from the surface may differ due to differences in their respective diffusivities, for evaporation, these are of the same order (i.e., the Schmidt and Prandtl numbers are of the order of unity) lending support for a single characteristic time scale for transport across the viscous sublayer. We thus ignore minute differences in scalar diffusivities, and assume (for simplicity) that momentum, heat, and vapor diffusion rates rapidly attain steady

Chapter 4 57 state rates during the eddy’s sweeping motion over “smooth” surfaces [Brutsaert, 1975a, p. 545; Trinh, 1992; Haghighi and Or, 2013]. Hence thermal (δT ) and mass (δv ) boundary layers are assumed to become fully developed underneath an eddy’s footprint area (i.e., δ δ δ≈ ≈T v ). In subsequent analyses, we parameterize surface temperature variations induced by rapid perturbations of heat and mass transfer across the eddy-surface interface during the eddy residence time as defined by the turbulence regime.
4.2.2 An Instantaneous Surface Energy Balance Model
The strongly coupled and intermittent mass and energy exchange during evaporation from porous surfaces into turbulent airflows affects surface temperature dynamics. With the passage of an eddy, an instantaneous and local balance between latent heat and net supply of energy by radiation, convection, and conduction may form with the eddy. The net radiation nR (W/m2) is considered to be the main component of energy supply that is balanced by latent heat flux λE (W/m2) due to evaporation, sensible heat flux H (W/m2) from the surface, (vertical) conductive heat flux G (W/m2) resulting from temperature gradients in the porous medium, and by storage in the surface layer S (W/m2) altering its temperature with time [Penman, 1948; Monteith, 1981]. This can be expressed by the partitioning of the energy received by the surface layer ( −nR H ) between the evaporative flux (λE ), the conductive vertical heat flux (G ), and the heat storage in the substrate (S ). A one dimensional energy balance for a spatially homogeneous surface underneath the footprint of the i th renewal eddy is accordingly given as
λ− = + +n i iR H E G S (4.6)
where λ (J/kg) is the latent heat of vaporization, and
ω∂ ∂+ = − +
∂ ∂s vT TG S K cz t
(4.7)
in which sK (W/mK) is the thermal conductivity of a wet porous medium, ( , )T z t(K) represents spatio-temporal distribution of the temperature profile within the substrate (evaporation zone), ρ=v s pc c (J/m3K) is the volumetric heat capacity of the porous surface with ρs (kg/m3) the apparent density and
pc (J/kg K) the specific heat capacity of the wet surface on mass basis, and ω (m) is an effective “thermal thickness” (defined in Eq. (4.8) below).
The contribution of lateral conductive heat transport across the eddy perimeter is neglected for simplicity, as it would slightly expand the lateral extent of an eddy

58 Thermal signatures of turbulent airflows footprint. Moreover, the paths of rapid and repetitive sweep/ejection of eddies over the interacting surface would (statistically) cover the entire surface justifying the simplification of assuming no-flux boundary (∂ ∂ = 0T x ) along the eddy lateral boundaries (see Figure 4.1). We hence focus on the resulting vertical (1D) temperature fluctuations within the surface layer (below an eddy footprint) and associated changes in thermal storage and short-lived vertical heat flux within the porous medium (Eq. (4.7)).
The extent of 1D transient variations in subsurface temperature profile could be estimated to define an effective thermal thickness ω , that senses surface temperature fluctuations. We capitalize on the known time scale for eddy renewal, and invoke the notion of thermal damping depth originally derived for sinusoidal temperature fluctuations at the surface [Jury et al., 1991], yielding an estimate for the effective thermal thickness as:
ω τπ
= Ht
D (4.8)
where HD (m2/s) is the surface thermal diffusivity, and τ t (s) is the mean residence time of fluctuating “thermal signatures” (termed thermal eddy residence time marked by the index “t” to distinguish it from momentum residence times marked by the index “m”; see section 4.4.2.2). Eq. (4.8) reveals that the effective thermal thickness varies with changes in the wetness-dependent thermal diffusivity, and with the time scale of the thermal signatures. This approximation for the temporal effective thermal thickness (Eq. (4.8)) was evaluated numerically and found to be a reasonable approximation as shown in Appendix A.
The transient nature of heat (and mass) exchange at the surface and the relative importance of various transport processes could be characterized by the Biot (Bi ) and Fourier (Fo ) numbers defined as [Incropera et al., 2006]
=s
hLBiK
(4.9a)
=2HD t
FoL
(4.9b)
where δ= ah K (W/m2K) is the convective sensible heat transfer coefficient with
aK (W/mK) the thermal conductivity of air (see section 4.2.2.1), L (m) is the characteristic length scale through which thermal conduction occurs ( ω≈L ), and

Chapter 4 59 t (s) is the characteristic time for a temperature change to occur ( ≈mean residence time of turbulent momentum field eddies). For a practical range of parameters in the present study: = −20 30h W/mK, = 0.04sK W/mK and −= × 82.2 10HD m2/s for the cotton cloth used in the experiments, ω≈ = 0.1L mm (see section 4.3), and ≈ 0.1t s (see section 4.4), the Biot and Fourier numbers are of the order of 10-4 to 10-2, and 10-1 to 100, respectively.
The Biot number provides a measure of surface temperature drop relative to the temperature difference between the surface and the air, with 1Bi is indicative of a uniform temperature distribution within the surface layer during the transient process [Incropera et al., 2006; Grine et al., 2007]. This means that the resistance to heat conduction within the substrate is much smaller than the resistance to convection across the air boundary layer. The low values of Bi in our setup support the neglect of lateral conductive heat fluxes, and confirm the dominance of surface skin temperature ( sT ) as the main parameter that reflects rapid variations in surface energy balance. The Fourier number reflects the ratio of diffusive or conductive transport rates to changes in storage within the subsurface substrate, with values of 1Fo suggests that the vertical conductive heat transport is negligible relative to changes in thermal storage within the effective thermal thickness. Note that for the conditions of this study, the values of Fo are not far from unity (0.1 to 1.0) implying non-negligible contribution of vertical conductive heat transport in the subsurface layer, as it determines the effective thermal thickness.
The slightly nonlinear shape of the vertical temperature distribution below an evaporating surface could simply be linearized from the surface to the effective thermal thickness (i.e., ω∂ ∂ ≈ ∆T z T ) [81] such that one can assume a relatively constant vertical conductive heat flux within the surface layer over the eddy’s footprint. Thus, the instantaneous energy balance within the surface “skin” of known thermal thickness ω during renewal of turbulent eddies results in rapid variations in surface temperature sdT at a rate that is inversely proportional to the volumetric heat capacity and the effective thermal thickness, as
λω ω
−= − − −
1s s an s i i
vi
dT T TR K H E
dt c (4.10)
with sT and aT (K) surface and air temperatures, respectively. The quantification of surface temperature fluctuations defined in Eq. (4.10) requires parameterization of

60 Thermal signatures of turbulent airflows variables contributing to the surface energy balance. The net long-wave radiation is represented by the difference between blackbody radiation at the surface temperature ( sT ) and that at air temperature ( aT ) with the net radiation flux nR expressed as
( )σε= − Λ − −4 4(1 )n sw s aR R T T (4.11)
where swR (W/m2) is the incoming short-wave radiation, Λ (-) is the surface reflectivity or albedo, σ (W/m2K4) is the Stefan-Boltzmann constant ( −× 85.67 10 W/m2K4), and ε (-) is the surface emissivity.
4.2.2.1 The Sensible Heat Flux
The sensible heat exchange between the surface and the i th renewal eddy across the viscous sublayer, iH (W/m2), is formulated as the product of thermal conductivity and temperature gradient across the viscous sublayer
=
= −@ 0
i ai z
dTH Kdz
(4.12)
where aK (W/mK) is the thermal conductivity of air in the boundary layer (0.024 W/mK at 25oC). Evidence suggests that a linear temperature profile across a viscous sublayer of thickness 2 mm forms within a time scale of 0.2 s [Gaikovich, 2000]. We thus consider linear gradients of temperature and vapor concentration across this layer to form instantaneously, and Eq. (4.12) is then rewritten as
( )= −i i s aH h T T (4.13)
where δ=i a ih K (W/m2K) is the instantaneous convective sensible heat transfer coefficient assuming that temperature profile at the border of the viscous sublayer reaches ambient temperature (i.e., δ = aT T ) [Gaikovich, 2000].
4.2.2.2 Evaporation and Latent Heat Fluxes
Evaporation flux from a wet porous surface into the i th renewal eddy (across the local viscous sublayer), iE (kg/m2s), is formulated as a function of vapor concentration difference [Haghighi et al., 2013]
= −( )i i s aE k C C (4.14)
where sC and aC (kg/m3) are the vapor concentrations at the surface (assumed saturated) and in the well-mixed air at the top of the viscous sublayer, respectively,

Chapter 4 61 and ik (m/s) is the instantaneous mass transfer coefficient that includes surface resistance (due to surface wetness state) as derived by Haghighi et al. [2013]
δ θ=
+ P ( )ii surf
Dkf
(4.15)
where D (m2/s) is the vapor diffusion coefficient in air, P (m) is the equivalent 1D mean pore size ( π=P r ; with r (m) the pore radius) [Haghighi et al., 2013], and the surface wetness-dependent coefficient θ( )surff is obtained from [Schlünder, 1988; Haghighi et al., 2013]
πθθπ θ
= −
1( ) 14surf
surfsurf
f (4.16)
with θsurf (-) the surface water content.
The vapor concentration difference in Eq. (4.14) is a function of temperature and vapor pressure differences between the surface and the free air stream. Assuming that liquid vapor behaves as an ideal gas, one can express the concentration difference as
− = −
( ) ( )w sat s sat as a
s a
M P T P TC C RS
R T T (4.17)
where wM (kg/mol) is the molar mass of evaporating liquid, R (J/mol K) is the universal gas constant (8.314 J/mol K), satP (Pa) is the vapor pressure at the liquid surface assumed to be the saturation vapor pressure at the surface temperature, and RS (-) is the air relative vapor saturation (air relative humidity, RH (-), for water vapor). In this study, the saturation vapor pressure satP is computed using the Antoine equation as [Dean, 1999]
−+= ×( ) 133.32 10BA
C TsatP T (4.18)
where A , B , and C are the Antoine coefficients that vary among liquids (see Table 4.1 for the coefficients and their range of validity for substances discussed in this study). Note that for the empirical relations in Eq. (4.18) the temperature T is expressed in oC and not in K [Dean, 1999].

62 Thermal signatures of turbulent airflows Table 4.1: Coefficients of Antoine equation [Dean, 1999]
Substance A B C Range of validity
minT (oC) maxT (oC)
Water 8.07131 1730.63 233.426 1 100 Acetone 7.13270 1219.97 230.653 -64 70
4.2.3 Intermittent Surface Temperature Fluctuations
Combining Eqs. (4.11), (4.13), and (4.14) with Eq. (4.10), we obtain an ordinary differential equation (ODE) for the instantaneous variations in surface temperature underneath the i th eddy as
( )( )σε λω
= − Λ + − + − − −
4 41 (1 ) ( ) ( )ssw a s i a s i s a
vi
dTR T T T T k C C
dt c (4.19)
with ω= +i i sh K . To facilitate an analytical solution for the surface temperature sT , we linearize the long wave radiation and the latent heat terms. We expand sT around aT , and express −4 4
a sT T as −34 ( )a a sT T T , such that the resulting approximation is very good for the range of natural surface and air temperatures relevant to evaporation between 0 and 60oC (see Shahraeeni and Or [2011] for more details). We also linearize the saturation vapor concentration sC as a function of sT with an excellent accuracy (especially for an operational range of evaporating surface temperatures of 15oC to 25oC) as
= ≈ +( )
( ) ( )w sat s ws s s
s
M P T MC T aT b
R T R (4.20)
where a and b are the linearization constants (see Table 4.2).
Table 4.2: Physical properties and empirical coefficients
Substance λ (J/kg) pc (J/kg K)
D (m2/s) wM
(kg/mol)
ρ(kg/m3) ε (-)
Empirical Coeff. a
(Pa/K2) −b
(Pa/K)
Water × 32450 10 4180 −× 52.50 10 0.018 998 0.95 0.467 128.783
Acetone × 3518 10 2150 −× 51.24 10 0.058 327 0.95 3.465 931.191
The linearized form of Eq. (4.19) subsequently yields a first order ODE that could be solved analytically as
( )−= +2 1
, 4 3 2( ) c c ts iT t c e c c (4.21)
where

Chapter 4 63
ω
σε λ
σε λ
=
= + +
= − Λ + + + −
= −
1
32
43
34 0
2
4
(1 ) 4
v
wa i i
wsw a i a i a
c cM a
c T kR
M bc R T T k C
Rc
c Tc
(4.22)
with 0T (K) the initial surface temperature at the onset of a renewal event with a time scale of τ∆ = − =0 ,m it t t (see also Tables 4.1 and 4.2 for numerical values of the physical properties and empirical constants used in Eq. (4.22)). Note that the exponential form of the analytical solution in Eq. (4.21) conforms to other well-established solutions derived for transient heat exchange over a flat plate [Incropera et al., 2006; Grine et al., 2007]. Eqs. (4.21) and (4.22) reflect the instantaneous and fluctuating nature of surface temperature due to interactions with eddies having different characteristic residence times (τ ,m i ) and boundary layer thicknesses. The transfer coefficients for intermittent sensible ( ih ) and latent ( ik ) heat fluxes may also fluctuate due to their dependency on the instantaneous viscous sublayer thickness, which in turn, is a function of individual eddy residence time τ ,m i (see Eq. (4.1)).
Although Eq. (4.21) was derived for instantaneous surface temperature evolution during a single eddy renewal event, it may also be used to describe surface temperature evolution over longer periods. We use the surface renewal formalism and consider the cumulative thermal effect of a population of eddies with different residence times τ ,m i (drawn from a gamma distribution function) that intermittently interact with the surface in a sequence of sweep/eject events. The resulting gradual temporal evolution of surface temperature (with superimposed transient fluctuations) is computed for any elapsed time from the onset of the turbulent flow regime given as: τ
== ∑ ,1
Nm ii
t , with N the number of eddy replacements during the time elapsed (the result is similar to a surface subjected to periodic thermal transients considered by Glass and Özisik [1988]). We note that in this calculation the effective thermal damping depth ω (Eq. (4.8)) is approximated by the mean eddy residence time and not by the elapsed time t .
Additionally, the analytical solution presented in Eq. (4.21) enables estimation of the elapsed time for attaining an asymptotic value from the onset of a turbulence

64 Thermal signatures of turbulent airflows regime as
−= − −
1
2 0
ln s eqeq
eq
T Tct
c T T (4.23)
with = 3 2eqT c c (K) the equilibrium surface temperature, and = 0.99s eqT T . For the range of lab conditions studied with: = 0swR W/m2, = 293aT to 303 K,
∞ = 0.5U to 4 m/s, − =0 10eqT T K, = 35RS and 0% for water and acetone, respectively and considering eddies with mean properties (evaluating ih and ik by δ rather than δi ) interacting with a saturated cotton cloth ( = 0.03r mm, θ = 0.75surf , and ω ≈ 0.1 mm), the surface temperature would attain (near) steady-state value after 100 to 200 s for water, and within 15 to 40 s for acetone (after which the surface temperature would fluctuate about this steady value).
In summary, the theoretical coupling between turbulent momentum field and surface temperature variations (Eqs. (4.21) and (4.22)) combined with rapid (and highly resolved) IR surface temperature measurements offer a framework for characterization of surface-turbulence interactions (parameterized by the eddy residence time distribution and the shape parameter α ) and a potential method for surface-temperature-based estimation of surface evaporative fluxes. In the following, we present the experimental setup used to remotely quantify temperature dynamics for an evaporating surface exposed to prescribed turbulent airflow regimes.
4.3 Experimental Considerations
For evaluation of the theoretical framework, we conducted a series of evaporation experiments (total of 10 runs) under different turbulent airflow regimes with mean airflow velocities ranging from 0.5 to 2.0 m/s in a small wind tunnel ( ×L W×H :
× ×1.2 1.2 0.2 m; see Figure 4.2). The wind tunnel was equipped with four blowing fans with built-in straightener grids (TAR/L, LTG Inc., Germany) providing stable airflows over the evaporating surface ( ×4 1040 m3/h @ 1050 rpm). A schematic of the experimental setup is illustrated in Figure 4.2.
We selected a thin cotton cloth (0.2 mm thick) mounted tightly on a frame of size ×500 500 mm, and initially saturated with acetone to provide a thin surface with
a high rate of evaporation into ambient air from a surface with low thermal capacity (see Appendix B). As pointed out by Tiselj et al. [2001], Balick et al. [2003], and Hunt et al. [2003], the magnitude of surface temperature fluctuations depends on surface thermal capacity, thickness, and the relative strength of thermal response time for solid and fluid surfaces (see Appendix B). Hence, rapid and

Chapter 4 65 dynamically resolved thermal signatures are expected for thin evaporative surfaces with low effective heat capacity. Considering Eq. (4.8) and thermal diffusivity of cotton ( −≈ × 82.2 10HD m2/s), the effective thermal thickness of the surface for this experiment was simply estimated as ω ≈ 0.08 mm for a mean thermal residence time of 1 s. Some experiments involved multiple thicknesses (from 0.2 to 0.8 mm thick) were also carried out to examine the role of the effective thickness on the characteristics of surface thermal signatures. The derivation of ω (m) uses similar ingredients as the concept of thermal inertia in remote sensing [Price, 1977], but it also contains a length scale (effective thickness) for dynamic surface energy balance calculations.
Figure 4.2: Experimental setup used to study coherent thermal structures during surface drying: (1) infrared camera; (2) logger for single-point (and low frequency) measurement of ambient temperature ∞T , velocity ∞U , and relative humidity/vapor saturation in the middle of duct tunnel above the test surface; (3) wind production chamber; (4) blowing fans; (5) high-frequency 3D ultrasonic anemometer measuring velocity of an air layer ( aU ) of 50 mm thickness above the test surface; (6) balance; and (7) evaporating test surface: a × ×500 500 0.2 mm cotton cloth with pores of size
= 0.03r mm and a porosity of 75%.
1 m
0.2
m
1
2
3
4 5
6
7

66 Thermal signatures of turbulent airflows The temperature field at the surface was resolved using an IR imager sampling at 52 Hz. We have used an IR thermal camera (FLIR SC6000, FLIR Systems, MA, USA) with a noise equivalent temperature difference (NETD) of 35 mK @ 30oC. The IR imager is equipped with a quantum well infrared photon detector (QWIP) capable of recording infrared radiation in a narrow range of wavelength of 8.0 to 9.2 micron, at high resolution ( ×512 640 pixels). The integration time of the detector is 10 ms and it is equipped with a linear Stirling cooler. The thermal images were converted to the surface temperature sT assuming a constant surface emissivity of ε = 0.95 [Mira et al., 2007]. The acquired images are transferred to a dedicated PC with ThermaCAM Researcher software (FLIR Systems, MA, USA) for subsequent analyses.
Details of the velocity of an air layer of 50 mm thickness adjacent to the surface (
aU ) was recorded at the edge of the evaporating surface using a 3D ultrasonic anemometer with 0.01 m/s accuracy (WindMaster, Gill Instruments Ltd., The Netherland) acquiring measurements at 32 Hz. The mean air velocity ( ∞U ) was measured at a distance of 100 mm above the test surface (in the middle of the duct tunnel) using a hot-wire anemometer (P600, Dostmann Electronic, Germany), and recorded by a data logger (21X, Campbell Scientific Inc., UT, USA). The temperature and relative humidity of the ambient were also monitored at the same location using a temperature and humidity transmitter (HMT337, Vaisala HUMICAP®, Finland). Evaporative mass loss from the surface was measured using electronic balances with ±0.01 g repeatability and ±0.02 g linearity (ED3202S, Sartorius, Germany).
4.4 Results and Discussion
We first investigated similarities between the momentum and thermal fluctuation fields using spectral analyses [Stoica and Moses, 2004] that enable direct estimates of the extent of coupling between these two processes. Experimental results for acetone evaporation from the thin cotton surface yielded a wide range of highly resolved surface temperature fluctuations (discussed in Appendix B). The characteristics of the surface interacting momentum turbulent field were then deduced from spatio-temporal IRT measurements, and potential applications of such thermal inferences for remote estimation of surface evaporative fluxes were explored.

Chapter 4 67 4.4.1 Surface Temperature and Turbulent Air Velocity
Fluctuations
IRT images and concurrent sonic anemometer airflow measurements were sampled at 52 and 32 Hz, respectively. For illustrative purposes, we present results from an experiment (one out of 10 different runs) in Figures 4.3a to 4.3c. The results demonstrate the highly dynamic evaporative processes into turbulent airflow and associated surface temperature depression (Figures 4.3a and 4.3b). The fluctuations superimposed onto a mean trend of ( )aU t and ( , , )sT x y t are attributed to eddy motions contributing to both ′
aU and ′sT , where a prime denotes fluctuations about
the temporal and tempo-spatial average, respectively. We note that the dashed line shown in Figure 4.3b is obtained from Eq. (4.21) for an effective mean turbulent airflow property under the same experimental conditions. The agreement between the model prediction and the experimental data inspires confidence in the proposed coupling approach.
Figure 4.3: Typical time series of (a) velocity of an air layer ( aU ) of 50 mm thickness above the test surface measured by the 3D ultrasonic anemometer (along the centerline), (b) surface temperature obtained from an arbitrary single-point at the centerline, and (c) acetone mass loss (per area) during drying of a
× ×500 500 0.2 mm saturated cotton cloth (θ ≈ 0.75surf and = 0.03r mm) which was exposed to a drying airflow with ∞ = ±1 0.25U m/s and ∞ = 298T K (measured at the center of the wind tunnel).
We further note that the “deterministic” surface temperature depression (without

68 Thermal signatures of turbulent airflows instantaneous fluctuations) predicted by the model (Figure 4.3b) is consistent with surface temperature adjustment following exposure to mean turbulent flow. Replacing turbulent momentum field with “effective” mean properties ( ih and ik are evaluated by the effective viscous sublayer thickness δ , rather than δi ), enables the use of Eq. (4.21) for parameterizing effective surface temperature evolution. Note that here the effective (mean) thermal thickness ω would simply be estimated from mean thermal eddy residence time τ t (rather than the elapsed time t ), and thus is assumed constant for a stable mean evaporation flux and accordingly does not affect this alternative approach as t goes to infinity.
To study the relationship between momentum fluctuations in turbulent air velocity and surface temperature, we computed the power spectral densities for the fluctuations in ′
aU and ′sT using the fast Fourier transform [Stoica and Moses, 2004]
depicted in Figures 4.4a and 4.4b, respectively. The results (averaged over 10 runs) describe the distribution of the power of a signal (or time series) across different spatial frequencies (wavenumbers). The one-dimensional wavenumber is computed using Taylor’s [1938] hypothesis and the velocity measurements. Katul et al. [1998] have argued that eddy motions responsible for surface temperature fluctuations may be decomposed into an active component inducing shear at the surface and an inactive component which is produced by turbulence in the outer region away from the surface. These two contributions are characterized by power spectra with -1 and -5/3 power laws for the inactive and shear-inducing eddy motions, respectively [Katul et al., 1998]. Evidence of these contributions are shown in Figure 4.4a for the
′aU spectrum; whereas in Figure 4.4b only the -5/3 power law appears to be
reflected in the spectrum of ′sT . These results are similar to Katul et al.’s [1998]
findings, where ′sT spectra follow -5/3 power law for the entire range of
wavenumbers (Figure 4.4b).
The results in Figure 4.4a where large-scale fluctuations (small wavenumbers) in the ′aU spectrum follow -1 power law (attributed to inactive eddy motions), yet,
thermally, this class of eddies are expected to exert stronger influence on the thermal signatures through shear affecting the viscous sublayer near the surface (hence inducing -5/3 power law for thermal fluctuations). Thus, the similarity between the two spectra in the inertial range (wavenumbers larger than 10 1/m) supports the proposed approach that considers eddies contributing to heat and mass exchange from the surface through their impact on the viscous sublayer thickness. We also performed a more complete wavelet spectral analysis to investigate similarities between the two signals in space and time with the results presented in

Chapter 4 69 Appendix C.
Figure 4.4: Power spectral density for (a) air velocity fluctuations ′aU (measured at a frequency of 32 Hz) and (b) surface temperature fluctuations ′sT (52 Hz) for all 10 runs of the acetone evaporation test. The -5/3 and -1 power laws are also shown.
Such inherent coupling between airflow turbulence characteristics and surface temperature fluctuations offers opportunities for using a resolved thermal regime to estimate (invert for) the momentum field fluctuations (turbulent structures), as discussed next.
4.4.2 Surface-Temperature-based Characterization of Turbulent Airflows
4.4.2.1 Thermal Manifestation of Eddy Renewal Events
We capitalized on the spatio-temporal IRT information to make inferences on eddy-surface interactions (renewal events). A sequence of spatially-resolved snapshots of
′( , )sT x y (the mean value was spatially averaged over the instantaneous image) during the thin cotton surface drying is shown in Figure 4.5 demonstrating spatio-temporal evolution of thermal fluctuations over a footprint of size ×200 200 mm in the center of the ×500 500 mm test surface (to avoid edge effects).

70 Thermal signatures of turbulent airflows
Figure 4.5: Snapshots of surface temperature fluctuations (averaged spatially over the footprint) ′sT (K) at t∆ = (a) 0, (b) 5, (c) 10, and (d) 15 s measured at 52 Hz during the acetone evaporation (wind direction is from top to bottom). The sequence of the snapshots reveals spatio-temporal evolution of thermal fluctuations over the footprint. Considering the thermal field within the solid white box, an initially positive ′sT can be attributed to a sweep event, when a population of fast moving air parcels (eddies) comes in contact with the surface. Shortly thereafter, several small cold spots appear; these grow, combine, and move in the wind direction initiating an ejection event (b). As the population of eddies rises from the surface (renewed by another family of eddies), the surface begins to warm again and the cycle repeats (c and d). A similar sequence of events (sequential hot and cold thermal signatures) can be realized from the dashed white box but with a phase difference.
We note that a time stamp of ∆ = 5t s was used to visualize “macroscopic” fluctuations (including a population of small-scale fluctuations; see Figure 4.3a) whose thermal spatial distribution can be more easily captured and detected over a

Chapter 4 71 relatively large footprint. The IR images show that air parcels with different characteristics in contact with the surface induce different surface temperature patterns. An initially positive ′
sT (within the solid white box) can be attributed to a sweep event by a fast and warm air parcel (relative to surface temperature). Shortly thereafter, several small cold spots appear due to evaporative cooling; these then grow, merge, and move along the airflow direction culminating in an ejection event. As an eddy rises from the surface (renewed by another eddy) the surface may warm again and the cycle is repeated. The same story (sequential hot and cold thermal signatures) is realized from the dashed white box, however, with a phase difference.
Figure 4.6: (a) Dashed line through the image oriented in the streamwise direction indicates centerline of the drying surface, (b) Temporal evolution of ′sT recorded (at 52 Hz) during acetone evaporation along the centerline for the whole period of the drying process, and (c) for a few seconds after the onset of drying (marked by the red rectangle in (b)). The white squares shown in (a) indicate data sampling locations analyzed in Figure 4.8.

72 Thermal signatures of turbulent airflows To further illustrate the spatio-temporal evolution of structures related to the momentum field through their thermal imprints over the surface, we draw a streamwise line through the center of the image (the dashed line in Figure 4.6a) and plot the time evolution of ′
sT along this line for the entire drying process (Figure 4.6b). We then zoom-in on to examine a narrow window of a few seconds (3 to 4 s) from the onset of drying (Figure 4.6c). The results clearly illustrate the advective nature of thermal signatures with thermal structures lasting a few seconds as seen from the downward slope of the hot and cold stripes of ′
sT in Figure 4.6c. The estimated horizontal velocity from the slope of the stripes is 1.5 m/s, close to the directly measured mean wind velocity in the middle of the duct tunnel that advects large-scale structures along the surface.
Next, we evaluate how surface thermal signatures could be used to characterize the turbulent momentum field (parameterized by the eddy spectrum shape parameter α ) and yield estimates for mean evaporation flux from the surface.
4.4.2.2 Thermally-deduced Eddy Residence Time Distribution
As discussed in section 4.2.1 above, the quantification of the viscous sublayer thickness (and evaporative fluxes) requires prescribing the shape parameter of the eddy residence time distribution (α ) that is parametrically expressed by the gamma statistical distribution [Danckwerts, 1951; Seo and Lee; 1988]. Prominent in Eq. (4.2) are the shape α and rate β parameters that control the shape of the distribution. Considering a constant shape parameter α , the distribution may shift towards larger residence times (low frequency) by decreasing the rate parameter β (i.e., the mean residence time τ in Eq. (4.2b) increases). Thus, different distributions characterized by a similar shape parameter α can be distinguished through differences in the rate parameter β affected by surface thermal properties deduced from IRT measurements.
Invoking the analytical description of surface temperature variations defined in Eq. (4.21), we express the residence time of “thermal signatures” of eddies (the index “t” marks thermal residence times, distinguished from momentum residence times marked by the index “m”) as a function of surface thermal properties, as
ωτ
∆ = − − ∆
,2 max
ln 1 sv it i
Tcc T
(4.24)
in which ∆ = −max 0eqT T T is the maximum temperature variation achievable on the

Chapter 4 73 top surface due to maximum elapsed time of N eddy replacement with = 3 2eqT c c the equilibrium surface temperature. Figure 4.7 shows typical parameters used in Eq. (4.24) which can be extracted from given surface temperature time series.
For prescribed airflow conditions (i.e., 2c and ∆ maxT are given), Eq. (4.24) shows that the thermal residence time of an eddy, that results in a well-defined temperature depression ∆ sT , is directly proportional to surface volumetric heat capacity and effective thermal thickness. This implies that typical thermal properties of natural surfaces are likely to dampen observable thermal signatures and filter out rapid perturbations (as discussed in section 4.3.2 and Appendix B). On the other hand, such proportionality between thermally-deduced eddy residence time (i.e., from thermal response time of the surface) and surface properties could be exploited as it imparts no effects on the momentum dominated shape parameter α , and only eddies with sufficiently long mean residence time will imprint their effect on “surface thermal fluctuations”. This predictable shift could be of great importance for field-scale applications where evaporation takes place from surfaces with relatively large effective heat capacity (and thermal inertia).
Figure 4.7: Typical surface thermal information (Eq. (24)) extracted from a given surface temperature time series.
4.4.2.2.1 Extracting α and β Parameters from Surface Temperature Fluctuations
As shown theoretically, surface temperature fluctuations provide a means for

74 Thermal signatures of turbulent airflows characterizing the surface interacting momentum field intermittency (renewal eddies) through the corresponding gamma density function parameters (α and β ). The eddy residence time distributions depicted in Figure 4.8 were deduced from direct air velocity measurements and from IR imagery (symbols) shown in Figures 4.3a and 4.3b, respectively. The eddy residence time distributions were obtained from the time difference between two consecutive peak and valley points in the wind velocity and surface temperature time series (see Figure 4.7), as described in Seo and Lee [1988] and Watanabe and Mori [2008]. In practice, there is a lower threshold for the time difference between consecutive peaks and valleys longer than the measurement’s “sampling time” (1/Hz), otherwise, these are considered as noise and filtered out, accordingly. Note that time differences belonging to a surface temperature difference of smaller than the IR camera’s NETD are also treated as noise and filtered.
The fitted gamma density functions to the experimental data (lines) support the potential for using thermal fluctuations to deduce the turbulent airflow characteristics (typically measured by 3D anemometers). The time distribution spectra of both the momentum- and surface-temperature fluctuations share the same shape parameter 2α = , which is also in agreement with the previously reported experimental values in the range of 0α = to 2 [Haghighi and Or, 2013]. Consequently, this unique shape parameter for ′
sT and ′aU enables quantification of
an effective viscous sublayer thickness (linked to the momentum field characteristic) from rapid thermal measurements (see Eqs. (4.1) to (4.4)). An interesting feature of this experiment was the ability to better resolve the dynamics of thermal fluctuations due to the higher sampling frequency of the IR camera (52 Hz for IR imagery relative to 32 Hz by the sonic anemometer), while in typical terrestrial applications we expect the reverse to apply (due to higher thermal capacity of terrestrial surfaces relative to the thin evaporative surface used in this exploratory study).
The robustness of the newly proposed surface-temperature-based approach was further evaluated by monitoring wind velocity at different heights above the surface using the 3D sonic anemometer. The results depicted in Figure 4.8 reveal systematic variations in the turbulent regimes (parameterized by α ) with measurement height such that the turbulent flow gradually becomes dominated by larger eddies (with longer residence time) with increasing the measurement height (z ). We note that z indicates the height of the bottom of the 3D sonic anemometer and the measurements volume contains an air layer of 150 mm thickness (the gap between

Chapter 4 75 sonic transducers). Such systematic variations in the eddy spectrum parameter with height are indicative of variations in the nature of the flow field from shear flow near the surface to free shear flow away from the surface [Pope, 2000; Haghighi and Or, 2013]. These nuanced variations may not be captured by classical flux gradient methods limiting the quantification of mean viscous sublayer thickness using Eq. (4.3). Additionally, air velocity measurements recorded by the sonic anemometer even at the surface may contain fluctuations at scales comparable with the sensor’s physical dimensions (i.e., a 150 mm gap between sonic transducers relative to a viscous sublayer thickness of a few millimeters). This inherent measurement bias may shift the measured eddy residence time distribution towards lower frequencies or longer eddy residence times (with larger α ) [92] than the population of surface-interacting eddies that suggests a potential advantage of inferences made at the surface where renewal eddies “directly” leave their imprints.
Figure 4.8: Comparison of eddy residence time distributions deduced from air velocity (3D sonic anemometer, 32 Hz) and temperature (IR imager, 52 Hz) fluctuations measurements during acetone evaporation. Wind data were measured at different heights above the surface ( z indicates the height of the bottom of the sonic anemometer) revealing variations in turbulent structures (parameterized by α
) with the measurement height. The error bars shown over the temperature-based data represent confidence interval (standard deviation) of the data taken from five different locations at the centerline (white squares shown in Figure 4.6a).
The results in Figure 4.8 demonstrate that surface temperature fluctuations spectra

76 Thermal signatures of turbulent airflows are consistent over the surface and independent of any particular sampling location. The distributions of thermal fluctuations obtained from five different positions along the centerline (white squares in Figure 4.6a) collapse into a unique eddy residence time spectrum (the standard deviations are shown by the error bars in Figure 4.8). The spatially-consistent results are of practical importance suggesting the possibility of replacing costly IRT by low cost and simpler single-point IR measurements (with a spatial resolution of larger than the representative elementary area of the surface) useful for widespread field and industrial applications.
4.4.2.2.2 Effects of Surface Thermal Properties
The magnitude of temperature fluctuations over typical natural surfaces will be dampened by their relatively high surface heat capacity vc , and their large effective thermal thickness ω (see Appendix B). Eq. (4.24) shows that thermally-deduced eddy residence time is proportional to surface thermal properties. Hence, while the shape of the eddy residence time distribution characterized by the shape parameter α may be constant, the rate parameter β is expected to vary with the mean response time of measured thermal signatures due to surface thermal properties.
Figure 4.9: Variation of surface-temperature-based eddy residence time distribution with surface thickness measured during acetone evaporation.
The experimental results depicted in Figure 4.9 illustrate how thermally-deduced eddy residence time distribution varies with effective surface thermal thickness for acetone evaporation from a cotton cloth of different thicknesses. These experimental
ω

Chapter 4 77 results confirm (1) the independence of the shape parameter α from surface thermal properties, and (2) the sensitivity of the rate parameter β to surface thermal properties. Hence, information gleaned from surface temperature fluctuations provide direct links between the rate parameter β and surface wetness through effects on surface effective thermal thickness and heat capacity (Eq. (4.24)). This link is of potential importance for various remote sensing of hydrological and meteorological near surface processes that will be explored in future studies.
4.4.3 Turbulent Evaporative Fluxes Quantified by Surface Thermal Fluctuations
A potential application of thermally-deduced eddy residence time distributions discussed in the previous subsection is the estimation of average heat and mass fluxes induced by eddy-surface interactions. These exchange processes are dominated by the viscous sublayer thickness, shown to be a function of the eddy spectrum shape parameter α (Eqs. (4.3) to (4.5)). Substituting α obtained from surface temperature measurements discussed in the previous subsection into Eqs. (4.4) and (4.5) yields the effective (mean) viscous sublayer thickness defined in Eq. (4.3). This, in turn, enables estimation of mean evaporation flux from drying surfaces by substituting the mean mass transfer coefficient k (m/s) evaluated by δ into Eq. (4.14) as (see Haghighi and Or [2013] for detailed discussions)
δ θ= −
+( )
P ( ) s asurf
DE C Cf
(4.25)
where all terms have been defined previously.
4.4.3.1 Acetone Evaporation from the Thin Cotton Cloth
Evaluating Eq. (4.25) by airflow and surface properties given in Figure 4.3 and the thermally-deduced eddy spectrum shape parameter obtained in Figure 4.8 ( 2α = ), the mean evaporation flux is estimated as =theory 0.0011E kg/m2s, a value in good agreement with the flux determined by direct measurement of mass loss,
=experiment 0.0013E kg/m2s (see Figure 4.3c). Figure 4.10 depicts a comparison between model predictions (using the surface-temperature-based α ) and experimental results obtained under similar conditions as described in Figure 4.3 for a range of mean air velocities (as marked).

78 Thermal signatures of turbulent airflows
Figure 4.10: Comparison between model estimations using the thermally-deduced eddy spectrum parameter 2α = (used for calculation of the viscous sublayer thickness varying from 4 to 1.5 mm while air velocity changes from 0.5 to 2 m/s) and experimental data. The square symbol corresponds to the sample measurements shown in Figure 4.3 and the solid line represents 1:1 line.
The agreement between model predictions and measured fluxes lends support to the proposed surface-temperature-based estimates of parameters that control the viscous sublayer thickness (Eqs. (4.3) to (4.5)). More detailed discussion of the sensitivity of estimated evaporative fluxes to the eddy shape parameter α that affects the viscous sublayer thickness is provided in Haghighi and Or [2013].
4.4.3.2 Plant Leaves and Canopy Interactions
Plant leaves represent natural evaporating surfaces with inherently thin thermal thickness (and low thermal inertia). Studies by Paw U et al. [1992], Braaten et al. [1993], and Snyder et al. [1996] have explored the behavior of coherent turbulent structures within plant canopies that periodically sweep through the canopy (SR events). Extracted from high-frequency air temperature measurements above canopies, characteristics of these coherent structures were subsequently used by many investigators [Paw U et al., 1995; Spano et al., 2000; Drexler et al., 2004; Castellvi and Snyder, 2009] to estimate surface sensible and latent heat fluxes using the SR formalism.
The link between turbulence and canopy temperature perturbations (observable by IRT [Costa et al., 2013]) could be used to characterize turbulent coherent structures

Chapter 4 79 that contribute to surface fluxes [Raupach et al., 1996; Katul et al., 1998]. Invoking a similar line of reasoning, we hypothesize that the use of surface thermal information proposed in this study could be used to quantify turbulence-induced heat and mass exchange from assemblies of leaf surfaces. We note that concurrent stomatal thermal regulation via transpiration cooling may mediate turbulence induced variations in leaf temperatures [Jones, 1992; Chaves et al., 2003; Schymanski et al., 2013], however, such adjustments occur at longer time scales (102 to 103 seconds [Vico et al., 2011; Schymanski et al., 2013]) relative to characteristic turbulent residence times (a few seconds) and are neglected here.
Detailed surface IR images are not required for inferences of turbulent interactions (see subsection 4.4.2.2.1), and a single-point rapid thermal measurement over an evaporating surface (or canopy) suffices for extraction of surface-temperature-based eddy residence time distributions. We re-analyzed such (rapid) single-point IR-measured surface temperature and air velocity fluctuations over a grass-covered surface reported by Katul et al. [1998] as depicted in Figure 4.11a. The results in Figure 4.11b represent the eddy residence time distributions obtained from direct air velocity fluctuations and indirectly from the surface-temperature-based approach. As for the laboratory-scale results depicted in Figure 4.8, the results in Figure 4.11b confirm the similarity between the distributions obtained by velocity and thermal measurements, both yield a unique eddy spectrum shape parameter α for the ′
aU and ′sT distributions. For the data of Katul et al. [1998], the surface
temperature and wind velocity fluctuations were both recorded at the same sampling frequency (5 Hz), hence information concerning faster thermal fluctuations was not captured due to the surface thermal inertia. Regardless, the thermal properties of the surface were not expected to affect the shape parameter α (see subsection 4.4.2.2). A potential application of the proposed approach would be the estimation of evaporative fluxes from canopies using Eq. (4.25) based on rapid thermal measurements. Successful determination of such fluxes would require supplemental information such as mean stomatal size and density.

80 Thermal signatures of turbulent airflows
Figure 4.11: (a) Air velocity and surface temperature data reproduced from Katul et al. [30] which were recorded over a grass-covered field (small thermal inertia); (b) Comparison of eddy residence time distribution deduced from air velocity and temperature fluctuations shown in (a).
4.5 Summary and Conclusions
The study develops a theoretical framework for linking rapid thermal fluctuations from an evaporating surface with characteristics of turbulent airflows interacting with the surface. The intermittent regime associated with turbulent eddy-surface interactions gives rise to structured temperature fluctuations; these are linked via surface renewal formalism and parametrically by the gamma distribution parameters. We extended a recently proposed model of Haghighi and Or [2013] for turbulent exchange from evaporating surfaces to explicitly consider instantaneous and local variations in surface energy balance induced by evaporative cooling beneath eddy footprints.
Results of acetone evaporation from thin cotton cloths confirmed that the temperature-based eddy spectrum shape parameter α was constant for momentum and surface thermal fluctuations and values were consistent with previously-reported (momentum-based) measurements of Haghighi and Or [2013]. Surface thermal information offers direct access to surface-turbulence interactions where exchange processes take place (instead of measured at some heights above the surface). The results also showed that the inferred statistical properties of surface thermal fluctuations (and turbulence) are independent of the measured location over homogeneously wet surfaces such that a single-point measurement over the surface could provide necessary information for deducing the shape and rate parameters, and facilitate estimates of surface evaporation. This, in turn, makes the

Chapter 4 81 proposed approach a good candidate for (large-scale) hydrological applications potentially complementing momentum-based approaches.
As a preliminary test of the approach for practical field applications, the model was evaluated using reported values of thermal fluctuations from short grass leaves (surfaces with relatively low thermal inertia) to deduce characteristics of the turbulent airflow (that was measured and reported independently). The agreement between surface-temperature- and momentum-based eddy residence time distributions obtained thermally (from a point measurement) and by direct wind speed measurements, respectively, inspires confidence in the utility of the method. We also discussed how such thermally-deduced eddy residence time distributions could be used to quantify evaporative fluxes from thin porous surfaces (including plant leaves).
Additional tests would be required to evaluate model applicability for more general scenarios of evaporation from natural surfaces; nevertheless, the study provides new insights on the role of airflow turbulence in surface-turbulence interactions (irrespective of momentum field measurements) at this critical interface where most of the exchange processes originate. We envision that the approach could potentially provide a building block for upscaling to field- and landscape-scale applications with relatively high thermal inertia (e.g., water evaporation from bare soil surfaces) through further evaluations of likely effects of surface hydro-thermal properties (water content, volumetric heat capacity, and effective thermal thickness) on the attenuation of surface temperature fluctuations. Although the primary focus of the study was on turbulence interactions with an evaporating porous surface, the analysis could be extended easily to infer sensible heat flux exchanges over dry surfaces using similar thermal fluctuation concepts.
Appendix A: Evaluation of the Analytical Approximation for the Effective Thermal Thickness
To evaluate the performance of the analytical approximation for the effective thermal thickness defined in Eq. (4.8); temperature distribution (2D unsteady heat condition) beneath an evaporating saturated soil column (θ = 0.38surf and
−= × 74 10HD m2/s) during momentum eddy residence times was resolved numerically using an explicit finite difference method. The governing equation used is a 2D unsteady Laplace equation for heat conduction below the evaporating surface as

82 Thermal signatures of turbulent airflows
∂ ∂ ∂= +
∂ ∂ ∂
2 2
2 2HT T TDt x z
(A.1)
with initial and boundary conditions as
∞
∞
=
= =
= =
→ −∞ =
∂ ∂ =0and1mm
( 0)( 0)( )
0
s
x
T t TT z TT z TT x
(A.2)
A schematic of the evaporating soil column and solution domain along with the initial and boundary conditions are shown in Figure A.1. We note that even grid spacing of ∆ = ∆ = 0.02x z mm in x- and z-directions was used and that the time interval was determined by ∆ = ×0.5 CFLt (with = ∆ 2CFL 4 Hz D the Courant-Friedrichs-Lewy condition) to ensure stability of the numerical solution.
Figure A.1: Schematic of an evaporating (saturated) soil column below an eddy footprint (dimensions are not to scale). Solution domain along with initial and boundary conditions used for numerical solution of the temperature field beneath the surface are presented.
Considering measured surface temperature time series for a saturated soil sample (not reported here) as the top boundary condition ( = sT T ) during momentum-based eddy residence time of individual eddies extracted from wind velocity measurements τm (Figure A.2a), Figure A.2b illustrates a numerically resolved
sT x
z
50 m
m
1 mm
∂T/∂
x=0
∞T
Solu
tion
dom
ain
∂T/∂
x=0

Chapter 4 83 temperature profile along the saturated soil column and its variation with momentum-based eddy residence times (τm ) drawn from the spectrum shown in Figure A.2a.
Figure A.2: Comparison of the analytical approximation for the effective thermal thickness (Eq. (8)) with numerical simulations under saturated condition (θ = 0.38surf and −= × 74 10HD m2/s): (a) probability density of momentum and thermal eddy residence times extracted from measured wind velocity and surface temperature time series, (b) temperature profile beneath the top soil obtained from numerical simulations for different eddies charcaterized by τm (the red profile indicates the result belonging to the eddy with mean properties), and (c) comparison between numerical estimates of the thermal thickness (blue circles) obtained from (b) with the analytical approximation (solid red line) which is evaluated by τt obtained from (a).
The 2D temperature field shown in the inset was obtained for an eddy with mean properties (τ τ= m ) and a corresponding 1D profile is indicated by the thick red line. The numerical results show variation of the thermal thickness (the depth at
𝜔𝜔

84 Thermal signatures of turbulent airflows which the effects of the temperature variation induced at the surface is dampened and the temperature profile below the surface reaches its initial status) with the eddy residence time whose mean value tends to a depth of 1 mm below the surface for the whole spectrum of eddies interacting with the saturated surface.
Comparing the numerically obtained thermal thicknesses with the analytical approximation obtained from Eq. (4.8), which is evaluated by the mean thermal eddy residence time τ t (Figure A.2a), Figure A.2c reveals that there is a fair agreement between the two approaches suggesting confidence in the analytical approximation used in this study. We note that surface thermal fluctuations contain a more integrated measure of the energy partitioning interactions as they implicitly consider changes in energy partitioning between latent, sensible, and conductive soil heat fluxes during eddy residence times; these in turn are reflected in the resulting τ t and then in the estimated effective thermal thickness. For all practical purposes the estimated ω based on the value of τ t is of the same order as the one that would have been obtained from the complete solution of the energy balance over the same surface.
Appendix B: Detection Limits for Infrared Thermography of Evaporating Surfaces B.1 Temperature Resolution
The use of IRT measurements for the proposed inferences hinges on the presence of surface temperature fluctuation amplitudes, ∆ = − 0s sT T T , larger than the temperature resolution of the IRT device, ∆ IRT . The temperature resolution of an IR camera is specified by the so-called noise-equivalent temperature difference (NETD) for a blackbody, ∆ 0IRT . Since the noise intensity is independent of surface emissivity [Nakamura, 2009], the values of the noise amplitudes for a blackbody and a non-blackbody emissivity are similar yielding the following relation (invoking the binomial theorem and assuming ∆ 0s IRT T and ∆s IRT T ) [Nakamura, 2009]
ε∆
∆ = 0IRIR
TT (B.1)
Eq. (B.1) indicates that the temperature resolution for a non-blackbody is proportional to the reciprocal of the surface emissivity (ε ).
Using Eq. (4.21), we define a dimensionless temperature variation (surface time constant to response to an induced temperature depression) during the residence time of a single eddy of average properties as

Chapter 4 85
( )τ−∆∆ = = −
∆2 1=
max
1 mc css
TT e
T (B.2)
where ∆ = −max 0eqT T T is the maximum temperature variation achievable on the top surface due to maximum elapsed time of N eddy replacement and τ ≈ 2
=112m av u is the (momentum-based) eddy mean residence time [Haghighi and Or, 2013].
Figure B.1: Theoretical analysis of temperature resolution detectable using IR measures under prescribed conditions: (a) Variation of the dimensionless surface temperature fluctuations, ∆ =T , with surface thermal properties (effective thermal thickness and volumetric heat capacity) over water and acetone surfaces exposed to a prescribed airflow condition ( = 0.0sR W/m2; = 298aT K; = 2aU m/s; and
= 35RS and 0% for water and acetone, respectively); (b) Variation of surface temperature depression over a thin layer of water and acetone (with a damping depth of ω = 0.08 mm) exposed to various mean wind velocities and air temperatures, under prescribed conditions ( = 0.0sR W/m2; = 293oT ; and = 35RS and 0% for water and acetone, respectively).
Eq. (B.2) contains a time constant that characterizes the surface response to temperature depression induced by a renewal eddy during its residence time. For known airflow conditions (with constant ∆ maxT ), a cursory inspection of Eqs. (B.2) and (4.21) reveals that the amplitude of surface temperature fluctuations is enhanced by decreasing the volumetric heat capacity vc and the surface effective thermal thickness ω (Figure B.1a). The comparison depicted in Figure B.1a reveals that the attenuation of thermal fluctuations decreases with increasing vc and ω , hence thermal fluctuations of natural surfaces would require the use of sensitive IR

86 Thermal signatures of turbulent airflows imagers. In addition to surface thermal properties, airflow properties such as air temperature and air velocity also contribute to the surface temperature fluctuations ∆ sT , through effects on both ∆ maxT and ∆ =
sT .
For standard laboratory conditions (e.g., = 0swR W/m2, =0 293T K, and = 35RS and 0% for water and acetone, respectively), Figure B.1b represents the
expected variations of ∆ sT over a thin layer of liquid saturated cotton cloth (ω = 0.08mm) exposed to various mean wind velocities and air temperatures. The results clearly show that thermal fluctuations are enhanced by diminishing the air velocity (increasing eddy residence times); however, the effect of the air temperature is also a function of the surface initial temperature 0T (especially for water). Even though the evaporating surface temperature may increase under certain circumstances (such as evaporation into very hot airflows), generally, evaporation results in a surface temperature depression (evaporative cooling, marked by ∆ < 0sT ) due to phase change from liquid to vapor [Shahraeeni and Or, 2010b; Aminzadeh and Or, 2013]. Thus, for many natural conditions, where the surface temperature decreases by evaporation, the amplitude of surface thermal fluctuations may decrease with increasing the air temperature (counteracting the evaporative cooling) as shown in Figure B.1b. Figure B.1b also reveals that temperature fluctuations are considerably enhanced for evaporating surfaces saturated with acetone whose large vapor pressure gradient is less dependent on the air temperature.
In summary, based on the analyses in Figures B.1a and B.1b, acetone appears to offer certain advantages as the evaporation liquid especially in the context of accentuating surface thermal fluctuations (practically independent of air temperature). Furthermore, our experimental setup was equipped with a high sensitivity IR camera with a specified ∆ =0 20IRT to 30 mK that could resolve temperature fluctuations over thin surfaces under commonly experienced range of air velocities (1 to 5 m/s) and air temperatures (273 to 323 K).
B.2 Upper Limit of Thermal Fluctuations Frequency
We may consider the maximum frequency of eddy-induced thermal fluctuations with respect to limits of detectability. Based on Eq. (4.21) this could be expressed simply as ∆ = ∆s IRT T (the upper limit of detectability) that corresponds to a critical thermal fluctuations frequency, maxf (1/s). The value of maxf can be determined as a function of ∆ IRT (the minimum resolvable temperature fluctuation) for known thermo-physical properties of the surface and the air

Chapter 4 87
= − ∆
− ∆
2max
1
max
1
ln 1 IR
cf
c TT
(B.3)
For given airflow conditions, Eq. (B.3) suggests that the maximum resolvable frequency by an IR camera (with a specified ∆ 0IRT ) increases with decreasing the surface effective thermal thickness and with decreasing the volumetric heat capacity (Figure B.2a). The results shown in Figure B.2a reveal that the phase delay of surface temperature fluctuations decreases with decreasing the volumetric heat capacity and the surface effective thermal thickness (less dampened frequency due to the surface thermal inertia). In other words, retaining high-frequency thermal fluctuations requires a reduction in surface thermal properties (i.e., low volumetric heat capacity and thin effective thermal thickness).
Figure B.2: Theoretical analysis of upper limit of fluctuating frequency detectable using IR measures under the prescribed conditions: (a) Variation of the maximum resolvable frequency, maxf , with surface thermal properties (effective thermal thickness and volumetric heat capacity) over a layer of water and acetone exposed to a drying airflow ( = 0.0sR W/m2; = 298aT K; and ∞ = 2U m/s); (b) Variation of
maxf over a thin layer of water and acetone (with a damping depth of ω = 0.08 mm) exposed to various mean wind velocities and air temperatures, under prescribed conditions ( = 0.0sR W/m2; = 293oT ; and = 35RS and 0% for water and acetone, respectively).
Simulation results under the prescribed conditions depicted in Figure B.2b show the maximum detectable frequency of thermal fluctuations maxf by a high sensitive IR

88 Thermal signatures of turbulent airflows camera with an NETD of ∆ =0 20IRT to 30 mK. For the normal conditions where ∆ < 0sT , the range of maxf is increasing by increasing the air velocity and by decreasing the air temperature. The results also reveal that resolving fluctuations for an air velocity of 1 m/s for a wide range of air temperatures ( ≤ ≤273 323aT ) would require a rapid IR camera with a frame rate of 300 Hz.
Appendix C: Wavelet Spectral Analysis
To quantitatively assess similarities between turbulent air characteristics and the resulting surface temperature fluctuations, we have used wavelet spectral analysis [Hudgins et al., 1993; Addison, 2002]. A wavelet is a mathematical function used to distinguish the various contributions of different space and time scales to observed function or continuous-time signal. The effect of each scale component can then be studied at a resolution that matches its scale.
A wavelet transform is the representation of a function by wavelets which are scaled and translated copies (“baby” wavelets) of a finite-length or fast-decaying oscillating waveform (“mother” wavelet) [Hudgins et al., 1993; Addison, 2002]. The wavelet transform is often compared with the traditional Fourier transforms, in which signals are represented as a sum of sinusoids. The main difference is that wavelets are localized in both time and frequency whereas the standard Fourier transform is only localized in frequency. Wavelets often yield a better signal representation using multiresolution analysis, with balanced resolution at any time and frequency. Wavelet transforms have several advantages over traditional Fourier transforms for representing functions that include discontinuities and sharp peaks, and enable accurate deconstruction and reconstruction of finite, non-periodic and/or non-stationary signals [Sifuzzaman et al., 2009].
For a time series F , its wavelet function FW is given by [Hudgins et al., 1993]
τ ψ τ= −∫( , ) ( ) ( )F sW s F t t dt (C.1)
where s , τ , and ψ s are respectively scale, time, and mother wavelet function (Morlet wavelet in this study). Thus, wavelet analysis yields not only the spectral measure of variance, but also the time instant when it appears. One can use wavelets to detect surface renewal events and analyze wind speeds and surface temperatures [Katul et al., 1989; Hudgins et al., 1993; Garai and Kleissl, 2011].
Figures C.1a and C.1b depict the wavelet scalogram of the air velocity and surface temperature fluctuations in which colors represent the percentage of energy for each

Chapter 4 89 continuous wavelet coefficient of the signal vectors aU and sT at real positive scales using the mother wavelet. A scalogram is a visual method of displaying the time-scale (frequency) localization property of a continuous wavelet transform using a mother wavelet. As clearly seen, there is a general similarity between ′
aU and ′sT
scalograms especially for higher frequencies (reflected by small scales) where the fluctuations are more apparent and the ′
sT time series lags behind ′aU by about 10
s. We note that the scale parameter shown on the y-axis is defined as the stretching factor such that the mother wavelet stretches (lower frequency) by increasing the scale parameter. Consistent with the time plot of aU and sT in Figures 4.3a and 4.3b, and with the energy spectra shown in Figures 4.4a and 4.4b, the ′
aU scalogram includes larger scale fluctuations detected at larger scales (compared to ′
sT scalogram). This is attributed mainly to differences in measurement frequency (52 Hz and 32 Hz for IR imager and sonic anemometer, respectively).
Figure C.1: Scaled wavelet scalogram of (a) air velocity and (b) surface temperature fluctuations recorded during acetone evaporation until the surface dries out (45 s). In this plot, coefficient values are shown by colors (z-axis) and x and y axes represent time interval and scale range related to the coefficients, respectively.
Acknowledgements
The authors gratefully acknowledge funding by the Swiss National Science Foundation of the project “Evaporation from terrestrial surfaces – linking pore scale

90 Thermal signatures of turbulent airflows phenomena with landscape processes” (200021-113442) and the financial support of the German Research Foundation DFG of the project “Multi-Scale Interfaces in Unsaturated Soil” (MUSIS; FOR 1083). The assistance of Mr. Fabian Rüdy with the illustration shown in Figure 4.2 and technical assistance of Daniel Breitenstein and Hans Wunderli (ETH Zurich) are greatly appreciated.


Chapter 5
Turbulence-induced Thermal Signatures over Evaporating Bare Soil Surfaces1
Abstract: Soil wetness and airflow turbulence are key factors affecting surface energy balance components thereby influencing surface skin temperature. Turbulent eddies interacting with evaporating surfaces often induce localized and intermittent evaporative and sensible heat fluxes that leave distinct thermal signatures. These surface thermal fluctuations observable by infrared thermography (IRT) offer a means for characterization of overlaying turbulent airflows and remote quantification of surface wetness. We developed a theoretical and experimental methodology for using rapid IR surface temperature measurements to deduce surface wetness and evaporative fluxes from smooth bare soils. The mechanistic model provides theoretical links between surface thermal fluctuations, soil and aerodynamic properties enabling thermal inferences of soil wetness with explicit consideration of soil thermal capacity and airflow turbulence effects. The method potentially improves accuracy of soil wetness assessment by IRT-based techniques whose performance is strongly influenced by surface-turbulence interactions, and offers new ways for quantifying fluxes directly at their origin.
5.1 Introduction
Thermal interactions between natural surfaces and turbulent airflows offer insights into the nature of various exchange processes, and could be used to infer the turbulent regime itself [Derksen, 1974; Schols, 1985; Katul et al., 1998; Balick et al., 2003; Vogt, 2008; Garai and Kleissl, 2011; Garai et al., 2013]. Recently, Haghighi and Or [2015a] have developed a mechanistic model to quantify turbulent evaporative fluxes from porous surfaces considering the coupling between airflow turbulence characteristics and temperature fluctuations of thin porous surfaces (e.g.,
1published as: Haghighi, E., and D. Or, Turbulence-induced thermal signatures over evaporating bare soil surfaces, Geophys. Res. Lett., doi:10.1002/2015GL064354.

Chapter 5 92 cloth, paper, and plant leaves). The modeling framework is based on the surface renewal (SR) theory [Higbie, 1935; Danckwerts, 1953; Harriott, 1962] that represents the turbulent airflow as a collection of rotating air parcels (eddies) comprised of different sizes and intensities, that are gradually loaded by diffusive vapor fluxes during a certain residence time [Brutsaert, 1975; Katul et al., 2006; Haghighi and Or, 2013].
The objective of this study was to link theoretically and experimentally turbulent airflow characteristics with rapid temperature fluctuations measured over evaporating smooth bare soils during stage-I (phase change vaporization plane is at the surface). This dynamic coupling provides a means for extracting information on a thin aerodynamic boundary layer (termed viscous sublayer) adjacent to the surface across which heat and vapor exchanges take place, and even on the state of surface wetness from measured surface thermal fluctuations influenced directly by surface thermal capacity and airflow turbulence. Explicit consideration of airflow turbulence and associated thermal imprints will benefit IRT-based assessment of soil surface water content [e.g., Minacapilli et al., 2009; Zhang et al., 2013] where atmospheric forcing (e.g., wind turbulence) drastically affects soil surface temperature and accordingly thermal inferences of soil surface wetness [Hu and Islam, 1995; Kerr, 2007].
5.2 Theoretical Considerations 5.2.1 Turbulence-induced Surface Temperature Fluctuations Evidence suggests that instantaneous variations in the viscous sublayer forming over the footprint of sweeping eddies affect local vapor and thermal gradients and thus could affect evaporative and sensible heat fluxes [Gaikovich, 2000; Haghighi and Or, 2013, 2015a]. Consequently, an evaporating surface could locally be cooled down or warmed up relative to air temperature and the resulting intermittent and spatially variable surface temperature dynamics are observable by means of rapid and sensitive infrared thermography (IRT), as illustrated in Figure 5.1.

93 Thermal signatures of turbulent airflows over drying bare soils
Figure 5.1: Schematic of an idealized surface renewal process by turbulent eddies and a typical resulting surface temperature evolution with time elapsed since exposed to the turbulent airflow. Thermal eddy residence time extracted from thermal fluctuations is determined as the time difference between two consecutive peak and valley in surface temperature time series [Watanabe and Mori, 2008; Haghighi and Or, 2015a].
U∞, T∞
Laminar Turbulent
z x δ
Ua, Ta Ts
w
τt,i
2ΔT s
0.1
K
50 s
0.1
K
10 s
T0,i

Chapter 5 94 Haghighi and Or [2015a] have shown that the eddy residence time distribution (a momentum field characteristic) known to follow the gamma statistical distribution [Danckwerts, 1951; Seo and Lee, 1988] could be extracted from information contained in rapid surface temperature measurements alone. The gamma distribution representation of eddy residence time distribution ( )φ τ is given as [Danckwerts, 1951; Brutsaert, 1975a]
1
( ) exp( )( 1)
ααβφ τ τ βτ
α
+
= −Γ +
(5.1)
where τ (s) is the eddy residence time, ( ) ( 1)!n nΓ = − is the gamma function, α (-) and β (1/s) are the shape and rate parameters, respectively, that are linked through
1αβτ+
= (5.2)
where τ (s) is the mean residence time of the eddy population.
As shown by Haghighi and Or [2015a], surface temperature fluctuations permit characterization of momentum field intermittency (renewal eddies) parameterized by the shape (α ) and rate ( β ) parameters of the eddy residence time distribution. These two parameters control the shape of the eddy distribution and provide insights into the nature of surface-turbulence interactions (e.g., a turbulent regime characterized by small or large α is referred to as small- or large-scale eddy dominated, respectively [Haghighi and Or, 2013]). Establishing an instantaneous surface energy balance model with linearize components, Haghighi and Or [2015a] have parameterized surface temperature variations induced by rapid perturbations of heat and mass transfer across an eddy-surface interface during the eddy residence time as determined by the turbulence regime. This, in turn, enabled analytical parameterization of the time scale of “thermal signatures” induced by eddies (termed here thermal eddy residence time and marked by the index “t”) interacting with smooth porous surfaces as a function of aerodynamic and surface thermal properties, as [Haghighi and Or, 2015a]
τ ∆
= − − ∆
,,
max,
ln 1 s ivt i
i i
Tc wA T
(5.3a)
σε λ= + +34 wi a i i
M aA T h k
R (5.3b)

95 Thermal signatures of turbulent airflows over drying bare soils
σε λ
σε λ
− Λ + + + −
∆ = −+ +
4
max, 0,3
(1 ) 4
4
wsw a i a i a
i iw
a i i
M bR T hT k C
RT T
M aT h k
R
(5.3c)
where τ ,t i (s) is the thermal eddy residence time induced by i th eddy, vc (J/m3K) is
the volumetric heat capacity of a wet porous surface expressed as a linear function of surface water content, surfθ (-), as [Huang et al., 2012]
v pav b vw surfc c cρ θ= + (5.4)
with bρ (kg/m3) the soil bulk density, 837pavc ≈ (J/Kg K) the average heat capacity on mass basis for solid constituents of most mineral soils, and
64.19 10vwc ≈ × (J/m3K) the volumetric heat capacity of water [de Vries, 1963; Kluitenberg, 2002], σ (W/m2K4) is the Stefan-Boltzmann constant ( 85.67 10−× W/m2K4), ε (-) is the surface emissivity with a value of 0.95 for a wide range of surface water contents [Mira, 2007], λ (J/kg) is the latent heat of vaporization (
32450 10× J/kg), wM (kg/mol) is the molar mass of evaporating liquid (0.018 kg/mol), R (J/mol K) is the universal gas constant (8.314 J/mol K), 0,iT (K) is the initial surface temperature at the onset of the i th renewal event with a time scale of ,i t it τ∆ = (see Figure 1), swR (W/m2) is the incoming short-wave radiation, Λ (-) is the surface reflectivity or albedo, sT and aT (K) are the surface and air temperatures, respectively, aC (kg/m3) is the vapor concentration in the air,
0.467a = (Pa/K2) and 128.783b = − (Pa/K) are linearization constants of the saturation vapor concentration as a function of surface temperature for =sT 288 to 298 K [Haghighi and Or, 2015a], ∆ ,s iT (K) is the surface temperature variation induced by i th eddy, ∆ max,iT (K) is the maximum surface temperature variation induced by the i th eddy (i.e., τ → ∞ ), ih (W/m2K) and ik (m/s) are instantaneous convective sensible heat and mass transfer coefficients, respectively, obtained from [Haghighi and Or, 2013, 2015a]
δ= +a s
ii
K Kh
w (5.5)
δ π θ=
+ ( )i
i surf
Dkr f
(5.6)
with aK (W/mK) the thermal conductivity of air in the boundary layer, D (m2/s) the vapor diffusion coefficient in air,
iδ (m) the instantaneous viscous sublayer

Chapter 5 96 thickness forming below the i th eddy’s footprint [Haghighi and Or, 2013], = P 3r(m) the mean pore radius with P (m) the mean soil particle size, ( )surff θ a surface wetness-dependent coefficient obtained from [Schlünder, 1988; Haghighi et al., 2013]
1( ) 14surf
surfsurf
f πθθπ θ
= −
(5.7)
Finally, w (m) in Eq. (5.3) is an effective thermal thickness that “experiences” surface temperature fluctuations and, to a first approximation, is estimated from the thermal damping depth originally derived for sinusoidal surface temperature fluctuations [Jury et al., 1991], as
Ht
Dw τ
π= (5.8)
where HD (m2/s) is the surface thermal diffusivity, and tτ (s) is the mean residence time of fluctuating “thermal signatures”. The approximation used for the effective thermal thickness has been studied (numerically) by Haghighi and Or [2015a], and was shown to provide results to within 20± % of the exact numerical value. Equation (5.8) reveals that the effective thermal thickness varies with surface wetness (reflected in the thermal diffusivity), and with the time scale of the thermal signatures.
For prescribed airflow conditions (A and ∆ maxT ), Eq. (5.3) shows that the thermal residence time of an eddy (during which a well-defined surface temperature depression of ∆ ,s iT is induced) is directly proportional to surface volumetric heat capacity and effective thermal thickness. This implies that typical thermal properties of natural (terrestrial) surfaces are likely to dampen observable thermal signatures and filter out perturbations induced by fast eddies [Haghighi and Or, 2015a]. On the other hand, the proportionality between thermally-deduced eddy residence time (i.e., from thermal response time of the surface) and surface properties offers a promise for inferences independent of the turbulence shape parameter α [Haghighi and Or, 2015a] where only eddies with sufficiently long residence time will leave their thermal imprints.
In other words, the eddy residence time distribution shifts towards longer residence times by a decrease in the so-called rate parameter β (note the inverse relation with the mean residence time τ in Eq. (5.2)), while the shape parameter α remains constant. We recognize that surface roughness could greatly influence the

97 Thermal signatures of turbulent airflows over drying bare soils nature of turbulent interactions (parameterized by α ) [Perry et al., 1987; Chen, 1990]; however, the present study focuses on aerodynamically smooth evaporating surfaces. Hence, different eddy distributions would have the same shape parameter α (for similar airflow conditions) but could be different and distinguished through different rate parameters β (affected by surface thermal properties) as deduced from IRT measurements. Such shift in residence times is theoretically predicted and could be useful for field-scale applications where evaporation occurs from surfaces with relatively large thermal capacity. Moreover, thermal eddy residence times tτ extracted from measured surface temperature fluctuations sT∆ (Figure 5.1) inherently contain effects of surface thermal properties, thereby enabling inverse estimation of such parameters from the model (e.g., using Eq. (5.3)).
5.2.2 Thermally-deduced Surface Water Content
As discussed in section 5.2.1, temperature fluctuations of natural surfaces are dampened by relatively high volumetric heat capacity (
vc ) of wet terrestrial surfaces, that may also involve a large effective thermal thickness (w ). Considering Eq. (5.3) for surface thermal response time induced by a renewal eddy, the rate parameter β will vary with the mean response time of measured “thermal signatures” due to the influence of surface thermal properties, while the eddy spectrum shape parameter α remains relatively constant for a given turbulent regime [Haghighi and Or, 2015a].
Combining Eqs. (5.3) to (5.8) for an eddy of mean properties ( tτ and ∆ sT ) and considering surface wetness dependency of volumetric heat capacity (Eq. (5.4)) yield relationships between surface water content and mean “thermal” eddy residence time, τ t
(s), given by
22 2 1 3
1
42surfθ
−Ω ± Ω − Ω Ω=
Ω for 0.1surfθ ≥ (5.9a)
where

Chapter 5 98
( )
τ π
λσε δ π τ ρ τ π
δ
λ πτ
∆ Ω = − ∆
∆ Ω = + + + + + − ∆
Ω =
1 3max
32 2 3
max
3 1
ln 1
4 ln 1
svw t
a s w sa t pav b t
wt
Td c
T
K K M a TT d r d c
w RD T
M r ad
RD
(5.9b)
with the coefficients 1 0.224d = (-) and 2 0.385d = − (-) fitting parameters used to simplify the wetness resistance parameter ( )surff θ in Eq. (5.7) in the parametric form: 1 2( )surf surff d dθ θ≈ + (with 2 0.99R = ), and 2
3 0.09 10Hd D −= = ×(m/s1/2) for 0.1surfθ ≥ obtained from measured data for a range of soils reported by Jury et al. [1991] that facilitates the analytical solution in Eq. (5.9). Considering Eqs. (5.3) and (5.9), the mean value of thermal eddy residence time corresponding to critical surface water content of 0.1surfθ = is expressed as
( )θ
ρτ
λπ σεδ δ π
=
+ ∆ = − ∆ + + + +
2
30.1
3 max
0.11 ln 14
( 1.8 )
pav b vw s
a s wa
d c c TK K DM a TT
w R r
(5.10)
such that one can use Eq. (5.9) to determine surface water content if 0.1t θτ τ =≥ .
For low surface water contents (i.e., 0 0.1surfθ≤ < or 0.1t θτ τ =< ) where surface
wetness dependency of soil thermal diffusivity (as well as the volumetric heat capacity) needs to be considered [Jury et al., 1991], we derived a more complex analytical expression with discussions on its potential application to infer stage-I evaporation status ( 0surfθ > ) in Appendix A.
The last parameter that needs to be prescribed is the effective (mean) thickness of the viscous sublayer (δ ) under turbulent airflows that is estimated (as a function of turbulence characteristics, in particular, mean velocity and eddy residence time distribution) according to [Haghighi and Or, 2013]
νδ α=
=
( ) afu
(5.11)
where aν (m2/s) is the air kinematic viscosity, =u (m/s) is the friction velocity obtained from [Haghighi and Or, 2013]

99 Thermal signatures of turbulent airflows over drying bare soils
=0.3
1u U
α ∞=+
(5.12)
with U∞ (m/s) the mean air velocity, and ( )f α expressed as [Haghighi and Or, 2013]
( 1)
1 02.2 112 1( )( 1) (2 1) 02 1
fα
απαα α αα+
== × Γ + Π + >+ (5.13a)
(2 1) (2 1) (2( 1) 1) (2( 2) 1) ... (2( ) 1)nα α α α αΠ + = + × − + × − + × × − + (5.13b)
with n α< (-) the largest integer smaller than α . Note that α accounts for variations in turbulence nature with measurement height [Haghighi and Or, 2013] from shear flow close to the surface dominated by small-scale eddies (small α ) to free shear flow with larger eddies (large α ) far away from the surface [Pope, 2000]. For a most common range of 0α = to 2 [Haghighi and Or, 2013], the expression defined in Eq. (5.12) for the friction velocity is consistent with other well-established expressions (e.g., = 0.15u U∞= ) that were obtained empirically for a wide range of meteorological conditions [Weber, 1999].
Thus, for given airflow conditions ( aT , aU ), surface properties (r , bρ , and w ), and surface temperature data (α , β ,
tτ , sT∆ , and ∆ maxT ), one may use Eq. (5.9) to estimate surface water content and potentially surface evaporation status (determining whether a surface is evaporating or not). Note that the calculations are not sensitive to frequency of thermal measurements; it simply determines a cutoff for observable eddies. While this may shift the thermally-deduced eddy residence time distribution (affecting
tτ ), the corresponding observed mean surface temperature fluctuation sT∆ changes accordingly and the model takes these variations into account (as the inputs).
5.2.3 Evaporative Fluxes from Smooth Bare Soils into Turbulent Airflows
Considering surface as the plane where surface-eddy interactions take place, a thermally-deduced eddy residence time distribution provides a surface-independent shape parameter α (not affected by surface thermal properties) characterizing turbulent momentum field near the surface with certain advantages over traditional momentum-based methods [Haghighi and Or, 2015a] and a rate parameter β including surface water content feedbacks. Provided some further surface and aerodynamic properties (such as mean particle size, air temperature and relative humidity, etc.) are available, one can estimate mean stage-I turbulent evaporative

Chapter 5 100 fluxes from gradually drying surfaces, E (kg/m2s), as [Haghighi and Or, 2013]
= ∆E k C (5.14)
where k (m/s) is the average mass transfer coefficient (Eq. (5.6) with the effective viscous sublayer thickness defined in Eq. (5.11)), and s aC C C∆ = − (kg/m3) is the air water vapor concentration difference at the liquid surface ( sC , saturation value at the surface temperature) and at the border of the viscous sublayer ( aC ) obtained from
( ) ( )w sat s sat a
s a
M P T P TC RH
R T T
∆ = −
(5.15)
where, sT (K) is the surface temperature, RH (-) is the air relative humidity, and
satP (Pa) is the vapor pressure at the liquid surface assumed to be the saturation vapor pressure at the surface temperature and is computed using the Clausius-Clapeyron relation as [Hartmann, 1994]
1 1( ) 611exp273
wsat
MP T
R Tλ
= − (5.16)
By assuming a fully mixed turbulence above the viscous sublayer [Haghighi and Or, 2013], we do not consider likely effects of atmospheric stability in this study (with small scale laboratory-scale experiments) that are known to be important for large scales of interest [Haghighi and Or, 2015b].
5.3 Materials and Methods
The coupling of surface temperature fluctuations with airflow momentum field using IRT measurements were deduced from evaporation experiments conducted under prescribed airflow regimes in a small wind tunnel ( L W×H× : 1.2 1.2 0.2× × m; see Figure 5.2). The wind tunnel was equipped with four blowing fans with built-in straightener grids (TAR/L, LTG Inc., Germany) which provide stable airflows over the evaporating surface ( 4 1040× m3/h @ 1050 rpm). A schematic of the experimental setup is illustrated in Figure 5.2.

101 Thermal signatures of turbulent airflows over drying bare soils
Figure 5.2: Experimental setup used to study surface thermal inferences of airflow turbulence and surface wetness status during stage-I evaporation: (1) infrared camera; (2) logger for single-point (and low frequency) measurement of ambient temperature T∞ , velocity U∞ , and relative humidity/vapor saturation in the middle of duct tunnel above the test surface; (3) wind production chamber; (4) blowing fans; (5) high-frequency 3D ultrasonic anemometer measuring airflow velocity near the sand sample ( aU ); (6) sand-filled box ( 0.2 0.2 0.2× × m) with particle sizes ranging from 0.3 to 0.9 mm and porosity of 0.4; (7) Mariotte bottle adjusting water table depth (L ) in the soil sample; and (8) balance.
A sand-filled box (0.2 0.2 0.2× × m) with particle sizes ranging from 0.3 to 0.9 mm ( =P 0.6 mm and porosity of 0.4) was used to represent evaporating bare soils with relatively high volumetric heat capacity and large effective thermal thickness. The box was connected to a Mariotte bottle to control the water table depth below the surface L (m) which, in turn, controlled surface water content and thermal properties of the evaporating medium. The evaporation characteristic length ( capL ) for the sand was estimated to be around 100 mm [Lehmann et al., 2008] determining the deepest water table position before hydraulic connectivity with the evaporating surface is disrupted. Water content measurements were obtained by direct sampling of the surface and oven drying (FD 115, BINDER, Germany) maintaining a temperature of 110 5± oC and a balance sensitive to 0.1% mass of the test sample (ED3202S, Sartorius, Germany). We note that the gravimetric
0.2
m
1.2 m
1 2
3
4
5
6
7
L
8

Chapter 5 102 measurements were converted to volumetric values using the sand bulk density. The experiments were performed for seven water table depths of: 0L = , 20, 50, 70, 100, 150, and 200 mm below the surface.
Soil surface temperature and airflow velocity were monitored and recorded, respectively, by an IR camera and by an ultrasonic anemometer at 30 Hz that provide necessary information required for extracting surface-temperature- and momentum-based eddy residence times. The eddy residence time distributions were obtained from the time difference between two consecutive peak and valley in the surface temperature and wind velocity time series [e.g., Seo and Lee, 1988; Watanabe and Mori, 2008]. In practice, there is a lower threshold for the time difference between consecutive peaks and valleys longer than the measurement “sampling time” (1/Hz), otherwise, these were considered as noise and filtered out.
The IR imager used in this study was FLIR ThermaCAM SC6000 with a noise equivalent temperature difference (NETD) of 35 mK. The camera is equipped with a quantum well infrared photon detector (QWIP) capable of recording infrared radiation in a narrow range of wavelength of 8.0 to 9.2 micron, at high resolution (640 512× pixels). The integration time of the detector is 10 ms and it is equipped with a linear Stirling cooler. Thermal images were converted to the surface temperature sT assuming a constant surface emissivity of 0.95 [Mira et al., 2007] and were transferred to a dedicated PC with ThermaCAM Researcher software (FLIR Systems, MA, USA) for subsequent analyses. We note that surface temperature differences smaller than IR camera’s NETD were treated as thermal noise and filtered out.
Details of airflow velocity adjacent to the surface ( aU ) were recorded at the edge of the evaporating surface using a 3D ultrasonic anemometer with 0.01 m/s accuracy (WindMaster, Gill Instruments Ltd., Netherland) acquiring measurements at 30 Hz. The mean airflow velocity (U∞ ) was measured at a distance of 100 mm above the test surface (in the middle of the duct tunnel) using a hot-wire anemometer (P600, Dostmann Electronic, Germany) and recorded by a data logger (21X, Campbell Scientific Inc., UT, USA). The temperature and relative humidity of the ambient air were also monitored at the same location using a temperature and humidity transmitter (HMT337, Vaisala HUMICAP®, Finland). Evaporative mass loss from the soil sample was measured using a digital balance (CPA34001S, Sartorius, Germany) with repeatability and linearity of 0.1 and 0.2 g, respectively.

103 Thermal signatures of turbulent airflows over drying bare soils 5.4 Results and Discussion
Using IRT-measured surface temperature field and mass loss measurements, we report experimental and theoretical results evaluating the performance of the proposed surface-temperature-based approach in quantifying surface (θsurf ) and aerodynamic (δ ) boundary conditions as the necessary input parameters for estimating mean evaporative fluxes from smooth bare soil surfaces (Eqs. (5.6) and (5.14)) with δ P 1.
5.4.1 Surface Thermal Signatures and the Eddy Residence Time Distribution
According to Haghighi and Or [2015a], full surface IR images are not necessary for making thermal inferences regarding turbulent interactions, and a single-point rapid thermal measurement over the surface (with a spatial resolution of larger than the representative elementary area of the surface) suffices for derivation of surface-temperature-based eddy residence time distributions. The single-point surface temperature measurements (obtained from a single pixel of area 1≈ mm2) for three water table depths of 0, 100, and 150 mm are shown in Figure 5.3a. The results shown in the zoom-in inset clearly reveal differences in time scales of thermal fluctuations such that the frequency of the fluctuations increases with lower water table depth and reducing surface water content.
Provided thermal eddy residence time distributions are available (Figure 5.3b), Eq. (5.3) yields mean and variance of surface thermal fluctuations (∆ sT ) as
τ
∆ = ∆ − − max 1 exps t
v
AT Tc w
(5.17)
that are indicated by dashed lines for the two extreme conditions in Figure 5.3a (see the zoom-in inset). We observed that the amplitude of surface thermal fluctuations (∆ ,s iT ) for different water table depths follow a single gamma distribution (not shown here), implying a constant mean amplitude of surface thermal signatures (
sT∆ ) independent of surface wetness (for 0.1surfθ ≥ ).

Chapter 5 104
Figure 5.3: Thermal inferences of airflow turbulence parameterized by α and surface wetness embedded in β : (a) Surface temperature measurements ( sT ) of the evaporating soil sample at three different water table depths (0 100, and 150 mm) below the soil surface for airflow conditions of 1aU = m/s, 301aT = K, and
30RH = %; (b) Surface-temperature-based eddy residence time distributions obtained from measured thermal fluctuations in (a) indicate variations in the rate parameter and mean residence time of thermal signatures with water table depth (or surface wetness). Dashed lines shown in the inset of (a) are predicted values of
ss TT ∆± calculated by Eq. (5.17) with thermal eddy residence times given in (b).
50 s

105 Thermal signatures of turbulent airflows over drying bare soils According to Eqs. (5.3) and (5.17), this observation could be explained by the same effect of surface water content on both vc w and τ t (A is relatively insensitive to surface wetness) such that τ t vc w tends to be a constant value. Additionally, ∆ maxT is also relatively constant for a wide range of surface water contents and constant airflow properties (see Eq. (5.3c)), hence resulting in a nearly constant surface thermal amplitude (independent of surface water content). We note that the differences observed in the mean surface temperature of the three scenarios shown in Figure 5.3a are attributed to changes in surface evaporation rates that will be discussed in the next section.
In contrast with the weak dependency of mean amplitude of thermal fluctuations on surface water content variations (for 0.1surfθ ≥ ), the thermal eddy residence time distributions shown in Figure 5.3b reveal effects of surface wetness on the time scale of thermal fluctuations. The results confirm that the mean residence time of turbulence-induced thermal signatures decreases with reduced surface water content (the resulting values of 5tτ ≈ , 2, and 0.8 s for water table depths of 0, 100, and 150 mm, respectively). These mean thermal eddy residence times translate to values of the effective surface thermal thickness in the range of 1.0w ≈ to 0.5 mm (Eq. (5.8)). The gamma density functions fitted to experimental data (lines) support the potential of using dynamic thermal information to deduce the turbulent regime (typically measured by anemometers). This is based on the similarity of the eddy spectrum shape parameter 2α = , deduced thermally but that characterizes the momentum field (independent of surface thermal properties). The values of this shape parameter are in agreement with previously reported (momentum-based) experimental results yielding values in the range of 0α = to 2 [Haghighi and Or, 2013, 2015a]. A more complete analysis of surface wetness dependency of the rate parameter β is presented in Appendix B.
5.4.2 Surface Wetness and Turbulent Evaporative Fluxes from Smooth Bare Soils
Considering dependency of the mean residence time of surface thermal signatures (embedded in the rate parameter β ) on surface water content (Figure 5.3b), Eqs. (5.9) and (A.1) could be used to estimate surface water content variations from measured surface thermal fluctuations (Figure 5.3a) for different water table depths. For known sand physical properties: 1450bρ = kg/m3, (0.6 / 3) 0.2r ≈ = mm, and 0.95ε = , and airflow properties: 1aU ≈ m/s, 301aT ≈ K, and 30RH = %, the results shown in Figure 5.4a depict a comparison between the model predictions and measurements that reveals relatively good performance of the proposed

Chapter 5 106 approach. We note that the ratio of δ =P 0.17 for the experiments in this study with =P 0.6 mm and δ ≈ 3.5 mm (Eqs. (5.11) to (5.13) with = 1aU and α = 2 ) is much less than unity enabling use of Eqs. (5.9) and (A.1) established for smooth bare soils. Typical surface water content variations with water table depth (L ) during stage-I evaporation is shown in the inset that qualitatively confirms the proposed measurement procedure and the pattern of the results. As water table depth moves from the surface ( 0L = ) to the soil evaporative characteristic length (
100capL L= = mm) below the topsoil surface water content varies from saturated (
sθ ) to residual ( rθ ) water content while [Lehmann et al., 2008].
Using the thermally-deduced eddy residence time shape parameter (α ) and surface water content ( surfθ ), we additionally compared measured evaporative fluxes (measured mass loss) with predicted fluxes for the porous medium (Eqs. (5.14) to (5.16)), as depicted in Figure 5.4b. The resulting agreement between the predictions and measurements for the surface water content and evaporation fluxes is reasonable, and inspires confidence in the physical basis underlying the analysis. Note that the relatively high rate of surface evaporation even at low surface water contents (2 to 5 mm/day), that has been measured and predicted under the given experimental conditions, could account for the (relatively low) surface evaporative cooling observed at large water table depths (Figure 5.3a). Nevertheless, these results are preliminary and additional tests considering a wider range of natural conditions and various forms of IR information acquisition would be needed to evaluate the proposed method prior to field-scale applications.

107 Thermal signatures of turbulent airflows over drying bare soils
Figure 5.4: Surface-temperature-based quantification of surface water content and corresponding evaporative fluxes: (a) Comparison between predicted and measured surface water content at different water table depths. The inset shows variations in surface water content with water table depth based on the concept of evaporative characteristic length [Lehmann et al., 2008] assuming a quasi-hydrostatic profile for water content distribution across the unsaturated zone during stage-I evaporation. (b) Variations in corresponding vapor fluxes obtained by the model (solid line) and by weight loss measurements (symbols).
5.5 Summary and Conclusions
The study extends and experimentally evaluates a novel method for using rapid IR
θs θr
Lcap L θsurf

Chapter 5 108 measurements of turbulence-induced surface temperature fluctuations over evaporating smooth bare soils during stage-I to determine airflow turbulence characteristics, surface water content and evaporation rates. Based on the concepts from the SR theory, intermittent turbulent eddy-surface interactions give rise to predictable surface temperature fluctuations whose characteristics are intimately linked with the turbulence regime and surface hydro-thermal properties. The effects of surface hydro-thermal properties (water content, volumetric heat capacity, and effective thermal thickness) on the attenuation of surface temperature fluctuations, results in a predictable shift in thermally-deduced residence time distribution of events (thermal eddies) following the gamma distribution. A useful outcome of this analysis is that the shape parameter α remains constant (not affected by surface properties), and thus the shift in thermal fluctuation distributions (reflected in the rate parameterβ ) may be used to remotely deduce surface wetness. These relations were formalized in theoretical expressions for predicting surface water content and evaporative fluxes from bare soil surfaces during stage-I.
The surface-temperature-based method was evaluated by using experiments of evaporation from a sand surface with different water contents (and thermal properties) as controlled by water table position below the surface. Theoretical predictions were in good agreement with laboratory-scale experimental results for the constant conditions of the experiment (without dynamic surface drying). While additional tests under natural field conditions are required, the proposed framework that links airflow turbulence with surface thermal fluctuations expands the utility of surface temperature information into estimation of surface wetness and other hydro-thermal properties [Vereecken et al., 2008]. The framework could improve the accuracy of soil surface wetness assessment by IRT-based techniques that observe surface temperature fluctuations directly where they are influenced by surface-turbulence interactions and where surface fluxes originate.
Appendix A: Thermal Estimation of Low Surface Water Contents
Combining Eqs. (5.3) to (5.8) for an eddy of mean properties ( tτ and sT∆ ) and considering surface wetness dependency of volumetric heat capacity and thermal diffusivity (for 0 0.1surfθ≤ < ) yield relationships between surface water content and mean “thermal” eddy residence time,
tτ (s), as

109 Thermal signatures of turbulent airflows over drying bare soils
( )
( )( )
32 3 2 2 334 3 4 5 6 5 4 6 5 4 3 4 5 6 5
34
5
32 3 2 2 3 434 4 3 4 5 6 5 4 6 5 4 3 4 5 6 5
27 9 2 4 3 27 9 2
3 23 22 3 6 54
33 27 9 2 4 3 27 9 2
surfθ− Ω Ω + Ω Ω Ω − Ω + Ω Ω − Ω − Ω Ω + Ω Ω Ω − Ω
= −Ω
Ω Ω − Ω Ω−
ΩΩ − Ω Ω + Ω Ω Ω − Ω + Ω Ω − Ω − Ω Ω + Ω Ω Ω − Ω
(A.1a)
where
( )
( )
λ πτ
τ π
ρ τ π
λσε δ π τ ρ τ π
δ
Ω =
∆ Ω = − ∆
∆ Ω = + − ∆
∆ Ω = + + + + + − ∆
3 1
4 4max
5 4 5max
36 2 5
max
ln 1
ln 1
4 ln 1
wt
svw t
spav b vw t
sa s wa t pav b t
M r ad
RDTd cT
Td c d cT
K K M a TT d r d cw RD T
(A.1b)
with 24 0.3883 10d −= × (m/s1/2) and 2
5 0.0477 10d −= × (m/s1/2) empirical coefficients used for simplifying the thermal diffusivity in Eq. (5.8) as
4 5H surfD d dθ≈ + (with 2 0.95R = ) for 0 0.1surfθ≤ < using measured data for a range of soils reported by Jury et al. [1991].
For practical applications, the proposed approach may also be employed to determine whether a surface is evaporating or not (as implied by the condition
0surfθ > for stage-I evaporation). Considering the analytical solution obtained in Eq. (A.1), critical thermal eddy residence time corresponding to zero surface water content could be expressed as
θ
ρτ
π σεδ
=
∆ = −
∆ + +
2
50
3 max
1 ln 14
spav b
a sa
c d TK K TT
w
(A.2)
Hence, one may calculate the mean residence time of resolved thermal signatures tτ (Eq. (5.2)) and compare the value with the critical residence time for stage-I evaporating surface
0θτ =. If
0t θτ τ => , the surface is evaporating at stage-I (phase

Chapter 5 110 change at the surface) and Eqs. (5.9) and (A.1) could be used to estimate surface water content; otherwise, the surface is dry and the evaporation process leaves no thermal signature at the surface. This would indicate that evaporation (if exist) is at stage-II (vapor diffusion controlled) where the phase change plane is below the surface and 0surfθ = .
Appendix B: The Dependency of the Rate Parameter β on Surface Wetness
Combining Eqs. (5.2) to (5.8) for an eddy of mean properties ( tτ and sT∆ ) yields a parametric expression for the rate parameter β as a function of surface water content ( surfθ ) and surface thermal information ( tτ , sT∆ , and ∆ maxT ), as
αβρ θ θ π
θ
+= + ∆ −
∆
2
max
1
( ) ( ) /ln 1
( )spav b vw surf H surf
surf
c c D TA T
(B.1)
where the thermal diffusivity HD (m2/s) is empirically (using the data of Jury et al. [1991] reported for a range of soils) estimated as
4 4 3 210 0.25541 0.44382 0.26669 0.06136 0.00075H surf surf surf surfD θ θ θ θ× = − + − + + (B.2)
Considering a relatively insensitive thermal fluctuations amplitude ( sT∆ ) that implies a relatively constant ratio of ∆ ∆ ≈max 0.06sT T for a wide range of surface water contents (see section 5.4.1), and airflow properties of 1aU ≈ m/s, 2α = (section 5.4.1), 301aT ≈ K, and 30RH = %, Figure B.1 shows variation of the rate parameter with surface water content obtained theoretically and experimentally from Eq. (B.1) and measurements in Figure 5.3b, respectively. As can be seen, there is a good agreement between model predictions and measured β confirming principals of the proposed modeling approach. Nevertheless, at very low surface water contents the model predicts a reduction in β that could be attributed to the assumption of constant ratio ∆ ∆ maxsT T independent of surface water content that may not be valid at very low surface water contents.

111 Thermal signatures of turbulent airflows over drying bare soils
Figure B.1: Variations in predicted (solid line) and measured (symbols) rate parameters with surface water content.
Acknowledgements
The authors gratefully acknowledge funding by the Swiss National Science Foundation of the project “Evaporation from terrestrial surfaces – linking pore scale phenomena with landscape processes” (200021-113442) and the financial support of the German Research Foundation DFG of the project “Multi-Scale Interfaces in Unsaturated Soil” (MUSIS; FOR 1083). Technical assistance of Daniel Breitenstein and Hans Wunderli (ETH Zurich) are greatly appreciated.


Part III: Linking Pore-scale Phenomena with
Landscape Processes


Chapter 6
Linking Evaporative Fluxes from Bare Soil across Surface Viscous Sublayer with the Monin-Obukhov Atmospheric Flux-profile Estimates1
Abstract: The Monin-Obukhov similarity theory (MOST) provides the theoretical basis for many “atmospheric-based” methods (such as eddy covariance and flux-profile methods) that are widely used for quantifying surface-atmosphere exchange processes. The turbulence driven and highly nonlinear profiles of momentum, air temperature, and vapor densities require complex resistance expressions applied to simple gradients deduced from a single or few height measurements. Notwithstanding the success of these atmospheric-based methods, they often leave a gap at the immediate vicinity of terrestrial surfaces where fluxes emanate. A complementary approach for quantifying surface fluxes relies on diffusive interactions across a viscous sublayer next to the surface, referred to as the “surface boundary layer (BL)” approach. This study (for bare soil) establishes formal links between these two approaches thereby offering a physically based lower boundary condition (BC) for flux-profile methods while improving the top BC for surface BL-based formulations to include atmospheric stability. The modified lower BC for flux-profile relationships links characteristics of drying evaporating surfaces considering nonlinearities between wetness and evaporative fluxes and obviates reliance on both profile measurements and empirical surface resistances. The revised top BC for surface BL methods greatly improves the agreement with published field-scale experimental measurements. The proposed reconciliation procedure improves estimation capabilities of both flux-profile and surface BL formulations, and considerably enhances their accuracy of flux estimation when applied theoretically (in the absence of measured profiles) to drying bare soil surfaces.
1published as: Haghighi, E., and D. Or (2015), Linking evaporative fluxes from bare soil across surface viscous sublayer with the Monin-Obukhov atmospheric flux-profile estimates, J. Hydrol., 525, 684-693.

Chapter 6 113 6.1 Introduction
Exchange processes at the land-surface are of great interest to hydrological and climatic modeling. Globally, evaporation consumes about 25% of the incoming solar energy, and returns 60% of terrestrial precipitation back to the atmosphere by the processes of evapotranspiration [Oki and Kanae, 2006; Trenberth et al., 2009]. At the atmospheric side of the land-atmosphere interface, gradients in momentum, air temperature, and water vapor density occur primarily in the vertical direction near the surface and sustained by turbulent exchange [Monin and Obukhov, 1954; Brutsaert, 1982]. The quantification of vertical fluxes from measured profiles of wind speed, air temperature, and water vapor density has been a central focus of micrometeorological research [Monin and Obukhov, 1954; Dyer and Hicks, 1970; Businger et al., 1971; Pruitt et al., 1973; Dyer, 1974]. Nevertheless, even the simplest scenario of bare soil evaporation may exhibit complex dynamics due to internal transport mechanisms unrelated to atmospheric BCs [Fisher, 1923; Yiotis et al., 2004; Prat, 2007; Lehmann et al., 2008; Shokri and Or, 2011; Or et al., 2013; Assouline et al., 2014]. Hence reliance on atmospheric-based methods may lead to overestimation of evaporation from drying soil surfaces [Camillo and Gurney, 1986; Kondo et al., 1990; Bittelli et al., 2008].
The Monin-Obukhov similarity theory (MOST) [Monin and Obukhov, 1954] provides a theoretical framework for estimating turbulent fluxes from measured profiles (flux-profile methods) close to the surface but beyond the region where molecular diffusion effects are important [Brutsaert, 1975a; Liu et al., 1979]. Using dimensional arguments, Monin and Obukhov [1954] established a general scalar flux-profile near the surface as a function of a stability parameter, ( )z d Lζ = − , with z (m) the scalar measurement height, d (m) the zero plane displacement (
0d = for bare soil surfaces [Garratt and Hicks, 1973]), and L (m) the Obukhov’s [1946] stability length. At heights below this characteristic length, shear production of turbulent kinetic energy dominates over buoyant turbulence effects. For conditions of stable stratification, the turbulent sensible heat flux (H ) is directed downward (i.e., 0H < ) and, consequently, 0L > ; whereas for unstable conditions, the sensible heat flux from the surface is upward (i.e., 0H > ) and 0L < . These regimes coalesce at neutral stratification where L = ∞ [Monin and Obukhov, 1954].
The logarithmic representation of meteorological variables (such as wind speed, air temperature, and water vapor density) in MOST-based approaches necessitates definition of a finite height for representing extrapolated “surface” values

114 Reconciled surface BL- and MOST-based estimates [Brutsaert, 1975a]. In other words, the flux-profile methods very close to the surface become poorly defined exactly where most of the variations in wind speed, air temperature, and water vapor density in the lower part of the atmosphere occur [Liu et al., 1979]. Brutsaert [1975a] commented that “Unfortunately, however, in the immediate vicinity of the surface, where 0z = , the assumed analogy is not really valid, because mass and heat transfer at the wall are controlled mainly by molecular diffusion”. In practice, flux-profile methods shift the physical surface to fictitious levels for each of the scalars: 0z z= for momentum, 0hz z= for sensible heat, and
0vz z= for water vapor transfer, with 0vz the roughness length for water vapor transfer [Garratt and Hicks, 1973; Brutsaert, 1975a] (see Figure 6.1).
As the primary parameter relevant to evaporation that links flux-profile methods to surface conditions (where fluxes originate) and other parameters that affect the method’s accuracy [Raupach and Legg, 1984; Foken, 2006; Huang et al., 2009; Huo et al., 2014], Brutsaert [1975a, 1982] proposed two parameterizations of 0vz for smooth and bluff-rough surfaces. Notwithstanding the extensive list of applications and evaluations of MOST-based flux-profile methods in field tests [Businger et al., 1971; Högström, 1988; Liu et al., 2007; Sorbjan and Grachev, 2010; Liu et al., 2013; Ershadi et al., 2014], an “explicit” link to physical processes at the surface and to wetness state remains lacking [Kondo et al., 1990; van de Griend and Owe, 1994; Bittelli et al., 2008; Shahraeeni et al., 2012; Haghighi et al., 2013].
We refer to exchange rates across a thin boundary layer adjacent to the surface (the viscous sublayer) where water vapor fluxes are dominated by molecular diffusion [Bange, 1953; Cooke, 1967; Schlünder, 1988; Haghighi et al., 2013], and often give rise to nonlinear “surface wetness-dependent” resistances [Kondo et al., 1990; van de Griend and Owe, 1994; Yamanaka and Yonetani, 1999; Bittelli et al., 2008; Haghighi et al., 2013] that must be properly considered for model closure. Such nonlinear effects, that control both evaporative fluxes and energy partitioning with surface drying [Aminzadeh and Or, 2013], clearly affect energy balance closure of atmospheric-based measurements [Foken et al., 2006; Foken, 2008; Leuning et al., 2012; Wohlfahrt and Widmoser, 2013; Eder et al., 2014].

Chapter 6 115
Figure 6.1: Schematic of a turbulent airflow over an evaporating porous surface with associated water vapor density profiles presented for three different atmospheric stability conditions. Near-surface resistances in MOST- (
,a tR ) and surface BL-based ( sv BLR R+ ) estimates of evaporative fluxes into the atmosphere are shown in the inset (dimensions are not to scale).
To bridge the gap between the total aerodynamic resistance in flux-profile methods
Cs
RBL
Rsv
2r r√π/θsurf
Surf
ace
BL
MO
ST
Rs
Ra OR Ra,t
Laminar Turbulent
U∞, T∞
Viscous Sublayer C(z0v)-C(z)
E
Ln(z)
Ln(z0)
Ln(z0v) δ
z=z0, C(z0)
z, C(z)
z=z0v, C(z0v)
z=δ, C(δ) δi

116 Reconciled surface BL- and MOST-based estimates with nonlinearities associated with surface wetness and diffusion processes that could affect estimation of 0( )vC z and bare soil evaporation rates [Camillo and Gurney, 1986; Kondo et al., 1990; Bittelli et al., 2008], studies have proposed an empirical surface resistance (in series with ,a tR ) as a function of surface water content [e.g., Sun, 1982; Camillo and Gurney, 1986; van de Griend and Owe, 1994]. Considering evaporation during stage-I where capillary flow supplies the (phase change) evaporation plane at the soil surface [van Brakel, 1980; Shokri et al., 2010; Shahraeeni et al., 2012], Haghighi et al. [2013] have proposed a physically based framework to overcome the reliance on the empirical resistance accounting for surface wetness effects [Schlünder, 1988; Shahraeeni et al., 2012; Haghighi et al., 2013]. Invoking similar concepts, the present study aims to derive a consistent and physically based lower BC for flux-profile methods that considers the pore-scale physics of evaporation as affected by surface wetness ( surfθ ) and viscous sublayer thickness (δ ). These new lower BCs would obviate reliance on empirical surface resistances, remove the ambiguous extrapolated water vapor density at 0vz z= , and thus improve the estimation capabilities of these methods at the most sensitive region for surface fluxes.
The second objective of this study is to improve the top BC for the surface boundary layer methods developed for laminar airflows by Shahraeeni et al. [2012] and for turbulent airflows by Haghighi and Or [2013]. The method is based on pore-scale modeling of diffusive water vapor fluxes across the viscous sublayer that explicitly considers effects of surface wetness and subsurface properties on evaporation rates. Recently, aspects of turbulent exchange were incorporated by using a detailed formulation of surface renewal (SR) theory [Higbie, 1935; Danckwerts, 1951; Harriott, 1962] with explicit account of surface-eddy exchange during a certain eddy residence time over the surface [Haghighi and Or, 2013]. As eddies are swept along the evaporating surface, they gradually accumulate water vapor (or exchange energy) at rates determined by diffusion across a viscous sublayer forming beneath their footprint, and by the mean water vapor gradient between the surface and the well-mixed turbulent airflow. Following a certain residence time over the surface, an eddy is ultimately ejected back into the turbulent flow and renewed by another drawn from an eddy population defined by flow conditions. Although the performance of this surface-based BL approach under controlled laboratory and field conditions has been tested [Aminzadeh and Or, 2013; Haghighi et al., 2013; Haghighi and Or, 2013; Mosthaf et al., 2014], it lacks direct consideration of atmospheric stability (as incorporated in MOST-based approaches) which directly impacts the water vapor BC at the top of the viscous sublayer ( ( )C δ

Chapter 6 117 ). The assumption of a well-mixed turbulent atmosphere that we used in earlier works for laboratory-scale applications (i.e., ( ) ( )C C zδ = irrespective of atmospheric stability conditions [e.g., Shahraeeni et al., 2012; Haghighi and Or, 2013; Aminzadeh and Or, 2013]) could result in significant errors in the surface BL formulation, especially for large scales of interest and for different atmospheric stability conditions.
Considering continuity of the water vapor flux from the surface across the atmospheric boundary layer (under quasi-steady-state conditions), we seek to reconcile MOST- and surface BL-based estimates of evaporative fluxes from bare soil surfaces. The motivation for such flux matching is to capitalize on the advantages of MOST methodology in terms of its robust formulation and testing for large scales, its consideration of atmospheric stability and turbulent transfer, and its natural links to remote sensing [Kalma et al., 2008; Kustas and Anderson, 2009]. The surface BL approach, on the other hand, offers several advantages (i.e., explicit consideration of surface wetness, hydraulic properties of the soil, estimation of evaporation dynamics, and direct links to energy exchange at the surface) that could be readily incorporated into a more complete flux estimation scheme. Thus, the objectives of this study were to: (1) revise the lower BC in MOST-based flux-profile methods to provide explicit links to dynamic surface properties at 0z = (such as soil type and surface water content) affecting fluxes through surface-based BL formulations; (2) modify the top BC of the BL approach to provide water vapor density values derived from MOST-based atmospheric stability; and (3) propose a general (combined) model for stage-I evaporative fluxes from bare soil surfaces into turbulent airflows capitalizing on both methods.
Following this introduction, section 6.2 briefly presents a theoretical overview of aerodynamic and surface resistances to evaporative fluxes from drying surfaces, and the matching considerations for reconciling flux-profile with the surface BL approach. Using selected literature results, we evaluate the proposed model in section 6.3, followed by summary and concluding remarks in section 6.4.
6.2 Theoretical Considerations 6.2.1 MOST- and Surface BL-based Estimates of Evaporative
Fluxes from Bare Soil Several surface-atmosphere transport processes are often expressed succinctly through equivalent “resistances” to vertical transport arranged in series [Wesely and Hicks, 1977; van de Griend and Owe, 1994; Bittelli et al., 2008; Haghighi et al.,

118 Reconciled surface BL- and MOST-based estimates 2013], as depicted schematically in Figure 6.1. Flux-profile methods were introduced originally for vegetated surfaces where the surface is defined as the roughness height plus the displacement height (e.g., 0vz z d= + for water vapor transfer [Brutsaert, 1982]). These methods consider three primary resistances to water vapor transfer into the atmosphere: (i) a canopy (stomatal) resistance, cR (s/m), determined from physiological plant properties [Hicks et al., 1987], (ii) a surface resistance, sR (s/m), (also known as the excess resistance [Thom, 1972; Verma, 1989]) that accounts for transfer across a thin quasi-laminar boundary layer of air in contact with a surface [Chamberlain, 1966; Garratt and Hicks, 1973], and (iii) a bulk aerodynamic resistance, aR (s/m), related to momentum transfer as determined from atmospheric properties (predominantly turbulent exchange) [Thom, 1975; Brutsaert, 1982; Hicks et al., 1987].
Considering 0d = and 0cR = for bare soil surfaces [Garratt and Hicks, 1973], the surface and aerodynamic resistance formulations established by Thom [1975] for turbulent exchange within the surface sublayer above the shifted level 0vz (where logarithmic variation of the vapor density profile and atmospheric stability influence the transfer rates) is rewritten for bare soil as [Shuttleworth and Wallace, 1985; van de Griend and Owe, 1994; Yamanaka and Yonetani, 1999; Bittelli et al., 2008] (see Figure 6.1)
10
* * 0
1 1 ln ( ) ( )s a sv svv v
zR R Ba u a ku z
ξ ξ−
+ = + − Ψ + Ψ (6.1)
where 1va = is the ratio of eddy diffusivity for water vapor to eddy viscosity under neutral conditions, ( )1 1
0 0ln vB k z z− −= (with 0.41k = the von Karman constant) is an empirical surface transfer function [Chamberlain, 1966; Garratt and Hicks, 1973] that is considered as a “mere fitting parameter” in the context of heat transfer estimation [Lhomme et al., 2000], z Lξ = and 0 0vz Lξ = are the stability parameters, and ( )sv ξΨ is the stability function expressed as
( )
1 1 162 ln 02
( )5 0 15 1 ln( ) 1
sv
ξξ
ξ
ξ ξξ ξ
+ − < Ψ =
− ≤ ≤− + >
(6.2)

Chapter 6 119 such that 0ξ < indicates an “unstable” atmospheric condition while 0 1ξ≤ ≤ and 1ξ > refer to “neutral and stable” and “strongly stable” conditions, respectively [Thom, 1972, 1975; Brutsaert, 1982]. We note that the sum of the resistances formulated in Eq. (6.1) is equivalent to the total resistance to vertical water vapor transfer, ,a tR (s/m), widely used in the literature for both vegetated (
0d ≠ ) and bare soil ( 0d = ) surfaces [e.g., Brutsaert, 1982; Yamanaka and Yonetani, 1999; Salvucci and Gentine, 2013] as
0, 0
* 0
( ) ( ) 1 ln ( ) ( )va t sv sv
MOST v v
C z C z zRE a ku z
ξ ξ −
= = − Ψ + Ψ (6.3)
where MOSTE (kg/m2s) is the mean water vapor flux from the surface, and 0( )vC z is an effective air water vapor density estimated from extrapolated logarithmic profile [Brutsaert, 1982].
The total aerodynamic resistance defined in Eq. (6.3) has been established beyond the roughness height 0 0vz > . Hence, it does not account for an additional resistance imposed on water vapor while it diffuses from soil pores at 0z = (where air water vapor density at the surface sC (kg/m3) is considered as the saturation value at the soil surface temperature sT (K)) to the free air at the nominal surface level 0vz where the air water vapor density is denoted by 0( )vC z [Bittelli et al., 2008; Shahraeeni et al., 2012; Salvucci and Gentine, 2013]. This additional “surface wetness-dependent” diffusional resistance has been shown to be a nonlinear function of surface wetness and soil properties, and could affect estimates of evaporative fluxes as bare soil surfaces gradually dry [Sun, 1982; Camillo and Gurney, 1986; Kondo et al., 1990; van de Griend and Owe, 1994; Bittelli et al., 2008].Thus, studies have proposed an empirical surface resistance, sr (s/m), as a function of surface water content in series with ,a tR offering “empirically-based reconciled” estimates for evaporative fluxes from bare soil surfaces, ,rec empE (kg/m2s) as
,,
( )srec emp
a t s
C C zE
R r−
=+
(6.4)
where sr is estimated from various calibration tests and is expressed as a function of surface water content [e.g., van de Griend and Owe, 1994; Yamanaka and Yonetani, 1999].
In contrast to MOST-based approaches that focus primarily on the atmospheric side of the soil interface (with 0vz as the only parameter containing some surface

120 Reconciled surface BL- and MOST-based estimates information [Brutsaert, 1975a, 1982]), the surface BL-based approach explicitly considers the roles of surface properties and wetness state and the viscous sublayer thickness on the pore-scale physics of evaporation from drying porous surfaces [Haghighi et al., 2013]. Evidence suggests that the limiting “surface wetness-dependent” transport mechanisms are (i) an internal capillary-viscous resistance,
svR (s/m), imposed on water transfer that is controlled by soil hydraulic properties [Haghighi et al., 2013], and (ii) a diffusive boundary layer resistance, BLR (s/m), for water vapor transfer from the surface to the atmosphere across the viscous sublayer that accounts for the interactions between discrete pores and the boundary layer [Bange, 1953; Suzuki and Maeda, 1968; Schlünder, 1988; Shahraeeni et al., 2012; Haghighi et al., 2013] (see Figure 6.1).
Haghighi et al. [2013] and Haghighi and Or [2013] have recently proposed a physically based near-surface resistance model to evaporative fluxes, which considers concurrent effects of surface and aerodynamic properties together, using available diffusion-based analytical solutions [Schlünder, 1988] as
P ( )( )4 ( )
surfssv BL
BL surf
fC CR R
E K Dδ θδ γ
θ
+−+ = = + (6.5)
where BLE (kg/m2s) is the surface BL-based mean water vapor flux from the surface, ( )C δ (kg/m3) is the air water vapor density at the border of the viscous sublayer
with the thickness δ (m), P r P= (m) is the equivalent mean pore size of the soil [Haghighi et al., 2013] with r (m) the pore radius, D (m2/s) is the water vapor diffusion coefficient in air ( 52.5 10−× m2/s), 51.73 10γ −= × (-) is a proportionality constant reconciling units (considering SI units) for capillary liquid to vapor fluxes [Haghighi et al., 2013], surfθ (-) is the surface water content represented conceptually in this approximation by identical pores on a regular lattice with relative evaporating pore area per unit cell equal to surfθ , the coefficient ( )surff θ reflecting surface wetness dependency is obtained from the pore-scale vapor diffusion model of Schlünder [1988], as
1( ) 14surf
surfsurf
f PθθP θ
= −
(6.6)
and K (m/s) is the hydraulic conductivity at the evaporating surface expressed as a function of surface water content, as [Mualem, 1976; van Genuchten, 1980]

Chapter 6 121
( )21 1/1/(1 1/ )( ) 1 1
nnsurf s surf surfK K τθ
−− = Θ − − Θ
(6.7) surf r
surfs r
θ θθ θ
−Θ =
−
in which, the effective surface water saturation surfΘ is expressed as a function of surface water content ( surfθ ), with rθ (-) the residual water content, sθ (-) the saturated water content (≈ sand porosity), the parameter n (-) linked with pore size distribution, the parameter τ (-) related to the flow path geometry and connectivity (generally set to 0.5 [Mualem, 1976]), and sK (m/s) is the saturated hydraulic conductivity.
An important variable in this scheme is the effective viscous sublayer thickness δ(m). For turbulent airflows, δ is a function of turbulence characteristics, particularly mean wind speed and turbulent eddy size (or residence time) spectrum [Haghighi and Or, 2013]. This dependency is succinctly expressed as [Haghighi and Or, 2013]
*
( )guνδ α= (6.8)
where ν (m2/s) is the air kinematic viscosity ( 51.5 10−× m2/s), α (-) is the shape parameter of eddy residence time distribution known to follow the gamma statistical distribution [Danckwerts, 1951; Brutsaert, 1975b; Seo and Lee, 1988] (see the Appendix), and *u (m/s) is the friction velocity estimated as [Haghighi and Or, 2013]
*0.3
1u U
α ∞=+
(6.9)
where U∞ (m/s) is the mean wind speed, and ( )g α is obtained from [Haghighi and Or, 2013]
( 1)
1 02.2 112 1( )( 1) (2 1) 02 1
gα
αPαα α αα+
== × Γ + Π + >+ (6.10)
(2 1) (2 1) (2( 1) 1) (2( 2) 1) ... (2( ) 1)nα α α α αΠ + = + × − + × − + × × − +
where ( ) ( 1)!x xΓ = − is the gamma function and n α< is the largest integer smaller than α . Note that α accounts for variations in turbulence nature with measurement height [Haghighi and Or, 2013] from shear flow close to the surface

122 Reconciled surface BL- and MOST-based estimates dominated by small-scale eddies (small α ) to free shear flow with larger eddies far away from the surface (large α ) [Pope, 2000]. For a most common range of 0α = to 2, the expression defined in Eq. (6.9) for the friction velocity is consistent with other well-established expressions (e.g., * 0.15u U∞≈ ) that were obtained empirically for a wide range of meteorological conditions [Weber, 1999, Eqs. (9) and (10)].
As a top BC, the surface BL-based model in Eq. (6.5) assumes that the water vapor density in the newly introduced renewal eddy represents the well-mixed free stream flow, as would be measured at any height away from the evaporating surface (i.e.,
( ) ( )C C zδ = ). Considering the known variations in water vapor density profiles with height and atmospheric stability conditions deduced by MOST [Wesely and Hicks, 1977; Brutsaert, 1982; Hicks et al., 1987], such a simplistic assumption would introduce errors into flux estimates for different atmospheric stability conditions. In other words, water vapor profile shapes were not considered in the SR formulation of Haghighi and Or [2013], and thus need to be accounted for.
Considering Eqs. (6.3) and (6.5), MOST- and surface BL-based estimates of evaporative fluxes are complementary and could benefit from modifications of lower ( 0( )vC z ) and top ( ( )C δ ) BCs to consider “joint contribution” of atmospheric stability conditions and surface water content to evaporative fluxes from bare soil surfaces. In the following section, we invoke the mass conservation law for a hypothetical constant vertical flux emanating from a bare soil surface and traversing various atmospheric resistances arranged in series, and propose a “physically based reconciled” estimate of mean evaporation flux (i.e.,
,rec phys MOST BLE E E= = as an alternative to the empirically-based derivation in Eq. (6.4)) with modified lower and upper BCs in MOST- and surface BL-based methods, respectively.
6.2.2 Physically based Reconciled Estimate of Evaporative Fluxes from Bare Soil
Based on the conservation of mass for quasi-steady-state conditions, the vertical evaporation flux is constant across the atmospheric boundary layer (i.e.,
,rec phys MOST BLE E E= = ) and could be expressed as
0,
,
( ) ( )vrec phys
a t
C z C zE
R−
= (6.11a)

Chapter 6 123
,
( )srec phys
sv BL
C CE
R Rδ−
=+
(6.11b)
with resistance terms defined in Eqs. (6.3) and (6.5). Considering a typical value commonly used to represent roughness length for water vapor transfer from soil surfaces ( 0 1vz ≈ mm [Garratt and Hicks, 1973]), and the range of variations of the viscous sublayer thickness δ (0.5 to 10 mm depending on wind speed and population of turbulent eddies [Haghighi and Or, 2013]), 0vz may fall within or outside the viscous sublayer. Assuming that the viscous sublayer and its formation are not strongly affected by bare soil roughness of the order of 1 mm, we may define a ratio of 0vz δ and merge the equality postulated in Eq. (6.11) for ,rec physE through linking the lower and upper BCs for aerodynamically (effective) smooth surfaces (i.e., 0 1vz δ ≤ ).
Assuming linear variations of water vapor density profile and other scalars across a viscous sublayer of thickness δ where scalar exchange rates are controlled by molecular diffusion [Brutsaert, 1982; Schlünder, 1988] provides a means to link
0( )vC z with ( )C δ as
0 00( ) 1 ( )v vv s
z zC z C C δ
δ δ
= − +
(6.12)
where sC and 0vz δ are prescribed. Substituting 0( )vC z from Eq. (6.12) (with ( )C δ obtained from Eq. (6.11b)) into Eq. (6.11a) yields the physically based
reconciled estimate of surface evaporative fluxes given as
( ),
0,
( )srec phys
va t sv BL
C C zE
zR R R
δ
−=
+ +
(6.13)
that explicitly considers joint effects of atmospheric stability conditions and surface water content embedded in ,a tR and sv BLR R+ , respectively. We note that the surface BL-based resistance model defined in Eqs. (6.5) and (6.11b) is treated as a 1D diffusion model but with the intrinsic resistance due to changes in surface water content calculated from the 3D pore-scale diffusion solution of Schlünder [1988]. The solution makes a distinction between the ( )s sC T over evaporating pores and zero flux ( 0C z∂ ∂ = ) over dry surfaces resulting in 3D vapor shells forming over individual evaporating pores within the viscous sublayer (see Figure 6.1) [Schlünder, 1988; Shahraeeni et al., 2012; Haghighi et al., 2013; Aminzadeh and Or, 2014].

124 Reconciled surface BL- and MOST-based estimates These insights and intrinsic surface resistance (as the core of the surface BL-based model that feeds into the MOST) are finally treated as an “effective” 1D surface flux for all practical applications [Schlünder, 1988; Haghighi et al., 2013] enabling the application of Eq. (6.12) for unsaturated soil surfaces and matching with MOST 1D flux.
Figure 6.2: Comparison of normalized evaporation rates from drying surfaces based on MOST-formalism (dashed line) and estimates by the reconciled method (solid lines) for typical coarse (P 0.3= mm and 2.5n = —thick lines) and fine (P 0.05= mm and 1.5n = —thin lines) sandy soil surfaces exposed to (a) low wind (
0 0.2vz δ = ) and (b) high wind ( 0 0.8vz δ = ) speed conditions (with 2z = m, 298sT = K, ( ) 293T z = K, and 30RH = %). The normalized results ( oE (kg/m2s) is
the potential evaporation flux at 0.4surfθ = ) reveal insensitivity of MOST-based estimates to potential effects of surface water content and soil type exerting a stronger influence on evaporating surfaces with smaller (effective) pore sizes subjected to high wind speeds.
Figure 6.2 depicts a theoretical comparison between MOST-based (Eq. (6.3)) and reconciled (Eq. (6.13)) method estimates for typical coarse (P 0.3= mm and pore size distribution 2.5n = ) and fine (P 0.05= mm and 1.5n = ) sandy soil under low wind ( 0 0.2vz δ = ) and high wind ( 0 0.8vz δ = ) speed conditions with 2z = m, 298sT = K, ( ) 293T z = K, and 30RH = %. To avoid ambiguities concerned with determination of the air water vapor density at 0vz z= in Eq. (6.3), the results are represented in a normalized form ( oE E ) with oE (kg/m2s) the potential evaporation flux from a fully saturated surface (i.e.,
0.4surf
oE Eθ =
= for most sandy soils). Considering that “theoretically” there is no direct link between 0( )vC z and surface parameters (as the only parameter in MOST formulation that could potentially contain likely effects of surface wetness and soil type provided real measured profiles are available), the normalized results reveal insensitivity of

Chapter 6 125 MOST-based estimates to potential effects of surface parameters when evaluated theoretically (in the absence of measured profiles). Such insensitivity becomes important for soil surfaces with smaller effective pore size exposed to high wind speeds (Figure 6.2b) where the deviation between the two approaches considerably increases with decreasing surface water content. According to the studies by Camillo and Gurney [1986], Kondo et al. [1990], and Bittelli et al. [2008], atmospheric-based approaches (like MOST-based methods) that only rely on the aerodynamic resistance fail to capture surface wetness effects on evaporative fluxes from bare soil surfaces when evaluated theoretically (i.e., measured profiles are not available), as depicted in Figure 6.2.
Figure 6.3: Comparison of evaporation rate estimates during surface drying based on surface BL (dashed line) and reconciled (solid lines) methods for a typical sandy soil (P 0.2= mm and 2.0n = ) subjected to low wind ( 0 0.2vz δ = —thin lines) and high wind ( 0 0.8vz δ = —thick lines) speeds. Estimates are made for (a) unstable (
1ξ = − , 298sT = K, ( ) 293T z = K) and (b) stable ( 1ξ = + , 288sT = K, ( ) 293T z = K) atmospheric conditions (with 2z = m and 30RH = %). The results reveal overestimation of the surface BL-based method at high surface water contents especially under stable atmospheric condition and high wind speed ( 0 0.8vz δ = ).
Similar to results presented in Figure 6.2, Figure 6.3 shows deviations between the surface BL-based (Eq. (6.5)) and the reconciled method (Eq. (6.13)) estimates. The results depicted in Figure 6.3 were obtained for a typical sandy soil (P 0.2= mm and 2.0n = ) subjected to low ( 0 0.2vz δ = ) and high ( 0 0.8vz δ = ) wind speeds considering unstable ( 1ξ = − , 298sT = K, ( ) 293T z = K), and stable ( 1ξ = + ,
288sT = K, ( ) 293T z = K) atmospheric conditions (with 2z = m and 30RH =%). The results illustrate deviations from the assumption of a well-mixed turbulent atmosphere (i.e., assuming ( ) ( )C C zδ = irrespective of atmospheric stability conditions) previously used in the surface BL-based approach. The deviations
~100
%
~200
%
z0v/δ=0.2
z0v/δ=0.8

126 Reconciled surface BL- and MOST-based estimates increase with increasing surface water content and wind speed (expressed by increasing ratio 0vz δ ). The largest deviations are associated with stable atmospheric conditions (Figure 6.3b). In other words, the assumption of
( ) ( )C C zδ = becomes reasonable for very unstable conditions (i.e., 1ξ − ) where vertical movements of turbulent eddies are strongly enhanced due to intensive turbulence mixing under unstable atmospheric conditions [Monin and Obukhov, 1954; Brutsaert, 1982]. Combining concepts from the SR theory and MOST, we have proposed an effective top water vapor density BC (at the border of the viscous sublayer) for surface BL-based formulation in Eq. (6.5) (as an alternative to using Eq. (6.13)) with results presented in the Appendix.
In summary, Eq. (6.13) is the main result of this study representing a physically based matching procedure for MOST- and surface BL-based estimates of evaporative fluxes from bare soil. The procedure explicitly considers joint effects of surface parameters and atmospheric stability conditions. In the following, we evaluate the impact of the matching procedure on description of bare soil evaporative fluxes using field-scale observations from the literature.
6.3 Evaluation for Drying Soil Surfaces at the Field-Scale
In this section the reconciled estimate defined in Eq. (6.13) is evaluated experimentally with measured data at the field-scale. Results from field-scale measurements rarely contain all the information required for the assessment of the proposed matching procedure. Nevertheless, measurements of total aerodynamic and surface resistances reported by Sun [1982], Camillo and Gurney [1986], Passerat de Silans [1986], and Kondo et al. [1990] for bare sandy soil under the unstable atmospheric condition (with mean surface and air temperatures estimated as 298 and 293 K, respectively, and mean wind speed of 2 m/s) contain most of the required input parameters for evaluation of the reconciled formulation. In the absence of detailed information on the soil pore size and its distribution (P and n ), and on the atmospheric stability conditions (ξ ), we considered a practical range of parameters as (P 0.3= mm and 2.5n = ) and (P 0.1= mm and 2.0n = ) for a coarse and fine sandy soil surface, respectively, and 0.01ξ = − to -2 for unstable atmospheric conditions. We note that measured resistances in s/m were converted to evaporation fluxes in mm/day through
,24 3600 ( )a t sE C R r= × × ∆ + with C∆ in kg/m3.

Chapter 6 127
Figure 6.4: Comparison between evaporation rates from drying soil surfaces estimated by the physically based reconciled method (solid and dashed lines) and reported field measurements (symbols) for a range of surface and meteorological conditions. The soil surface was assumed to be sandy with a coarse (P 0.3= mm and
2.5n = —thick lines) and fine ( P 0.1= mm and 2.0n = —thin lines) texture with 298sT = K. Mean atmospheric properties were estimated as: 2U∞ = m/s, 293T∞ =
K, and 30RH = % (measured at a height 2z = m) with mildly unstable atmospheric conditions 0.01ξ = − (solid lines) and highly unstable atmospheric conditions 2ξ = − (dashed lines). Note that the measured evaporation rates in mm/day were obtained from measured aerodynamic and surface resistances through
,24 3600 ( )a t sE C R r= × × ∆ + with C∆ in kg/m3 and ,a tR and sr in s/m.
Results depicted in Figure 6.4 reveal that the overall pattern of the measurements is very well captured by the resulting model estimates (Eq. (6.13)) for the prescribed surface and aerodynamic BCs. Independently measured data are bounded by the reconciled model estimates obtained for (practical) extreme ranges of surface and atmospheric conditions. The results illustrate potential joint effects of soil type (P and n ) and atmospheric stability (ξ ) on the pattern of evaporative fluxes during surface drying such that individual measurements could be captured by the reconciled model provided adequate information regarding these parameters are available. We note that the relatively large discrepancies observed at very low surface water contents between model estimates and data reported by Camillo and Gurney [1986] could be related to the fact that the newly reconciled model was

128 Reconciled surface BL- and MOST-based estimates developed for stage-I evaporation while measurements may include part of diffusive vapor fluxes of stage-II evaporation (after the topsoil was dry).
6.4 Summary and Conclusions
The well-established flux-profile methods do not explicitly consider surface interactions (other than through empirical resistance terms), whereas surface BL-based approach ignores atmospheric stability conditions that affect conditions at the top of the viscous sublayer. Since both methods should estimate the same fluxes for quasi-steady-state conditions, we propose a procedure for reconciling the two formulations by improving their respective lower and top BCs when applied to drying bare soil surfaces. A procedure for improving the lower BC for the MOST-based approach is based on the surface BL-based formulation that explicitly considers surface parameterization and effects of turbulence intermittency. In turn, atmospheric stability considerations from MOST formalism are incorporated to improve surface BL-based estimates.
Equation (13) is the main result of this study, reflecting the adjustments of the lower and top BCs for the MOST- and surface BL-based methods. The flux reconciliation procedure ensures consistent fluxes from bare soil surfaces and represents surface dynamics as shown in Figures 6.2 and 6.3 used for evaporation rates from typical bare soil surfaces across a wide range of practical surface and airflow parameters. We also applied the procedure to field measurements from different sources yielding improved estimates (Figure 6.4) and inspiring confidence in the method for practical applications. In addition to the parametric reconciled formulation in Eq. (6.13) applicable for aerodynamically smooth surfaces (
0 1vz δ ≤ ), we proposed a second (numerically solvable) reconciliation procedure (Eq. (A.7)) with no limitations to the ratio 0vz δ that considers water vapor density adjustments at the top of the viscous sublayer by turbulent renewal eddies.
Additional tests are required to assess the general usefulness of the proposed approach for natural surfaces under field conditions; nevertheless, the surface-profile matching approach offers physically consistent incorporation of atmospheric conditions into surface-based methods including those based on surface thermal signatures [e.g., Qiu and Zhao, 2010; Aminzadeh and Or, 2014]. Similarly, the approach offers a means for consistent and physically based inclusion of bare soil surface characteristics and effects of surface drying into the widely used MOST-based methods. While the primary focus of the study was on evaporative fluxes from bare soil surfaces, the analysis is easily extendable to sensible heat fluxes over

Chapter 6 129 dry surfaces using similar reconciliation concepts.
Appendix A: Eddy Renewal and Water Vapor Density Dynamics at the Top of the Viscous Sublayer
As discussed in section 6.2.1, the SR formulation of Haghighi and Or [2013] assumes that air water vapor density in the newly introduced renewal eddy is that of the well-mixed free stream measured away from evaporating bare soil surfaces (i.e.,
( ) ( )C C zδ = ). However, such a simplistic assumption (applicable for laboratory-scale applications [e.g., Shahraeeni et al., 2012; Aminzadeh and Or, 2013]) is likely to introduce errors into flux estimates for large scales of interest and for different atmospheric stability conditions where water vapor density profiles deduced by MOST are known to vary with height and atmospheric stability [Brutsaert, 1982], thus needs to be accounted for.
Based on concepts from the SR theory that considers eddies carrying different “mean” properties (e.g., water vapor density) during their sweep from a measurement height z down to an ejection point (border of the induced boundary layer thickness iδ ), local variations in the viscous sublayer thickness iδ (m) and accordingly in the flow properties overlaying this boundary are associated to vertical motions of turbulent eddies (sweep and ejection events). Thus, an estimate for local air water vapor density at the top of the viscous sublayer as ( )i iC Cδ = can be obtained from (using Eq. (6.3))
0*
0 00
1 ( ) ( )
ln ln1( ) 1 ( )
i
i
z
i vi v
ii
zv vsv sv
i i
EC C z dz C zz a ku
zzz z
dzz z
δ
δ
δ
δδ
ξ ξδ δ
= = − ×−
− Ψ + − − Ψ − −
∫
∫ (A.1)
where iδ (m) is the instantaneous viscous sublayer thickness induced by the i th eddy that could be estimated as [Haghighi and Or, 2013]
i icδ ν τ= (A.2)
with 2.2c = a proportionality constant depending on flow geometry [Meek and Baer, 1970, 1973], and iτ (s) the residence time of the i th eddy.
Considering the stability function ( )sv ξΨ defined in Eq. (6.3), the evaluation of the

130 Reconciled surface BL- and MOST-based estimates integral term on the RHS of Eq. (A.1) is dependent on the range of the lower (
i i Lδξ δ= ) and upper ( z Lξ = ) bounds such that it could be evaluated over either a single interval or multiple intervals through splitting the integrand, as
( ) ( ) ( )i i
z x z
sv sv svxdz z L dz z L dz
δ δξΨ = Ψ + Ψ∫ ∫ ∫ (A.3)
Combining Eqs. (6.3) and (A.1), we eliminate the evaporation flux between the two equations and obtain the ratio of mean eddy vapor density to that at the measurement height as
0( )(1 )
( ) ( )i v
i i
C C zC z C z
= − Φ + Φ if ( ) 0C z ≠ (A.4)
where
0 00
00
ln ln1( ) 1 ( )
ln ( ) ( )
i
ii
zv vsv sv
i ii
sv svv
zzz z
dzz zzz
δ
δδ
ξ ξδ δ
ξ ξ
−
Ψ + − − Ψ− −
Φ =
− Ψ + Ψ
∫
(A.5)
Figure A.1 shows the results obtained for a single eddy with mean properties (i.e.,
iδ δ= ) that represent variations in the ratio ( )iC C z with the atmospheric stability conditions (ξ ) and the ratio of extrapolated to free stream water vapor density 0( ) ( )vC z C z for a constant measurement height at 2z = m. The results reveal considerable improvements in the assumption of ( ) ( ) 1C C zδ = especially for stable atmospheric conditions ( 0ξ > ) where the assumption strongly deviates from unity. Nevertheless, the results show that such an assumption becomes more evident for low water vapor gradient and unstable atmospheric conditions where turbulence intensity and vertical eddy exchanges are enhanced (similar to the results shown in Figure 6.3).

Chapter 6 131
Figure A.1: Variations in the newly modified top water vapor density BC at the border of the viscous sublayer adjusted by eddy renewal ( ( )C C δ= ) with atmospheric stability conditions (ξ ) and the ratio 0( ) ( )vC z C z .
Combining Eqs. (A.4) and (6.5), instantaneous evaporation flux into the i th eddy can be obtained from the modified surface BL-based formulation as
P ( )4 ( )
s ii
i surf
surf
C CE
fK D
δ θγθ
−=
++
(A.6)
Invoking concepts from the SR theory, the expected value of water vapor flux over all eddy replacements (average surface vapor flux) is obtained from [Brutsaert, 1975b; Haghighi and Or, 2013]
, 0 0
( )( ) ( )
( ) P ( )4 ( )
s irec phys i
i surf
surf
C CE E d d
fK D
τφ τ τ φ τ τ
δ τ θγθ
∞ ∞ −= =
++
∫ ∫ (A.7)
where ( )φ τ is the eddy residence time distribution expressed by the gamma statistical distribution as [Danckwerts, 1951; Brutsaert, 1975b; Seo and Lee, 1988]
1
( ) exp( )( 1)
ααβφ τ τ βτ
α
+
= −Γ +
(A.8)

132 Reconciled surface BL- and MOST-based estimates
1αβτ+
=
with 2*300 uτ ν≈ (s) the mean residence time of the eddy spectrum [Haghighi and
Or, 2013].
Given the same prescribed airflow and surface conditions as in Figure 6.3, numerical evaluation of Eq. (A.7) (using the Simpson’s rule) yields the mean evaporation flux with results presented in Figure A.2. The results reveal the good performance of the second reconciliation procedure introduced in Eq. (A.7) that considers eddy renewal adjustments of water vapor density at the top of the viscous sublayer (Eq. (A.4)) and reproduces reasonably well the reconciled results shown in Figure 6.3.
Figure A.2: Comparison between evaporation rates estimated by the surface BL approach (dashed line) in Eq. (6.13), and the first (solid line) and second (dash-dot line) newly proposed reconciliation procedures defined in Eqs. (6.5) and (A.7), respectively. The results were obtained for a typical sandy soil ( P 0.2= mm and
2.0n = ) exposed to low wind ( 0 0.2vz δ = —thin lines) and high wind ( 0 0.8vz δ = —thick lines) speeds under (a) unstable ( 1ξ = − , 298sT = K, ( ) 293T z = K) and (b) stable ( 1ξ = + , 288sT = K, ( ) 293T z = K) atmospheric conditions with 2z = m and 30RH = %. The results reveal that the second reconciliation procedure introduced in Eq. (A.7) considering eddy-induced water vapor density dynamics at the border of the viscous sublayer reproduces reasonably well the reconciled results presented in Figure 6.3.
Acknowledgements
The authors gratefully acknowledge funding by the Swiss National Science Foundation of the project “Evaporation from terrestrial surfaces – linking pore scale phenomena with landscape processes” (200021-113442) and the financial support of

Chapter 6 133 the German Research Foundation DFG of the project “Multi-Scale Interfaces in Unsaturated Soil” (MUSIS; FOR 1083).

Chapter 7
Evaporation from Wavy Porous Surfaces into Turbulent Airflows1
Abstract: The relief and roughness of natural surfaces interacting with airflows and with radiation affect rates and distributions of heat and vapor fluxes into the atmosphere. The study quantifies interactions of regular sinusoidal wavy porous surfaces (with different geometrical characteristics) affecting heat and vapor transport into prescribed turbulent airflows. A model for turbulent eddies interacting with an undulating evaporating surface with mean boundary layer that varies across sinusoidal wavy surfaces was developed and experimentally evaluated in a wind tunnel. The surface of a 1 m2 shallow (0.3 m deep) sand-filled basin was imprinted with regular sinusoidal ridges and troughs, water content and temperature sensors were embedded in the sand, and the instrumented basin was placed on a balance in the wind tunnel. Detailed thermal signatures of the evaporating surface for different wind speeds and surface patterns were obtained using high resolution infrared thermography. The evaporative mass loss measurements and observed thermal patterns were in good agreement with model predictions for turbulent exchange over various wavy surface geometries. Results suggest that evaporative fluxes can be either enhanced or suppressed (relative to a flat surface) due to complex interplay between local boundary layer thickness and internal limitations to water flow to the evaporating surface. For a practical range of air velocities (0.5 to 4.0 m/s), and for sinusoidal configurations studied (amplitudes of 50 to 100 mm), the evaporative mass loss (relative to the flat surface) was reduced by up to 60% for low surface aspect ratio and high wind velocity, and enhanced by up to 80% for high aspect ratio and low wind velocity. The study offers a framework for interpreting and upscaling evaporative fluxes from rough terrestrial surfaces. Ongoing work considers shortwave radiation and geometrical interactions for a more complete account of surface energy balance and
1published as: Haghighi, E., and D. Or (2015), Evaporation from wavy porous surfaces into turbulent airflows, Transp. Porous Med., doi:10.1007/s11242-015-0512-y.

Chapter 7 135 fluxes from natural rough surfaces.
7.1 Introduction
The relief and roughness of natural soil surfaces is manifested across many scales and affect many land-atmosphere interactions [Jalota and Prihar, 1990; Raupach et al., 1992; McInnes et al., 1994; Raupach and Finnigan, 1997]. We distinguish between surface roughness that refers to microrelief of soil surfaces due to variations and arrangement of soil aggregates [Lehrsch et al., 1987; Guzha, 2004] from the general relief of a surface that represents topographical structures that are many times larger than soil aggregates. Studies of heat and mass transfer from terrestrial surfaces have shown that land relief and surface roughness may affect the surface reflectively (albedo) hence the amount of shortwave radiation absorbed at the surface [Bowers and Hanks, 1965; Potter et al., 1987; Raupach and Finnigan, 1997; Matthias et al., 2000; Cierniewski et al., 2014]. Surface roughness and relief have also been shown to act as momentum sinks for the atmospheric flows [Raupach, 1992] affecting the aerodynamic boundary layer and turbulent interactions adjacent to the surface [Perry et al., 1969; Taylor and Gent, 1974; Finnigan, 1988; Wieringa, 1993; Raupach and Finnigan, 1997]. Such effects of surface geometrical irregularities on incoming shortwave radiation and on aerodynamic boundary layer near the surface, in turn, affect exchange of energy, water, and momentum between land surfaces and the atmosphere [Jalota and Prihar, 1990; Raupach et al., 1992; McInnes et al., 1994; Raupach and Finnigan, 1997].
A simple example of terrestrial surfaces with regular variations in surface relief are agricultural ridge-furrow surfaces that have been known to affect aerodynamic properties, and heat and vapor exchange dynamics at the surface [Potter et al., 1987; Jalota and Prihar, 1990; McInnes et al., 1994]. Studies have shown that short-term evaporation rates increase over such (wavy) soil surfaces (relative to a similar untilled surface) [Holmes et al., 1960; Allmaras et al., 1972; Jalota and Prihar, 1990] whereas longer term evaporation rates exhibited a decrease [Willis and Bond, 1971; Gill et al., 1977; Jalota and Prihar, 1990]. Under certain conditions surface tillage has been used to conserve water, but it may also enhance evaporation and thus accelerate soil drying [Jalota and Prihar, 1990; Unger and Cassel, 1991; Schwartz et al., 2010]. These seemingly inconsistent effects point to the complexity and modifications of surface geometrical features on interactions that are otherwise reasonably well understood for flat and smooth surfaces.

136 Turbulent evaporation from wavy porous surfaces
Figure 7.1: Schematic of pore-scale evaporation from a sinusoidal wavy porous surface
(characterized by wave amplitude 2γ and wavelength λ ), in the presence of a shallow water table,
into a turbulent airflow boundary layer. At aspect ratios ( 2γ λ ) larger than 0.03, airflow boundary
layer detaches wavy surfaces of heights larger than the viscous sublayer thickness ( 12δ γ < ), and a
separated flow region forms in the wake of ridges when the bulk flow is perpendicular to the direction
of ridges. Local evaporative fluxes from the surface are affected by spatial variations of (1) internal soil
hydraulic properties reflected in surface water content and ridges surface decoupling from the water
table below and (2) external airflow boundary layer dynamics that locally vary along the wavy surface.
Ua, Ta
H(x) λ/2
2γ
Ts
Separation Zone Reattachmen
z
x
ZT
Hwt

Chapter 7 137 Notwithstanding the large number of experimental studies on interactions influencing heat and mass exchange from tilled soil surfaces [e.g., Jalota and Prihar, 1990; Unger and Cassel, 1991; McInnes et al., 1994], there are only a handful of mechanistic models that systematically account for interactions among key processes [Linden, 1982; Bristow et al., 1986; Yang et al., 1996; Mwendera and Feyen, 1997]. The primary objective of this study was to develop a simple and physically based model for quantifying evaporation from sinusoidal wavy porous surfaces during stage-I evaporation. The model considers sinusoidal surfaces characterized by wave amplitude (2γ ) and wavelength (λ ), and the effects of various physical processes that influence evaporative fluxes and surface temperatures (see Figure 7.1).
Soil evaporation during stage-I may be limited by internal transport properties that affect water supply to the vaporization plane at the surface [van Brakel, 1980; Prat, 2002; Lehmann et al., 2008; Shokri et al., 2010; Haghighi et al., 2013]; or by available energy at the surface [Penman, 1948]; and by mass exchange resistance across a thin boundary layer adjacent to the surface (termed the viscous sublayer) where exchange rates are dominated by molecular diffusion [Oke, 1978; Schlünder, 1988; Shahraeeni et al., 2012; Haghighi et al., 2013]. In recently-established pore-scale models for evaporation from flat (and smooth) porous surfaces exposed to a convective air boundary layer, diffusive fluxes across the viscous sublayer were calculated by explicit incorporation of the dynamic resistance due to changes in surface water content and capillary connections to the subsurface [Shahraeeni et al., 2012; Haghighi et al., 2013]. Additionally, airflow turbulence and its impacts on the viscous sublayer thickness were incorporated via the surface renewal (SR) formalism [Higbie, 1935; Danckwerts, 1951; Harriott, 1962] considering surface-eddy exchange during an eddy’s residence time over a surface [Haghighi and Or, 2013].
We seek to integrate effects of wavy surface attributes on surface wetness and on the aerodynamic boundary layer forming adjacent to an evaporating surface. Hence, the specific objectives of this study were to: (1) extend the evaporation model of Haghighi et al. [2013] for turbulent interactions with wavy porous surfaces considering renewal eddy characteristics and mean viscous sublayer variations across the wavy surface (see Figure 7.2); (2) experimentally test the model by systematically varying wavy surface attributes in evaporation experiments in a wind tunnel; and (3) express the effective behavior of surface waviness on evaporative fluxes relative to flat surfaces under similar boundary conditions.

Figure 7.2: Representation of an evaporating wavy surface building block as a collection of individual flat-surface evaporating sites with associated internal and external boundary conditions (note that dimensions are not to scale). Evaporative fluxes from each flat-surface unit cell could be estimated from surface resistance model of Haghighi et al. [2013] coupled with concepts from the SR theory [Haghighi and Or, 2013]. These local evaporative fluxes are averaged over the entire surface yielding mean evaporation flux from the wavy surface building block.
Separation Zone Reattachment
0.1
0.6
x/λ=0.0
1.0
δ(x)
dx
δ(x/λ)
H(x/λ)
RBL
Rsv
δi

Chapter 7 139 Following this introduction, we present in section 7.2 theoretical background and modeling details for coupling pore-scale evaporation from wavy porous surfaces with a collection of individual eddies forming the interacting turbulent airflow. Section 7.3 is devoted to describing experimental setup used for evaluating the proposed model by first considering surface thermal patterns observable by infrared thermography (IRT), and then mass loss measurements. Preliminary experimental results and model verifications are presented in section 7.4, followed by summary and concluding remarks in section 7.5.
7.2 Modeling Evaporation from Wavy Porous Surfaces
Studies have shown that local and mean evaporative fluxes from wet porous surfaces are constrained by hydration condition and transport properties of the porous medium, and by vapor transport across the air viscous sublayer adjacent to the surface [Schlünder, 1988; Lehmann et al., 2008; Shahraeeni et al., 2012; Haghighi et al., 2013]. Thus, understanding effects of surface relief on subsurface hydrologic processes and on interacting airflows is essential for parameterization of momentum, heat and mass transfer processes from wet surfaces to the airflow. Waviness is the measure of surface relief at scales and spacing much greater than surface grain and other roughness elements that does not behave like a surface roughness in a traditional sense [Schultz and Flack, 2009]. We characterize regular surface waviness by an aspect ratio 2γ λ (-) with wave amplitude 2γ (m) and wavelength λ (m) (see Figure 7.1).
For a prescribed wavy surface of wavelength λ , the variations in wave amplitude 2γ or its aspect ratio (2γ λ ) can significantly affect the behavior of a turbulent airflow boundary layer perpendicular to the direction of ridges [Bradshaw, 1973; Zilker and Hanratty, 1979; Buckles et al., 1984; Baskaran et al., 1987]. The magnitude of this effect depends on the ratio of the upwind shear layer thickness (
0xδ = , defined in section 7.2.1 below) to the wave amplitude (2γ ) [Baskaran et al., 1987] such that for a ratio 2 1δ γ < flow separates due to a strong adverse pressure gradient established in the lee of the ridges [Baskaran et al., 1987; Almeida et al., 1993; Raupach and Finnigan, 1997]. According to Simpson [1989], the flow separation is defined as the complete process of departure, detachment or breakdown of the boundary-layer flow. The detachment is accompanied by a sudden thickening of the rotational flow near the wall and by large values of the normal component of the velocity at the wall. For conditions with 2 1δ γ > (very low wind speeds or low amplitude surface relief) the airflow traces the surface and boundary layer separation does not occur [Baskaran et al., 1987; Almeida et al., 1993].

140 Turbulent evaporation from wavy porous surfaces For sufficiently high wind velocity, a new condition (in addition to 2 1δ γ < ) stipulates that a surface aspect ratio 2γ λ larger than 0.03 is required for flow separation [Zilker and Hanratty, 1977, 1979]. Studies of steady turbulent flows (where mean turbulence characteristics remain constant with time) have shown that for wavy surfaces with aspect ratios larger than 0.03, the boundary layer detaches and results in separated flow regions in the wake of ridges [Zilker and Hanratty, 1977, 1979]. For a wide range of Reynolds numbers and surface wave geometry, experimental and numerical studies have shown that flow transverse to a smooth wavy surface separates near 0.1sx λ= and reattaches near 0.6rx λ= [Buckles et al., 1984; Almeida et al., 1993; Maaß and Schumann, 1996; Kruse et al., 2006; Wagner et al., 2011]. A similar pattern of wavy surface influence on airflow interactions (expressed in terms of boundary layer resistance) was deduced from observations over wavy bare soil surfaces subjected to natural air boundary layer [McInnes et al., 1994]. Considering that for many natural surfaces, the ratio 2γ λ is often greater than 0.1, it is reasonable to expect the zones of separated and reattached airflows to form between ridges for airflows perpendicular to the ridge orientation (Figure 7.1).
In addition to effects on airflow conditions and the patterns of aerodynamic boundary layer near the surface, surface attributes may influence local hydrological interactions affecting surface water content distribution along a wavy porous surface. During stage-I evaporation water is supplied to the evaporation plane at the surface via continuous liquid pathways driven by capillary gradients acting against gravitational pull and viscous resistance [Yiotis et al., 2001; Lehmann et al., 2008; Shokri et al., 2010]. Modifying aerodynamic boundary layer and thus evaporative fluxes, surface waviness affects the initial hydrostatic conditions influencing dynamic conditions. These local effects may alter the competition between capillary, gravity, and viscous effects that, in turn, affects local distribution of surface water content and resulting evaporative fluxes.
In the following, we first describe how the local viscous sublayer thickness, as a key variable that determines the upper boundary condition for diffusive heat and mass exchange [Gaikovich, 2000; Shahraeeni et al., 2012; Haghighi and Or, 2013], is affected along a prescribed wavy geometry (section 7.2.1). This localized parameterization of the boundary layer is then applied to the pore-scale diffusion model to quantify local (and mean) evaporation rates (sections 7.2.2 and 7.2.3). We extend the diffusion-based resistance model of Haghighi et al. [2013] coupled with concepts from the SR theory [Brutsaert, 1975a; Haghighi and Or, 2013] by

Chapter 7 141 incorporating the role of wavy surface variables on the localization of the viscous sublayer thickness and on capillary water flow to the evaporating surface at the pore-scale, as depicted in Figure 7.2. Notwithstanding potential effects of surface roughness on the dynamics of boundary layer separation along a bare tilled soil surface, the boundary layer separation and reattachment points are assumed to follow a similar pattern as for smooth surfaces [McInnes et al., 1994]. We also neglect potential effects of wind penetration into evaporating porous surfaces, simply because water-filled pores during stage-I evaporation would suppress such convection into the porous medium [Kimball and Lemon, 1971; Massman et al., 1997], and the permeability Reynolds number ReK (the ratio of effective pore diameter to typical thickness of the viscous sublayer) [Breugem et al., 2006] is negligibly small. Typical turbulent airflows with millimetric viscous sublayer [Haghighi and Or, 2013] over soil surfaces of micrometric pore sizes would result in a negligibly small ReK , with practically impervious surfaces [Breugem et al., 2006]. We defer the treatment of shortwave radiation and associated geometrical interactions on localized surface energy balance to future studies, and focus here on laboratory-scale experiments in the absence of shortwave radiation.
7.2.1 Local Variations of the Viscous Sublayer Thickness along a Wavy Surface
As discussed in the previous section, turbulent airflow over a wavy surface (at the scale of hydrological interest here) is characterized by flow separation and reattachment, and the formation of a recirculation zone (Figures 7.1 and 7.2) [Zilker and Hanratty, 1979; Buckles et al., 1984; Cherukat et al., 1998; Wagner et al., 2011]. The resulting separation zone modifies the local nature of the wind stress and accordingly local heat and mass exchange rates from the wavy surface (Figure 7.3) [McInnes et al., 1994; Reul et al., 2008; Wagner et al., 2011; Mirzaei et al., 2013]. A typical numerical simulation of evaporation from a fully saturated wavy surface (no internal flow limitations) as depicted in Figure 7.3 reveals effects of variations in viscous sublayer thickness across the wavy surface on local variations in evaporative fluxes. The reduced vapor concentration gradient (dC dz ) observed over the separation zone suppresses local evaporative fluxes that could be accounted for by a thicker viscous sublayer thickness (relative to the reattachment zone) resulting from the boundary layer separation.

142 Turbulent evaporation from wavy porous surfaces
Figure 7.3: Contribution of airflow boundary layer dynamics over a fully saturated wavy porous surface (with ( ) 0H x = below the surface) to local evaporative fluxes from the surface. Evaporative fluxes are controlled solely by aerodynamic properties parameterized by the viscous sublayer thickness (δ ) such that airflow separation modifies local heat and mass exchange rates relative to a corresponding flat surface (indicated by the dashed line). The insets show a typical water vapor concentration field and a corresponding diffusive flux distribution adjacent to the wavy surface obtained from RANS simulation of turbulent water vapor transfer using COMSOL Multiphysics.
Invoking concepts from the SR formalism, turbulent airflow interactions are considered by averaging the effects of eddies over their sizes and intensities in the population [Harriott, 1962; Brutsaert, 1975a; Haghighi and Or, 2013]. A characteristic viscous sublayer forms under each eddy that provides boundary conditions for vapor and heat transfer (see Figure 7.2) [Gaikovich, 2000; Haghighi and Or, 2013, 2015a]. Motivated by Meek and Baer’s [1970, 1973] study, Haghighi and Or [2013] have estimated the thickness of the viscous sublayer forming below an eddy’s footprint, iδ (m), over a flat surface as a function of eddy residence time,
iτ (s), as (Figure 7.2)
1i ic v tδ = (7.1)
Ua, Ta
Low
High
Concentration Field Diffusive Fluxes
BL Separation Flux Suppression

Chapter 7 143 where 1 2.2c = is a proportionality constant depending on flow geometry [Popovich and Hummel, 1967; Meek and Baer, 1973; Tuoc and Keey, 1992; Haghighi and Or, 2013], v (m2/s) is the kinematic viscosity of air ( 61.5 10−× m2/s), and it (s) is the residence time of the i th eddy. Considering an eddy residence time distribution (parametrically expressed by the gamma statistical distribution [Danckwerts, 1951; Seo and Lee, 1988]), an effective viscous sublayer thickness as a function of turbulent flow characteristics that explicitly considers the influence of the eddy distribution on mass exchange processes is established according to (see Figure 7.2) [Haghighi and Or, 2013]
( ) ( 1)0.3 a
v gU
δ α α= ⋅ + (7.2)
where aU (m/s) is the mean ambient velocity, α (-) is the shape parameter of eddy residence time distribution ranging from 0 to 2 for a range of practical airflow conditions interacting with flat (and smooth) surfaces [Haghighi and Or, 2013, 2015a], and ( )g α is obtained from [Haghighi and Or, 2013]
( 1)
1 02.2 112 1( )( 1) (2 1) 02 1
gα
απαα α αα+
== ⋅ Γ + Π + >+ (7.3a)
(2 1) (2 1) (2( 1) 1) (2( 2) 1) ... (2( ) 1)mα α α α αΠ + = + ⋅ − + ⋅ − + ⋅ ⋅ − + (7.3b) with m α< (-) the largest integer smaller than α .
The parametric viscous sublayer model above, established for flat surfaces, was extended to consider local interactions of the viscous sublayer thickness along a wavy surface for mean airflow perpendicular to the ridges. The model extension considers a separated flow region underlain by spanwise oriented large eddies with the reattachment zone experiencing a turbulent regime dominated by small scale streamwise eddies [Wagner et al., 2011], as depicted in Figures 7.1 and 7.2. Employing Eq. (7.2) that defines the mean viscous sublayer thickness above a single flat-surface unit cell forming the wavy surface (see Figure 7.2), the expressions for the resulting mean boundary layer thickness at the various regions of a wavy surface element are given as follow

144 Turbulent evaporation from wavy porous surfaces
2 3
( ) ( 1) 0.0 0.10.3
( ) ( ) ( 1) 0.1 0.60.3
0.6 1.0
a
s sa
v g xUvx g xUxc c x
α α λ
δ λ α α λ
λλ
⋅ + ≤ <
= ⋅ + ≤ ≤
+ < ≤
(7.4a)
2
3 2
( ) ( 1) ( ) ( 1)0.3 1 0.6
( ) ( 1)0.3
s s
a
a
g gvcUvc g cU
α α α α
α α
⋅ + − ⋅ +=
−
= ⋅ + − (7.4b)
The expressions in Eq. (7.4) are in the core of this study where we capitalize on the average and scalable behavior of separation and reattachment zones over wavy surfaces to derive analytical expressions for the spatially resolved boundary layer thickness. The simplification implicit in the linear variation of the mean viscous sublayer thickness over the reattachment zone (0.6 1.0x λ< ≤ ) was inspired by the results of McInnes et al. [1994] that observed a similar behavior in aerodynamic conductance along a wavy bare soil surface. Additionally, we assume that sα α> in Eq. (7.4) refers to the shape parameter of the eddy distribution that forms the recirculating airflow within the separation zone. According to Haghighi and Or [2013], a turbulent regime characterized by a larger shape parameter α is dominated by larger eddies (with longer residence time) inducing a thicker viscous sublayer (relative to smaller scale eddies) for a constant mean airflow velocity.
A comparison of the predicted variations in the viscous sublayer thickness (Eq. (7.4)) with the aerodynamic conductance data measured over a ridge-furrow bare soil by McInnes et al. [1994] is shown in Figure 7.4. The results reveal that the overall pattern of the variations of the viscous sublayer thickness along the wavy surface (in x-direction) for two different wind directions of perpendicular (Figure 7.4a) and parallel (Figure 7.4b) to the direction of ridges is represented reasonably well by the proposed model in Eq. (7.4). The thicker boundary layer observed (and predicted) above the separation zone implies a higher aerodynamic resistance to heat and mass fluxes [Schlünder, 1988; Shahraeeni et al., 2012; Haghighi et al., 2013] and reaffirms the surface flux suppression beneath the separation region compared to the reattachment zone (Figure 7.3) [McInnes et al., 1994; Wagner et al., 2011; Mirzaei et al., 2013].

Chapter 7 145
Figure 7.4: Comparison of predicted (lines) and measured (symbols) variations in the viscous sublayer thickness along a wavy surface (in x-direction) when wind direction is in (a) x-direction and (b) y-direction. Measured data were extracted from the aerodynamic conductance ( hg ) measurements along a wavy bare soil by McInnes et al. [1994] as a a p hK c gδ ρ= with aK (W/mK), aρ (kg/m3), and pc(J/kgK) the thermal conductivity, density, and specific heat capacity of air, respectively. The comparisons shown in (a) and (b) were obtained, respectively, for ( 4aU = m/s, 2α = , 3sα = ) and ( 3aU = m/s, 2α = ). For the condition that the wind direction is parallel to the ridge direction (y-direction), airflow dynamics over the wavy surface is similar to that over a flat surface (no separation) so viscous sublayer thickness is constant along the surface and equals to 0xδ = .
7.2.2 Local Evaporative Fluxes along a Wavy Porous Surface
Approximation of the wavy porous surface by equivalent localized aerodynamic and subsurface boundary conditions enables application of pore-scale model elements previously developed for flat evaporating porous surfaces [Shahraeeni et al., 2012;
x
y z

146 Turbulent evaporation from wavy porous surfaces Haghighi et al., 2013; Haghighi and Or, 2013]. In the following, we describe the physical model that is schematically illustrated in Figure 7.2.
7.2.2.1 Resistances to Evaporative Fluxes from Porous Surfaces
Lumped or equivalent resistances to scalar transport to/from land surfaces are often used to express various surface-atmosphere exchange processes. Specifically, water vapor transport from evaporating porous surfaces across the adjacent viscous sublayer is governed by molecular diffusion with resistances varying with boundary layer characteristics, surface water content, and soil type [Bange, 1954; Cooke, 1967; Schlünder, 1988, Haghighi et al., 2013]. Evaporation from drying porous surfaces (during stage-I) is quantified as a superposition of diffusion solutions from interacting pores supplied by viscous flow from a receding drying front. Haghighi et al. [2013] formulated a generalized top boundary condition for the effective resistance to evaporation considering: (1) a boundary layer resistance ( BLR ) that accounts for nonlinear diffusive interactions between surface wetness (pore spacing) and the viscous sublayer thickness, and (2) an internal capillary-viscous resistance (
svR ) to unsaturated capillary flow towards the surface that varies with saturation (Figure 7.2). As the topsoil dries out, the internal viscous resistance to water supply from the drying front beneath an evaporating surface becomes dominant [Haghighi et al., 2013].
Considering the two resistances in series, evaporation flux, E (kg/m2s), across the viscous sublayer is expressed (in the form of the Ohm’s law) as [Haghighi et al., 2013]
( )( ) ( )BL sv
CE xR x R x
λλ λ∆
=+
(7.5)
where s aC C C∆ = − (kg/m3) is the water vapor concentration difference at an evaporating pore surface (assumed saturated at the surface temperature) and in the air above the viscous sublayer obtained from
( ) ( )w sat s sat a
s a
M P T P TC RH
T T
∆ = − ℜ (7.6)
where, wM (kg/mol) is the molar mass of water (0.018 kg/mol), ℜ (J/mol K) is the universal gas constant (8.314 J/mol K), sT and aT (K) are the surface and air temperatures, respectively, RH (-) is the air relative humidity, and satP (Pa) is the vapor pressure at the liquid surface, assumed to be the saturation vapor pressure at

Chapter 7 147 the surface temperature [Hartmann, 1994]. Assuming a fully mixed turbulence above the viscous sublayer [Haghighi and Or, 2013], we do not consider likely effects of atmospheric stability in this study (with small scale laboratory-scale experiments) that are known to affect vapor concentration difference at large scales of interest [Haghighi and Or, 2015b].
Considering dominant contribution of diffusion to evaporation from porous surfaces for a practical range of surface and airflow conditions, and availability of simple analytical diffusion solutions [Schlünder, 1988], Haghighi et al. [2013] proposed simple and physically based analytical expressions for the boundary layer ( BLR ) and internal capillary-viscous ( svR ) resistances as functions of viscous sublayer thickness, surface water content, and mean (effective) pore size as
( ) ( )( ) surf
BL
x rfR x
Dδ λ θ
λ+
= (7.7)
4( )( )sv
eff surf
cR x
Kλ
θ= (7.8)
where D (m2/s) is the water vapor diffusion coefficient in air ( 52.5 10−≈ × m2/s), r (m) is the mean pore radius, 5
4 1.73 10c −= × (-) is a proportionality constant that reconciles units (considering SI units) for capillary liquid to vapor fluxes [Haghighi et al., 2013], surfθ (-) is the surface water content, ( )surff θ is a surface wetness-depended function obtained from the diffusion model of Schlünder [1988] as
1( ) 14surf
surfsurf
f πθθπθ
= −
(7.9)
This function accounts for the nonlinear diffusive interactions as the surface dries and spacing between remaining evaporating pores increases [Shahraeeni et al., 2012], and ( )eff surfK Kχ θ= (m/s) is the effective hydraulic conductivity of the unsaturated region (above the receding drying front). The coefficient χ (-) governs capillary flow between the drying front and the surface, it ranges between 1 and 5 as the surface evolves from fully saturated to dry [Haghighi et al., 2013]. The unsaturated hydraulic conductivity function ( )surfK θ is expressed as a function of surface water content as [Mualem, 1976; van Genuchten, 1986]

148 Turbulent evaporation from wavy porous surfaces
( )21 1/1/(1 1/ )( ) 1 1
nnsurf s surf surfK K τθ
−− = Θ − − Θ
(7.10)
where surf rsurf
s r
θ θ
θ θ
−Θ =
− is the effective surface water saturation with rθ (-) the
residual water content, sθ (-) the saturated water content (≈ sand porosity), n (-) the pore size distribution index, τ (-) the tortuosity parameter related to flow path geometry and connectivity (generally set to 0.5 [Mualem, 1976]), and sK (m/s) the saturated hydraulic conductivity. The coefficient 4χ = has been used in this study, numerical results have shown that this value represents a wide range of soil textures and surface water contents where internal capillary-viscous resistance affects transport (i.e., 0.4surfΘ < ) (see Fig. A1 in [Haghighi et al., 2013] for more details).
7.2.2.2 Local Variations of Surface Water Content along Wavy Porous Surfaces
The surface water content is an important variable in Eqs. (7.7) to (7.10), it may vary in time and space and must be determined for model closure. Considering the simple case of evaporation from a partially saturated porous medium supplied by a shallow water table, the surface water content is controlled by the drying front depth H (m) (Figure 7.1). We use the concept of the evaporative characteristic length CH (m) [Lehmann et al., 2008] that determines the extent of the hydraulically connected region between a receding drying front and the evaporating surface. In the experimental part of this study, the “drying front” position is defined by a fixed shallow water table depth, and the water content distribution to the surface follows a quasi-hydrostatic profile [Shokri et al., 2008]. Keeping a water table (or drying front) depth shorter than the evaporative characteristic length for the porous medium ( CH H≤ ) enables an expression of the hydraulically connected surface water content as [Lehmann et al., 2008; Aminzadeh and Or, 2013]
( )1 1surf r
s s C
x HH
θ λ θθ θ
= − −
(7.11)
where H (m) is the drying front depth, that for a wavy surface is obtained from
( ) 1 cos 2 TxH x Zλ γ πλ
= + +
(7.12)
where 2T wtZ H γ= − (m) is the height of the trough above the shallow water table

Chapter 7 149 (Figure 7.1) with wtH (m) the depth of the water table measured from ridges (see Figure 7.1); and
CH (m) is the evaporative characteristic length that determines the deepest water table position before hydraulic connectivity with the evaporating surface above is lost (termed here “surface decoupling”). Following Lehmann et al. [2008], we can introduce the role of viscous resistance that is proportional to surface water content and potential evaporation rate resulting in an effective characteristic length expressed as
( )1
( )
GC o
eff surf
HH x
EK
λ
ρ θ
=+
(7.13)
where GH (m) is the gravity characteristic length ranging from 90 to 150 mm for coarse and fine textured sand media [Lehmann et al., 2008], ρ (kg/m3) the water density ( 1000≈ kg/m3), and oE (kg/m2s) is the potential evaporation flux from a free water surface under similar conditions (providing an upper bound for viscous resistances) that could be estimated from
( )( )
o CE x Dx
λδ λ∆
= (7.14)
For given local variations of surface and aerodynamic properties along a wavy surface, Eqs. (7.11) to (7.14) are solved to estimate local variations of evaporative characteristic length and surface water content along the wavy surface. Note that for fully saturated conditions, ( ) 0H x λ = everywhere below the wavy surface and thus ( )surf sxθ λ θ= (Eq. (7.11)).
7.2.3 Mean Evaporation Flux and Rate from Wavy Porous Surfaces
Combining Eqs. (7.4) to (7.14), we obtain the mean evaporation flux, E (kg/m2s), from the wavy surface representative element (Figures 7.1 and 7.2) as
0 ( ) ( )BL sv
C dxER x R x
λ
λ λ λ∆
=+∫ (7.15)
where ( )BLR x λ and ( )svR x λ are defined in Eqs. (7.7) and (7.8), respectively. Numerical evaluation of Eq. (7.15) using the Simpson’s rule yields the mean evaporation flux from wavy porous surfaces as a function of surface geometry (γ and λ ) whose influences on external aerodynamic and internal porous medium

150 Turbulent evaporation from wavy porous surfaces properties (and accordingly on evaporative fluxes) are embedded in BLR and svR , respectively.
In addition to the estimation of the mean evaporation flux, mean evaporation rate from a representative element of the wavy surface, be (kg/s), is given as
b be E A= ⋅ (7.16) where bA w s= × (m2) is the surface area of the wavy building block with the width w (m) and the length s (m) given according to
2
0
2 21 sins x dxλ πγ π
λ λ
= + ∫ (7.17)
Note that the total mean evaporation rate, e (kg/s), from an evaporating system composed of bN wavy surface building blocks is simply
b be e N= ⋅ (7.18) where bN λ= with (m) the length of the system.
7.3 Experimental Setup for Turbulent Evaporation from Wavy Sand Surfaces
The proposed model was tested using evaporation experiments conducted under controlled boundary conditions in a small wind tunnel (L W×H× : 1.2 1.2 0.2× × m; see Figure 7.5). The wind tunnel was equipped with four blowing fans with built-in straightener grids (TAR/L, LTG Inc., Germany) providing stable airflows over the evaporating surface ( 4 1040× m3/h @ 1050 rpm). A schematic of the experimental setup is illustrated in Figure 7.5.
A sand-filled box (1.0 1.0 0.3× × m) with particle sizes ranging from 0.3 to 0.9 mm ( 0.4sθ = and 2.7n = [Leij et al., 1999]) was used as the evaporating medium. The sand surface was shaped by sinusoidal wavy molds with prescribed amplitudes (2γ ) and wavelengths (λ ). A series of drying experiments were performed for four wavy surface configurations (2γ ,λ ): (50,200), (50,100), (100,200), and (100,100) mm with different number of replicates as 7, 7, 5, and 3 runs, respectively. The sand box was connected to a Mariotte bottle for maintaining a constant water table depth below the surface and thus enabling control and maintenance of constant surface water content (determined based on the depth of the water table and water retention characteristics of the sand). The gravity characteristic length ( GH ) for this sand was approximately 130 mm based on Lehmann et al.’s [2008] approximation. The near surface water content (water content of the top 0-5 cm

Chapter 7 151 soil layer) at different locations below ridges and troughs along wavy sand surfaces was measured and recorded by time domain reflectometry (TDR) method (TDR100, Campbell Scientific Inc., UT, USA).
Figure 7.5: Experimental setup used to study evaporation from wavy sand surfaces into prescribed turbulent airflow regimes: (1) infrared camera; (2) logger for single point (and low frequency) measurement of ambient temperature, velocity, and relative humidity in the middle of the duct tunnel above the test surface; (3) wind production chamber; (4) blowing fans; (5) high-frequency 3D ultrasonic anemometer recording near-surface air velocity field at 30 Hz; (6) a sand-filled box (1.0 1.0 0.3× × m) with particle sizes ranging from 0.3 to 0.9 mm and porosity of 0.4; (7) Mariotte bottle that adjusts water table depth in the soil sample; and (8) balance. The location of TDR probes monitoring and recording spatio-temporal variations of surface water content is marked by red dots on the sand sample. The dashed line indicates a corresponding flat evaporating sand surface.
The temperature field at the surface was resolved using an IR imager sampling at 30 Hz. We have used an IR thermal camera (FLIR SC6000, FLIR Systems, MA, USA) with a noise equivalent temperature difference of 35 mK @ 30oC. The IR imager is equipped with a quantum well infrared photon (QWIP) detector capable of recording infrared radiation in a narrow range of wavelength of 8.0 to 9.2 micron at high resolution (640 512× pixels). The integration time of the detector is 10 ms
1.2 m
1
2
3
4 5
7
8
6 0.2
m

152 Turbulent evaporation from wavy porous surfaces and it is equipped with a linear Stirling cooler. The thermal images were converted to the surface temperature assuming a constant surface emissivity of 0.95 [Mira, 2007]. The acquired images are transferred to a dedicated PC with ThermaCAM Researcher software (FLIR Systems, MA, USA) for subsequent analyses.
Details of the velocity of an air layer of 50 mm thickness adjacent to the surface (
aU ) was recorded at the edge of the evaporating surface using a 3D ultrasonic anemometer with 0.01 m/s accuracy (WindMaster, Gill Instruments Ltd., The Netherland) acquiring measurements at 30 Hz. The mean air velocity (U∞ ) was measured at a distance of 100 mm above the test surface (in the middle of the duct tunnel) using a hot-wire anemometer (P600, Dostmann Electronic, Germany), and recorded by a data logger (21X, Campbell Scientific Inc., UT, USA). The temperature and relative humidity of the ambient were also monitored at the same location using a temperature and humidity transmitter (HMT337, Vaisala HUMICAP®, Finland). Evaporative mass loss from the soil sample was measured using a heavy duty floor balance equipped with four beam load cells (H8C-Cx-250kg-4B, Zemic, Netherlands) with an accuracy of 0.023%≤ ± (which implies a water mass loss accuracy of 1± kg) and monitored by a controlling unit (PS Plus, Swiss Waagen, Switzerland).
7.4 Results and Discussion
We first report the performance of the proposed model to describe localized external and internal boundary conditions and associated localized evaporative fluxes under prescribed turbulent regimes using surface temperature field resolved by IRT. Next, we present the contribution of subsurface hydraulic properties and aerodynamic boundary layer to localized fluxes, and finally integrate the results and compare model predictions for mean evaporative fluxes and rates with mass loss measurements.
7.4.1 Localized Evaporative Fluxes 7.4.1.1 Thermal Manifestation of Localized Evaporative Fluxes
The temperature of an evaporating surface contains information on the partitioning of available energy among various components (i.e., sensible, latent, and conductive heat fluxes, and net radiation) and reflects their relative contribution [Kalma et al., 2008; Qiu and Zhao, 2010; Haghighi and Or, 2015a]. In the absence of incoming short-wave radiation (as in the laboratory experiments reported here), the temperature of an evaporating surface is generally lower than that of the flowing air

Chapter 7 153 [Shahraeeni and Or, 2010b; Haghighi and Or, 2015a]. Consequently, hot and cold regions on an evaporating surface (obtained by IRT measurements) are indicative of regions with relatively low and high evaporation rates, respectively [Shahraeeni and Or, 2010b; Aminzadeh and Or, 2013].
The pattern of surface temperature thus enables qualitative (and simple quantitative) inferences on interactions between surface geometry, medium water flow properties, and airflow boundary layer that affect “local” evaporative fluxes. Spatially-resolved snapshots of surface temperature 5 hrs after initiation of the evaporation test for flat and wavy sand surfaces under low and high wind speed conditions are depicted in Figure 7.6. The images depict the spatial distribution of surface temperature field over a footprint of 500 500× mm in the center of the 1000 1000× mm test surface. The warm and cool stripes observed in the IR images show evaporation signatures from ridges and troughs suggesting that the relative contributions to mean surface evaporation under low wind speed from these two regions were similar. For high airflow, the troughs were cooler and support high evaporative fluxes for all wavy surface configurations in this study (more noticeable for the large amplitude and high aspect ratio waves).
The dynamics of the temperature fields along the center of the image (shown as the vertical dashed line on the IR snapshot of the flat surface in Figure 7.6) are presented in Figure 7.7. The IR snapshots shown in Figure 7.7 clearly illustrate that for low wind speeds, the ridge and trough surfaces remained connected to the water table during the entire experiment. For high wind velocity, however, ridge surfaces became hydraulically decoupled from water table below and the surface dried out after 15 hrs of exposure (no longer contributing significantly to surface evaporation).

154 Turbulent evaporation from wavy porous surfaces
Low Air Velocity ( 0.7aU = m/s) High Air Velocity ( 3.5aU = m/s) Fl
at S
urfa
ce
(2γ,
λ)=
(50,
200
) m
m
(2γ,
λ)=
(50,
100
) m
m
(2γ,
λ)=
(100
, 200
) m
m
(2γ,
λ)=
(100
, 100
) m
m
Figure 7.6: Spatially-resolved snapshots of surface temperature at time 5 hrs (from the onset of evaporation tests) during flat and wavy sand drying under low and high wind speeds with 296aT = K and 40RH = %. Arrows indicate wind direction perpendicular to the ridges.
Tem
pera
ture
(K)
Ridge
Trough
Ridge
Trough
Ridge Trough
Ridge Trough
Tem
pera
ture
(K)
Tem
pera
ture
(K)
Tem
pera
ture
(K)
Tem
pera
ture
(K)

Chapter 7 155
Low Air Velocity ( 0.7aU = m/s) High Air Velocity ( 3.5aU = m/s) Fl
at S
urfa
ce
(2γ,
λ)=
(50,
200
) m
m
(2γ,
λ)=
(50,
100
) m
m
(2γ,
λ)=
(100
, 200
) m
m
(2γ,
λ)=
(100
, 100
) m
m
Figure 7.7: Temporal evolution of surface temperature along the centerline (the vertical dashed line shown in Figure 6) recorded during flat and wavy sand drying under low and high wind speeds with 296aT = K and 40RH = %.
Tem
pera
ture
(K)
Ridge
Trough
Ridge
Trough
Tem
pera
ture
(K)
Tem
pera
ture
(K)
Tem
pera
ture
(K)
Tem
pera
ture
(K)
Ridge Trough
Ridge Trough

156 Turbulent evaporation from wavy porous surfaces
7.4.1.2 Localized Internal and External Boundary Conditions
The interactions between internal soil transport processes and external (atmospheric) conditions that shape the observed spatio-temporal surface temperature patterns were simulated by the proposed model. Evaporation from sandy wavy surfaces using prescribed surface and aerodynamic conditions ( 0.1r = mm, 0.4sθ = , 0.05r sθ θ = , 130GH = mm, 289sT = K, 296aT = K,
40RH = %, 0.7aU = and 3.5 m/s, and 100wtH = mm) were modeled for the first 15 hrs of the experiments while the drying front or water table depth below the ridges did not exceed the evaporative characteristic length of the sand (i.e., the ridge surface remained connected to the water table below).
Figure 7.8 shows model predictions of local variations of internal ( surfθ ) and external (δ ) boundary conditions as well as corresponding evaporative fluxes along low (2 50γ = mm) and high (2 100γ = mm) surface amplitudes subjected to low (0.7 m/s, blue solid lines) and high (3.5 m/s, red dashed lines) wind speeds. We note that rapid IR measurements of surface thermal fluctuations over troughs and ridges in conjunction with concepts from the SR theory enabled estimation of eddy spectrum shape parameter as 3sα = and 2α = for separation and reattachment zones, respectively, that are required for quantifying viscous sublayer thickness and associated surface fluxes (see [Haghighi and Or, 2015a] for more details). The higher evaporative fluxes from the ridges for the two wavy surfaces under the low wind speed condition were captured by the physical model (Eq. (7.5)). For high wind speeds, however, the pattern varies, and evaporative fluxes from the troughs are higher with differences between evaporative fluxes from ridges and troughs more noticeable relative to the low wind condition (very similar to surface thermal patterns shown in Figure 7.6).
The measured and predicted variations in surface water content show a decrease in surface water content below ridges (of both low and high amplitude waves) for high wind velocity. Such reduction in surface water content may reflect internal viscous resistance that impacts the ridges stronger due: (i) longer capillary path from water table; (ii) lower initial surface water content; and (iii) higher initial evaporation rates (relative to the troughs). Note that a subtle change in surface wetness for surface water contents lower than 0.1 (i.e., surf rθ θ≈ ) may significantly increase the internal viscous resistance (Eq. (7.8)) and result in a considerable decrease in local evaporative fluxes [Haghighi et al., 2013]. The high initial evaporation rates from ridges due to a thinner boundary layer thickness (thinner for high wind speed relative to the low wind speed condition) shorten the evaporative characteristic

Chapter 7 157 length and may induce early surface decoupling (see subsection 7.2.2.2). The capillary decoupling reduces the relative contribution of ridges to surface evaporative fluxes despite favorable (thinner) low boundary layer resistance. Hence, for high wind speeds, evaporation from troughs control evaporation as observed in surface temperature snapshots (Figures 7.6 and 7.7) and predicted by the physical model (Figure 7.8).
In addition to the physical model predictions, we quantified spatial distribution of evaporative fluxes using the relatively simple 3T model of Qiu and Zhao [2010, Eq. (7.10)] (as a “diagnostic” tool to integrate local evaporative fluxes and surface temperature information). Using information on air temperature, and wet and dry soil temperatures, the 3T model links surface thermal measurement with surface soil water content and estimates surface evaporation rates [Qiu et al., 1998]. The spatial distributions of surface evaporative fluxes shown in Figure 7.8 confirm the results obtained by the physical model regarding relative contribution of ridges and troughs to surface evaporation in the presence of a shallow water table (surface averaged evaporation rates predicted by the 3T model are presented in Table 7.1).
Table 7.1: Measured and predicted mean evaporation rate data
aU (m/s) Mean Evaporation Rate (kg/hr) Flat (50, 200) (50, 100) (100, 200) (100, 100)
Experiment* 0.7 0.12 0.11 (0.14) 0.14 (0.12) 0.14 (0.15) 0.20 (0.15) 1.8 0.35 0.29 (0.12) 0.37 (0.12) 0.30 (0.06) 0.55 (0.20) 3.5 0.78 0.50 (0.17) 0.61 (0.17) 0.70 (0.18) 1.01 (0.22)
3T Model 0.7 0.16 0.13 0.17 0.16 0.25 1.8 0.41 0.35 0.50 0.33 0.63 3.5 0.84 0.52 0.66 0.69 1.11
Physical Model
0.7 0.14 0.12 0.16 0.16 0.25 1.8 0.35 0.27 0.35 0.37 0.58 3.5 0.66 0.44 0.56 0.63 0.99
*values in parenthesis indicate standard deviation of measurements: 7 runs for (50, 200) and (50, 100), 5 runs for (100, 200), and 3 runs for (100, 100).

158 Turbulent evaporation from wavy porous surfaces
Figure 7.8: Predicted local variations in internal (surfθ ) and external (δ ) boundary
conditions as well as corresponding localized evaporative fluxes along low ( 2 50γ = mm) and high ( 2 100γ = mm) amplitude wavy sand surfaces under low (0.7 m/s, blue solid lines) and high (3.5 m/s, red dashed lines) wind speeds based on the prescribed aerodynamic and surface properties during the first 15 hrs of the experiments (before complete decoupling of ridges from the water table below). Square symbols indicate surface water content values measured beneath ridges and troughs using TDR probes. Diagnostic predictions of surface evaporative fluxes (spatial distributions) were obtained from the 3T model of Qiu and Zhao [2010] based on the surface temperature snapshots presented in Figure 7.6 to provide an estimate of local (spatial) variations of surface evaporative fluxes.
Evap
. Flu
x (k
g/m
2 hr)
Ridge
Trough
Evap
. Flu
x (k
g/m
2 hr)
Ridge
Trough
Ua=0.7 m/s Ua=3.5 m/s
Evap
. Flu
x (k
g/m
2 hr)
Ridge
Trough
Evap
. Flu
x (k
g/m
2 hr)
Ridge
Trough
Ua=0.7 m/s Ua=3.5 m/s

Chapter 7 159 Note that the results in Figure 7.8 presented as a function of x λ (rather than x ) suggests that the magnitude of local evaporative fluxes predicted by the physical model are independent of the wavy surface wavelength (λ ), thus the results are applicable for wavy surface configurations of the same amplitude (e.g., ( 2γ , λ)=(50, 200) and (50, 100) mm). Nevertheless, the surface temperature field of the high aspect ratio surface (50, 100) exhibited a higher temperature difference between ridges and troughs under high wind speed (3.5 m/s), that may imply a marginal difference in the pattern of local evaporative fluxes from the low and high aspect ratio surfaces under high wind speed condition. Nevertheless, we note that this observation of warmer ridges of the steeper wavy surface (relative to the low aspect ratio surface) under high wind speed condition that are manifested in the IR snapshots could be accounted for by lateral heat exchange of pores of different evaporative fluxes due to local variations of the viscous sublayer thickness as a function of x (rather than x λ ), and by capillary coupling signature with the water table below.
7.4.2 Mean Evaporation Fluxes and Mass Loss Rates
Evaluating Eqs. (7.15) and (7.18) for mean evaporation flux E (kg/m2s) and mass loss rate e (kg/s) from wavy sand surfaces (considering measured mass loss data obtained during the first 15 hrs of the evaporation experiments), we compared model predictions with experimental data (Figure 7.9). The evaporation rate represents cumulative amount of water withdrawn from the system within a specific time (this metric is scale dependent); whereas the evaporation flux is the measure of average evaporation rate per unit evaporating surface area (scale independent). Thus, experimentally determined mean evaporation rates (e ) were extracted directly from weighing mass loss from the evaporating sand samples, and the corresponding mean evaporation fluxes (E ) were obtained using the total surface area exposed to airflow (i.e., ( )E e w s= × ). Note that the ratio of evaporating wavy surface area to the corresponding flat surface area (
wavy flatA A with 1flatA = m2) varied in this study from 1.14 to 2.30 for wavy surfaces with (2γ , λ )=(50, 200) and (100,100) mm, respectively.

160 Turbulent evaporation from wavy porous surfaces
Low amplitude (2γ=50 mm) High amplitude (2γ=100 mm)
Eva
pora
tion
Flux
(kg
/m2 h
r)
Eva
pora
tion
Rat
e (k
g/hr
)
Figure 7.9: Predicted (lines) and measured (symbols) mean evaporation flux and rate ratios from low and high amplitude wavy sand surfaces (relative to flat surface) under different airflow velocities. Error bars represent standard deviation of measured mass loss rates from wavy sand surfaces with different number of replicates: 7 runs for 0.25AR = and 0.5 (low amplitude), 5 runs for 0.5AR = (high amplitude) and 3 runs for 1.0AR = (see also Table 7.1). We note that the evaporation flux is scaled per unit area and expresses mass loss per unit surface area (increased surface area due to waviness is scaled out), and the evaporation rate is the mass loss per unit projected area (waviness increases evaporating area relative to a flat surface).
The results shown in Figure 7.9 reveal that the overall pattern of the variations in measured evaporation fluxes and mass loss rates were described reasonably well by the physical model (absolute mass loss rates are given in Table 7.1). These results also reveal that evaporative fluxes from wavy porous surfaces underlain by a shallow water table are reduced compared to the corresponding flat surface (the ratios are less than unity). This interesting result is explained by the double effect

Chapter 7 161 of evaporative flux suppression from the troughs with a thicker boundary layer, and the reduction in the evaporative flux from the ridges due to hydraulic decoupling. Hence, despite a considerably larger evaporating wavy surface area, evaporation flux is reduced relative to the flat surface. Considering the sensitivity of the evaporative characteristic length to local viscous resistance (enhanced by wind velocity – see Eqs. (7.13) and (7.14)), the hydraulic decoupling of ridges is enhanced with increasing the wind velocity and the evaporative flux ratio decreases (the absolute mass loss for wavy to flat surfaces – see Table 7.1). Furthermore, the observed and predicted results exhibited insensitivity of the flux ratios to the aspect ratio of the surface (for both low and high amplitudes) suggesting that the evaporation rate (mass loss from the same overall surface footprint) was increased in proportion to increasing surface area with increasing aspect ratio.
In addition to flux ratios, measurements and model predictions depicted in Figure 7.9 show that evaporation rates from wavy surfaces may be enhanced or suppressed relative to a similar flat surface (the absolute mass loss values are given in Table 7.1). The enhanced evaporative water loss at high aspect ratios is associated with larger evaporating surfaces especially under low wind speed condition where hydraulic coupling with the water table (or the receding drying front in natural systems) is maintained for both low and high amplitude wavy surface configurations used in this study. The lower evaporation rate ratios at low aspect ratio surfaces (even for low wind velocity) reflect the dominance of flux suppression in the detachment region for which the mild increase in total evaporating area is not sufficient to compensate relative to a saturated flat surface.
The hydraulic decoupling for both low and high amplitude wavy surfaces under high wind velocity (relative to the evaporative characteristic length) overwhelms the overall wavy surface evaporative response for a wide range of aspect ratios that remain below the values for an equivalent flat surface. While model predictions capture the trend quite well for low aspect ratio waves, the model marginally overpredicts the ratios for higher aspect ratios (2 1γ λ = ) especially under high wind speeds probably due to earlier hydraulic decoupling (shorter effective characteristic length) promoted by the initially lower water content over the ridges and the enhanced viscous losses due to higher fluxes at the ridges (high viscous resistance).
7.5 Summary and Conclusions
We developed a physically based model that explicitly accounts for key variables

162 Turbulent evaporation from wavy porous surfaces that influence evaporation rates from wavy porous surfaces. The pore-scale surface resistance model of Haghighi et al. [2013], coupled with concepts from fluid flow dynamics over wavy and hilly solid surfaces and SR theory, was extended by incorporating interactions with wavy surfaces resulting in localization of viscous sublayer thickness. The model also considers subsurface interactions that affect surface water content and capillary flows towards the evaporating wavy surface. The localization of boundary layer interactions and subsurface coupling developed here provides a simple theoretical framework for considering evaporation rates and fluxes from tilled bare soil surfaces. Evaporation rate is defined as mass loss per unit projected area (waviness increases evaporating area relative to a flat surface) while the evaporation flux is scaled per unit area and expresses the mass loss per unit surface area (increased surface area due to waviness is scaled out).
Considering localization of mean viscous sublayer thickness and its effects on the resulting hydraulic soil behavior, the model accounts for local evaporative fluxes manifested in the surface temperature field of the controlled laboratory drying experiments of wavy sand surfaces in the presence of a shallow water table. The interplay of localized internal (surface water content) and external (viscous sublayer thickness) boundary conditions and associated localized evaporative fluxes were in good agreement with TDR measurements, literature data [McInnes et al., 1994], and diagnostic predictions by the 3T model [Qiu and Zhao, 2010]. The model predictions highlight the significant subsurface coupling and internal viscous resistance to localized evaporative fluxes where low wind speeds could prolong (and conversely for high wind speeds) the contribution of evaporating ridges to surface mean evaporation rates.
Furthermore, model predictions of mean evaporation rates and surface fluxes were in good agreement with experimental results obtained by direct mass loss measurements of the evaporating surface. The results revealed that the relative evaporative mass loss (per saturated flat surface evaporation) increases with increasing surface aspect ratio (i.e., increasing exposure surface area) and with lower wind velocity (lower viscous resistance below ridges). The same ratio was reduced by increasing wind velocity and by decreasing surface aspect ratio, indicating that increased exposure surface area does not compensate suppressed fluxes over the various regions (troughs with thicker boundary layer and ridges’ decoupling from water table below due to enhanced viscous effects).
The model requires additional tests to assess its applicability to natural surfaces at

Chapter 7 163 the field-scale; nevertheless, the simple framework offers a means for systematic evaluation of key surface and aerodynamic parameters that affect evaporative fluxes from wavy porous surfaces into turbulent airflows. The model may also be useful for studying evaporation from wavy plant leaves, and designing efficient evaporative drying scenarios for certain industrial purposes (e.g., wood and building materials drying). The approach could provide a building block for upscaling evaporation predictions to landscape-scale applications with incorporation of shortwave radiation and associated geometrical interactions that would enhance localization of surface energy balance components in addition to the localized effects presented here.
Acknowledgements
The authors gratefully acknowledge funding by the Swiss National Science Foundation of the project “Evaporation from terrestrial surfaces – linking pore scale phenomena with landscape processes” (200021-113442) and the financial support of the German Research Foundation DFG of the project “Multi-Scale Interfaces in Unsaturated Soil” (MUSIS; FOR 1083). Technical assistance of Daniel Breitenstein and Hans Wunderli (ETH Zurich) is greatly appreciated.

Chapter 8
Interactions of Bluff-body Obstacles with Turbulent Airflows Affecting Evaporative Fluxes from Porous Surfaces1
Abstract: Bluff-body obstacles interacting with turbulent airflows are common in many natural and engineering applications (from desert pavement and shrubs over natural surfaces to cylindrical elements in compact heat exchangers). Even with obstacles of simple geometry, their interactions within turbulent airflows result in a complex and unsteady flow field that affects surface drag partitioning and transport of scalars from adjacent evaporating surfaces. Observations of spatio-temporal thermal patterns on evaporating porous surfaces adjacent to bluff-body obstacles depict well-defined and persistent zonation of evaporation rates that were used to construct a simple mechanistic model for surface-turbulence interactions. Results from evaporative drying of sand surfaces with isolated cylindrical elements (bluff bodies) subjected to constant turbulent airflows were in good agreement with model predictions for localized exchange rates. Experimental and theoretical results show persistent enhancement of evaporative fluxes from bluff-rough surfaces relative to smooth flat surfaces under similar conditions. The enhancement is attributed to formation of vortices that induce a thinner boundary layer over part of the interacting surface footprint. For a practical range of air velocities (0.5 to 4.0 m/s), low-aspect ratio cylindrical bluff elements placed on evaporating sand surfaces enhanced evaporative mass loss (relative to a flat surface) by up to 300% for high density of elements and high wind velocity, similar to observations reported in the literature. Concepts from drag partitioning were used to generalize the model and upscale predictions to evaporation from surfaces with multiple obstacles for potential applications to natural bluff-rough surfaces.
1submitted as: Haghighi, E., and D. Or, Interactions of bluff-body obstacles with turbulent airflows affecting evaporative fluxes from porous surfaces, J. Hydrology (under review).

Chapter 8 165 8.1 Introduction
The quantification of fluxes from realistic complex terrains is of considerable importance for hydrological and climatic models. The magnitudes and spatial patterns of land-atmosphere fluxes are affected by the interaction of land surface heterogeneity with incoming solar (shortwave) radiation [Duguay, 1993; Yang and Friedl, 2001; Wang et al., 2005; Helbig et al., 2009] and atmospheric boundary layer turbulence [Finnigan, 1988; Wieringa, 1993; Brutsaert, 1998; Stoll and Porte-Agel, 2006]. For surfaces with protruding bluff-body elements, studies have shown that the shape of the obstacles, their spacing, and spatial arrangement significantly modify the surface radiation and energy balances [Whiteman et al., 1989; Strahler and Jupp, 1990; Ni and Li, 2000; Müller and Scherer, 2005; Helbig et al., 2010]. These geometrical attributes are also important for turbulence generation adjacent to the surface thereby influencing turbulent transport of momentum and scalars [Cai, 1999; Tseng et al., 2006; Bou-Zeid et al., 2007; Cheng and Porte-Agel, 2013].
Turbulent transport to and from surfaces with bluff roughness elements has been the subject of extensive experimental and numerical studies in modern fluid dynamics and transport phenomena due to its importance in many natural and engineering applications [Chamberlain, 1968; Brutsaert, 1979; Goldstein et al., 1985; Chyu and Goldstein, 1991; Ligrani et al., 2003; Giordano et al., 2012; Sumner, 2013]. Among the types of bluff roughness elements studied in fluid dynamics research [e.g., Okamoto, 1982; Savory and Toy, 1986; Pattenden et al., 2005; Byun and Simpson, 2006; Martinuzzi, 2008; Wang and Zhou, 2009; Papanicolaou et al., 2012], cylindrical bodies interacting with fluid flows have been extensively studied (see review by Sumner [2013] and references therein). We thus focus in this study on interacting non-evaporating circular cylinders (as bluff-body obstacles) that protrude from an evaporating porous surface to quantify their impacts on evaporative fluxes as models of natural roughness elements (e.g., bare soil surfaces partially covered with boulders and shrubs).
We ignore potential interactions of shortwave radiation on surface energy balance, and focus on the characteristics of heat and mass transfer from surfaces containing protruding cylindrical obstacles that are largely shaped by local airflow patterns around the obstacles [Kawamura et al., 1984; Pattenden et al., 2005; Krajnovic, 2011]. As air flows over a surface-mounted circular cylinder with a relatively low aspect ratio =AR h d (where h (m) and d (m) are the height and diameter of the cylinder, respectively) a complex boundary layer in the near surface region forms with a few vortex-pairs rolling over and/or sweeping around the cylinder base

166 Turbulent evaporation from bluff-rough porous surfaces (termed horseshoe vortex), as illustrated in Figure 8.1a [Fröhlich and Rodi, 2004; Pattenden et al., 2005; Afgan et al., 2007; Lee et al., 2007; Frederich et al., 2009; Palau-Salvador et al., 2010; Krajnovic, 2011]. A horseshoe vortex consists of many vortices with complex interactions and oscillatory motions [Baker, 1979 and 1980] that produce high surface shear stress thereby enhancing heat and mass transfer to or from the interacting surface [Goldstein and Karni, 1984; Goldstein et al., 1985; Chyu and Goldstein, 1991; Ligrani et al., 2003; Giordano et al., 2012; Sumner, 2013].
This study seeks to simplify the complex picture of bluff-body interactions reported in the literature towards establishment of a simple and physically based model for stage-I evaporation rates from bluff-body covered bare soil surfaces. We consider concepts from surface renewal (SR) theory [Higbie, 1935; Danckwerts, 1951; Harriott, 1962] to extend the pore-scale model of Haghighi and Or [2013] originally developed for diffusive water vapor fluxes from aerodynamically smooth soil surfaces into turbulent airflows (see Figure 8.1). As individual eddies are swept along the evaporating surface, they gradually accumulate water vapor (or exchange energy) at rates determined by diffusion across a viscous sublayer forming beneath their footprint, and by the mean water vapor gradient between the surface and the well-mixed turbulent airflow. Following a certain residence time over the surface, an eddy is ultimately ejected back into the turbulent flow and renewed by another drawn from an eddy population defined by airflow conditions.

Chapter 8 167
Figure 8.1: Schematic of (a) formation of typical turbulent structures around a protruding circular cylinder resulting from turbulent airflow interactions with cylindrical obstacle (the picture is inspired from large eddy simulations reported in Afgan et al. [2007]), and (b and c) the building block for quantification of the mean evaporation flux from the base surface of a non-evaporating finite circular cylinder in cross flow. The model considers three distinct zones over the base surface affected differently by airflow turbulence: (1) the region of influence of upstream horseshoe vortex system, (2) the region influence by wake vortices downstream of the obstacle, and (3) the unaffected region. The pore-scale model considers the turbulent airflow interacting with the evaporating surface as a collection of eddies with different characteristics drawn from a statistical distribution. Water vapor transfer (during stage-I evaporation) through a unit surface of the building block into individual eddies is governed by 3D vapor diffusion from individual pores across a local viscous sublayer (c) forming below eddies footprint (green dashed line in the inset of (a)).
z
x
1
3
y
x
2 2r
δ
√π/θ r
3d/2
d
s
(b) (c)

168 Turbulent evaporation from bluff-rough porous surfaces Focusing on modifications to airflow turbulence near bluff-body roughness elements, this study aims to: (1) extend the SR-based evaporation model of Haghighi and Or [2013] by explicitly incorporating localized viscous sublayers forming around cylindrical elements; (2) experimentally test the model by systematically varying surface roughness elements in evaporation experiments in a wind tunnel; and (3) generalize the results by considering the effective surface drag partitioning with obstacles of different densities and the resulting effects on evaporative fluxes. The important effects of shortwave radiation on surface energy balance are deferred to future studies, and we focus here primarily on the effects of momentum partitioning on surface fluxes.
Following this introduction, section 8.2 describes the theoretical background and modeling details for coupling pore-scale stage-I evaporation from bluff-rough porous surfaces with a population of individual eddies forming the interacting turbulent airflow. Section 8.3 is devoted to describing experimental setup used for evaluating the proposed model by first considering surface thermal patterns observable by infrared thermography (IRT), and then mass loss measurements. Preliminary experimental results and model verifications are presented in section 8.4, followed by summary and concluding remarks in section 8.5.
8.2 Modeling Evaporation from Porous Surfaces with a few Bluff-Body Obstacles
Both local evaporation patterns and mean evaporative fluxes from drying porous surfaces are constrained by surface wetness and internal transport properties of the porous medium, by the available energy at the surface, and by scalar transport across an aerodynamic viscous sublayer [Schlünder, 1988; Shahraeeni et al., 2012; Haghighi et al., 2013; Haghighi and Or, 2013]. During early stages of evaporation from an initially-saturated porous medium, the evaporation rate is often high and relatively constant (the so-called stage-I evaporation). This stage is marked by stationary vaporization plane at the surface that is supplied by capillary liquid flow from below as the drying front gradually recedes [Yiotis et al., 2004; Lehmann et al., 2008; Shahraeeni et al., 2012; Or et al., 2013]. The porous medium internal transport capacity during this stage often exceeds the diffusive resistance to transport across the air viscous sublayer, hence external aerodynamic conditions govern evaporation rates [van Brakel, 1980; Schlünder, 1988; Shahraeeni et al., 2012; Haghighi et al., 2013].
The primary effects of surface bluff-body elements that interact with airflows is
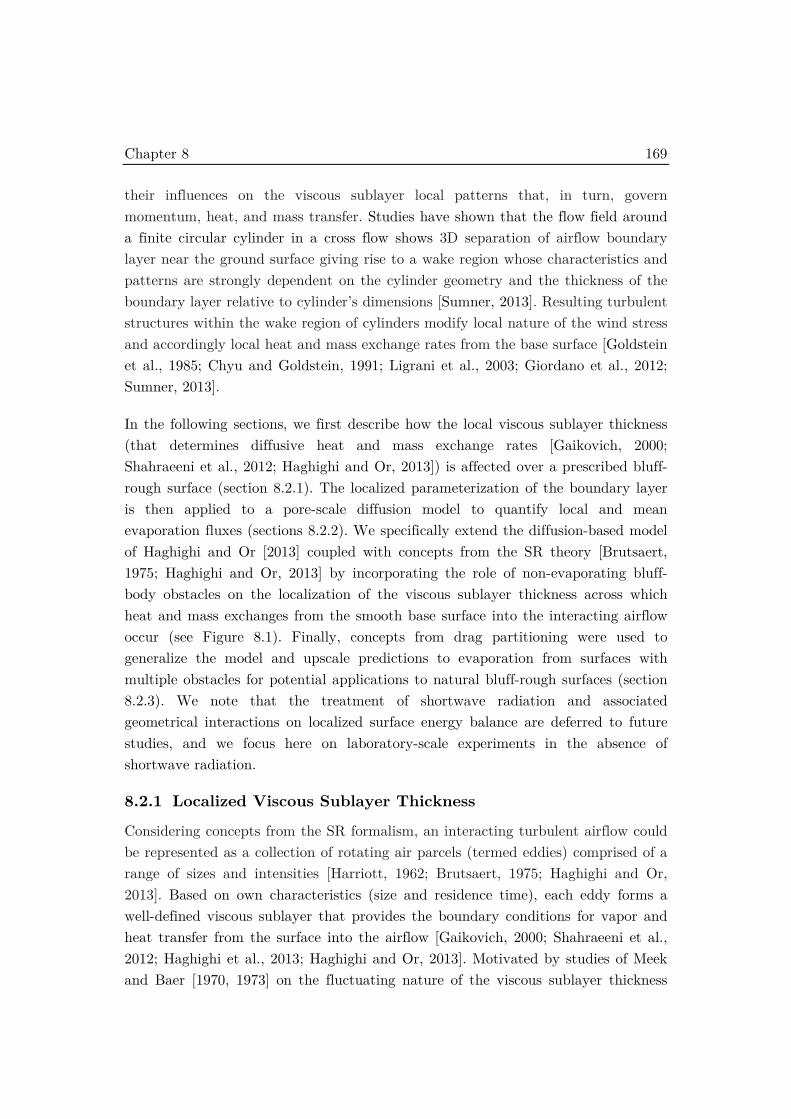
Chapter 8 169 their influences on the viscous sublayer local patterns that, in turn, govern momentum, heat, and mass transfer. Studies have shown that the flow field around a finite circular cylinder in a cross flow shows 3D separation of airflow boundary layer near the ground surface giving rise to a wake region whose characteristics and patterns are strongly dependent on the cylinder geometry and the thickness of the boundary layer relative to cylinder’s dimensions [Sumner, 2013]. Resulting turbulent structures within the wake region of cylinders modify local nature of the wind stress and accordingly local heat and mass exchange rates from the base surface [Goldstein et al., 1985; Chyu and Goldstein, 1991; Ligrani et al., 2003; Giordano et al., 2012; Sumner, 2013].
In the following sections, we first describe how the local viscous sublayer thickness (that determines diffusive heat and mass exchange rates [Gaikovich, 2000; Shahraeeni et al., 2012; Haghighi and Or, 2013]) is affected over a prescribed bluff-rough surface (section 8.2.1). The localized parameterization of the boundary layer is then applied to a pore-scale diffusion model to quantify local and mean evaporation fluxes (sections 8.2.2). We specifically extend the diffusion-based model of Haghighi and Or [2013] coupled with concepts from the SR theory [Brutsaert, 1975; Haghighi and Or, 2013] by incorporating the role of non-evaporating bluff-body obstacles on the localization of the viscous sublayer thickness across which heat and mass exchanges from the smooth base surface into the interacting airflow occur (see Figure 8.1). Finally, concepts from drag partitioning were used to generalize the model and upscale predictions to evaporation from surfaces with multiple obstacles for potential applications to natural bluff-rough surfaces (section 8.2.3). We note that the treatment of shortwave radiation and associated geometrical interactions on localized surface energy balance are deferred to future studies, and we focus here on laboratory-scale experiments in the absence of shortwave radiation.
8.2.1 Localized Viscous Sublayer Thickness
Considering concepts from the SR formalism, an interacting turbulent airflow could be represented as a collection of rotating air parcels (termed eddies) comprised of a range of sizes and intensities [Harriott, 1962; Brutsaert, 1975; Haghighi and Or, 2013]. Based on own characteristics (size and residence time), each eddy forms a well-defined viscous sublayer that provides the boundary conditions for vapor and heat transfer from the surface into the airflow [Gaikovich, 2000; Shahraeeni et al., 2012; Haghighi et al., 2013; Haghighi and Or, 2013]. Motivated by studies of Meek and Baer [1970, 1973] on the fluctuating nature of the viscous sublayer thickness

170 Turbulent evaporation from bluff-rough porous surfaces under turbulent regimes, Haghighi and Or [2013] have estimated the thickness of the viscous sublayer forming below an eddy’s footprint, δi (m), over a flat surface as a function of eddy residence time, τ i (s), as (Figure 8.1a)
δ τ= 1i ic v (8.1)
where =1 2.2c is a proportionality constant depending on flow geometry [Popovich and Hummel, 1967; Meek and Baer, 1973; Tuoc and Keey, 1992; Haghighi and Or, 2013], v (m2/s) is the kinematic viscosity of air ( −× 61.5 10 m2/s), and τ i (s) is the residence time of the i th eddy. Studies have shown that the eddy residence time distribution φ τ( ) (a momentum field characteristic) follows the gamma statistical distribution [Danckwerts, 1951; Seo and Lee, 1988] expressed as
ααβφ τ τ βτ
α
+
= −Γ +
1
( ) exp( )( 1)
(8.2a)
αβτ+
=1
(8.2b)
where Γ = −( ) ( 1)!n n is the gamma function, and α (-) and β (1/s) are, respectively, the shape and rate parameters that control the shape of the distribution and provide insights on the nature of interactions between turbulent airflows and the surface (e.g., a turbulent regime characterized by small or large α (for a constant β ) is referred to as small-scale or large-scale eddy dominated, respectively [Haghighi and Or, 2013]), and τ (s) is the mean residence time of the eddy residence time distribution.
Combining Eqs. (8.1) and (8.2) and considering concepts from the SR theory, Haghighi and Or [2013] have established an effective viscous sublayer thickness as a function of turbulent flow characteristics that explicitly incorporates the influence of the eddy distribution on mass exchange processes according to
δ α==
( ) vgu
(8.3)
where =u (m/s) is the friction velocity estimated as [Haghighi and Or, 2013]
α=
+=0.3
1 au U (8.4)
with aU (m/s) the mean air velocity, and α( )g is obtained from [Haghighi and Or,

Chapter 8 171 2013]
α
απαα α αα+
== ⋅ Γ + Π + >+ ( 1)
1 02.2 112 1( )( 1) (2 1) 02 1
g (8.5a)
α α α α αΠ + = + ⋅ − + ⋅ − + ⋅ ⋅ − +(2 1) (2 1) (2( 1) 1) (2( 2) 1) ... (2( ) 1)n (8.5b)
with n α< (-) the largest integer smaller than α . According to Haghighi and Or [2013], by increasing α the occurrence of larger eddies with longer residence times in a turbulent airflow regime increases and the mean viscous sublayer thickness becomes thicker.
The parametric viscous sublayer model above, established originally for flat surfaces, has been extended here to consider local variations in the viscous sublayer thickness due to airflow interactions with bluff-body obstacles protruding from the surface. The mean flow in the near wake of bluff-rough surfaces (at the scale of hydrological interest here) with low-aspect-ratio obstacles is characterized by three persistent features, as illustrated by Pattenden et al. [2005]: (i) a horseshoe vortex forming at the surface upstream of the obstacle that wraps around the obstacle and becomes primarily streamwise in the wake; (ii) streamwise tip vortices that emerge from the free end; and (iii) an arch vortex consisting of the mean spanwise vortices shed from the obstacle sides, connected near the free end (Figure 8.1a). Downstream, tip structures and horseshoe legs combine near the surface to form streamwise structures called the trailing vortices [Pattenden et al., 2005; Frederich et al., 2009]. The boundary layer model extension seeks parameterization of these persistent features around the obstacle. We assume wakes near low-aspect-ratio cylindrical obstacles (regions 1 and 2 in Figure 8.1b) are dominated by smaller scale eddies (smaller α ) relative to the unaffected zone (region 3 in Figure 8.1b) [Goldstein and Karni, 1984; Afgan et al., 2007; Lee et al., 2007; Palau-Salvador et al., 2010; Krajnovic, 2011; Sumner, 2013].
The viscous sublayer model coupled with a surface-temperature-based approach proposed by Haghighi and Or [2015a, b] for determining α from spatially variable surface thermal fluctuations observable by infrared thermography (IRT) offers a physically based framework for characterizing spatial variation of viscous sublayer thickness over a bluff-rough surface. Considering that instantaneous variations in the viscous sublayer forming over the footprint of sweeping eddies affect evaporative and sensible heat fluxes, an evaporating surface could locally be cooled down or

172 Turbulent evaporation from bluff-rough porous surfaces warmed up and the resulting intermittent and spatially variable surface temperature dynamics could be resolved by means of rapid and sensitive IRT (Figure 8.2) [Haghighi and Or, 2015a, b]. As shown by Haghighi and Or [2015a, b], the resolved surface temperature time series could be used to obtain the shape parameter of the eddy residence time distribution α (parameterizing the momentum field intermittency) through the distribution of thermal eddy residence times defined as the time difference between two consecutive peak and valley points in the surface temperature time series (see Figure 8.2), as described by Haghighi and Or [2015a, b].
Figure 8.2: (a) A typical surface temperature time series (including thermal fluctuations) resolved during surface evaporation; and (b) a typical thermally-deduced eddy residence time distribution obtained from surface thermal fluctuations in (a) that provides necessary information (α and β ) for characterization of a turbulent momentum field [Haghighi and Or, 2015a, b].
8.2.2 Local and Mean Evaporative Fluxes
Evaporation from a drying porous surface (during stage-I) is quantified as a superposition of diffusion solutions from interacting pores supplied by viscous flow from a receding drying front [Shahraeeni et al., 2012; Haghighi et al., 2013; Haghighi and Or, 2015c]. Representing the evaporating porous surface by a single effective pore size where surface water content (density of evaporating pores per surface) varies to mimic surface drying [Schlünder, 1988; Haghighi et al., 2013; Aminzadeh and Or, 2014], Haghighi and Or [2013] have extended the pore-scale diffusion model of Schlünder [1988] (Figure 8.1c) and established a diffusion-
Surf
ace
Tem
pera
ture
Time
Prob
abili
ty D
ensi
ty
Thermal Eddy Residence Time, τ
Measured τ
Measured τ
Fitted gamma distribution (α and β)
(a) (b)

Chapter 8 173 turbulence model with explicit account of surface-eddy exchange during eddy residence time over the surface. As eddies are swept along the evaporating surface, they gradually accumulate water vapor at rates determined by diffusion across a viscous sublayer forming beneath their footprint, and by the mean water vapor gradient between the surface and the well-mixed turbulent airflow. Following a certain residence time over the surface, an eddy is ultimately ejected back into the turbulent flow and renewed by another drawn from an eddy population defined by flow conditions [Haghighi and Or, 2013].
Diffusive turbulent vapor fluxes from a drying smooth porous surface across an effective viscous sublayer thickness is expressed as [Haghighi and Or, 2013]
δ θ∆
=+ ( )flat
surf
D CErf
(8.6)
where flatE (kg/m2s) is the mean evaporation flux from the flat surface, D (m2/s) is the water vapor diffusion coefficient in air ( 52.5 10−× m2/s), δ (m) is the mean viscous sublayer thickness influenced by airflow turbulence [Haghighi and Or, 2013], r (m) is the mean pore radius, θsurf (-) is the surface water content, ∆ = −s aC C C(kg/m3) is the water vapor concentration difference at the liquid surface (assumed saturated) and in the air at the border of the viscous sublayer obtained from
∆ = − ℜ
( ) ( )w sat s sat a
s a
M P T P TC RH
T T (8.7)
with wM (kg/mol) the molar mass of water (0.018 kg/mol), ℜ (J/mol K) the universal gas constant (8.314 J/mol K), sT and aT (K) the surface and air temperatures, respectively, RH (-) the air relative humidity, and satP (Pa) the vapor pressure at the liquid surface (assumed to be the saturation vapor pressure at the surface temperature), and θ( )surff is a surface wetness-depended coefficient obtained from [Schlünder, 1988]
πθθπθ
= −
1( ) 14surf
surfsurf
f (8.8)
This function accounts for the nonlinear diffusive interactions as the surface dries and spacing between remaining evaporating pores increases [Shahraeeni et al., 2012]. We note that this simplified approach ignores potential limitations imposed

174 Turbulent evaporation from bluff-rough porous surfaces by capillary flow to the surface which become important at very low surface water contents [Shahraeeni et al, 2012; Haghighi et al., 2013], and thus only the limitations due to diffusive vapor transfer across the viscous sublayer are considered [Schlünder, 1988; Shahraeeni et al., 2012; Haghighi et al., 2013].
Considering Eq. (8.6) and the hypothesized localization of airflow turbulence near the base surface of a circular cylinder protruding from the surface (Figure 8.1b), mean evaporation flux from the entire cylindrical obstacle-centered building block (Figure 8.1b) _bluff bldE (kg/m2s) is simply obtained from
δ θ=
=
−= =
+
∑
∑
3
1 ,_ 3
,
1
( ),
( )
j jj s s j a
bluff bld jj surf j
jj
E A C T CE E D
rfA (8.9)
where δ j and ,s jT are obtained from surface thermal information resolved by IRT (providing α j and ,s jT ) as discussed in section 8.2.1, and jA (m2) is the area of the j th evaporating zone with approximations in Figures 8.1b and 8.3 as
π
π
=
= ⋅
= − ⋅ +
2
1
22
3
532
932tot
dA
A d sdA A d s
(8.10)
with totA (m2) the total area of the system. The surface areas proposed in Eq. (8.10) are inspired by literature results [e.g., Pattenden et al., 2005; Giordano et al., 2012] and our own thermal imaging (e.g., see Figures 8.3 and 8.4). The patterns are assumed to be independent of wind velocity for protruding obstacles with a constant and low aspect-ratio [Giordano et al., 2012]. We note that for surfaces covered by multiple protruding obstacles, the mean evaporation flux bluffE (kg/m2s) is expressed as
==∑ _ ,
1_
N
bluff bld kk
bluff zonation
EE
N
(8.11)
where N (-) is the number of protruding cylindrical obstacles. Equation (11)

Chapter 8 175 assumes that interactions between adjacent cylinders are of negligible impacts on the geometry of three turbulence-influenced zones, except the length of the wake zone downstream of obstacles (s ) that could vary from obstacle’s spacing to the system size.
For simplicity, we consider a simple scenario of evaporation from a partially saturated porous medium supplied by a fixed drying front depth (or a shallow water table) where the surface water content θsurf is controlled by the drying front depth L (m) (Figures 8.1a and 8.3). The concept of evaporative characteristic length CL(m) [Lehmann et al., 2008] is used to determine the extent of the hydraulically connected region between the drying front depth and the evaporating surface. In the experimental part of this study, the “drying front” position is controlled by a fixed shallow water table depth, and the water content distribution to the surface follows a quasi-hydrostatic profile [Shokri et al., 2008]. Maintaining a fixed drying front depth shorter than the evaporative characteristic length for the porous medium ( ≤ CL L ) provides an estimate for surface water content during evaporation as [Lehmann et al., 2008]
θ θθ θ
= − −
, 1 1surf j jr
s s C
LL
(8.12)
where θr (-) is the residual water content and θs (-) is the saturated water content (≈ sand porosity). The evaporative characteristic length CL that determines the deepest water table position before hydraulic connectivity with the evaporating surface above is lost varies from 90 to 150 mm for a range of sands with fine and coarse texture [Lehmann et al., 2008].
To account for the non-evaporating area covered by the cylindrical obstacles, and to compare results among different obstacle configurations and coverages, we define a mean mass loss rate from the surface, termed mean evaporation rate _bluff zonatione(kg/s) for a surface covered with non-evaporating circular cylinders of diameter d(m) that is given as
= ⋅_ _bluff zonation bluff zonation evape E A (8.13)
where = − ⋅evap tot obsA A N A is the “active” evaporating area with π= 2 4obsA d the basal area of the circular cylinder.

176 Turbulent evaporation from bluff-rough porous surfaces
8.2.3 Drag Partitioning and Model Generalization
Although the mechanistic zonation model (Eq. (11)) for surfaces covered by multiple protruding obstacles provides physical insights into the mechanisms that enhance heat and mass exchange rates from the base porous surface, the model requires detailed IRT images that limit its application for natural and landscape-scale studies. Additionally, the proposed zonation model relies on simplifying assumptions that neglect interactions between adjacent protruding obstacles on mean wind velocity deceleration (due to obstacle resistance), and on adjustments of the turbulent flow field downstream. For surfaces with large obstacle densities (large number of obstacles per unit area), such interactions cannot be ignored and an alternative and more general scheme is required for upscaling surface evaporation estimates.
The effect of a bluff-body on drag forces and on shear stresses at the surface was first studied in detail by Schlichting [1936] who stated that the total drag force imparted to a rough surface due to fluid flow can be partitioned into force acting on the roughness elements and force acting on the surface. The drag partition problem aims to establish the change in total drag as well as the changes in drag acting on the roughness elements and on the intervening surface as a function of roughness type, size and spacing. This has been commonly described by the roughness density (or frontal area index) λ λ≤ ≤ max0 (-) defined as
λ ⋅ ⋅=
tot
N d hA
(8.14)
where all the parameters have been defined previously.
Studies have shown that for a surface with no bluff-bodies (λ = 0 ), the transfer of momentum to the surface is determined by background turbulence. As the roughness (bluff-body) density increases, the transfer of momentum to the surface is affected by both background turbulence and wakes associated with bluff-body elements and overall momentum transfer is enhanced accordingly (i.e., the background turbulence breaks down into smaller scale eddies with smaller α inducing a thinner mean boundary layer thickness) [Raupach, 1992; Shao and Yang, 2005; Huthoff, 2012; Nepf, 2012; Haghighi and Or, 2013]. As the roughness density (number of obstacles) increases to a critical value (λ ≈ 0.2c ), mutual sheltering among the bluff-body roughness elements becomes more important such that penetration of background turbulence to the surface reduces (i.e., the base surface is

Chapter 8 177 shielded from the background turbulence), hence the transfer of momentum from the airflow to the surface (and shear stress at the surface) considerably reduces [Shao and Yang, 2005, 2008; Huthoff, 2012; Nepf, 2012].
Complementing studies by Raupach [1992], Shao and Yang [2008] established a parametric expression for the friction velocity =u (m/s) formulating systematically such interactions as
( )λ η η η= − + − + = (1 ) (1 )a r rg s c sgu U f f f (8.15)
where η≤ ≤0 1 (-) is the basal-area index (or fraction of obstacle cover) expressed as
λη = =⋅obs obs
tot
N A AA d h
(8.16)
γ= rg sg (-) and sg (-) are the values of drag coefficient for the bluff-body and ground surface, respectively, at λ = 0 obtained from
κ − =
2 2
0
ln wsg
s
zz
(8.17)
with κ = 0.41 the von Karman constant, wz (m) the reference height at which aU is taken, and 0sz (m) the bare surface roughness length, and rf (-), sf (-), and cf (-) are functions of quantities related to bluff-body elements given as
λη
λη
η
= − −
= − −
= + −
exp(1 )
exp(1 )
1 1
rr k
ss k
sgcc
sg
af
af
f
(8.18)
with = 3ra (-), = 5sa (-), and = 0.1k model parameters obtained from extensive numerical simulations [Shao and Yang, 2008], and sgc (-) is the drag coefficient on the surface of the bluff-body element expressed as

178 Turbulent evaporation from bluff-rough porous surfaces
κ − −=
2 2
0
ln wsgc
sc
z hz
(8.19)
where 0scz (m) is the roughness height of the fully covered surface (≈ 0sz ).
We note that such picture of interactions between bluff-body elements and turbulent airflow that induces patterns of momentum transfer to the surface (parameterized by the friction velocity) could incorporate aspects of the proposed zonation scheme developed above (Eqs. (8.3) and (8.9) to (8.11)). The zonation model considers changes in turbulent eddy distribution (parameterized by α ) interacting with the surface that directly affect the friction velocity (Eq. (8.4)) and viscous sublayer thickness adjacent to the surface (Eq. (8.3)). However, for generalization of the modeling approach and to improve predictive capabilities of the shape parameter α , we combine Eqs. (8.4) and (8.15) to obtain a new parametric representation of the important α parameter. The representation yields an average eddy distribution shape parameter for a surface with obstacles (α ) that is independent of the thermal measurements and not restricted to integer values, given as
( )α
λ η η η= −
− + − +
0.3 1(1 ) (1 )r rg s c sgf f f
(8.20)
The mean shape parameter defined in Eq. (20) reflects variations in the characteristics of the eddy population (with specific size and velocity) as a function of bluff-body roughness density that penetrates through the roughness elements and interacts with the evaporating base surface. Considering that the drag-partitioning-based mean shape parameter intrinsically includes the physical interactions between turbulent airflow and bluff-body obstacles, it can simply be combined with basic flat surface evaporation model (Eq. (8.6)) and obtain corresponding mass loss rates from bluff-rough surfaces. Combining Eqs. (8.3), (8.4), (8.6), and (8.20), and assuming a relatively constant value of ( ) 21g α = for a practical range of α values [Haghighi and Or, 2013], we quantify an upscaled mean evaporation rate _bluff drage(kg/s) from a bluff-rough evaporating porous surface as a function of roughness density (or roughness frontal area index) λ as
η= ⋅ −_ (1 )bluff drag flat tote E A (8.21)

Chapter 8 179 where the fraction of obstacle cover index η is defined in Eq. (8.16) as a function of λ . Considering that η varies from 0 to 1, the corresponding range of variations in λ follows λ≤ ≤ ⋅0 ( )obsd h A .
8.3 Experimental Considerations
The proposed zonation model was tested using evaporation experiments conducted under controlled boundary conditions in a small wind tunnel ( ×L W×H : 1.2 1.2 0.2× × m; see Figure 8.3). The wind tunnel was equipped with four blowing fans with built-in straightener grids (TAR/L, LTG Inc., Germany) providing stable airflows over the evaporating surface ( ×4 1040 m3/h @ 1050 rpm). A schematic of the experimental setup is illustrated in Figure 8.3.
A sand-filled box ( × ×1.0 1.0 0.3 m) with grain sizes ranging from 0.3 to 0.9 mm and θ = 0.4s was used as the evaporating medium. Non-evaporating circular cylinders with prescribed geometries ( = 100d mm and = 150h mm) and spatial arrangements were used as bluff-body obstacles protruding from the surface (Figure 8.3). The sand-filled box was connected to a Mariotte bottle to maintain a constant water table depth (drying front depth) below the surface and thus enabling control and maintenance of constant surface water content (Eq. (8.10)). The characteristic evaporative length for the sand was estimated as = 130CL mm based on the method of Lehmann et al. [2008].
The temperature field at the surface was resolved using an IR imager sampling at 30 Hz. We have used an IR thermal camera (FLIR SC6000, FLIR Systems, MA, USA) with a noise equivalent temperature difference (NETD) of 35 mK @ 30oC. The IR imager is equipped with a quantum well infrared photon (QWIP) detector capable of recording infrared radiation in a narrow range of wavelength of 8.0 to 9.2 micron at high resolution ( ×640 512 pixels). The integration time of the detector is 10 ms and it is equipped with a linear Stirling cooler. The thermal images were converted to the surface temperature assuming a constant surface emissivity of 0.95 [Mira, 2007]. The acquired images are transferred to a dedicated PC with ThermaCAM Researcher software (FLIR Systems, MA, USA) for subsequent analyses.

180 Turbulent evaporation from bluff-rough porous surfaces
Figure 8.3: Experimental setup used to study evaporation from bluff-rough sand surfaces into prescribed turbulent airflow regimes: (1) infrared camera resolving surface temperature field ( sT ) during sand surface drying; (2) logger for single point (and low frequency) measurement of ambient temperature aT and relative humidity in the middle of the duct tunnel above the test surface; (3) wind production chamber; (4) blowing fans; (5) high-frequency 3D ultrasonic anemometer measuring airflow velocity field near the surface ( aU ) at 30 Hz; (6) sand-filled box (
× ×1.0 1.0 0.3 m) with particle sizes ranging from 0.3 to 0.9 mm and porosity of 0.4; (7) Mariotte bottle adjusting water table depth (L ) in the soil sample; and (8) balance.
Details of air velocity field adjacent to the surface ( aU ) were recorded at the edge
1
2
3
4 5
7
8
0.2
m
1.2 m
6
L
1
1 2
Horseshoe vortex
Wake vortices
1 2
6
3 4 d
h

Chapter 8 181 of the evaporating surface using a 3D ultrasonic anemometer with 0.01 m/s accuracy (WindMaster, Gill Instruments Ltd., The Netherland) acquiring measurements at 30 Hz. The temperature and relative humidity of the ambient were monitored at a distance of 100 mm above the test surface (in the middle of the duct tunnel) using a temperature and humidity transmitter (HUMICAP®, HMT337, Vaisala, Finland). Evaporative mass loss from the soil sample was measured using a heavy duty floor balance equipped with four beam load cells (H8C-Cx-250kg-4B, Zemic, Netherlands) with an accuracy of ≤ ±0.023% (which implies a water mass loss accuracy of ±1 kg) and monitored by a controlling unit (PS Plus, Swiss Waagen, Switzerland).
8.4 Results and Discussion
Using IRT-measured surface temperature field and mass loss measurements, we first report experimental and theoretical results evaluating the performance of the proposed zonation model (Eqs. (8.9) to (8.11)) in describing localized aerodynamic boundary conditions and associated localized evaporative fluxes from a wet sand surface covered with a single low-aspect-ratio cylinder subjected to turbulent airflows. Next we present results for evaporation from sand surfaces covered by multiple circular cylinders (with different densities), and finally evaluate the performance of the generalized model (Eqs. (8.20) and (8.21)) for upscaling evaporation rates as a function of roughness density potentially applicable for natural bluff-rough surfaces.
8.4.1 Surface Evaporation Dynamics Affected by a Protruding Circular Cylinder
8.4.1.1 Thermal Manifestation of Enhancing Mechanisms
In the absence of short-wave radiation effects (as in the laboratory experiments reported here), the temperature of an evaporating surface is typically lower than that of the flowing air [Shahraeeni and Or, 2010]. Consequently, hot and cold regions on an evaporating surface (obtained by IRT measurements) are indicative of regions with relatively low and high evaporation rates, respectively [Shahraeeni and Or, 2010; Haghighi and Or, 2015a]. The pattern of surface temperature thus enables qualitative (and simple quantitative) inferences on interactions between surface geometry and airflow boundary layer affect “local” evaporative fluxes during stage-I.
Spatially-resolved snapshots of surface temperature 5 hrs after initiation of the

182 Turbulent evaporation from bluff-rough porous surfaces evaporation test for a flat sand surface with and without a single cylindrical bluff element for low and high wind speeds are depicted in Figure 8.4. The sand surface was kept at constant saturation by constant supply from a shallow water table of depth 50mm below the surface. The images show the spatial distribution of surface temperature field over a footprint of ×500 500 mm in the center of the
×1000 1000 mm test surface. The cylinder is indicated with a black circle in these and the following snapshots, and the white circular ring around it is excluded from data. The warm and cool spots observed in the IR images (under low and high wind speeds) show evaporation signatures from the surface reflecting three distinct zones associated with near-surface airflow turbulence interacting with the surface and their relative contribution to mean surface evaporation during stage-I.
Figure 8.4: Spatially-resolved snapshots of surface temperature at time 5 hrs (from the onset of evaporation tests) during flat and bluff-rough (single circular cylinder of diameter 100d = mm and height 150h = mm) sand drying under low ( 0.7aU = m/s) and high ( 3.5aU = m/s) wind speeds with 296aT = K and 30RH = % (arrows indicate wind direction). The horseshoe vortex on the cylinder base (zone 1), the wake region downstream of the cylinder (zone 2), and unaffected surface region (zone 3) are evident. Note different ranges of color bars in different parts of Figure 8.4.
Low wind speed ( 0.7aU = m/s) High wind speed ( 3.5aU = m/s)
Surfa
ce T
empe
ratu
re (K
) Su
rface
Tem
pera
ture
(K)
1
2 3

Chapter 8 183 The horseshoe vortex system on the cylinder base (zone 1), wake vortices downstream of the cylinder (zone 2), and the turbulence-unaffected zone (zone 3) are evident from the surface thermal snapshots. The results reveal that the horseshoe vortex enhances mass (and heat) transfer in the region upstream of and around the protruding cylinder giving rise to stronger evaporative cooling. Mass transfer enhancement is also observed in the “cold” wake region downstream of the cylinder with a form elongated in the streamwise direction associated with mean flow reattachment and high intensity of the cylinder tip vortex starting from the top of the relatively short cylinder that stretch the wake zone [Giordano et al., 2012; Sumner, 2013].
8.4.1.2 Localization of Airflow Turbulence and Viscous Sublayer
The surface-airflow interactions that shape the observed surface temperature patterns could be described by the physical model presented in Eqs. (8.3) to (8.6). The model explicitly accounts for the impact of airflow turbulence (parameterized by the shape parameter of the eddy residence time distribution α ) on sensible and latent heat exchanges across a viscous sublayer forming next to the evaporating surface whose thickness is strongly influenced by α (Eq. (8.3)). Haghighi and Or [2015a] have recently shown that a single-point rapid thermal measurement (with a spatial resolution of larger than the representative elementary area of the surface) over homogenous evaporating surfaces provides necessary information for inferences of turbulent interactions and resulting viscous sublayer thickness and evaporative fluxes based on thermally-deduced eddy residence time distributions.
We analyzed IR-measured surface temperature fluctuations at points located in the various regions around the cylindrical obstacle (a typical surface temperature time series under low wind velocity is depicted in Figure 8.5a). The statistical values were used to deduce the eddy spectrum shape parameter α (representing a characteristic of the momentum field [Haghighi and Or, 2015a]) for different zones as depicted in Figure 8.5b. The eddy residence time distributions depicted in Figure 8.5b were obtained from the time difference between two consecutive peak and valley points in the surface temperature time series (see Figure 8.2), as described in Haghighi and Or [2015a]. In practice, there is a lower threshold for the time difference between consecutive peaks and valleys longer than the measurement’s “sampling time” (1/Hz), otherwise, these are considered as noise and filtered out, accordingly. We note that time differences belonging to a surface temperature difference of smaller than the IR camera’s NETD are also treated as noise and filtered.

184 Turbulent evaporation from bluff-rough porous surfaces
Figure 8.5: Thermal characterization of the turbulent momentum field: (a) single-point surface temperature time series of three distinct zones during sand drying under low wind condition ( 0.7aU = m/s); (b) thermally-deduced eddy residence time extracted from surface thermal fluctuation in (a) with fitted gamma distribution providing corresponding eddy distribution shape parameter (α ); and (c) local variations of viscous sublayer thickness under three different airflow velocities (0.7, 1.8, and 3.5 m/s) using thermally-deduced eddy distribution shape parameters.
The fitted gamma density functions (lines) to the experimental data (symbols) in Figure 8.5b provide shape parameter of eddy residence time distributions characterizing nature of airflow turbulence interacting with the surface that varies locally (and are otherwise inaccessible by direct local measurement by other means). The results reaffirm that zones 1 and 2 (with α values smaller than zone 3) experience a “stronger” turbulent momentum field dominated by smaller-scale eddies [Haghighi and Or, 2013] indicating the role of horseshoe and wake vortices upstream and downstream of the cylinder, respectively. Such qualitative picture of
(c) α=2
1
2
0 1
0 1
(b) α=1
α=1
α=2
(a)

Chapter 8 185 the variability of turbulent interactions over the surface is translated to viscous sublayer thickness that directly controls evaporative fluxes during stage-I evaporation [Haghighi and Or, 2013]. Substituting the shape parameters obtained from Figure 8.5b into Eqs. (8.3) to (8.5) yields local variations of the mean viscous sublayer thickness over different zones around the protruding cylinder (Figure 8.5c). The results shown in Figure 8.5c reveal that the horseshoe and wake vortices generate a relatively strong turbulent field over zones 1 and 2, respectively that locally enhance vapor transfer from the surface across a thinner viscous sublayer [Schlünder, 1988; Shahraeeni et al., 2012; Haghighi et al., 2013].
8.4.1.3 Localized and Mean Evaporative Fluxes
The primary application of thermally-deduced interacting eddy distributions presented in the previous section is the estimation of the viscous sublayer thickness, a function of the eddy spectrum shape parameter α (Eqs. (8.3) to (8.5)). This enables estimation of local and mean evaporation fluxes from porous surfaces with a single protruding bluff-body obstacle (Eq. (8.9)). The localized evaporative fluxes (
jE in Eq. (8.9)) were estimated for the prescribed surface and aerodynamic conditions ( = 0.1r mm, θ = 0.4s , θ θ = 0.05r s , = 130CL mm, = 50L mm, with the pattern of sT from IRT data presented in Figure 8.4, = 296aT K,
= 30RH %, = 0.7aU to 3.5 m/s, and δ from Figure 8.5c).
Figure 8.6: Localized surface evaporative fluxes: (a) comparison between physical model estimates (Eq. (6)) and diagnostic predictions of the 3T model for local evaporative fluxes (from three distinct zones) under three different wind velocity of 0.7, 1.8, and 3.5 m/s (symbol size increases by increasing wind velocity); (b) a typical snapshot of surface evaporative fluxes (spatial distribution) obtained from the 3T model of Qiu and Zhao [2010] based on the surface temperature snapshot presented in Figure 8.4 under low wind speed condition ( 0.7aU = m/s).
(kg/m2hr)
(b)
2 3
1 (a)

186 Turbulent evaporation from bluff-rough porous surfaces Figure 8.6a shows model predictions of local evaporative fluxes compared with diagnostic predictions of the simple 3T model of Qiu and Zhao [2010] that uses the surface temperature field and integrates local evaporative fluxes. The 3T model uses information on air temperature as well as wet and dry soil temperatures to link surface thermal measurements with surface soil water content and estimate spatial distribution of surface evaporation fluxes (Figure 8.6b) [Qiu et al., 1998]. The comparison shown in Figure 8.6a confirms the results obtained by the physical zonation model predictions (Eq. (8.9)) regarding the relative contributions of the three turbulence-affected zones to surface evaporation in the presence of a shallow water table (surface averaged evaporation rates predicted by the 3T model are presented in Table 8.1).
Table 8.1: Measured and predicted mean evaporation rate data
aU (m/s) Mean Evaporation Rate (kg/hr) Flat Single Multiple-4 Multiple-9
Experiment= 0.7 0.12(0.05) 0.13(0.05) 0.18(0.08) 0.22(0.07) 1.8 0.20(0.06) 0.28(0.05) 0.43(0.10) 0.57(0.10) 3.5 0.25(0.10) 0.33(0.08) 0.60(0.13) 0.91(0.05)
3T Model 0.7 0.16 0.14 0.19 0.24 1.8 0.20 0.28 0.45 0.60 3.5 0.30 0.41 0.66 0.94
Physical Model
0.7 0.14 0.15 0.20 0.16 1.8 0.23 0.29 0.47 0.61 3.5 0.33 0.40 0.68 1.01
=values in parenthesis indicate standard deviation of measurements: 4 runs for flat surface, 5 runs for Single and Multiple-4, and 3 runs for Multiple-9.
In addition to local evaporative fluxes, we compared model predictions of mean evaporation flux (Eq. (8.9)) from a flat sand surface ( = 1totA m2) with and without a cylindrical obstacle with measured mass loss rates (Figure 8.7). The mean evaporation flux (E in kg/m2hr) is the measure of average mass loss rate (e in kg/hr) per unit evaporating surface area ( evapA ). Thus, experimentally determined mean evaporation fluxes (total of 9 experiments – see Table 8.1) were extracted from weighing mass loss of the evaporating sand samples and the total active evaporating area (i.e., = evapE e A ).
The results shown in Figure 8.7 reveal that the overall pattern of measured evaporation fluxes and mass loss rates were described reasonably well by the physical model (absolute mass values are given in Table 8.1). These results also

Chapter 8 187 reveal that evaporative fluxes from the surface with the cylindrical obstacle were enhanced compared to the corresponding flat surface (the flux ratios are larger than unity). This result was anticipated by the model and is attributed to the evaporative flux enhancement from zones 1 and 2 with a thinner boundary layer (Figures 8.5 and 8.6). Hence, despite a reduction in the active evaporating area (obstacle base), evaporation fluxes (and rates) were enhanced relative to the flat surface (see also results in sections 8.4.2 and 8.4.3).
Figure 8.7: Predicted and measured mean evaporation flux ratios (per saturated flat surface) from the evaporating sand sample with a single circular cylinder in cross flow under three different air velocity of 0.7, 1.8, and 3.5 m/s. Sand surface was kept saturated ( 0.4surfθ ≈ ) by fixing a constant water table below the surface ( 50L = mm). The evaporation enhancement (relative to flat surface drying) inferred from both measurements (measured mass loss and surface temperature field) and model predictions reveal contribution of horseshoe and wake vortices to surface evaporation fluxes.
Moreover, the observed and predicted results exhibited an increasing evaporation flux ratio with increasing wind velocity. Considering that the formation and intensity of horseshow vortex system and wake vortices near the base surface of a protruding cylinder is sensitive to the wind velocity (or the friction velocity), evaporation enhancement (relative to a flat surface) increases with increasing wind velocity. In other words, interactions between stronger turbulent airflows with a protruding obstacle result in formation of vortices with higher shear stress (smaller α ) that induce thinner mean viscous sublayers relative to the corresponding flat

188 Turbulent evaporation from bluff-rough porous surfaces surface with a velocity-independent 3α = (see Figure 8.5c).
The results also show that the discrepancy between model prediction and measured data decreases by increasing wind velocity that could be accounted for by likely impacts of the protruding cylinder on spatial heterogeneity of mean airflow velocity above the test surface in the experiments. By increasing wind velocity, the damping effects of the obstacle on the mean velocity of the stronger turbulent airflow field reduces and the model assumption of a constant mean wind velocity everywhere above the test surface becomes more evident (see also thermal images presented in Figure 8.8 exhibiting a reduction in wind velocity in streamwise direction).
8.4.2. Evaporation from Sand Surfaces with Multiple Protruding Cylinders
In addition to experiments with single protruding obstacle, we conducted a series of drying tests with sand surfaces covered by a number of similar circular cylinders arranged in-line with a constant spacing of 200 mm. Similar to results obtained for single obstacle, IRT measurements of evaporating sand surfaces with multiple protruding cylinders indicate formation of horseshoe and wake vortices enhancing evaporative cooling of surface skin temperature (relative to a similar flat surface), as illustrated in Figure 8.8. The thermal images in Figure 8.8 show that airflow turbulent interactions with the surface increase with the number of cylindrical obstacles protruding from the surface. The impact is indicated by higher evaporative cooling for the sand surface covered by 9 cylinders.
Figure 8.9 shows the comparison between model predictions of mean evaporation flux ratios (Eq. (8.11)) and measured mass loss data that reveals an enhancement in evaporative fluxes (relative to a similar flat surface) obtained from 12 experiments (see Table 8.1). The enhanced evaporation fluxes from bluff-rough surfaces relative to the flat surface predicted by the physical zonation model (Eq. (8.11)) reveal the role of protruding obstacles on generating stronger turbulent structures (with smaller α ) interacting with the surface that induce thinner viscous sublayers (α = 3flat and α = 2bluff to 0). Similar to results presented in Figure 8.7, the larger discrepancies between model predictions and measured data at low wind velocities could be attributed to likely wind velocity deceleration along the evaporating test surface in experiments (as evidenced by thermal images shown in Figure 8.9 with decreasing evaporative cooling along the surface under low wind velocity condition) that is not considered by the simple zonation model.

Chapter 8 189
Figure 8.8: Spatially-resolved snapshots of surface temperature at time 5 hrs (from the onset of evaporation tests) during flat and bluff-rough (multiple circular cylinders of diameter 100d = mm and height 150h = mm with two different arrangements) sand drying under low ( 0.7aU = m/s) and high ( 3.5aU = m/s) wind speeds with 296aT = K and 30RH = % (arrows indicate wind direction). Thermal snapshots imply a systematic enhancement in surface evaporative fluxes (increasing evaporative cooling) by increasing number of obstacles protruding from the surface. Note the different ranges of color bars in different parts of Figure 8.8.
Low wind speed ( 0.7aU = m/s) High wind speed ( 3.5aU = m/s)
Surfa
ce T
empe
ratu
re (K
) Su
rface
Tem
pera
ture
(K)
Surfa
ce T
empe
ratu
re (K
)
200 mm
200
mm
200 mm
200
mm

190 Turbulent evaporation from bluff-rough porous surfaces
Figure 8.9: Predicted and measured mean evaporation flux ratios (per saturated flat surface) from the evaporating sand sample covered with (a) 4 circular cylinders in triangle arrangement and (b) 9 circular cylinders in square arrangement under three different air velocity of 0.7, 1.8, and 3.5 m/s while the sand surface was kept saturated ( 0.4surfθ ≈ ). The evaporation enhancement (relative to flat surface drying) inferred from both measurements (measured mass loss and surface temperature field) and model predictions reveal contribution of airflow turbulence generated in the near wake region of cylinders to surface evaporation fluxes.
Comparing mass loss results presented in Figures 8.7 and 8.9 reveals a systematic increase of evaporation flux enhancement by increasing wind velocity and the number of protruding obstacles. In other words, mass loss from the system is
(a)
(b)

Chapter 8 191 increasing while the active evaporating area decreases by increasing the number of non-evaporating obstacles (as also confirmed from the absolute values given in Table 8.1). We note that the relatively good performance of the mechanistic zonation model (Eq. (8.11)) in capturing measured response of small drying bluff-rough surfaces (1 m2) covered by low obstacle/roughness density ( 0.2λ < ) may not reflect the response of surface with high obstacle density could affect the flow field [Shao and Yang, 2005; Huthoff, 2012; Nepf, 2012]. In the following section, we present analysis of the generalized drag-partitioning-based model (Eq. (8.21)) accounting for such interactions for high density obstacles that are not described by the proposed zonation model in Eq. (8.11) that is limited to low obstacle density.
8.4.3 Generalized Bluff-body Model Predictions for Mean Evaporation Rates
Evaluating the drag-partitioning-based generalized model defined in Eqs. (8.20) and (8.21) for the prescribed boundary conditions enables prediction of mean evaporative mass loss rates as functions of wind velocity and bluff-body roughness density (λ ). Results presented in Figures 8.10a and 8.10b reveal the performance of the proposed mean eddy spectrum shape parameter (Eq. (8.20)) to account for the variations in momentum transfer to a bluff-rough surface with λ . The good agreement between model predictions and area-weighted measured data in Figure 8.10a inspires a confidence to the drag-portioning-based generalized approach that accounts for the impact of roughness density on interacting eddy population transferring momentum from the mean airflow to the surface. By increasing the roughness density from λ = 0 (flat surface) to λ ≈ 0.2c , airflow-obstacle interactions result in formation of smaller scale eddies (Figure 8.10a) with larger penetration depth that enhances momentum transfer and shear stress at the surface inducing thinner boundary layer thicknesses (Figure 8.10b). As the roughness density increases to values larger than λc , penetration of background turbulence to the surface considerably reduces due to the mutual sheltering among the bluff-body roughness elements [Shao and Yang, 2005; Huthoff, 2012; Nepf, 2012] such that the relatively stagnant (low-velocity) air volume entrapped between obstacles are considered as large eddies with sizes of the order of obstacles’ height with relatively low shear stress and thick viscous sublayer thickness.

192 Turbulent evaporation from bluff-rough porous surfaces
Figure 8.10: Predicted variations in the momentum transfer (penetration) from turbulent airflows to bluff-rough surfaces with roughness density: (a) Comparison between predicted mean (line) and measured area weighted (symbols) shape parameters for a moderate wind velocity of 1.8 m/s, and (b) corresponding variations in friction velocity and mean viscous sublayer indicated by solid and dashed lines, respectively. Considering that bluff-body obstacles in this study are of circular cross section that protrude from a square flat surface, the basal-area index (η ) does not reach unity and thus the results have been truncated at
max ( 1)λ λ λ η< = = , as indicated by the red arrow in (a).
Using the results of Eq. (8.20) as the inputs, Figure 8.11 shows the comparison between generalized model predictions for mean evaporation rates (Eq. (8.21)) and
(a)
(b)

Chapter 8 193 measured mass loss rates from sand surfaces covered by circular cylinders of prescribed geometry ( = 100d mm and = 150h mm) with different frontal area indices (λ = totNdh A ) subjected to low ( = 0.7aU m/s – solid line) and high (3.5 m/s – dashed line) wind speed conditions. The values of −= = × 4
0 0 7.5 10s scz h z h, = 1.5wz h , and γ = = 150rg sg were estimated from Shao and Yang [2008] for the calculations in Eq. (8.21). The reasonably well agreement between model predictions and experimental data inspires a confidence to the reconciliation procedure based on the drag partitioning concepts.
Figure 8.11: Drag-partitioning-based generalized model predictions (lines) of mean evaporation rates from bluff-rough bare soil surfaces (covered with non-evaporating surface-mounted circular cylinders of diameter 100d = mm and height 150h = mm) subjected to low (0.7 m/s – solid line) and high (3.5 m/s – dashed line) wind velocities while the roughness density (or roughness frontal area index) varies from
0λ = (flat surface with no obstacle) to max 4 1.9h dλ π= = indicating a fully covered surface ( 1η = ).
The results show that despite the decreasing active evaporating area (by increasing λ up to the critical value of λ ≈ 0.2c ) the mean evaporation rate from the surface increases. Considering results presented in Figure 8.10, this is accounted for by enhancing momentum transfer (shear stress) to the surface resulting from small scale eddies with thinner viscous sublayers. Further increase in λ results in reduced shear stresses at the surface as the surface is shielded from the background turbulence such that evaporation rates from the surface decreases monotonically until λ reaches λmax where the surface is fully covered by non-evaporating
Model (Eq. (21))
Exp. (single) Exp. (multiple-4) Exp. (multiple-9)
3.5 m/s
0.7 m/s

194 Turbulent evaporation from bluff-rough porous surfaces roughness elements (η = 1) and surface evaporation no longer occurs ( = 0bluffe ).
8.5 Summary and Conclusions
We developed a physically based zonation model for evaporation from porous surfaces covered by non-evaporating protruding circular cylinders that explicitly accounts for key variables (roughness density and boundary layer localization) influencing evaporation rates during stag-I. The pore-scale diffusion-turbulence model of Haghighi and Or [2013], coupled with concepts from the SR theory and fluid flow dynamics over roughened surfaces, was extended by incorporating airflow interactions with low-aspect-ratio circular cylinders protruding from the surface resulting in localization of viscous sublayer thickness adjacent to the base surface. The zonation model also considers subsurface interactions that affect surface water content and capillary flows towards the evaporating base surface during stage-I evaporation. The localization of boundary layer interactions developed in this study provides a simple theoretical framework for quantifying evaporation rates and fluxes from natural base soil surfaces covered partially with low-aspect-ratio boulders and shrubs.
A modeling approach was developed to explicitly account for the localized nature of airflow turbulence near the surface (reflected in the eddy spectrum shape parameter and corresponding mean viscous sublayer thickness) and its effects on the resulting heat and mass exchange. The proposed zonation model provides mechanistic description of the localized evaporative fluxes and the enhancement mechanisms manifested at the surface temperature field during laboratory-scale drying experiments (with single and multiple protruding obstacles). The observed and predicted (local and mean) evaporation enhancement due to the formation of horseshoe and wake vortices upstream and downstream of the cylinder, respectively, were in good agreement with studies in the literature [e.g., Goldstein et al., 1985; Chyu and Goldstein, 1991; Giordano et al., 2012; Sumner, 2013], and with mass loss measurements. The model predictions and measured data highlight a systematic increase in evaporation enhancement by increasing wind velocity and number of protruding obstacles that could be accounted for by the role of roughness density (or frontal area index) λ (-) on drag partitioning and momentum transfer to the surface (changes in the nature of airflow turbulence interacting with the base surface).
The generalization to effective surface behavior combined concepts from the drag partitioning theory with the proposed physical zonation model using roughness

Chapter 8 195 density parameter λ (-) to describe changes in the drag acting on the roughness elements and on the intervening surface as a function of roughness type, size and spacing. Model predictions and observations exhibited evaporation rate enhancement by increasing λ to a critical value of λ ≈ 0.2c (despite decreasing active evaporating area) where scalar transfer is dominated by smaller-scale eddies (higher friction velocity). By increasing λ to values larger than λc mutual sheltering among the roughness elements becomes important and reduces shear stresses at the surface. Hence, evaporation rates from the surface decreases until λ reaches a maximum value of λmax (linked to obstacle geometry) where the surface is fully covered by non-evaporating roughness elements and evaporation no longer occurs accordingly.
The physically based modeling framework was successfully tested for relatively small-scale evaporating test surfaces covered by low density and short obstacle arrays. We have not examined conditions where mean wind velocity is affected by interactions with extensive and dense obstacle arrays. Such systems may give rise to the formation of a new boundary layer downstream. Furthermore, interactions between larger scale (a few meters in height) obstacles with significant parts of the logarithmic wind profile that may excite a larger spectrum of eddy sizes were not studies here (other than via the eddy spectrum shape parameter α ) and may require additional considerations. We finally envision that the approach could provide a building block for upscaling evaporation predictions to landscape-scale applications with incorporation of shortwave radiation and associated geometrical interactions that would enhance localization of surface energy balance components in addition to the localized effects presented here.
Acknowledgements
The authors gratefully acknowledge funding by the Swiss National Science Foundation of the project “Evaporation from terrestrial surfaces – linking pore scale phenomena with landscape processes” (200021-113442) and the financial support of the German Research Foundation DFG of the project “Multi-Scale Interfaces in Unsaturated Soil” (MUSIS; FOR 1083). Technical assistance of Daniel Breitenstein and Hans Wunderli (ETH Zurich) is greatly appreciated.

Chapter 9
Concluding Remarks and Outlook
Despite the ubiquity of evaporative processes in many engineering and natural applications and their strong influence on energy balance of terrestrial surfaces and the hydrologic cycle, the basic interactions between aerodynamic conditions and porous media properties constraining evaporative supply and dynamics remain primarily empirical. This PhD thesis presents physically based models and experimental methods addressing links between surface-atmosphere interactions and evaporation dynamics during stage-I evaporation (vaporization plane at the surface) to account for new fundamental aspects of evaporative water losses from porous surfaces defining landscape-scale fluxes and drying dynamics. We specifically addressed joint effects of surface and aerodynamic properties on stage-I evaporation dynamics upscaling fluxes from discrete pores as a surface progressively dries out to macroscopic evaporative losses from terrestrial surfaces. The research presented in this dissertation potentially provides new information and upscaling schemes for bridging the gap between porous medium controls at laboratory- and field-scales and would broaden the physical basis for (i) quantifying coupling between soil and atmosphere (mass and energy fluxes); (ii) accounting for processes controlling spatio-temporal patterns of evaporative losses (heterogeneity and topography); and (iii) developing physically based boundary conditions for operational hydrologic and climatic continuum models.
9.1 Main Findings and New Insights
This PhD thesis consists of three different parts addressing different aspects of evaporation dynamics from engineered and natural porous surfaces subjected to turbulent airflows. In a series of theoretical and experimental studies, the following areas have been analyzed extensively:
1. The first part of the thesis (chapters 2 and 3) addresses joint effects of surface and aerodynamic conditions on evaporative fluxes from porous

Chapter 9 197
surfaces. Our systematic analyses of a complete advection-diffusion equation for isothermal evaporation from porous surfaces (in chapter 2) have shown the dominant contribution of vapor diffusion (relative to advection) to surface evaporative fluxes into a convective airflow boundary layer for a practical range of surface and airflow conditions. In practice, one could consider diffusion only for vapor transport across boundary layer (decoupled from advection by the velocity field) in which the sole role of air velocity is to define the thickness of the viscous sublayer across which mass exchange takes place. This latter option is convenient and opens numerous possibilities for application of simple diffusion based analytical solutions (such as the Schlünder’s [1988] model) to describe fluxes from porous surfaces as a superposition of diffusion solutions from pores.
2. The dominant contribution of diffusion to evaporation from porous surfaces enabled us to use the simple and analytical diffusion solution of Schlünder [1988] and formulate a generalized top boundary condition for effective resistance to diffusive evaporation rates. This newly developed top boundary condition links joint effects of soil type, surface water content and boundary layer characteristic into a simple and physically based analytical expression. The performance of the diffusion-based evaporative resistance model was experimentally evaluated by laboratory- and field-scale drying tests reported in the literature, with promising results for a wide range of experimental conditions.
3. To account for the role of airflow turbulence on diffusive evaporative fluxes from natural surfaces to turbulent airflows, in chapter 3 we used a detailed formulation of the surface renewal (SR) theory with explicit account of surface-eddy exchange during a certain eddy residence time over the surface. The proposed mechanistic model explicitly accounts for localized (and intermittent) variations in the viscous sublayer thickness as determined by eddy characteristics that directly affect local and instantaneous evaporative fluxes into a surface-interacting eddy. The average surface evaporative flux reflects interactions between surface diffusive fluxes and a population of eddies with different residence times over the surface. Explicit consideration of the eddy residence time distribution (following the gamma statistical distribution) enabled us to extract an effective viscous sublayer thickness as a function of turbulent airflow characteristics that explicitly accounts for the effect of the eddy spectrum on the mass exchange process.

198 Concluding remarks and outlooks
4. The second part of the dissertation (chapters 4 and 5) focused on intermittent and spatial surface temperature dynamics associated with turbulent eddy-surface interactions during stage-I evaporation. In chapter 4 we extended the diffusion-turbulence model established in the first part for turbulent exchange from evaporating surfaces to explicitly consider instantaneous and local variations in surface energy balance induced by evaporative cooling beneath eddy footprints. The resulting inherent coupling between airflow turbulence characteristics and structured surface thermal fluctuations observable by rapid and high resolution infrared thermography (IRT) offered opportunities for using a resolved thermal regime to estimate (invert for) the momentum field fluctuations (turbulent structures). The results also showed that the inferred statistical properties of surface thermal fluctuations (and turbulence) are independent of the measured location over homogeneously wet surfaces. Such spatially-consistent results are of practical importance suggesting the possibility of replacing costly IRT by low cost and simpler single-point IR measurements (with a spatial resolution of larger than the representative elementary area of the surface) useful for widespread field and industrial applications.
5. In chapter 5 we further evaluated likely effects of surface hydro-thermal properties (water content, volumetric heat capacity, and effective thermal thickness) on the attenuation of surface temperature fluctuations to expand applicability of the new surface-temperature-based approach to field- and landscape-scale applications with relatively high thermal inertia (e.g., water evaporation from bare soil surfaces). Theoretical and well-controlled experimental results of stage-I evaporation from smooth bare soils revealed a predictable shift in thermally-deduced eddy residence time distributions (reflected in the rate parameter of the corresponding gamma distribution). These relations were formalized in theoretical expressions for predicting surface water content and evaporative fluxes from bare soil surfaces.
6. The last part of the dissertation (chapters 6 to 8) addressed the role of landscape processes (atmospheric stability and interactions between land surface heterogeneity and incoming solar radiation and atmospheric boundary layer turbulence) in drying dynamics of terrestrial surfaces and their incorporation into pore-scale surface-based methods. In chapter 6 we proposed a reconciliation (flux matching) procedure to improve surface-based estimates large scales of interest where water vapor concentration at

Chapter 9 199
the top of the viscous sublayer was modified to include atmospheric stability considerations based on the concepts from the Monin-Obukhov similarity theory (MOST). The proposed reconciliation procedure improves estimation capabilities of both flux-profile and surface BL formulations, and considerably enhances their accuracy of flux estimation when applied theoretically (in the absence of measured profiles) to drying bare soil surfaces.
7. In chapters 7 and 8 we systematically incorporated the effects of land surface relief and irregularities on localization of external (airflow turbulence near the surface and incoming solar radiation) and internal (soil hydraulic properties and surface wetness) boundary conditions directly affecting surface evaporative fluxes by extending applications of the mechanistic model established in chapter 3 to wavy and bluff-rough bare soil surfaces with prescribed geometries. In chapter 7, we developed a model for turbulent eddies interacting with an undulating evaporating surface with mean boundary layer that varies across sinusoidal wavy porous surfaces that was experimentally evaluated in a wind tunnel. Theoretical and experimental results suggested that evaporative fluxes can be either enhanced or suppressed (relative to a flat surface) due to complex interplay between local boundary layer thickness and internal limitations to water flow to the evaporating surface. For a practical range of air velocities (0.5 to 4.0 m/s), and for sinusoidal configurations studied (amplitudes of 50 to 100 mm), the evaporative mass loss (relative to the flat surface) was reduced by up to 60% for low surface aspect ratio and high wind velocity, and enhanced by up to 80% for high aspect ratio and low wind velocity.
8. We finally quantified the influence of geometrical interactions between aerodynamic boundary layer and bluff-body roughness elements affecting airflow turbulence near the surface and resulting surface fluxes. In chapter 8 we constructed a simple model for surface-turbulence interactions inspired from observations of spatio-temporal thermal patterns on evaporating porous surfaces adjacent to bluff-body obstacles that depict well-defined and persistent zonation of evaporation rates from the base surface. Experimental and theoretical results showed persistent enhancement of evaporative fluxes from bluff-rough surfaces relative to smooth flat surfaces under similar conditions. The enhancement is attributed to formation of horseshoe and wake vortices upstream and downstream of the cylinder, respectively,

200 Concluding remarks and outlooks
inducing a thinner boundary layer over part of the interacting surface footprint. For a practical range of air velocities (0.5 to 4.0 m/s), low-aspect ratio cylindrical bluff elements placed on evaporating sand surfaces enhanced evaporative mass loss (relative to a flat surface) by up to 300% for high density of elements and high wind velocity, similar to observations reported in the literature.
9. Combining the proposed model for bluff-rough surfaces with concepts from drag partitioning enabled us to generalize the model and upscale predictions to evaporation from surfaces with multiple obstacles. The generalized model incorporates the commonly used roughness density parameter (or frontal area index) describing changes in drag acting on the roughness elements and on the intervening surface as a function of roughness type, size and spacing. Model predictions and observations exhibited evaporation rate enhancement by increasing the roughness density to a critical value of about 0.2 (despite decreasing active evaporating area) where scalar transfer is dominated by smaller-scale eddies (higher friction velocity). For larger values of the roughness density (>0.2) mutual sheltering among the roughness elements becomes important and reduces evaporation rates from the surface (due to reduced shear stresses at the surface) until the surface is fully covered by non-evaporating bluff roughness elements (at a maximum value of roughness density linked to obstacle geometry) where surface evaporation no longer occurs.
9.2 Future Perspective
As a key component in the Earth’s hydrologic and energy balances, physically based large-scale parameterizations are critical for developing predictive capabilities to link soil properties and conditions with future evaporative losses. These are not only important for present day land and water resource management, but also for future climate change scenarios in which soil surface interactions are known to play a critical role. This PhD thesis presents relatively simple and parametric pore-scale models along with experimental methods addressing different aspects of surface-atmosphere interactions and their impacts on evaporative water losses from porous surfaces defining landscape-scale fluxes and drying dynamics. Although the good performance of the proposed models were tested by well-controlled laboratory-scale and limited field-scale measurements in different parts of the dissertation, additional test and further model improvements are required for applications to more general field conditions. In the following, we discuss some limitations of physically based

Chapter 9 201 models associated with simplifying assumptions that could be improved in future research:
1. The present modelling approach for evaporation from roughened surfaces (in chapters 7 and 8) does not consider the role of incoming shortwave radiation and associated geometrical interactions on evaporative fluxes from wavy and bluff-rough surfaces. Such interactions would enhance localization of surface energy balance components in addition to the localized effects of momentum field partitioning presented in this dissertation.
2. The model for evaporation from wavy surfaces (chapter 7) does not take into account likely impacts of wind flow direction and inclination on variations in viscous sublayer thickness along the wavy surface. This might also have an effect on wind penetration into the porous medium especially at low surface water contents that is not included in the present modelling framework.
3. The model established for evaporation from bluff-rough surfaces (chapter 8) is limited to convective airflow interactions with rigid low-aspect-ratio and non-evaporating cylindrical obstacles protruding from an evaporating porous surface (as the roughness elements). Thus, heat and mass exchange patterns to and from vegetated surfaces consisting of roughness elements which are characteristically of a more porous and fibrous nature (i.e., flexible and evaporating roughness elements) with non-cylindrical geometries may not be accurately accounted for by the present model.
4. The surface-temperature-based scheme established in chapters 4 and 5 for characterization of interacting airflow turbulence and surface hydro-thermal properties (as the inputs for quantification of local and mean evaporative fluxes) is limited to homogenously wet surfaces. Incorporation of surface heterogeneity considerations using similar concepts developed in chapters 7 and 8 for external momentum field heterogeneity over wavy and bluff-rough surfaces (as well as heterogeneities in internal soil transport properties) would broaden applicability of the thermally-based approach for (large-scale) hydrological applications potentially complementing classical momentum-based approaches.
5. Further modification of the reconciliation procedure established in chapter 6 (for physically based inclusion of surface characteristics and pore-scale

202 Concluding remarks and outlooks
effects of surface drying into widely used atmospheric-based approaches) by incorporating energetic aspects of surface drying through a more complete pore-scale surface energy balance closure would generalize application of the surface-based models developed in different parts of this dissertation to improve predictive capabilities of large-scale atmospheric-based methods not only in terms of evaporation fluxes but also surface temperature variations and sensible heat fluxes.


References Abramowitz, M., and I. A. Stegun (1972), Handbook of Mathematical Functions with Formulas, Graphs, and Mathematical Tables, 9th printing, Dover, New York.
Addison, P. S. (2002), The illustrated wavelet transform handbook: Introductory theory and applications in science, engineering, medicine and finance, The Institute of Physics, London.
Adrian, R. J. (2007), Hairpin vortex organization in wall turbulence, Phys. Fluids, 19, 041301, doi:10.1063/1.2717527.
Afgan, I., C. Moulinec, R. Prosser, and D. Laurence (2007), Large eddy simulation of turbulent flow for wall mounted cantilever cylinders of aspect ratio 6 and 10, Int. J. Heat Fluid Flow, 28, 561–574, doi:10.1016/j.ijheatfluidflow.2007.04.014.
Allmaras, R. R., W. W. Nelson, and E. A. Hallauer (1972), Fall vs. spring plowing and related heat balance in western corn belt, Minn. Agric. Stn. Tech. Bull., 283, 1-22.
Almeida, G. P., D. F. G. Durao, and M. V. Heitor (1993), Wake flows behind two-dimensional model hills, Exp. Therm. Fluid Sci., 7, 87-101, doi:10.1016/0894-1777(93)90083-U.
Aminzadeh, M., and D. Or (2013), Temperature dynamics during nonisothermal evaporation from drying porous surfaces, Water Resour. Res., 49, doi:10.1002/2013WR014384.
Aminzadeh, M., and D. Or (2014), Energy partitioning dynamics of drying terrestrial surfaces, J. Hydrol., 519, 1257-1270, doi:10.1016/j.jhydrol.2014.08.037.
Anderson, J. M., R. W. Duck, and J. McManus (1995), Thermal radiometry: a rapid means of determining surface water temperature variations in lakes and reservoirs, J. Hydrol., 173(1–4), 131–144, doi:10.1016/0022-1694(95)02714-Z.
Arya, S. P. (2001), Introduction to Micrometeorology, 2nd ed., Academic Press, London, UK.
Asher, W. E., H. Liang, C. J. Zappa, M. R. Loewen, M. A. Mukto, T. M. Litchendorf, and A. T. Jessup (2012), Statistics of surface divergence and their relation to air-water gas transfer velocity, J. Geophys. Res., 117, C05035,
203

doi:10.1029/2011JC007390.
Assouline, S., K. Narkis, and D. Or (2010), Evaporation from partially covered water surfaces, Water Resour. Res., 46, W10539, doi:10.1029/2010WR009121.
Assouline, S., K. Narkis, R. Gherabli, P. Lefort, and M. Prat (2014), Analysis of the impact of surface layer properties on evaporation from porous systems using column experiments and modified definition of characteristic length, Water Resour. Res., 50, 3933–3955, doi:10.1002/2013WR014489.
Atmane, M. A., W. E. Asher, and A. T. Jessup (2004), On the use of the active infrared technique to infer heat and gas transfer velocities at the air-water free surfaces, J. Geophys. Res., 109, C08S14, doi:10.1029/2003JC001805.
Baker, C. J. (1979), The laminar horseshoe vortex, J. Fluid Mech., 95(2), 347–367, doi:10.1017/S0022112079001506.
Baker, C. J. (1980), The turbulent horseshoe vortex, J. Wind Eng. Ind. Aerodyn., 6, 9–23, doi:10.1016/0167-6105(80)90018-5.
Balick, L. K., C. A. Jeffery, and B. Henderson (2003), Turbulence induced spatial variation of surface temperature in high resolution thermal IR satellite imagery, Proc. SPIE, 4879, 221–230, doi:10.1117/12.462447.
Bange, G. G. J. (1953), On the quantitative explanation of stomatal transpiration, Acta Bot. Neerl., 2(3), 255–296.
Baskaran, V., A. J. Smits, and P. N. Joubert (1987), A turbulent flow over a curved hill. Part 1. growth on an internal boundary layer, J. Fluid Mech., 182, 47-83, doi:10.1017/S0022112087002246.
Bhaganagar, K., J. Kim, and G. Coleman (2004), Effects of roughness on wall-bounded turbulence, Flow Turbul. Combust., 72(2), 463-492, doi:10.1023/B:APPL.0000044407.34121.64.
Bird, R. B., W. E. Stewart, and E. N. Lightfoot (2002), Transport Phenomena, 2nd ed., John Wiley and Sons, New York.
Bittelli, M., F. Ventura, G. S. Campbell, R. L. Snyder, F. Gallegati, and P. R. Pisa (2008), Coupling of heat, water vapor, and liquid water fluxes to compute evaporation in bare soils, J. Hydrol, 362(3), 191-205, doi:10.1016/j.jhydrol.2008.08.014.
Bou-Zeid, E., M. B. Paralange, and C. Meneveau (2007), On the Parameterization of Surface Roughness at Regional Scales, J. Atmos. Sci., 64, 216-227, doi:10.1175/JAS3826.1.
204

Bowers, S. A., and R. J. Hanks (1965), Reflection of radiant energy from soils, Soil Sci., 100(2), 130-138, doi:10.1097/00010694-196508000-00009.
Braaten, D. A., R. H. Shaw, and K. T. Paw U (1993), Boundary layer flow structures associated with particle reentrainment, Bound.-Lay. Meteorol., 65(3), 255–272, doi:10.1007/BF00705529.
Bradshaw, P. (1973), Effects of streamline curvature on turbulent flow, AGARDograph, 169, 1-131.
Breugem, W. P., B. J. Boersma, and R. E. Uittenbogaard (2006), The influence of wall permeability on turbulent channel flow, J. Fluid Mech., 562, 35-72, doi:10.1017/S0022112006000887.
Bristow, K. L., G. S. Campbell, R. I. Papendick, and L. F. Elliott (1986), Simulation of heat and moisture transfer through a surafce residue-soil system, Agr. Forest Meteorol., 36, 193-214, doi:10.1016/0168-1923(86)90035-3.
Brooks, R. H., and A. T. Corey (1964), Hydraulic properties of porous media, Hydrology Paper 3, Colorado State University, Fort Collins, Colorado.
Brusset, H., D. Depeyre, and T.L. Quang (1973), An estimation of the film penetration model parameters, Chem. Eng. Sci., 28, 31-39, doi:10.1016/0009-2509(73)85083-3.
Brutsaert, W. (1975a), A theory for local evaporation (or heat transfer) from rough and smooth surfaces at ground level, Water Resour. Res., 11(4), 543-550, doi:10.1016/0009-2509(73)85083-3.
Brutsaert, W. (1975b), The roughness length for water vapor, sensible heat, and other scalars, J. Atmos. Sci., 32, 2028–2031, doi:10.1175/1520-0469(1975)032<2029:TRLFWV>2.0.CO;2.
Brutsaert, W. (1979), Heat and mass transfer to and from surfaces with dense vegetation or similar permeable roughness, Bound.-Lay. Meteorol., 16, 365-388, doi:10.1007/BF02220492.
Brutsaert, W. (1982), Evaporation into the Atmosphere: theory, history and applications, D. Reidel, Dordrecht, Holland.
Brutsaert, W. (1998), Land-surface water vapor and sensible heat flux: Spatial variability, homogeneity, and measurement scales, Water Resour. Res., 34(10), 2433-2442, doi:10.1029/98WR01340.
Buckles, J., T. J. Hanratty, and R. J. Adrian (1984), Turbulent flow over large-amplitude wavy surfaces, J. Fluid Mech., 140, 27-44, doi:10.1017/S0022112084000495.
205

Bullin, J. A., and A. E. Dukler (1972), Random eddy models for surface renewal: formulation as a stochastic process, Chem. Eng. Sci., 27, 439-442, doi:10.1016/0009-2509(72)85081-4.
Businger, J. A., J. C. Wyngaard, Y. Izumi, and E. F. Bradley (1971), Flux-profile relationships in the atmospheric surface layer, J. Atmos. Sci., 28, 181–189, doi:10.1175/1520-0469(1971)028<0181:FPRITA>2.0.CO;2.
Byun, G., and R. L. Simpson (2006), Structure of three-dimensional separated flow on an axisymmetric bump, AIAA J, 44(5), 999–1008, doi:10.2514/1.17002.
Cai, X.-M. (1999), Large-eddy simulation of the convective boundary layer over an idealized patchy urban surface, Quart. J. Roy. Meteorol. Soc., 125, 1427–1444, doi:10.1256/smsqj.55615.
Camillo, P. J., and R. J. Gurney (1986), A resistance parameter for bare soil evaporation models, Soil Sci., 141(2), 95-105, doi:10.1097/00010694-198602000-00001.
Castellvi, F., and R. L. Snyder (2009), Combining the dissipation method and surface renewal analysis to estimate scalar fluxes from the time traces over rangeland grass near Ione (California), Hydrol. Process, 23, 842–857, doi:10.1002/hyp.7223.
Chamberlain, A. C. (1966), Transport of gases to and from grass and grass-like surfaces, Proc. R. Soc. Lond. A., Mathematical and Physical Sciences (1934-1990), 290(1421), 236-265, doi:10.1098/rspa.1966.0047.
Chamberlain, A. C. (1968), Transport of gases to and from surfaces with bluff and wave-like roughness elements. Quart. J. Roy. Meteorol. Soc., 94, 318–332. doi:10.1002/qj.49709440108.
Chaves, M. M., J. P. Maroco, and J. Pereira (2003), Understanding plant responses to drought - From genes to the whole plant, Funct. Plant Biol., 30, 239–264, doi:10.1071/FP02076.
Chen, F. (1990), Turbulent characteristics over a rough natural surface-Part I: Turbulent structures, Bound.-Lay. Meteorol., 52, 151-175, doi:10.1007/BF00123182.
Cheng, W.-C., and F. Porte-Agel (2013), Evaluation of subgrid-scale models in large-eddy simulation of flow past a two-dimensional block, Int. J. Heat Fluid Flow, 44, 301-311, doi:10.1016/j.ijheatfluidflow.2013.06.007.
Cherukat, P., Y. Na, T. J. Hanratty, and J. B. McLaughlin (1998), Direct numerical simulation of a fully developed turbulent flow over a wavy wall, Theor. Comput. Fluid Dynamics, 11, 109-134, doi:10.1007/s001620050083.
206

Christen, A., F. Meier, and D. Scherer (2012), High-frequency fluctuations of surface temperatures in an urban environment, Theor. Appl. Climatol., 108, 301–324, doi:10.1007/s00704-011-0521-x.
Chyu, M. K., and R. J. Goldstein (1991), Influence of an array of wall-mounted cylinders on the mass transfer from a flat surface, Int. J. Heat Mass Transfer, 34(9), 2175-2186, doi:10.1016/0017-9310(91)90044-F.
Cierniewski, J., A. Karnieli, C. Kazmierowski, S. Krolewicz, J. Piekarczyk, K. Lewinska, A. Goldberg, R. Wesolowski, and M. Orzechowski (2014), Effects of soil surface irregularities on the diurnal variation of soil broadband blue-sky albedo, IEEE journal of selected topics in applied earth observations and remote sensing, doi: 10.1109/JSTARS.2014.2330691.
Cooke, J. R. (1967), Some theoretical considerations in stomatal diffusion: A field theory approach, Acta Biotheor., 17, 95–124, doi:10.1007/BF01625092.
Cooke, J. R. (1969), The influence of stomatal spacing upon diffusion rate, ASAE Meeting, No. 69-525, St. Joseph, MI.
Corino, E. R., and R. S. Brodkey (1969), A visual investigation of the wall region in turbulent flow, J. Fluid Mech., 37, 1-30, doi:10.1017/S0022112069000395.
Costa, J. M., O. M. Grant, and M. M. Chaves (2013), Thermography to explore plant-environment interactions, J. Exp. Bot., doi:10.1093/jxb/ert029.
Danckwerts, P. V. (1951), Significance of liquid-film coefficients in gas absorption, J. Ind. Eng. Chem., 43, 1460-1467, doi:10.1021/ie50498a055.
de Vries, D. A. (1963), Thermal properties of soils, in Physics of Plant Environment, edited by W. R. van Wijk, pp. 210-235, North-Holland, Amsterdam.
Dean, J. A. (1999), Lange's Handbook of Chemistry, 15th ed., McGraw-Hill, New York.
Derksen, D. S. (1974), Thermal infrared pictures and the mapping of microclimate, Neth. J. Agric. Sci., 22, 119–132.
Derksen, D. S. (1974), Thermal infrared pictures and the mapping of microclimate, Neth. J. Agric. Sci., 22, 119–132.
Drexler, J. Z., R. L. Snyder, D. Spano, and K. T. Paw U (2004), A review of models and micrometeorological methods used to estimate wetland evapotranspiration, Hydrol. Process, 18, 2071-2101, doi:10.1002/hyp.1462.
Duguay, C. R. (1993), Radiation modeling in mountainous terrain review and status, Mountain Research and Development, 13(4), 339-357.
207

Dullien, F. A. L. (1979), Porous Media: Fluid Transport and Pore Structure, Academic, San Diego, California.
Dyer, A. J. (1974), A review of flux-profile relationships, Bound.-Lay. Meteorol., 7, 363–372, doi:10.1007/BF00240838.
Dyer, A. J., and B. B. Hicks (1970), Flux-gradient relationships in the constant flux layer, Quart. J. Roy. Meteorol. Soc., 96, 715–721, doi:10.1002/qj.49709641012.
Ebrahimi, A. N., and D. Or (2014), Microbial dispersal in unsaturated porous media—Characteristics of motile bacterial cell motions in unsaturated angular pore networks, Water Resour. Res., 50, doi:10.1002/2014WR015897.
Eder, F., F. De Roo, K. Kohnert, R. L. Desjardins, H. P. Schmid, and M. Mauder (2014), Evaluation of two energy balance closure parameterizations, Bound.-Lay. Meteorol., 151, 195–219, doi:10.1007/s10546-013-9904-0.
Einstein, H. A., and H. Li (1958), The viscous sublayer along a smooth boundary, Trans. ASCE, 123, 293-313.
Ershadi, A., M. F. McCabe, J. P. Evans, N. W. Chaney, and E. F. Wood (2014), Multi-site evaluation of terrestrial evaporation models using FLUXNET data, Agr. For. Meteorol., 187, 46-61, doi:10.1016/j.agrformet.2013.11.008.
Falco, R. E. (1991), A coherent structure model of the turbulent boundary layer and its ability to predict Reynolds number dependence, Phil. Trans. R. Soc. Lond. A, 336(1641), 103-129, doi:10.1098/rsta.1991.0069.
Finnigan, J. J. (1988), Air flow over complex terrain, in Flow and Transport in the Natural Environment: Advances and Applications, edited by W. L. Steffen and O. T. Denmead, pp. 183-229, Springer-Verlag, Heidelberg.
Fisher, R. A. (1923), Some factors affecting the evaporation of water from soil, J. Agron. Sci., 13(2), 121-143, doi:10.1017/S0021859600003270.
Foken, T. (2006), 50 years of the Monin-Obukhov similarity theory, Bound.-Lay. Meteorol., 119, 431-447, doi:10.1007/s10546-006-9048-6.
Foken, T. (2008), The energy balance closure problem: an overview, Ecol. Appl., 18, 1351–1367, doi:10.1890/06-0922.1.
Foken, T., F. Wimmer, M. Mauder, C. Thomas, and C. Liebethal (2006), Some aspects of the energy balance closure problem, Atmos. Chem. Phys., 6, 4395–4402, doi:10.5194/acpd-6-3381-2006.
Fortuin, J. M. H., and P. J. Klijn (1982), Drag reduction and surface renewal in turbulent pipe flow, Chem. Eng. Sci., 37(4), 611-623, doi:10.1016/0009-
208

2509(82)80124-3.
Fortuin, J. M. H., E. E. Musschenga, and P. J. Hamersma (1992), Transfer processes in turbulent pipe flow described by ERSR Model, AIChE J., 38(3), 343-362, doi:10.1002/aic.690380304.
Frederich, O., J. Scouten, D. M. Luchtenburg, and F. Thiele (2009), Numerical simulation and analysis of the flow around a wall-mounted finite cylinder, in Imaging Measurement Methods, edited by W. Nitsche and C. Dobriloff, pp. 207-216, Springer-Verlag, Berlin Heidelberg.
Fröhlich, J., and W. Rodi (2004), LES of the flow around a circular cylinder of finite height, Int. J. Heat Fluid Flow, 25, 537–548, doi:10.1016/j.ijheatfluidflow.2004.02.006.
Gaikovich, K. P. (2000), Study of atmospheric-turbulence effects on the formation of a thermal film in the near-surface water layer and the dynamics of air-water heat exchange using measurements of thermal radio emission, Radiophys. Quantum Electron., 43(6), 469-477, doi:10.1007/BF02677174.
Gaikovich, K. P., and R. V. Troitsky (1997), Dynamics of heat and mass transfer through a water-air interface based on measurements of thermal radio emission at a frequency of 60 GHz, Radiophys. Quantum Electron., 40(3), 228-240, doi:10.1007/BF02676347.
Garai, A., and J. Kleissl (2011), Air and surface temperature coupling in the convective atmospheric boundary layer, J. Atmos. Sci., 68, 2945–2954, doi:10.1175/JAS-D-11-057.1.
Garai, A., E. Pardyjak, G. J. Steeneveld, and J. Kleissl (2013), Surface temperature and surface-layer turbulence in a convective boundary layer, Bound.-Lay. Meteorol., 148(1), 51-72, doi:10.1007/s10546-013-9803-4.
Garbe, C. S., H. Spies, and B. Jähne (2003), Estimation of surface flow and net flux from infrared image sequences, JMIV, 19(3), 159-174, doi:10.1023/A:1026233919766.
Garbe, C. S., U. Schimpf, and B. Jähne (2004), A surface renewal model to analyze infrared image sequences of the ocean surface for the study of air-sea heat and gas exchange, J. Geophys. Res., 109, C08S15, doi:10.1029/2003JC001802.
Garratt, J., and B. B. Hicks (1973), Momentum, heat, and water vapor transfer to and from natural and artificial surfaces, Quart. J. Roy. Meteorol. Soc., 99(422), 680–687, doi:10.1002/qj.49709942209.
Gill, K. S., S. K. Jalota, S. S. Prihar, and T. N. Chaudhary (1977), Water conservation by soil mulch in relation to soil type, time of tillage, tilth and
209

evaporativity, J. Ind. Soc. Soil Sci., 25, 360-366.
Giordano, R., A. Ianiro, T. Astarita, and G. M. Carlomagno (2012), Flow field and heat transfer on the base surface of a finite circular cylinder in crossflow, App. Therm. Eng., 49, 79-88, doi:10.1016/j.applthermaleng.2011.10.029.
Glass, D. E., and M. N. Özisik (1988), Transient temperatures from periodic surface heat flux for slabs, cylinders, and spheres, Heat Mass Transfer, 22(3), 179-183, doi:10.1007/BF01052984.
Goldstein, R. J., and J. Karni (1984), The effect of a wall boundary layer on local mass transfer from a cylinder in cross flow, J. Heat Transfer, 106, 260-267, doi:10.1115/1.3246667.
Goldstein, R. J., M. K. Chyu, and R. C. Hain (1985), Measurement of local mass transfer on a surface in the region of the base of a protruding cylinder with a computer-controlled data acquisition system, Int. J. Heat Mass Transfer, 28(5), 977-985, doi:10.1016/0017-9310(85)90279-0.
Grine, A., J. Y. Desmons, and S. Harmand (2007), Models for transient conduction in a flat plate subjected to a variable heat flux, Appl. Therm. Eng., 27(2), 492-500, doi:10.1016/j.applthermaleng.2006.06.013.
Gurka, R., A. Liberzon, and G. Hestroni (2004), Detecting coherent patterns in a flume by using PIV and IR imaging techniques, Exp. Fluid., 37, 230–236, doi:10.1007/s00348-004-0805-3.
Gurudatt, K., V. M. Nadkarni, and K. C. Khilar (2010), A study on drying of textile substrates and a new concept for the enhancement of drying rate, J. Text. Inst., 101(7), 635-644, doi:10.1080/00405000902732776.
Guzha, A. C. (2004), Effects of tillage on soil microrelief, surface depression storage and soil water storage, Soil Till. Res., 76, 105-114, doi:10.1016/j.still.2003.09.002.
Haghighi, E., and D. Or (2013), Evaporation from porous surfaces into turbulent airflows: Coupling eddy characteristics with pore scale vapor diffusion, Water Resour. Res., 49, 8432-8442, doi:10.1002/2012WR013324.
Haghighi, E., and D. Or (2015a), Thermal signatures of turbulent airflows interacting with evaporating thin porous surfaces, Int. J. Heat Mass Transfer, 87, 429-446, doi:10.1016/j.ijheatmasstransfer.2015.04.026.
Haghighi, E., and D. Or (2015b), Linking evaporative fluxes from bare soil across surface viscous sublayer with the Monin-Obukhov atmospheric flux-profile estimates, J. Hydrol., 525, 684-693, doi:10.1016/j.jhydrol.2015.04.019.
Haghighi, E., and D. Or (2015c), Turbulence-induced thermal signatures over 210

evaporating bare soil surfaces, Geophys. Res. Lett., Under Review.
Haghighi, E., and D. Or (2015d), Evaporation from wavy porous surfaces into turbulent airflows, Transp. Porous Med., doi:10.1007/s11242-015-0512-y.
Haghighi, E., E. Shahraeeni, P. Lehmann, and D. Or (2013), Evaporation rates across a convective air boundary layer are dominated by diffusion, Water Resour. Res., 49, 1602-1610, doi:10.1002/wrcr.20166.
Hanratty, T. J. (1956), Turbulent exchange of mass and momentum with a boundary, AIChE J., 2, 359-362, doi:10.1002/aic.690020313.
Hara, T., E. VanInwegen, J. Wendelbo, C. S. Garbe, U. Schimpf, B. Jähne, and N. Frew (2007), Estimation of air-sea gas and heat fluxes from infrared imagery based on near surface turbulence models, in Transport at the Air Sea Interface, edited by C. S. Garbe, R. A. Handler, and B. Jähne, pp. 241-254, Springer-Verlag Berlin, Heidelberg.
Harriott, P. (1962), A Random eddy modification of the penetration theory, Chem. Eng. Sci., 17, 149-154, doi:10.1016/0009-2509(62)80026-8.
Hartmann, D. L. (1994), Global physical climatology, Academic Press, San Diego, Calif.
Haußecker, H., U. Schimpf, and B. Jähne (1998), Measurements of the air-sea gas transfer and its mechanism by active and passive thermography, IEEE International Geoscience and Remote Sensing Symposium Proceedings, 1, 484-486, doi:10.1109/IGARSS.1998.702947.
Helbig, N, H. Löwe, and M. Lehning (2009), Radiosity approach for the shortwave surface radiation balance in complex terrain, J. Atmos. Sci., 66, 2900-2912, doi:10.1175/2009JAS2940.1.
Helbig, N., H. Löwe, B. Mayer, and M. Lehning (2010), Explicit validation of a surface shortwave radiation balance model over snow-covered complex terrain, J. Geophys. Res., 115, D18113, doi:10.1029/2010JD013970.
Hetsroni, G., and R. Rozenblit (1994), Heat transfer to a liquid-solid mixture in a flume, Int. J. Multiphase Flow, 20, 671–689, doi:10.1016/0301-9322(94)90038-8.
Hetsroni, G., T. A. Kowalewski, B. Hu, and A. Mosyak (2001), Tracking of coherent thermal structures on a heated wall by means of infrared thermography, Exp. Fluid., 30, 286–294, doi:10.1007/s003480000175.
Hicks, B. B., D. D. Baldocchi, T. P. Meyers, R. P. Hosker, and D. R. Matt (1987), A preliminary multiple resistance routine for deriving dry deposition velocities from measured quantities, Water Air Soil Pollut., 36(3), 311–330,
211

doi:10.1007/BF00229675.
Higbie, R. (1935), The rate of absorption of a pure gas into a still liquid during short periods of exposure, Trans. AIChE, 31, 365-388.
Hisatake, K., M. Fukuda, J. Kimura, M. Maeda, and Y. Fukuda (1995), Experimental and theoretical study of evaporation of water in a vessel, J. Appl. Phys., 77, 6664-6674, doi:10.1063/1.359079.
Högström, U. (1988), Non-dimensional wind and temperature profiles in the atmospheric surface layer: a re-evaluation, Bound.-Lay. Meteorol., 42, 55–78, doi:10.1007/BF00119875.
Holmes, J. W., E. L. Greacen, and G. C. Gurr (1960), The evaporation of water from bare soils with different tilths, Trans. 7th Int. Congo Soil Sci., Madison, WI Vol. 1. Int. Soc. Soil Sci., Wageningen, The Netherlands, pp. 188-194.
Hu, Z., and S. Islam (1995), Prediction of ground surface temperature and soil moisture content by the force-restore method, Water Resour. Res., 31(10), 2531-2539, doi:10.1029/95WR01650.
Huang, J. P., X. H. Lee, and E. G. Patton (2009), Dissimilarity of scalar transport in the convective boundary layer in inhomogeneous landscapes, Bound-Lay. Meteorol., 130, 327–345, doi:10.1007/s10546-009-9356-8.
Huang, P. M., Y. Li, and M. E. Sumner (2012), Handbook of soil sciences: properties and processes, 2nd ed., CRC Press, Boca Raton, FL.
Hudgins, L., C. A. Friehe, and M. E. Mayer (1993), Wavelet transforms and atmospheric turbulence, Phys. Rev. Lett., 71, 3279–3282.
Hunt, J. C. R., A. J. Vrieling, F. T. M. Nieuwstadt, and H. J. S. Fernando (2003), The influence of the thermal diffusivity of the lower boundary on eddy motion in convection, J. Fluid Mech., 491, 183–205, doi:10.1017/S0022112003005482.
Huo, Q., X. Cai, L. Kang, H. Zhang, and Y. Song (2014), Effects of surface source/sink distributions on the flux-gradient similarity in the unstable surface layer, Theor. Appl. Climatol., doi:10.1007/s00704-014-1118-y.
Huthoff, F. (2012), Theory for flow resistance caused by submerged roughness elements, J. Hydraul. Res., 50(1), 10-17, doi:10.1080/00221686.2011.636635.
Idso, S. B., R. J. Reginato, R. D. Jackson, B. A. Kimball, and F. S. Nakayama (1974), The three stages of drying of a field soil, Soil Sci. Soc. Am. Proc., 38(5), 831-837, doi: 10.2136/sssaj1974.03615995003800050037x.
Incropera, F. P., D. P. DeWitt, T. L. Bergman, and A. S. Lavine (2006),
212

Fundamentals of heat and mass transfer, 6th edition, John Wiley & Sons, NJ.
Iritani, Y., N. Kasagi, and M. Hizata (1985), Heat transfer mechanism and associated turbulence structure in the near-wall region of a turbulent boundary layer, in Turbulent Shear Flows 4, edited by L. J. S. Bradbury et al., pp. 223–234, Springer, Berlin.
Jalota, S. K., and S. S. Prihar (1990), Bare-soil evaporation in relation to tillage, in Advances in Soil Science, edited by B.A. Stewart, Vol. 12, pp. 187-216, Springer-Verlag, New York Inc., NY.
Jeong, J., F. Hussain, W. Schoppa, and J. Kim (1997), Coherent structures near the wall in a turbulent channel flow, J. Fluid Mech., 332, 185-214.
Jones, H. G. (1992), Plants and microclimate, 2nd ed., Cambridge, Cambridge University Press, UK.
Jury, W. A., W. R., Gardner, and W. H. Gardner (1991), Soil Physics, John Wiley and Sons, New York, NY.
Jury, W.A., and J. Gruber (1989), A stochastic analysis of the influence of soil and climatic variability on the estimate of pesticide groundwater pollution potential, Water Resour. Res., 25(12), 2465-2474, doi:10.1029/WR025i012p02465.
Kalma, J. D., T. R. McVicar, and M. F. McCabe (2008), Estimating land surface evaporation: A review of methods using remotely sensed surface temperature data, Surv. Geophys., 29, 421-469, doi:10.1007/s10712-008-9037-z.
Katul, G. G., A. Porporato, D. Cava, and M. Siqueira (2006), An analysis of intermittency, scaling, and surface renewal in atmospheric surface layer turbulence, Physica D, 215, 117-126, doi:10.1016/j.physd.2006.02.004.
Katul, G. G., J. D. Albertson, C. I. Hsieh, P. S. Conklin, J. T. Sigmon, M. B. Parlange, and K. R. Knoerr (1996), The ‘‘inactive’’ eddy motion and the large-scale turbulent pressure fluctuations in the dynamic sublayer, J. Atmos. Sci., 53, 2512–2524, doi:10.1175/1520-0469(1996)053<2512:TEMATL>2.0.CO;2.
Katul, G. G., J. Schieldge, C. I. Hsieh, and B. Vidakovic (1998), Skin temperature perturbations induced by surface layer turbulence above a grass surface, Water Resour. Res., 34, 1265–1274, doi:10.1029/98WR00293.
Kawamura, T., M. Hiwada, T. Hibino, I. Mabuchi, and M. Kumuda (1984), Flow around a finite circular cylinder on a flat plate, Bull. JSME, 27(232), 2142–2151.
Kerr, Y. H. (2007), Soil moisture from space: Where are we?, Hydrogeol. J., 15, 117-120.
213

Kim, H. T., S. J. Kline, and W.C. Reynolds (1971), The production of turbulence near a smooth wall in a turbulent boundary layer, J. Fluid Mech., 50, 133–160, doi:10.1017/S0022112071002490.
Kimball, B. A., and E. R. Lemon (1971), Air turbulence effects upon soil gas exchange, Soil Sci. Soc. Am. J., 35, 16-21, doi:10.2136/sssaj1971.03615995003500010013x.
Kline, S. J., W. C. Reynolds, F. A. Schraub, and P. W. Runstadler (1967), The structure of turbulent boundary layers, J. Fluid Mech., 30, 741-773, doi:10.1017/S0022112067001740.
Kluitenberg, G. J. (2002), Heat capacity and specific heat, in Methods of Soil Analysis, Part 4, Physical Methods, edited by J. H. Dane, and G. C. Topp, pp. 1201–1208, Madison, WI.
Kondo, J., N. Saigusa, and T. Sato (1990), A parameterization of evaporation from bare soil surfaces, J. Appl. Meteor., 29, 385-389, doi:10.1175/1520-0450(1990)029<0385:APOEFB>2.0.CO;2.
Krajnovic, S. (2011), Flow around a tall finite cylinder explored by large eddy simulation, J. Fluid Mech., 676, 294-317, doi:10.1017/S0022112011000450.
Kräuter, C., D. Trofimova, D. Kiefhaber, N. Krah., and B. Jähne (2014), High resolution 2-D fluorescence imaging of the mass boundary layer thickness at free water surfaces, J. Europ. Opt. Soc. Rap. Public., 9, 14016, doi:10.2971/jeos.2014.14016.
Kruse, N., S. Kuhn, and P. R. von Rohr (2006), Wavy wall effects on turbulence production and large-scale modes, J. Turbul., 7, 1–24, doi:10.1080/14685240600602911.
Kundu, P. K., and I. M. Cohen (2002), Fluid Mechanics, 2nd ed., Academic Press, San Diego, Calif.
Kustas, W., and M. Anderson (2009), Advances in thermal infrared remote sensing for land surface modeling, Agr. Forest Meteorol., 149, 2071-2081, doi:10.1016/j.agrformet.2009.05.016.
Lahiri, B. B., S. Bagavathiappan, T. Jayakumar, and J. Philip (2012), Medical applications of infrared thermography: A review, Infrared Phys. Techn., 55(4), 221-235, doi:10.1016/j.infrared.2012.03.007.
Lee, T., C.-L. Lin, and C. A. Friehe (2007), Large-eddy simulation of air flow around a wall-mounted circular cylinder and a tripod tower, J. Turbul., 8(29), doi:10.1080/14685240701383122.
214

Lee, W. C., O. A. Plumb, and L. Gong (1992), An experimental study of heat and mass transfer during drying of packed beds, Trans. ASME J. Heat Transfer, 114, 727-734, doi: 10.1115/1.2911341.
Lehmann, P., and D. Or (2009), Preferential evaporation and capillary coupling in porous media with textural contrasts, Phys. Rev. E, 80, 046318, doi:10.1103/PhysRevE.80.046318.
Lehmann, P., S. Assouline, and D. Or (2008), Characteristic lengths affecting evaporative drying of porous media, Phys. Rev. E, 77(5), 056309, doi:10.1103/PhysRevE.77.056309.
Lehrsch, G. A., F. D. Whisler, and M. J. M. Römkens (1987), Soil surface roughness as influenced by selected soil physical properties, Soil Till. Res., 10, 197-212, doi:10.1016/0167-1987(87)90028-6.
Leij, F. J., W. J. Alves, M. Th. van Genuchten, and J. R. Williams (1999), The UNSODA unsaturated soil hydraulic database, in Proc. Int. Workshop Characterization and Measurement of the Hydraulic Properties of Unsaturated Porous Media, edited by M. Th. van Genuchten, F. J. Leij , and L. Wu, pp. 1269-1281, UC Riverside.
Leuning, R., E. van Gorsel, W. J. Massman, and P. R. Isaac (2012), Reflections on the surface energy imbalance problem, Agr. Forest Meteorol., 156, 65–74, doi:10.1016/j.agrformet.2011.12.002.
Lhomme, J. P., A. Chehbouni, and B. Monteny (2000), Sensible heat flux-radiometric surface temperature relationship over sparse vegetation: Parameterizing B-1, Bound.-Lay. Meteorol., 97(3), 431-457, doi:10.1023/A:1002786402695.
Ligrani, P. M., and M. M. Oliveira (2003), Comparison of heat transfer augmentation techniques, AIAA Journal, 41(3), 337-362, doi:10.2514/2.1964.
Lim, W. H., M. L. Roderick, M. T. Hobbins, S. C. Wong, P. J. Groeneveld, F. Sun, and G. D. Farquhar (2012), The aerodynamics of pan evaporation, Agr. Forest Meteorol., 152, 31-43, doi:10.1016/j.agrformet.2011.08.006.
Lin, C. L., C. H. Moeng, P. P. Sullivan, and J. C. McWilliams (1997), The effects of surface roughness on flow structures in a neutrally stratified planetary boundary layer flow, Phys. Fluids, 9, 3235-3249, doi:10.1063/1.869439.
Linden, D. R. (1982), Predicting tillage effects on evaporation, in Predicting Tillage Effects on Soil Physical Properties and Processes, edited by P. W. Unger and D. M. Van Doren, ASA Sp. Publ. 44, Am. Soc. Agron., Soil Sci. Soc. Amer., Madison, WI.
Liu, G., Y. Liu, and S. Endo (2013), Evaluation of surface flux parameterizations
215

with long-term ARM observations, Mon. Wea. Rev., 141, 773–797, doi:10.1175/MWR-D-12-00095.1.
Liu, S., L. Lu, D. Mao, and L. Jia (2007), Evaluating parameterizations of aerodynamic resistance to heat transfer using field measurements, Hydrol. Earth Syst. Sci., 11, 769-783, doi:10.5194/hess-11-769-2007.
Liu, W. T., K. B. Katsaros, and J. A. Businger (1979), Bulk parameterization of air-sea exchange of heat and water vapor including the molecular constraints at the interface, J. Atmos. Sci., 36(9), 1722-1735, doi:10.1175/1520-0469(1979)036<1722:BPOASE>2.0.CO;2.
Loughlin, K. F., M. A. Abul-Hamayel, and L.C. Thomas (1985), The surface rejuvenation theory of wall turbulence for momentum, heat and mass transfer: Application to moderate and high Schmidt (Prandtl) numbers, AIChE J., 31(10), 1614-1620, doi:10.1002/aic.690311005.
Lowry, T., and S. G. Li (2002), A characteristic-based finite analytic method for solving the two-dimensional steady state advection-diffusion equation, Water Resour. Res., 38(7), 1123, doi:10.1029/2001WR000518.
Lu, T., and S. Q. Shen (2007), Numerical and experimental investigation of paper drying: heat and mass transfer with phase change in porous media, Appl. Therm. Eng., 27(8–9), 1248–1258, doi:10.1016/j.applthermaleng.2006.11.005.
Maaß, C., and U. Schumann (1996), Direct numerical simulation of separated turbulent flow over a wavy boundary, in Flow Simulation with High Performance Computers, edited by E. H. Hirschel, pp. 227–241, Vieweg, Braunschweig, Germany.
Marshall, J. K. (1971), Drag measurements in roughness arrays of varying density and distribution, Agricultural Meteorology, 8, 269-292, doi:10.1016/0002-1571(71)90116-6.
Martinuzzi, R. (2008), Dual vortex structure shedding from low aspect ratio, surface- mounted pyramids, J. Turbul., 9, 1–16, doi:10.1080/14685240802272117.
Massman, W. J., R. A. Sommerfeld, A. R. Mosier, K. F. Zeller, T. J. Hehn, and S. G. Rochelle (1997), A model investigation of turbulence-driven pressure-pumping effects on the rate of diffusion of CO2, N2O, and CH4 through layered snowpacks, J. Geophys. Res., 102(D15), 18851-18863, doi:10.1029/97JD00844.
Mathpati, C. S., and J. B. Joshi (2007), Insight into theories of heat and mass transfer at the solid-fluid interface using direct numerical simulation and large eddy simulation, Ind. Eng. Chem. Res., 46(25), 8525-8557, doi:10.1021/ie061633a.
216

Matthias, A. D., A. Fimbres, E. E. Sano, D. F. Post, L. Accioly, A. K. Batchily, and L. G. Ferreira (2000), Surface roughness effects on soil albedo, Soil Sci. Soc. Am. J., 64, 1035-1041, doi:10.2136/sssaj2000.6431035x.
McInnes, K. J., J. L. Heilman, and M. J. Savage (1994), Aerodynamic conductances along a bare ridge-furrow tilled soil surface, Agr. Forest Meteorol., 68, 119-131, doi:10.1016/0168-1923(94)90031-0.
Meek, R. L. (1972), Mean period of fluctuations near the wall in turbulent flows, AIChE J., 18(4), 854-855, doi:10.1002/aic.690180434.
Meek, R. L., and A. D. Baer (1970), The periodic viscous sublayer in turbulent flow, AIChE J., 16(5), 841-848, doi:10.1002/aic.690160525.
Meek, R. L., and A. D. Baer (1973), Turbulent heat transfer and the periodic viscous sublayer, Int. J. Heat Mass Transfer, 16(7), 1385-1396, doi:10.1016/0017-9310(73)90146-4.
Metzger, T., and E. Tsotsas (2005), Influence of pore size distribution on drying kinetics: A simple capillary model, Drying Technol., 23(9-11), 1797-1809, doi: 10.1080/07373930500209830.
Minacapilli, M., M. Iovino, and F. Blanda (2009), High resolution remote estimation of soil surface water content by a thermal inertia approach, J. Hydrol., 379(3), 229-238, doi:10.1016/j.jhydrol.2009.09.055.
Mira, M., E. Valor, R. Boluda, V. Caselles, and C. Coll (2007), Influence of soil water content on the thermal infrared emissivity of bare soils: Implication for land surface temperature determination, J. Geophys. Res., 112, F04003, doi:10.1029/2007JF000749.
Mirzaei, M., L. Davidson, A. Sohankar, and F. Innings (2013), The effect of corrugation on heat transfer and pressure drop in channel flow with different Prandtl numbers, Int. J. Heat Mass Transfer, 66, 164-176.
Monin, A. S., and A. M. Obukhov (1954), Basic laws of turbulent mixing in the surface layer of the atmosphere, Tr. Geofiz. Inst. Acad. Nauk SSSR, 24(151), 163–187.
Monteith, J. L. (1981), Evaporation and surface temperature, Quart. J. Roy. Meteorol. Soc., 107, 1-27, doi:10.1256/smsqj.45101.
Monteith, J., and M. Unsworth (2007), Principals of environmental physics, 3rd ed., Academic Press, Calif.
Mosthaf, K., R. Helmig, and D. Or (2014), Modeling and analysis of evaporation processes from porous media on the REV scale, Water Resour. Res., 50, 1059–1079,
217

doi:10.1002/2013WR014442.
Mualem, Y. (1976), A new model for predicting the hydraulic conductivity of unsaturated porous media, Water Resour. Res., 12(3), 513-522, doi:10.1029/WR012i003p00513.
Müller, M. D., and D. Scherer (2005), A grid- and subgrid-scale radiation parameterization of topographic effects for mesoscale weather forecast models, Mon. Weather Rev., 133, 1431-1442, doi:10.1175/MWR2927.1.
Mwendera, E. J., and J. Feyen (1997), Tillage and evaporativity effects on the drying characteristics of a silty loam: evaporation prediction models, Soil Till. Res., 41, 127-140, doi:10.1016/S0167-1987(96)01078-1.
Nadarajah, S., and A. K. Gupta (2007), A generalized gamma distribution with application to drought data, Math. Comput. Simulat., 74(1), 1-7, doi:10.1016/j.matcom.2006.04.004.
Nakamura, H. (2009), Frequency response and spatial resolution of a thin foil for heat transfer measurements using infrared thermography, Int. J. Heat Mass Transfer, 52, 5040-5045, doi:10.1016/j.ijheatmasstransfer.2009.04.019.
Nakamura, H. (2011), Spatio-temporal measurement of convective heat transfer using infrared thermography, in Heat Transfer - Theoretical Analysis, Experimental Investigations and Industrial Systems, edited by A. Belmiloudi, ISBN: 978-953-307-226-5, InTech, doi:10.5772/13827.
Nakamura, H., S. Takaki, and S. Yamada (2011), Spatio-temporal characteristics of heat transfer in separated and reattaching flows, Proceedings of ASME-JSME-KSME Joint Fluids Engineering conference, Hamamatsu, Shizuoka, Japan.
Nakamura, H., S. Takaki, and S. Yamada (2012), Visualization of spatio-temporal heat transfer to a turbulent flow, Proceedings of 15th International Symposium on Flow Visualization, Minsk, Belarus.
Nepf, H. M. (2012), Hydrodynamics of vegetated channels, J. Hydraul. Res., 50(3), 262-279, doi:10.1080/00221686.2012.696559.
Ni, W., and X. Li (2000), A coupled vegetation-soil bidirectional reflectance model for a semiarid landscape, Remote Sens. Environ., 74, 113-124, doi:10.1016/S0034-4257(00)00127-9.
Obukhuv, A. M. (1946), Turbulence in an atmosphere with inhomogeneous temperature, Tr. Inst. Teor. Geofiz. Acad. Nauk SSSR, 1, 95-115.
Okamoto, S. (1982), Turbulent shear flow behind hemisphere-cylinder paced on ground plane, in Turbulent Shear Flows 3, edited by L. J. S. Bradbury et al., pp.
218

171-185, Springer-Verlag, Berlin Heidelberg.
Oke, T. R. (1978), Boundary layer climates, Methuen, London, UK.
Oki, T., and S. Kanae (2006), Global hydrological cycles and world water resources, Science 313, 1068–1072, doi:10.1126/science.1128845.
Or, D., P. Lehmann, E. Shahraeeni, and N. Shokri (2013), Advances in soil evaporation physics – a review, Vadose Zone J., doi:10.2136/vzj2012.0163.
Oyakawa, K., T. Miyagi, S. Oshiro, I. Senaha, M. Yaga, and M. Hiwada (2000), Study on Time-Spatial Characteristics of Heat Transfer by Visualization of Infrared Images and Dye Flow, Proceedings of 9th International Symposium on Flow Visualization, Pap. no. 233, Edinburgh, Scotland, UK.
Palau-Salvador, G., T. Stoesser, J. Fröhlich, M. Kappler, and W. Rodi (2010), Large eddy simulations and experiments of flow around finite-height cylinders, Flow Turbul. Combust., 84(2), 239–275, doi:10.1007/s10494-009-9232-0.
Panofsky, H. A., and J. A. Dutton (1984), Atmospheric turbulence: models and methods for engineering applications, John Wiley and Sons, New York.
Papanicolaou, A. N., C. Kramer, A. Tsakiris, T. Stoesser, S. Bomminayuni, and Z. Chen (2012), Effects of a fully submerged boulder within a boulder array on the mean and turbulent flow fields: Implications to bedload transport, Acta Geophysica, 60(6), 1502-1546, doi:10.2478/s11600-012-0044-6.
Passerat de Silans, A. (1986), Heat and mass transfer in a stratified soil subjected to a natural atmospheric excitation: Comparison models-experience, Ph.D. thesis, Institut National Polytechnique de Grenoble, Grenoble, France.
Pattenden, R. J., S. R. Turnock, and Z. Zhang (2005), Measurements of the flow over a low-aspect-ratio cylinder mounted on a ground plane, Exp. Fluid, 39, 10–21, doi:10.1007/s00348-005-0949-9.
Paw U, K. T., J. Qiu, H. B. Su, T. Watanabe, and Y. Brunet (1995), Surface renewal analysis: A new method to obtain scalar fluxes, Agr. Forest Meteorol., 74, 119–137, doi:10.1016/0168-1923(94)02182-J.
Paw U, K. T., Y. Brunet, S. Collineau, R. H. Shaw, T. Maitani, J. Qiu, and L. Hipps (1992), On coherent structures in turbulence above and within agricultural plant canopies, Agr. Forest Meteorol., 61, 55–68, doi:10.1016/0168-1923(92)90025-Y.
Penman, H. L. (1948), Natural evaporation from open water, bare soil and grass, Proc. R. Soc. A., 193, 120–145, doi:10.1098/rspa.1948.0037.
Perry, A. E., K. L. Lim, and S. M. Henbest (1987), An experimental study of the
219

turbulence structure in smooth- and rough-wall boundary layers, J. Fluid Mech., 177, 437-466, doi:10.1017/S0022112087001034.
Perry, A. E., W. H. Schofield, and P. N. Joubert (1969), Rough wall turbulent boundary layers, J. Fluid Mech., 37, 383-413.
Pinczewski, W. V., and S. Sideman (1974), A model for mass (heat) transfer in turbulent tube flow: moderate and high Schmidt (Prandtl) Numbers, Chem. Eng. Sci., 29, 1969-1976, doi:10.1016/0009-2509(74)85016-5.
Pope, S. B. (2000), Turbulent Flows, Cambridge University Press, Cambridge.
Popovich, A. T. and R. L. Hummel (1967), Experimental study of the viscous sublayer in turbulent pipe flow, AIChE J., 13(5), 854-860, doi:10.1002/aic.690130509.
Potter, K. N., R. Horton, and R. M. Cruse (1987), Soil surface roughness effects on radiation reflectance and soil heat flux, Soil Sci. Soc. Am. J., 51, 855-860, doi:10.2136/sssaj1987.03615995005100040003x.
Prat, M. (2002), Recent advances in pore-scale models for drying of porous media, Chem. Eng. J., 86, 153–164, doi:10.1016/S1385-8947(01)00283-2.
Prat, M. (2007), On the influence of pore shape, contact angle and film flows on drying of capillary porous media, Int. J. Heat Mass Transfer, 50, 1455–1468, doi:10.1016/j.ijheatmasstransfer.2006.09.001.
Price, J. C. (1977), Thermal inertia mapping: A new view of the earth, J. Geophys. Res., 82(18), 2582-2590, doi:10.1029/JC082i018p02582.
Pruitt, W. O., D. L. Morgan, and F. J. Lourence (1973), Momentum and mass transfer in the surface boundary layer, Quart. J. Roy. Meteorol. Soc., 99(420), 370–386, doi:10.1256/smsqj.42013.
Qiu, G. Y., and M. Zhao (2010), Remotely monitoring evaporation rate and soil water status using thermal imaging and “three-temperatures model (3T model)” under field-scale conditions, J. Environ. Monit., 12, 716-723, doi:10.1039/b919887c.
Qiu, G. Y., T. Yano, and K. Momii (1998), An improved methodology to measure evaporation from bare soil based on comparison of surface temperature with a dry soil surface, J. Hydrol., 210(1-4), 93-105, doi:10.1016/S0022-1694(98)00174-7.
Raupach, M. R. (1992), Drag and drag partition on rough surfaces, Boundary-Lay. Meteorol., 60, 375-395, doi:10.1007/BF00155203.
Raupach, M. R., and B. J. Legg (1984), The uses and limitations of flux-gradient relationships in micrometeorology, Agr. Water Manage., 8(1-3), 119-131,
220

doi:10.1016/0378-3774(84)90049-0.
Raupach, M. R., and J. J. Finnigan (1997), The influence of topography on meteorological variables and surface-atmosphere interactions, J. Hydrol., 190, 182-213, doi:10.1016/S0022-1694(96)03127-7.
Raupach, M. R., J. J. Finnigan, and Y. Brunet (1996), Coherent eddies and turbulence in vegetation canopies: The mixing layer analogy, Bound.-Lay. Meteorol., 78, 351–382, doi:10.1007/BF00120941.
Raupach, M. R., W. S. Wenig, D. J. Carruthers, and J. C. R. Hunt (1992), Temperature and humidity fields and fluxes over low hills, Quart. J. Roy. Meteorol. Soc., 118, 191-225, doi:10.1002/qj.49711850403.
Rawls, W. J., D. L. Brakensiek, and K. E. Saxton. (1982), Estimation of soil water properties, Trans. ASAE, 25(5), 1316-1320.
Renno, N. O., V. J. Abreu, J. Koch, P. H. Smith, O. K. Hartogensis, H. A. R. De Bruin, D. Burose, G. T. Delory, W. M. Farrell, C. J. Watts, J. Garatuza, M. Parker, and A. Carswell (2004), MATADOR 2002: A pilot experiment on convective plumes and dust devils, J. Geophys. Res., 109(E7), doi:10.1029/2003JE002219.
Reul, N., H. Branger, and J. P. Giovanangeli (2008), Air flow structures over short-gravity breaking water waves, Boundary-Lay. Meteorol., 126, 477-505, doi:10.1007/s10546-007-9240-3.
Ruckenstein, E. (1958), A note concerning turbulent exchange of heat or mass with a boundary, Chem. Eng. Sci., 7, 265-268, doi:10.1016/0009-2509(58)85023-X.
Salvucci, G. D., and P. Gentine (2013), Emergent relation between surface vapor conductance and relative humidity profiles yields evaporation rates from weather data, PNAS, 110, 6287-6291.
Savory, E., and N. Toy (1986), Hemispheres and hemisphere-cylinders in turbulent boundary layers, J. Wind Eng. Ind. Aerodyn., 23, 345–364, doi:10.1016/0167-6105(86)90054-1.
Schimpf, U., H. Haußecker, and B. Jähne (1999), Studies of air-sea gas transfer and micro turbulence at the ocean surface using passive thermography, in The Wind-driven Air-Sea Interface: Electromagnetic and Acoustic Sensing, Wave Dynamics and Turbulent Fluxes, edited by M. L. Banner, School of Mathematics, University of New South Wales, Sydney, Australia.
Schlatter, P., Q. Li, R. Örlü, F. Hussain, and D. S. Henningson (2014), On the near-wall vortical structures at moderate Reynolds numbers, Eur. J. Mech. B-Fluid,
221

48, 75-93, doi:10.1016/j.euromechflu.2014.04.011.
Schlichting, H. (1936), Experimentelle untersuchungen zum rauhigkeitsproblem, Ingen.-Arch. 7, 1–34.
Schlünder, E. U. (1988), On the mechanism of the constant drying rate period and its relevance to diffusion controlled catalytic gas phase reactions, Chem. Eng. Sci., 43(10), 2685-2688, doi:10.1016/0009-2509(88)80012-5.
Schols, J. L. J., A. E. Jansen, and J. G. Krom (1985), Characteristics of turbulent structures in the unstable atmospheric surface layer, Bound.-Lay. Meteorol., 33, 173–196, doi:10.1007/BF00123389.
Schoppa, W., and F. Hussain (2002), Coherent structure generation in near-wall turbulence, J. Fluid Mech., 453, 57-108, doi:10.1017/S002211200100667X.
Schultz, M. P., and K. A. Flack (2009), Turbulent boundary layers on a systematically varied rough wall, Phys. Fluids, 21, 015104, doi:10.1063/1.3059630.
Schwartz, R. C., R. L. Baumhardt, and S. R. Evett (2010), Tillage effects on soil water redistribution and bare soil evaporation throughout a season, Soil Till. Res., 110, 221-229, doi:10.1016/j.still.2010.07.015.
Schymanski S. J., D. Or, and M. Zwieniecki (2013), Stomatal control and leaf thermal and hydraulic capacitances under rapid environmental fluctuations, PLoS ONE, 8(1): e54231, doi:10.1371/journal.pone.0054231.
Seo, Y. G., and W. K. Lee (1988), Single-eddy model for random surface renewal, Chem. Eng. Sci., 43(6), 1395-1402, doi:10.1016/0009-2509(88)85112-1.
Shahraeeni, E., and D. Or (2010a), Pore scale analysis of evaporation and condensation dynamics in porous media, Langmuir, 26(17), 13924–13936, doi:10.1021/la101596y.
Shahraeeni, E., and D. Or (2010b), Thermo-evaporative fluxes from heterogeneous porous surfaces resolved by infrared thermography, Water Resour. Res., 46(9), W09511, doi:10.1029/2009WR008455.
Shahraeeni, E., and D. Or (2012a), Pore-scale evaporation-condensation dynamics resolved by synchrotron x-ray tomography, Phys. Rev. E, 85(1), 016317, doi:10.1103/PhysRevE.85.016317.
Shahraeeni, E., and D. Or (2012b), Pore scale mechanisms for enhanced vapor transport through partially saturated porous media, Water Resour. Res., 48, W05511, doi:10.1029/2011WR011036.
Shahraeeni, E., and D. Or (2011), Quantification of subsurface thermal regimes
222

beneath evaporating porous surfaces, Int. J. Heat Mass Transfer, 54, 4193–4202 doi:10.1016/j.ijheatmasstransfer.2011.05.024.
Shahraeeni, E., P. Lehmann, and D. Or (2012), Coupling of evaporative fluxes from drying porous surfaces with air boundary layer-Characteristics of evaporation from discrete pores, Water Resour. Res., 48, W09525, doi:10.1029/2012WR011857.
Shao, Y., and Y. Yang (2005), A scheme for drag partition over rough surfaces, Atmos. Environ., 39, 7351–7361, doi:10.1016/j.atmosenv.2005.09.014.
Shao, Y., and Y. Yang (2008), A theory for drag partition over rough surfaces, J. Geophys. Res., 113, F02S05, doi:10.1029/2007JF000791.
Shepherd, C. B., C. Hadlock, and R. C. Brewer (1938), Drying material in trays-Evaporation of surface moisture, Ind. Eng. Chem., 30(4), 388-397, doi:10.1021/ie50340a006.
Shokri, N. and D. Or (2011), What determines drying rates at the onset of diffusion controlled stage-2 evaporation from porous media?, Water Resour. Res., 47, W09513, doi:10.1029/2010WR010284.
Shokri, N., P. Lehmann and D. Or (2009), Critical evaluation of enhancement factors for vapor transport through unsaturated porous media, Water Resour. Res., 45, W10433, doi:10.1029/2009WR007769.
Shokri, N., P. Lehmann, and D. Or (2010), Liquid phase continuity and solute concentration dynamics during evaporation from porous media-pore scale processes near vaporization surface, Phys. Rev. E., 81, 046308, doi:10.1103/PhysRevE.81.046308.
Shokri, N., P. Lehmann, P. Vontobel, and D. Or (2008), Drying front and water content dynamics during evaporation from sand delineated by neutron radiography, Water Resour. Res., 44, W06418, doi:10.1029/2007WR006385.
Shuttleworth, W. J., and J. S. Wallace (1985), Evaporation from sparse crops-an energy combination theory, Quart. J. Roy. Meteorol. Soc., 111(469), 839-855, doi:10.1256/smsqj.46909.
Sifuzzaman, M., M. R. Islam, and M. Z. Ali (2009), Application of wavelet transform and its advantages compared to Fourier transform, J. Physical Sciences, 13, 121-134.
Simpson, R. L. (1989), Turbulent boundary-layer separation, Ann. Rev. Fluid Mech., 21, 205-234.
Snyder, R. L., D. Spano, and K. T. Paw U (1996), Surface renewal analysis for sensible and latent heat flux density, Bound.-Lay. Meteorol., 77, 249–266,
223

doi:10.1007/BF00123527.
Song, J. H., and S. Shida (2010), Infrared thermography for monitoring surface checking of wood during drying, Wood Material Science and Engineering, 5(2), 73-77, doi:10.1080/17480272.2010.483288.
Sorbjan, Z., and A. A. Grachev (2010), An evaluation of the flux-gradient relationship in the stable boundary layer, Bound-Lay. Meteorol., 135(3), 385–405, doi:10.1007/s10546-010-9482-3.
Spano, D., R. L. Snyder, P. Duce, and K. T. Paw U (2000), Estimating sensible and latent heat flux densities from grapevine canopies using surface renewal, Agr. Forest Meteorol., 104, 171–183, doi:10.1016/S0168-1923(00)00167-2.
Stoica, P., and R. Moses (2004), Spectral analysis of signals, Prentice Hall, New Jersey.
Stoll, R., and F. Porte-Agel (2006), Dynamic subgrid-scale models for momentum and scalar fluxes in large-eddy simulations of neutrally stratified atmospheric boundary layers over heterogeneous terrain, Water Resour. Res., 42, W01409, doi:10.1029/2005WR003989.
Strahler, A. H., and D. L. B. Jupp (1990), Modeling bidirectional reflectance of forests and woodlands using Boolean models and geometric optics, Remote Sens. Environ., 34, 153-166, doi:10.1016/0034-4257(90)90065-T.
Sumner, D. (2013), Flow above the free end of a surface-mounted finite-height circular cylinder: A review, J. Fluid Struct., 43, 41-63, doi:10.1016/j.jfluidstructs.2013.08.007.
Sun, S. F. (1982), Moisture and heat transport in a soil layer forced by atmospheric conditions, M.S. thesis, University of Connecticut, Storrs, CT.
Suzuki, M., and S. Maeda (1968), On the mechanism of drying of granular beds; mass transfer from discontinuous source, J. Chem. Eng. Jpn., 1(6), 26-31, doi:10.1252/jcej.1.26.
Taylor, G. I. (1938), The spectrum of turbulence, Proc. R. Soc. London, Ser. A, 164, 476–490, doi:10.1098/rspa.1938.0032.
Taylor, P. A., and P. R. Gent (1974), A model of atmospheric boundary layer flow above an isolated two-dimensional hill: An example of flow over gentle topography, Boundary-Lay. Meteorol. I, 349-362, doi:10.1007/BF00240837.
Telesca, L., and M. Lovallo (2011), Analysis of the time dynamics in wind recordes by means of multifractal detrended fluctuation analysis and the Fisher-Shannon information plane, J. Stat. Mech.-Theory Exp., 7(07), doi:10.1088/1742-
224

5468/2011/07/P07001.
Thom, A. S. (1972), Momentum, mass and heat exchange of vegetation, Quart. J. Roy. Meteorol. Soc., 98(415), 124–134, doi:10.1256/smsqj.41509.
Thom, A. S. (1975), Momentum, mass and heat exchange of plant communities, in Vegetation and the Atmosphere, edited by J. L. Monteith, pp. 57–109, Academic Press, London.
Thom, H. C. S. (1958), A note on the gamma distribution, Mon. Weather Rev., 86(4), 117-121, doi:10.1175/1520-0493(1958)086<0117:ANOTGD>2.0.CO;2.
Thomas, L. C., P. J. Gingo, and B. T. F. Chung (1975), The surface rejuvenation model for turbulent convective transport-an exact solution, Chem. Eng. Sci., 30, 1239-1242, doi:10.1016/0009-2509(75)85046-9.
Tiselj, I., R. Bergant, B. Mavko, I. Bajsic, and G. Hetsroni (2001), DNS of turbulent heat transfer in channel flow with heat conduction in the solid wall, J. Heat Transfer, 123(5), 849–857, doi:10.1115/1.1389060.
Toor, H. L., and J. M. Marchello (1958), Film-penetration model for mass and heat transfer, AIChE J., 4(1), 97-101, doi:10.1002/aic.690040118.
Townsend, A. A. (1961), Equilibrium layers and wall turbulence, J. Fluid Mech., 11, 97–120, doi:10.1017/S0022112061000883.
Trenberth, K.E., J. Fasullo, and J. Kiehl (2009), Earth’s global energy budget, Bull. Am. Meteorol. Soc., 90, 311–323, doi:10.1175/2008BAMS2634.1.
Trinh, K. T. (1992), Turbulent transport near the wall in Newtonian and non-Newtonian pipe flow, PhD thesis, University of Canterbury, Christchurch, New Zealand.
Tseng, Y.-H., C. Meneveau, and M. B. Paralange (2006), Modeling flow around bluff bodies and predicting urban dispersion using large eddy simulation, Environ. Sci. Technol., 40, 2653-2662, doi:10.1021/es051708m.
Tuoc, T. K., and R. B. Keey (1992), A modified penetration theory and its relation to boundary layer transport, Trans. IChemE, 70(A), 596-603.
Unger, P.W., and D. K. Cassel (1991), Tillage implement disturbance effects on soil properties related to soil and water conservation: a literature review, Soil Till. Res., 19, 363-382, doi:10.1016/0167-1987(91)90113-C.
van Boxel, J. H., G. Sterk, and S. M. Arens (2004), Sonic anemometers in aeolian sediment transport research, Geomorphology, 59(1), 131–147, doi:10.1016/j.geomorph.2003.09.011.
225

van Brakel, J. (1980), Mass transfer in convective drying, in Advances in Drying, vol. 1, edited by A. S. Mujumdar, pp. 217-267, Hemisphere, New York.
van de Griend, A. A., and M. Owe (1994), Bare soil surface resistance to evaporation by vapor diffusion under semiarid conditions, Water Resour. Res., 30(2), 181-188, doi:10.1029/93WR02747.
van de Griend, A. A., P. J. Camillo, R. J. Gurney (1985), Discrimination of soil physical parameters, thermal inertia, and soil moisture from diurnal surface temperature fluctuations, Water Resour. Res., 21(7), 997-1009, doi:10.1029/WR021i007p00997.
van Genuchten, M. Th. (1980), A closed-form equation for predicting the hydraulic conductivity of unsaturated soils, Soil Sci. Soc. Am. J., 44(5), 892-898, doi:10.2136/sssaj1980.03615995004400050002x.
Vereecken, H., J. A. Huisman, H. Bogena, J. Vanderborght, J. A. Vrugt, and J. W. Hopmans (2008), Water Resour. Res., 44, W00D06, doi:10.1029/2008WR006829.
Verma, S. B. (1989), Aerodynamic resistances to transfers of heat, mass and momentum, in Estimation of Areal Evapotranspiration, edited by T. A. Black, D. L. Spittlehouse, M. D. Novak, and D. T. Price, pp. 13-20, IAHS Publ. no. 177.
Vico, G., S. Manzoni, S. Palmroth, and G. Katul (2011), Effects of stomatal delays on the economics of leaf gas exchange under intermittent light regimes, New Phytol., 192(3), 640–652, doi:10.1111/j.1469-8137.2011.03847.x.
Vogt, R. (2008), Visualisation of turbulent exchange using a thermal camera, Paper no. 8B.1, 18th symposium on boundary layer and turbulence, Stockholm.
Wagner, C., S. Kenjeres, and P. R. von Rohr (2011), Dynamic large eddy simulations of momentum and wall heat transfer in forced convection over wavy surfaces, J. Turbul., 12, N7, doi:10.1080/14685248.2010.547496.
Wallace, J. M., H. Eckelmann, and R. S. Brodkey (1972), The wall region in turbulent shear flow, J. Fluid Mech., 54, 39-48, doi:10.1017/S0022112072000515.
Wang, H. F., and Y. Zhou (2009), The finite-length square cylinder near wake, J. Fluid Mech., 638, 453–490, doi:10.1017/S0022112009990693.
Wang, K., X. Zhou, J. Liu, and M. Sparrow (2005), Estimating surface solar radiation over complex terrain using moderate-resolution satellite sensor data, Int. J. Remote Sens., 26(1), 47-58, doi:10.1080/01431160410001735111.
Wark, C. E., and H. M. Nagib (1991), Experimental investigation of coherent structures in turbulent boundary layers, J. Fluid Mech., 230, 183-208, doi:10.1017/S0022112091000757.
226

Watanabe, Y., and N. Mori (2008), Infrared measurements of surface renewal and subsurface vortices in nearshore breaking waves, J. Geophys. Res., 113, C07015, doi:10.1029/2006JC003950.
Weber, R. O. (1999), Remarks on the definition and estimation of friction velocity, Bound.-Lay. Meteorol., 93, 197-209, doi:10.1023/A:1002043826623.
Wesely, M. L., and B. B. Hicks (1977), Some factors that affect the deposition rates of sulfur dioxide and similar gases on vegetation, J Air Pollut. Control Assoc., 27(11), 1110-1116, doi:10.1080/00022470.1977.10470534.
White, F. M. (2003), Fluid mechanics, 5th ed., McGraw-Hill, New York.
Whiteman, C. D., K. J. Allwine, L. J. Fritschen, M. M. Orgill, and J. R. Simpson (1989), Valley radiation and surface energy budget microclimates. Part I: Radiation, J. Appl. Meteorol., 28, 414-426, doi:10.1175/1520-0450(1989)028<0427:DVRASE>2.0.CO;2.
Wieringa, J. (1993), Representative roughness parameters for homogeneous terrain, Boundary-Lay. Meteorol., 63, 323-363, doi:10.1007/BF00705357.
Willis, W. O. and J. J. Bond, (1971), Soil water evaporation: Reduction by simulated tillage, Soil Sci. Soc. Am. Proc., 35, 526-528, doi:10.2136/sssaj1971.03615995003500040016x.
Wohlfahrt, G., and P. Widmoser (2013), Can energy balance model provide additional constraints on how to close the energy imbalance?, Agr. Forest Meteorol., 169, 85-91, doi:10.1016/j.agrformet.2012.10.006.
Yamanaka, T., and T. Yonetani (1999), Dynamics of the evaporation zone in dry sandy soils, J. Hydrology, 217, 135-148, doi:10.1016/S0022-1694(99)00021-9.
Yang, B. P. S. Blackwell, and D. F. Nicholson (1996), A numerical model of heat and water movement in furrow-sown water repellent sandy soils, Water Resour. Res., 32(10), 3051-3061, doi:10.1029/96WR02103.
Yang, R., and M. A. Friedl (2001), Parameterization of shortwave radiation fluxes for nonuniform vegetation canopies in land surface models, J. Geophys. Res., 106(D13), 14275-14286, doi:10.1029/2001JD900180.
Yiotis, A. G., A. G. Boudouvis, A. K. Stubos, I. N. Tsimpanogiannis, and Y. C. Yortsos (2004), Effect of liquid films on the drying of porous media, AIChE J., 50(11), 2721-2737, doi: 10.1002/aic.10265.
Yiotis, A. G., A. K. Stubos, A. G. Boudouvis, and Y. C. Yortsos (2001), A 2-D pore-network model of the drying of single-component liquids in porous media, Adv. Water Resour., 24, 439-460, doi:10.1016/S0309-1708(00)00066-X.
227

Yiotis, A. G., I. N. Tsimpanogiannis, A. K. Stubos, and Y. C. Yortsos (2007), Coupling between external and internal mass transfer during drying of a porous medium, Water Resour. Res., 43(6), W06403, doi:10.1029/2006WR005558.
Yu, S. L., and W. Brutsaert (1967), Evaporation from very shallow pans, J. Appl. Meteorol., 6(2), 265-271, doi:10.1175/1520-0450(1967)006<0265:EFVSP>2.0.CO;2.
Zhang, D., R. Tang, W. Zhao, B. Tang, H. Wu, K. Shao, and Z. L. Li (2013), Surface soil water content estimation from thermal remote sensing based on the temporal variation of land surface temperature, Remote Sens., 6, 3170-3187, doi:10.3390/rs6043170.
Zilker, D. P., and T. J. Hanratty (1977), Influence of the amplitude of a solid wavy wall on a turbulent flow. Part 1. Non-separated flows, J. Fluid Mech., 82, 29-51, doi:10.1017/S0022112077000524.
Zilker, D.P., and T. J. Hanratty (1979), Influence of the amplitude of a solid wavy wall on a turbulent flow. Part 2. Separated flows, J. Fluid Mech., 90, 257-271, doi:10.1017/S0022112079002196.
228

Curriculum Vitae
PERSONAL INFORMATION Name: Erfan Haghighi Gender: Male Place of birth: Lahijan, Iran Date of birth: July 27th, 1985 Nationality: Iranian Marital status: Married
EDUCATION • Ph.D. Environmental Systems Science (Flow and Transport in
Porous Media) ETH Zurich, Zürich, Switzerland, Aug. 2011-July 2015
• M.Sc. Mechanical Engineering (Energy Conversion) Sharif University of Technology, Tehran, Iran, Sep. 2007-Sep. 2009 GPA: 18.26/20.00
• B.Sc. Mechanical Engineering (Fluid Mechanics and Thermal Fluids) The University of Guilan, Rasht, Iran, Sep. 2003-July 2007 GPA: 17.13/20:00 (ranked 1st)
AWARDS AND HONORS • Ranked 10th among more than 120 graduate students in department of
Mechanical Engineering, Sharif University of Technology, Sep. 2009 • Honored to be a member of Iran’s National Elites Foundation (INEF), since
Feb. 2008 • Ranked 36th (among nearly 30,000 Mechanical Engineer participants) in
Iranian annual M.Sc. higher education entrance examination in Mechanical Engineering, Sep. 2007
• Finalist in 12th national Mechanical Engineering Olympiad, Iran, July 2007 • Being exempted from M.Sc. program entrance exam as the exceptional
talented student, The University of Guilan, July 2007 • Ranked 1st among more than 70 undergraduate students in department of
Mechanical Engineering, Outstanding Student Award, The University of Guilan, July 2007
• Honored to be a member of National Organization for Development of Exceptional Talents (NODET), Sep. 2005-July 2007
229

RESEARCH INTERESTS (but are not limited to) • Fluid Flow and Heat Transfer in Porous Media • Subsurface Hydrology • Evaporation and Drying Processes • Land-Atmosphere Interactions during Evaporation • Infrared Thermography (Hydrological Applications) • Enhanced Oil Recovery (EOR) Processes • Optimization of Energy Flow in Industrial Plants
RESEARCH EXPERIENCE • Soil and Terrestrial Environmental Physics (STEP), ETH Zurich, Aug.
2011-Present - Developing models along with experiments (IR thermography, 3D sonic
anemometry, …) to link pore-scale heat and mass transfer with landscape processes
- Coupling between external and internal mechanisms affecting evaporation dynamics from a porous medium
- Numerical and experimental study of heat and mass exchange from porous surfaces into turbulent airflows
• Sharif Energy Research Institute (SERI), Tehran, Iran, Sep. 2009-July 2011 - Director of Transportation Division in “development of a comprehensive
plan for energy management in oil and gas upstream” granted by National Iranian Oil Company (NIOC)
- Executive Director in “development and implementation of energy demand and supply models for strategic planning in energy sector” granted by Institute for International Energy Studies (IIES)
• Research Institute of Petroleum Industry (RIPI), Tehran, Iran, Feb. 2009-Feb. 2010
• Hydrocarbon Reservoir Simulation Research Group, Sharif University of Technology, July 2008-Sep. 2009
• Gas Turbine Research Group, The University of Guilan, Feb. 2006-Aug. 2007
JOURNAL PUBLICATIONS (PEER-REVIEWED) In preparation • Haghighi, E., M. Aminzadeh, and D. Or, A pore-scale coupled energy
balance model for evaporating bare soils under various atmospheric conditions
• Haghighi, E., S. Lagüela, M. Aminzadeh, and D. Or, Geometrical interactions affecting energy and mass balances over evaporating rough bare soil surfaces
• Haghighi, E., and D. Or, Comment on “A physically based surface resistance model for evaporation from bare soils” by C. Zhang, L. Li, and D. Lockington
Submitted (under review) • Haghighi, E., and D. Or (2015), Interactions of bluff-body obstacles with
turbulent airflows affecting evaporative fluxes from porous surfaces, Journal of Hydrology
230

Published • Haghighi, E., and D. Or (2015), Turbulence-induce thermal signatures
over evaporating bare soil surfaces, Geophysical Research Letters, doi:10.1002/2015GL064354.
• Haghighi, E., and D. Or (2015), Evaporation from wavy porous surfaces into turbulent airflows, Transport in Porous Media, doi:10.1007/s11242-015-0512-y.
• Haghighi, E., and D. Or (2015), Evaporation from thin porous surfaces into turbulent airflows: Characteristics of eddy-induced surface thermal signatures, International Journal of Heat and Mass Transfer, 87, 429-46, doi:10.1016/j.ijheatmasstransfer.2015.04.026.
• Haghighi, E., and D. Or (2015), Linking evaporative fluxes from bare soils across surface viscous sublayer with the Monin-Obukhov atmospheric flux-profile estimates, Journal of Hydrology, 525, 684-693, doi:10.1016/j.jhydrol.2015.04.019.
• Haghighi, E., and D. Or (2013), Evaporation from porous surfaces into turbulent airflows: Coupling eddy characteristics with pore scale vapor diffusion, Water Resources Research, 49, 8432-8442, doi:10.1002/2012WR013324.
• Haghighi, E., E. Shahraeeni, P. Lehmann, and D. Or (2013), Evaporation rates across a convective air boundary layer are dominated by diffusion, Water Resources Research, 49, 1602-1610, doi:10.1002/wrcr.20166.
• Haghighi, E., M.T. Manzari, S.K. Hannani, and H. Naderan (2010), Compositional simulation of 1-D oil reservoirs flow using a high-resolution central scheme, Sharif Journal of Science and Technology (in Persian).
CONFERENCE PROCEEDINGS • Haghighi, E., B. Borzou, A.R. Ghahremani, and M. Behshad Shafii (2009),
Optimization of a regenerative gas turbine engine with isothermal heat addition with the genetic algorithm, Proceedings of ASME Turbo Expo 2009: Power for Land, Sea and Air, Orlando, Florida
CONFERENCE ABSTRACTS AND PRESENTATIONS • Haghighi, E., and D. Or (2015), Thermal signatures and evaporative fluxes
from regular wavy porous surfaces into turbulent airflows, 7th International Conference on Porous Media and Annual Meeting, International Society for Porous Media, Padua, Italy
• Haghighi, E., and D. Or (2015), Turbulent evaporative fluxes from wavy porous surfaces, IBP PhD Congress, ETH Zurich, Switzerland
• Haghighi, E., and D. Or (2015), Evaporative fluxes from wavy porous surfaces, MUSIS workshop on Interfaces and Interfacial Displacement in Unsaturated Porous Media, Potsdam, Germany
• Haghighi, E., S. Laguela, M. Aminzadeh, and D. Or (2014), The role of bluff-body roughness elements on turbulent evaporative fluxes from porous surfaces: Effects of momentum and energy partitioning, American Geophysical Union-Fall Meeting, San Francisco, Abstract H33E-0864
• Haghighi, E., and D. Or (2014), Effects of surface roughness on evaporation from porous surfaces into turbulent airflows, EGU General Assembly, Geophysical Research Abstracts, 16, EGU2014-15915
• Or, D., S. Assouline, M. Aminzadeh, E. Haghighi, S. Schymanski, and P. Lehmann (2014), Stomata size and spatial pattern effects on leaf gas exchange - a quantitative assessment of plant evolutionary choices, EGU General Assembly, Geophysical Research Abstracts, 16, EGU2014-14801
• Haghighi, E., and D. Or (2014), Modelling evaporative fluxes from wavy 231

porous surfaces, ZHydro (Hydrology Seminar), Zurich, Switzerland • Haghighi, E., and D. Or (2013), Rapid surface thermal signatures for
estimation of evaporative fluxes into turbulent flows, American Geophysical Union-Fall Meeting, San Francisco, Abstract H21C-1046
• Haghighi, E., and D. Or (2013), Surface thermal signatures of turbulent evaporative fluxes, ZHydro (Hydrology Seminar), Zurich, Switzerland
• Haghighi, E., and D. Or (2013), Estimating evaporation rates from tresstrial surfaces using rapid thermal measurements: On the coupling of air turbulent field with evaporative thermal signatures, ITES Research Day, ETH Zurich, Zurich, Switzerland
• Haghighi, E., and D. Or (2013), Evaporation from porous surfaces into turbulent airflows: On the coupling of momentum and thermal signatures, EGU General Assembly, Geophysical Research Abstracts, 15, EGU2013-3148
• Haghighi, E., and D. Or (2012), Diffusion-dominant transport from partially wet surfaces: Applications to evaporation across an air boundary layer, ZHydro (Hydrology Seminar), Zurich, Switzerland
• Haghighi, E., and D. Or (2012), Evaporation from porous surfaces into turbulent airflows: Thermal signatures of local evaporation, ITES Research Day, ETH Zurich, Zurich, Switzerland
• Haghighi, E., and D. Or (2012), Thermal signatures of diffusive evaporative fluxes from porous surfaces into turbulent airflows: Coupling eddies with vapor diffusion, Gordon Research Conferences: Flow and Transport in Permeable Media, Les Diablerets, Switzerland
• Haghighi, E., and D. Or (2012), From pores to eddies: Linking diffusion-based evaporative fluxes from porous surfaces with a turbulent air boundary layer, EGU General Assembly, Geophysical Research Abstracts, 14, EGU2012-2439
PROFESSIONAL AFFILIATIONS • American Society of Mechanical Engineering (since 2008) • European Geosciences Union (since 2012) • American Geophysical Union (since 2013)
TEACHING EXPERIENCE (TEACHING ASSISTANT) • Vadose Zone Hydrology, Swiss Federal Institute of Technology (ETH
Zurich), Fall semesters 2013 and 2014 • Advanced Engineering Mathematics, The University of Guilan, Fall
semester 2006 • Automatic Control, The University of Guilan, Fall semester 2006 • Internal Combustion Engines, The University of Guilan, Fall semester 2006 • Gas Dynamics, The University of Guilan, Fall semester 2006
RELATED COURSEWORK • ETH Zurich: Mass Transfer; Turbulent Flows; Vadose Zone Hydrology;
Groundwater; Finite Element Analysis in Biomedical Engineering • Sharif University of Technology: Multiphase Flow in Porous Media;
Advanced Numerical Computations; Computational Fluid Dynamics; Optic Flow Diagnostic; Viscous Fluid; Advanced Thermodynamics; Advanced Fluid Dynamics
• The University of Guilan: Fluid Mechanics; Thermodynamics; Heat 232

Transfer; Gas Dynamics; Internal Combustion Engines; Computer Programming; Numerical Analysis; Water Supply Systems; Design of Refrigerating Systems and Cool Plants; Central Heating and Ventilation
COMPUTER SKILLS
• PROGRAMING: MATLAB, C++, and FORTRAN • SOFTWARE: COMSOL Multiphysics, FLUENT, Gambit, ANSYS, HYSYS,
AutoCAD, EES, Carrier, and MS Office
LANGUAGES • Persian
Native • English
Full professional proficiency • German
Elementary proficiency • Arabic
Elementary proficiency
233