Turbulent jets of dilute polymer solutions
18
Journal of Non-Newtonian Fluid Mechanics, 32 (1989) 311-328 Elsevier Science Publishers B.V., Amsterdam - Printed in The Netherlands 311 TURBULENT JETS OF DILUTE POLYMER SOLUTIONS K. KOZIOL and P. GLOWACKI Institute of Chemical Engineering and Technology, Technical University of Poznari, 61-245 Poznari (Poland) (Received October 10, 1987; in revised form February 28, 1989) Summary In the present paper, the effect of high-molecular drag reducing polymer additives on free and impinging turbulent jets has been examined. The measurements of radial and axial distributions of the mean velocity of a turbulent jet issuing from a convergent conical nozzle indicate a decrease of the half-width spreading coefficient and the velocity decay rate with an increasing polymer concentration. In the wall jet region the pressure gradi- ents disappear faster than for water though a transition from a laminar to a turbulent boundary layer takes place at a greater distance from the stagna- tion point. A skin friction drag reduction of about 80 percent, in the range of polymer concentrations of 25-100 ppm by weight, has been observed. The responsible mechanism that has been proposed is the expansion and orientation of polymers in rotation-free straining flows. 1. Introduction Turbulent impinging jets of fluid have been utilized in many heat and mass transfer operations. They offer the possibility of obtaining high heat and mass transfer rates at surfaces when the bulk of the surrounding fluid is stagnant. By considering a jet impinging normally on a plane surface, three distinct regions of flow can be recognized (Fig. l), i.e. free jet region I, impingement region II, and wall jet region III. From the fact that the fluid flow in these regions varies extremely, one may assume that the effect of polymer additives on the flow structure is different, although the overall effects on drag reduction in smooth pipe flow may be similar. 0377-0257/89/$03.50 0 1989 Elsevier Science Publishers B.V.
-
Upload
independent -
Category
Documents
-
view
3 -
download
0
Transcript of Turbulent jets of dilute polymer solutions

Journal of Non-Newtonian Fluid Mechanics, 32 (1989) 311-328 Elsevier Science Publishers B.V., Amsterdam - Printed in The Netherlands
311
TURBULENT JETS OF DILUTE POLYMER SOLUTIONS
K. KOZIOL and P. GLOWACKI
Institute of Chemical Engineering and Technology, Technical University of Poznari, 61-245 Poznari (Poland)
(Received October 10, 1987; in revised form February 28, 1989)
Summary
In the present paper, the effect of high-molecular drag reducing polymer additives on free and impinging turbulent jets has been examined. The measurements of radial and axial distributions of the mean velocity of a turbulent jet issuing from a convergent conical nozzle indicate a decrease of the half-width spreading coefficient and the velocity decay rate with an increasing polymer concentration. In the wall jet region the pressure gradi- ents disappear faster than for water though a transition from a laminar to a turbulent boundary layer takes place at a greater distance from the stagna- tion point. A skin friction drag reduction of about 80 percent, in the range of polymer concentrations of 25-100 ppm by weight, has been observed. The responsible mechanism that has been proposed is the expansion and orientation of polymers in rotation-free straining flows.
1. Introduction
Turbulent impinging jets of fluid have been utilized in many heat and mass transfer operations. They offer the possibility of obtaining high heat and mass transfer rates at surfaces when the bulk of the surrounding fluid is stagnant.
By considering a jet impinging normally on a plane surface, three distinct regions of flow can be recognized (Fig. l), i.e. free jet region I, impingement region II, and wall jet region III.
From the fact that the fluid flow in these regions varies extremely, one may assume that the effect of polymer additives on the flow structure is different, although the overall effects on drag reduction in smooth pipe flow may be similar.
0377-0257/89/$03.50 0 1989 Elsevier Science Publishers B.V.

312
I- I
Impingement Wall jet region region
Fig. 1. Flow regions of impinging jets.
The main aim of the present study was the investigation of free and impinging turbulent jets of dilute polymer solutions. The study provides information on a free jet mean velocity profile, static wall pressure, and wall shear stress on a normal surface as a function of Reynolds number, a nozzle-to-plate distance, and polymer concentration. We have also made comparisons with Newtonian solutions and with previous Newtonian stud- ies.
The experiments have been done by using a modified electrochemical technique which makes measurements in viscoelastic dilute polymer solu- tions possible.
2. Discussion of previous studies
Many authors [1,2] are of the opinion that drag reduction is a wall effect. The velocity profile measurements by Elata et al. [3] with guar gum solu- tions, Goren and Norbury [4] as well as Virk et al. [5] with aqueous solutions of poly(ethylene oxide) have indicated some small changes in the core region. This result suggests that the free jet region should be unaffected by drag reducing additives. The experimental results [6-151 obtained hitherto are inconsistent. Both Goren and Norbury [4], as well as Jackley (see [6]) and Barker [6] found little difference between an aqueous polymer jet and a pure water one.
The experiments quoted above were made with different polymer ad- ditives and velocity-sensitive probes.

313
On the other hand, Gadd [7] observed that small-scale turbulence may be suppressed by a 30 w.ppm solution of Polyox WSR-301. White [8] found, with Pitot tube experiments, that a jet of Polyox had a significantly greater spreading angle than pure water. Vlasov and Kalashnikov [9] have suggested that the discrepancy of opinions may be explained by different physicomechanical structures of polymer solutions. They suggest that the secondary bulk effect occurs only with solutions which show detectable elastic properties.
Pownall and Kiser [lo] reported Pitot tube measurements which suggest that non-Newtonian jets do not spread faster than Newtonian ones. For concentrated polymer solutions, the apparent higher rate of spread results from the “die-swell” effect.
Vlasov et al. [ll] and Shulman et al. [12] found that the mechanism by which the jet spread is significantly affected by the additive, thus the entrainment of the non-turbulent ambient fluid in dilute polymer solutions is diminished. A similar effect was observed by Filipsson et al. [13] in the case of fiber suspension jets.
Usui and Sano [14] have found that the increase of the integral scale in the submerged polymer jets is not isotropic and the most significant effect is observed in the region where the turbulent dissipation has a maximum value.
According to Berman and Hung [15] polymer additives can exert various influences on free turbulent jets depending upon the purity of the water used. In case of jets containing high expanded polymer molecules with sufficient concentration the spreading begins at a larger distance from the nozzle and a suppression of small scale turbulence can be observed.
A number of works [16-181 analyse in detail the influence of polymer additives on the structure of turbulence in a mixing layer which can be counted to free turbulent flows. Investigation results have shown that the polymer additives raised the intensity and coherence length of the turbulent macro-structures while the small-scale turbulence is strongly attenuated.
As a result of these works, it seemed that a further investigation of free turbulence in dilute polymer solutions would be likely to throw further light upon the above-mentioned phenomena.
The flow structure in the impingement and wall jet regions (Fig. 1) is more complicated [19,20] and the effect of polymer additives in this case is unexplored. In case of viscoelastic fluids, at high jet velocities, a Deborah number of sufficient magnitude causes a solid-like fluid response. This implies the development of a solid-like stagnant material coating the region surrounding the stagnation point. The pipe flow experiments [2-51 indicated that in regions II and III thickening of the viscous sublayer adjacent to the wall is possible. The variations in the flow structure of the jet could well be expected to affect local heat and mass-transfer coefficients in impingement and wall jet regions.

314
3. Experimental
A flow diagram of the apparatus is presented in Fig. 2. To avoid shear degradation of the polymer solutions, the driving force for the jet was provided by a constant head tank 72 dm3 (l), from which the fluid flowed through a valve into a calming section (2). The jet was formed by forcing the fluid from the calming section through a convergent conical nozzle (3) mounted in the center of a 0.15 m square transparent box 0.6 m long. For each of the three jet orifice diameters 2, 3, 4 mm, four different initial velocities were used producing a range of jet Reynolds numbers Re, = W,,,~/V from 3 - 103-12 - 103.
The initial velocity profile of the jet at the orifice was nearly uniform, except for a very thin boundary layer, and the axial intensity of turbulence at the nozzle exit was w&/W~,~ = 1.7%.
The velocity field in the free jet and shear stress at the deflecting wall were explored using a specially modified electrochemical technique [21]. The polymer solutions used in the drag reduction studies were prepared by slowly mixing a prepared amount of Polyox WSR-301 in sixty liters of distilled water. The resulting solution was added at 20 + 0.5 o C to lop2 M potassium ferricyanide in the presence of equimolar ferrocyanide. The reactions for this system are
Fe(CN)i3 + e- at the cathode
dFe(CN)i4. at the anode
(1)
To avoid chemical degradation of the polymer solutions, 0.1 M potassium hydroxide was chosen as a supporting electrolyte. All solutions were made in freshly distilled water and measured immediately after the solution was completed (about 12 hours). When this procedure was followed, the repeata- bility of the measurements was better than 5%. The properties of fluids are shown in Table 1.
Fig. 2. Experimental configuration. l-constant head tank, 2-calming section, 3-conical nozzle, 4-probe, 5-jet basin.

315
TABLE 1
Properties of fluids at 20.0 o C
Fluid
1 2 3 4
Polymer concentration Density Viscosity
(w.ppm) (b/m3 ) ~~-10~ (Pas)
- 1003 1.029 25 1003 1.054 50 1003 1.078
100 1003 1.138
The polymer chosen for this study, the poly (ethylene oxide) grade Polyox WSR-301, henceforth referred to as PEO, is one of the most effective non-ionic polymers for drag reduction, due to its long straight chain. In case of PEO, maximum drag reduction can be observed for polymer concentra- tions in the range of O-100 w.ppm. At these polymer concentrations the solution shows a constant shear viscosity. When PEO was added, the general shape of the current-potential curve for the ferricyanide ions reduction on nickel and platinum electrodes was not altered.
The molecular weight of polymer M, = 2.4 X lo6 g/mol was calculated by the following equation [22]
[ 711 = 1.03 x 1O-4 M;‘*. (2) The intrinsic viscosity [q] of PEO solutions was determined by employing
an Ubbelohde capillary viscometer and a pycnometer. A special attempt was made to avoid instrumental anomalies in dilute
PEO solutions. The bases of the electrochemical method used in this work are described in a number of works [23-251 considering both the theoretical aspects and the problems connected with the practical applications.
Comparatively few literature data [26,27] and our own investigations [28] show that electrochemical measuring techniques can be successfully used in the local velocity measurements of rheologically complex fluids. The prob- lem requiring a particularly penetrating analysis was the adequate construc- tion of the measuring sensors. Experimental studies of a number of authors [29-311 have indicated a decrease or even a complete disappearance of the sensitivity of the velocity-sensitive probes (impact tubes, hot-wire, and hot-film anemometers) in viscoelastic polymer solutions.
Metzner and Astarita in their theoretical analysis [32] obtained an equation describing local values of heat transfer coefficients in the case of a viscoelastic fluid flowing over a flat plate in the range of laminar boundary layer flow. A similar analysis can be carried out in case of electrochemical anemometers.
Taking into account the creation of a viscoelastic stagnant zone with a thickness of AZ at the leading edge of wedge probe (Fig. 3), a modified

316
- Cathode
- Probe
Fig. 3. Comparison of the viscoelastic with the Newtonian boundary layer developing on a wedge probe.
equation describing the local values of the mass transfer coefficient &, for viscoelastic polymer solutions can be presented in the form:
P 3 =0*33 w
i
l/2
1 ( y l/3
D v(z+ew) 5 ’ ) where D denotes diffusion coefficient, t9 characteristic time of fluid and Y kinematic fluid viscosity.
At low fluid velocities w or far downstream from the leading edge of the wedge probe z X- 8w the mass transfer coefficients, thus also the indications of electrochemical anemometers, are identical for purely viscous and viscoe- lastic fluids.
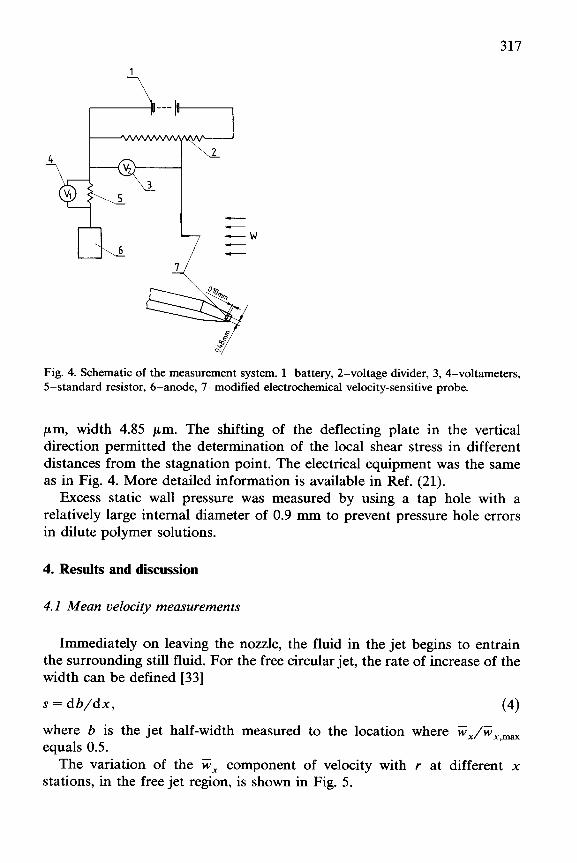
On the basis of the above considerations, our own modification of the construction of electrochemical sensors has been proposed. A schematic diagram of the electrical system is shown in Fig. 4. The cathode (7), being the measuring element, has been moved back, according to eqn. (3), by about 1.5 mm from the leading edge of the measuring wedge probe. Experimental studies [21] have shown that the above solution prevented the decrease of the sensitivity of the probe due to slightly viscoelastic properties of dilute PEO solutions.
Due to the application of the electrochemical technique, the measure- ments of the local shear stress at the deflecting wall were possible without using probes that interfere with the flow field. The measuring electrode made of a platinum foil was inserted through the deflecting wall and mounted flush with the impingement surface. The dimensions of electrode surface exposed to the fluid were: length measured in the flow direction 30.5
317
Fig. 4. Schematic of the measurement system. l-battery, 2-voltage divider, 3, 4-voltameters, 5-standard resistor, B-anode, 7-modified electrochemical velocity-sensitive probe.
pm, width 4.85 pm. The shifting of the deflecting plate in the vertical direction permitted the determination of the local shear stress in different distances from the stagnation point. The electrical equipment was the same as in Fig. 4. More detailed information is available in Ref. (21).
Excess static wall pressure was measured by using a tap hole with a relatively large internal diameter of 0.9 mm to prevent pressure hole errors in dilute polymer solutions.
4. Results and discussion
4.1 Mean velocity measurements
Immediately on leaving the nozzle, the fluid in the jet begins to entrain the surrounding still fluid. For the free circular jet, the rate of increase of the width can be defined [33]
s = db/dx, (4)
where b is the jet half-width measured to the location where WJW,,,, equals 0.5.
The variation of the W, component of velocity with r at different x stations, in the free jet region, is shown in Fig. 5.

318
Fig. 5. Radial distributions of the longitudinal mean velocity; Wx,O = 1.0 m/s. l-up = 0, 2- up = 50 w.ppm, 3-up = 100 w.ppm.
It can be observed, according to Fig. 5, that the half-width of the jet tends to decrease with an increasing polymer concentration. In fact, this is the case only for nozzle-to-plate spacings greater than the potential core, i.e. for x/d > 6. The half-width of the jet changes only slightly for x/d < 6 for all these fluids.
The rate of increase of the width b in time for free circular jets is proportional to the transverse velocity W: [33]
db/dt - w;. (5)
Combining eqns. (4) and (5), it can be easily shown that
s - QK,,,. (6)
The above expression (6) indicates that the decrease of s with an increasing polymer concentration may be due to changes in velocity ( W,,,) or turbulence (w:) distribution in an axisymmetric polymer jet. Polymer jet shares its momentum slower, but in a limited variation of the polymer concentration, up, axial variation of velocity changes only slightly with polymer concentration (Fig. 5). This experimental observation favours the explanation that the increase in the free jet range is due to the damping of radial velocity fluctuations normal to the direction of flow. In concentra-

319
4.0 -
3.0 -
I.” i
8.0 12.0 16.0 20.0 24.0 28.0 32.0 x/d
Fig. 6. Decay of the dimensionless centre-line velocity; Wx,O = 1.0 m/s at different PEO levels, up (w.ppm) l-u, = 0, 2-u, = 50, 3-up =lOO.
tions ranging up to 100 w.ppm no variation of velocity profile near the nozzle exit due to viscoelastic effects [lo] was observed.
It was found from Fig. 5 that for x > d, the velocity profile is not described by one curve as for Newtonian fluids [34] of the form
A simple visual jet study gave evidence that the half-width spreading coefficient K, is a function of the mean nozzle exit velocity i?,,, and polymer concentration. It should be noted that the jets that are compared here are those having the same centre-line mean velocity at the end of the nozzle.
Figure 6 is a plot of the dimensionless inverse centre-line velocity W,,J
ii;, max versus the downstream distance x/d. Also in this case the velocity profiles are not described by one curve. As mentioned before, a polymer jet shares its momentum slower, therefore the centre-line velocity decay rate K, as per eqn. (8),
progressively diminishes with an increasing polymer concentration. For Newtonian jets the widening rates Ki = 0.156 and decay rates K, =
0.09 are in good agreement with various axisymmetric free turbulent mea-
320
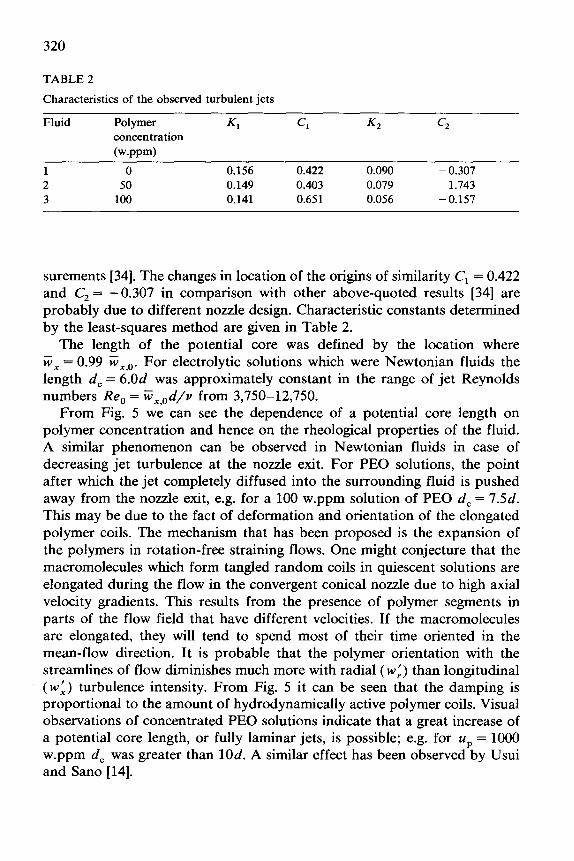
TABLE 2
Characteristics of the observed turbulent jets
Fluid Polymer concentration
Wwm)
KI CI K, c2
1 0 0.156 0.422 0.090 - 0.307 2 50 0.149 0.403 0.079 1.743 3 100 0.141 0.651 0.056 - 0.157
surements [34]. The changes in location of the origins of similarity C, = 0.422 and C, = -0.307 in comparison with other above-quoted results [34] are probably due to different nozzle design. Characteristic constants determined by the least-squares method are given in Table 2.
The length of the potential core was defined by the location where w, = 0.99 w,,,. For electrolytic solutions which were Newtonian fluids the length d, = 6.0d was approximately constant in the range of jet Reynolds numbers Re, = Wx,od/v from 3,750-12,750.
From Fig. 5 we can see the dependence of a potential core length on polymer concentration and hence on the rheological properties of the fluid. A similar phenomenon can be observed in Newtonian fluids in case of decreasing jet turbulence at the nozzle exit. For PEO solutions, the point after which the jet completely diffused into the surrounding fluid is pushed away from the nozzle exit, e.g. for a 100 w.ppm solution of PEO d, = 7Sd. This may be due to the fact of deformation and orientation of the elongated polymer coils. The mechanism that has been proposed is the expansion of the polymers in rotation-free straining flows. One might conjecture that the macromolecules which form tangled random coils in quiescent solutions are elongated during the flow in the convergent conical nozzle due to high axial velocity gradients. This results from the presence of polymer segments in parts of the flow field that have different velocities. If the macromolecules are elongated, they will tend to spend most of their time oriented in the mean-flow direction. It is probable that the polymer orientation with the streamlines of flow diminishes much more with radial ( w:) than longitudinal (w:) turbulence intensity. From Fig. 5 it can be seen that the damping is proportional to the amount of hydrodynamically active polymer coils. Visual observations of concentrated PEO solutions indicate that a great increase of a potential core length, or fully laminar jets, is possible; e.g. for up = 1000 w.ppm d, was greater than 10d. A similar effect has been observed by Usui and Sano [14].

321
Fig. 7. Typical pressure profiles at 3- up = 50, 4-up = loo.
4.2 Pressure distributions
different PEO levels, up (w.ppm) l-up = 0, 2-up = 25,
The excess static pressure distributions on the deflecting surface were measured in the Reynolds number and nozzle-to-plate spacings ranges of 3,750 to 12,750 and 3d to 24d, respectively. Figure 7 shows typical pressure profiles in the impingement and wall jet region. The region of impingement and jet deflection, as shown in Fig. 7, is the seat of marked negative pressure gradients. The shape of the pressure profiles depends on polymer concentra- tion. For PEO solutions the pressure gradients are greater and hence disappear faster than for water. The influence of polymer on pressure
np Ah I
I0 V+,,
h(+,=0.641(+)11)
I 0.81 l \* 0% .-Up= 0
l\ o-up: 2.5'165
I %.* s-Up- 5.O'd
0.6. 3. ?xf
r-up~lO~lo-s
‘0%
0.41 x,
%l I
0.2 L %:n,
o l e+*_ *, s+A_.*r
0. N _I--
_i_ 0.2 0.4 0.6 0.8 1.0 1.2 1.4 1.6 18 '.O r/r,
Fig. 8. Dimensionless pressure profiles.

322
profiles (Fig. 7) coincides approximately with the velocity profile modifica- tions (Fig. 5).
The profiles are replotted in a dimensionless form in Fig. 8. This general curve for water and all concentrations of PEO can be given by
lnhp, AP
1.631
, (9)
in which Ap denotes the value of wall pressure at any r, and r,, is the value of r at which Ap = 0.5 Ap,. In the region far downstream of the nozzle x/d > 10, where the flow structure is self-preserving, the present results compare well with the results given by Beltaos and Rajaratnam [35] for water jets and is given here as
In% AP
00)
4.3 Wall shear stress distributions
The experiments were made in the impingement and wall jet region at a distance r = O-6d from the stagnation point. The typical radial distributions
-r, CNh21
k
50.0
1
0 1.0 2.0 3.0 413 5.0 ” r/d
Fig. 9. Selected experimental wall shear stress profiles at different PEO levels, up (w.ppm). l-u,=O, 2-u,=25, 3-u,=50,4-u,=lOO.

323
L 1 .I
0 1.0 2.0 3.0 4.0 5.0 6'o r/d Fig. 10. Selected experimental wall shear stress profiles at different PEO levels, up (w.ppm). l-u, =o, 2-u,=25,3-u,=50,4-u,=lOO.
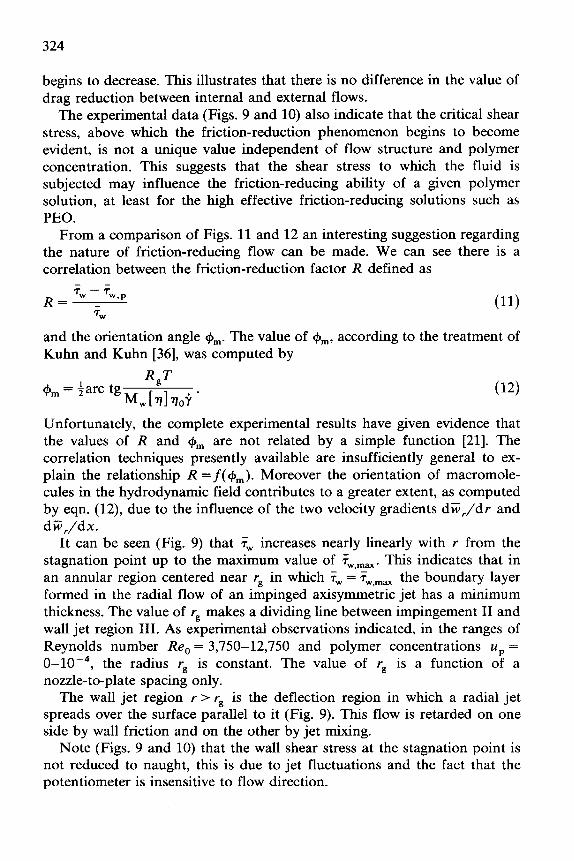
of local values ?+, are shown in Fig. 9. Very interesting is the large effect of polymer additive in reducing the wall shear stress. The friction reduction increases with concentration until it reaches a maximum value of about 80% in the range of polymer concentrations up = 25-100 w.ppm and then it
5Y.sGiT r/d 1.0 2.0 3.0 r/d
Fig. 11. Profile of the friction-reduction factor; w.ppm.
Fig. 12. Radial distribution of the orientation angle &,,; up = 50 w.ppm.
324
begins to decrease. This illustrates that there is no difference in the value of drag reduction between internal and external flows.
The experimental data (Figs. 9 and 10) also indicate that the critical shear stress, above which the friction-reduction phenomenon begins to become evident, is not a unique value independent of flow structure and polymer concentration. This suggests that the shear stress to which the fluid is subjected may influence the friction-reducing ability of a given polymer solution, at least for the high effective friction-reducing solutions such as PEO.
From a comparison of Figs. 11 and 12 an interesting suggestion regarding the nature of friction-reducing flow can be made. We can see there is a correlation between the friction-reduction factor R defined as
and the orientation angle &,. The value of +,, according to the treatment of Kuhn and Kuhn [36], was computed by
Unfortunately, the complete experimental results have given evidence that the values of R and c#+,, are not related by a simple function [21]. The correlation techniques presently available are insufficiently general to ex- plain the relationship R =f( $a,). M oreover the orientation of macromole- cules in the hydrodynamic field contributes to a greater extent, as computed by eqn. (12), due to the influence of the two velocity gradients dw,/dr and diC,/dx.
It can be seen (Fig. 9) that Yw increases nearly linearly with Y from the stagnation point up to the maximum value of ?w,ma”. This indicates that in an annular region centered near rg in which +w = T,,,+_,~ the boundary layer formed in the radial flow of an impinged axisymmetric jet has a minimum thickness. The value of rp makes a dividing line between impingement II and wall jet region III. As experimental observations indicated, in the ranges of Reynolds number Re, = 3,750-12,750 and polymer concentrations up = 0-10m4, the radius Ye is constant. The value of rs is a function of a nozzle-to-plate spacing only.
The wall jet region r > rg is the deflection region in which a radial jet spreads over the surface parallel to it (Fig. 9). This flow is retarded on one side by wall friction and on the other by jet mixing.
Note (Figs. 9 and 10) that the wall shear stress at the stagnation point is not reduced to naught, this is due to jet fluctuations and the fact that the potentiometer is insensitive to flow direction.

325
TABLE 3
Dimensionless radius r,/d as a function of polymer concentration
Polymer concentration Wppm)
Dimensionless radius t-,/d
at x/d = 6.0
0 25 50 100
1.83 1.94 2.16 2.38
At a distance r = O-r, from the stagnation point the fluid flow is laminar even for very high jet Reynolds numbers due to marked negative pressure gradients. The indication of some change in the character of the flow is an abrupt change in the slope of the 7~~ vs. r/d curve at r-,/d (Fig. 9). We associate the point r, with transition from a laminar to a turbulent boundary layer. For Newtonian jets this point coincides exactly with the end of the region of the measured pressure gradients. This is indeed the case for all the curves, but only in case of jets impinging at nozzle-to-plate spacings shorter than the potential core, i.e. for x < d,. The transition is triggered by the disappearance of the pressure gradients which exist in the vicinity of the stagnation point. For the polymer solutions the pressure gradients disappear faster than for water though a transition from a laminar to a turbulent boundary layer takes place at a greater distance from the stagnation point. We can see (Table 3) that the viscoelastic characteristic of the fluid has delayed the transition. The deviation of the behaviour of flow from this expected pattern is ascribed to the extension of the molecular coils or molecular aggregates at high strain rates. In the region 0 -C r G rg, the randomly coiled macromolecules are exposed to dilatational flow with longitudinal gradients which expand the coil considerably more than a flow with transverse gradients. This particle-flow interaction, as mentioned be- fore, inhibits turbulence production. The greater the number of the polymer coils is elongated by the exposure to flow field, the stronger the damping effect (Table 3).
From the point r, a smooth, monotonic decrease of 7_, with an increasing r is observed (Fig. 9). As x/d is further increased, this change in slope at rt also becomes less and less marked and the radial distribution of wall shear stress has a perfectly smooth shape, e.g. for x/d = 12 (Fig. 10). This shape can be accounted for by the radial variation of the thickness of a boundary layer free of transitions.
5. Conclusions
The results of this experiment show that in the presence of polymer molecules the jet shares its momentum slower. The mean velocity profiles

326
tend to be somewhat narrower than for water, probably due to a delay in the onset of turbulence. The measurements of the mean velocity as a function of radial and axial position showed a decrease of the half-width spreading coefficient and the velocity decay rate with increasing polymer concentra- tion. The viscoelastic nature of the fluid has substantial effect on the length of the potential core.
The shape of the pressure profiles on the deflecting surface depends on polymer concentration, though in the region where the flow structure is self-preserving the profiles are described by a one dimensionless general curve (Fig. 8) for water and all concentrations of PEO.
The PEO tends to delay the onset of turbulence in the wall jet region. The critical shear stress, above which the friction-reduction occurs, is a function of flow structure and polymer concentration. It is possible that the effect of the skin-friction drag reduction of about 80% is connected with the orienta- tion of macromolecules in the hydrodynamic field.
Acknowledgements
This investigation was carried out under the sponsorship of the Ministry of Science and Higher Education of Poland. The authors wish to express their thanks to the Management of Research Program MR-1-10 for the permission to publish this work.
Notation
b
c* c2 d
4 D
Kl K* WV AP
APk r
‘0.5
R
R, s
velocity scaling length location of the dimensionless geometric origin location of the dimensionless kinematic origin diameter of nozzle length of the potential core diffusion coefficient rate of jet widening center line velocity decay rate molecular weight of polymer excess pressure over the ambient value excess stagnation pressure radial distance from the stagnation point pressure scaling length friction-reduction factor gas-law constant in eqn. (12) rate of increase of jet width time

327
T
% W
x
Z
AZ
Greek
P Y 17 [VI 90
V
P
absolute temperature in eqn. (12) polymer concentration velocity axial distance from the jet efflux plane distance from the leading edge of the wedge probe thickness of the solid-like stagnation material
mass-transfer coefficient shear rate dynamic fluid viscosity intrinsic viscosity solvent dynamic viscosity kinematic fluid viscosity fluid density shear stress orientation angle characteristic time of fluid
Superscripts
, fluctuating
Overbars
- time-smoothed
Subscripts
max maximum value 0 at the jet efflux plane
P polymer r local value at r W at the wall X local value at x
References
1 M.M. Reischman and W.G. Tiederman, J. Fluid Mech., 0 (1975) 369. 2 P.S. Virk, J. Fluid Mech., 45 (1971) 225. p
3 C. Elata, J. Lehrer and A. Kahanovitz, Israel J. Technol., 4 (1966) 87. 4 Y. Goren and J.F. Norbury, Trans. Am. Sot. Mech. Eng., D 89 (1967) 814.

328
5 P.S. Virk, E.W. Merrill, H.S. MickIey, K.A. Smith and E.L. MolIo-Christensen, J. Fluid Mech., 30 (1967) 305.
6 S.J. Barker, J. Fluid Mech., 60 (1973) 721. 7 G.E. Gadd, Nature, 206 (1965) 463. 8 D.A. White, J. Fluid Mech., 28 (1967) 195. 9 S.A. VIasov and V.N. KaIashnikov, Nature, 224 (1969) 1195.
10 R.A. PownaII and K.M. Kiser, Ind. Eng. Chem. Fundam., 9 (1970) 293. 11 S.A. VIasov, O.V. Isaeva and V.N. KaIashnikov, Inzh.-phis. zh., 25 (1973) 987. 12 Z.P. ShuIman, N.A. Pokryvailo, N.D. KovaIevskaya and V.V. Kulebyakin, Inzh.-phis. zh.,
25 (1973) 977. 13 L.G.R. Filipsson, J.H. Lagerstedt and F.H. Bark, J. Non-Newtonian Fhtid Mech., 3
(1977) 97. 14 H. Usui and Y. Sano, J. Chem. Eng. Jpn, 13 (1980) 401. 15 N.S. Berman and T. Hung, Am. Inst. Chem. Eng. J., 31 (1985) 208. 16 M. Kwade, Rheol. Acta, 21 (1982) 120. 17 M. Hibberd, M. Kwade and R. Scharf, Rheol. Acta, 21 (1982) 582. 18 R. Scharf, Rheol. Acta, 24 (1985) 385. 19 M. Poreh, Y.G. Tsuei and J.E. Cermak, Trans. Am. Sot. Mech. Eng., ES9 (1967) 457. 20 F. Girah, Ch. Chia and 0. Trass, Ind. Eng. Chem. Fundam., 16 (1977) 21. 21 P. Glowacki, Ph.D. Thesis, Technical University, Poznah, 1983. 22 T. Mizushina, H. Usui and T. Yoshida, J. Chem. Eng. Jpn, 7 (1974) 162. 23 P. Grassmann, N. Ibl and I. Irtib, Chem. Ing. Tech., 33 (1961) 529. 24 J.E. Mitchell and T.J. Hanratty, J. Fluid Mech., 26 (1966) 199. 25 T. Mizushina, Adv. Heat Transfer, 7 (1971) 87. 26 N.A. Pokryvailo, A.S. Sobolevsky, Z.P. Shulman and T.V. Yushkina, Inzh.-phis. zh., 37
(1979) 289. 27 T.J. Hanratty, G.L. Chorn and D.T. Hatziavramidis, Phys. Fluids, 20 (1977) 112. 28 K. Koziol and P. Glowacki, Report MR-1-10, Technical University, Poznah, 1980. 29 C.A. Friehe, W.H. Schwarz, Viscous Drag Reduction. Plenum Press, New York, NY,
1969, pp. 281. 30 R.W. Serth and K.M. Kiser, Am. Inst. Chem. Eng. J., 16 (1970) 163. 31 N.A. HaIIiwell and A.K. Lewkowicz, Phys. Fluids, 18 (1975) 1617. 32 A.B. Metzner, G. Astarita, Am. Inst. Chem. Eng. J., 13 (1967) 550. 33 H. SchIichting, Boundary Layer Theory. McGraw-Hill, New York, NY, 1968. 34 V.W. Goldschmidt and S.C. Chuang, Trans. Am. Sot. Mech. Eng., D 94 (1972) 22. 35 S. Beltaos and N. Rajaratnam, Proc. Am. Sot. Ci. Eng., J. Hydraul. Div., 100 (1974) 1313. 36 W. Kuhn and H. Kuhn, Helv. Chim. Acta, 29 (1946) 71.