Sedimentation and welding processes of dilute pyroclastic ...
Upload
independentCategory
view
3download
0
Advanced Powder Technol Vol 15 No 1 pp 31ndash49 (2004)Oacute VSP and Society of Powder Technology Japan 2004Also available online - wwwvsppubcom
Original paper
Computational model for prediction of particledegradation during dilute-phase pneumatic conveyingmodeling of dilute-phase pneumatic conveying
PIERRE CHAPELLE1curren NICHOLAS CHRISTAKIS 1HADI ABOU-CHAKRA2 IAN BRIDLE 3 M S A BRADLEY3MAYUR PATEL 1 and MARK CROSS 1
1 Centre for Numerical Modelling and Process Analysis University of GreenwichOld Royal Naval College Park Row Greenwich London SE10 9LS UK
2 Chemical and Process Engineering School of Engineering University of SurreyGuildford Surrey GU2 7XH UK
3 The Wolfson Centre for Bulk Solids Handling Technology University of GreenwichWellington Street Woolwich London SE18 6PF UK
Received 3 December 2002 accepted 7 March 2003
AbstractmdashA complete model of particle impact degradation during dilute-phase pneumatic convey-ing is developed which combines a degradation model based on the experimental determination ofbreakage matrices and a physical model of solids and gas ow in the pipeline The solids ow ina straight pipe element is represented by a model consisting of two zones a strand-type ow zoneimmediately downstream of a bend followed by a fully suspended ow region after dispersion of thestrand The breakage matrices constructed from data on 90plusmn angle single-impact tests are shown togive a good representationof the degradationoccurring in a pipe bend of 90plusmn angle Numerical resultsare presented for degradation of granulated sugar in a large scale pneumatic conveyor
Keywords Dilute-phase pneumatic conveying numerical simulations impact degradation breakagematrices
1 INTRODUCTION
Particle degradation during dilute-phase pneumatic conveying is often a majorconcern in industrial practice [1] Current computational approaches for simulatingpneumatic conveying systems concentrate only on the detailed description of the ow of the solids and gas phases and disregard the damage which occurs to theparticle on impact with pipe walls (eg [2 3]) Comparatively erosive wear of
currenTo whom correspondence should be addressed E-mail pchapellegreacuk
32 P Chapelle et al
bends by particle impact has been widely studied in the literature and models havebeen presented for predicting the life time of individual bends in conveying systems(eg [4 5])
The aim of this paper is the numerical prediction of particle degradation duringdilute-phase pneumatic conveying In a previous work [6] the concept of a breakagematrix has been used to develop a procedure for determining degradation propensityunder a range of particle velocities and particle sizes from single-impact tests carriedout in a laboratory-scale degradation tester In the present work a complete modelof dilute-phase pneumatic conveying is developed which incorporates within aphysical ow model of the solids and gas phases through the pipeline a model forparticle degradation based on the analysis presented in [6] Numerical results arepresented for the degradation of granulated sugar in an industrial scale pneumaticconveyor
2 NUMERICAL MODELS
Since the most extensive damage during dilute-phase pneumatic conveying iscaused by collisions of the particles with bend walls [7] only degradation by impactat the bends is considered in the present work
A number of simplifying assumptions have been made in order to arrive at aworking model
sup2 All particles travel at the same velocity whatever their size and density [8]
sup2 Interparticle collisions are neglected since only dilute phase conveying systemsare considered
sup2 Degradation of a particle in a bend is represented by a single impact Indeedthe rst impact gives rise to the most severe damage and additional impactsin the same bend after the particle rebounds off the wall are not considered assigni cant as a rst approximation As will be shown later the collective effect ofa 90plusmn angle bend on a particle size distribution can be represented quite accuratelythrough a 90plusmn angle single-impact event
sup2 Fatigue phenomena by which a particle breaks when collisions occur a numberof times are ignored as a rst approximation Hence each impact of a particle isconsidered independent of the next
Two important parameters affecting degradation by impact are the particle con-veying velocity and the collision angle (the angle between the particle path and thetangent to the wall at the collision point) which most likely vary along the lengthof the pipeline [7] Therefore it is essential for the evaluation of degradation to rstcalculate the particle velocity at any point in the system and hence the velocity ofany impact between a particle and the bend wall A model for particle degradationshould additionally consider the effect of the bend structure (type of bend radius ofcurvature) upon which the collision angle is critically dependent
Modeling of dilute-phase pneumatic conveying 33
As a consequence a prerequisite to the modeling of degradation during dilute-phase conveying is the development of a model for particle acceleration within thepipeline and the capability to correlate the impact angle and the bend structure
21 Flow model
The pipeline is divided up into straight sections and bends
211 Straight horizontal pipeline Observations by tomography of the owpattern during dilute-phase conveying [9] reveal two distinct modes of ow in astraight pipe element as represented on Fig 1 Note that the developed ow modesin the case of a horizontal bend to a horizontal straight pipe are identical to thoseshown in Fig 1
Downstream of a pipe bend as a result of being slowed down inside the bendparticles are mainly transported in a form of a strand in which a high concentrationlayer of particles occupies the lower portion of the pipe In the upper portion ofthe pipe particles are suspended in the transport gas As particles on the top ofthe layer are picked up from the surface by the gas stream owing more quicklythe layer is gradually eroded and decreases in depth along the pipeline A point isreached where the layer of solids vanishes and all the particles are transported as ahomogeneous gasndashsolid suspension ow (characterized by a uniform dispersion ofthe particles across the pipe) This mode of ow is called fully suspended ow Itshould be mentioned that similar phenomena occur to suspend the particles initiallyat rest after their injection at the inlet of the conveying pipe [10]
The approach used in the present study for modeling the strand type ow is basedon the model of Bradley et al [11] This model is a one-dimensional model whichdescribes the ow of two layers (ie the dense strand and the suspended ow abovethe strand) with separate velocity and exchanging momentum between them due toshear forces at their interface It is based on a balance of forces on elements of theregion above the strand and of the strand itself
Assuming the gravitational effects and the friction between the strand and thebottom end of the pipersquos inner surface being insigni cant in the balance of forcesacting on a strand element Newtonrsquos second law of motion applied to a strand
Figure 1 Schematic of the particulate ow downstreamof a pipe bend during dilute-phasepneumaticconveying
34 P Chapelle et al
element of length plusmnl leads to the following expression
iqueststrSstr D frac12bplusmnlfrac14D2
41 iexcl Aacuteastr (1)
In this equation iqueststr is the shear stress between the strand and the suspended owabove Sstr is the strand surface area in contact with the suspended ow frac12b is thebulk density of the material in the strand which is assumed to remain constantthroughout the strand dispersion process D is the pipe diameter 1 iexcl Aacute representsthe fraction of the pipe cross-sectional area which is covered by the strand and astr
is the acceleration of the strand elementThe friction force between the strand and the suspended ow is modeled in
analogy to single-phase ow using an equivalent Moody friction factor as suggestedin Bradley et al [11]
iqueststr Dfrac12airfstr
2vair iexcl vstr
2 (2)
where frac12air is the air density and vair and vstr are the air and strand velocities Thevalue of the equivalent Moody friction factor fstr is increased above the one obtainedfrom the Moody diagram [12] in order to account for the additional momentumtransfer resulting from the interchange of particles between the surface of the strandand the suspended ow
The motion of the suspended ow is controlled by a balance between a drivingforce 1PsuspAacutefrac14D2=4 and the frictional resistances against the pipe wall iquestsusp andthe strand iqueststr
iqueststrSstr C iquestsuspSsusp D 1Psuspfrac14D2
4Aacute (3)
where Ssusp is the contact area between the suspended ow and the pipe wallThe friction force between the conveying gas and the pipe wall is modeled as for
single-phase ow
iquestsusp Dfrac12airfsusp
2v2
air (4)
where the value of the friction factor fsusp is assumed as before to be higher thanthe one determined for air alone from the Moody diagram [12] to allow for thecontribution to the pressure gradient of the particles present in the suspended ow
In the fully suspended ow region the slip velocity between the air and theparticles is assumed to be negligible The usual approach of calculating the totalpressure drop along an elemental length consists of splitting the pressure gradientinto two parts [13]
1P D 1Pair C 1Psolids (5)
where 1Pair is the pressure drop that would be expected with air only in the pipeand 1Psolids represents the additional pressure drop caused by the particles presentin the gas
Modeling of dilute-phase pneumatic conveying 35
1Pair is calculated as for single-phase ow conditions from Darcyrsquos equation
1Pair D2f plusmnl
Dfrac12airv
2air (6)
with the pipe ow friction factor f The pressure drop due to the particles can be represented by [14]
1Psolids D Kplusmnlfrac12suspv2air (7)
where frac12susp is the suspension density (de ned as the mass ow rate of solids dividedby the volume ow rate of air) and K is an empirical coef cient
The increase in air velocity caused by the expansion of the air is given by
vair D4
sup2V air
frac14D2 (8)
wheresup2
V air is the volume ow rate of air which is determined from the ideal gas lawto take gas compressibility effect into account
Psup2
V air Dsup2mairRTair (9)
withsup2mair the mass ow rate of air R the gas constant and Tair the air temperature
212 Straight vertical pipeline Only vertically-up sections are considered inthe present study since long vertical down sections are not common in industrialpractice For the strand type of ow the gravitational force must be included inthe force balance on a strand element in (1) The approach of Mills [15] who hasfound that vertically-up sections show pressure gradient approximately twice thatof horizontal sections has been applied to predict the pressure drop under fullysuspended ow conditions Therefore the pressure drop value obtained from (5)needs to be doubled
213 Bend pipeline It has been observed that the pressure drop caused bya bend does not occur in the bend itself but in the straight pipe immediatelydownstream of the bend [16 17] As a consequence there is no pressure drop in thebend The deceleration of the particles on their way through a bend occurs mainlyas a result of bouncing and sliding contact with the pipe wall under the effect of thecentrifugal force The particle velocity change inside the bend can be described bya simple physical model based on Newtonrsquos second law in which the particlendashwallinteractions are characterized by a coef cient of friction sup1 and an overall coef cientof restitution e This leads to
v D ev0 expiexclsup1micro (10)
where v0 is the particle velocity as it enters into the bend and micro is the angular positionof the particle inside the bend The overall coef cient of restitution e is de ned in
36 P Chapelle et al
terms of the initial and rebound velocities vi and vr as
e D vr=vi (11)
Assuming a constant mass ow rate of solids within the pipeline it is possible towork out from the particle velocity value the fraction of the pipe cross-sectionalarea occupied by the strand 1 iexcl Aacute at the outlet section of the bend The associatedincrease in the air velocity due to the reduction of the cross-sectional area availablefor the air can then be obtained from mass conservation
214 Parameters of the model The friction factor between the air and the pipewall f can be read directly on the Moody diagram for the actual air Reynoldsnumber and surface roughness conditions [12]
The value of the coef cient K characterizing the solids contribution to thepressure gradient in the fully suspended ow can be obtained from the empiricaldiagram of Hyder who plotted the values of K versus the particle size and theparticle density [14]
Finally the last two parameters of the model ie the two equivalent Moodyfriction factors fstr and fsusp must be estimated from experimental data eg by tting the calculated pressure pro le downstream of a bend to the measured oneOur determination of the friction factor between the suspended ow and the pipewall fsusp is based on Bradleyrsquos analysis who postulated a linear relationship offsusp against the suspension density [11]
215 Numerical solution procedure The solution procedure in a straight sec-tion is based on the subdivision of the pipe into elemental lengths Calculationproceeds forwards along the pipeline taking into account each element in turn Theboundary condition on pressure is set either at the end of the conveying line (in thecase of a positive pressure system) or at the beginning of the pipe (in the case of avacuum system) Therefore in the case of a positive pressure system the calcula-tion procedure works with a guessed value of the pressure at the inlet of the pipeand is iterated to obtain the known value of the pressure at the end of the pipe
The solution of each element is achieved through an iteration procedure by usinga central difference scheme The procedure for an element in the strand ow regionis illustrated in Fig 2
The procedure begins with known values of air pressure air and strand velocitiesand strand cross-sectional area at the starting end of the element and guessed valuesof these quantities at the opposite end of the element First the strand surface incontact with the air Sstr and the contact area of the air with the inside surface ofthe pipe Ssusp are worked out (by geometry considerations) from the cross-sectionalarea covered by the strand The friction forces between strand and air iqueststr and airand pipe iquestsusp are then determined from (2) and (4) respectively These valuesare used to determine the acceleration of the strand element from (1) and the newstrand velocity at the opposite end of the element thus nding the decrease in the
Modeling of dilute-phase pneumatic conveying 37
Figure 2 Flow chart for the solution procedure of the governing equations of the strand-type ow
cross-sectional area of the strand from the conservation of the solids mass ow rateThe pressure of air at the outlet of the corresponding suspended ow element isobtained from the pressure drop in the air element calculated from (3) The valueof the air velocity at the outlet of the air element resulting from the expansion ofthe air and the increase in the cross-sectional area available for the air (due to thereduction of the depth of the strand as its velocity increases) is determined usingthe conservation of the air mass ow rate in conjunction with the perfect gas lawThe overall procedure is repeated until convergence is reached on the values of theair pressure the air and strand velocities and the strand cross-sectional area at theopposite end of the element
The model of acceleration of the strand type ow has been previously validatedthrough comparisons against pressure measurements obtained in an industrial-scalepneumatic conveying system [11]
38 P Chapelle et al
22 Degradation model
As discussed earlier particle degradation is considered to occur only by impact atthe bends By analogy to the traditional analysis of grinding processes by populationbalance models (eg [18]) the variation of all particles sizes in an impact eventcan be represented in a concise way by means of a breakage matrix based on thefollowing matrix equation [6]
B cent i D o (12)
where i and o are column vectors whose entries are the particle mass fraction ineach size class respectively before and after impact and B is the breakage matrixwhose elements bij de ne the mass fraction of particles of size class j which afterimpact ends up in size class i Chapelle et al [6] developed an interpolation methodfor calculating the output particle size distribution over a range of impact velocitiesand particle sizes based on the measurement of the breakage matrix for a limitednumber of velocities in a laboratory scale degradation tester
In this paper the overall change in the particle size distribution between the inletand the outlet of a bend is described by an equation equivalent to (12) Assumingthat degradation in a bend can be represented by a single impact the variables i ando in (12) are now de ned as the particle size distribution at the inlet and outlet of thebend respectively Numerical evaluation of the outlet particle size distribution o isperformed by means of the method presented in [6] for the impact velocity involvedin the bend which is considered to be the particle velocity at the inlet section ofthe bend calculated from the ow model Experimental breakage matrices mustbe constructed from results of impact experiments carried out at an impact anglerepresentative of the angle of collision in the bend which is primarily dependenton the angle of the bend involved However it is not possible to evaluate directlythe angle at which a particle impacts on the wall without performing a Lagrangiandescription of the particulate ow within the bend Therefore a simpli ed modelis proposed in which a given value of the bend angle is assumed to correspondto a given value of the particle impact angle As it will be demonstrated laterthis approach enables a satisfactory characterisation of degradation processes in 90plusmn
angle bends
3 VALIDATION OF THE DEGRADATION MODEL AGAINST PNEUMATICCONVEYING TESTS IN THE LABORATORY
31 Test facility
A pilot-sized pneumatic conveyor test facility was developed to predict degradationin pneumatic conveying systems (see Fig 3) This test facility allows material tobe conveyed around one bend with certain critical variables regulated The entiresample of the conveyed material is then captured and analyzed to assess the amountof degradation caused under the designated test conditions Care has been taken
Modeling of dilute-phase pneumatic conveying 39
Figure 3 Schematic of the pilot-sized pneumatic conveyor test rig
with the design of this conveying section to ensure that the acceleration lengthprovided is adequate for the particles to reach a steady-state velocity [8] Thepneumatic conveyor test rig is described in detail in [19]
32 Conveying tests
The aim of this test rig is to assess as accurately as possible the degradation ina single bend The rig works on a negative pressure principle that minimizesdegradation due to feeders Particles were accelerated along a 38-mm internaldiameter pipeline over a length of 12 m Material was conveyed around one bendinto a receiving hopper Once the entire sample of conveyed material had beencollected from the hopper a particle size analysis was applied to assess the amountof degradation caused under the designated test conditions An advantage of usingthis test facility is that it is possible to collect all the conveyed material as the lterand the internal walls of the receiving hopper are easily accessible and cleaned
A series of tests using granulated sugar (of solids density of 1600 kgm3) atvarying velocities (9 16 and 22 ms) for a short radius R=D D 36 90plusmn
angle bend geometry was undertaken A constant suspension density equal to15 kgm3 was used in all experiments The retrieved sample was reduced toa smaller representative quantity using a dividing rif e box For the means ofmeasuring degradation the particle size analysis was performed according to BritishStandard [20] procedure for conducting a sieve test The experimental uncertaintyhas been calculated to be 5
40 P Chapelle et al
Figure 4 Particle size distribution of sugar samples at different particle velocities using a pilot-sizedpneumatic conveyor test facility
33 Test results
Figure 4 shows the degradation behaviour of the sugar for a range of particlevelocities As expected the amount of degradation increases as the velocityincreases However it seems likely that below 22 ms the amount of degradationis relatively small which might be due to the fact that the strength of the particleis high enough to resist the shock of subjected impacts only peripheral fracturesoccur This is typi ed by the corners of the sugar having a tendency to break fromthe particle
34 Comparison between the model and the test results
For the above-mentioned inlet particle size distribution the outlet particle sizedistribution has been calculated at each investigated velocity by means of thepresented degradation model using the breakage matrices determined in a previouswork [6] These results are compared against the measurements from the pilot-sizedpneumatic conveyor rig (see Fig 5)
Good agreement is found between the particle size distribution measured and thatcalculated for each impact velocity These results demonstrate that the degradationmodel based on 90plusmn angle single impact data does give a suitable representation ofthe degradation that takes place in a 90plusmn angle bend
The calculated air pressure at the bend inlet (0997 pound 105 Pa) is in reasonableagreement with the measured value (0918 pound 105 Pa) with a relative difference ofabout 8
Experimental tests performed in the pilot-sized pneumatic conveyor rig for 90plusmn
single bends need not be repeated with bends of different curvatures since ithas been experimentally observed [19] that the bend curvature does not have a
Modeling of dilute-phase pneumatic conveying 41
Figure 5 Comparison between the experimental results and the prediction of the model
signi cant effect in the extent of particle degradation for granulated sugar beingpneumatically conveyed through a series of 90plusmn bends
4 APPLICATION TO A LARGE-SCALE PNEUMATIC CONVEYING PROCESS
As an illustrative application the model presented above has been used to studydegradation in an industrial-scale dilute-phase pneumatic conveying system Thelayout of the pipe system is shown in Fig 6 The pipeline with internal diameterof 0053 m includes various elements ie horizontal pipes 90plusmn elbow bends (ofcurvature R=D D 36) and a vertically upward pipe
The conveyed materials is granulated sugar of solids density 1600 kgm3 and withan initial size distribution identical to that used for the laboratory tests described inSection 3 The experimental breakage matrices determined in [6] for this materialhave been used in the degradation model The simulations were performed foroperational conditions usually employed in industrial practice ie a conveyingvelocity of 185 ms and a suspension density of 15 kgm3 In the inlet cross-sectionof the pipeline particles were assumed to be homogenously dispersed and the gas
42 P Chapelle et al
Figure 6 Layout of the industrial-scalepneumatic conveying line
Table 1Values of the parameters in the ow model used for the calculations
Parameter Value
Inlet air velocity (vair) 185 msMass ow rate of particles (
sup2ms D frac12susp
sup2V air 0615 kgs
Friction factor strandsuspended ow (fstr) 3Friction factor suspended owpipe wall (fsusp) 00115Friction factor airpipe wall (f ) 00044Coef cient characterising the pressure drop caused by 16 pound 10iexcl6
the particles in the gas (K )Bend wall friction coef cient (sup1 025Coef cient of restitution (e) 08
and particle velocities were assumed to be identical Table 1 summarizes the valuesof the parameters in the ow model used for the calculations The dependence ofthe friction factor between the suspended ow and the pipe wall on the suspensiondensity was assumed to follow the relation obtained by Bradley et al [11]
0004 C 0005frac12susp (13)
An elemental length of 02 m was used for solving the governing equations of thestrand-type ow It was veri ed that an additional reduction in the value of theelemental length had no signi cant in uence on the results of the simulation
The predicted pro les of the air pressure and the air and particle velocities alongthe conveying pipeline are presented in Fig 7 The air expands along the pipewith a total pressure drop over the whole pipeline of the order of 15 pound 104 PaIt can be seen that the pressure distribution downstream of each bend (the bendsbeing located at a conveying distance from the inlet of 61 92 159 and 269 mrespectively) is characterized by a high-pressure gradient in the section immediately
Modeling of dilute-phase pneumatic conveying 43
Figure 7 Predictionof the numerical simulation for (a) air pressure and (b) air and particle velocitiespro les along the conveying line The indexes (i) (i D 1 5) refer to the location of the bends alongthe conveying line
adjacent to the bend followed by a lower-pressure gradient far downstream of thebend This pressure drop pro le around a bend is similar to the one observed inthe experiments of [17] Experiments for a wide range of materials and operatingconditions show that the length over which the development of the pressure dropinduced by a bend occurs (ie the distance which is necessary for the pressuredrop to approach a steady gradient) is of the order of 8 m (eg [8 14]) which is inreasonable agreement with the value of 6 m predicted by the present model
44 P Chapelle et al
Expansion of the air causes an increase in the air velocity and thus in the particlevelocity as a result of the momentum transfer between the gas and solids phasesIn a pipe bend particles are considerably slowed down due to centrifugal forcesand particlendashwall interactions The reduction of particle velocity around a bend ison average about 45 In the downstream straight section of a bend the particleswhich are conveyed in the form of a strand are progressively re-accelerated towardsthe air velocity It may be noted that the drop of the particle velocity in the bendand the subsequent creation of a strand is accompanied with a marginal increaseof the air velocity at the bend exit due to the reduction of the pipe cross-sectionalarea occupied by the air For this example none of the straight pipe sections islong enough to disperse completely the strand before reaching the next bend Suchdispersion of the strand can be observed in Fig 8 which shows the pro les of the airand particle velocities along the pipeline for the same simulation conditions exceptthe length of the last straight pipe of the conveying system which has been set to20 m in the present simulation (instead of 67 m previously) It can be seen thata transition from the strand-type ow to a fully suspended ow occurs in the laststraight pipe at a conveying distance of about 14 m from the outlet section of theupstream bend
Figure 9 shows the change in the harmonic mean size of the particle distributionafter each bend The harmonic mean size Xh was de ned by the equation
1
XhD
X wi
di
(14)
where wi is the fraction of material retained between sieves of mean size di
Figure 8 Calculatedpro les of the air and particle velocitiesalong the conveying line for a conveyingsystem with a last straight pipe section of 20 m length The indexes (i) (i D 1 5) refer to the locationof the bends along the conveying line
Modeling of dilute-phase pneumatic conveying 45
The materials experiences signi cant degradation as the harmonic mean decreasesat almost half of its initial value after conveying through ve bends The rate ofdegradation is approximately constant with respect to the number of bends sinceparticles in the present case have similar impact velocity in each bend (see Fig 7)
The full particle size distribution after each bend is presented on Fig 10 Asexpected degradation in the bend considerably alters the particle size distributionIt can be seen that as the number of passes through a bend increases the fractionsof the largest particles (gt425 sup1m) decrease whereas the fractions of the smallestparticles (lt425 sup1m) increase At the end of the conveying line almost 18 of
Figure 9 Harmonic mean sizes of the particle distribution after each pipe bend
Figure 10 Particle size distributionsafter each pipe bend
46 P Chapelle et al
Fig
ure
11
Har
mon
icm
ean
size
sof
the
part
icle
size
dist
ribu
tion
afte
rea
chpi
pebe
ndun
der
diff
eren
tinl
etai
rve
loci
ties
and
mas
s
owra
tes
ofpa
rtic
les
Modeling of dilute-phase pneumatic conveying 47
the material turns out to be dust (de ned as particles smaller than 200 sup1m) and thefraction of particles larger than 850 sup1m decreases to 80 of its initial value Thehigh degradation observed in our simulation can be explained by the relatively highconveying velocity used and the large bend angle considered
Numerical predictions for the particle harmonic mean diameter after each bendunder different inlet gas velocities and particles mass ow rates are shown in Fig 11It can be seen that the inlet gas velocity has a very signi cant effect on particledegradation Indeed a 30 increase of the inlet air velocity under the same particlemass ow rate (cases 1 and 2) causes a drop of approximately 30 of the particlemean diameter at the outlet of the conveying system Figure 11 shows also thatthe particle mass ow rate has a negligible in uence on particle degradation overthe range of values investigated as the particle mean diameter after each bendremains essentially unchanged between cases 1 and 3 The primary in uence ofthe air velocity on degradation is in agreement with the experimental observationscommonly reported in the literature (eg [21 22]) The fact that no signi cant effectof the particle mass ow rate on particle degradation is predicted in the simulationmay be attributed to two reasons First according to our analysis the particlemass ow rate plays a role only in the fully suspended ow mode [see (7)] whichcontrols the ow in the present simulation in a limited portion of the conveyingsystem ie the rst straight pipe (see Fig 7) Second the effect of collisionsof particles with other particles is not accounted for in the model in its presentform Interparticle collisions at high particle mass ow rate may cause a decreasein the particle velocity and hence reduce the level of degradation undergone by theparticles
5 CONCLUSIONS
Calculation of the propensity of particle degradation due to impact based on theexperimental determination of breakage matrices has been combined with a simplephysical ow model of the gas and solids phases to predict degradation duringdilute-phase pneumatic conveying By comparing the results of the degradationmodel to those obtained in a pilot-sized pneumatic conveyor test rig it has beendemonstrated that degradation occurring in a 90plusmn angle pipe bend can be adequatelydescribed using 90plusmn angle single-impact experimental data hence supporting themain assumption of the developed degradation model Numerical simulations for alarge scale pneumatic conveying system were presented and discussed
6 ONGOING WORK
The performance of the model developed in this work is promising and furtherexperimental work is planned to obtain data suf cient to validate the model foran industrial-scale pneumatic conveyor Moreover work is currently underway in
48 P Chapelle et al
order to enable the model to account for different bend angles multiple impacts ina bend and the effect of the number of impacts on the particle degradation behaviorThis should lead to a powerful engineering tool which can be employed for processcontrol and the prediction of the optimum operating conditions
Acknowledgements
This work forms part of the co-ordinated research project in Quality in Particu-late Manufacturing (QPM) funded by EPSRC Innovative Manufacturing Initiativefor Process Industries (grant no GRM1505701) whose support is gratefully ac-knowledged The authors wish to thank Professor Alan Reed and Professor UgurTuzun for useful discussions
REFERENCES
1 I Bridle S R Woodhead A J Burnett and R N Barnes A review of techniques for theinvestigation of particle degradation in pneumatic conveying systems in Proc 5th Int ConfBulk Materials Storage Handling and Transportation Newcastle pp 205ndash210 (1995)
2 Y Tsuji T Tanaka and T Ishida Lagrangian numerical simulation of plug ow of cohesionlessparticles in a horizontal pipe Powder Technol 71 239ndash250 (1992)
3 A Yilmaz and E K Levy Formation and dispersion of ropes in pneumatic conveying PowderTechnol 114 168ndash185 (2001)
4 K Shimizu T Noguchi H Seitoh M Okada and Y Matsubara FEM analysis of erosive wearWear 250 779ndash784 (2001)
5 R Hanson D Allsopp T Deng D Smith M S A Bradley I M Hutchings and M K PatelA model to predict the life of pneumatic conveyor bends Proc IMECHE E J Process MechEngng 216 143ndash149 (2002)
6 P Chapelle H Abou-Chakra N Christakis M Patel A Abu-Nahar U Tuumlzuumln and M CrossComputational model for prediction of particle degradation during dilute-phase pneumaticconveying the use of a laboratory-scaledegradation tester for the determination of degradationpropensity Advanced Powder Technol 15 13ndash29 (2004)
7 H Kalman Attrition control by pneumatic conveying Powder Technol 104 214ndash220 (1999)8 M S A Bradley Prediction of pressure losses in pneumatic conveying pipelines PhD Thesis
University of Greenwich London (1990)9 Y Yan I R Barrat J Ma and A R Reed On-line continuous mass ow measurement of
particulate solids in gas stream in Proc Int Symp on Reliable Flow of Particulate Solidspp 103ndash110 Porsgrunn (1999)
10 S B Savage R Pfeffer and Z M Zhao Solids transport separation and classi cation PowderTechnol 88 323ndash333 (1996)
11 M S A Bradley R J Farnish L M Hyder and A R Reed A novel analytical model forthe acceleration of particles following bends in pneumatic conveying systems in Handbookof Conveying and Handling of Particulate Solids A Levy and H Kalman (Eds) pp 411ndash423Elsevier Science Amsterdam (2001)
12 L F Moody Friction factors for pipe ow Trans ASME 66 671ndash684 (1944)13 O Molerus Overview pneumatic transport of solids Powder Technol 88 309ndash321 (1996)14 L M Hyder The effect of particle size and density on pressure gradients in horizontal pipelines
in lean phase pneumatic conveying PhD Thesis University of Greenwich London (1999)
Modeling of dilute-phase pneumatic conveying 49
15 D Mills in Pneumatic Conveying Design Guide pp 15ndash16 Warren Spring LaboratoryStevenage (1985)
16 H Ito Pressure losses in smooth pipe bends Trans ASME J Basic Engng 81 1ndash10 (1959)17 M S A Bradley and D Mills Approaches to dealing with the problem of energy loss due to
bends in Proc 13th Powder and Bulk Conf Rosemont IL pp 705ndash715 (1988)18 L G Austin Introduction to the mathematical description of grinding as a rate process Powder
Technol 5 1ndash17 (197172)19 I Bridle The analysis of particle degradation in pneumatic conveyors utilizing a pilot-sized test
facility PhD Thesis University of Greenwich London (2000)20 British Standards Institution Test Sieving Methods using Test Sieves of Woven Wire Cloth and
Perforated Metal Plate BS 1796 Part 1 BS1 London (1989)21 T A Bell A Boxman and J B Jacobs Attrition of salt during pneumatic conveying in Proc
5th World Congr of Chemical Engineering San Diego CA Vol V pp 238ndash243 (1996)22 A D Salman C A Biggs J Fu I Angyal M Szabo and M J Hounslow An experimental
investigationof particle fragmentationusing single particle impact studiesPowder Technol12836ndash46 (2002)
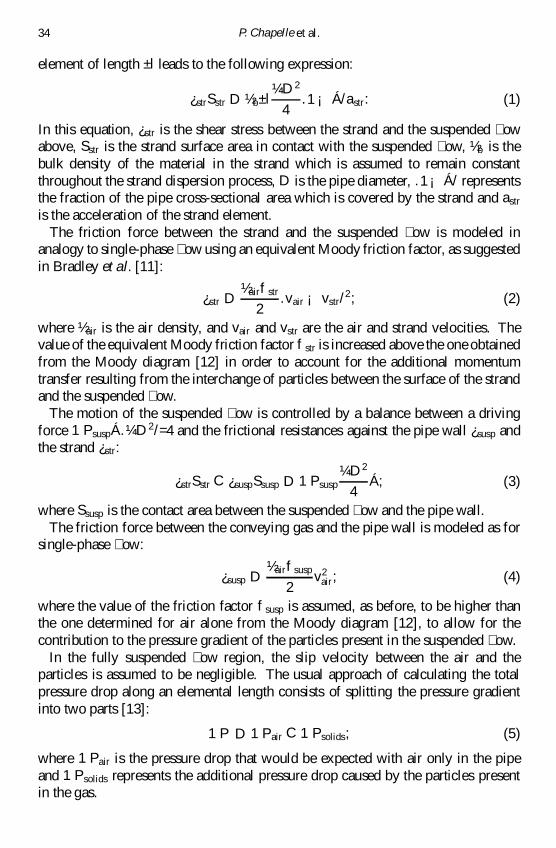
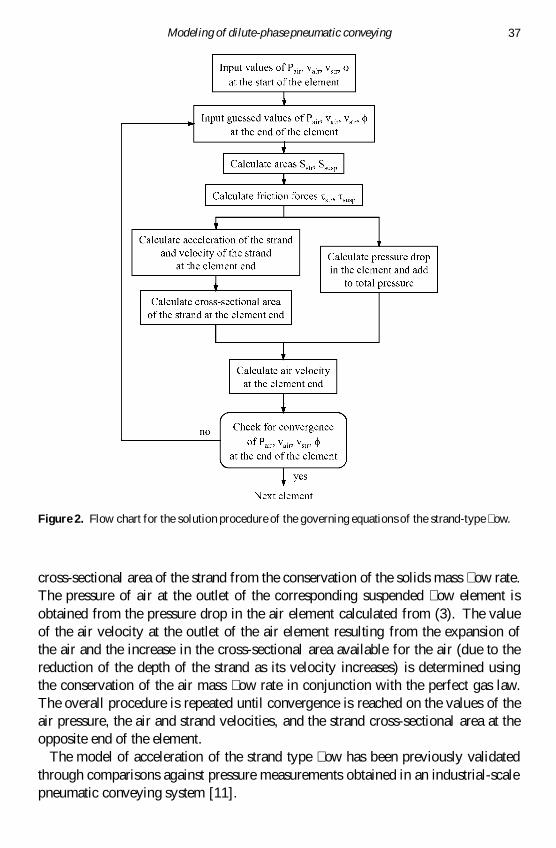
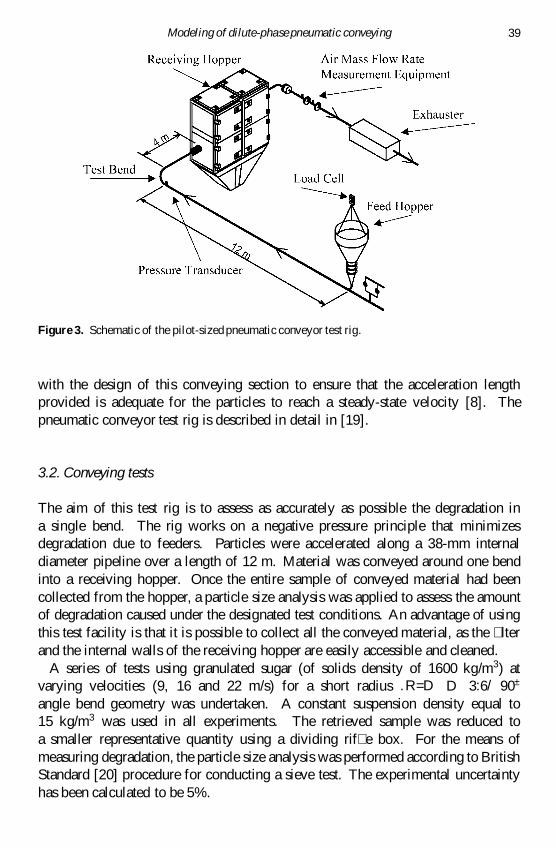
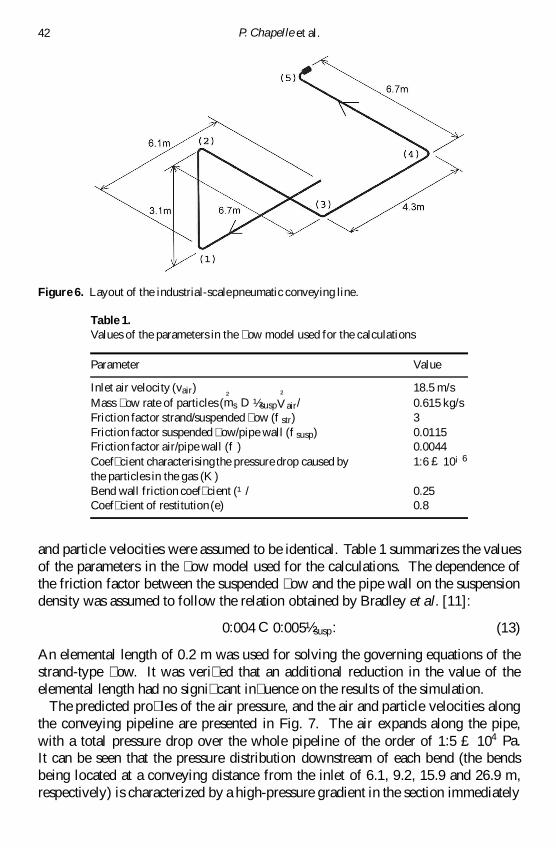
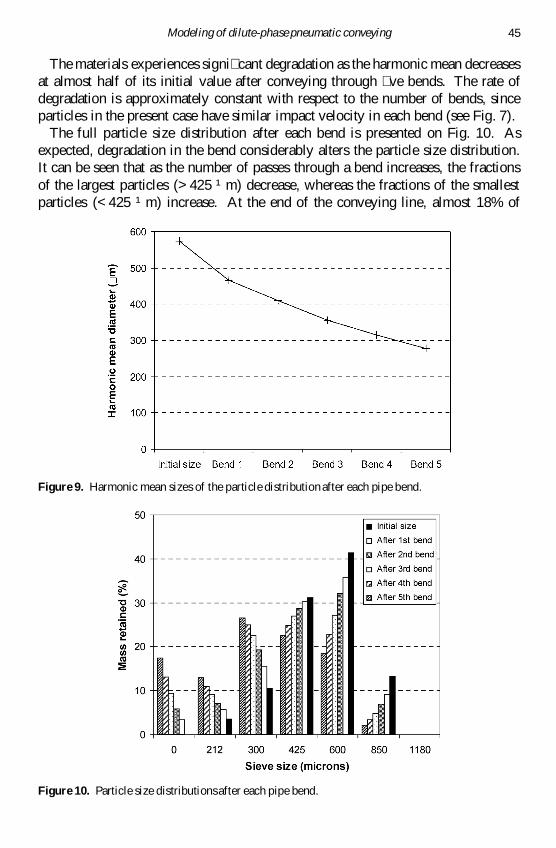
Copyright © 2022 FDOKUMEN