Synthesis of ligand-selective ZnS nanocrystals exhibiting ligand-tunable fluorescence
8
Journal of Colloid and Interface Science 316 (2007) 939–946 www.elsevier.com/locate/jcis Synthesis of ligand-selective ZnS nanocrystals exhibiting ligand-tunable fluorescence M. Habib Ullah a , Bonghwan Chon b , Taiha Joo b , Minsoo Son a , Il Kim a , Chang-Sik Ha a,∗ a National Research Laboratory of Nano-Information Materials, Department of Polymer Science and Engineering, Pusan National University, Busan 609-735, South Korea b Department of Chemistry, Pohang University of Science and Technology, Pohang 790-784, South Korea Received 23 May 2007; accepted 16 August 2007 Available online 28 August 2007 Abstract High-quality ZnS nanocrystals (NCs) of nearly identical size are synthesized using isomeric ligands, o-, m-, p-phenylenediamines (PDAs) that bind to the NC cores. The fluorescence emission from the NC is tunable according to the structure of the isomer. The measured fluorescence quantum yields (QYs) are 2–3 times higher for NCs that are passivated with isomeric PDA ligands than the fluorescence QY of NCs prepared at the absence of PDAs. The NC morphologies were studied by low-angle and wide-angle X-ray diffraction (XRD), and by transmission electron microscopy (TEM). The average correlating sizes were found to be 3.0 ± 0.3, 3.7 ± 0.30, and 3.0 ± 0.5 nm for the NCs that were passivated with o-PDA, m-PDA, and p-PDA, respectively. The Fourier-transform infra-red (FTIR) spectroscopy and X-ray photoelectron spectroscopy (XPS) studies were carried out to investigate the shell structure and the interaction between the core and the shell. The adsorbed ligands were quantitatively analyzed by TGA. The structure, morphology, and optical properties of these PDA passivated NCs were compared with the NCs prepared in the absence of PDA. © 2007 Elsevier Inc. All rights reserved. Keywords: Isomeric ligands; Phenylenediamine; ZnS nanocrystals; Fluorescence tuning 1. Introduction Colloid-based ‘soft-solution’ methods are suitable for the synthesis of encapsulated nanocrystals (NCs) because the parti- cle size can be controlled readily upon changing the concentra- tion and the type of organic molecular ligand [1]. Functional ligands may be used to coat the surfaces of the particles to allow them to become free standing in solution and prevent their direct aggregation. Such NCs often become soluble in or- ganic solvents or in aqueous solutions when the ligands bind strongly to their surfaces [2]. Water-soluble nanocrystals are used widely for studies in biological systems [2a,3]. NCs that are soluble in common organic solvents are suitable for prepar- ing polymer/inorganic composite materials, which may find ap- plications in high-refractive-index films, tunable light-emitting * Corresponding author. Fax: +82 51 514 4331. E-mail address: [email protected] (C.-S. Ha). diodes, optical waveguides, photovoltaic solar cells, and non- linear optical devices [4]. Small, uncapped semiconductor NCs usually form with de- fective states on their surfaces because of their large surface- to-volume ratios. The state of their surface dramatically affects their degree of luminescence quenching at the crystal surface. Surface defects are also often prominent in capped NCs when the ligands are not anchored suitably onto the surfaces. When the core semiconductor NCs are passivated effectively with ap- propriate ligands, however, their luminescence and fluorescence intensities can be increased substantially [5]. Such enhanced fluorescence emission results from suppression of nonradiative recombination because of the reduced concentration of sur- face states that feature dangling bonds and/or unstable surface atoms [1a,6]. The choice of capping ligand for the NCs is critical because it determines the stability, solubility, reactivity, size, and shape of the NCs during their synthesis [2a,7]. Size-dependent shifts in the absorption onsets and emission maxima to higher ener- 0021-9797/$ – see front matter © 2007 Elsevier Inc. All rights reserved. doi:10.1016/j.jcis.2007.08.043
-
Upload
independent -
Category
Documents
-
view
4 -
download
0
Transcript of Synthesis of ligand-selective ZnS nanocrystals exhibiting ligand-tunable fluorescence
Journal of Colloid and Interface Science 316 (2007) 939–946www.elsevier.com/locate/jcis
Synthesis of ligand-selective ZnS nanocrystals exhibitingligand-tunable fluorescence
M. Habib Ullah a, Bonghwan Chon b, Taiha Joo b, Minsoo Son a, Il Kim a, Chang-Sik Ha a,∗
a National Research Laboratory of Nano-Information Materials, Department of Polymer Science and Engineering, Pusan National University,Busan 609-735, South Korea
b Department of Chemistry, Pohang University of Science and Technology, Pohang 790-784, South Korea
Received 23 May 2007; accepted 16 August 2007
Available online 28 August 2007
Abstract
High-quality ZnS nanocrystals (NCs) of nearly identical size are synthesized using isomeric ligands, o-, m-, p-phenylenediamines (PDAs) thatbind to the NC cores. The fluorescence emission from the NC is tunable according to the structure of the isomer. The measured fluorescencequantum yields (QYs) are 2–3 times higher for NCs that are passivated with isomeric PDA ligands than the fluorescence QY of NCs prepared atthe absence of PDAs. The NC morphologies were studied by low-angle and wide-angle X-ray diffraction (XRD), and by transmission electronmicroscopy (TEM). The average correlating sizes were found to be 3.0 ± 0.3, 3.7 ± 0.30, and 3.0 ± 0.5 nm for the NCs that were passivatedwith o-PDA, m-PDA, and p-PDA, respectively. The Fourier-transform infra-red (FTIR) spectroscopy and X-ray photoelectron spectroscopy(XPS) studies were carried out to investigate the shell structure and the interaction between the core and the shell. The adsorbed ligands werequantitatively analyzed by TGA. The structure, morphology, and optical properties of these PDA passivated NCs were compared with the NCsprepared in the absence of PDA.© 2007 Elsevier Inc. All rights reserved.
Keywords: Isomeric ligands; Phenylenediamine; ZnS nanocrystals; Fluorescence tuning
1. Introduction
Colloid-based ‘soft-solution’ methods are suitable for thesynthesis of encapsulated nanocrystals (NCs) because the parti-cle size can be controlled readily upon changing the concentra-tion and the type of organic molecular ligand [1]. Functionalligands may be used to coat the surfaces of the particles toallow them to become free standing in solution and preventtheir direct aggregation. Such NCs often become soluble in or-ganic solvents or in aqueous solutions when the ligands bindstrongly to their surfaces [2]. Water-soluble nanocrystals areused widely for studies in biological systems [2a,3]. NCs thatare soluble in common organic solvents are suitable for prepar-ing polymer/inorganic composite materials, which may find ap-plications in high-refractive-index films, tunable light-emitting
* Corresponding author. Fax: +82 51 514 4331.E-mail address: [email protected] (C.-S. Ha).
0021-9797/$ – see front matter © 2007 Elsevier Inc. All rights reserved.doi:10.1016/j.jcis.2007.08.043
diodes, optical waveguides, photovoltaic solar cells, and non-linear optical devices [4].
Small, uncapped semiconductor NCs usually form with de-fective states on their surfaces because of their large surface-to-volume ratios. The state of their surface dramatically affectstheir degree of luminescence quenching at the crystal surface.Surface defects are also often prominent in capped NCs whenthe ligands are not anchored suitably onto the surfaces. Whenthe core semiconductor NCs are passivated effectively with ap-propriate ligands, however, their luminescence and fluorescenceintensities can be increased substantially [5]. Such enhancedfluorescence emission results from suppression of nonradiativerecombination because of the reduced concentration of sur-face states that feature dangling bonds and/or unstable surfaceatoms [1a,6].
The choice of capping ligand for the NCs is critical becauseit determines the stability, solubility, reactivity, size, and shapeof the NCs during their synthesis [2a,7]. Size-dependent shiftsin the absorption onsets and emission maxima to higher ener-
940 M.H. Ullah et al. / Journal of Colloid and Interface Science 316 (2007) 939–946
gies with decreasing size have been studied widely [3a,3d,4e,8,9]. Recently, we reported that PDAs are excellent cappingligands for silver nanoparticles, where the ligand-to-metal in-teraction is extremely strong, and the size, shape and the phaseof the colloidal nanoparticles are determined by the isomers ofPDA [10]. In the present study, we report a simple novel ap-proach for the synthesis of high-quality ZnS NCs capped witheither of three isomeric ligands: ortho (o)-, meta (m)-, and para(p)-phenylenediamines (PDAs). The NCs are of nearly identi-cal size, but the fluorescence emission of the NC was tunableaccording to the structure of the isomer, i.e. fluorescence emis-sion can be sharply tuned by the same structure molecules withdifferent positioning amine functional groups.
2. Experimental
2.1. Materials
All of the chemical reagents used in this study are analyti-cal grade and used without further purification. The reagents,o-, m-, and p-PDAs, zinc acetate dihydrate [Zn(CH3COO)2·2H2O], thiacetamide, 2-(4-biphenylyl)-5-phenyl-1,3,4-oxadi-azole (PBD), anhydrous N,N -dimethylacetamide (DMAc) anddimethylsulfoxide (DMSO) were purchased from Sigma–Al-drich.
2.2. Synthesis
The following procedure was used to synthesize the o-,m-, and p-PDA-passivated ZnS NCs. Typically, the PDA(2.77 mmol) was dissolved in dimethylacetamide (DMAc)(10 mL) at ca. 45 ◦C. In a separate vial, Zn(CH3COO)2·2H2O(1.15 mmol) was dissolved in DMAc (10 mL) under sonication(ca. 2 min) and was then added into the PDA solution to al-low the Zn2+ ions to adsorb onto the amino groups of the PDA.Thioacetamide (1.15 mmol) was dissolved in DMAc (20 mL) ina two-channel flask under magnetic stirring near room temper-ature; N2 gas was purged for a few minutes. The temperatureof the solution was increased to 110 ◦C (the melting point ofthioacetamide) at a rate of 3 ◦C/min. Under vigorous magneticstirring, the Zn2+–PDA solution was injected into the thioacet-amide solution and then the temperature of the mixed solutionwas raised to 165 ◦C (the boiling point of DMAc); the mixturewas heated under reflux for ca. 25 min. The reaction mixturecontaining the ZnS NC was then cooled to room temperature.Transparent clear solutions of ZnS NCs were obtained wheno-PDA and m-PDA were used as the capping ligands, but acolloidal solution ZnS NC was obtained when p-PDA was thecapping ligand. Each of the NC solutions was, however, pre-cipitated in ethanol and washed several times until colorlessethanol was obtained. The NC products were collected throughcareful decantation. A ZnS NC sample was also synthesized inthe absence of PDA, while maintaining all of the other parame-ters identical to those described above.
2.3. Characterization
The low- and wide-angle X-ray diffraction (XRD) data werecollected on a Rigaku Miniflex X-ray diffractometer, operatedat 40 kV and 30 mA, using CuKα (λ = 1.5401 Å) radiation.The NC aliquots were cast on a glass substrate and dried at50 ◦C for 12 h. Transmission electron microscopy (TEM) im-ages were obtained using a JEOL-JEM 2010 electron micro-scope operated at 200 kV. A drop of diluted suspension ofeach NC aliquot was placed on a copper TEM grid, coveredcompletely with carbon, and then the solvent was left to evapo-rate. The FTIR spectra were recorded at room temperature on aJASCO FTIR 460 Plus operated at a resolution 4 cm−1. Spec-imens for analysis were prepared as KBr pellets of the driedNCs (50 ◦C for 12 h). X-ray photoelectron spectroscopy (XPS)was performed using a VG-Scientific ESCA lab 250 spectrom-eter and AlKα radiation (1486.6 eV); the peak positions werereferenced internally to the C 1s peak at 284.6 eV. For XPS,samples were prepared in a manner similar to those for XRDanalysis, except that a silicon substrate was employed. Ther-mogravimetric analysis (TGA) data with their derivative signalswere recorded on a TGA Q50 in nitrogen atmosphere at a ramp10 ◦C min−1 from 40 to 750 ◦C. The samples for TGA measure-ments were prepared by vacuum drying at room temperature.UV–vis spectra were measured using a Hitachi U-2010 spec-trometer. Fluorescence emission and excitation spectra weremeasured using a Hitachi F-4500 spectrometer. Time correlatedsingle photon counting (TCSPC) technique was used for thetime-resolved fluorescence (TRF) measurements. The fluores-cence was dispersed by a monochromator and detected witha thermoelectrically cooled microchannel plate photomultipliertube (Hamamatsu R3809U-51). Outputs of the photomultipliertube (start pulse) and a fast photodiode (stop pulse) were ana-lyzed by a picosecond time analyzer (EG&G Ortec, 9308). Thewidth of the instrument response function was 40 ps to providebetter than 10 ps time resolution after deconvolution. The fem-tosecond light source was based on a home-built cavity-dumpedinfrared optical parametric oscillator which has been describedin detail elsewhere [11]. The cavity-dumped fundamental out-put at 1240 nm was frequency quadrupled by successive secondharmonic generations using a 3 mm LBO and 500 µm BBOcrystals to generate the pump pulse at 310 nm. For UV–visand FL spectroscopic measurements DMAc was used as sol-vent. For quantum yield measurements, samples as well as stan-dard, 2-(4-biphenylyl)-5-phenyl-1,3,4-oxadiazole (PBD), weredispersed in DMAc by sonication (5–10 min). PBD has anemission maximum at 380 nm, when excitation wavelength,315 nm, and quantum yield, 83% [12].
3. Results and discussion
Our synthetic approach was quite simple (Scheme 1). First,Zn2+ ions were adsorbed onto the amine of the PDAs. TheZn2+–PDA complex ions were reacted with the S2− ions (inDMAc) that arose from thermal decomposition of thioacet-amide. The reacting solutions were then heated under refluxto provide well-passivated, high-quality ZnS NCs. The role of

M.H. Ullah et al. / Journal of Colloid and Interface Science 316 (2007) 939–946 941
Scheme 1. Stepwise representation for the synthesis of ZnS NCs bound too-PDA, m-PDA, and p-PDA.
vinylideneamine (CH2CNH), a by-product of the thermal de-composition of thioacetamide, in this process is not presentedin Scheme 1 because of the negligible interactions of this aminewith the NC surface in the presence of the PDAs. The purified(washed) ZnS NCs that were passivated with PDA were readilysoluble in dimethylsulfoxide (DMSO) and DMAc. In contrast,the NC synthesized in the same manner, but in the absenceof the passivating PDA, was insoluble in DMAc, DMSO, andother common solvents. The views (a–c) in the image (Fig. 1)indicate that the NCs passivated with o-, m-, and p-PDA, re-spectively, were completely soluble in DMSO; view d (Fig. 1)provides an image of the NCs (that are not passivated with thePDA) in DMSO. The complete solubility of PDA encapsulatedNCs is the physical evidence that PDAs are strongly bondedto the core (ZnS). For convenience, however, we name the NC
Fig. 1. Views in the photographic image of the ZnS NCs in DMSO (the trans-parent solutions) obtained when (a) o-, (b) m-, and (c) p-PDA were bound tothe core NCs and (d) ZnS NCs in DMSO (opaque colloidal solution) obtainedin the absence of a PDA.
(a)
(b)
Fig. 2. (a) Low- and (b) wide-angle X-ray diffraction of PNC1, PNC2, PNC3,and BNC.
products passivated with o-, m-, and p-PDA as PNC1, PNC2,and PNC3, respectively, and the bare NC (passivated only withCH2CNH) as BNC.
To characterize the NCs morphologically, we studied theirlow- and wide-angle X-ray diffraction (XRD) patterns. Thelow-angle XRD peaks (Fig. 2a) of PNC1, PNC2, PNC3, andBNC occurred at 2θ values of 2.5◦, 2.1◦, 2.4◦, and 3.0◦, respec-tively. Such characteristic low-angle peaks have been reportedpreviously by Nanda et al. [9e] in the case of ZnS NCs and byMurray et al. [9g] in the case of CdS NCs. Using to the Bragg

942 M.H. Ullah et al. / Journal of Colloid and Interface Science 316 (2007) 939–946
equation (2d sin θ = λ) allows the correlation length d betweencrystallities to be obtained from these low-angle diffractionpeaks. Since each NC is separated from its nearest neighbors byan organic encapsulation layer, the average separation distancebetween the NCs is the mean particle size including the lig-and shell [9e,9g]. If the separation distances are highly regular,well-defined diffraction peaks should be observed. The aver-age NC sizes for PNC1, PNC2, PNC3, and BNC, which wedetermined from the diffraction peak data in the low-angle re-gion, are 3.5, 4.1, 3.6, and 2.8 nm, respectively. Although thediffraction peaks for the first three crystalline samples werewell defined, the latter one was broadened. The broad natureof the BNC peak suggests a lower degree of order in termsof the separation distance (i.e., a wide size distribution). Thismay be the cause of weak adsorption of CH2CNH onto the sur-faces of the NCs. In contrast, the well-defined peaks for PNC1,PNC2, and PNC3 indicate that their well-separated NCs werestrongly encapsulated with PDA molecules leading to their nar-row size distributions. The slightly larger, but better oriented,PNC1, PNC2, and PNC3 systems, relative to BNC, may havearisen as a result of molecular rearrangement of CH2CNH andPDA molecules under the synthesis conditions (i.e., under re-flux).
Fig. 2b presents the wide-angle (WA) diffraction patterns ofPNC1, PNC2, PNC3, and BNC. Although the diffraction peakswere broadened significantly because of their small crystallitesizes, the peak positions at 28.6◦, 47.7◦, and 56.7◦ correspondto the (111), (220), and (311) planes of cubic sphalerite ZnS. Toobtain further information from the WAXRD data of the crystal-lites, we applied the Debye–Scherrer formula [9e,13] expressedas L = 0.9λ/B cos θ , where L is the coherence length, B is thefull width at half maximum of the peak, λ is the wavelength ofthe X-ray radiation, and θ is the diffraction angle. If the NCsare considered to have spherical morphologies, where D is thediameter of the NC, the relation between L and D is expressedas D = 4/3L [9e]. To determine the values of L with minimumerror, we used the (111) peak along with a solid fitted line. Thevalues of L that we obtained for PNC1, PNC2, PNC3, and BNCwere 2.4, 2.9, 2.5, and 2.3 nm, respectively, giving values ofD of 3.2, 3.9, 3.3, and 3.0 nm, respectively. The values of D
for PNC1, PNC2, and PNC3 are lower than the correspondingparticle sizes determined from the low-angle diffraction peaks,presumably because wide-angle diffraction is dominated by thehigher electron density of the core crystals, i.e., it disregardsthe lower-electron-density organic shell. The wide-angle crys-tallite size (D) for BNC was a little larger, however, than thesize measured from the low-angle peak. This small size dif-ference (0.2 nm) in between the systems is expected becausethe low-angle diffraction peak for BNC was wider enough toclearly mark the corresponding 2θ value.
To verify the morphologies suggested by the low- and wide-angle XRD patterns, we obtained transmission electron mi-croscopy (TEM) images (Fig. 3) of PNC1, PNC2, PNC3, andBNC. We used Gatan software to draw the size-histogram fromthe images of the samples. The average sizes for PNC1, PNC2,and PNC3, which we estimated from the size-histograms, were3.0 ± 0.3, 3.7 ± 0.30, and 3.0 ± 0.5 nm, respectively. Thus, the
Fig. 3. TEM images of (a) PNC1, (b) PNC2, (c) PNC3, and (d) BNC.
NC sizes measured by TEM are consistent with the sizes ob-tained by XRD. The size histogram for BNC was too broad, andthus its standard deviation was large. The average size-range,however, we estimated to be 2.0–3.5 nm. This broad size distri-bution reveals that the NCs are unstable in the absence of PDAmolecules.
The Fourier transform infrared (FTIR) absorption spectro-scopic data of PNC1, PNC2, and PNC3 confirmed that theirshell structures consisted dominantly of o-, m-, and p-PDAmolecules, respectively, while that of BNC indicated that itsNCs contained CH2CNH molecules (Fig. 4). Although thePDA-passivated NCs (PNC1, PNC2, and PNC3) may have pos-sibility to adsorb a little amount of CH2CNH moieties, how-ever, it is difficult to resolute them from PDA in the FTIRspectra of NCs that are dominantly passivated by PDAs.
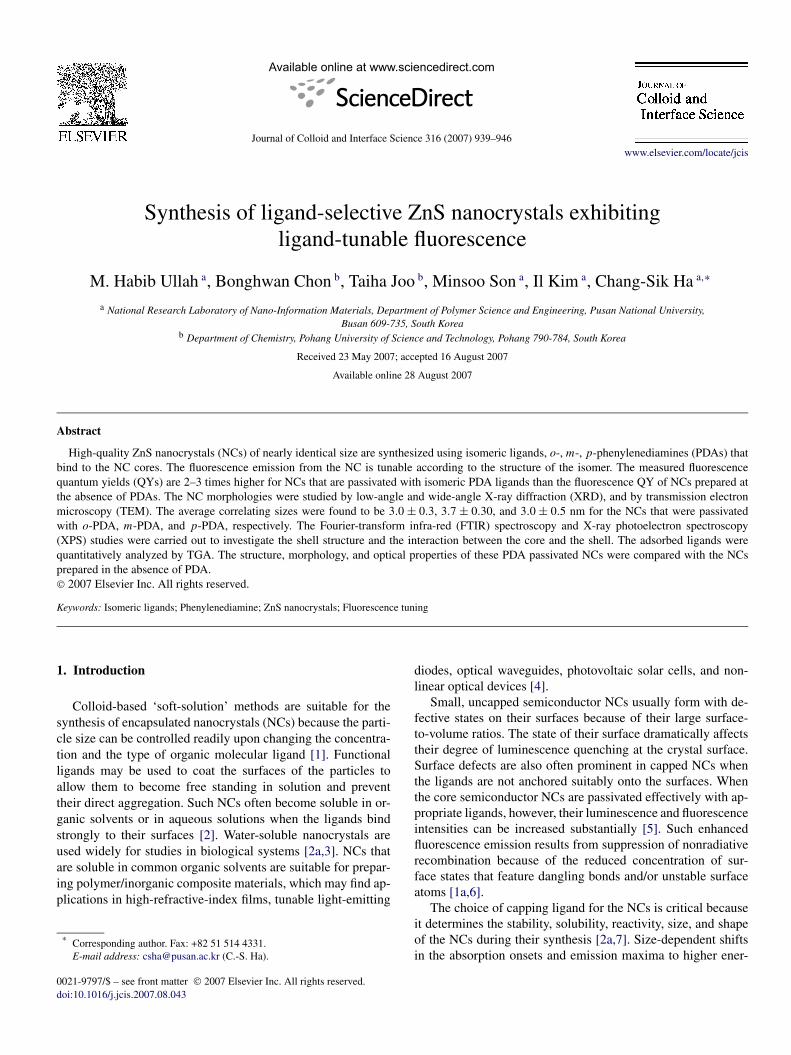
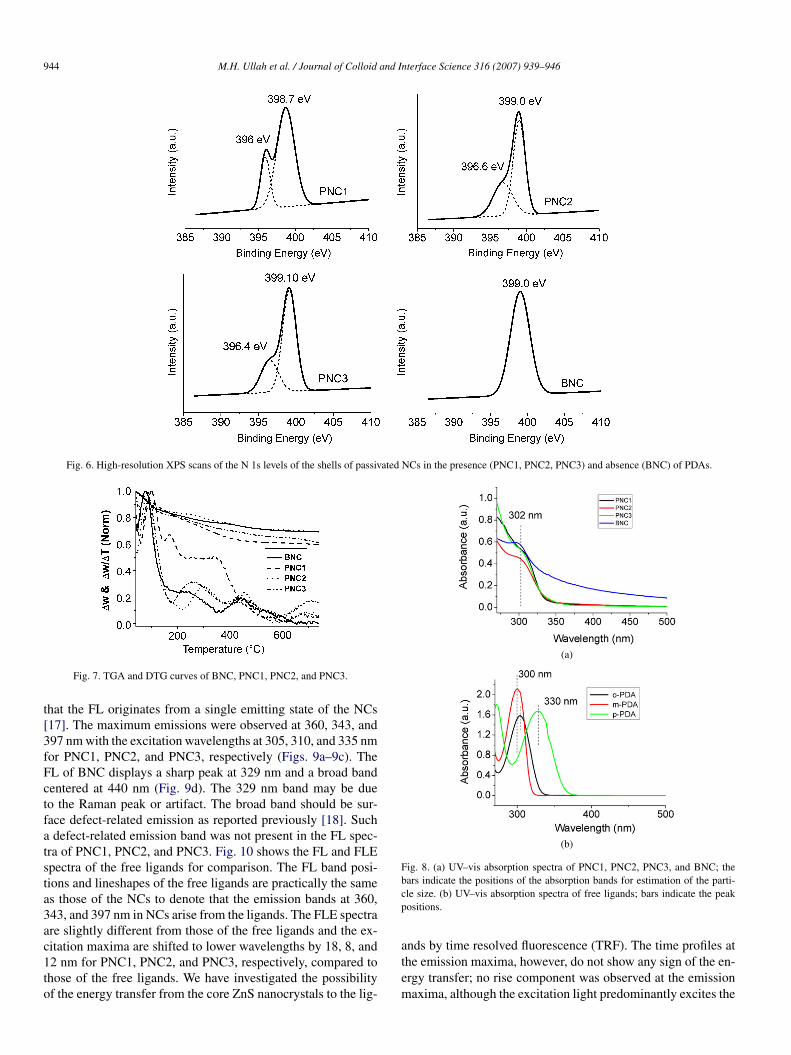
We used X-ray photoelectron spectroscopy (XPS) to revealthe nature of the interfaces between the cores and ligands. Be-cause the amino functional groups coordinated to the surface Znatoms of the NCs, the N 1s and Zn 2p states provided impor-tant information regarding the ligand-to-core interaction. Thehigh-resolution XPS data (Fig. 5, top) for the Zn 2p states in-dicated binding energy shifts of ca. 2 eV to lower energy foreach of PNC1, PNC2, and PNC3, relative to that of BNC, in-dicating that the PDA amino groups were attached strongly toZn atoms compared to the amino group of CH2CNH. The N 1sdata corroborated this finding. The high-resolution N 1s spectra(Fig. 6) for PNC1, PNC2, and PNC3 each display two bands (atca. 396 and 399 eV), whereas that for BNC presents only one(at 399 eV). The bands at ca. 399 eV represent nitrogen atoms inamino environments [10,14]. The lower-energy band probablyarose from charge transfer from the core to the ligand. Simi-lar charge interaction band was previously observed for N 1s inthe case of phenylenediamine encapsulated Ag [10b]. The cen-ter band positions for the S 2p levels were almost the same foreach NC (Fig. 5, bottom), because the S atoms did not have in-teraction directly with the nitrogen atoms of any of the aminogroups.
M.H. Ullah et al. / Journal of Colloid and Interface Science 316 (2007) 939–946 943
Fig. 4. FTIR spectra displaying the (top) lower and (bottom) higher frequencyranges of the vibrations of PNC1, PNC2, PNC3, and BNC (represented as a, b,c, and d, respectively).
Fig. 5. High-resolution XPS scans of the (top) Zn 2p and (bottom) S 2p levelsof the cores of (a) PNC1, (b) PNC2, (c) PNC3, and (d) BNC.
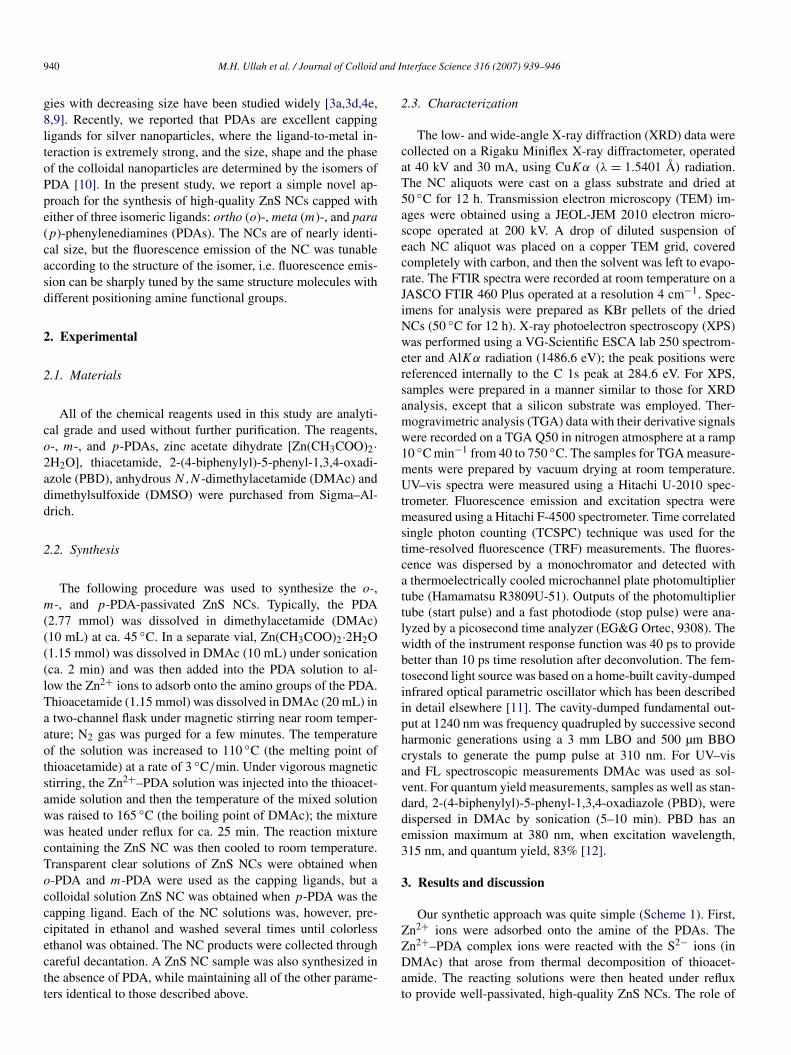
To quantify the amounts of the adsorbed ligands on the NCsurfaces, we also performed thermogravimetric analysis (TGA)with their derivative thermogravimetric (DTG) analysis data of
PNC1, PNC2, PNC3, and BNC (Fig. 7). The weight loss upto 180 ◦C is due to the removal of the adsorbed DMAc andethanol/moisture on the NC surfaces as suggested by the DTGcurves. After removing DMAc from the NC surfaces, weightloss takes place via following steps: organic ligands are des-orbed from the core NCs, followed by the decomposition of theorganic ligands (both PDA and aliphatic vinylideneamine) andthen the recrystallization of the core NCs. In particular, a DTGpeak centered at 175 ◦C obtained for PNC1 is not observed forPNC2, PNC3, and BNC. This may indicate that DMAc makesweak complexation with the NC surfaces and the solvent is notcompletely removed until 220 ◦C. The shoulder-like broad peakfrom 220 to 600 ◦C for the PNC1 is due to the weight losscaused by the decomposition of ligands, where the amountsof adsorbed ligands are estimated as 18% of total weight ofNCs. The DTG peak around 680 ◦C for the PNC1 is due to therecrystallization of the NCs (by subsequent aggregation afterdecomposition of ligands). The loss of weight due to the re-crystallization is 0.9%. In this way, the amounts of adsorbed lig-ands are estimated as 12.3% and 16.4%, respectively, for PNC2and PNC3. For BNC, however, the recrystallization peak wasnot observed around 680 ◦C, since the recrystallization peakmay be overlapped with the decomposition of aliphatic vinyli-deneamine at lower temperature. The weight loss due to thecombined decomposition and recrystallization was estimated asaround 11.6%.
Fig. 8a presents the UV–vis absorption spectra of the NCs.The spectra compares the absorption of PDA functionalizedNCs and bare NCs. Each NC displays an absorption band at302 ± 3 nm, which is a finding consistent with the results re-ported by Yanagida et al. [15a] and Inoue et al. [15b]; such awavelength fits the curve (absorbance vs diameter) simulatedby Nakaoka and Nosaka [15c] for ZnS particles of diameter 2–5 nm. Whereas the absorbances of PNC1, PNC2, and PNC3 inthe visible region were near to zero and remained parallel to thebaseline, for BNC we observed a monotonic absorbance curvefrom the visible to the UV region. This finding indicates thatthe absorbance of BNC in the visible region was due to scatter-ing [16a], possibly because of the agglomerated particles thatwere improperly dispersed in the solvent. The absorption bandsat 302 ± 3 nm, which are blue-shifted from the bulk band-gapwavelength of ca. 340 nm, are due to quantum confinement ef-fects in the ZnS nanoparticles [16]. The negligible differences(maximum ∼6 nm) between the positions of the absorptionbands in the spectra of PNC1, PNC2, and PNC3 suggest thattheir particle size distributions were nearly similar (maximumdeviation 0.7 nm from PNC1 and PNC3 to PNC2, as observedby TEM and XRD). Fig. 8b shows the absorbance nature ofthe free ligands (o-PDA, m-PDA, and p-PDA) in the same sol-vent into which the absorbance of NCs were measured. Uponcomparison of absorbance spectral profiles of free ligands andNCs functionalized with the corresponding ligands, one can seethat unreacted free ligands were completely removed from thenanocrystallite samples.
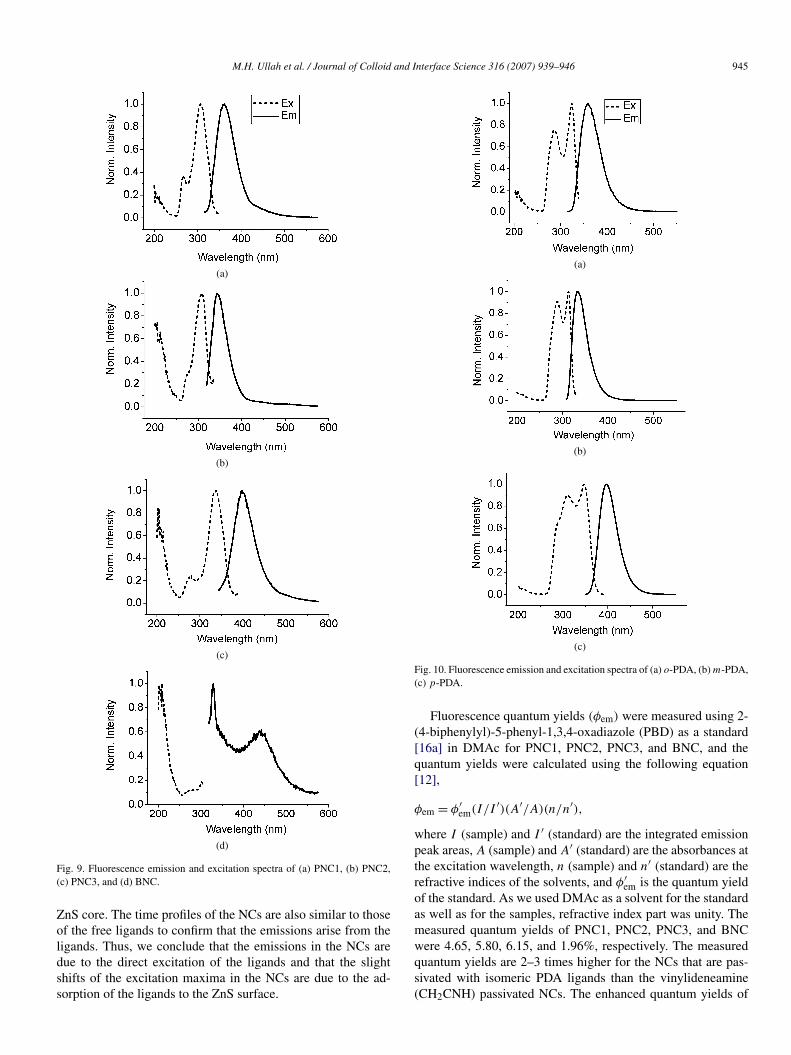
Fig. 9 displays the fluorescence emission (FL) and fluores-cence excitation (FLE) spectra of the NCs. The FL band posi-tions did not shift at different excitation wavelengths indicating
944 M.H. Ullah et al. / Journal of Colloid and Interface Science 316 (2007) 939–946
Fig. 6. High-resolution XPS scans of the N 1s levels of the shells of passivated NCs in the presence (PNC1, PNC2, PNC3) and absence (BNC) of PDAs.
Fig. 7. TGA and DTG curves of BNC, PNC1, PNC2, and PNC3.
that the FL originates from a single emitting state of the NCs[17]. The maximum emissions were observed at 360, 343, and397 nm with the excitation wavelengths at 305, 310, and 335 nmfor PNC1, PNC2, and PNC3, respectively (Figs. 9a–9c). TheFL of BNC displays a sharp peak at 329 nm and a broad bandcentered at 440 nm (Fig. 9d). The 329 nm band may be dueto the Raman peak or artifact. The broad band should be sur-face defect-related emission as reported previously [18]. Sucha defect-related emission band was not present in the FL spec-tra of PNC1, PNC2, and PNC3. Fig. 10 shows the FL and FLEspectra of the free ligands for comparison. The FL band posi-tions and lineshapes of the free ligands are practically the sameas those of the NCs to denote that the emission bands at 360,343, and 397 nm in NCs arise from the ligands. The FLE spectraare slightly different from those of the free ligands and the ex-citation maxima are shifted to lower wavelengths by 18, 8, and12 nm for PNC1, PNC2, and PNC3, respectively, compared tothose of the free ligands. We have investigated the possibilityof the energy transfer from the core ZnS nanocrystals to the lig-
(a)
(b)
Fig. 8. (a) UV–vis absorption spectra of PNC1, PNC2, PNC3, and BNC; thebars indicate the positions of the absorption bands for estimation of the parti-cle size. (b) UV–vis absorption spectra of free ligands; bars indicate the peakpositions.
ands by time resolved fluorescence (TRF). The time profiles atthe emission maxima, however, do not show any sign of the en-ergy transfer; no rise component was observed at the emissionmaxima, although the excitation light predominantly excites the
M.H. Ullah et al. / Journal of Colloid and Interface Science 316 (2007) 939–946 945
(a)
(b)
(c)
(d)
Fig. 9. Fluorescence emission and excitation spectra of (a) PNC1, (b) PNC2,(c) PNC3, and (d) BNC.
ZnS core. The time profiles of the NCs are also similar to thoseof the free ligands to confirm that the emissions arise from theligands. Thus, we conclude that the emissions in the NCs aredue to the direct excitation of the ligands and that the slightshifts of the excitation maxima in the NCs are due to the ad-sorption of the ligands to the ZnS surface.
(a)
(b)
(c)
Fig. 10. Fluorescence emission and excitation spectra of (a) o-PDA, (b) m-PDA,(c) p-PDA.
Fluorescence quantum yields (φem) were measured using 2-(4-biphenylyl)-5-phenyl-1,3,4-oxadiazole (PBD) as a standard[16a] in DMAc for PNC1, PNC2, PNC3, and BNC, and thequantum yields were calculated using the following equation[12],
φem = φ′em(I/I ′)(A′/A)(n/n′),
where I (sample) and I ′ (standard) are the integrated emissionpeak areas, A (sample) and A′ (standard) are the absorbances atthe excitation wavelength, n (sample) and n′ (standard) are therefractive indices of the solvents, and φ′
em is the quantum yieldof the standard. As we used DMAc as a solvent for the standardas well as for the samples, refractive index part was unity. Themeasured quantum yields of PNC1, PNC2, PNC3, and BNCwere 4.65, 5.80, 6.15, and 1.96%, respectively. The measuredquantum yields are 2–3 times higher for the NCs that are pas-sivated with isomeric PDA ligands than the vinylideneamine(CH2CNH) passivated NCs. The enhanced quantum yields of
946 M.H. Ullah et al. / Journal of Colloid and Interface Science 316 (2007) 939–946
PDA-capped ZnS NCs are the direct results of more effectivesurface passivation, by which nonradiative recombination pathsare reduced significantly.
4. Conclusions
In summary, we have demonstrated a simple approach tosynthesize high-quality ZnS NCs of nearly identical size usingisomers of PDAs that bind strongly to the core surface. The NCsare characterized microscopically and spectroscopically to re-veal the roles of isomeric ligands of PDAs to core crystals. Theligands, PDAs, perform three roles: (1) due to the strong inter-actions between the PDAs and the NC cores the agglomerationis avoided and the NCs are obtained in narrow size distribu-tions; (2) PDAs effectively suppress the formation of surfacedefects and prohibit fluorescence quenching and defect-relatedemissions; (3) finally, PDAs tune the FL because emissions inthe NCs are due to the direct excitation of the ligands.
Acknowledgments
This study was financially supported by the Korea Sci-ence and Engineering Foundation (KOSEF) through the Na-tional Research Laboratory Program funded by the Ministryof Science and Technology (MOST; M10300000369-06J0000-36910), the SRC/ERC program of MOST/KOSEF (Grant #R11-2000-070-080020) and the Brain Korea 21 project.
References
[1] (a) M.H. Ullah, C.-S. Ha, J. Nanosci. Nanotechnol. 5 (2005) 1376;(b) E.C. Scher, L. Manna, A.P. Alivisatos, Philos. Trans. A 361 (2003)241;(c) J. Joo, H.B. Na, T. Yu, J.H. Yu, Y.W. Kim, F. Wu, J.Z. Zhang, T. Hyeon,J. Am. Chem. Soc. 125 (2003) 11100.
[2] (a) W.C. Chan, S. Nie, Science 281 (1998) 2016;(b) I. Potapova, R. Mruk, C. Hübner, R. Zentel, T. Basché, A. Mews,Angew. Chem. Int. Ed. 44 (2005) 2437.
[3] (a) M. Bruchez Jr., M. Maronne, P. Gin, S. Weiss, A.P. Alivisatos, Sci-ence 281 (1998) 2013;(b) S.F. Wuister, C.D.M. Donegá, A. Meijerink, J. Am. Chem. Soc. 126(2004) 10397;(c) H. Fan, E.W. Leve, C. Scullin, J. Gabaldon, D. Tallant, S. Bunge, T.Boyle, M.C. Wilson, C.J. Brinker, Nano Lett. 5 (2005) 645;(d) W.C.W. Chan, D.J. Maxwell, X. Gao, R.E. Bailey, M. Han, S. Nie,Curr. Opin. Biotechnol. 13 (2002) 40;(e) M. Xie, H.-H. Liu, P. Chen, Z.-X. Xie, Y.-M. Du, B.-Q. Pan, D.-W.Pang, Chem. Commun. (2005) 5518;(f) T. Pellegrino, S. Kudera, T. Liedl, A.M. Javier, L. Manna, W.J. Parak,Small 1 (2005) 43;(g) H. Qian, C. Dong, J. Weng, J. Ren, Small 2 (2006) 747.
[4] (a) L.L. Beecroft, C.K. Ober, Chem. Mater. 9 (1997) 1302;(b) A. Haryona, W.H. Binder, Small 2 (2006) 600;(c) H. Liu, J.B. Edel, L.M. Bellan, H.G. Graighead, Small 2 (2006) 495;(d) K.R. Choudhury, Y. Sahoo, T.Y. Ohulchanskyy, P.N. Prasad, Appl.Phys. Lett. 87 (2005) 073110-1;(e) J. Lee, V.C. Sundar, J.R. Heine, M.G. Bawendi, K.F. Jensen, Adv.Mater. 12 (2000) 1102;(f) K.R. Choudhury, Y. Sahoo, P.N. Prasad, Adv. Mater. 17 (2005) 2877;(g) Y.K. Olsson, G. Chen, R. Rapaport, D.T. Fuchs, V.C. Sundar, J.S.Steckel, M.G. Bawendi, A. Aharoni, U. Banin, Appl. Phys. Lett. 85 (2004)4469;
(h) C. Lü, Y. Cheng, Y. Liu, F. Liu, B. Yang, Adv. Mater. 18 (2006) 1188;(i) W. Caseri, Macromol. Rapid Commun. 21 (2000) 705;(j) A. Pan, D. Liu, R. Liu, F. Wang, X. Zhu, B. Zou, Small 1 (2005)980;(k) S. Chaudhury, M. Ozkan, Appl. Phys. Lett. 84 (2004) 2925;(l) C. Lü, Z. Cui, Y. Wang, Z. Li, C. Guan, B. Yang, J. Shen, J. Mater.Chem. 13 (2003) 2189.
[5] (a) M. Konishi, T. Isobe, M. Senna, J. Lumin. 93 (2001) 1;(b) A.B. Bourlinos, A. Stassinopoulos, D. Anglos, R. Herrera, S.H. Anas-tasiadis, D. Petridis, E.P. Giannolis, Small 2 (2006) 513;(c) T. Dannhauser, M. O’Neil, K. Johansson, D. Whitten, G. McLendon,J. Phys. Chem. 90 (1986) 6074.
[6] H. Yang, P.H. Holloway, Appl. Phys. Lett. 82 (2003) 1965.[7] (a) M.H. Ullah, W.-S. Chung, I. Kim, C.-S. Ha, Small 2 (2006) 870;
(b) Y. Li, X. Li, C. Yang, Y. Li, J. Phys. Chem. B 108 (2004) 16002;(c) R. Kho, C.L. Torres-Martínez, R.K. Mehra, J. Colloid Interface Sci.227 (2000) 561;(d) J.M. Tsay, S. Doose, F. Pinaud, S. Weiss, J. Phys. Chem. B 109 (2005)1669.
[8] (a) B. Gilbert, F. Huang, H. Zhang, G.A. Waychunas, J.F. Banfield, Sci-ence 305 (2004) 651;(b) N. Herron, Y. Wang, H. Eckert, J. Am. Chem. Soc. 112 (1990) 1322;(c) T. Vossmeyer, L. Katsikas, M. Giersig, I.G. Popovic, K. Diesner,A. Chemseddine, A. Eychmüller, H. Weller, J. Phys. Chem. 98 (1994)7665;(d) V.N. Soloviev, A. Eichhöfer, D. Fenske, U. Banin, J. Am. Chem.Soc. 123 (2001) 2354.
[9] (a) B.O. Dabbousi, J. Rodriguez-Viejo, F.V. Mikulec, J.R. Heine, H. Mat-toussi, R. Ober, K.F. Jensen, M.G. Bawendi, J. Phys. Chem. B 101 (1997)9463;(b) W. Chen, J.-O. Malm, V. Zwiller, R. Wallenberg, J.-O. Bovin, J. Appl.Phys. 89 (2001) 2671;(c) A.P. Alivisatos, J. Phys. Chem. 100 (1996) 13226;(d) W. Chen, J.Z. Zhang, A.G. Joly, J. Nanosci. Nanotechnol. 4 (2004)919;(e) J. Nanda, S. Sapra, D.D. Sarma, N. Chandrasekharam, G. Hodes,Chem. Mater. 12 (2000) 1018;(f) H. Bao, E. Wang, S. Dong, Small 2 (2006) 476;(g) C.B. Murray, D.J. Norris, M.G. Bawendi, J. Am. Chem. Soc. 115(1993) 8706.
[10] (a) M.H. Ullah, I. Kim, C.-S. Ha, J. Nanosci. Nanotechnol. 6 (2006) 777;(b) M.H. Ullah, I. Kim, C.-S. Ha, Mater. Lett. 60 (2006) 1496.
[11] C.K. Min, T. Joo, Opt. Lett. 30 (2005) 1855.[12] (a) S.L. Cumberland, K.M. Hanif, A. Javier, G.A. Khitrov, G.F. Strouse,
S.M. Woessner, C.S. Yun, Chem. Mater. 14 (2002) 1576;(b) J.N. Demas, G.A. Crosby, J. Phys. Chem. 75 (1971) 991.
[13] A. Guinier, X-Ray Diffraction, Freeman, San Francisco, CA, USA, 1963.[14] Handbook of X-Ray Photoelectron Spectroscopy, Physical Electronics,
Eden Prairie, MN, 1995.[15] (a) S. Yanagida, M. Yoshiya, T. Shiragami, C. Pac, H. Mori, H. Fujita,
J. Phys. Chem. 94 (1990) 3104;(b) H. Inoue, N. Ichiroku, T. Torimoto, T. Sakata, H. Mori, H. Yoneyama,Langmuir 10 (1994) 4517;(c) Y. Nakaoka, Y. Nosaka, Langmuir 13 (1997) 708.
[16] (a) J.H. Yu, J. Joo, H.M. Park, S.-I. Baik, Y.W. Kim, S.C. Kim, T. Hyeon,J. Am. Chem. Soc. 127 (2005) 5662;(b) R. Rossetti, R. Hull, J.M. Gibson, L.E. Brus, J. Chem. Phys. 82 (1985)552;(c) H. Zhang, B. Gilbert, F. Huang, J.F. Banfield, Nature 424 (2003) 1025.
[17] W. Chen, J.-O. Malm, V. Zwiller, Y. Huang, S. Liu, R. Wallenberg, J.-O.Bovin, L. Samuelson, Phys. Rev. B 61 (2000) 11021.
[18] (a) W.-S. Chae, J.-H. Yoon, H. Yu, D.J. Jang, Y.-R. Kim, J. Phys. Chem.B 108 (2004) 11509;(b) W.-T. Yao, S.-H. Yu, L. Pass, J. Li, Q.-S. Wu, L. Zhang, J. Jiang,Small 1 (2005) 320;(c) Y. Zhang, Q. Peng, X. Wang, Y. Li, Chem. Lett. 33 (2004) 1320.