1992b Paleoenvironment and Late Prehistoric Sites in the Lopburi Region of Central Thailand
Upload
up-dilimanCategory
view
4download
0
lable at ScienceDirect
Quaternary International xxx (2014) 1e12
Contents lists avai
Quaternary International
journal homepage: www.elsevier .com/locate/quaint
Paleoenvironment changes in Juag Lagoon, Philippines based onsedimentology, bulk geochemistry and stable isotopes and theirimplication to nutrification
Joan Reotita a,b,*, Fernando Siringan a, Jing Zhang c, Rhodora Azanza a
a The Marine Science Institute, Velasquez St., University of the Philippines Diliman, Quezon City 1101, PhilippinesbNational Institute of Geological Sciences, Velasquez St., University of the Philippines Diliman, Quezon City 1101, Philippinesc State Key Laboratory of Estuarine and Coastal Research, East China Normal University, 3663 North Zhongshan Rd, Shanghai, China
a r t i c l e i n f o
Article history:Available online xxx
* Corresponding author. The Marine Science Institutthe Philippines Diliman, Quezon City 1101, Philippine
E-mail addresses: [email protected], zoantha
1040-6182/$ e see front matter � 2014 Elsevier Ltd ahttp://dx.doi.org/10.1016/j.quaint.2014.01.029
Please cite this article in press as: Reotita,geochemistry and stable isotopes and tj.quaint.2014.01.029
a b s t r a c t
In recent decades, eutrophication has been identified as a major problem in coastal and estuarinesystems. Eutrophication can be due to cultural activities but can also be due to natural factors. Thisstudy explores the possible role of geomorphic change in the eutrophication history of Juag Lagoon,which is one of the sites with harmful algal blooms in the Philippines. Surface and sediment cores wereacquired for this study to trace the paleoenvironmental changes that brought about the present daylagoon. Radiocarbon dates and 210Pb-based estimates of sedimentation rates provided age control.Sedimentological indicators and stable isotope signatures of organic matter were utilized to assesschanges in the source of organic matter deposited in the lagoon whereas XRF-derived bulk sedimentgeochemistry was used as proxy for sediment input. Three phases of geomorphic state were identifiedover the lagoon history. Prior to 700 A.D., bulk geochemistry and isotopic measurements indicate a pre-lagoon environment. Subsequent drop in sea level led to the development of the lagoon, which per-sisted until 1100 A.D. The lagoonal condition transitioned to increased marine influence towards 1200A.D., through several sandbar-breaching events that may have persisted in recent years. The presentday lagoon maintains a continuous water exchange through a small tidal channel. The closing of thelagoon and the limited flushing of lagoon waters could have led to the nutrification of the lagoon.Moreover, anthropogenic impact through forest denudation, mariculture and fertilizer use in theneighboring islands is reflected, which could have also affected the nutrification of the lagoon in thelast 100 years.
� 2014 Elsevier Ltd and INQUA. All rights reserved.
1. Introduction
The cumulative and synergistic effects of natural climate vari-ability and anthropogenic impact to global change are projected toincrease in the future (Seitzinger et al., 2002; Rabalais et al., 2007,2009). Predictions of nutrient loading is said to be at the highestproportion in southern and eastern Asia (Seitzinger et al., 2002).This globally increasing trend, related to population growth,industrialization and increase in fertilizer use, translates to theamplification of the negative effects of eutrophication. Thus,eutrophication poses a serious threat to long-term health, fishingindustry, local tourism as well as to other ecosystem services in
e, Velasquez St., University [email protected] (J. Reotita).
nd INQUA. All rights reserved.
J., et al., Paleoenvironmentheir implication to nutrific
coastal and shallow marine environments (Seitzinger et al., 2002;de Jonge et al., 2002).
However, these global changes occur in the Anthropocene.Baseline information on the onset of environmental change issparse. Records provided by the sediments contain informationthat may aid in elucidating the nutrification and eutrophicationhistory of an area through paleoenvironmental reconstructions(Cooper and Brush, 1993; Zimmerman and Canuel, 2000; Paerl,2006). This study combines sedimentological indicators, XRF-derived bulk geochemistry and isotope signatures of organic mat-ter in reconstructing the formation and evolution of Juag Lagoon,offshore Matnog, Sorsogon. Age controls on the phases of lagoonformation are provided by 210Pb and radiocarbon age dates. Thepossible impact of the narrow opening of the lagoon to nutrientconcentrations and ultimately to its eutrophication state isexplored.
changes in Juag Lagoon, Philippines based on sedimentology, bulkation, Quaternary International (2014), http://dx.doi.org/10.1016/

J. Reotita et al. / Quaternary International xxx (2014) 1e122
2. Study area
2.1. Study site and hydrodynamics
Juag Lagoon is located 6 km offshore of Matnog Port, which isthe southernmost point of Sorsogon Province of the Bicol Region(Fig. 1a and b). The lagoon is nestled in an island linked to SanBernardino Strait via a deep, narrow channel to its southwest(Fig. 1c). The San Bernardino Strait, found on the south of the island,serves as one of the links between the Philippine internal seas andthe Pacific (Han et al., 2009; Gordon et al., 2011; Jones et al., 2011).Surface water circulation patterns during the Northeast Monsoonshow that Pacific waters enter near the San Bernardino Strait andflow westward to Sibuyan via Tablas Strait. However, during sum-mer, tidal forcing reduces the mean westward flow and transportwithin the San Bernardino Strait (Han et al., 2009).
The general hydrodynamic setup within the San BernardinoStrait may influence the water exchange between the open oceanand that of Juag Lagoon. Specifically, the warm Pacific surface wa-ters enter the San Bernardino Strait (Gordon et al., 2011; Jones et al.,2011). In amore detailed study of tidal influences, Jones et al. (2011)discussed the dynamics within the strait, showing variations insalinity, temperature, dissolved oxygen and chlorophyll concen-trations during ebb and flood tides. Their work also showed thathigh flow velocities during ebb tides resulted to strong verticaltransport and mixing of deep water with the surface watersresulting in higher phytoplankton biomass in the interior of SanBernardino Strait (Jones et al., 2011).
Fig. 1. Maps showing the location of Juag Lagoon with respect to (a) Bicol Region, (b) SorsogLagoon is at 0.5 m contour interval based on the data set acquired for this study. Pink dots rein this figure legend, the reader is referred to the web version of this article.)
Please cite this article in press as: Reotita, J., et al., Paleoenvironmentgeochemistry and stable isotopes and their implication to nutrificj.quaint.2014.01.029
2.2. Regional geology and geomorphology
Sorsogon is part of the Bicol Volcanic Arc Complex, which iscomposed of several active and inactive volcanoes and volcaniccenters. Mount Bulusan, which is the most proximate to JuagLagoon, is considered active (Fig. 1b; Aurelio and Pena, 2004). Assuch, the majority of Sorsogon province is underlain predominantlyby Pliocene to Quaternary Volcanics (Bulusan Volcanic Complex),whereas a few low-lying areas, coastal zones and the small-islandsystems including Juag Lagoon are underlain by Quaternary allu-vium (BED,1985; Aurelio and Pena, 2004). The Quaternary alluviumas described by Aurelio and Pena (2004) includes beach and riverdeposits. This is indicated by sedimentary deposits found on out-crops in Juag Lagoon showing planar cross-bedded coarse- tomedium-grained sandstones that are mostly volcanic in origin.These outcrops served as anchor for the development of sand andgravel bars on the reef flat, which bounded the lagoon on itssouthwest to northwest side. Beach profiles, BP1eBP5, show thatthis segment is 10e20mwidewith elevations ranging from0.8m to1.6 m (Fig. 2). The narrow beach width and low elevation makes thewestern side of the lagoon susceptible to breachingduring typhoonsor storm surges. Accretion of a barrier bar to the east formed a>150m-wide and2e3mhigh coastal plain (BP6eBP10) that boundsthe lagoon on its northeast to southeast side. This segment of theisland is lined with coral rubble and beach sand comprised of for-aminifers, coral fragments and other calcareous materials.
The lagoon is roughly 1000 m along its long axis and 600 mwide. The lagoon entrance on the southwest, bounded by a
on Province and (c) Matnog and San Bernardino Strait. The bathymetry contours of Juagpresent the shoreline trace of the island. (For interpretation of the references to colour
changes in Juag Lagoon, Philippines based on sedimentology, bulkation, Quaternary International (2014), http://dx.doi.org/10.1016/

Fig. 2. Beach profile transects around the island showing variation in shore heights and widths. Pink dots represent the transect location with corresponding profile adjacent to it.(For interpretation of the references to colour in this figure legend, the reader is referred to the web version of this article.)
J. Reotita et al. / Quaternary International xxx (2014) 1e12 3
westward accreting spit, has a relatively deep channel (1e2 m) thatserves as main passage that facilitates flushing of lagoon waters. Inrecent years, locals widened the lagoon entrance to allow entry oflarger outrigger boats (Fig. 2). The narrow channel, composed ofsandy substrate and lined by living corals, leads to two relativelyshallow basins. These two basins, with maximum depths rangingfrom 4 to 5 m, are separated by a shallow platform with two islets(Figs. 1 and 2). The deep parts (w5 m) are dominated by siltysubstrate whereas the shallower parts are made up of sandy sedi-ments with Halimeda flakes, mollusc fragments and other calcar-eous grains comprising the sand fraction. Sea grasses fringe theshallower zones near the eastern bank, and mangroves line thelagoon shore of the wide plain.
3. Methodology
3.1. Field methods and database
Shoreline tracing and beach profiling were conducted in 2010 tosupplement the datasets for Juag Lagoon. The shoreline positionwas established by taking Global Positioning System (GPS) readingswhile walking the coast and taking note of composition of thebeach sediments (Fig. 2). Beach profiles were setup at 90� to theshore following the beach profiling method by Emery (1961).Elevation readings were referenced to the mean sea level datum ofMatnog, Sorsogon (NAMRIA, 2010). Beach profiling was done toestablish beach height and width variation across the island.Bathymetric survey was conducted using an integrated GlobalPositioning System (GPS) and echo sounder with resolution of 7e10 m and 10 cm respectively. The tideecorrected bathymetric datawas processed using the Kriging method.
Please cite this article in press as: Reotita, J., et al., Paleoenvironmentgeochemistry and stable isotopes and their implication to nutrificj.quaint.2014.01.029
Twenty-one surface sediment samples were acquired across thelagoon using anEkman-type grab sampler. Four core sedimentswereacquired either through gravity coring or manual push-coring forlonger cores. Juag 4-1, a 50 cm gravity core, was acquired in 2007while the restwere acquired in 2010 (Fig. 3). Push cores JL4, JL6 and JL11 have corresponding gravity cores. Core JL4, 68 cm in length, wasacquired at depths of 3e4 m on the western side of the lagoon. JL11,which is 98 cm in length, was acquired at 5 m depth, near the innerbank on the eastern side. Cores JL4 and JL11 were analyzed for bulksediment properties, elemental concentrations and ratios based onXRF analysis and carbon (C) and nitrogen (N) isotope analysis. Sam-ples submitted for radiocarbon age-dating (14C) analysis were sub-sampled from JL6 fromwhich dateable materials were identified.
3.2. Laboratory methods
3.2.1. Bulk sediment propertiesThe surface sediment and core samples were analyzed for bulk
sediment properties including bulk density, grain size and sedi-ment composition. The bulk density and moisture content of coresamples were measured from homogenized 5 ml subsamples takenat 1 cm interval. The samples were oven-dried at 60 �C untilreaching constant weight. The same method was used for sedi-mentological analysis of surface sediment samples. Sedimentcomposition was determined through loss on ignition (LOI) anal-ysis, a measurement of sediment weight loss through sequentialheating. This method was adapted from Heiri et al. (2001), yieldingestimates of lithics, organic matter (OM), and carbonate content ofthe sediments.
Grain size analysis was performed using a laser particle sizeanalyzer (LPSA). Prior to grain size analysis, carbonate materials
changes in Juag Lagoon, Philippines based on sedimentology, bulkation, Quaternary International (2014), http://dx.doi.org/10.1016/

Fig. 3. Map showing the location and depth (m) at which the sediment cores (orange triangle) and surface sediments (blue dots) were acquired. (For interpretation of the referencesto colour in this figure legend, the reader is referred to the web version of this article.)
Fig. 4. 210Pb activity (Bq/kg) versus sediment depth (cm) for Juag Lagoon Core 4-1. Thesedimentation rate is determined from the slope of the least squares fit for 210Pb excessvalues plotted versus depth (Data courtesy of PNRI).
J. Reotita et al. / Quaternary International xxx (2014) 1e124
were picked and separated from the bulk sediments whereas theorganic content of the sediments were removed through chemicaldigestion. Sediments were treated to subsequent addition of 10%hydrogen peroxide (H2O2) until no visible reaction was observed.The sediments were washed with distilled water, allowed to settlebefore decanting, and the process repeated until the supernatantbecame clear before proceeding with grain size analysis. Theremoval of organic matter was done in sediments with elevatedorganic content to prevent biases in grain size distribution and tocompletely disperse clay fractions (Poppe et al., 2000; Vaasma,2008). H2O2 pre-treatment minimizes the underestimation of clayfraction (Di Stefano et al., 2010). Three replicates were prepared persubsample and were run through the LPSA six times. The averagedvalues from these 6 runs were used and are reported as percentagevolume.
3.2.2. GeochronologyThe age model of the sediment core Juag 4-1 was generated
from 210Pb measurements using alpha spectrometry performed atPhilippine Nuclear Research Institute (PNRI; Fig. 4). For longer-termreconstruction, sediment samples with dateable materials from thelongest core (JL6) were submitted for C-14 analysis to RafterRadiocarbon Laboratory, GNS Science in New Zealand. Radiocarbonage dates of Halimeda and mollusc fragments were corrected forreservoir effect by applying the average DR value measured frommodern corals that were also submitted to GNS Science. The DRvalue was applied on the calibration curve and then converted tocalendar years (A.D.) using the Calib6.11 software (Stuiver andReimer, 1993).
3.2.3. Bulk geochemistryRelative elemental concentrations were directly measured on
the split cores using an X-ray Fluorescence (XRF) core scanner. TheXRF scanner measures, non-destructively, the chemical composi-tion of the sediment as element intensities in total counts (cnts) orcounts per second (cps), which are proportional to the chemicalconcentrations (Tjallingii et al., 2007). Three cores, JL4, JL6 and JL11,were scanned at 1 cm interval, sampling every 30 s, with generator
Please cite this article in press as: Reotita, J., et al., Paleoenvironmentgeochemistry and stable isotopes and their implication to nutrificj.quaint.2014.01.029
settings of 10, 30 and 50 kv to be able to obtain intensities for thesuite of elements. The upper 10 cm of the core was not scanned dueto high moisture content which could result in strongly reducedelement intensities of the lighter elements Al and Si (Tjallingii et al.,2007). Results are reported as counts per second, fromwhich ratioswere calculated. The XRF-derived measurements were normalizedto Ti to take out the effect of source rock. Titaniumwas used since itis a conservative lithogenic element that participates in very fewbiogeochemical processes (Koinig et al., 2003; Kylander et al., 2011).As such, it is the best proxy for terrigenous component in marinesediments (Wei et al., 2003). Among the elements determinedthrough XRF-scanning, Ti, Al, and Si were used for interpretationsince they have similar high-frequency patterns. Elemental ratios
changes in Juag Lagoon, Philippines based on sedimentology, bulkation, Quaternary International (2014), http://dx.doi.org/10.1016/

Table 1Summary of 14C age dates and their corresponding calendar years.
Sampleid
Rafter id Samplingdepth(cm)
Datedmaterial
14Cage (B.P.)
Cal year1s (A.D.)
Cal year2s (A.D.)
JL 650-51
32693/14a
50e51 Pelecypod 607 � 20 1655e1689 1598e1606/1616e1713
JL 650-51
32693/14a
50e51 Halimedasp.
610 � 15 1656e1685 1631e1703
JL661-62
32693/15
61e62 Peatysediment
823 � 15 1213e1252 1185e1261
JL693-94
32693/16 93e94 Peatysediment
1224 � 20 725e738 709e747
J. Reotita et al. / Quaternary International xxx (2014) 1e12 5
used as proxy for sediment input include Al/Ti, Si/Ti, Ca/Ti. Al and Tiwere used to show changes in terrigenous provenance of sediments(Kryc et al., 2003; Wei et al., 2003) and physical weathering(Kylander et al., 2011). Ratios of Ca/Ti and Sr/Ti reflect the carbonatecomponent contributed to the sediments (Diekmann et al., 2008;Kylander et al., 2011) whereas the Si/Ti reflects productivity(Kylander et al., 2011). Elemental ratios such as Ba/Ti and Br/Ti wereused as proxies for primary productivity (Tribovillard et al., 2006;Calvert and Pedersen, 2007), whereas Mn/Ti, and Cr/Ti were usedas paleoredox indicators (Tribovillard et al., 2006; Chun et al.,2010).
3.2.4. Isotope analysisIsotopes of C and N were measured from bulk sediment samples
to establish organic matter sources that may further support thepaleoenvironment reconstruction. Only Cores JL4 and JL11 wereanalyzed due to limited laboratory time. Samples were preparedand analyzed at the State Key Laboratory for Estuarine CoastalResearch (SKLEC) laboratory in East China Normal University(ECNU) following the method of Wu et al. (2003). Sediment sub-samples were first dried at 50 �C for at least 24 h. Afterwards, thesediments were grinded and homogenized. For the carbon isotopeanalysis, samples were treated with 1 M HCl and dried overnight.Both nitrogen isotope composition (d15N) and organic carbonisotope (d13C) composition were measured using a Finnigan DeltaPlus XP isotope ratio mass spectrometer after high temperaturecombustion in a Flash 1112 EA elemental analyzer at 1020 �C. Re-sults are expressed in parts per mil (&) as:
dð&Þ ¼ Rsample � RreferenceRreference
� 1000;
where d (&) denote d13C (&) or d15N (&) and Rsample and Rreferenceare the isotopic ratios of sample and reference respectively. Refer-ence for Carbon is Vienna Peedee belemnite (PDB) whereas fornitrogen isotope ratios, it is atmospheric nitrogen. Average re-producibilities of about 0.1 were based on replicate measurementsfor d13C and d15N.
3.2.5. Nutrient analysisNutrient analysis was done only on Core Juag 4-1. Sediment
samples were sieved through a 63 mm mesh and oven-dried at30 �C. Available phosphorus (P) and total nitrogen (TN) weremeasured using the standard Kjeldahl method at the Bureau ofSoils and Water Management (BSWM), Department of Agriculture.The BSWM method follows a three-step process of digestion,distillation and titration in determining nitrogen concentration,whereas TN values for Cores JL4 and JL11 were measured throughsediment combustion in a Flash elemental analyser.
4. Results
4.1. Surface sediment composition
LOI data indicate that Juag Lagoon sediments are predominatelylithics (60e70%) and almost equal proportions of carbonate (15e35%) and organic matter (10e30%). The surface sediments aredominated by sand and silt fractions with very minimal clay. Sand-sized particles are concentrated along the shallower zones on theeastern and western banks of the lagoon and towards the lagoonmouth to the south, where carbonate materials are also concen-trated. Relatively large proportions of silt-sized particles are foundin the deeper portions of Juag Lagoon, at 3 me5 m depth, near thebasin center. These silty to muddy sediments are composed oforganic rich materials and calcareous materials. The bulk
Please cite this article in press as: Reotita, J., et al., Paleoenvironmentgeochemistry and stable isotopes and their implication to nutrificj.quaint.2014.01.029
components of the shallow sandy substrates are carbonate mate-rials such as Halimeda flakes and mollusc fragments and very fewsiliciclastic materials. The Halimeda fragments are the remains ofthe calcareous algae Halimeda spp., abundant in the shallow partsof the lagoon.
4.2. Lithologies, correlation and age model
Cores JL4, JL6 and JL11 were logged, noting variations in color,sedimentary structures, and presence or absence of biological re-mains. Initial visual estimate of grain size was done and was latervalidated by the measured grain size using LPSA. This refined thedistinguished lithologic boundaries. Three distinct sections wereidentified based on the sedimentological characteristics, whichwere cross-referenced with XRF-derived geochemical profiles suchas Ti, Al, Si, Ca and Ba. Detailed core logs showing the identifiedsections with sample silica profile are shown in Fig. 5. Section 3 isdistinguished from other segments based on distinct color change,very fine grain size, and the absence of Halimeda flakes. DispersedHalimeda flakes in silty sediments characterize Section 2, whereasin Section 1, there is an increase in Halimeda flakes. These Halimedaflakes together with other carbonate grains appear as distinctlayers.
The age model for Core Juag 4-1 was derived from the 210Pbsedimentation rates from PNRI (Fig. 4). The sedimentation rate forthe upper 10 cm segment is 0.59 cm/y, whereas the 10e50 cmsegment yielded a 0.25 cm/y sedimentation rate. The 14C-derivedage dates from bivalves,Halimeda and peaty sediments subsampledfrom Core JL6 cover from the late 15th century A.D. until the early6th century A.D. (Table 1). The ages from Core JL6 were correlatedto the two other cores, JL4 and JL11 based on the sedimentologicand geochemical correlations. The identified sections, from bottomto top, are referred to as Sections 3, 2 (2a and 2b) and 1 (Fig. 5).
4.2.1. Section 3Section 3 was only observed in JL6 (106 cme150 cm). A prom-
inent shift in color from dusky yellowish brown to light yellowishbrown marks the boundary between Section 2 and Section 3. Sec-tion 3 is typified by mottled, fine-grained sediments with very fewand sparse minute, transparent, juvenile bivalve remains togetherwith small molluscs. A sudden drop in elemental concentrationsalso characterizes this section, which is due to an increase inorganic matter along this segment. At the 91e93 cm mark, age isestimated to be 709e747 A.D. (1224 � 20 BP).
4.2.2. Section 2The boundary between Section 3 and Section 2 is defined by the
gradual change in color, light yellowish brown to dusky yellowishbrown, and grain size, from fine-grained to coarser materials.Generally, Section 2 is predominantly silt-sized with few Halimeda
changes in Juag Lagoon, Philippines based on sedimentology, bulkation, Quaternary International (2014), http://dx.doi.org/10.1016/

Fig. 5. Correlation across cores based on sedimentological and XRF-derived geochemical profiles. Si, which is one of the several geochemical indices used in this study, is included inthis figure. Age control is provided by radiocarbon dating of samples from core JL6.
J. Reotita et al. / Quaternary International xxx (2014) 1e126
inclusions. Halimeda fragments gradually disappeared towards thelower segment (70e100 cm). Section 2 is estimated to cover fromlate 800 A.D. until 1700 A.D. (Table 1). In Cores JL6 and JL11, twosubsections were identified based on sedimentology and bulkgeochemistry. The subsections were not distinguishable in Core JL4,as the sediment recovery was only 70 cm long. However, theremaining section in Core JL4 could be part of Section 2a based onlithology, bulk geochemistry, and carbon isotope values.
Section 2b, the 75e105 cm segment of Cores JL6 and JL11, ismore organic-rich near the contact with few wood fragmentsobserved in core JL6, which gradually shifted to less OM upcore,concurrent with the change in sediment color from dark reddishbrown to dark brown. This section is also characterized by lowconcentrations of Halimeda and the presence of minute pelecypodsand other mollusc fragments in very minimal amounts. Anapparent decreasing upward trend of Si is typical of this section inCores JL6 and JL11 (Fig. 5).
Section 2a is the transition zone from Section 2 to Section 1,which is composedmainly of dark brown, silt-sized sediments withfew mottled portions. Halimeda fragments are still present butbecome infrequent, whereas other biological remains such as smallgastropods and other molluscs are still present in considerablenumbers. The elemental plot of Si appears to be constant in JL11 butappeared to be slightly increasing for Core JL6. In Core JL6, anoblique erosional contact is observed, suggesting an event of non-deposition.
4.2.3. Section 1Upcore, the contact between Section 2 and Section 1 is along the
boundary of an erosional contact observed only in JL6, typified by a
Please cite this article in press as: Reotita, J., et al., Paleoenvironmentgeochemistry and stable isotopes and their implication to nutrificj.quaint.2014.01.029
pronounced change in color and grain size. Similar variations wereobserved in JL4 and JL11 without the sharp contact. Section 1 iscomposed predominantly of dark grayish brown to brownish black,organic-rich, silt-sized sediments with sparse Halimeda inclusionsand other carbonate fragments. Although organic-rich (20% to 4O%OM), this section is predominated by lithics and ample amounts ofcarbonate materials. A 2 to 5 cm-thick sand-sized sediment layercomposed of Halimeda fragments characterizes the boundary be-tween Section 2 and Section 1. Upcore, several thin layers of Hal-imeda punctuate the core segment. The layers interspersed withHalimeda, gastropods and other carbonate grains show decrease inmoisture content, whereas the layers predominated by finer sedi-ments show increased moisture. The dark sediment layer on theupper 10 cm of Core JL6 is absent from all other cores. Section 1 istypified by the upper 50 cm of JL6 and 11 and the upper 40 cm ofCores JL4 and Juag 4-1. The core profile of Juag 4-1 was based solelyon grain size, as the core was extruded on site after acquisition(Fig. 5).
4.3. Proxies for sediment input
LOI data together with XRF-derived elemental ratios were usedas proxies for sediment input. The JL6 core used for LOI analysiswas a gravity core, while the replicate push core was used for theXRF analysis. Compression in the gravity core may explain thedifference in the depth of the sharp drop in the percentages oflithics and carbonates relative to the XRF-derived proxies for lithic(Ti, and Al/Ti) and carbonate (Ca/Ti and Sr/Ti) inputs (Fig. 6). Sec-tion 3 yielded very low lithics content (Fig. 6a), which is consistentwith low Ti concentration and low elemental ratio of Al/Ti. In
changes in Juag Lagoon, Philippines based on sedimentology, bulkation, Quaternary International (2014), http://dx.doi.org/10.1016/

Fig. 6. Detrital input and erosion proxy showing (a) elemental ratios of Al/Ti and Si/Ti plotted against lithics composition and (b) carbonate concentrations derived from LOI plottedagainst Ca/Ti and Sr/Ti. The JL6 core used for LOI analysis was a gravity core while the replicate push core was used for the XRF analysis, which explains the difference in theboundaries of the profile from LOI and XRF datasets.
J. Reotita et al. / Quaternary International xxx (2014) 1e12 7
contrast, Si/Ti shows a decreasing trend but at a magnitude lowerthan Al and Ti. Upcore, Sections 2 and 1 are characterized by aseemingly constant, high lithic input, which comprised the bulk ofthe total sediment composition ranging from 55 to 65%. However,the high values in lithic composition could be overestimates, asthere is a possibility of incomplete combustion of carbonate grainsresulting to carbonate ash that could add up to the residual lithiccomponent. In very recent times, there is a marked decrease in Ti.Si/Ti content shows a 25-fold increase relative to Al/Ti with severalpeaks. Elemental ratios of Ca/Ti and Sr/Ti were used as proxies forcarbonate input. In Juag Lagoon, Ca/Ti and Sr/Ti ratios appear to beconstant throughout the core, except for certain peaks that arecoincident with layers comprised of Halimeda and other calcareousgrains.
Fig. 7. Discriminant plots of d13C, C/N and d15N showing the general overview of OM sourc2007).
Please cite this article in press as: Reotita, J., et al., Paleoenvironmentgeochemistry and stable isotopes and their implication to nutrificj.quaint.2014.01.029
4.4. Proxies for organic matter sources
Proxies such as d13C, TOC and C/N are used to determine thesource and fate of OM in sediments (Meyers, 2003) in coastal zones(Müller and Voss, 1999; Lamb et al., 2006; Zhang et al., 2007). InJuag Lagoon, the measured d13C and d15N values for all cores rangefrom �18.3& to �23.5& and 0.7&e1.5& respectively. Thesevalues, based on previous studies (e.g. Fry et al., 1977;Meyers,1994;Thornton andMcManus,1994;Meyers, 2003) suggest that OM fromJuag Lagoon is sourced from a mixture of marine phytoplanktonand terrestrial C3 plant sources (Fig. 7). Elemental carbon to ni-trogen ratios suggests that Core JL4 has mixed marine and terres-trial signature (4.1e24.2) whereas Core JL11 is dominated byterrestrial input (11.5e27.5).
es of Juag Lagoon sediments (adapted from Meyers, 1994; Lamb et al., 2006; Ku et al.,
changes in Juag Lagoon, Philippines based on sedimentology, bulkation, Quaternary International (2014), http://dx.doi.org/10.1016/
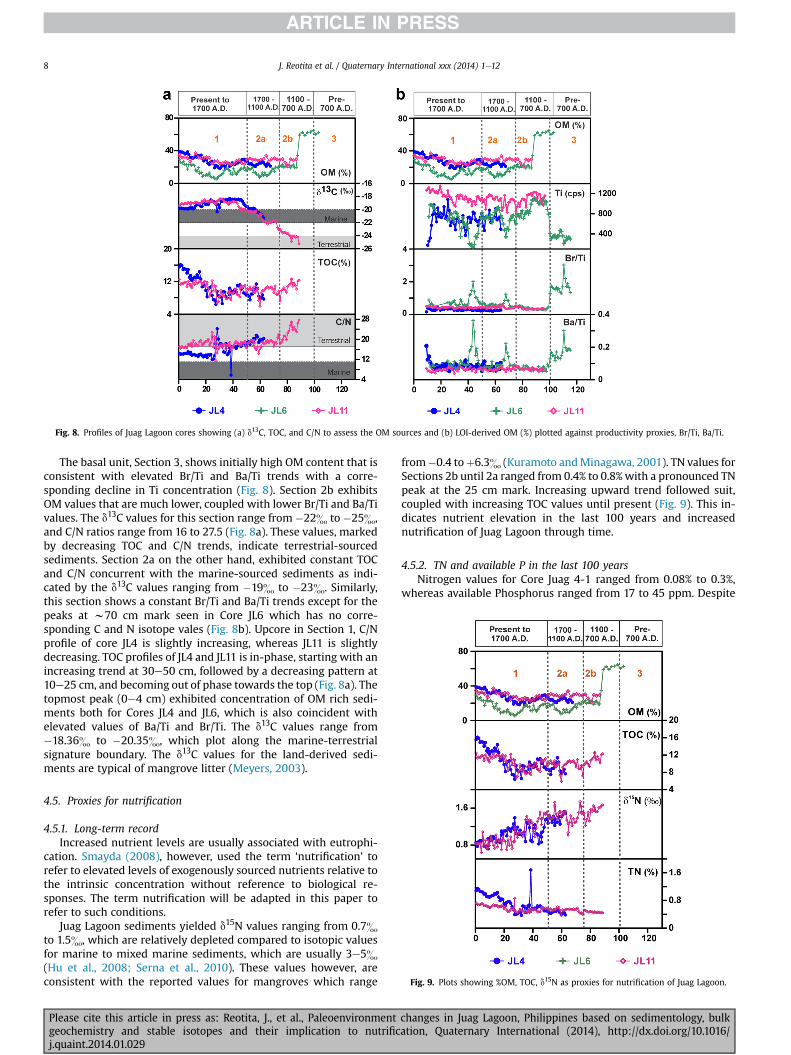
Fig. 8. Profiles of Juag Lagoon cores showing (a) d13C, TOC, and C/N to assess the OM sources and (b) LOI-derived OM (%) plotted against productivity proxies, Br/Ti, Ba/Ti.
Fig. 9. Plots showing %OM, TOC, d15N as proxies for nutrification of Juag Lagoon.
J. Reotita et al. / Quaternary International xxx (2014) 1e128
The basal unit, Section 3, shows initially high OM content that isconsistent with elevated Br/Ti and Ba/Ti trends with a corre-sponding decline in Ti concentration (Fig. 8). Section 2b exhibitsOM values that are much lower, coupled with lower Br/Ti and Ba/Tivalues. The d13C values for this section range from �22& to �25&,and C/N ratios range from 16 to 27.5 (Fig. 8a). These values, markedby decreasing TOC and C/N trends, indicate terrestrial-sourcedsediments. Section 2a on the other hand, exhibited constant TOCand C/N concurrent with the marine-sourced sediments as indi-cated by the d13C values ranging from �19& to �23&. Similarly,this section shows a constant Br/Ti and Ba/Ti trends except for thepeaks at w70 cm mark seen in Core JL6 which has no corre-sponding C and N isotope vales (Fig. 8b). Upcore in Section 1, C/Nprofile of core JL4 is slightly increasing, whereas JL11 is slightlydecreasing. TOC profiles of JL4 and JL11 is in-phase, starting with anincreasing trend at 30e50 cm, followed by a decreasing pattern at10e25 cm, and becoming out of phase towards the top (Fig. 8a). Thetopmost peak (0e4 cm) exhibited concentration of OM rich sedi-ments both for Cores JL4 and JL6, which is also coincident withelevated values of Ba/Ti and Br/Ti. The d13C values range from�18.36& to �20.35&, which plot along the marine-terrestrialsignature boundary. The d13C values for the land-derived sedi-ments are typical of mangrove litter (Meyers, 2003).
4.5. Proxies for nutrification
4.5.1. Long-term recordIncreased nutrient levels are usually associated with eutrophi-
cation. Smayda (2008), however, used the term ‘nutrification’ torefer to elevated levels of exogenously sourced nutrients relative tothe intrinsic concentration without reference to biological re-sponses. The term nutrification will be adapted in this paper torefer to such conditions.
Juag Lagoon sediments yielded d15N values ranging from 0.7&to 1.5&, which are relatively depleted compared to isotopic valuesfor marine to mixed marine sediments, which are usually 3e5&(Hu et al., 2008; Serna et al., 2010). These values however, areconsistent with the reported values for mangroves which range
Please cite this article in press as: Reotita, J., et al., Paleoenvironmentgeochemistry and stable isotopes and their implication to nutrificj.quaint.2014.01.029
from�0.4 toþ6.3& (Kuramoto andMinagawa, 2001). TN values forSections 2b until 2a ranged from 0.4% to 0.8%with a pronounced TNpeak at the 25 cm mark. Increasing upward trend followed suit,coupled with increasing TOC values until present (Fig. 9). This in-dicates nutrient elevation in the last 100 years and increasednutrification of Juag Lagoon through time.
4.5.2. TN and available P in the last 100 yearsNitrogen values for Core Juag 4-1 ranged from 0.08% to 0.3%,
whereas available Phosphorus ranged from 17 to 45 ppm. Despite
changes in Juag Lagoon, Philippines based on sedimentology, bulkation, Quaternary International (2014), http://dx.doi.org/10.1016/

Fig. 10. Percentage sediment composition (organic matter, carbonates and lithics) ofJuag 4-1 core plotted against Total Nitrogen and Available Phosphorus.
J. Reotita et al. / Quaternary International xxx (2014) 1e12 9
the narrow range, and fluctuations, the TN profile shows an overallincreasing trend through time. The P concentration, on the otherhand, remained constant from 1800 until early 1990s and spikedonly in the last 15 years (Fig.10). Concurrent with the increase in TNand P through time is a constant lithogenic input, with increasingOM and decreasing carbonate composition.
5. Discussion
5.1. Bulk geochemistry and clastic sediment input
The low lithic content, coupled with low Ti, Al/Ti and relativelyhigh Si/Ti, could be indicative of very low lithic sediment input intothe system after 700 A.D. This could also be indicative of low pre-cipitation (Wei et al., 2003, 2006) and a constant source ofautochthonous biogenic silica (Fig. 6).
Despite the possibility of overestimation of Ti, Al/Ti and Si/Ti,Sections 2a and 2b exhibited similar constant trends (Fig. 6), indi-cating constant terrigenous input from 1100 A.D. until 1700 A.D.This constant input of lithic material gradually increased towardsSection 1, as exhibited by the increasing Ti and Al/Ti trends. Thisincreasing trend is interpreted to have been caused by an increasein sediment yield which may have been caused by deforestation inthe area. Initial deforestation is most probably due to loggingduring the Spanish period which led to the decline of forest cover(Kummer, 1992; Pulhin, 2003; Bankoff, 2007). Island denudationcould be the source of sediments, given that the lagoon has hightrapping efficiency. However, some of sediments delivered into thelagoon could also be sourced from nearby islands and the mainlandof Sorsogon. The indicated increase in terrigenous input in recentdecades is supported by reports that upland agriculture in thePhilippines increased six-fold between 1960 and 1987, which iscoincident with a rapid decline in forest cover (Coxhead et al., 2002and references therein). On the other hand, volcanic eruptions areruled out as source of sediments, as a pronounced ash layer thatcould be indicative of volcanic activity is absent. Furthermore, Al/Titrends are constantly increasing with no apparent peak or spike inthe profile that could be indicative of volcanic activity (Warner andGieskes, 1974).
The Ca/Ti and Sr/Ti ratios are said to be indicative of the level ofphysicochemical carbonate or silicate weathering or pedogenicsediment input (Koinig et al., 2003). Moreover, Cores JL4 and JL6show elevated Ca/Ti relative to Core JL11, which can be explained bythe proximity of these two cores to the potential source of
Please cite this article in press as: Reotita, J., et al., Paleoenvironmentgeochemistry and stable isotopes and their implication to nutrificj.quaint.2014.01.029
carbonate materials. This is also supported by the increased fre-quency of Halimeda layers in Core JL6.
5.2. Organic matter sources, productivity and redox
The bulk of the sediments from cores JL4 and JL11 plot on themarine to mixed marine and terrestrial zone (Fig. 7), although,subsamples from lower segment of Core JL11 (Section 2a) plottedclose to the C3 zone (Fig. 8a). The C3 plants can be associated withwoody plants, which would include themangroves presently liningthe banks of the lagoon (Fig. 7). Terrestrial C4 plants typicallyassociated with dry conditions (Ku et al., 2007) are not likely tohave contributed to the OM pool, as Juag Lagoon is in an area thathas very high rainfall (PAGASA, 2011). Sediment samples with d13Cendmembers plotting onmarine zone are most likely sourced frommarine algae or phytoplankton (Fry et al., 1977; Meyers, 1994;Thornton and McManus, 1994; Lamb et al., 2006). Furthermore,values of d15N plotted against d13C show that bulk of the organiccontent of the sediments plotted along the marine zone (Fig. 7).
The high OM content, elevated Ba/Ti and Br/Ti and the decline inTi in Section 3, suggests that theperiodprior to 700A.D.was a periodof low lithogenic input and relatively high productivity (Fig 8b).Productivity could not solely be attributed to biogenic silica, as Siand Si/Ti are also decreasing (Fig 6a). Redox proxies,Mn/Ti and Cr/Ti,show two peaks indicating two possible anoxic events (Fig. 11). TheMn peaks could be explained by the upward diffusion of Mn2þ
resulting in its escape to the water column, particularly in anoxicbasins. However, when oxygenated pore water is encountered,oxidation and precipitation of Mn oxides may occur (Tribovillardet al., 2006 and references therein). Relatively low but constantsupply of biogenic silica in a reducing environment may have beenbrought about by the isolation of the pre-lagoon during this period.
In Section 2b, OM values together with decreasing TOC and C/Ntrends indicate that at 700 A.D., OM was sourced predominantlyfrom terrestrial environments, gradually shifting to increasingmarine influence towards 1100 A.D. During this period, detritalinput increased, which is consistent with the pronounced decreasein productivity as indicated by the decline in Ba/Ti and Br/Ti plots.In Section 2a, d13C values shifted to predominantly marine-sourcedsediments from 1100 A.D. to 1700 A.D. Concurrent with the pro-nounced marine influence is the constant detrital input, as shownby the flat profile of lithogenic proxies. Increased marine influencecould be due to more frequent inundation of open ocean waterbrought about by breaching of the sandbars on the western side ofthe lagoon. The sandbar based on beach profiles is less than 1 m,and could be easily breached during storm events.
In Section 1, TOC and OM profiles (Fig. 8a) as well as Ba/Ti andBr/Ti (Fig. 8b) show increasing trends, which imply increasedproductivity in the water column (Zimmerman and Canuel, 2000).The increased productivity resulting in an oxygenated water col-umn could account for the high Mn/Ti trend (Moreno et al., 2007;Kylander et al., 2011). The d13C values for Section 1 are indicativeof mixedmarine and terrestrial signature from 1700 A.D. to present.The d13C values for the land-derived end member are typical ofmangrove litter (Meyers, 2003). This is manifested in Core JL11,acquired near the eastern bank of the lagoon, which is lined bymangroves. The d13C values for Core JL4 on the other hand, arewithin the range of marine-derived signatures, which can beexplained by its proximity to thewestern bank of the lagoon, whichis proximal to the more open ocean.
The overall fluctuating TOC and C/N trends and varying amountsof d13C in Section 1 suggests a mixture of sediments from terrestrialand marine sources. Furthermore, increasing OM accompanied byincreasing TOC indicates faster sedimentation rates in the last 200years.
changes in Juag Lagoon, Philippines based on sedimentology, bulkation, Quaternary International (2014), http://dx.doi.org/10.1016/

Fig. 11. Bulk geochemical proxies for redox comparing (a) ratios and (b) elemental concentration.
J. Reotita et al. / Quaternary International xxx (2014) 1e1210
5.3. Nutrification of Juag Lagoon
The derived d15N values for Juag Lagoon sediments (0.7&e
1.5&) fall within the values for fertilizers, forest leaf litter andmangroves. In a study done in a riverine mangrove in GuimarasIsland, Philippines, Primavera (1996) presented d15N values rangingfrom 0.6& to 3.2& for phytoplankton and 2.8&e3.8& formangrove leaves. In a study conduted in a mangrove area inThailand, d15N values for mangroves forest leaf litters range from�8& to þ3& (Kuramoto and Minagawa, 2001). Kolasinski et al.(2011) reported d15N values for fertilizers ranging from �4to þ4&. The bulk of the sediments deposited prior to 1700 A.D.could have been sourced from mangroves or leaf litter. The“explosive increase” in the utilization of fertilizer only started in1960, and persisted towards the 1980s (Boesch, 2002). As early as1909, the HabereBosch process for reacting N2 with H2 to produceammonia was already discovered, which allowed for the massiveexpansion of agriculture (Howarth, 2008 and references therein). Inthe Philippines, fertilizer consumption data from 1961 to 2002showed an increasing trend (FAOSTAT, 2012). This is consistentwith the global increase in fertilizer utilization, although indeveloped countries, the utilization of nitrogen either becamestagnant or decreased in recent years. In Asia however, theincreasing trend is sustained until present (Hossain and Singh,2000). Thus, d15N values for the upper 20 cm of the core could beattributed to increased fertilizer consumption, which is synchro-nous with increasing TN values. Nitrogen and phosphorus con-centrations in Juag Lagoon over the last 100 years (Fig. 10) fallwithin the range of nutrient concentration (N ¼ 0.05e0.20%;P ¼ 10e90 ppm) reported by David et al. (2009) from severalaquaculture sites in the Philippines. Increased nutrification in theseaquaculture sites resulted in coastal pollution and harmful algalbloom events.
5.4. Geomorphic evolution of Juag Lagoon and possible implicationfor nutrification
Pre-700 A.D., Juag Lagoon sediments (Section 3) indicated a lowenergy environment characterized by low terrigenous input, and
Please cite this article in press as: Reotita, J., et al., Paleoenvironmentgeochemistry and stable isotopes and their implication to nutrificj.quaint.2014.01.029
constant supply of autochthonous silica, consistent with increasedproductivity (Fig. 12a). During this time, when the sea level was0.9e1.2 m higher than the present mean tide level (Maeda et al.,2009), the two sub-basins of the present day lagoon were not yetenclosed by sandbars but were likely surrounded by a shallowsandy platform which could also be the source of the futuresandbars. Because sea level was higher, the shoreline was furtherlandward. Thus, the mainland terrigenous sediment sources weremore landward than present. Moreover, thicker vegetation isassumed both for Juag Lagoon and the surrounding islands, asdeforestation commenced around 1500 A.D. (Kummer, 1992;Bankoff, 2007). Hence, this time could have resulted to rivershaving lower than present suspended loads. Low sedimentdischarge would have led to clearer coastal waters, which in turnwould contribute to higher productivity.
The pre-lagoon environment was succeeded by pronouncedenrichment of lithogenic material, suggesting increased terrestrialerosion and perhaps enhanced precipitation from ca. 700 A.D. until1100 A.D. (Section 2b). Increased erosion could have been triggeredby sea level fall. As the sea level dropped, the sandbars started todevelop, which led to the formation of the lagoon. Most of theshallow to intertidal banks of the lagoon were then colonized bymangroves, which could have expanded rapidly (Fig. 12b). This issupported by TOC, d13C and C/N values all indicating terrestrial-derived organic matter, mostly mangrove litter (Fig. 8). This isfurther corroborated by the d15N values which are also indicative ofmangrove sourced OM (Fig. 9).
Around 1100 A.D.e1700 A.D., the system shifted to a predomi-nantly marine environment, as typified by Section 2a and sup-ported by carbon isotopic values and peaks in LOI-derivedcarbonate components. During this period, expansion of the coastalplain along the eastern side continued, but the sandbars on thewestern side could have undergone breaching allowing the marinewaters to inundate the lagoon. Several episodes of breaching couldhave happened in more recent years and decimated the mangrovecover on this flank. These breaching events are represented byseveral sedimentary layers characterized by silty sediments withinclusions of Halimeda and other carbonate grains that wereobserved in this section (Fig. 12c). Increasing OM and TOC trends
changes in Juag Lagoon, Philippines based on sedimentology, bulkation, Quaternary International (2014), http://dx.doi.org/10.1016/

Fig. 12. Summary of the formation of Juag Lagoon showing (a) pre-lagoon, (b) lagoonformation and (c) marine inundation. Some of the symbols and graphics are from IAN-University of Maryland (ian.umces.edu/symbols/).
J. Reotita et al. / Quaternary International xxx (2014) 1e12 11
persisted for the next 300 years, indicating increased accumulationrates. Consistently, elevated lithic input was observed which couldbe attributed to forest denudation during this period. Bankoff(2007) in his study of Philippine forest denudation noted that thecumulative effect of almost four centuries of forest exploitationunder Spanish, American and Japanese colonialism was significantand sustained loss of forest cover. He also cited a decline inSouthern Luzon forest cover from 72% in 1875 to 39% in 1932. Thisvalidates the association of increased lithogenic input in recentyears. Despite the high lithic input, productivity consistentlyincreased with coincident marine and mixed marine to terrestrialderived OM. Mixed OM sources depicted in this section suggest abalance in the marine and terrestrial sediment input. The lagoonmaintained continuouswater exchangewith themore openmarinewaters through the tidal channel that is kept open by local fisherfolk through dredging.
Total nitrogen profile from ca.1000 A.D. to 1700 A.D. registered aconstant trend (Fig. 9). A slight change is evident in ca. 1800 A.D.,and the TN shows a generally increasing trend until recent years.Similarly, increase in P concentration occurred only in the last 20years. This shows that the nutrification of Juag Lagoon occurredvery recently, which may be attributed to enhanced anthropogenicimpact and/or to limited flushing of lagoon waters resulting inlonger residence time. Moreover, the long-term trend is supported
Please cite this article in press as: Reotita, J., et al., Paleoenvironmentgeochemistry and stable isotopes and their implication to nutrificj.quaint.2014.01.029
by the TN trends spanning the last 100 years based on Core Juag 4-1(Fig. 11). High consumption of fertilizers as a result of agriculturalexpansion in more recent years (FAOSTAT, 2012) is positivelycorrelated to increasing TN and P. The closed lagoon system couldhave aided in the accumulation and concentration of the nutrientsthat enter the lagoon thereby resulting in enhanced nutrification.Although the closing of the lagoon as well as the SL variations couldhave played a role in the nutrification of the lagoon, it seemed thatanthropogenic factors altered and increased the nutrification of thelagoon. This apparent nutrification could have fostered a favourablecondition that lead to recurring bloom events in Juag Lagoon.Monitoring efforts show that in the last 15 years, harmful algalblooms have been reported for this area (BFAR Shellfish Bulletin).
6. Summary and conclusion
Lithologic and sedimentologic-based correlations of core sedi-ments supported by XRF-derived bulk geochemistry and carbonand nitrogen isotopic measurements identified three lithologicunits in Juag Lagoon. These units typify the geomorphic evolutionand nutrification of the lagoon. Prior to 700 A.D., the deep sub-basins could have been a pre-lagoon, open marine environmentflanked by low-lying, sandy platforms. The lowering of sea levelallowed the sandbars to develop and it also exposed the easternbanks of the lagoon and allowed for the expansion of mangroves.This is indicated by lithogenic input to the sub-basins throughweathering and erosion in addition to the detrital sedimentscoming from the nearby islands. The lagoon transitioned tomarine-dominated sediment input with concurrent increase in productiv-ity from 1100 A.D. to 1700 A.D. Increased marine influence couldhave been aided by several breaching events that continued untilrecent times.
Increasing OM, TOC, TN and lithogenic input characterized thelast 200e300 years in Juag Lagoon. The increasing population andthe onset of agriculture in the area during this time may haveimpacted the increasing trend in lithogenic input through forestdenudation. Similarly, a pronounced elevation of TN is recorded inthe last 100 years, which can be attributed to fertilizer utilization assuggested by d15N values. The increasing productivity accompaniedby elevated TN, P and TOC values substantiates the nutrification ofJuag Lagoon in recent years, which could be enhanced by humanactivities and lead to eutrophication.
Acknowledgements
The authors would like to thank the PhilHAB Program funded bythe DOST-PCAARD. Isotope analysis was accomplished and fundedby the SKLEC of East China National University through Dr. JingZhang. Lead-210 age dates were provided by PNRI.
References
Aurelio, M.A., Pena, R.E., 2004. Geology and Mineral Resources of the Philippines(1). Mines and Geosciences Bureau, Department of Environment and NaturalResources, Quezon City, p. 391.
Bankoff, G., 2007. One island too many: reappraising the extent of deforestation inthe Philippines prior to 1946. Journal of Historical Geography 33 (2), 314e334.
Boesch, D.F., 2002. Challenges and opportunities for science in reducing nutrientover-enrichment of coastal ecosystems. Estuaries 25 (4), 886e900.
Bureau of Fisheries and Aquatic Resources (BFAR) Shellfish Bulletin. http://www.bfar.da.gov.ph.
Calvert, S.E., Pedersen, T.F., 2007. Chapter fourteen elemental proxies for palae-oclimatic and palaeoceanographic variability in marine sediments: interpreta-tion and application. Developments in Marine Geology 1, 567e644.
Chun, C.O., Delaney, M.L., Zachos, J.C., 2010. Paleoredox changes across thePaleocene-Eocene thermal maximum, Walvis Ridge (ODP Sites 1262, 1263, and1266): evidence from Mn and U enrichment factors. Paleoceanography 25 (4).
Cooper, S.R., Brush, G.S., 1993. A 2,500-year history of anoxia and eutrophication inChesapeake Bay. Estuaries 16 (3), 617e626.
changes in Juag Lagoon, Philippines based on sedimentology, bulkation, Quaternary International (2014), http://dx.doi.org/10.1016/

J. Reotita et al. / Quaternary International xxx (2014) 1e1212
Coxhead, I., Shively, G., Shuai, X., 2002. Development policies, resource constraints,and agricultural expansion on the Philippine land frontier. Environment andDevelopment Economics 7 (2), 341e363.
David, C.P.C., Maria, Y.S., Siringan, F.P., Reotita, J.M., Zamora, P.B., Villanoy, C.L.,Sombrito, E.Z., Azanza, R.V., 2009. Coastal pollution due to increasing nutrientflux in aquaculture sites. Environmental Geology 58 (2), 447e454.
de Jonge, V.N., Elliott, M., Orive, E., 2002. Causes, historical development, effects andfuture challenges of a common environmental problem: eutrophication.Hydrobiologia 475 (1), 1e19.
Di Stefano, C., Ferro, V., Mirabile, S., 2010. Comparison between grain-size analysesusing laser diffraction and sedimentation methods. Biosystems Engineering 106(2), 205e215.
Diekmann, B., Hofmann, J., Henrich, R., Fütterer, D.K., Röhl, U., Wei, K.Y., 2008.Detrital sediment supply in the southern Okinawa Trough and its relation tosea-level and Kuroshio dynamics during the late Quaternary. Marine Geology255, 83e95.
Emery, K.O., 1961. A simple method of measuring beach profiles. Limnology andOceanography 6, 90e93.
Food and Agricultural Organization of the United Nations (FAO), 2012. FAOSTAT,PRODStat Fertilizers Archive, Fertilizers. http://faostat.fao.org/site/575/default.aspx#ancor (accessed 29.08.12.).
Fry, B., Scalan, R.S., Parker, P.L., 1977. Stable carbon isotope evidence for two sourcesof organic matter in coastal sediments: sea grasses and plankton. Geochimica etCosmochimica Acta 41 (12), 1875e1877.
Geological Map Bicol Shelf e Lamon Bay and Southeast Luzon Bay, December 1985.Bureau of Energy Development (BED) (Petroleum Basin Evaluation Project).
Gordon, A.L., Sprintall, J., Ffield, A., 2011. Regional oceanography of the PhilippineArchipelago. Oceanography 24 (1), 14e27.
Han, W., Moore, A., Levin, J., Zhang, B., Arango, H., Curchitser, E., Di Lorenzo, E.,Gordon, A., Lin, J., 2009. Seasonal surface ocean circulation and dynamics in thePhilippine Archipelago region during 2004e2008. Dynamics of the Atmo-spheres and Oceans 47, 114e137.
Heiri, O., Lotter, A.F., Lemcke, G., 2001. Loss on ignition as a method for estimatingorganic and carbonate content in sediments: reproducibility and comparabilityof results. Journal of Paleolimnology 25, 101e110.
Hossain, M., Singh, V.P., 2000. Fertilizer use in Asian agriculture: implications forsustaining food security and the environment. Nutrient Cycling in Agro-ecosystems 57, 155e169.
Howarth, R.W., 2008. Coastal nitrogen pollution: a review of sources and trendsglobally and regionally. Harmful Algae 8, 14e20.
Hu, J., Zhang, G., Li, K., Peng, P., Chivas, A., 2008. Increased eutrophication offshoreHong Kong, China during the past 75 years: evidence from high-resolutionsedimentary records. Marine Chemistry 110, 7e17.
Integration and Application Network, University of Maryland Center for Environ-mental Science (ian.umces.edu/symbols/).
Jones, B.H., Lee, C.M., Toro-Farmer, G., Boss, E.S., Gregg, M.C., Villanoy, C.L., 2011.Tidally driven exchange in an archipelago strait: biological and optical re-sponses. Oceanography 24 (1), 142e155.
Koinig, K.A., Shotyk, W., Lotter, A.F., Ohlendorf, C., Sturm, M., 2003. 9000 years ofgeochemical evolution of lithogenic major and trace elements in the sedimentof an alpine lake e the role of climate, vegetation, and land-use history. Journalof Paleolimnology 30 (3), 307e320.
Kolasinski, J., Rogers, K., Cuet, P., Barry, B., Frouin, P., 2011. Sources of particulateorganic matter at the ecosystem scale: a stable isotope and trace element studyin a tropical coral reef. Marine Ecology Progress Series 443, 77e93.
Kryc, K.A., Murray, R.W., Murray, D.W., 2003. Al-to-oxide and Ti-to-organic linkagesin biogenic sediment: relationships to paleo-export production and bulk Al/Ti.Earth and Planetary Science Letters 211 (1), 125e141.
Ku, H.W., Chen, Y.G., Chan, P.S., Liu, H.C., Lin, C.C., 2007. Paleo-environmental evo-lution as revealed by analysis of organic carbon and nitrogen: a case of coastalTaipei Basin in Northern Taiwan. Geochemical Journal 41 (2), 111e120.
Kummer, D.M., 1992. Deforestation in the Post-war Philippines (No. 234). Universityof Chicago Press.
Kuramoto, T., Minagawa, M., 2001. Stable carbon and nitrogen isotopic character-ization of organic matter in a mangrove ecosystem on the southwestern coastof Thailand. Journal of Oceanography 57 (4), 421e431.
Kylander, M.E., Ampel, L., Wohlfarth, B., Veres, D., 2011. High-resolution X-rayfluorescence core scanning analysis of Les Echets (France) sedimentarysequence: new insights from chemical proxies. Journal of Quaternary Science26, 109e117.
Lamb, A.L., Wilson, G.P., Leng, M.J., 2006. A review of coastal palaeoclimate andrelative sea-level reconstructions using d13C and C/N ratios in organic material.Earth-Science Reviews 75, 29e57.
Maeda, Y., Yokoyama, Y., Siringan, F., Quina, G., 2009. Holocene relative sea levelfluctuations recorded in tidal notches along the Pacific Coast of Northern Luzon,Philippines. Journal of Geography 118 (6), 1284e1291.
Meyers, P., 1994. Preservation of elemental and isotopic source identification ofsedimentary organic matter. Chemical Geology 114, 289e302.
Please cite this article in press as: Reotita, J., et al., Paleoenvironmentgeochemistry and stable isotopes and their implication to nutrificj.quaint.2014.01.029
Meyers, P., 2003. Applications of organic geochemistry to paleolimnological re-constructions: a summary of examples from the Laurentian Great Lakes.Organic Geochemistry 34, 261e289.
Moreno, A., Giralt, S., Valero-Garcés, B., Sáez, A., Bao, R., Prego, R., Pueyo, P., Gon-zales-Samperiz, C., Taberner, C., 2007. A 14kyr record of the tropical Andes: theLago Chungará sequence (18� S, northern Chilean Altiplano). Quaternary In-ternational 161, 4e21.
Müller, A., Voss, M., 1999. The palaeoenvironments of coastal lagoons in thesouthern Baltic Sea, II. d13C and d15N ratios of organic matterdsources andsediments. Palaeogeography, Palaeoclimatology, Palaeoecology 145, 17e32.
National Mapping and Resource Information Authority (NAMRIA), 2010. Tide andCurrent Tables Philippines 2010. Oceanographic Survey Division, Coast andGeodetic Survey Department, Manila, Philippines.
Paerl, H.W., 2006. Assessing and managing nutrient-enhanced eutrophication inestuarine and coastal waters: interactive effects of human and climatic per-turbations. Ecological Engineering 26 (1), 40e54.
Philippine Atmospheric Geophysical and Astronomical Services Administration(PAGASA), 2011. Climate Change in the Philippines. PAGASA, Quezon City,Philippines, p. 85.
Poppe, L.J., Eliason, A.H., Fredericks, J.J., Rendigs, R.R., Blackwood, D., Polloni, C.F.,2000. Grain Size Analysis of Marine Sediments: Methodology and Data Pro-cessing. In: US Geological Survey East Coast Sediment Analysis: Procedures,Database, and Georeferenced Displays. US Geological Survey Open File Report00e358.
Primavera, H.J., 1996. Stable carbon and nitrogen isotope ratios of penaeid juvenilesand primary producers in a riverine mangrove in Guimaras, Philippines.Bulletin of Marine Science 58 (3), 675e683.
Pulhin, J.M., 2003. Trends in Forest Policy in the Philippines. Policy Trend Report2002, pp. 29e41.
Rabalais, N.N., Turner, R.E., Gupta, B.K.S., Platon, E., Parsons, M.L., 2007. Sedimentstell the history of eutrophication and hypoxia in the northern Gulf of Mexico.Ecological Applications 17 (5), S129eS143.
Rabalais, N.N., Turner, R.E., Díaz, R.J., Justi�c, D., 2009. Global change and eutrophi-cation of coastal waters. ICES Journal of Marine Science: Journal du Conseil 66(7), 1528e1537.
Seitzinger, S.P., Kroeze, C., Bouwman, A.F., Caraco, N., Dentener, F., Styles, R.V., 2002.Global patterns of dissolved inorganic and particulate nitrogen inputs to coastalsystems: recent conditions and future projections. Estuaries 25 (4), 640e655.
Serna,A., Pätsch, J., Dähnke, K.,Wiesner,M.G., ChristianHass,H., Zeiler,M., Hebbeln,D.,Emeis, K.C., 2010. History of anthropogenic nitrogen input to the GermanBight/SENorth Sea as reflected by nitrogen isotopes in surface sediments, sediment coresand hindcast models. Continental Shelf Research 30 (15), 1626e1638.
Smayda, T.J., 2008. Complexity in the eutrophicationdharmful algal bloomrelationship, with comment on the importance of grazing. Harmful Algae 8,140e151.
Stuiver, M., Reimer, P.J., 1993. Extended 14C database and revised CALIB radiocarboncalibration program. Radiocarbon 35, 215e230.
Thornton, S.F., McManus, J., 1994. Application of organic carbon and nitrogen stableisotope and C/N ratios as source indicators of organic matter provenance inestuarine systems: evidence from the Tay Estuary, Scotland. Estuarine, Coastaland Shelf Science 38 (3), 219e233.
Tjallingii, R., Röhl, U., Kölling, M., Bickert, T., 2007. Influence of the water content onX-ray fluorescence core-scanning measurements in soft marine sediments.Geochemistry Geophysics Geosystems 8 (2), Q02004.
Tribovillard, N., Algeo, T.J., Lyons, T., Riboulleau, A., 2006. Trace metals as pale-oredox and paleoproductivity proxies: an update. Chemical Geology 232 (1),12e32.
Vaasma, T., 2008. Grain-size analysis of lacustrine sediments: a comparison of pre-treatment methods. Estonian Journal of Ecology 57, 231e243.
Warner, T.B., Gieskes, J.M., 1974. Iron-rich Basal Sediments from the Indian Ocean:Site 245. In: Deep Sea Drilling Project. et al., Initial Reports of the Deep SeaDrilling Project, vol. 25, pp. 395e403.
Wei, G., Liu, Y., Li, X., Shao, L., Liang, X., 2003. Climatic impact on Al, K, Sc and Ti inmarine sediments: evidence from ODP site 1144, South China sea. GeochemicalJournal- Japan 37 (5), 593e602.
Wei, G., Li, X.H., Liu, Y., Shao, L., Liang, X., 2006. Geochemical record of chemicalweathering and monsoon climate change since the early Miocene in the SouthChina Sea. Paleoceanography 21 (4), PA4214.
Wu, Y., Zhang, J., Li, D.J., Wei, H., Lu, R.X., 2003. Isotope variability of particulateorganic matter at the PN section in the East China Sea. Biogeochemistry 65 (1),31e49.
Zhang, J., Wu, Y., Jennerjahn, T.C., Ittekkot, V., He, Q., 2007. Distribution of organicmatter in the Changjiang (Yangtze River) Estuary and their stable carbon andnitrogen isotopic ratios: implications for source discrimination and sedimen-tary dynamics. Marine Chemistry 106 (1), 111e126.
Zimmerman, A.R., Canuel, E.A., 2000. A geochemical record of eutrophication andanoxia in Chesapeake Bay sediments: anthropogenic influence on organicmatter composition. Marine Chemistry 69 (1), 117e137.
changes in Juag Lagoon, Philippines based on sedimentology, bulkation, Quaternary International (2014), http://dx.doi.org/10.1016/
Copyright © 2022 FDOKUMEN