Do stable carbon isotopes of brown coal woods record changes in Lower Miocene palaeoecology?
10
Do stable carbon isotopes of brown coal woods record changes in Lower Miocene palaeoecology? I. Poole a,b, * , M. Dolezych c,d , J. Kool a , J. van der Burgh d , P.F. van Bergen a,1 a Geochemistry, Earth Sciences, Utrecht University, P.O. Box 80021, 3508 TA Utrecht, The Netherlands b Palaeontological Museum, Oslo University, P.O. Box 1172 Blindern, N-0318 Oslo, Norway c Hoyerswerda 02977, Schlossstr. 1c, Germany d Laboratory of Palaeobotany, Faculty of Biology, University of Utrecht, Budapestlaan 4, 3584 CD Utrecht, The Netherlands Received 24 August 2004; received in revised form 1 November 2005; accepted 11 November 2005 Abstract Stable carbon isotope ratios of fossil wood from the Miocene brown coal deposits in former East Germany are compared with palaeobotanical and sedimentological data to test the use of stable isotopes in determining palaeoenvironment. Significant differences in the chemical composition of samples from different horizons were observed. Those specimens preserved under the most (bio)degrading conditions yielded stable carbon isotope values least representative of original wood specimens. Overall, the chemical preservation of the wood was seen to affect the stable isotope signal but deconvolving the preservational bias using a molecular approach enabled estimations of d 13 C biomass and d 13 C palaeoatmosphere that were then used to interpret more fully the palaeoenvironment. D 2005 Elsevier B.V. All rights reserved. Keywords: Fossil wood; Miocene; Stable carbon isotopes; Pyrolysis; Lignin 1. Introduction d 13 C values of biomass and atmosphere derived from fossil terrestrial material are important prerequi- sites for carbon models concerned with constraining carbon flow and understanding terrestrial palaeoecosys- tems more fully (Poole et al., 2004). Such d 13 C values rely on the assumption that their isotopic compositions have not been significantly altered during diagenesis. Stable carbon isotope ratios of plant biomass (i.e. d 13 C biomass ) are dependent upon a number of factors: isotopic composition of the atmosphere (e.g. Farquhar et al., 1989), carbon fixation pathway (C 3 v. C 4 ; Smith and Epstein, 1971), and internal assimilation, metabo- lism and biosynthetic pathways (e.g. O’Leary, 1981; Farquhar et al., 1989). Moreover local environmental parameters such as irradiance, temperature, soil water, salinity influencing water availability also affect the d 13 C signatures. With respect to fossil material, additional factors need to be considered. Inherent alterations in d 13 C fossil plant signature can arise due to taphonomical processes selec- tively removing certain chemical moieties thus biasing the d 13 C fossil plant value of the organ under investigation. This process has been termed dchemical taphonomyT (van Bergen and Poole, 2002). Therefore to ensure that 0031-0182/$ - see front matter D 2005 Elsevier B.V. All rights reserved. doi:10.1016/j.palaeo.2005.11.013 * Corresponding author. Geochemistry, Earth Sciences, Utrecht University, P.O. Box 80021, 3508 TA Utrecht, The Netherlands. E-mail address: [email protected] (I. Poole). 1 Current address: Shell Global Solutions International, Badhuisweg 3, 1031 CM Amsterdam, The Netherlands. Palaeogeography, Palaeoclimatology, Palaeoecology 236 (2006) 345– 354 www.elsevier.com/locate/palaeo
-
Upload
senckenberg -
Category
Documents
-
view
0 -
download
0
Transcript of Do stable carbon isotopes of brown coal woods record changes in Lower Miocene palaeoecology?

www.elsevier.com/locate/palaeo
Palaeogeography, Palaeoclimatology, P
Do stable carbon isotopes of brown coal woods record changes in
Lower Miocene palaeoecology?
I. Poole a,b,*, M. Dolezych c,d, J. Kool a, J. van der Burgh d, P.F. van Bergen a,1
a Geochemistry, Earth Sciences, Utrecht University, P.O. Box 80021, 3508 TA Utrecht, The Netherlandsb Palaeontological Museum, Oslo University, P.O. Box 1172 Blindern, N-0318 Oslo, Norway
c Hoyerswerda 02977, Schlossstr. 1c, Germanyd Laboratory of Palaeobotany, Faculty of Biology, University of Utrecht, Budapestlaan 4, 3584 CD Utrecht, The Netherlands
Received 24 August 2004; received in revised form 1 November 2005; accepted 11 November 2005
Abstract
Stable carbon isotope ratios of fossil wood from the Miocene brown coal deposits in former East Germany are compared with
palaeobotanical and sedimentological data to test the use of stable isotopes in determining palaeoenvironment. Significant
differences in the chemical composition of samples from different horizons were observed. Those specimens preserved under
the most (bio)degrading conditions yielded stable carbon isotope values least representative of original wood specimens. Overall,
the chemical preservation of the wood was seen to affect the stable isotope signal but deconvolving the preservational bias using a
molecular approach enabled estimations of d13Cbiomass and d13Cpalaeoatmosphere that were then used to interpret more fully the
palaeoenvironment.
D 2005 Elsevier B.V. All rights reserved.
Keywords: Fossil wood; Miocene; Stable carbon isotopes; Pyrolysis; Lignin
1. Introduction
d13C values of biomass and atmosphere derived
from fossil terrestrial material are important prerequi-
sites for carbon models concerned with constraining
carbon flow and understanding terrestrial palaeoecosys-
tems more fully (Poole et al., 2004). Such d13C values
rely on the assumption that their isotopic compositions
have not been significantly altered during diagenesis.
Stable carbon isotope ratios of plant biomass (i.e.
0031-0182/$ - see front matter D 2005 Elsevier B.V. All rights reserved.
doi:10.1016/j.palaeo.2005.11.013
* Corresponding author. Geochemistry, Earth Sciences, Utrecht
University, P.O. Box 80021, 3508 TA Utrecht, The Netherlands.
E-mail address: [email protected] (I. Poole).1 Current address: Shell Global Solutions International, Badhuisweg
3, 1031 CM Amsterdam, The Netherlands.
d13Cbiomass) are dependent upon a number of factors:
isotopic composition of the atmosphere (e.g. Farquhar
et al., 1989), carbon fixation pathway (C3 v. C4; Smith
and Epstein, 1971), and internal assimilation, metabo-
lism and biosynthetic pathways (e.g. O’Leary, 1981;
Farquhar et al., 1989). Moreover local environmental
parameters such as irradiance, temperature, soil water,
salinity influencing water availability also affect the
d13C signatures.
With respect to fossil material, additional factors need
to be considered. Inherent alterations in d13Cfossil plant
signature can arise due to taphonomical processes selec-
tively removing certain chemical moieties thus biasing
the d13Cfossil plant value of the organ under investigation.
This process has been termed dchemical taphonomyT(van Bergen and Poole, 2002). Therefore to ensure that
alaeoecology 236 (2006) 345–354

I. Poole et al. / Palaeogeography, Palaeoclimatology, Palaeoecology 236 (2006) 345–354346
the d13Cfossil plant values are both as reliable as possible
and comparable, the fossils need to be systematically
identified, the same organ type targeted and the molec-
ular preservation of each piece of material determined. In
addition, whenever possible larger fossil wood samples
containing several growth rings are preferred because
local environmental factors, such as light and water
availability, that influence stomatal conductance and
photosynthesis, and as such d13Cbiomass, are integrated
allowing larger scale isotope trends to be observed.
Moreover it is emphasised that the stable carbon isotope
composition of the material used here is an integrated
time average because lignin–cellulose of one growth ring
in living trees also includes carbon fixed during the
autumn prior to early wood formation. Moreover, the
use of several growth rings into a single sample further
reduces seasonally induced changes allowing larger
scale isotope trends to be observed.
Despite these boundary conditions, stable carbon
isotope values of fossil remains have great potential
to help in the reconstruction of palaeoenvironments
(e.g. Nguyen Tu et al., 1999, 2002) although direct
correlations with pCO2 are more difficult to assess
(Nguyen Tu et al., 2004). However, it is necessary to
test the variations in d13C values of fossil plants in
different deposits in which the environments are al-
ready well documented to fully validate this use of
carbon isotopes as a tool to characterise changes in
palaeoecosystems (Nguyen Tu et al., 2002).
In this paper the use of stable carbon isotopes of
fossil material from a well-defined Miocene swamp
environment as a palaeoecological indicator is explored
by comparing these data with the sedimentological and
palaeobotanical conclusions drawn for the sedimentary
setting under investigation. The current study focuses
on organically well-preserved wood from the Miocene
brown coal mines of Wetro, Janschwalde and Welzow
of former East Germany.
The solvent insoluble part of wood, which constitu-
tes the bulk of the material, between 90% and 96%, is
composed of two main chemical moieties: holocellu-
lose (i.e. hemicellulose and cellulose) and lignin. The
moieties comprising the cellulose fraction of wood are13C enriched when compared with the lignin fraction
(e.g. Benner et al., 1987; Spiker and Hatcher, 1987;
Loader et al., 2003). Therefore the relative abundance
of cellulose to lignin preserved within a piece of fossil
wood will affect the d13Cfossil wood value. It is well
known that under natural anaerobic conditions the holo-
cellulose fraction of wood is preferentially degraded
relative to lignin with hemicellulose degrading faster
than cellulose (e.g. Benner et al., 1987; Hedges et al.,
1985). Consequently hemicellulose can last for perhaps
thousands of years whereas cellulose can survive
millions of years. Lignin however can still be recog-
nised after 10s, if not 100s of millions of years (e.g. van
Bergen et al., 2004) perhaps not as an original lignin
fraction but as degradation products specific to lignin.
The selective removal and alteration of the chemical
composition are interrelated with the sedimentary envi-
ronment (van Bergen et al., 1994) and thus preservation
type of the fossil.
The depositional environment in the Lusatian region
offers a number of fossiliferous localities, namely the
Wetro, Janschwalde and Welzow coal mining areas,
which have yielded a wealth of fossil plant material.
Most of the plant material has been systematically
identified and these results have been used along with
sedimentological (Standke et al., 1992), stratigraphical
(Gothel, 2002) and palynological studies (Krutzsch,
1992, 2000) to piece together detailed palaeoenviron-
mental and palaeofloral reconstructions (e.g. Mai,
2000). The material from this region is of interest
because the temperature did not vary significantly and
water availability appeared to be the only influential
factor over this narrow stratigraphic interval spanning
approx. 500,000 years during the Lower Miocene about
15–16 Ma ago.
2. Material and methods
2.1. Geological and palaeobotanical context
The sections sampled are located in the southeastern
corner of former East Germany (Fig. 1). They comprise
a series of intercalated sand, clay and brown coal layers
representing a number of regression/transgression
cycles (Gothel, 2002; TB 2.3 and TB 2.4 sensu Haq
et al., 1988). The main coal layers are indicated as Bank
1 to Bank 3. The section represents the upper part of the
Lower Miocene/lower part of the Middle Miocene, with
the top of the sequence situated below evidence of the
Ries impact, indicating that the specimens must be at
least 15 Ma old (Langhian), with the oldest sequence
approximately 16 Ma. Based on stratigraphic compar-
isons the sections correlate to zone M5–M6 based on
planktonic foraminifera (Berggren et al., 1995).
All three Banks comprise distinctive facies, dK–A–G–P–MT corresponding to vegetation succession (Schnei-
der, 1978). According to Gothel (2002) a transgression
occurred during the deposition of sediments representing
Bank 3 and Bank 1. Bank 2 shows the possible begin-
nings of a regression but is subsequently truncated by a
hiatus. These facies represent vegetation succession

Fig. 1. Locations of the three brown coal mines (Tgb.) from where the
samples used in this study originated.
I. Poole et al. / Palaeogeography, Palaeoclimatology, Palaeoecology 236 (2006) 345–354 347
sequences on moorland grading from a species rich
(succession/colonizer; dKT) vegetation growing on a
relatively nutrient poor substrate to a species poor
(climax; dMT) vegetation growing on an extremely nu-
trient poor substrate (Schneider, 1969, 1978, 1992). The
time interval for this cycle is in the region of c. 10�103
years.
The K-facies represents an eutrophic swamp facies
mostly dominated by conifers such as Glyptostrobus
(i.e. Glybtostroboxylon) and the slow growing (i.e. 120
rings per 10 cm) Sequoia (i.e. Taxodioxylon) forming
an open canopy environment. A-facies represents a
facies dominated by angiospermous trees and shrubs,
e.g. Symplocos, associated with conifers such as the
arborescent Taiwania and Cunninghamia. G-facies or
Glumiflorae facies yields no wood but only dgrassTfragments, e.g. Cyperaceae and Poaceae, are found
here. P-facies or Pinus facies is dominated by conifer
woodland composed of trees and shrubs with an under-
storey of angiosperms. M-facies or Marcoduria facies
is extremely nutrient poor and acidic with microorgan-
isms unable to break down the organic matter rendering
the wood material relatively well-preserved. The vege-
tation was open, slow growing and also dominated by
conifer trees such as Sciadopitys, Cryptomeria and
Sequoia. Marcoduria is characterised by thick spongy
roots and associated with dry periods (Schneider, 1969,
1978, 1992).
Vegetation studies (Mai, 2000) of the leaf flora in
particular suggest that a floral complex of the bWiesaQtype prevailed over this region under a subtropical/
warm temperate humid, seasonal climate similar to
those growing today in the evergreen broad leaved
forests of Changsa and Hunan in China. The mean
annual temperature is estimated as being at least 18 8C,with an average coldest month temperature of +4 8C,an absolute minimum temperature dropping to �5 8C,and a mean annual precipitation of 800–2000 mm with
few to no dry periods during the summer months (Mai,
2000). There are no lithological differences between
the localities and the prevailing climate remained con-
stant over this geological time period. Fluctuations in
the water table, however, had an effect on the nutrient
availability. The underlying clay layers are nutrient
rich indicating a flood plain environment dominated
by forest, rather than woodland vegetation, which is in
accordance with the in situ fossil plants found (Schnei-
der, 1969, 1992).
2.2. Analyses
The autochthonous fossil wood samples, 21 conifers
and 1 angiosperm, were collected from different coal
seams of clearly determined facies (Table 1). No sam-
ples were collected near the erosional settings known to
occur in these localities (Gothel, 2002).
2.2.1. Anatomical analyses
The material was identified by preparing tangential
and longitudinal sections of all samples using razor
blades and subsequently mounted in glycerine jelly
and studied under transmitted light microscopy. One
specimen (120701/28) was identified as an angiosperm
(Symplocoxylon krauselii) and the remainder were con-
ifers (see Table 1 and Dolezych, 2005).
2.2.2. Molecular analyses
The molecular composition of the woods was deter-
mined using the technique of van Bergen and Poole
(2002) and Poole and van Bergen (2002). In all cases
the wood studied comprised samples from trunk or
large branch wood each containing several growth
rings and thereby reducing small-scale intra-tree chem-
ical and isotopic variations. The material was powdered
and solvent extracted using methanol (3�), methanol/
dichloromethane (3�) and dichloromethane (3�). Aftereach extraction step the sample was centrifuged and the
supernatant removed. The final solvent extracted resi-

Table 1
Fossil wood specimens studied along with their taxonomic assignment and relative abundances of cellulose products (SP), lignin products (LP) and lignin degradation products (LDP), expressed as a
percentage, and associated d13Cfossil wood, d13Clevoglucosan and d13Cbiomass arranged from the top of Bank 1 to the underlying clay
Sample no. Locality %SP %LP %LDP d13Cfossil wood d13Clevogluc. d13Cbiomassa Taxonomic affinity Nearest living equivalent
31799 Welzow 1M 97 3.5 0.5 �22.2 �17.1 �23.6 Taxodioxylon gypsaceum Sequoia sempervirens
280502/18 Welzow 1M 98 1.5 0.5 �21.7 ND �23.1 Pinuxylon zobelianum Pinus section cembrae
120701/24 Welzow 1M 90 9 1 �22.6 �21.4 �23.7 Pinuxylon tarnocviense Pinus section strobus
120701/27 Welzow 1P 65 34 1 �25.6 �24.9 �25.5 Pinuxylon parryoides Pinus section parrya
120701/28 Welzow 1P 25 45 30 �27.3 �24.1 �25.7 Symplocoxylon kraeuselii Symplocos sp.
120701/36 Welzow 1A 95 3 2 �23.6 �22.0 �24.9 Taxodioxylon gypsaceum Sequoia sempervirens
120701/188 Welzow 1K 95 4 1 �22.4 ND �23.7 Glyptostroboxylon rudolphii Glyptostrobus sp.
280502/39 Welzow 1K 98 1 1 �22.1 �20.1 �23.5 Glyptostroboxylon rudolphii Glyptostrobus sp.
280502/9 Welzow 1K 98 2 0 �22.0 �24.0 �23.4 Juniperoxylon pachyderma Taxodiaceae cf.
120701/49 Welzow 2M 95 4 1 �24.4 �19.9 �25.7 Pinuxylon parryoides Pinus section parrya
120701/121 Welzow 2K 98 1.5 0.5 �22.5 �21.1 �23.9 Taxodioxylon germanicum Sequoia sempervirens
291001/25 Janschwalde 2K 90 8 2 �23.5 �12.5 �24.6 Glyptostroboxylon rudolphii Glyptostrobus sp.
291001/47 Janschwalde 2K 50 35 15 �23.7 �15.4 �23.1 Taxodioxylon gypsaceum Sequoia sempervirens
301001/236 Janschwalde 2K 95 4 1 �22.4 �21.6 �23.7 Taxodioxylon germanicum Sequoia sempervirens
120701/130 Welzow 3P 30 40 30 �25.4 �20.8 �24.0 Pinuxylon parryoides Pinus section parrya
301001/285 Janschwalde 3P 5 65 30 �24.1 �15.0 �21.6 Pinuxylon parryoides Pinus section parrya
120701/147 Welzow 3K 5 45 50 �23.3 �9.8 �21.0 Glyptostroboxylon rudolphii Glyptostrobus sp.
130302/218 Welzow 3K 0 30 70 �24.8 ND �22.5 Glyptostroboxylon rudolphii Glyptostrobus sp.
301001/265 Janschwalde 3K 2 49 49 �23.0 �3.3b �20.6 Taxodioxylon germanicum Sequoia sempervirens
301001/246 Janschwalde 3K 5 60 35 �23.7 �20.6 �21.3 Glyptostroboxylon rudolphii Glyptostrobus sp.
MD1 Wetro Clay 95 3.5 1.5 �23.2 �19.4 �24.5 Taxodioxylon gypsaceum Sequoia sempervirens
MD2 Wetro Clay 95 3.5 1.5 �23.1 �25.6 �24.4 Taxodioxylon gypsaceum Sequoia sempervirens
ND, not determined.a d13 Cbiomass is based on d13 Cfossil wood but corrected for its chemical composition (see Eq. (1)).b Value might be affected by the low relative abundance of levoglucosan in this sample.
I.Poole
etal./Palaeogeography,Palaeoclim
atology,Palaeoeco
logy236(2006)345–354
348

I. Poole et al. / Palaeogeography, Palaeoclimatology, Palaeoecology 236 (2006) 345–354 349
due was air-dried. All residues, containing the insoluble
organic matter representing the bulk of the wood, were
stored dry in the dark. Approximately 300 mg of each
sample was subject to off-line pyrolysis (1 h, 300 8C)and the pyrolysis products released were collected
using a cold trap. These products were derivatised
using an excess of N,O-bis(trimethylsilyl)-trifluoroace-
tamide containing 1% trimethylchlorosilane (BSTFA+
1% TMCS) and pyridine and analysed using a Hewlett-
Packard (HP, Wilmington, DE, USA) 6890 gas chro-
matograph (GC) (see Poole and van Bergen, 2002 for
details). Derivatised compounds were identified using a
HP 5890 series II GC coupled to a Fisons Instruments
VG platform II mass spectrometer (GC/MS; Manche-
ster, UK). Identification was based on mass spectral
characteristics and data presented in the literature
(Poole and van Bergen, 2002). The holocellulose-,
lignin- and lignin degradation products were derived
from the relative intensities of each product on the GC
chromatogram.
2.2.3. Stable carbon isotope analysis and corrections
On-line bulk stable carbon isotope (d13Cfossil wood)
analyses were performed on the extracted wood mate-
rial using a Fisons Instruments NA 1500 Elemental
Analyser (EA). The CO2 released was flushed through
the ConFlo II interface and analysed using a Finningan
MAT Delta Plus isotope ratio mass spectrometer
(IRMS).
Corrected biomass and palaeoatmospheric d13C
values were obtained using measured d13Cfossil wood
value and the relative abundances of the preserved
molecular components (Poole et al., 2004) according
to the following equations:
corrected d13Cbiomass
¼ d13Cbulk wood � %SP� þ 1:5ð Þ þ %LP� � 3ð Þ þ %LDP� � 2ð Þ½ �100
ð1ÞWhere %SP denotes the relative abundance of the
cellulose products, LP of lignin products and LDP
lignin degradation products; +1.5 is the fractionation
factor for cellulose (Leavitt and Long, 1986; Sass-
Klaassen et al., 2004; assuming little hemicellulose
contribution to the total holocellulose fraction pre-
served), �3 is the fractionation factor for lignin (Spiker
and Hatcher, 1987) and �2 is the fractionation factor
for lignin plus subsequent degradation (i.e. demethox-
ylation; Galimov, 1985; Spiker and Hatcher, 1987; see
Poole et al., 2004 for details).
d13Catmosphere ¼ corrected d13Cbiomass þ 18 ð2Þ
Where 18 is the average fractionation factor for plant
material derived from Polley et al. (1993), Arens et al.
(2000) and Grocke (2002) (see Poole et al., 2004 for
further details). Again it is emphasised that the 18x is a
first average approximation that can be refined when
more detailed studies have been undertaken using well-
defined sample sets. Also a difference in fractionation
factor between angiosperms and gymnosperms is
known (Stuiver and Braziunas, 1987). However, the
set of samples used contained only one angiosperm
wood specimen, thereby minimizing this taxonomic
effect.
2.2.4. Compound specific stable carbon isotope
analysis
The derivatised compounds released during off-line
pyrolysis were subsequently analysed for their stable
carbon isotope composition (Poole et al., 2004).
Compound specific stable carbon isotope values
were measured using a ThermoFinigan Delta PLUS
XL GC-combustion-IRMS with similar chromatograph-
ic conditions as the GC/MS analysis. Only the values of
levoglucosan, the main pyrolysis product of cellulose,
are presented. Values represent averages of two analyses
with analytical errors typically b0.8x based on stan-
dards. Corrections for the TMS groups were determined
from derivatised myo-inisitol with an underivitised d13C
value of �26.7x.
3. Results and discussion
3.1. Anatomical and molecular preservation
From microscopy studies, Bank 1 yielded the best
preserved material whereas Bank 3 was the least well
preserved evidenced by the relative amount of decay
having affected the anatomy and morphology. Within
Bank 3 the fungal and bacterial decay have resulted in
the characteristic yellowing of the wood or bGelbfauleQ.The Taxodiaceae are the most resistant to this decay but
even within the Taxodiaceae the K-facies material
shows the greatest evidence for decay whereas the M-
facies exhibits the least affected material.
Wood contains approximated 90% to 96% solvent
insoluble ligno-cellulose with the remainder being sol-
vent soluble compounds such as lipids, resins, oils etc.
The average holocellulose and lignin contribution to
modern ligno-celullose is approx. 65% and 35%, respec-
tively (Sarkanen and Ludwig, 1971). When correcting
for the effects of chemical taphonomy on the molecular
composition of the fossil wood a holocellulose : lignin
ratio of c. 65 :35 yields a corrected value, d13Cbiomass,
I. Poole et al. / Palaeogeography, Palaeoclimatology, Palaeoecology 236 (2006) 345–354350
almost identical to the measured d13Cfossil wood value
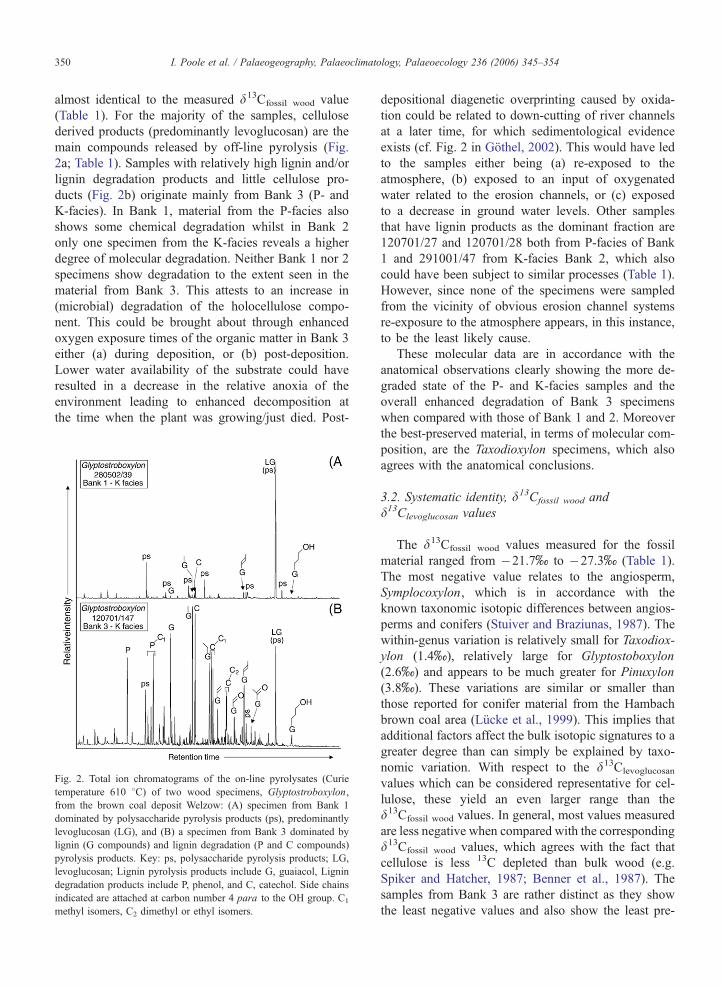
(Table 1). For the majority of the samples, cellulose
derived products (predominantly levoglucosan) are the
main compounds released by off-line pyrolysis (Fig.
2a; Table 1). Samples with relatively high lignin and/or
lignin degradation products and little cellulose pro-
ducts (Fig. 2b) originate mainly from Bank 3 (P- and
K-facies). In Bank 1, material from the P-facies also
shows some chemical degradation whilst in Bank 2
only one specimen from the K-facies reveals a higher
degree of molecular degradation. Neither Bank 1 nor 2
specimens show degradation to the extent seen in the
material from Bank 3. This attests to an increase in
(microbial) degradation of the holocellulose compo-
nent. This could be brought about through enhanced
oxygen exposure times of the organic matter in Bank 3
either (a) during deposition, or (b) post-deposition.
Lower water availability of the substrate could have
resulted in a decrease in the relative anoxia of the
environment leading to enhanced decomposition at
the time when the plant was growing/just died. Post-
Fig. 2. Total ion chromatograms of the on-line pyrolysates (Curie
temperature 610 8C) of two wood specimens, Glyptostroboxylon,
from the brown coal deposit Welzow: (A) specimen from Bank 1
dominated by polysaccharide pyrolysis products (ps), predominantly
levoglucosan (LG), and (B) a specimen from Bank 3 dominated by
lignin (G compounds) and lignin degradation (P and C compounds)
pyrolysis products. Key: ps, polysaccharide pyrolysis products; LG,
levoglucosan; Lignin pyrolysis products include G, guaiacol, Lignin
degradation products include P, phenol, and C, catechol. Side chains
indicated are attached at carbon number 4 para to the OH group. C1
methyl isomers, C2 dimethyl or ethyl isomers.
depositional diagenetic overprinting caused by oxida-
tion could be related to down-cutting of river channels
at a later time, for which sedimentological evidence
exists (cf. Fig. 2 in Gothel, 2002). This would have led
to the samples either being (a) re-exposed to the
atmosphere, (b) exposed to an input of oxygenated
water related to the erosion channels, or (c) exposed
to a decrease in ground water levels. Other samples
that have lignin products as the dominant fraction are
120701/27 and 120701/28 both from P-facies of Bank
1 and 291001/47 from K-facies Bank 2, which also
could have been subject to similar processes (Table 1).
However, since none of the specimens were sampled
from the vicinity of obvious erosion channel systems
re-exposure to the atmosphere appears, in this instance,
to be the least likely cause.
These molecular data are in accordance with the
anatomical observations clearly showing the more de-
graded state of the P- and K-facies samples and the
overall enhanced degradation of Bank 3 specimens
when compared with those of Bank 1 and 2. Moreover
the best-preserved material, in terms of molecular com-
position, are the Taxodioxylon specimens, which also
agrees with the anatomical conclusions.
3.2. Systematic identity, d13Cfossil wood and
d13Clevoglucosan values
The d13Cfossil wood values measured for the fossil
material ranged from �21.7x to �27.3x (Table 1).
The most negative value relates to the angiosperm,
Symplocoxylon, which is in accordance with the
known taxonomic isotopic differences between angios-
perms and conifers (Stuiver and Braziunas, 1987). The
within-genus variation is relatively small for Taxodiox-
ylon (1.4x), relatively large for Glyptostoboxylon
(2.6x) and appears to be much greater for Pinuxylon
(3.8x). These variations are similar or smaller than
those reported for conifer material from the Hambach
brown coal area (Lucke et al., 1999). This implies that
additional factors affect the bulk isotopic signatures to a
greater degree than can simply be explained by taxo-
nomic variation. With respect to the d13Clevoglucosan
values which can be considered representative for cel-
lulose, these yield an even larger range than the
d13Cfossil wood values. In general, most values measured
are less negative when compared with the corresponding
d13Cfossil wood values, which agrees with the fact that
cellulose is less 13C depleted than bulk wood (e.g.
Spiker and Hatcher, 1987; Benner et al., 1987). The
samples from Bank 3 are rather distinct as they show
the least negative values and also show the least pre-

Fig. 3. The relative stratigraphic sequence of the samples and their corrected d13Cbiomass value and the derived d13Catmosphere value. Markers plotted represent the average value of all samples from
the same facies from the same site.
I.Poole
etal./Palaeogeography,Palaeoclim
atology,Palaeoeco
logy236(2006)345–354
351
I. Poole et al. / Palaeogeography, Palaeoclimatology, Palaeoecology 236 (2006) 345–354352
served cellulose. This therefore indicates that the lignin
formed during this period must be particularly 13C
enriched in contrast to baverageQ lignin, which is gen-
erally more 13C depleted.
3.3. d13Cbiomass values
The d13Cfossil wood values obtained for each specimen
were corrected according to Eq. (1) above to take into
account molecular differences. In principle the cor-
rected values, yielding d13Cbiomass (Table 1; Fig. 3),
provide more representative bulk wood signatures
for the original living plant material than those
measured because of the effect of chemical taphon-
omy, i.e. a chemical composition similar to normal
ligno-cellulose will yield d13Cbiomass6d13Cfossil wood
whereas fossil woods dominated by lignin will yield
d13CbiomassNd13Cfossil wood.
The most complete section is within Bank 1. After
correcting for the effects of chemical taphonomy the
samples from equivalent facies show similar d13C
values that seem to imply facies related differences.
Even though Banks 2 and 3 are not as complete,
within-facies consistencies are also observed in these
Banks.
Nutrient levels are known to affect the bulk d13Cvalues of plant material (Huang et al., 1999). That
research showed that increased nitrogen levels resulted
in a 13C enrichment in Betula pendula seedlings. The
succession of decreasing nutrients from K-facies
through to M-facies of Bank 1 of the Welzow locality
resulted in more 13C depleted values for the samples
from K- through to P-facies — an equivalent trend to
that observed by Huang et al. (1999).
The trend to more depleted values through the suc-
cession is also observed in Banks 2 and 3 of the
Welzow locality. However, the M-facies of Bank 1,
supposedly the most nutrient poor facies (Dolezych,
2005), exhibits less depleted values relative to the
underlying P-facies. The reason for this is as yet un-
clear. In the Janschwalde and Welzow localities the
corrected isotopic values of both Banks 1 and 2 are,
in general, very similar. In contrast, despite the domi-
nance of the isotopically depleted lignin component,
Bank 3 yields notably 13C enriched corrected values,
suggesting a difference in environment and/or atmo-
sphere when compared with Banks 1 and 2. These more
enriched values in d13Cbiomass are to a larger extent also
mirrored in the d13Clevoglucosan values (Table 1) under-
pinning the true change to less depleted values in the
organic matter of these trees at the time they actually
grew.
In Bank 3 of Janschwalde locality there is no obvi-
ous indication of a nutrient related trend hence only
atmosphere or environmental factors will have affected
the values. The environment could have been subject to
changes, for example fluctuations in water table and
thus could have affected the water availability of the
trees. Enhanced water use efficiency normally yields
more 13C enriched biomass. However, it has been
implied that the environmental factors remained con-
stant which discounts this suggestion (Krutzsch, 1992;
Mai, 2000; Schneider, 1992). We are aware that the
absolute changes in d13C are relatively small and within
the natural within tree variation. However, the distinct
off-set of approximately 3x for 5 of the 6 samples
from Bank 3 does appear to imply a trend. Thus we
believe that the most the likely explanation is a change
in atmospheric 13C / 12C ratio (see below).
3.4. d13Catmosphere values
When the d13C of the atmosphere is calculated using
Eq. (2) it is not surprising that fluctuations identical to
those exhibited by d13Cbiomass are observed. Within
Banks 1 and 2 the shifts in the d13Catmosphere curve
are likely to be environmentally related thus rendering
the perceived atmospheric trend nutrient dependent
since Eq. (2) is directly dependent upon Eq. (1). How-
ever, in Bank 3 no direct evidence of an environmen-
tally related shift is observed. Thus the 3x enrichment
in d13Catmosphere when compared with Banks 1 and 2
appears to represent a shift in the atmospheric d13C.
This shift is in accordance with a change from less to
more depleted d13C values as observed in the marine
d13Ccarbonate curves spanning the Lower to Middle
Miocene (e.g. Woodruff and Savin, 1991; Pagani et
al., 1999). Once again we would like to emphasise
that these observations are a first approximation indi-
cating a trend in the d13Catmosphere values. Further
studies on fossil wood specimens from the same region
within the same time interval will validate our initial
observations.
4. Conclusions
For many years bulk stable carbon isotopes of or-
ganic matter have been used to determine carbon flow
in the biogeosphere. This in turn has been instrumental
in revealing shifts in the d13C of the atmosphere, a
factor often associated with changes in atmospheric
CO2 both in the present and during the geological
past. This study has focused on the use of d13Cbulk
values of wood through a time- and sedimentologically

I. Poole et al. / Palaeogeography, Palaeoclimatology, Palaeoecology 236 (2006) 345–354 353
constrained sequences where any changes in d13Cbulk
wood can be related to changes in the environment. By
eliminating the biases associated with chemical taphon-
omy, whereby certain moieties with the own isotopic
signature are preferentially lost over time, real, as op-
posed to perceived, shifts in d13Cbiomass could be de-
termined. By understanding the sedimentological and
botanical inputs associated with these sections per-
ceived changes in d13Catmosphere derived from d13Cbulk
can be linked to nutrient availability within the envi-
ronment for two of the Banks but seems to reveal a
directional trend in the atmospheric d13C during the
time of deposition of the underlying Bank 3. Therefore,
chemical preservation and taxonomic identity of fossil
material are important prerequisites to understanding
real, as opposed to perceived, isotopic shifts and such
shifts can provide further details pertaining to the ecol-
ogy during the geological past.
Acknowledgements
We would like to thank T. Zalm, G. Nobbe, B. van
Os, A. van Dijk and M. Kienhuis for technical assis-
tance. Three anonymous reviewers are thanked for their
comments on earlier versions of this manuscript. This
work was funded in part by NWO grant number ALW/
809.32.004 which is greatly appreciated.
References
Arens, N.C., Jahren, A.H., Amundson, R., 2000. Can C3 plants
faithfully record the carbon isotopic composition of atmospheric
carbon dioxide? Paleobiology 26, 137–164.
Benner, R., Fogel, M.L., Sprague, E.K., Hodson, R.E., 1987. Deple-
tion of 13C in lignin and its implications for stable isotope studies.
Nature 329, 708–710.
Berggren, W.A., Kent, D.V., Swisher, C.C., Aubry, M.-P., 1995. A
revised Cenozoic geochronology and chronostratigraphy. In:
Berggren, W.A., Kent, D.V., Aubry, M.-P., Hardenbol, J. (Eds.),
Geochronology, Time Scales and Global Stratigraphic Correla-
tion, Society for Sedimentary Geology, vol. 54, pp. 129–212.
Tulsa.
Dolezych, M. 2005. Koniferenholzer im 2. Miozanen Lausitzer Floz
und ihre Hkologische Position. LPP Contributions Series No. 19,
PhD thesis, Utrecht University. 339 pp.
Farquhar, G.D., Ehleringer, J.R., Hubick, K.T., 1989. Carbon isotope
discrimination and photosynthesis. Annu. Rev. Plant Physiol.
Plant Mol. Biol. 40, 503–537.
Galimov, E.M., 1985. The Biological Fractionation of Isotopes. Ac-
ademic Press, Orlando.
Gothel, M., 2002. Die Seese Sande des Mittel-Miozans der Lausitz —
Ablagerungen einer Tsunami? Natur. Landsch. Niederlausitz 22,
1–8.
Grocke, D.R., 2002. The carbon isotope composition of ancient CO2
based on higher-plant organic matter. Philos. Trans. R. Soc. Lond.,
A 360, 633–658.
Haq, B.U., Hardenbol, J., Vail, P.R., 1988. Mesozoic and Cenozoic
chronostratigraphy and cycles of sea-level change. In: Wilgus,
C.K., Hastings, B.S., Ross, C.A., Posamentier, H., Wagoner, J.,
Kendall, C.G.C. (Eds.), Sea-Level Changes: An Integrated Ap-
proach, Soc. Economic Paleontol. Mineral. Spec. Pub., vol. 42,
pp. 71–108.
Hedges, J.I., Cowie, G.L., Ertel, J.R., Barbour, R.J., Hatcher, P.G.,
1985. Degradation of carbohydrates and lignins in buried woods.
Geochim. Cosmochim. Acta 49, 701–711.
Huang, Y., Eglinton, G., Ineson, P., Bol, R., Harkness, D., 1999. The
effects of nitrogen fertilisation and elevated CO2 on the lipid
biosynthesis and carbon isotopic discrimination in birch seedlings
(Betula pendula). Plant Soil 216, 35–45.
Krutzsch, W., 1992. Palaobotanische Klimagliederung des Alttertiars
(Mitteleozan bis Oberoligozan) in Mitteldeutschland und das
Problem der Verknupfung mariner und kontinentaler Gliederun-
gen (klassische Biostratigraphien — palaobotanisch-okologische
Klimastratigraphie — Evolutions-Stratigraphie der Vertebraten).
N. Jb. Geol. Palaont. Abh. 186 (1–2), 137–253.
Krutzsch, W., 2000. Stratigraphische Tabelle Oberoligozan und Neo-
gen (marin-kontinental). Berliner Geowiss. Abh. E 34, 153–165.
Leavitt, S.W., Long, A., 1986. Stable carbon isotope variability in tree
foliage and wood. Ecology 67, 1002–1010.
Loader, N.J., Robertson, I., McCarroll, D., 2003. Comparison of
stable carbon isotope ratios in the whole wood, cellulose and
lignin of oak tree-rings. Palaeogeog. Palaeoclimatol. Palaeoecol.
196, 395–407.
Lucke, A., Helle, G., Schleser, G.H., Figueiral, I., Mosbrugger, V.,
Jones, T.P., Rowe, N.P., 1999. Environmental history of the
German Lower Rhine embayment during the Middle Miocene
as reflected by carbon isotopes in brown coal. Palaeogeog. Palaeo-
climatol. Palaeoecol. 154, 339–352.
Mai, D.H., 2000. Die untermiozanen Floren aus der Spremberger
Folge und dem 2. Flozhorizont in der Lausitz Teil IV: Fundstellen
und Palaobiologie. — Palaeont. Abt. B 254, 65–176.
Nguyen Tu, T.T., Bocherens, H., Mariotti, A., Baudin, F., Pons, D.,
Broutin, J., Derenne, S., Largeau, C., 1999. Ecological distribu-
tion of Cenomanian terrestrial plants based on 13C/12C ratios.
Palaeogeog. Palaeoclimatol. Palaeoecol. 145, 79–93.
Nguyen Tu, T.T., Kvacek, J., Ulicny, D., Bocherens, H., Mariotti, A.,
Broutin, J., 2002. Isotope reconstruction of plant palaeoecology.
Case study of Cenomanian floras from Bohemia. Palaeogeog.
Palaeoclimatol. Palaeoecol. 183, 43–70.
Nguyen Tu, T.T., Kurschner, W.M., Schouten, S., van Bergen, P.F.,
2004. Leaf carbon isotope composition of fossil and extant oaks
grown under differing atmospheric CO2 levels. Palaeogeog.
Palaeoclimatol. Palaeoecol. 212, 199–213.
O’Leary, M., 1981. Carbon isotope fractionation in plants. Phyto-
chemistry 20, 553–567.
Pagani, M., Artur, M.A., Freeman, K.H., 1999. Miocene evolution of
atmospheric carbon dioxide. Paleoceanography 14, 273–292.
Polley, H.W.M., Johnson, H.B., Marino, B.D., Mayeux, H.S., 1993.
Increase in C3 plant water-use efficiency and biomass over glacial
to present CO2 concentrations. Nature 361, 61–64.
Poole, I., van Bergen, P.F., 2002. Carbon isotope ratio analysis of
organic moieties from fossil mummified wood: establishing opti-
mum conditions for off-line pyrolysis extraction using GC/MS.
Rapid Commun. Mass Spectrom. 16, 1–6.
Poole, I., van Bergen, P.F., Kool, J., Schouten, S., Cantrill, D.J., 2004.
Molecular isotopic heterogeneity of fossil organic matter: impli-
cations for d13Cbiomass and d13Cpalaeoatmosphere proxies. Org. Geo-
chem. 35, 1261–1274.

I. Poole et al. / Palaeogeography, Palaeoclimatology, Palaeoecology 236 (2006) 345–354354
Sarkanen, K.V., Ludwig, C.H. (Eds.), 1971. Lignins. Occurrence,
Formation, Structure and Reactions. Wiley-Interscience, New
York.
Sass-Klaassen, U., Poole, I., Wils, T., Helle, G., Schleser, G.H., van
Bergen, P.F., 2004. The use of stable isotope dendrochronology
for environmental interpretations from growth ring patterns in
subfossil bog oaks. IAWA J. 26, 121–136.
Schneider, W., 1969. Cuticulae dispersae aus dem 2. Lausitzer Floz
(Miozan) und ihre fazielle Aussage. Freiberg. Forsch.-H. C 222,
1–75.
Schneider, W., 1978. Zu einigen Gesetzmaßigkeiten der faziellen
Entwicklung im 2. Lausitzer Floz. Z. angew. Geol. 24, 125–130.
Schneider, W., 1992. Floral successions in Miocene swamps and bogs
of Central Europe. Z. Geol. Wiss. 20, 555–570.
Smith, B.N., Epstein, S., 1971. Two categories of 13C/12C ratios for
higher plants. Plant Physiol. 47, 380–384.
Spiker, E.C., Hatcher, P.G., 1987. The effects of early diagenesis on
the chemical and stable carbon isotopic composition of wood.
Geochim. Cosmochim. Acta 51, 1385–1391.
Standke, G., Rascher, J., Strauss, C., 1992. Relative sea-level fluctua-
tions and brown coal formation around the Early–Middle Miocene
boundary in the Lusatian Brown Coal District. Geol. Rundsch. 82,
295–305.
Stuiver, M., Braziunas, T.F., 1987. Tree cellulose 13C/12C isotope
ratios and climate change. Nature 328, 58–60.
van Bergen, P.F., Poole, I., 2002. Stable carbon isotopes of wood: a
clue to palaeoclimate? Palaeogeog. Palaeoclimatol. Palaeoecol.
180, 31–45.
van Bergen, P.F., Collinson, M.E., Hatcher, P.G., de Leeuw, J.W.,
1994. Lithological control on the state of preservation of fossil
seed coats of water plants. Org. Geochem. 22, 683–702.
van Bergen, P.F., Blokker, P., Collinson, M.E., Sinninghe
Damste, J.S., de Leeuw, J.W., 2004. Structural biomacromo-
lecules in plants: what can be learnt from the fossil record?
In: Hemsley, A.R., Poole, I. (Eds.), Evolution of Plant Physiology,
Linnean Society Symposium Series, vol. 21. Elsevier, Amster-
dam, pp. 133–154.
Woodruff, F., Savin, S.M., 1991. Mid-Miocene isotope stratigraphy in
the deep-sea: high resolution correlations, paleoclimatic cycles,
and sediment preservation. Paleoceanography 6, 755–806.