Mechanical properties of the most common European woods
26
B. Bartolucci et alii, Frattura ed Integrità Strutturale, 54 (2020) 249-274; DOI: 10.3221/IGF-ESIS.54.18 249 Mechanical properties of the most common European woods: a literature review Beatrice Bartolucci Sapienza University of Rome, Italy [email protected], https://orcid.org/0000-0003-2064-5917 Andrea De Rosa University Federico II, Naples, Italy [email protected], http://orcid.org/0000-0001-7548-0254 Chiara Bertolin*, Filippo Berto Norwegian University of Science and Technology, Trondheim, Norway [email protected], https://orcid.org/0000-0002-0684-8980 [email protected], Francesco Penta University Federico II, Naples, Italy [email protected], https://orcid.org/0000-0002-4338-5444 Anna Maria Siani Sapienza University of Rome, Italy [email protected], https://orcid.org/0000-0001-7435-1426 ABSTRACT. Wood is an orthotropic material used since ancient time. A literature research about the mechanical properties of density, fracture toughness, modulus of elasticity, and Poisson’s ratio has been done to have a broader view on the subject. The publications relating to the topic were found through the two search engines Scopus and Google Scholar that have yielded several papers, including articles and book sections. In general, there is no standardization on the method of analysis carried out on wood, underlining the great difficulty in studying this complex material. The parameter of density has a great variability and needs a deeper investigation; fracture toughness is not always available in literature, not even in the different directions of the wood sample. Interesting is the modulus of elasticity, which provides a correlation with density, especially in longitudinal section but, again, it needs to be studied in detail. The parameter of Poisson’s ratio is provided as single values in three different directions, but mainly for softwood. All the parameters require a more in-depth study for both softwood and hardwood. Furthermore, the type of analysis, whether experimental or modelling, needs to be standardized to have more comparable results. Citation: Bartolucci, B., De Rosa, A., Bertolini, C., Berto, F., Penta, F., Siani, A.M.., Mechanical properties of the most common European woods: a literature review, Frattura ed Integrità Strutturale, 54 (2020) 249-274. Received: 28.08.2020 Accepted: 06.09.2020 Published: 01.10.2020 Copyright: © 2020 This is an open access article under the terms of the CC-BY 4.0, which permits unrestricted use, distribution, and reproduction in any medium, provided the original author and source are credited.
-
Upload
khangminh22 -
Category
Documents
-
view
2 -
download
0
Transcript of Mechanical properties of the most common European woods
B. Bartolucci et alii, Frattura ed Integrità Strutturale, 54 (2020) 249-274; DOI: 10.3221/IGF-ESIS.54.18
249
Mechanical properties of the most common European woods: a literature review Beatrice Bartolucci Sapienza University of Rome, Italy [email protected], https://orcid.org/0000-0003-2064-5917 Andrea De Rosa University Federico II, Naples, Italy [email protected], http://orcid.org/0000-0001-7548-0254 Chiara Bertolin*, Filippo Berto Norwegian University of Science and Technology, Trondheim, Norway [email protected], https://orcid.org/0000-0002-0684-8980 [email protected], Francesco Penta University Federico II, Naples, Italy [email protected], https://orcid.org/0000-0002-4338-5444 Anna Maria Siani Sapienza University of Rome, Italy [email protected], https://orcid.org/0000-0001-7435-1426 ABSTRACT. Wood is an orthotropic material used since ancient time. A literature research about the mechanical properties of density, fracture toughness, modulus of elasticity, and Poisson’s ratio has been done to have a broader view on the subject. The publications relating to the topic were found through the two search engines Scopus and Google Scholar that have yielded several papers, including articles and book sections. In general, there is no standardization on the method of analysis carried out on wood, underlining the great difficulty in studying this complex material. The parameter of density has a great variability and needs a deeper investigation; fracture toughness is not always available in literature, not even in the different directions of the wood sample. Interesting is the modulus of elasticity, which provides a correlation with density, especially in longitudinal section but, again, it needs to be studied in detail. The parameter of Poisson’s ratio is provided as single values in three different directions, but mainly for softwood. All the parameters require a more in-depth study for both softwood and hardwood. Furthermore, the type of analysis, whether experimental or modelling, needs to be standardized to have more comparable results.
Citation: Bartolucci, B., De Rosa, A., Bertolini, C., Berto, F., Penta, F., Siani, A.M.., Mechanical properties of the most common European woods: a literature review, Frattura ed Integrità Strutturale, 54 (2020) 249-274. Received: 28.08.2020 Accepted: 06.09.2020 Published: 01.10.2020 Copyright: © 2020 This is an open access article under the terms of the CC-BY 4.0, which permits unrestricted use, distribution, and reproduction in any medium, provided the original author and source are credited.
B. Bartolucci et alii, Frattura ed Integrità Strutturale, 54 (2020) 249-274; DOI: 10.3221/IGF-ESIS.54.18
-250
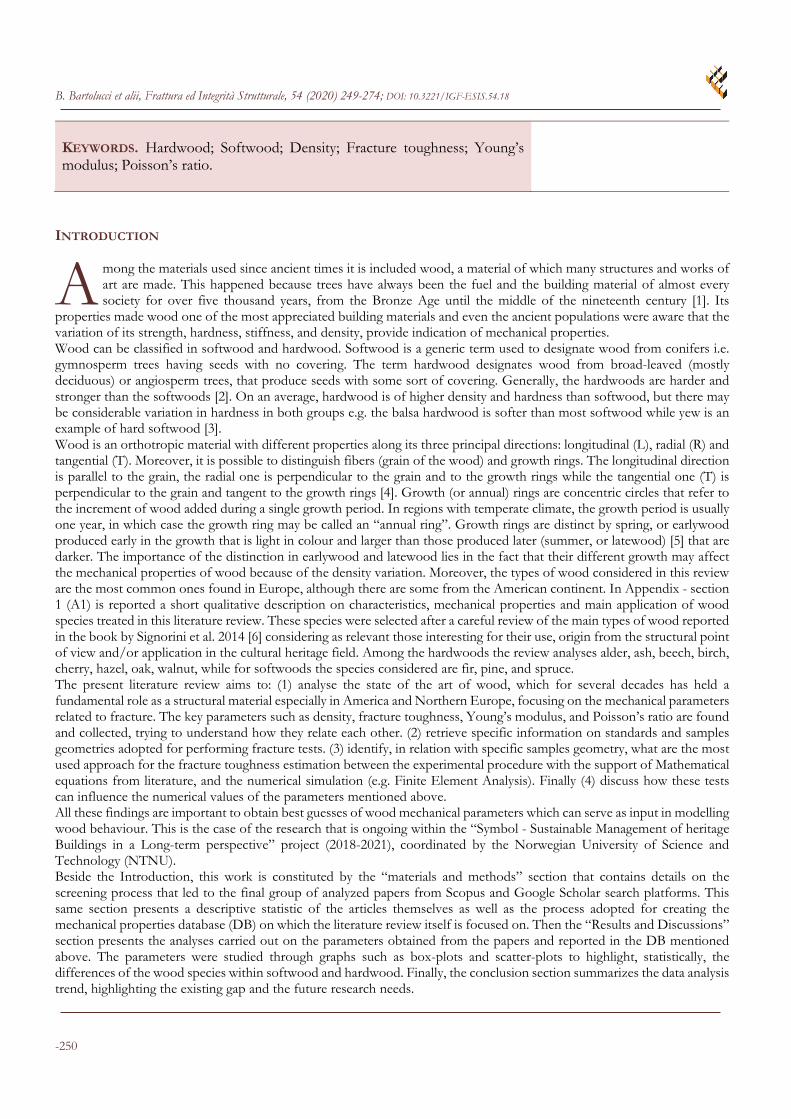
KEYWORDS. Hardwood; Softwood; Density; Fracture toughness; Young’s modulus; Poisson’s ratio.
INTRODUCTION
mong the materials used since ancient times it is included wood, a material of which many structures and works of art are made. This happened because trees have always been the fuel and the building material of almost every society for over five thousand years, from the Bronze Age until the middle of the nineteenth century [1]. Its
properties made wood one of the most appreciated building materials and even the ancient populations were aware that the variation of its strength, hardness, stiffness, and density, provide indication of mechanical properties. Wood can be classified in softwood and hardwood. Softwood is a generic term used to designate wood from conifers i.e. gymnosperm trees having seeds with no covering. The term hardwood designates wood from broad-leaved (mostly deciduous) or angiosperm trees, that produce seeds with some sort of covering. Generally, the hardwoods are harder and stronger than the softwoods [2]. On an average, hardwood is of higher density and hardness than softwood, but there may be considerable variation in hardness in both groups e.g. the balsa hardwood is softer than most softwood while yew is an example of hard softwood [3]. Wood is an orthotropic material with different properties along its three principal directions: longitudinal (L), radial (R) and tangential (T). Moreover, it is possible to distinguish fibers (grain of the wood) and growth rings. The longitudinal direction is parallel to the grain, the radial one is perpendicular to the grain and to the growth rings while the tangential one (T) is perpendicular to the grain and tangent to the growth rings [4]. Growth (or annual) rings are concentric circles that refer to the increment of wood added during a single growth period. In regions with temperate climate, the growth period is usually one year, in which case the growth ring may be called an “annual ring”. Growth rings are distinct by spring, or earlywood produced early in the growth that is light in colour and larger than those produced later (summer, or latewood) [5] that are darker. The importance of the distinction in earlywood and latewood lies in the fact that their different growth may affect the mechanical properties of wood because of the density variation. Moreover, the types of wood considered in this review are the most common ones found in Europe, although there are some from the American continent. In Appendix - section 1 (A1) is reported a short qualitative description on characteristics, mechanical properties and main application of wood species treated in this literature review. These species were selected after a careful review of the main types of wood reported in the book by Signorini et al. 2014 [6] considering as relevant those interesting for their use, origin from the structural point of view and/or application in the cultural heritage field. Among the hardwoods the review analyses alder, ash, beech, birch, cherry, hazel, oak, walnut, while for softwoods the species considered are fir, pine, and spruce. The present literature review aims to: (1) analyse the state of the art of wood, which for several decades has held a fundamental role as a structural material especially in America and Northern Europe, focusing on the mechanical parameters related to fracture. The key parameters such as density, fracture toughness, Young’s modulus, and Poisson’s ratio are found and collected, trying to understand how they relate each other. (2) retrieve specific information on standards and samples geometries adopted for performing fracture tests. (3) identify, in relation with specific samples geometry, what are the most used approach for the fracture toughness estimation between the experimental procedure with the support of Mathematical equations from literature, and the numerical simulation (e.g. Finite Element Analysis). Finally (4) discuss how these tests can influence the numerical values of the parameters mentioned above. All these findings are important to obtain best guesses of wood mechanical parameters which can serve as input in modelling wood behaviour. This is the case of the research that is ongoing within the “Symbol - Sustainable Management of heritage Buildings in a Long-term perspective” project (2018-2021), coordinated by the Norwegian University of Science and Technology (NTNU). Beside the Introduction, this work is constituted by the “materials and methods” section that contains details on the screening process that led to the final group of analyzed papers from Scopus and Google Scholar search platforms. This same section presents a descriptive statistic of the articles themselves as well as the process adopted for creating the mechanical properties database (DB) on which the literature review itself is focused on. Then the “Results and Discussions” section presents the analyses carried out on the parameters obtained from the papers and reported in the DB mentioned above. The parameters were studied through graphs such as box-plots and scatter-plots to highlight, statistically, the differences of the wood species within softwood and hardwood. Finally, the conclusion section summarizes the data analysis trend, highlighting the existing gap and the future research needs.
A
B. Bartolucci et alii, Frattura ed Integrità Strutturale, 54 (2020) 249-274; DOI: 10.3221/IGF-ESIS.54.18
251
MATERIALS AND METHODS
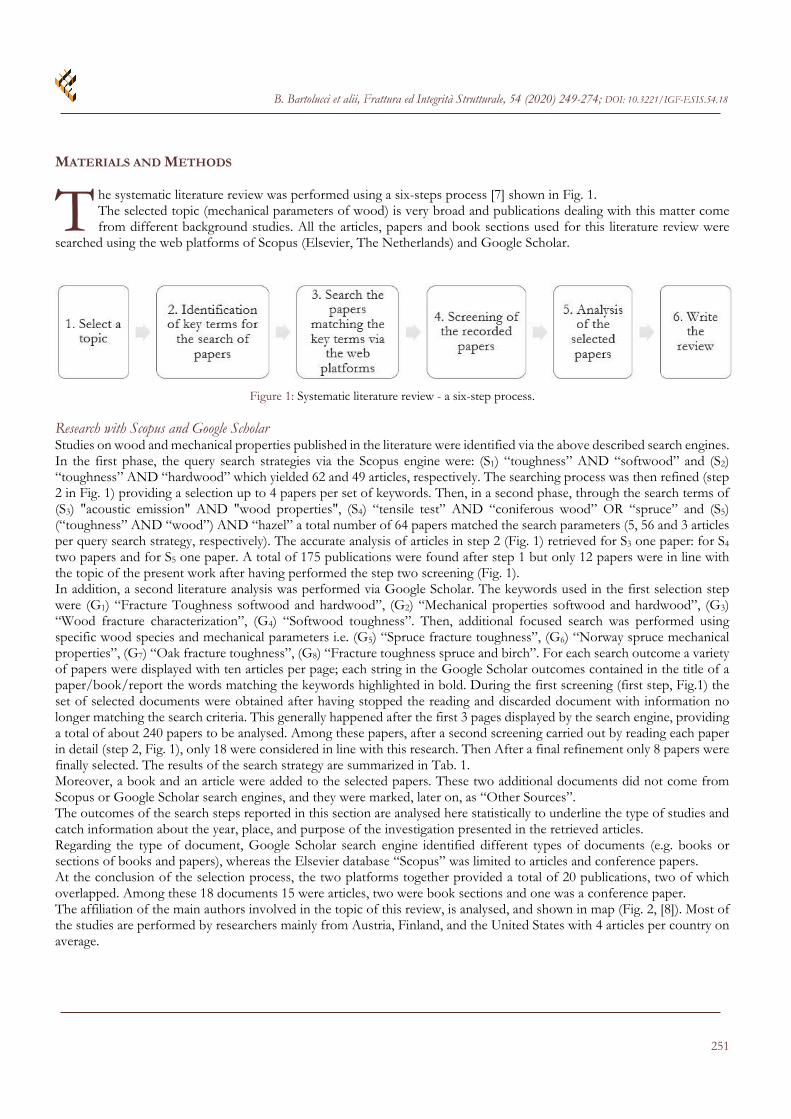
he systematic literature review was performed using a six-steps process [7] shown in Fig. 1. The selected topic (mechanical parameters of wood) is very broad and publications dealing with this matter come from different background studies. All the articles, papers and book sections used for this literature review were
searched using the web platforms of Scopus (Elsevier, The Netherlands) and Google Scholar.
Figure 1: Systematic literature review - a six-step process.
Research with Scopus and Google Scholar Studies on wood and mechanical properties published in the literature were identified via the above described search engines. In the first phase, the query search strategies via the Scopus engine were: (S1) “toughness” AND “softwood” and (S2) “toughness” AND “hardwood” which yielded 62 and 49 articles, respectively. The searching process was then refined (step 2 in Fig. 1) providing a selection up to 4 papers per set of keywords. Then, in a second phase, through the search terms of (S3) "acoustic emission" AND "wood properties", (S4) “tensile test” AND “coniferous wood” OR “spruce” and (S5) (“toughness” AND “wood”) AND “hazel” a total number of 64 papers matched the search parameters (5, 56 and 3 articles per query search strategy, respectively). The accurate analysis of articles in step 2 (Fig. 1) retrieved for S3 one paper: for S4 two papers and for S5 one paper. A total of 175 publications were found after step 1 but only 12 papers were in line with the topic of the present work after having performed the step two screening (Fig. 1). In addition, a second literature analysis was performed via Google Scholar. The keywords used in the first selection step were (G1) “Fracture Toughness softwood and hardwood”, (G2) “Mechanical properties softwood and hardwood”, (G3) “Wood fracture characterization”, (G4) “Softwood toughness”. Then, additional focused search was performed using specific wood species and mechanical parameters i.e. (G5) “Spruce fracture toughness”, (G6) “Norway spruce mechanical properties”, (G7) “Oak fracture toughness”, (G8) “Fracture toughness spruce and birch”. For each search outcome a variety of papers were displayed with ten articles per page; each string in the Google Scholar outcomes contained in the title of a paper/book/report the words matching the keywords highlighted in bold. During the first screening (first step, Fig.1) the set of selected documents were obtained after having stopped the reading and discarded document with information no longer matching the search criteria. This generally happened after the first 3 pages displayed by the search engine, providing a total of about 240 papers to be analysed. Among these papers, after a second screening carried out by reading each paper in detail (step 2, Fig. 1), only 18 were considered in line with this research. Then After a final refinement only 8 papers were finally selected. The results of the search strategy are summarized in Tab. 1. Moreover, a book and an article were added to the selected papers. These two additional documents did not come from Scopus or Google Scholar search engines, and they were marked, later on, as “Other Sources”. The outcomes of the search steps reported in this section are analysed here statistically to underline the type of studies and catch information about the year, place, and purpose of the investigation presented in the retrieved articles. Regarding the type of document, Google Scholar search engine identified different types of documents (e.g. books or sections of books and papers), whereas the Elsevier database “Scopus” was limited to articles and conference papers. At the conclusion of the selection process, the two platforms together provided a total of 20 publications, two of which overlapped. Among these 18 documents 15 were articles, two were book sections and one was a conference paper. The affiliation of the main authors involved in the topic of this review, is analysed, and shown in map (Fig. 2, [8]). Most of the studies are performed by researchers mainly from Austria, Finland, and the United States with 4 articles per country on average.
T
B. Bartolucci et alii, Frattura ed Integrità Strutturale, 54 (2020) 249-274; DOI: 10.3221/IGF-ESIS.54.18
-252
Scopus N° TOT Google Scholar N° TOT
(S1) 62 (G1) 30
(S2) 49 (G2) 30
(S3) 5 (G3) 30
(S4) 56 (G4) 30
(S5) 3 (G5) 30
(G6) 30
(G7) 30
(G8) 30
N° TOT REF N° TOT REF
12 8
Table 1: Papers research made by Scopus and Google Scholar. Table Upper Part: N° TOT refers to the total number of the papers found, after the first step application in the selection process per each keyword. Table Bottom Part: N° TOT REF refer to the total number of papers selected after the second step application in the selection process.
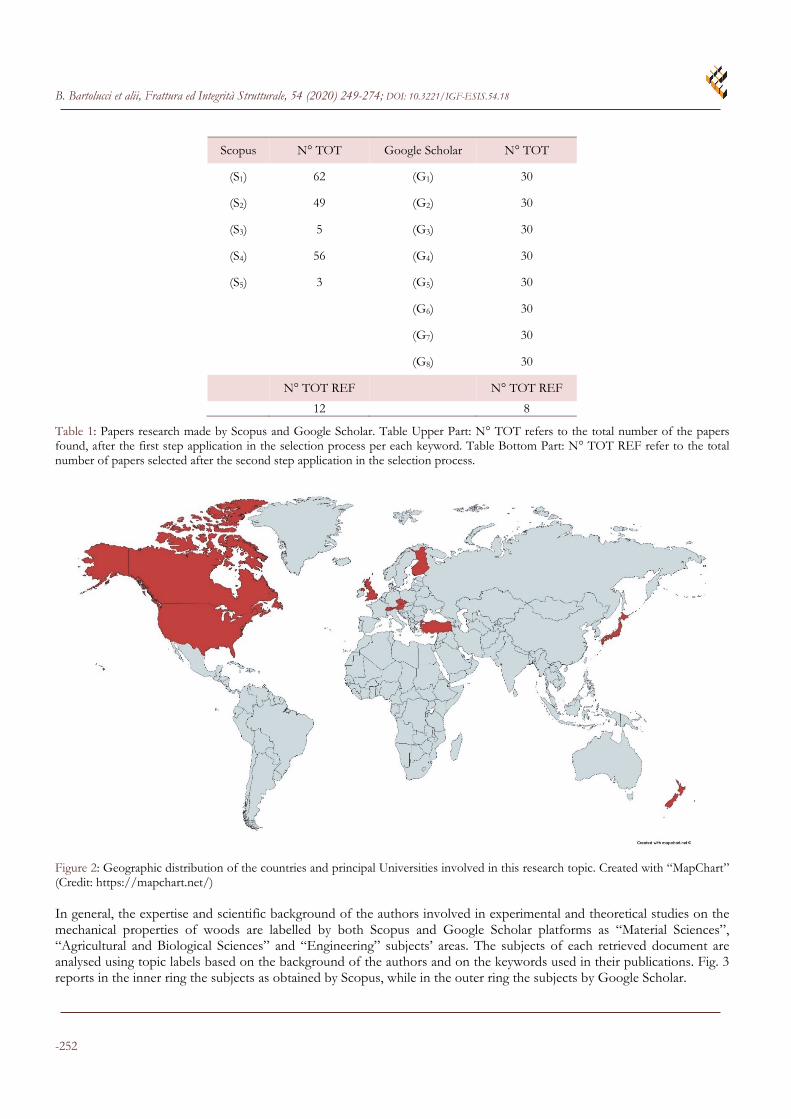
Figure 2: Geographic distribution of the countries and principal Universities involved in this research topic. Created with “MapChart” (Credit: https://mapchart.net/) In general, the expertise and scientific background of the authors involved in experimental and theoretical studies on the mechanical properties of woods are labelled by both Scopus and Google Scholar platforms as “Material Sciences”, “Agricultural and Biological Sciences” and “Engineering” subjects’ areas. The subjects of each retrieved document are analysed using topic labels based on the background of the authors and on the keywords used in their publications. Fig. 3 reports in the inner ring the subjects as obtained by Scopus, while in the outer ring the subjects by Google Scholar.
B. Bartolucci et alii, Frattura ed Integrità Strutturale, 54 (2020) 249-274; DOI: 10.3221/IGF-ESIS.54.18
253
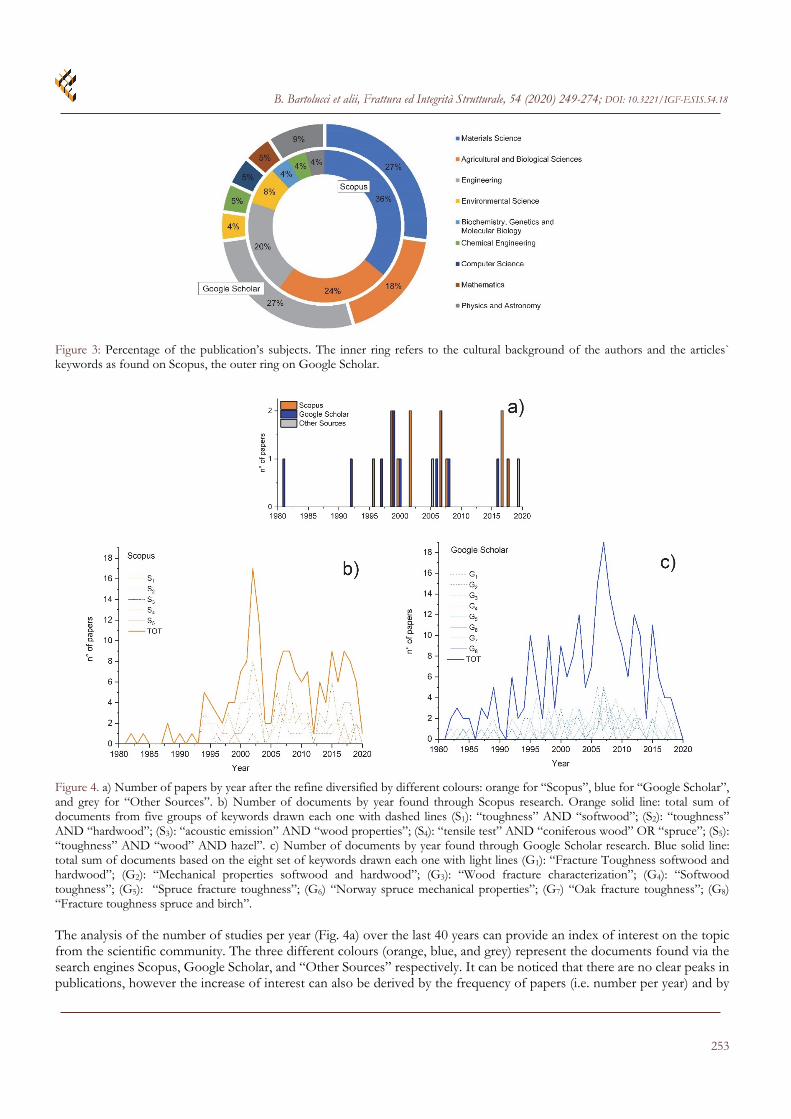
Figure 3: Percentage of the publication’s subjects. The inner ring refers to the cultural background of the authors and the articles` keywords as found on Scopus, the outer ring on Google Scholar.
Figure 4. a) Number of papers by year after the refine diversified by different colours: orange for “Scopus”, blue for “Google Scholar”, and grey for “Other Sources”. b) Number of documents by year found through Scopus research. Orange solid line: total sum of documents from five groups of keywords drawn each one with dashed lines (S1): “toughness” AND “softwood”; (S2): “toughness” AND “hardwood”; (S3): “acoustic emission” AND “wood properties”; (S4): “tensile test” AND “coniferous wood” OR “spruce”; (S5): “toughness” AND “wood” AND hazel”. c) Number of documents by year found through Google Scholar research. Blue solid line: total sum of documents based on the eight set of keywords drawn each one with light lines (G1): “Fracture Toughness softwood and hardwood”; (G2): “Mechanical properties softwood and hardwood”; (G3): “Wood fracture characterization”; (G4): “Softwood toughness”; (G5): “Spruce fracture toughness”; (G6) “Norway spruce mechanical properties”; (G7) “Oak fracture toughness”; (G8) “Fracture toughness spruce and birch”. The analysis of the number of studies per year (Fig. 4a) over the last 40 years can provide an index of interest on the topic from the scientific community. The three different colours (orange, blue, and grey) represent the documents found via the search engines Scopus, Google Scholar, and “Other Sources” respectively. It can be noticed that there are no clear peaks in publications, however the increase of interest can also be derived by the frequency of papers (i.e. number per year) and by
B. Bartolucci et alii, Frattura ed Integrità Strutturale, 54 (2020) 249-274; DOI: 10.3221/IGF-ESIS.54.18
-254
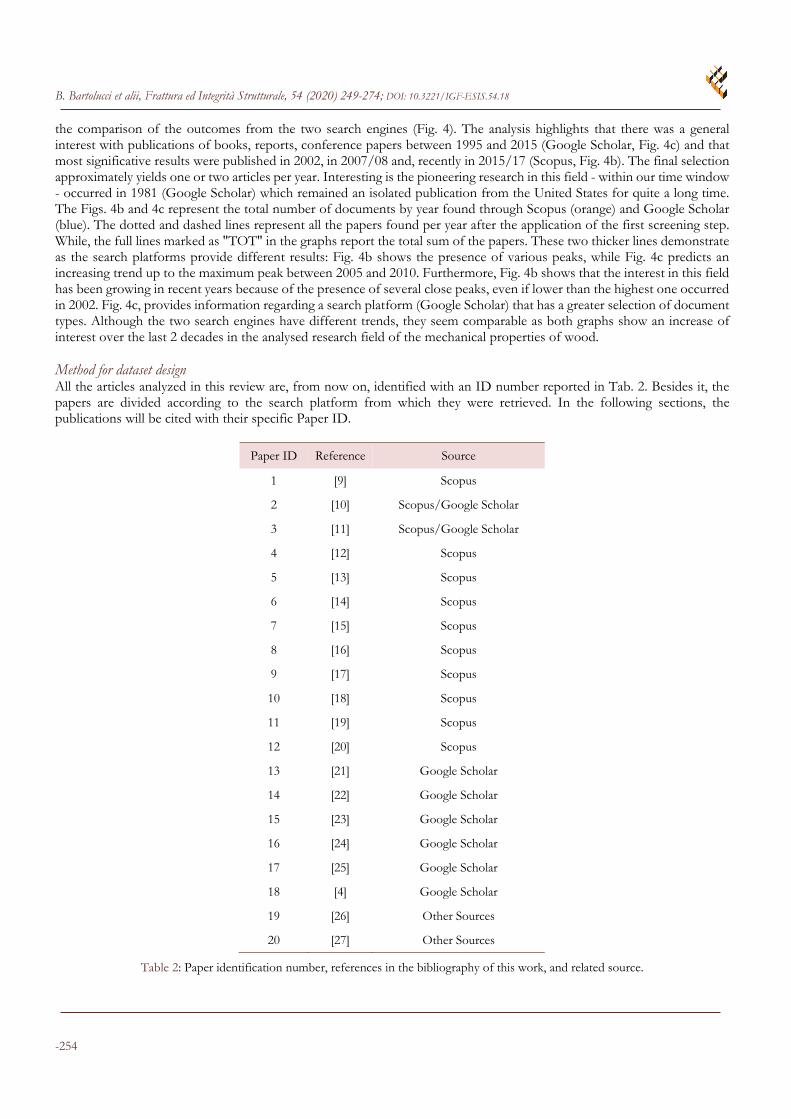
the comparison of the outcomes from the two search engines (Fig. 4). The analysis highlights that there was a general interest with publications of books, reports, conference papers between 1995 and 2015 (Google Scholar, Fig. 4c) and that most significative results were published in 2002, in 2007/08 and, recently in 2015/17 (Scopus, Fig. 4b). The final selection approximately yields one or two articles per year. Interesting is the pioneering research in this field - within our time window - occurred in 1981 (Google Scholar) which remained an isolated publication from the United States for quite a long time. The Figs. 4b and 4c represent the total number of documents by year found through Scopus (orange) and Google Scholar (blue). The dotted and dashed lines represent all the papers found per year after the application of the first screening step. While, the full lines marked as "TOT" in the graphs report the total sum of the papers. These two thicker lines demonstrate as the search platforms provide different results: Fig. 4b shows the presence of various peaks, while Fig. 4c predicts an increasing trend up to the maximum peak between 2005 and 2010. Furthermore, Fig. 4b shows that the interest in this field has been growing in recent years because of the presence of several close peaks, even if lower than the highest one occurred in 2002. Fig. 4c, provides information regarding a search platform (Google Scholar) that has a greater selection of document types. Although the two search engines have different trends, they seem comparable as both graphs show an increase of interest over the last 2 decades in the analysed research field of the mechanical properties of wood. Method for dataset design All the articles analyzed in this review are, from now on, identified with an ID number reported in Tab. 2. Besides it, the papers are divided according to the search platform from which they were retrieved. In the following sections, the publications will be cited with their specific Paper ID.
Paper ID Reference Source
1 [9] Scopus
2 [10] Scopus/Google Scholar
3 [11] Scopus/Google Scholar
4 [12] Scopus
5 [13] Scopus
6 [14] Scopus
7 [15] Scopus
8 [16] Scopus
9 [17] Scopus
10 [18] Scopus
11 [19] Scopus
12 [20] Scopus
13 [21] Google Scholar
14 [22] Google Scholar
15 [23] Google Scholar
16 [24] Google Scholar
17 [25] Google Scholar
18 [4] Google Scholar
19 [26] Other Sources
20 [27] Other Sources
Table 2: Paper identification number, references in the bibliography of this work, and related source.
B. Bartolucci et alii, Frattura ed Integrità Strutturale, 54 (2020) 249-274; DOI: 10.3221/IGF-ESIS.54.18
255
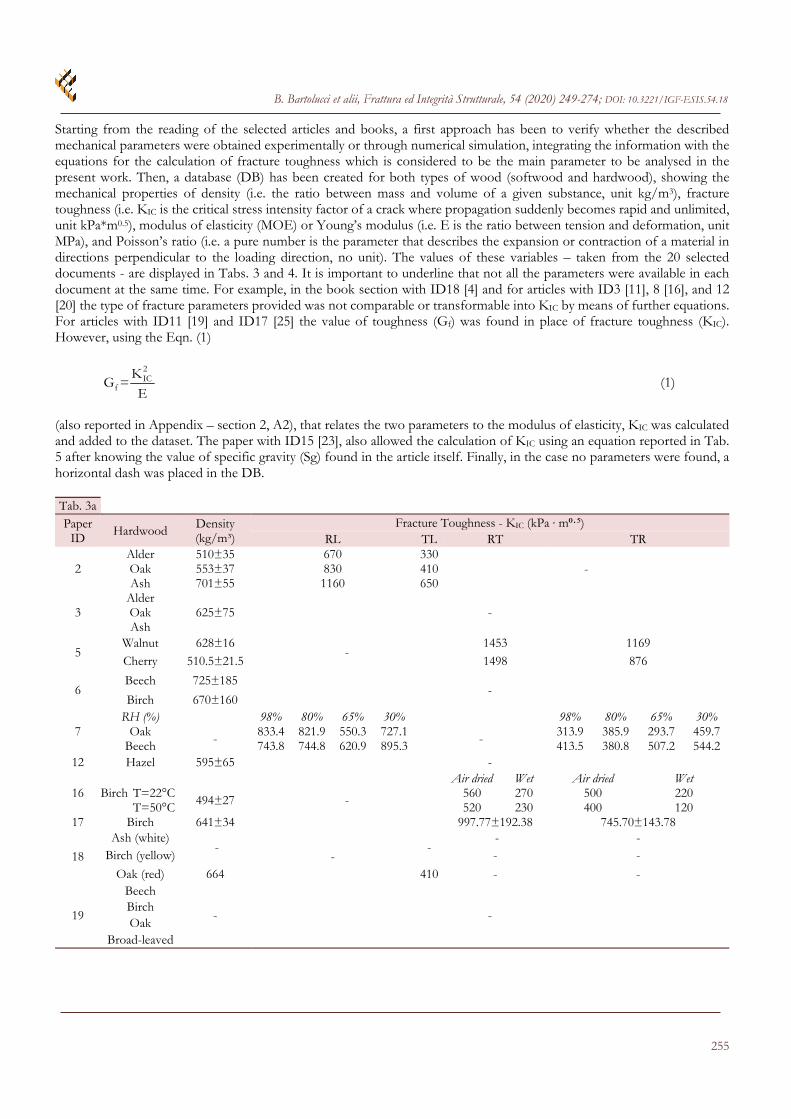
Starting from the reading of the selected articles and books, a first approach has been to verify whether the described mechanical parameters were obtained experimentally or through numerical simulation, integrating the information with the equations for the calculation of fracture toughness which is considered to be the main parameter to be analysed in the present work. Then, a database (DB) has been created for both types of wood (softwood and hardwood), showing the mechanical properties of density (i.e. the ratio between mass and volume of a given substance, unit kg/m3), fracture toughness (i.e. KIC is the critical stress intensity factor of a crack where propagation suddenly becomes rapid and unlimited, unit kPa*m0.5), modulus of elasticity (MOE) or Young’s modulus (i.e. E is the ratio between tension and deformation, unit MPa), and Poisson’s ratio (i.e. a pure number is the parameter that describes the expansion or contraction of a material in directions perpendicular to the loading direction, no unit). The values of these variables – taken from the 20 selected documents - are displayed in Tabs. 3 and 4. It is important to underline that not all the parameters were available in each document at the same time. For example, in the book section with ID18 [4] and for articles with ID3 [11], 8 [16], and 12 [20] the type of fracture parameters provided was not comparable or transformable into KIC by means of further equations. For articles with ID11 [19] and ID17 [25] the value of toughness (Gf) was found in place of fracture toughness (KIC). However, using the Eqn. (1)
2IC
fK
G =E
(1)
(also reported in Appendix – section 2, A2), that relates the two parameters to the modulus of elasticity, KIC was calculated and added to the dataset. The paper with ID15 [23], also allowed the calculation of KIC using an equation reported in Tab. 5 after knowing the value of specific gravity (Sg) found in the article itself. Finally, in the case no parameters were found, a horizontal dash was placed in the DB. Tab. 3a Paper
ID Hardwood Density
(kg/m³) Fracture Toughness - KIC (kPa · m⁰⸱⁵)
RL TL RT TR
2 Alder 510±35 670 330
- Oak 553±37 830 410Ash 701±55 1160 650
3 Alder
625±75 - Oak Ash
5 Walnut 628±16
- 1453 1169
Cherry 510.5±21.5 1498 876
6 Beech 725±185
- Birch 670±160
7 RH (%) 98% 80% 65% 30% 98% 80% 65% 30%
Oak - 833.4 821.9 550.3 727.1 - 313.9 385.9 293.7 459.7 Beech 743.8 744.8 620.9 895.3 413.5 380.8 507.2 544.2
12 Hazel 595±65 -
16 Birch Air dried Wet Air dried Wet
T=22°C 494±27 -
560 270 500 220T=50°C 520 230 400 120
17 Birch 641±34 997.77±192.38 745.70±143.78
18
Ash (white) -
- -
- - Birch (yellow) - -
Oak (red) 664 410 - -
19
Beech
- - Birch Oak
Broad-leaved
B. Bartolucci et alii, Frattura ed Integrità Strutturale, 54 (2020) 249-274; DOI: 10.3221/IGF-ESIS.54.18
-256
Tab. 3b Paper
ID Hardwood MOE (MPa) Poisson’s Ratio
EL ER ET LT LR RT
2 Alder 11700 1100 600 0.30 0.30
- Oak 13000 1600 900 0.30 0.30 Ash 15800 1500 800 0.30 0.30
3 Alder
- - Oak Ash
5 Walnut - 1083 1049 - 0.41±0.11Cherry 885 1609 0.54±0.19
6 Beech 14000±4000 - - Birch 15500±1000
7 RH (%)
Oak - - Beech 12 Hazel 16 Birch - - 17 Birch - 1110 620 -
18 Ash (white) 10950±1050 - 0.44 0.37 0.68
Birch (yellow) 12100±1800 - 0.45 0.43 0.69 Oak (red) 10900±1600 0.45 0.35 0.56
19
Beech 13060 1310 680 - Birch 15250 1260 640
Oak 13820 1280 660Broad-leaved - 0.5 0.37 0.67
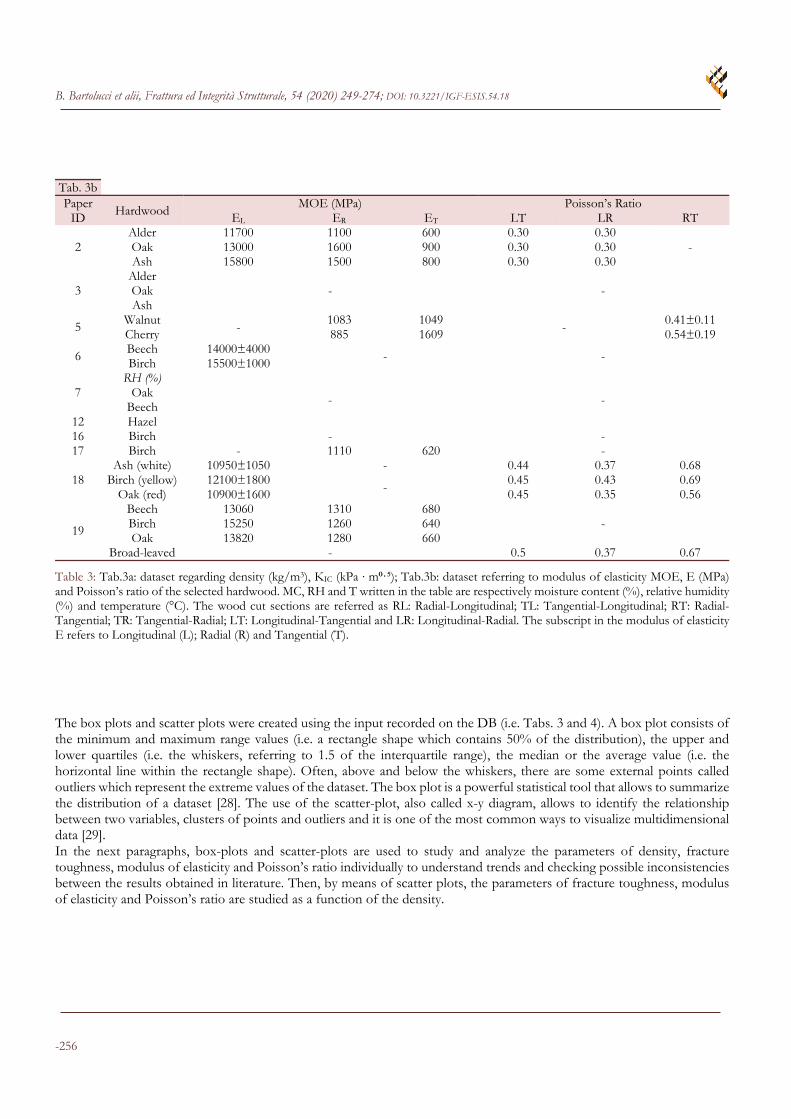
Table 3: Tab.3a: dataset regarding density (kg/m3), KIC (kPa · m⁰⸱⁵); Tab.3b: dataset referring to modulus of elasticity MOE, E (MPa) and Poisson’s ratio of the selected hardwood. MC, RH and T written in the table are respectively moisture content (%), relative humidity (%) and temperature (°C). The wood cut sections are referred as RL: Radial-Longitudinal; TL: Tangential-Longitudinal; RT: Radial-Tangential; TR: Tangential-Radial; LT: Longitudinal-Tangential and LR: Longitudinal-Radial. The subscript in the modulus of elasticity E refers to Longitudinal (L); Radial (R) and Tangential (T). The box plots and scatter plots were created using the input recorded on the DB (i.e. Tabs. 3 and 4). A box plot consists of the minimum and maximum range values (i.e. a rectangle shape which contains 50% of the distribution), the upper and lower quartiles (i.e. the whiskers, referring to 1.5 of the interquartile range), the median or the average value (i.e. the horizontal line within the rectangle shape). Often, above and below the whiskers, there are some external points called outliers which represent the extreme values of the dataset. The box plot is a powerful statistical tool that allows to summarize the distribution of a dataset [28]. The use of the scatter-plot, also called x-y diagram, allows to identify the relationship between two variables, clusters of points and outliers and it is one of the most common ways to visualize multidimensional data [29]. In the next paragraphs, box-plots and scatter-plots are used to study and analyze the parameters of density, fracture toughness, modulus of elasticity and Poisson’s ratio individually to understand trends and checking possible inconsistencies between the results obtained in literature. Then, by means of scatter plots, the parameters of fracture toughness, modulus of elasticity and Poisson’s ratio are studied as a function of the density.
B. Bartolucci et alii, Frattura ed Integrità Strutturale, 54 (2020) 249-274; DOI: 10.3221/IGF-ESIS.54.18
257
10
9 8 7 4 3 2 1
Paper ID
Tab. 4a
Spruce
Spruce
Pine
Fir
Pine
Spruce
RH
(%)
Pine
Pine
Spruce
Spruce
Spruce
Softwood
MC
(%
)
Site II
Site I
Sat.
18%
12%
7%
4%
275
345±95
288±63
365
328
-
590
488±38
479±40
-
Density
(kg/m³)
- - -
280.5
249.5
98%
-
-
490
164.2
RL
Fracture T
oughness - KIC (kP
a · m⁰⸱⁵)
409.6
385.1
80%
413.7
465
65%
435.5
494.1
30%
-
575±115
580±110
590±90
580±110
585±105
310
118.8
TL
- - -
RT
L
RL
T
185.3
204.2
98%
TR
281.3
290.3
80% 364.2
328.7
65%
348.8
352.5
30%
12800
-
12750±884
13810±665
-
11900
-
12900
15500
15600
16500
-
10000
10300
EL M
OE
(MP
a)
625
5554±288
5713±544
817.4
550
-
1030
970
800
690
ER
397
-
420 - 450
410
ET
0.45
- -
0.41
0.16
0.18
0.26
0.27
0.29
-
0.4
-
LT P
oisson's ratio
0.36
0.55
0.04
0.08
0.13
0.13
0.16
0.4
LR
0.21 - - - RT
B. Bartolucci et alii, Frattura ed Integrità Strutturale, 54 (2020) 249-274; DOI: 10.3221/IGF-ESIS.54.18
-258
20
19
18
17
16
15
14
13
11
Paper ID
Tab. 4b
Scots pine
Conifers
Spruce
Pine
Spruce (Red)
Spruce (Engelm
ann)
Spruce (Sitka)
Pine (R
ed)
Pine (L
oblolly)
Fir (Subalpine)
Spruce
Spruce
Conifers
Pine (green)
Pine (dry)
Spruce(green)
Spruce (dry Norw
ay)
Spruce
Pine
Spruce
Softwood
MC
(%)
12%
11.10%
10%
≈21.8%
≈17.1%
≈12.4%
≈8.1%
T=
50°C
T=
22°C
505
505
550
565±5
545±5
535±5
525±5
- - 425 -
410
347.5±20.5
- -
375±75
450±100
-
Density
(kg/m³)
- -
-
360
-
-
214
486
-
290±40
330±50
-
RL
Fracture Toughness - K
IC (kPa · m⁰⸱⁵)
420
-
320
193.40±71.99
273
286
220±20
265±25
TL
- -
499.2±4.02
210
250
Air dried
-
202
332
190±10
198±12
RT
120
150
Wet
- -
1520
2998
-
LR
1573
2513
LT
388.49±3.13
200
230
Air dried
207
170
210±20
260±30
147.09±38.25
TR
110
120
Wet
B. Bartolucci et alii, Frattura ed Integrità Strutturale, 54 (2020) 249-274; DOI: 10.3221/IGF-ESIS.54.18
259
20
19
18
17
16
15
14
13
11
Paper ID
Tab. 4c
Scots Pine
Conifers
Spruce
Pine
Spruce (Red)
Spruce (Engelm
ann)
Spruce (Sitka)
Pine (R
ed)
Pine (L
oblolly)
Fir (Subalpine)
Spruce
Spruce
Conifers
Pine (green)
Pine (dry)
Spruce (green)
Spruce (dry Norw
ay)
Spruce
Pine
Spruce
Softwood
MC
(%)
12%
11.10%
10%
≈21.8%
≈17.1%
≈12.4%
≈8.1%
T=
50°C
T=
22°C
14300
10283
16300
10230
13058
14998
15621
-
11710
11520
10300±1100
8000±900
9650±1150
10000±1200
11000±1300
8050±850
-
-
- -
est:8667
10700
-
8630.8±2546.5
EL
MO
E (M
Pa)
700
1994
1100
420
569
763
804
830
1000
-
710
327
710
308.7±94.6
ER
545
994
570
283
362
532
682
4940
650
430
262
430
321.2±172.3
ET
-
0.62
0.51
0.6
0.69
0.74
0.69
0.42
- -
0.46
0.47
0.31
0.29
0.33
- - - -
est:0.69
0.51
-
0.47
LT P
oisson's ratio
0.61
0.39
0.42
0.39
0.51
0.6
0.41
0.37
0.42
0.37
0.35
0.33
0.34
0.24
0.38
0.37
LR
0.48
1.09
0.63
0.73
0.63
0.69
0.69
0.47
0.53
0.43
0.41
0.38
0.44
0.67
0.51
0.44
RT
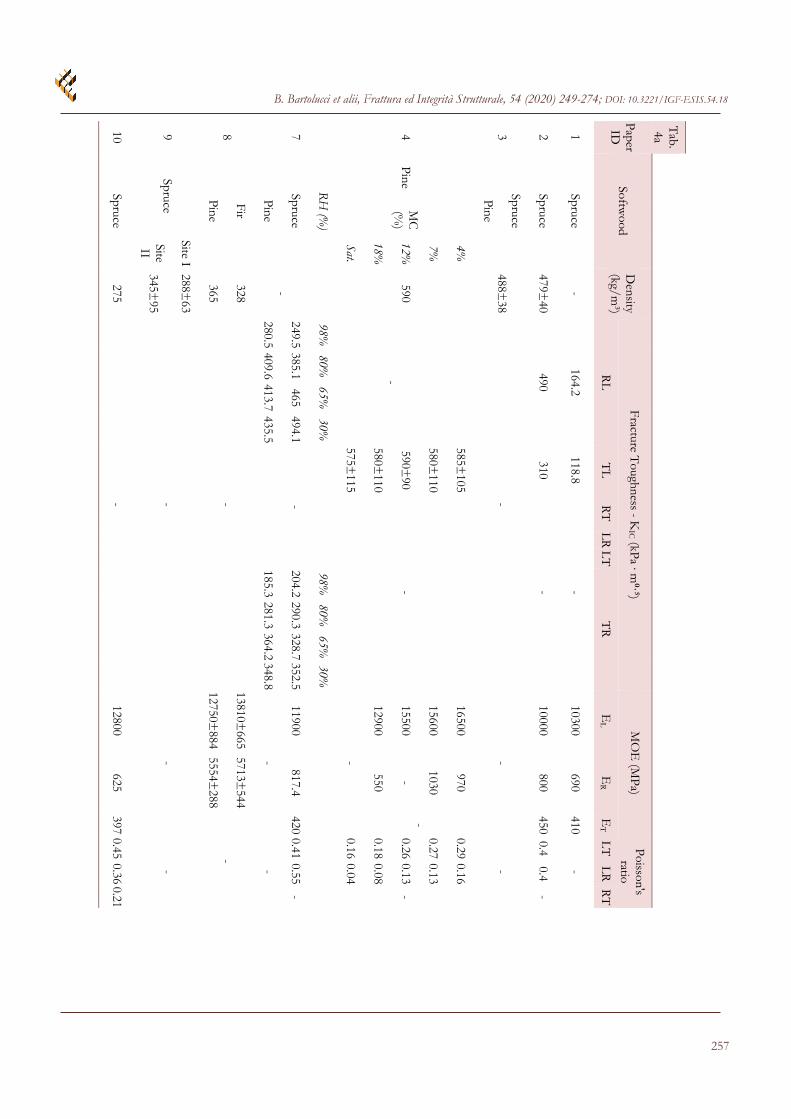
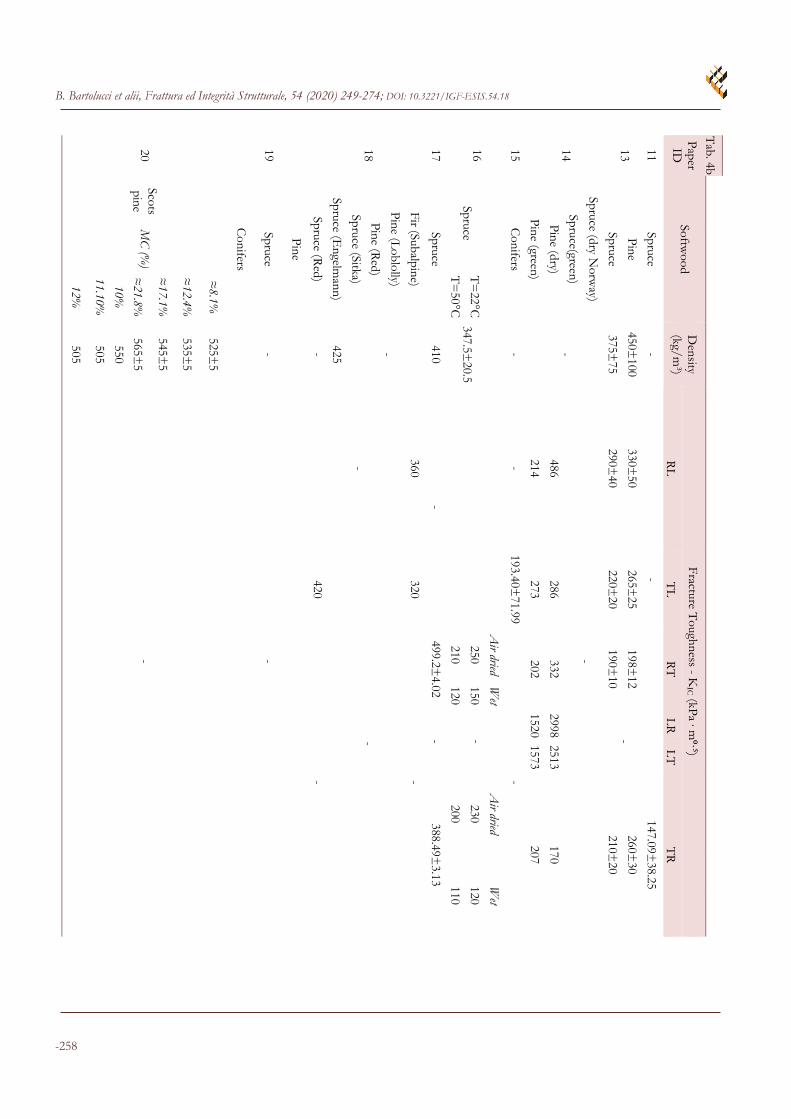
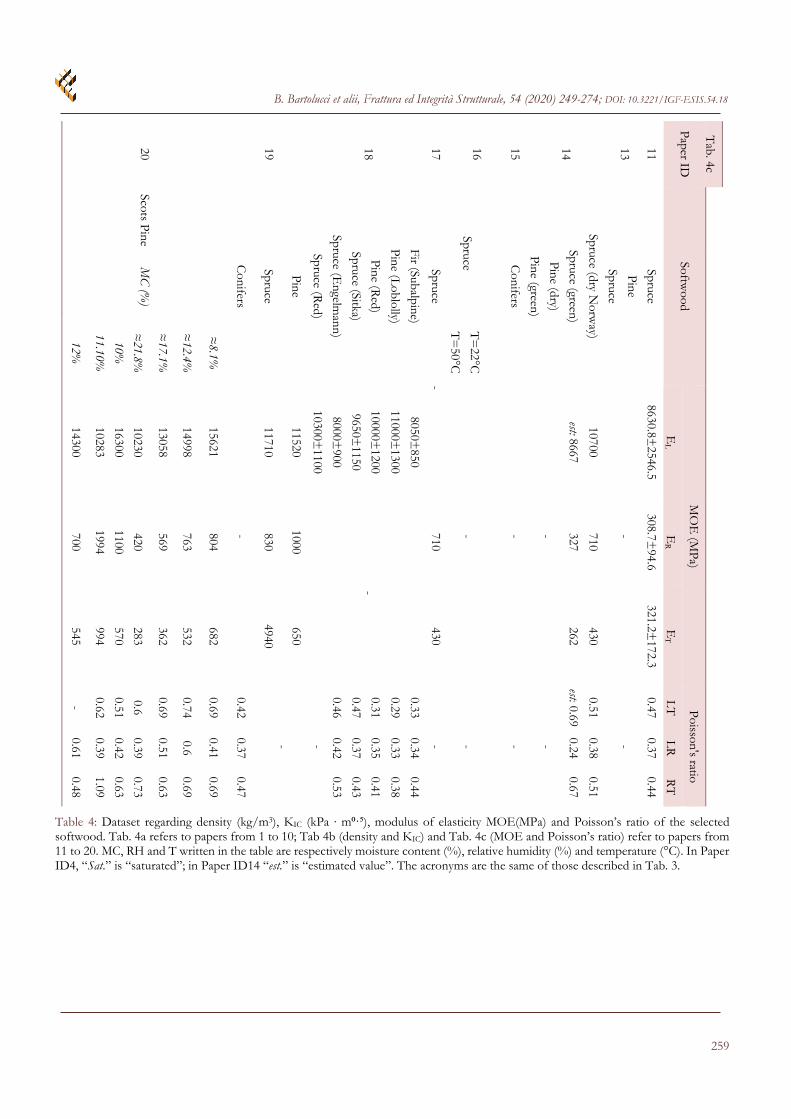
Table 4: Dataset regarding density (kg/m3), KIC (kPa · m⁰⸱⁵), modulus of elasticity MOE(MPa) and Poisson’s ratio of the selected softwood. Tab. 4a refers to papers from 1 to 10; Tab 4b (density and KIC) and Tab. 4c (MOE and Poisson’s ratio) refer to papers from 11 to 20. MC, RH and T written in the table are respectively moisture content (%), relative humidity (%) and temperature (°C). In Paper ID4, “Sat.” is “saturated”; in Paper ID14 “est.” is “estimated value”. The acronyms are the same of those described in Tab. 3.
B. Bartolucci et alii, Frattura ed Integrità Strutturale, 54 (2020) 249-274; DOI: 10.3221/IGF-ESIS.54.18
-260
RESULTS AND DISCUSSIONS
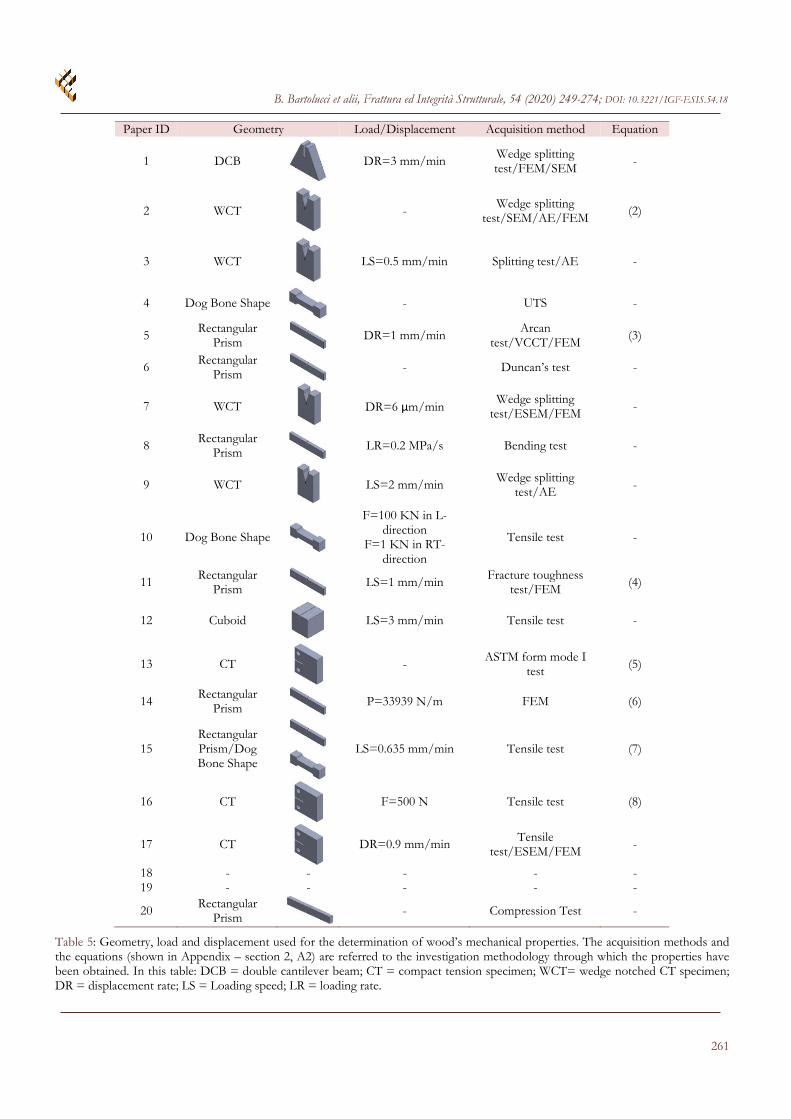
efore proceeding with the analysis of the values obtained in the DB, it is necessary to understand in which way (i.e. methodological approach; type of geometry; type of test;..) the parameters were found by the authors of the selected papers. Tab. 5 shows the geometries of the samples used, the type of analysis performed on them focusing on the
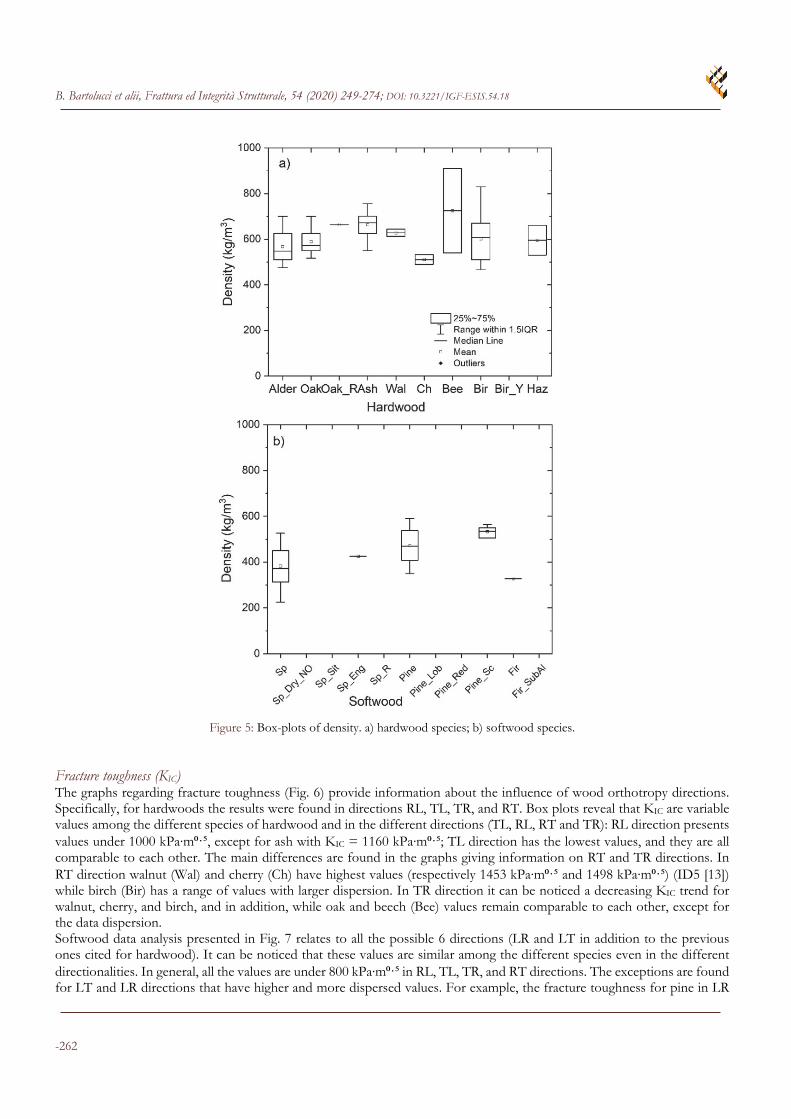
load or displacement and on the acquisition method of the parameters and, if available, the equations used for the calculation of fracture toughness, our main mechanical parameter of interest. The table demonstrates that the majority of the analyses were carried out using CT (Compact Tension) and WCT (Wedge notched CT) specimens. These are the best-known geometries together with the dog bone shape specimen. In general, it can be noted that CT/WCT and dog bone shape samples are used for two types of variables acquisition method. The first, it is used for splitting tests while the second for tensile tests analysis. Moreover, seven papers are linked to the use of a rectangular prism specimen. Differently from the CT/WCT samples, the rectangular prism is linked to various types of variables acquisition method, e.g. Arcan test, Duncan’s test, bending, tensile, and compression tests. A further study is necessary for papers ID1 [9] and ID8 [16] because, as shown in Tab. 5, the geometries involved in these researches are different from the others. The first one is a pyramid trunk (DCB specimen) used by the authors to facilitate direct observations of the fracture process, while the second one is a cuboid specimen that was useful for researchers to show how toughness varied around the hazel forks, finally it was different for the wood specie they selected for their study (ID12 [20]). Load and displacement rates are not the same in each study and not all the papers report their values, so it is difficult to find a standard procedure for this type of information. Concerning the acquisition method, it is clear that there is a sort of standardization of the studies about properties of wood: actually, the investigation often starts with a mechanical test on wood (e.g. splitting, bending, compression etc.) and then it continues with an analysis by Scanning Electron Microscope (SEM). Subsequently the values of the mechanical properties found in the experiment are often compared with numerical simulations, such as Finite Element Method (FEM) of analysis. This process was not applied to all the papers: in some articles only a mechanical experiment was carried out, in other cases only the FEM analysis, while in other articles the analysis was used in pairs (as in ID11 [19], which includes a fracture toughness test coupled with a FEM analysis). Another type of test used the Acoustic Emission (AE) No Destructive Technique (NDT) as in ID2 [10], ID3 [11], ID9 [17]. Tab. 5 demonstrates how future studies in this field of research should be based on a specific guideline, which give the possibility to compare search results more precisely. In the following sub-paragraphs, box-plots, and scatter-plots regarding mechanical properties of the most common European woods are reported and the results discussed for both softwood and hardwood. Density Looking at Fig. 5, it can be noticed that hardwood has higher density values than softwood, as already known in the literature. Particularly, this review confirms as the density of the eight most common hardwood species has values ranging between 467 and 910 kg/m³. Specifically, as regards hardwoods, one of the woods less dense is Cherry (Ch), as already known; while Beech (Bee) and Birch (Bir) species represent, respectively, the lowest (minimum) and the highest (maximum) values of density. In fact, as reported in Fig. 5a, their box-plots have a wider range of values. Beech and Birch density values (ID6, [14]) varies respectively from a minimum of 540 kg/m³ to a maximum of 910 kg/m³, and from a minimum of 510 kg/m³ to a maximum of 830 kg/m³. Since wood is an orthotropic material, all the values that are significantly lower or higher than the average value of Beech and Birch (that are respectively 725 kg/m³ and 670 kg/m³), could be derived from analysis carried out in different directions. Going on with the analysis, the DB reported in Tab. 4 shows how the smallest Birch density values was reported in the paper ID16, [24]. In this article, the authors analysed the most external parts of the Finnish Birch stem, that are also the regions where orthotropy is higher, measuring the density between the rings 12 and 40 of the stem cross section. The punctual measurements of this research pointed out different results compared to the average value reported in Fig. 5. Concerning softwoods (Fig. 5b), the most common species reported here, have a range with lower values if compared to hardwood, ranging between 225 and 590 kg/m³. It is possible to notice that there are different species of Spruce (Sp). In this case, density values were available for Spruce (Sp, mostly European) and Spruce Engelmann (Sp_Eng) which are comparable, although with a single value from the literature. Similarly, fir with only one density value deriving from the analysis of ID8 [16] does not allow a proper statistical interpretation. Then, Pine and Scots Pine (Pine_Sc) that are among the most common species of European woods highlight a higher average and a smaller dispersion for Scots Pine than Pine.
B
B. Bartolucci et alii, Frattura ed Integrità Strutturale, 54 (2020) 249-274; DOI: 10.3221/IGF-ESIS.54.18
261
Paper ID Geometry Load/Displacement Acquisition method Equation
1 DCB DR=3 mm/min Wedge splitting test/FEM/SEM
-
2 WCT - Wedge splitting
test/SEM/AE/FEM (2)
3 WCT LS=0.5 mm/min Splitting test/AE -
4 Dog Bone Shape - UTS -
5 Rectangular Prism DR=1 mm/min Arcan
test/VCCT/FEM (3)
6 Rectangular Prism - Duncan’s test -
7 WCT
DR=6 μm/min Wedge splitting
test/ESEM/FEM -
8 Rectangular Prism LR=0.2 MPa/s Bending test -
9 WCT
LS=2 mm/min Wedge splitting test/AE -
10 Dog Bone Shape
F=100 KN in L-direction
F=1 KN in RT-direction
Tensile test -
11 Rectangular Prism LS=1 mm/min Fracture toughness
test/FEM (4)
12 Cuboid LS=3 mm/min Tensile test -
13 CT
- ASTM form mode I test (5)
14 Rectangular
Prism P=33939 N/m FEM (6)
15 Rectangular Prism/Dog Bone Shape
LS=0.635 mm/min Tensile test (7)
16 CT
F=500 N Tensile test (8)
17 CT
DR=0.9 mm/min Tensile test/ESEM/FEM -
18 - - - - - 19 - - - - -
20 Rectangular Prism - Compression Test -
Table 5: Geometry, load and displacement used for the determination of wood’s mechanical properties. The acquisition methods and the equations (shown in Appendix – section 2, A2) are referred to the investigation methodology through which the properties have been obtained. In this table: DCB = double cantilever beam; CT = compact tension specimen; WCT= wedge notched CT specimen; DR = displacement rate; LS = Loading speed; LR = loading rate.
B. Bartolucci et alii, Frattura ed Integrità Strutturale, 54 (2020) 249-274; DOI: 10.3221/IGF-ESIS.54.18
-262
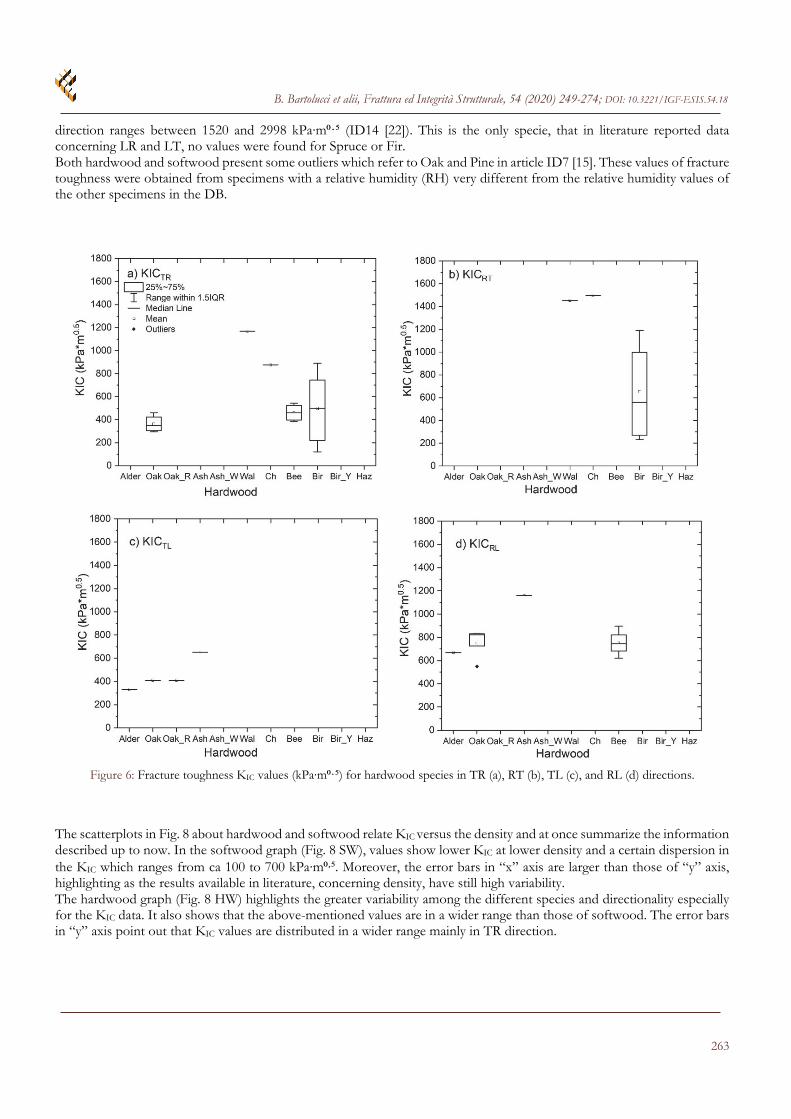
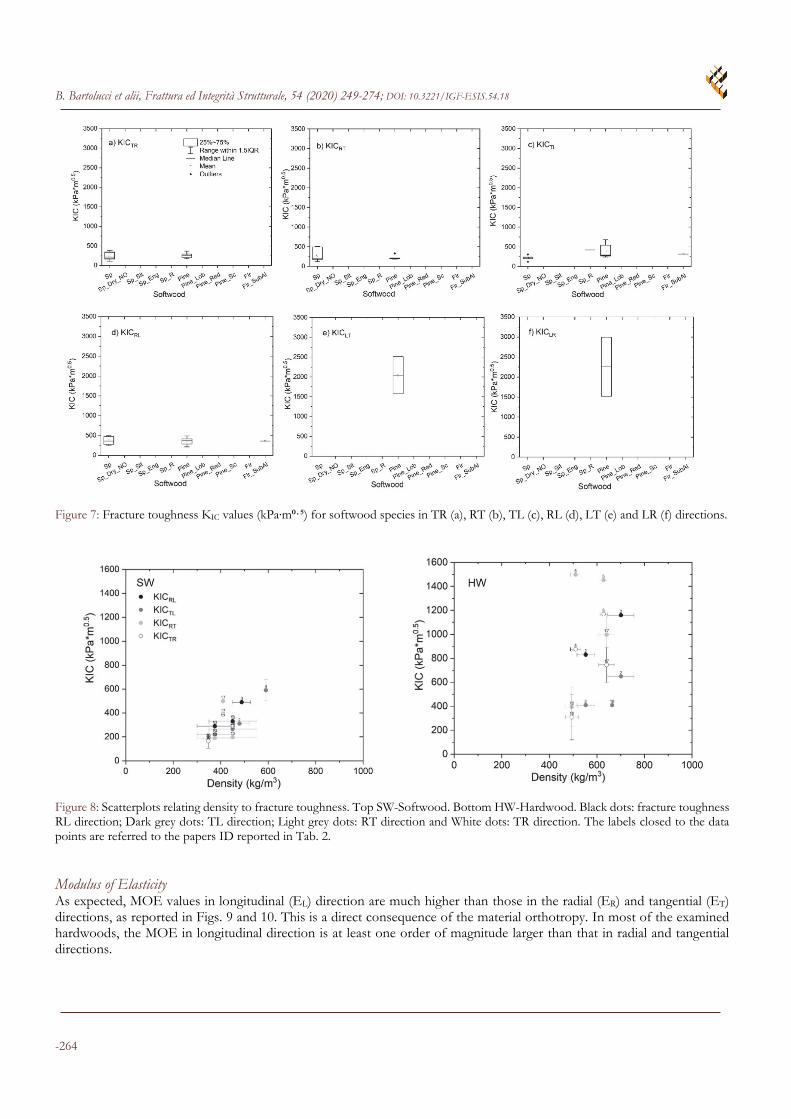
Figure 5: Box-plots of density. a) hardwood species; b) softwood species. Fracture toughness (KIC) The graphs regarding fracture toughness (Fig. 6) provide information about the influence of wood orthotropy directions. Specifically, for hardwoods the results were found in directions RL, TL, TR, and RT. Box plots reveal that KIC are variable values among the different species of hardwood and in the different directions (TL, RL, RT and TR): RL direction presents values under 1000 kPa·m⁰⸱⁵, except for ash with KIC = 1160 kPa·m⁰⸱⁵; TL direction has the lowest values, and they are all comparable to each other. The main differences are found in the graphs giving information on RT and TR directions. In RT direction walnut (Wal) and cherry (Ch) have highest values (respectively 1453 kPa·m⁰⸱⁵ and 1498 kPa·m⁰⸱⁵) (ID5 [13]) while birch (Bir) has a range of values with larger dispersion. In TR direction it can be noticed a decreasing KIC trend for walnut, cherry, and birch, and in addition, while oak and beech (Bee) values remain comparable to each other, except for the data dispersion. Softwood data analysis presented in Fig. 7 relates to all the possible 6 directions (LR and LT in addition to the previous ones cited for hardwood). It can be noticed that these values are similar among the different species even in the different directionalities. In general, all the values are under 800 kPa·m⁰⸱⁵ in RL, TL, TR, and RT directions. The exceptions are found for LT and LR directions that have higher and more dispersed values. For example, the fracture toughness for pine in LR
B. Bartolucci et alii, Frattura ed Integrità Strutturale, 54 (2020) 249-274; DOI: 10.3221/IGF-ESIS.54.18
263
direction ranges between 1520 and 2998 kPa·m⁰⸱⁵ (ID14 [22]). This is the only specie, that in literature reported data concerning LR and LT, no values were found for Spruce or Fir. Both hardwood and softwood present some outliers which refer to Oak and Pine in article ID7 [15]. These values of fracture toughness were obtained from specimens with a relative humidity (RH) very different from the relative humidity values of the other specimens in the DB.
Figure 6: Fracture toughness KIC values (kPa·m⁰⸱⁵) for hardwood species in TR (a), RT (b), TL (c), and RL (d) directions. The scatterplots in Fig. 8 about hardwood and softwood relate KIC versus the density and at once summarize the information described up to now. In the softwood graph (Fig. 8 SW), values show lower KIC at lower density and a certain dispersion in the KIC which ranges from ca 100 to 700 kPa·m⁰·⁵. Moreover, the error bars in “x” axis are larger than those of “y” axis, highlighting as the results available in literature, concerning density, have still high variability. The hardwood graph (Fig. 8 HW) highlights the greater variability among the different species and directionality especially for the KIC data. It also shows that the above-mentioned values are in a wider range than those of softwood. The error bars in “y” axis point out that KIC values are distributed in a wider range mainly in TR direction.
B. Bartolucci et alii, Frattura ed Integrità Strutturale, 54 (2020) 249-274; DOI: 10.3221/IGF-ESIS.54.18
-264
Figure 7: Fracture toughness KIC values (kPa·m⁰⸱⁵) for softwood species in TR (a), RT (b), TL (c), RL (d), LT (e) and LR (f) directions.
Figure 8: Scatterplots relating density to fracture toughness. Top SW-Softwood. Bottom HW-Hardwood. Black dots: fracture toughness RL direction; Dark grey dots: TL direction; Light grey dots: RT direction and White dots: TR direction. The labels closed to the data points are referred to the papers ID reported in Tab. 2.
Modulus of Elasticity As expected, MOE values in longitudinal (EL) direction are much higher than those in the radial (ER) and tangential (ET) directions, as reported in Figs. 9 and 10. This is a direct consequence of the material orthotropy. In most of the examined hardwoods, the MOE in longitudinal direction is at least one order of magnitude larger than that in radial and tangential directions.
B. Bartolucci et alii, Frattura ed Integrità Strutturale, 54 (2020) 249-274; DOI: 10.3221/IGF-ESIS.54.18
265
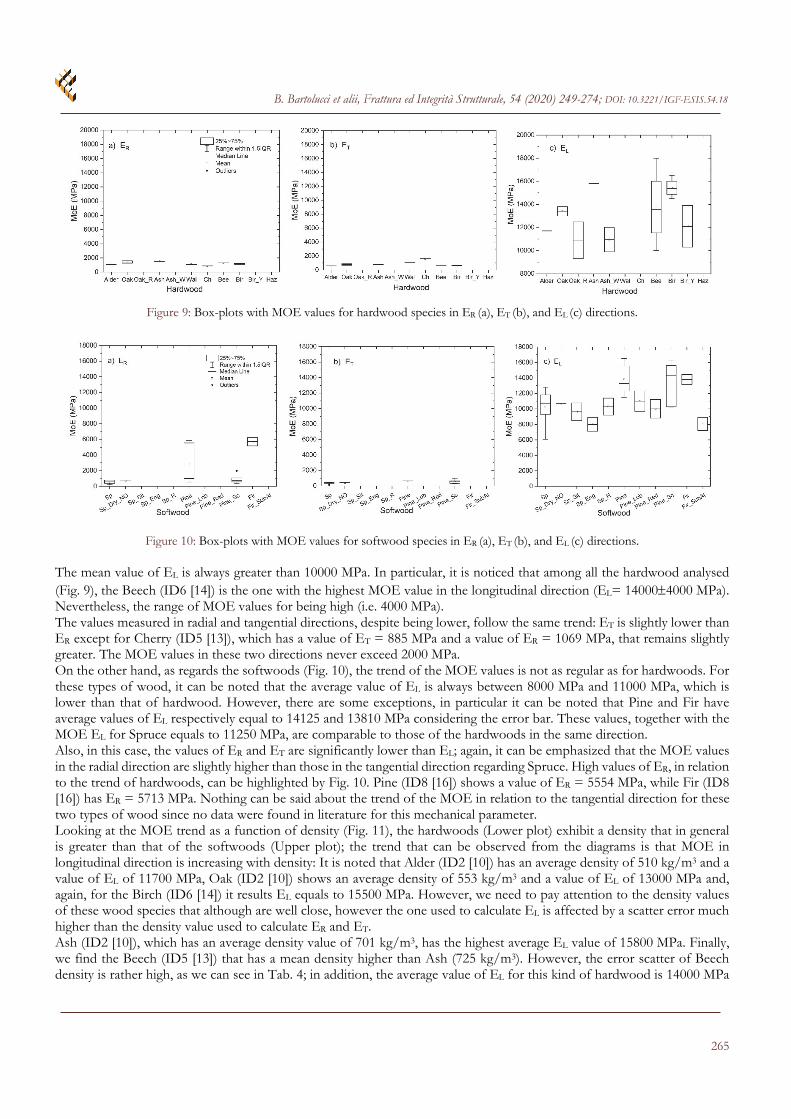
Figure 9: Box-plots with MOE values for hardwood species in ER (a), ET (b), and EL (c) directions.
Figure 10: Box-plots with MOE values for softwood species in ER (a), ET (b), and EL (c) directions.
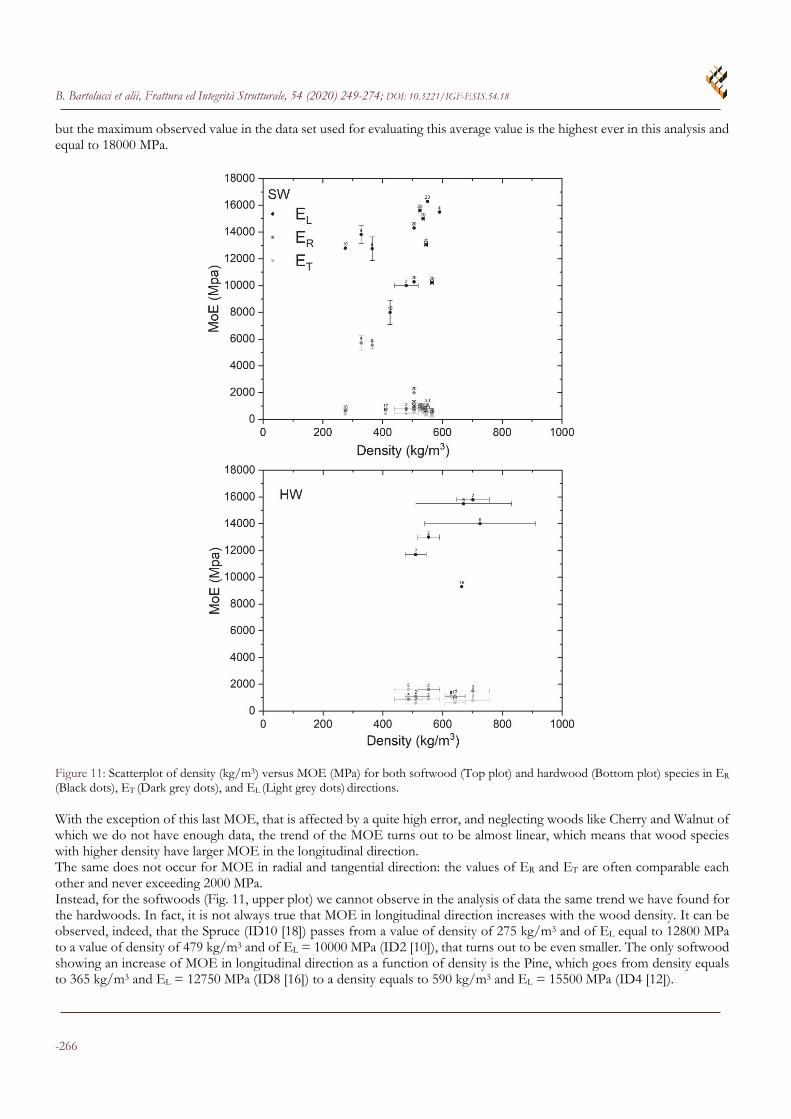
The mean value of EL is always greater than 10000 MPa. In particular, it is noticed that among all the hardwood analysed (Fig. 9), the Beech (ID6 [14]) is the one with the highest MOE value in the longitudinal direction (EL= 140004000 MPa). Nevertheless, the range of MOE values for being high (i.e. 4000 MPa). The values measured in radial and tangential directions, despite being lower, follow the same trend: ET is slightly lower than ER except for Cherry (ID5 [13]), which has a value of ET = 885 MPa and a value of ER = 1069 MPa, that remains slightly greater. The MOE values in these two directions never exceed 2000 MPa. On the other hand, as regards the softwoods (Fig. 10), the trend of the MOE values is not as regular as for hardwoods. For these types of wood, it can be noted that the average value of EL is always between 8000 MPa and 11000 MPa, which is lower than that of hardwood. However, there are some exceptions, in particular it can be noted that Pine and Fir have average values of EL respectively equal to 14125 and 13810 MPa considering the error bar. These values, together with the MOE EL for Spruce equals to 11250 MPa, are comparable to those of the hardwoods in the same direction. Also, in this case, the values of ER and ET are significantly lower than EL; again, it can be emphasized that the MOE values in the radial direction are slightly higher than those in the tangential direction regarding Spruce. High values of ER, in relation to the trend of hardwoods, can be highlighted by Fig. 10. Pine (ID8 [16]) shows a value of ER = 5554 MPa, while Fir (ID8 [16]) has ER = 5713 MPa. Nothing can be said about the trend of the MOE in relation to the tangential direction for these two types of wood since no data were found in literature for this mechanical parameter. Looking at the MOE trend as a function of density (Fig. 11), the hardwoods (Lower plot) exhibit a density that in general is greater than that of the softwoods (Upper plot); the trend that can be observed from the diagrams is that MOE in longitudinal direction is increasing with density: It is noted that Alder (ID2 [10]) has an average density of 510 kg/m3 and a value of EL of 11700 MPa, Oak (ID2 [10]) shows an average density of 553 kg/m3 and a value of EL of 13000 MPa and, again, for the Birch (ID6 [14]) it results EL equals to 15500 MPa. However, we need to pay attention to the density values of these wood species that although are well close, however the one used to calculate EL is affected by a scatter error much higher than the density value used to calculate ER and ET. Ash (ID2 [10]), which has an average density value of 701 kg/m3, has the highest average EL value of 15800 MPa. Finally, we find the Beech (ID5 [13]) that has a mean density higher than Ash (725 kg/m3). However, the error scatter of Beech density is rather high, as we can see in Tab. 4; in addition, the average value of EL for this kind of hardwood is 14000 MPa
B. Bartolucci et alii, Frattura ed Integrità Strutturale, 54 (2020) 249-274; DOI: 10.3221/IGF-ESIS.54.18
-266
but the maximum observed value in the data set used for evaluating this average value is the highest ever in this analysis and equal to 18000 MPa.
Figure 11: Scatterplot of density (kg/m3) versus MOE (MPa) for both softwood (Top plot) and hardwood (Bottom plot) species in ER
(Black dots), ET (Dark grey dots), and EL (Light grey dots) directions.
With the exception of this last MOE, that is affected by a quite high error, and neglecting woods like Cherry and Walnut of which we do not have enough data, the trend of the MOE turns out to be almost linear, which means that wood species with higher density have larger MOE in the longitudinal direction. The same does not occur for MOE in radial and tangential direction: the values of ER and ET are often comparable each other and never exceeding 2000 MPa. Instead, for the softwoods (Fig. 11, upper plot) we cannot observe in the analysis of data the same trend we have found for the hardwoods. In fact, it is not always true that MOE in longitudinal direction increases with the wood density. It can be observed, indeed, that the Spruce (ID10 [18]) passes from a value of density of 275 kg/m3 and of EL equal to 12800 MPa to a value of density of 479 kg/m3 and of EL = 10000 MPa (ID2 [10]), that turns out to be even smaller. The only softwood showing an increase of MOE in longitudinal direction as a function of density is the Pine, which goes from density equals to 365 kg/m3 and EL = 12750 MPa (ID8 [16]) to a density equals to 590 kg/m3 and EL = 15500 MPa (ID4 [12]).
B. Bartolucci et alii, Frattura ed Integrità Strutturale, 54 (2020) 249-274; DOI: 10.3221/IGF-ESIS.54.18
267
In the radial and tangential directions, one can basically observe constant MOE values with an increase in density for Spruce. We cannot say anything about the other types of considered woods for the lack of data, but the anomaly of the Fir and Pine is still confirmed because they have higher values of ER in relation to hardwoods.
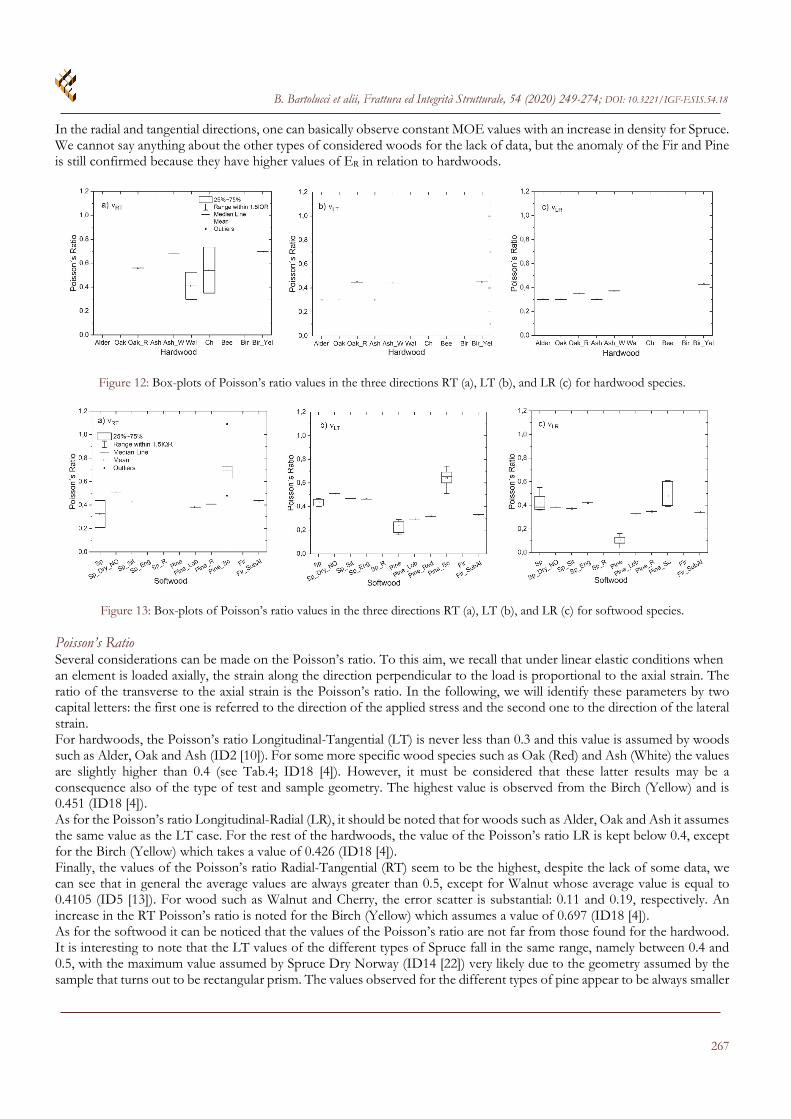
Figure 12: Box-plots of Poisson’s ratio values in the three directions RT (a), LT (b), and LR (c) for hardwood species.
Figure 13: Box-plots of Poisson’s ratio values in the three directions RT (a), LT (b), and LR (c) for softwood species.
Poisson’s Ratio Several considerations can be made on the Poisson’s ratio. To this aim, we recall that under linear elastic conditions when an element is loaded axially, the strain along the direction perpendicular to the load is proportional to the axial strain. The ratio of the transverse to the axial strain is the Poisson’s ratio. In the following, we will identify these parameters by two capital letters: the first one is referred to the direction of the applied stress and the second one to the direction of the lateral strain. For hardwoods, the Poisson’s ratio Longitudinal-Tangential (LT) is never less than 0.3 and this value is assumed by woods such as Alder, Oak and Ash (ID2 [10]). For some more specific wood species such as Oak (Red) and Ash (White) the values are slightly higher than 0.4 (see Tab.4; ID18 [4]). However, it must be considered that these latter results may be a consequence also of the type of test and sample geometry. The highest value is observed from the Birch (Yellow) and is 0.451 (ID18 [4]). As for the Poisson’s ratio Longitudinal-Radial (LR), it should be noted that for woods such as Alder, Oak and Ash it assumes the same value as the LT case. For the rest of the hardwoods, the value of the Poisson’s ratio LR is kept below 0.4, except for the Birch (Yellow) which takes a value of 0.426 (ID18 [4]). Finally, the values of the Poisson’s ratio Radial-Tangential (RT) seem to be the highest, despite the lack of some data, we can see that in general the average values are always greater than 0.5, except for Walnut whose average value is equal to 0.4105 (ID5 [13]). For wood such as Walnut and Cherry, the error scatter is substantial: 0.11 and 0.19, respectively. An increase in the RT Poisson’s ratio is noted for the Birch (Yellow) which assumes a value of 0.697 (ID18 [4]). As for the softwood it can be noticed that the values of the Poisson’s ratio are not far from those found for the hardwood. It is interesting to note that the LT values of the different types of Spruce fall in the same range, namely between 0.4 and 0.5, with the maximum value assumed by Spruce Dry Norway (ID14 [22]) very likely due to the geometry assumed by the sample that turns out to be rectangular prism. The values observed for the different types of pine appear to be always smaller
B. Bartolucci et alii, Frattura ed Integrità Strutturale, 54 (2020) 249-274; DOI: 10.3221/IGF-ESIS.54.18
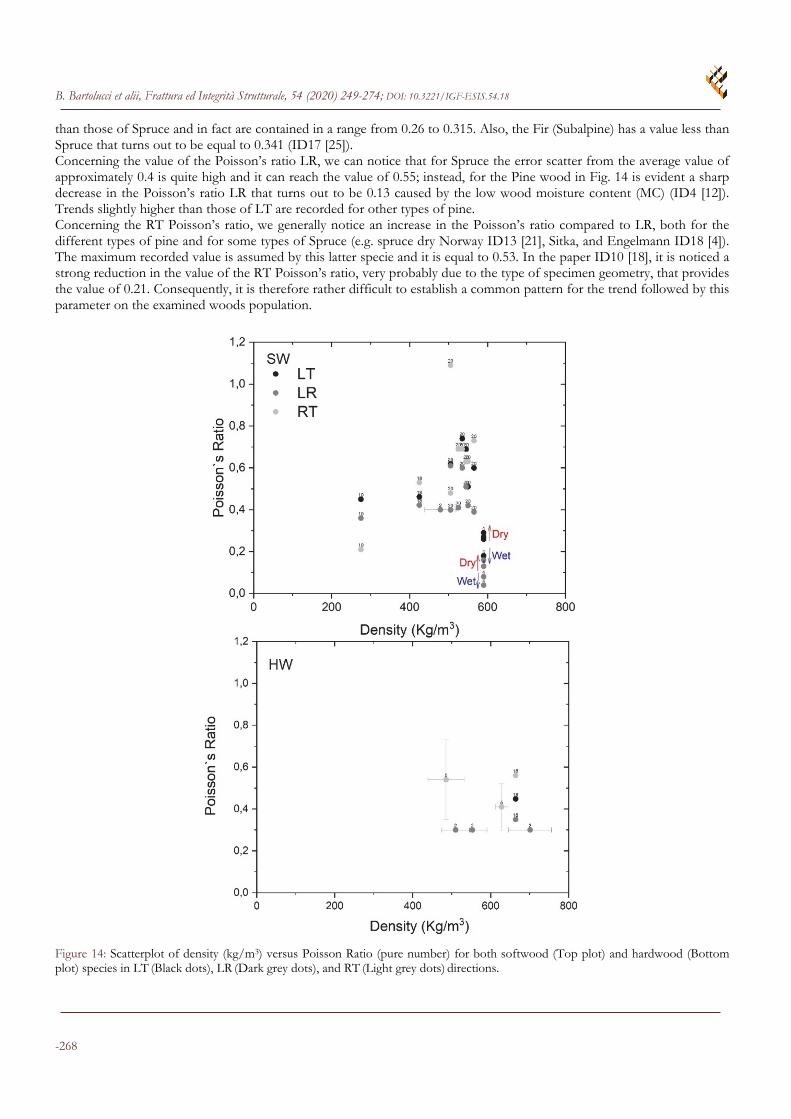
-268
than those of Spruce and in fact are contained in a range from 0.26 to 0.315. Also, the Fir (Subalpine) has a value less than Spruce that turns out to be equal to 0.341 (ID17 [25]). Concerning the value of the Poisson’s ratio LR, we can notice that for Spruce the error scatter from the average value of approximately 0.4 is quite high and it can reach the value of 0.55; instead, for the Pine wood in Fig. 14 is evident a sharp decrease in the Poisson’s ratio LR that turns out to be 0.13 caused by the low wood moisture content (MC) (ID4 [12]). Trends slightly higher than those of LT are recorded for other types of pine. Concerning the RT Poisson’s ratio, we generally notice an increase in the Poisson’s ratio compared to LR, both for the different types of pine and for some types of Spruce (e.g. spruce dry Norway ID13 [21], Sitka, and Engelmann ID18 [4]). The maximum recorded value is assumed by this latter specie and it is equal to 0.53. In the paper ID10 [18], it is noticed a strong reduction in the value of the RT Poisson’s ratio, very probably due to the type of specimen geometry, that provides the value of 0.21. Consequently, it is therefore rather difficult to establish a common pattern for the trend followed by this parameter on the examined woods population.
Figure 14: Scatterplot of density (kg/m3) versus Poisson Ratio (pure number) for both softwood (Top plot) and hardwood (Bottom plot) species in LT (Black dots), LR (Dark grey dots), and RT (Light grey dots) directions.
B. Bartolucci et alii, Frattura ed Integrità Strutturale, 54 (2020) 249-274; DOI: 10.3221/IGF-ESIS.54.18
269
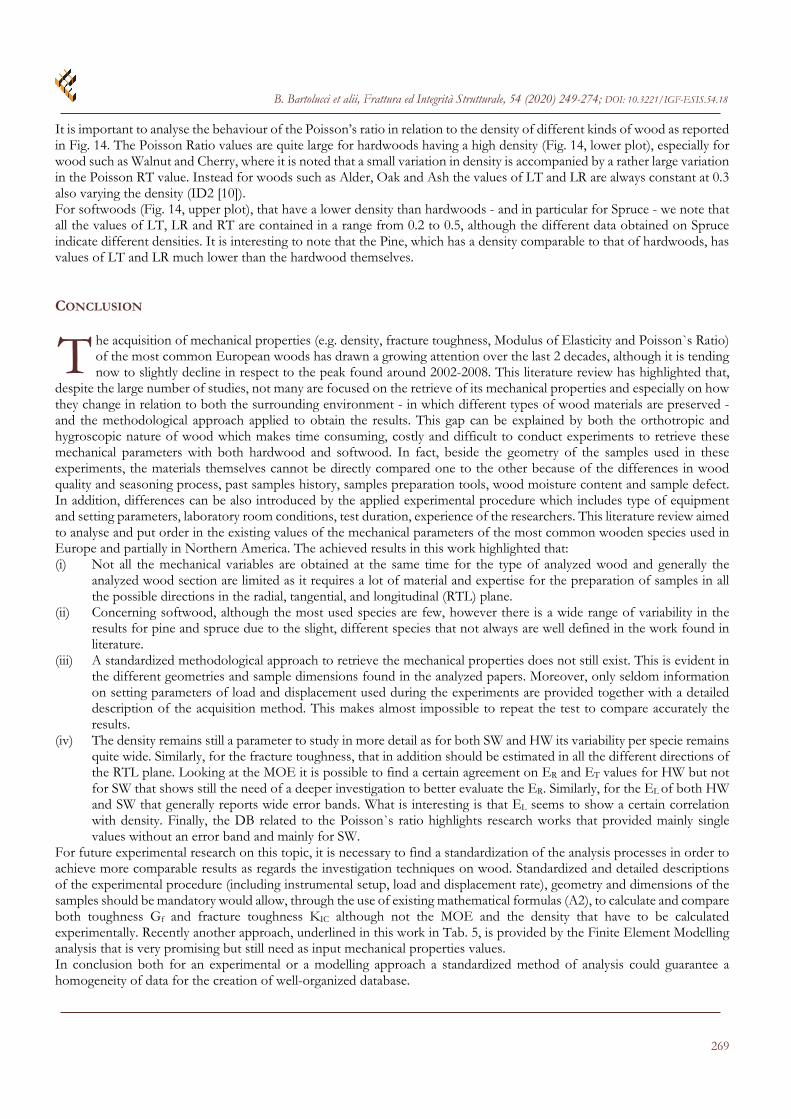
It is important to analyse the behaviour of the Poisson’s ratio in relation to the density of different kinds of wood as reported in Fig. 14. The Poisson Ratio values are quite large for hardwoods having a high density (Fig. 14, lower plot), especially for wood such as Walnut and Cherry, where it is noted that a small variation in density is accompanied by a rather large variation in the Poisson RT value. Instead for woods such as Alder, Oak and Ash the values of LT and LR are always constant at 0.3 also varying the density (ID2 [10]). For softwoods (Fig. 14, upper plot), that have a lower density than hardwoods - and in particular for Spruce - we note that all the values of LT, LR and RT are contained in a range from 0.2 to 0.5, although the different data obtained on Spruce indicate different densities. It is interesting to note that the Pine, which has a density comparable to that of hardwoods, has values of LT and LR much lower than the hardwood themselves. CONCLUSION
he acquisition of mechanical properties (e.g. density, fracture toughness, Modulus of Elasticity and Poisson`s Ratio) of the most common European woods has drawn a growing attention over the last 2 decades, although it is tending now to slightly decline in respect to the peak found around 2002-2008. This literature review has highlighted that,
despite the large number of studies, not many are focused on the retrieve of its mechanical properties and especially on how they change in relation to both the surrounding environment - in which different types of wood materials are preserved - and the methodological approach applied to obtain the results. This gap can be explained by both the orthotropic and hygroscopic nature of wood which makes time consuming, costly and difficult to conduct experiments to retrieve these mechanical parameters with both hardwood and softwood. In fact, beside the geometry of the samples used in these experiments, the materials themselves cannot be directly compared one to the other because of the differences in wood quality and seasoning process, past samples history, samples preparation tools, wood moisture content and sample defect. In addition, differences can be also introduced by the applied experimental procedure which includes type of equipment and setting parameters, laboratory room conditions, test duration, experience of the researchers. This literature review aimed to analyse and put order in the existing values of the mechanical parameters of the most common wooden species used in Europe and partially in Northern America. The achieved results in this work highlighted that: (i) Not all the mechanical variables are obtained at the same time for the type of analyzed wood and generally the
analyzed wood section are limited as it requires a lot of material and expertise for the preparation of samples in all the possible directions in the radial, tangential, and longitudinal (RTL) plane.
(ii) Concerning softwood, although the most used species are few, however there is a wide range of variability in the results for pine and spruce due to the slight, different species that not always are well defined in the work found in literature.
(iii) A standardized methodological approach to retrieve the mechanical properties does not still exist. This is evident in the different geometries and sample dimensions found in the analyzed papers. Moreover, only seldom information on setting parameters of load and displacement used during the experiments are provided together with a detailed description of the acquisition method. This makes almost impossible to repeat the test to compare accurately the results.
(iv) The density remains still a parameter to study in more detail as for both SW and HW its variability per specie remains quite wide. Similarly, for the fracture toughness, that in addition should be estimated in all the different directions of the RTL plane. Looking at the MOE it is possible to find a certain agreement on ER and ET values for HW but not for SW that shows still the need of a deeper investigation to better evaluate the ER. Similarly, for the EL of both HW and SW that generally reports wide error bands. What is interesting is that EL seems to show a certain correlation with density. Finally, the DB related to the Poisson`s ratio highlights research works that provided mainly single values without an error band and mainly for SW.
For future experimental research on this topic, it is necessary to find a standardization of the analysis processes in order to achieve more comparable results as regards the investigation techniques on wood. Standardized and detailed descriptions of the experimental procedure (including instrumental setup, load and displacement rate), geometry and dimensions of the samples should be mandatory would allow, through the use of existing mathematical formulas (A2), to calculate and compare both toughness Gf and fracture toughness KIC although not the MOE and the density that have to be calculated experimentally. Recently another approach, underlined in this work in Tab. 5, is provided by the Finite Element Modelling analysis that is very promising but still need as input mechanical properties values. In conclusion both for an experimental or a modelling approach a standardized method of analysis could guarantee a homogeneity of data for the creation of well-organized database.
T
B. Bartolucci et alii, Frattura ed Integrità Strutturale, 54 (2020) 249-274; DOI: 10.3221/IGF-ESIS.54.18
-270
ACKNOWLEDGEMENTS
he theoretical study has been possible thanks to the Norwegian Research Council funded by the “SyMBoL–Sustainable Management of Heritage Building in a Long-term Perspective” Project (project no. 274749) and the ERASMUS Students Exchange Programme.
REFERENCES [1] Perlin, J. (2005). A Forest Journey: The Story of Wood and Civilization. In: The Countryman Press, (Ed.), Woodstock,
The Countryman Press. [2] Osamah, M.G. (2016). Comparison study between Hardwood and Softwood, J. Babylon Univ. Sci., 23, pp. 563–564. [3] Nikhilesh, J.; Gauri, S.; Pooja, S.; Rupal, B.; T., K. Nikhilesh, J.; Gauri, S.; Pooja, S.; Rupal, B.; T., K.(n.d.). Hardwood
vs. Softwood. Available at: https://www.diffen.com/difference/Hardwood_vs_Softwood. [4] Kretschmann, D.E. (2005). Mechanical Properties of Wood. Wood Handbook, Forest Products Laboratory, pp. 1-44. [5] The Editors of Encyclopaedia Britannica. The Editors of Encyclopaedia Britannica. (2017). Growth ring PLANT
ANATOMY. Available at: https://www.britannica.com/science/growth-ring-plant-anatomy. [6] Signorini, G., Di Giulio, G., Fioravanti, M. (2014). Il legno nei beni culturali: guida alla determinazione delle specie
legnose. [7] Machi, Lawrence A.; McEvoy, B.T. (2016). Preface. In: Press, C., (Ed.), The Literature Review: Six Steps to Success 3rd
ed., United States of America, p. XIV. [8] Create Custom Map - MapChart. Available at: https://mapchart.net/. [9] Vasic, S., Smith, I. (2002). Bridging crack model for fracture of spruce, Eng. Fract. Mech., 69(6), pp. 745–760,
DOI: 10.1016/S0013-7944(01)00091-1. [10] Reiterer, A., Sinn, G., Stanzl-Tschegg, S.E. (2002). Fracture characteristics of different wood species under mode I
loading perpendicular to the grain, Mater. Sci. Eng. A, 332(1–2), pp. 29–36, DOI: 10.1016/S0921-5093(01)01721-X. [11] Reiterer, A., Stanzl-Tschegg, S.E., Tschegg, E.K. (2000). Mode I fracture and acoustic emission of softwood and
hardwood, Wood Sci. Technol., 34(5), pp. 417–430, DOI: 10.1007/s002260000056. [12] Kretschmann, D.E., Green, D.W. (1996). Modeling moisture content-mechanical property relationships for clear
southern pine, Wood Fiber Sci., 28(3), pp. 320–337. [13] Murata, K., Bachtiar, E.V., Niemz, P. (2017). Determination of mode I and mode II fracture toughness of walnut and
cherry in TR and RT crack propagation system by the Arcan test, Holzforschung, 71(12), pp. 985–990, DOI: 10.1515/hf-2017-0063.
[14] Boruvka, V., Zeidler, A., Holeček, T., Dudík, R. (2018). Elastic and strength properties of heat-treated beech and birch wood, Forests, 9(4), DOI: 10.3390/f9040197.
[15] Vasic, S., Stanzl-Tschegg, S. (2007). Experimental and numerical investigation of wood fracture mechanisms at different humidity levels. Holzforschung, 61, pp. 367–374.
[16] Aydin, S., Yardimci, M.Y., Ramyar, K. (2007). Mechanical properties of four timber species commonly used in Turkey, Turkish J. Eng. Environ. Sci., 31(1), pp. 19–27, DOI: 10.3906/tar-1104-1133.
[17] Stanzl-Tschegg, S.E., Filion, L., Tschegg, E.K., Reiterer, A. (1999). Strength properties and density of SO2 polluted spruce wood, Holz Als Roh - Und Werkst., pp. 121–128, DOI: 10.1007/s001070050027.
[18] Keunecke, D., Hering, S., Niemz, P. (2008). Three-dimensional elastic behaviour of common yew and Norway spruce, Wood Sci. Technol., 42(8), pp. 633–647, DOI: 10.1007/s00226-008-0192-7.
[19] Ando, K., Ohta, M. (1999). Variability of fracture toughness by the crack tip position in an annual ring of coniferous wood, J. Wood Sci., 45, pp. 275–283, DOI: 10.1007/BF00833491.
[20] Özden, S., Slater, D., Ennos, R. (2017). Fracture properties of green wood formed within the forks of hazel (Corylus avellana L.), Trees - Struct. Funct., 31(3), pp. 903–917, DOI: 10.1007/s00468-016-1516-0.
[21] Foselius, M., Riipola, K. (1992). Determination of fracture toughness for wood, J. Struct. Eng., 118, pp. 1727–40. [22] Le-Ngoc, L., mC Callion, H. (1997). On the fracture toughness of orthotropic materials, Eng. Fract. Mech., 58, pp.
355–362. [23] Petterson, R., Bodig, J. (1983). Prediction of fracture toughness of conifers, Soc. Wood Sci. Technol., 15(4), pp. 302–
316.
T
B. Bartolucci et alii, Frattura ed Integrità Strutturale, 54 (2020) 249-274; DOI: 10.3221/IGF-ESIS.54.18
271
[24] Tukiainen, P., Hughes, M. (2016). The effect of temperature and moisture content on the fracture behaviour of spruce and birch, Holzforschung, 70(4), pp. 369–376, DOI: 10.1515/hf-2015-0017.
[25] Tukiainen, P., Koponen, S. (2006). Fracture behaviour of small wood specimens in RT-direction. 9th World Conference on Timber Engineering 2006, WCTE 2006, 1, pp. 136–143.
[26] Piazza, M., Tomasi, R., Modena, R. (2005). Strutture in legno - materiale, calcolo e progetto secondo le nuove normative europee, Milano.
[27] Güntekin, E., Akar, S. (2019). Influence of moisture content on elastic constants of scots pine wood subjected to compression, Drewno, 62, pp. 41–53, DOI: 10.12841/wood.1644-3985.220.09.
[28] Potter, K. (2006). Methods for Presenting Statistical Information: The Box Plot. In: Informatik, G. fur, (Ed.), Visualization of Large and Unstructured Data Sets, Dagstuhl, Germany, pp. 97–106.
[29] Keim, Daniel A.; Hao, Ming C.; Dayal, Umeshwar; Janetzko, Halldor; Bak, P. (2009). Generalized scatter plots, Palgrave Macmillan Journals, 9, pp. 301–331, DOI: 10.1057/ivs.2009.34.
[30] D. Kretschmann. (2005). Characteristics and Availability of Commercially Important Woods. Wood Handbook, Forest Products Laboratory, pp. 3–40.
[31] Nixon, S., Read, R., Hoddinott, R., Lee, B., Campbell, L. Nixon, S., Read, R., Hoddinott, R., Lee, B., Campbell, L.(n.d.). Hazel (Corylus avellana). Available at: https://www.woodlandtrust.org.uk/trees-woods-and-wildlife/british-trees/a-z-of-british-trees/hazel/.
APPENDIX – SECTION 1
he information written in this section, except for hazelnut wood, are taken from Chapter 2 of the book “Wood Handbook - Wood as an Engineering Material” [30]. Alder: The wood of red alder varies from white to pale pinkish brown, and there is no visible boundary between
heartwood and sapwood. Red alder is moderately light in weight and intermediate in most strength properties but low in shock resistance. It has relatively low shrinkage. The principal use of red alder is for furniture, but it is also used for sash and door panel stock and others millwork. Ash: there are two groups of ash: the black ash group and the white ash group. The heartwood of black ash is a darker brown than that of white ash; the sapwood is light-coloured or nearly white. The wood of the black ash group is lighter in weight (basic specific gravity of 0.45 to 0.48) than that of the white ash group (basic specific gravity greater than 0.50). Principal uses for the black ash group are decorative veneer, cabinets, millwork, furniture, cooperage, and crates. Important species of the white ash group are American white ash (Fraxinus americana), green ash (F. pennsylvanica), blue ash (F. quadrangulata), and Oregon ash (F. latifolia). The heartwood of the white ash group is brown, and the sapwood is light-coloured or nearly white. Second-growth trees are particularly sought after because of the inherent qualities of the wood from these trees: it is heavy, strong, hard, and stiff, and it has high resistance to shock. Principal uses for the white ash group are decorative veneer, cabinets, furniture, flooring, millwork, and crates Beech: In some beech trees, colour varies from nearly white sapwood to reddish-brown heartwood. Sometimes there is no clear line of demarcation between heartwood and sapwood. The wood has uniform texture and no characteristic taste or odour, is heavy, hard, strong, high in resistance to shock, and highly suitable for steam bending. Beech shrinks substantially, therefore requires careful drying. It machines smoothly, is an excellent wood for turning, wears well, and is rather easily treated with preservatives. Most beech is used for flooring, furniture, brush blocks, handles, veneer, woodenware, containers, and cooperage. When treated with preservative, beech is suitable for railway ties. Birch: The three most important species are yellow birch (Betula alleghaniensis), sweet birch (B. lenta), and paper birch (B. papyrifera). These three species are the source of most birch lumber and veneer. Yellow birch has white sapwood and light reddish-brown heartwood. Sweet birch has light-coloured sapwood and dark brown heartwood tinged with red. For both yellow and sweet birch, the wood is heavy, hard, and strong, and has good shock-resisting ability. The wood is fine and uniform in texture. Paper birch is lower in weight, softer, and lower in strength than yellow and sweet birch. Birch shrinks considerably during drying. Yellow and sweet birch lumber is used primarily for the manufacture of furniture, boxes, baskets, crates, wooden ware, cooperage, interior woodwork, and doors; veneer plywood is used for doors, furniture, panelling, cabinets, aircraft, and other specialty uses. Paper birch is used for toothpicks, tongue depressors, ice cream sticks, and turned products, including spools, bobbins, small handles, and toys. Cherry: Black cherry (Prunus serotina) is sometimes known as cherry, wild black cherry, and wild cherry. It is the only native species of the genus Prunus that produces commercial lumber. The heartwood of black cherry varies from light to dark reddish brown and has a distinctive luster. The nearly white sapwood is narrow in old-growth trees and wider in second
T
B. Bartolucci et alii, Frattura ed Integrità Strutturale, 54 (2020) 249-274; DOI: 10.3221/IGF-ESIS.54.18
-272
growth trees. The wood has a uniform texture and very good machining properties. It is moderately heavy, strong, stiff, and moderately hard, with high shock resistance. Although it has moderately high shrinkage, it is very dimensionally stable after drying. Black cherry is used principally for furniture, fine veneer panels, and architectural woodwork. Other uses include burial caskets, wooden ware, novelties, patterns, and panelling. Hazel: Hazel grows across much of Europe, parts of north Africa and western Asia. It is part of the Betulaceae family, and it has a smooth, grey-brown, bark, which peels with age, and bendy, hairy stems. Leaf buds are oval, blunt, and hairy. Hazel wood can be twisted or knotted, and as such it historically had many uses. These included thatching spars, net stakes, water-divining sticks, hurdles, and furniture. Hazel was also valued for its nuts, or 'cobs'. Today, hazel coppice has become an important management strategy in the conservation of woodland habitats for wildlife. The resulting timber is used in lots of ways and is becoming increasingly popular as pea sticks and bean poles used by gardeners [31] Oak: The principal species are northern red (Quercus rubra), scarlet (Q. coccinea), Shumard (Q. shumardii), pin (Q. palustris), Nuttall (Q. nuttallii), black (Q. velutina), southern red (Q. falcata), cherrybark (Q. falcata var. pagodaefolia), water (Q. nigra), laurel (Q. laurifolia), and willow (Q. phellos) oak. The sapwood is nearly white and roughly 2 to 5 cm (1 to 2 in.) wide. The heartwood is brown with a tinge of red. Red oak lumber can be separated from white oak by the size and arrangement of pores in latewood and because it generally lacks tyloses in the pores. The open pores of red oak make this species group unsuitable for tight cooperage, unless the barrels are lined with sealer or plastic. Wood of the red oaks is heavy and have high shrinkage upon drying. Red oak lumber is remanufactured into flooring, furniture, general millwork, boxes, pallets and crates, agricultural implements, caskets, wooden ware, and handles. It is also used in railroad cars and boats. Walnut: The heartwood of black walnut varies from light to dark brown; the sapwood is nearly white and up to 8 cm (3 in.) wide in open-grown trees. Black walnut is normally straight grained, easily worked with tools, and stable in use. It is heavy, hard, strong, and stiff, and has good resistance to shock. Black walnut is well suited for natural finishes. Because of its good properties, black walnut is much valued for furniture, architectural woodwork, decorative panels and for interior woodworks. Fir: Douglas-fir (Pseudotsuga menziesii) is also known locally as red-fir, Douglas-spruce, and yellow-fir. Sapwood of Douglas-fir is narrow in old-growth trees but may be as much as 7 cm (3 in.) wide in second-growth trees of commercial size. Young trees of moderate to rapid growth have reddish heartwood and are called red-fir. Very narrow-ringed heartwood of old-growth trees may be yellowish brown and is known as yellow-fir. The wood of Douglas-fir varies widely in weight and strength. Douglas-fir is used mostly for building and construction purposes in the form of lumber, marine fendering, piles, plywood, and engineered wood composites. Pine: The most prized varieties are the Nordic ones, with straight stems and great development in height and sparse and thin branches. Red pine (Pinus resinosa) is frequently called Norway pine. The heartwood of red pine varies from pale red to reddish brown. The sapwood is nearly white with a yellowish tinge and is generally from 5 to 10 cm (2 to 4 in.) wide. The wood resembles the lighter weight wood of the Southern Pine species group. Red pine is moderately heavy, strong, and stiff and soft, and moderately high in shock resistance. It is generally straight grained, not as uniform in texture as eastern white pine (P. strobus), and somewhat resinous. The wood has moderately high shrinkage, but it is not difficult to dry and is dimensionally stable when dried. Red pine is used principally for lumber, cabin logs, and pulpwood, and to a lesser extent for piles, poles, posts, and fuel. The lumber is used for many of the same purposes as for eastern white pine (P. strobus). Red pine lumber is used primarily for building construction, including treated lumber for decking, siding, flooring, sashes, doors, general millwork, and boxes, pallets, and crates Spruce: Very common especially in the northern Europe and in Scandinavian countries and part of Russia. The heartwood of Engelmann spruce is nearly white, with a slight tinge of red. The sapwood varies from 2 to 5 cm (1 to 2 in.) in width and is often difficult to distinguish from the heartwood. The wood has medium to fine texture and is without characteristic odour. Engelmann spruce is rated as lightweight, and it is low in strength. It is also soft and low in stiffness, shock resistance, and shrinkage. The lumber typically contains many small knots. Engelmann spruce has excellent properties for pulp and papermaking. Sitka spruce (Picea sitchensis) is a large tree that grows along the north western coast of North America from California to Alaska. It is also known as yellow, tideland, western, silver, and west coast spruce. Much Sitka spruce timber is grown in Alaska, but most logs are sawn into cants for export to Pacific Rim countries. Material for U.S. consumption is produced primarily in Washington and Oregon. The heartwood of Sitka spruce is a light pinkish brown. The sapwood is creamy white and shades gradually into the heartwood; the sapwood may be 7 to 15 cm (3 to 6 in.) wide or even wider in young trees. The wood has a comparatively fine, uniform texture, generally straight grain, and no distinct taste or odour. It is moderately lightweight, moderately low in bending and compressive strength, moderately stiff, soft, and moderately low in resistance to shock and shrinkage. Based on weight, Sitka spruce rates high in strength properties and can be obtained in long, clear, straight-grained pieces. Sitka spruce is used principally for lumber, pulpwood, and cooperage. Sitka spruce has
B. Bartolucci et alii, Frattura ed Integrità Strutturale, 54 (2020) 249-274; DOI: 10.3221/IGF-ESIS.54.18
273
been by far the most important wood for aircraft construction and other specialty uses are ladder rails and sounding boards for pianos. APPENDIX – SECTION 2
2IC
fK
G =E
(1)
I B B C C-1
II B B C C
K 4 u -u -(u -u )π= B
K 4 v -v -(v -v )8L
(2)
maxIC I
FK =ζ π a
w t
(3)
IC Ca
K =σ πa FW
(4)
CIC I1
2
PK = Y
bw
(5)
IC 3
2
PS aK = f
WBW
(6)
ICg gK =400 S (7)
-1.5
IC max 0.5
a1-
WK =3.657 F BW
(8)
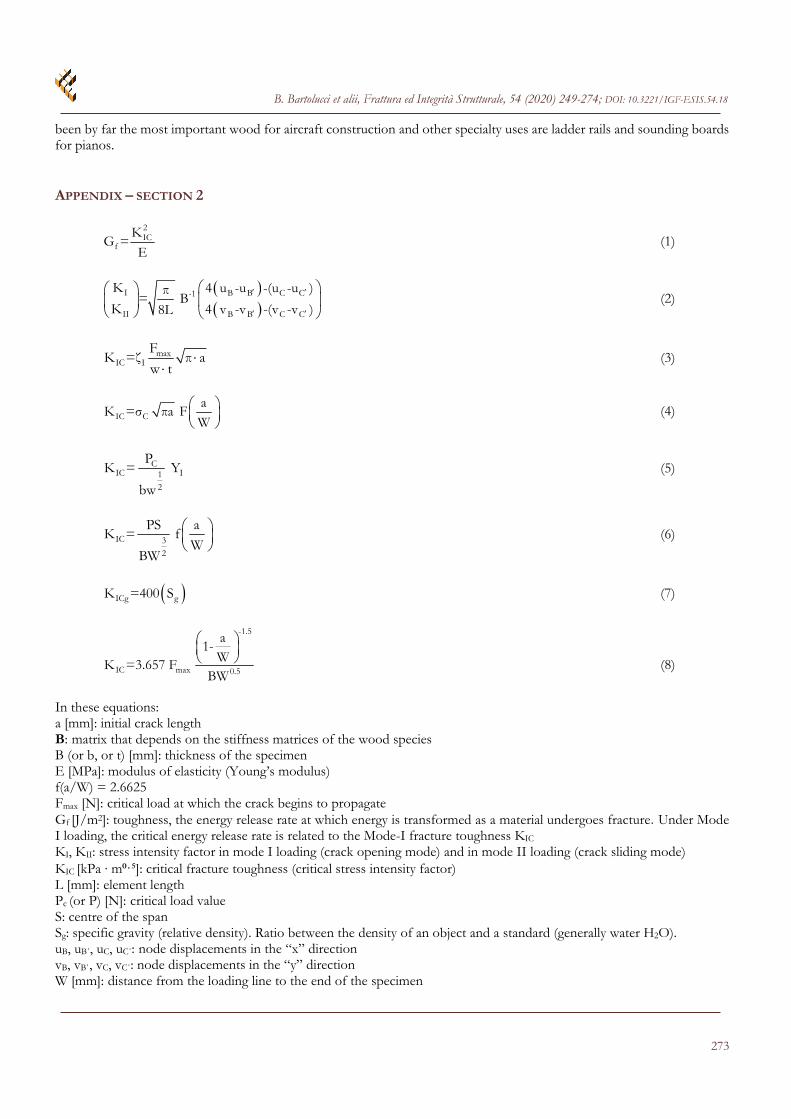
In these equations: a [mm]: initial crack length B: matrix that depends on the stiffness matrices of the wood species B (or b, or t) [mm]: thickness of the specimen E [MPa]: modulus of elasticity (Young’s modulus) f(a/W) = 2.6625 Fmax [N]: critical load at which the crack begins to propagate Gf [J/m2]: toughness, the energy release rate at which energy is transformed as a material undergoes fracture. Under Mode I loading, the critical energy release rate is related to the Mode-I fracture toughness KIC KI, KII: stress intensity factor in mode I loading (crack opening mode) and in mode II loading (crack sliding mode) KIC [kPa · m⁰⸱⁵]: critical fracture toughness (critical stress intensity factor) L [mm]: element length Pc (or P) [N]: critical load value S: centre of the span Sg: specific gravity (relative density). Ratio between the density of an object and a standard (generally water H2O). uB, uB΄, uC, uC΄: node displacements in the “x” direction vB, vB΄, vC, vC΄: node displacements in the “y” direction W [mm]: distance from the loading line to the end of the specimen
B. Bartolucci et alii, Frattura ed Integrità Strutturale, 54 (2020) 249-274; DOI: 10.3221/IGF-ESIS.54.18
-274
w [mm]: width of the specimen YI (or F(a/W)): shape factor ζI: correction factor = 2810 σC: critical stress The equations above are mentioned with their specific number in Tab. 5. They are associated to the papers whose references are shown in Tab. 2.