The Distribution and Most Recent Common Ancestor of the 17q21 Inversion in Humans
11
ARTICLE The Distribution and Most Recent Common Ancestor of the 17q21 Inversion in Humans Michael P. Donnelly, 1 Peristera Paschou, 4 Elena Grigorenko, 2 David Gurwitz, 5 Syed Qasim Mehdi, 6 Sylvester L.B. Kajuna, 7 Csaba Barta, 8 Selemani Kungulilo, 9 N.J. Karoma, 7 Ru-Band Lu, 10 Olga V. Zhukova, 11 Jong-Jin Kim, 12 David Comas, 13,14 Marcello Siniscalco, 15 Maria New, 16 Peining Li, 3 Hui Li, 17 Vangelis G. Manolopoulos, 18 William C. Speed, 1 Haseena Rajeevan, 1 Andrew J. Pakstis, 1 Judith R. Kidd, 1 and Kenneth K. Kidd 1, * The polymorphic inversion on 17q21, sometimes called the microtubular associated protein tau (MAPT) inversion, is an ~900 kb inver- sion found primarily in Europeans and Southwest Asians. We have identified 21 SNPs that act as markers of the inverted, i.e., H2, haplo- type. The inversion is found at the highest frequencies in Southwest Asia and Southern Europe (frequencies of ~30%); elsewhere in Europe, frequencies vary from < 5%, in Finns, to 28%, in Orcadians. The H2 inversion haplotype also occurs at low frequencies in Africa, Central Asia, East Asia, and the Americas, though the East Asian and Amerindian alleles may be due to recent gene flow from Europe. Molecular evolution analyses indicate that the H2 haplotype originally arose in Africa or Southwest Asia. Though the H2 inversion has many fixed differences across the ~900 kb, short tandem repeat polymorphism data indicate a very recent date for the most recent common ancestor, with dates ranging from 13,600 to 108,400 years, depending on assumptions and estimation methods. This estimate range is much more recent than the 3 million year age estimated by Stefansson et al. in 2005. 1 Introduction What was shown to be an inversion on 17q21 by Stefans- son et al. had initially been shown to be an ~100 kb region of complete linkage disequilibrium encompassing the microtubule-associated protein tau gene (MAPT [MIM 157140]). 1 Baker et al. named the most common haplo- type H1 and the less common haplotype H2. 2 Later, Pastor et al. extended the region of known complete disequilib- rium to ~700 kb. 3 Stefansson et al. then showed that the H1 and H2 haplotypes showed complete disequilibrium because H2 was inverted with respect to H1, the common human reference sequence, and actually extends ~900 kb. 1 The inversion encompasses a number of genes within its 900 kb extent. The MAPT gene is one of the most studied of these because of its association with neurodegenerative disorders (see below). Many of the other genes are also associated with neural function and development. Absence of recombination between the inverted and the noninverted chromosomes has resulted in two families of chromosomes: H1 chromosomes, which comprise the common human noninverted gene order, and H2 haplo- type, which comprises the inverted gene order. The H1 family of haplotypes has been associated with a number of tauopathies, diseases marked by the accumulation of MAPT neurofibrillary tangles in nerve cells, such as sporadic frontotemporal dementia (FTD [MIM 600274]), Alzheimer disease (AD [MIM 104300]), Parkinson disease (MIM 168600), and progressive supranuclear palsy (PSP [MIM 601104]). 4 The H2 haplotype has also been associ- ated with familial FTD by one group, though this associa- tion has yet to be replicated. 5 H2 chromosomes also seem to be susceptible to de novo deletions that lead to developmental delay and learning difficulties. 6–8 More- over, the promoter region of MAPT in H1 chromosomes is more efficient at driving transcription than the promoter sequence on the H2 haplotype. 9 This has been shown to be particularly true with the H1c subhaplotype. 10 Most work in this region has been focused on disease susceptibility and protection associated with the H2 haplo- types; only a few studies have looked at the population genetics of the inversion. On the basis of our data, 1 Department of Genetics, School of Medicine, Yale University, New Haven, CT 06520, USA; 2 Child Study Center, School of Medicine, Yale University, New Haven, CT 06520, USA; 3 Molecular Cytogenetics Laboratory, Department of Genetics, School of Medicine, Yale University, New Haven, CT 06520 USA; 4 Department of Molecular Biology and Genetics, Democritus University of Thrace, Alexandroupoli 68 100, Greece; 5 National Laboratory for the Genetics of Israeli Populations, Department of Human Molecular Genetics and Biochemistry, Sackler Faculty of Medicine, Tel Aviv University, Tel Aviv 69978, Israel; 6 Sindh Institute of Urology and Transplantation (SIUT), Karachi 74200, Pakistan; 7 Department of Biochemistry and Molecular Biology, Hubert Kairuki Memorial University, Dar es Salaam, Tanzania; 8 Institute of Medical Chemistry, Molecular Biology and Pathobiochemistry, Semmelweis, Budapest, Hungary; 9 Muhimbili University College of Health Sciences, Dar es Salaam, Tanzania; 10 Department of Psychiatry, College of Medicine and Hospital, National Cheng-Kung University, Tainan, Taiwan, ROC; 11 N.I. Vavilov Institute of General Genetics, Russian Academy of Sciences, Moscow, Russia; 12 DNA Analysis Division, National Institute of Scientific Investigation, Seoul, Korea; 13 Institute of Evolutionary Biology (CSIC-UPF), Department of Exper- imental and Health Sciences (UPF-PRBB), 08003 Barcelona, Spain; 14 Centro de Investigacio ´n Biome ´dica en Red (CIBER), Epidemiologı ´a y Salud Pu ´ blica, Aiguader 88, Barcelona 08003, Spain; 15 Laboratory of Statistical Genetics, The Rockefeller University, New York, NY 10021, USA; 16 Genetics and Genomic Sciences, The Mount Sinai School of Medicine, New York, NY 10029, USA; 17 Ministry of Education Key Laboratory of Contemporary Anthropology and Center for Evolutionary Biology, School of Life Sciences and Institute of Biomedical Sciences, Fudan University, Shanghai 200433, P.R. China; 18 Laboratory of Pharmacology, Medical School, Democritus University of Thrace, Dragana Campus, 68100 Alexandroupolis, Greece *Correspondence: [email protected] DOI 10.1016/j.ajhg.2010.01.007. ª2010 by The American Society of Human Genetics. All rights reserved. The American Journal of Human Genetics 86, 161–171, February 12, 2010 161
-
Upload
independent -
Category
Documents
-
view
0 -
download
0
Transcript of The Distribution and Most Recent Common Ancestor of the 17q21 Inversion in Humans

ARTICLE
The Distribution and Most Recent Common Ancestorof the 17q21 Inversion in Humans
Michael P. Donnelly,1 Peristera Paschou,4 Elena Grigorenko,2 David Gurwitz,5 Syed Qasim Mehdi,6
Sylvester L.B. Kajuna,7 Csaba Barta,8 Selemani Kungulilo,9 N.J. Karoma,7 Ru-Band Lu,10
Olga V. Zhukova,11 Jong-Jin Kim,12 David Comas,13,14 Marcello Siniscalco,15 Maria New,16 Peining Li,3
Hui Li,17 Vangelis G. Manolopoulos,18 William C. Speed,1 Haseena Rajeevan,1 Andrew J. Pakstis,1
Judith R. Kidd,1 and Kenneth K. Kidd1,*
The polymorphic inversion on 17q21, sometimes called the microtubular associated protein tau (MAPT) inversion, is an ~900 kb inver-
sion found primarily in Europeans and Southwest Asians. We have identified 21 SNPs that act as markers of the inverted, i.e., H2, haplo-
type. The inversion is found at the highest frequencies in Southwest Asia and Southern Europe (frequencies of ~30%); elsewhere in
Europe, frequencies vary from< 5%, in Finns, to 28%, in Orcadians. The H2 inversion haplotype also occurs at low frequencies in Africa,
Central Asia, East Asia, and the Americas, though the East Asian and Amerindian alleles may be due to recent gene flow from Europe.
Molecular evolution analyses indicate that the H2 haplotype originally arose in Africa or Southwest Asia. Though the H2 inversion has
many fixed differences across the ~900 kb, short tandem repeat polymorphism data indicate a very recent date for the most recent
common ancestor, with dates ranging from 13,600 to 108,400 years, depending on assumptions and estimation methods. This estimate
range is much more recent than the 3 million year age estimated by Stefansson et al. in 2005.1
Introduction
What was shown to be an inversion on 17q21 by Stefans-
son et al. had initially been shown to be an ~100 kb region
of complete linkage disequilibrium encompassing the
microtubule-associated protein tau gene (MAPT [MIM
157140]).1 Baker et al. named the most common haplo-
type H1 and the less common haplotype H2.2 Later, Pastor
et al. extended the region of known complete disequilib-
rium to ~700 kb.3 Stefansson et al. then showed that the
H1 and H2 haplotypes showed complete disequilibrium
because H2 was inverted with respect to H1, the common
human reference sequence, and actually extends ~900 kb.1
The inversion encompasses a number of genes within its
900 kb extent. The MAPT gene is one of the most studied
of these because of its association with neurodegenerative
disorders (see below). Many of the other genes are also
associated with neural function and development.
Absence of recombination between the inverted and the
noninverted chromosomes has resulted in two families of
chromosomes: H1 chromosomes, which comprise the
1Department of Genetics, School of Medicine, Yale University, New Haven, CT
Haven, CT 06520, USA; 3Molecular Cytogenetics Laboratory, Department of G4Department of Molecular Biology and Genetics, Democritus University of Th
of Israeli Populations, Department of Human Molecular Genetics and Biochem6Sindh Institute of Urology and Transplantation (SIUT), Karachi 74200, Paki
Memorial University, Dar es Salaam, Tanzania; 8Institute of Medical Chem
Hungary; 9Muhimbili University College of Health Sciences, Dar es Salaam,
National Cheng-Kung University, Tainan, Taiwan, ROC; 11N.I. Vavilov Insti12DNA Analysis Division, National Institute of Scientific Investigation, Seoul, K
imental and Health Sciences (UPF-PRBB), 08003 Barcelona, Spain; 14Centro d
Aiguader 88, Barcelona 08003, Spain; 15Laboratory of Statistical Genetics, The
Sciences, The Mount Sinai School of Medicine, New York, NY 10029, USA; 17
Center for Evolutionary Biology, School of Life Sciences and Institute of Biome
of Pharmacology, Medical School, Democritus University of Thrace, Dragana
*Correspondence: [email protected]
DOI 10.1016/j.ajhg.2010.01.007. ª2010 by The American Society of Human
The America
common human noninverted gene order, and H2 haplo-
type, which comprises the inverted gene order. The H1
family of haplotypes has been associated with a number
of tauopathies, diseases marked by the accumulation of
MAPT neurofibrillary tangles in nerve cells, such as
sporadic frontotemporal dementia (FTD [MIM 600274]),
Alzheimer disease (AD [MIM 104300]), Parkinson disease
(MIM 168600), and progressive supranuclear palsy (PSP
[MIM 601104]).4 The H2 haplotype has also been associ-
ated with familial FTD by one group, though this associa-
tion has yet to be replicated.5 H2 chromosomes also
seem to be susceptible to de novo deletions that lead to
developmental delay and learning difficulties.6–8 More-
over, the promoter region of MAPT in H1 chromosomes
is more efficient at driving transcription than the promoter
sequence on the H2 haplotype.9 This has been shown to be
particularly true with the H1c subhaplotype.10
Most work in this region has been focused on disease
susceptibility and protection associated with the H2 haplo-
types; only a few studies have looked at the population
genetics of the inversion. On the basis of our data,
06520, USA; 2Child Study Center, School of Medicine, Yale University, New
enetics, School of Medicine, Yale University, New Haven, CT 06520 USA;
race, Alexandroupoli 68 100, Greece; 5National Laboratory for the Genetics
istry, Sackler Faculty of Medicine, Tel Aviv University, Tel Aviv 69978, Israel;
stan; 7Department of Biochemistry and Molecular Biology, Hubert Kairuki
istry, Molecular Biology and Pathobiochemistry, Semmelweis, Budapest,
Tanzania; 10Department of Psychiatry, College of Medicine and Hospital,
tute of General Genetics, Russian Academy of Sciences, Moscow, Russia;
orea; 13Institute of Evolutionary Biology (CSIC-UPF), Department of Exper-
e Investigacion Biomedica en Red (CIBER), Epidemiologıa y Salud Publica,
Rockefeller University, New York, NY 10021, USA; 16Genetics and Genomic
Ministry of Education Key Laboratory of Contemporary Anthropology and
dical Sciences, Fudan University, Shanghai 200433, P.R. China; 18Laboratory
Campus, 68100 Alexandroupolis, Greece
Genetics. All rights reserved.
n Journal of Human Genetics 86, 161–171, February 12, 2010 161

previously deposited in ALFRED, on two SNPs associated
with the inversion, Stefansson et al.1 estimated the inver-
sion haplotype frequency to be 20% in Europeans, 6% in
Africans, and < 1% in East Asians. They also used
maximum-parsimony trees to suggest that the H1 and
H2 lineages diverged approximately 3 million years ago,
a pre-Homo sp. origin of the inversion. It would be odd
(though not impossible) for a polymorphism such as this
to remain polymorphic through such a long series of speci-
ations. Finally, they used reproductive rates in Icelanders
to suggest that the H2 lineage is under positive selection
in Europeans. They showed that women who have at least
one copy of the inversion have more children than those
who do not, though the difference is less than one child
per woman. They favored a balancing selection model
but were unable to rule out a dominant model of selec-
tion.1
Work has begun on the organization of this region in
nonhuman primates (NHPs). Holzer et al.11 resequenced
the exons and flanking intronic regions of MAPT, as well
as Saitohin (STH [MIM 607067]), a gene that is found in
intron 9 of the MAPT gene in chimpanzees, gorillas, and
gibbons. They also partially sequenced cynomolgus
macaque (Macaca fascicularis) and green monkey (Chloro-
cebus sabaeus). They typed eight inversion markers in
the NHPs and found that seven corresponded to the H2
allele in humans. They concluded that NHPs had the
H2 version of the MAPT gene and that this agrees with
the finding that NHPs seem less susceptible to tauopathies
than do H1 humans.11 More recently, Zody et al. used
fluorescence in situ hybridization (FISH) to study the
orientation of this region in NHPs. They found that the
inversion is highly polymorphic in both Pan species as
in Pongo, whereas the H2 inverted orientation is predom-
inant in Macaca. They proposed that this region is suscep-
tible to recurrent inversion throughout the primate
lineage. They concluded that in the human lineage, an
inversion event occurred on an ancestral primate H2
chromosome ~2.3 million years ago. The resulting H1
orientation then rose to extremely high frequencies in hu-
mans, almost completely replacing the ancestral H2 in-
verted orientation. The H2 inverted orientation then
rose to higher frequencies in Europe by means of selection
or a founder effect.12
Here, we present our results on the global distribution
of haplotypes by using SNPs and short tandem repeat
polymorphisms (STRPs). We provide a detailed descrip-
tion of the distributions of both the H2 family of haplo-
types, including the individual haplotypes within this
family, and the H1 haplotypes. We describe these haplo-
types and their component SNPs in NHPs. Finally, we
estimate a time period for the most recent common
ancestor (MRCA) of the MAPT H2 chromosome by using
STRP haplotypes. Our data and analyses argue that the H2
chromosome inversion in humans arose in Africa or
Southwest Asia and may be younger than previously
believed.
162 The American Journal of Human Genetics 86, 161–171, February
Material and Methods
Population SamplesWe typed SNPs in 3135 individuals from a global sample of 66 pop-
ulations. The populations represent the regions of Africa (13 pop-
ulations), Southwest Asia (5), Europe (16), Central Asia (9), East
Asia (10), the Pacific Islands (4), North America (4), and South
America (5) (Table 1). STRPs were typed in a subset of these popu-
lation samples. We also typed 15 NHPs: three each of chimpanzee
(Pan troglodytes), bonobo (Pan paniscus), gorilla (Gorilla gorilla),
orangutan (Pongo pygmaeus), and gibbon (Hylobates). Moreover,
we included published data on other populations in some of our
analyses: those in the Human Genome Diversity Panel
(HGDP),13,14 English,15 Icelandic,1 Norwegian,16 German,17
Serbian,17 and Brescia Italian.5 Smaller HGDP population samples
were combined with closely related populations to form larger
samples for our analyses (Table 1).
DNA samples for 57 populations were extracted from lympho-
blastoid cell lines. The cell lines were established and/or main-
tained in the lab of Kenneth K. and Judith R. Kidd at Yale Univer-
sity, via common techniques described elsewhere.18,19 Some cell
lines were established by the Coriell Cell Repositories and others
by the National Laboratory for the Genetics of Israeli Populations
at Tel-Aviv University. The DNA for nine other populations
samples were obtained as DNA only from colleagues or the Coriell
Cell Repositories. All samples were collected with informed
consent by participants and with approval by all relevant institu-
tional review boards.
SNPsWe typed a total of 90 SNPs covering approximately 600 Kb
within the boundaries of the inversion with an average of one
SNP every 6.6 Kb. Of the 90 SNPs, 39 were typed with Applied Bi-
osystems TaqMan assays and the other 51 were typed on a custom
Illumina bead array (Table S1, available online). All TaqMan
markers were typed on 46 populations. Some samples from addi-
tional populations were typed for a subset of the markers either
because only a limited amount of DNA was available or because
the samples were included to extend initial findings. These addi-
tional populations include Lisongo, Zaramo, Somali, Kuwaiti,
Greeks, Toscani, Roman Jews, Sardinians, Spanish Basque,
Catalan, Mohanna, Negroid Makrani, Hazara, Thoti, Kachari,
Papua-New Guineans, Samoans, Malaysians, and Guihiba. Illu-
mina markers were typed on all populations with the exception
of the Spanish Basque, Catalan, and Malaysians. TaqMan assays
were performed in 384 well plates with the use of ~50–100 ng
of DNA per well. Results were analyzed with the ABI Prism
Sequence Detection System.
FiberFISHWe confirmed the presence of an inverted chromosome in a single
heterozygous Irish sample by using fiberFISH. DNA was obtained
from a lymphoblastoid cell line during interphase. The interphase
chromosomes were then probed with two bacterial artificial chro-
mosomes (BACs) within the boundaries of the inversion (413P22
and 243L6) and with another probe that fell outside of the inver-
sion (79O18). In noninverted chromosomes 243L6 is situated next
to 79O18, and in inverted chromosomes 413P22 is situated next
to 79O18.
12, 2010

STRPsWe typed four STRPs within the boundaries of the inversion (Table
S2). STRPs were identified by Tandem Repeat Finder. STRPs were
typed via PCR with the use of fluorescently labeled primers (Table
S2). Lengths of PCR products were determined on an Applied Bio-
systems 3100 sequencer.
AnalysesHaplotypes based on SNPs were estimated with fastPHASE;20
haplotypes incorporating STRPs were estimated with PHASE.21,22
The MRCA of the inversion was estimated via the technique
described by Stephens et al.23
Results
SNPs within the Inversion Region
The allele frequencies for all 90 SNPs in all 46 populations
are available in ALFRED. On the basis of the 2005 Stefans-
son et al. study and disease-association studies, we used
alleles at 21 SNPs (Table 2) to identify inversion (H2) chro-
mosomes. LD between the SNPs defining the inversion,
i.e., the H2 haplotype (Table 2), and haplotypes including
all SNPs allowed us to identify the allelic configuration on
the inverted chromosomes in each population (Figure 1).
Of the 90 SNPs, 65 (72.2%) were polymorphic on the H1
chromosomes but monomorphic on the H2 inversion chro-
mosomes (Table S1). For five of these 65 SNPs, the H2 allele
was rare on the H1 chromosomes. For 21 of the 90 SNPs
(23.3%), one allele was specific to the H1 chromosomes
and the other was specific to the H2 inversion chromo-
somes. Only one of the 90 SNPs that we typed, rs1724427,
is monomorphic on the H1 chromosomes and polymor-
phic on the H2 chromosomes. Three of the 90 SNPs
(3.3%) appeared to be polymorphic on both the H1 and
H2 chromosomes. Although the typing results for these
three SNPs are reproducible, this may not represent true
polymorphism on H2 chromosomes, because almost all
evidence is based on SNP ‘‘homozygosity’’ even though
there was clear H1/H2 haplotype heterozygosity. A poly-
morphism directly nearby that interferes with the probe
or a deletion at this site on the H2 chromosome leading to
effective hemizygosity could also explain the data. More
studies of these instances will need to be undertaken.
It should be noted that we assume that all chromosomes
with the H2 haplotype are in fact in the inverted orienta-
tion. As mentioned earlier, the molecular equivalence of
the inversion and the H2 haplotype was first identified
by Stefansson et al.1 They used the RB-11 BAC clone
library, which they identified as being an H1/H2 heterozy-
gote by using the dinucleotide marker DG17S142 and
a 238 bp deletion that identified H2 chromosomes. Gijse-
linck et al., using FISH on mechanically stretched meta-
phase chromosomes, first visualize the inversion in H2/
H2 homozygous individuals compared to H1/H1 homozy-
gous indivduals.24 Zody et al.12 used metaphase FISH to
confirm the association between two known H2 marker
SNPs and an actual inversion phenotype in 25 HapMap
The America
cell lines (three of the chromosomes were H2). We have
used a tricolor fiberFISH method to cytogenetically
confirm the inversion in a heterozygous Irish sample
(Figure 2). Thus, several H2-specific markers have been
shown to cytogenetically identify the inversion in the
different studies involving five H2 chromosomes and 47
H1 chromosomes. Unfortunately, these cases all represent
Northwestern Europeans, or an individual of unknown
ancestry, in the case of the RP-11 BAC. We feel confident
that these results can be extrapolated throughout the rest
of Europe and into Southwest Asia and North Africa;
however, furthur confirmation in these regions is desir-
able. For the present, we are considering the H2 haplotype
and the inversion to be equivalent.
The Comparable Chromosome Region in Nonhuman
Primates
We also typed all 90 SNPs on 15 NHPs. Using our 21 inver-
sion-marking SNPs, we compiled a consensus haplotype
for NHPs at this region. For the most part the NHPs were
monomorphic at these 21 sites (only three heterozygotes:
one Gorilla and two Pongo). In general the alleles were
consistent across all five species, with a few minor excep-
tions. The consensus haplotype has 13 SNPs with alleles
identical to the H1 haplotype, seven that are identical to
the H2 haplotype, and one that could not be determined
(Table S2). The alleles do not seem to be randomly inter-
spersed, and there are runs of H1 alleles and runs of H2
alleles. The longest H2 run occurs in the region of the
MAPT gene, in agreement with the findings of Holzer
et al.11 Looking at the two Pan species, we see that both
are homozygous for the H1 allele at 11 sites and that P. trog-
lodytes is homozygous for H2 at six sites whereas P. paniscus
is homozygous for H2 at five sites. The alleles at four sites
in P. troglodytes and five sites in P. paniscus are unknown
because we were unable to type those sites in these species.
One interesting aspect of the two Pan species is that at site
rs9468 P. troglodytes is homozygous for the H2 allele
whereas P. paniscus is homozygous for the H1 allele. Gorilla
is also homozygous for the H2 allele at this site, and we
were unable to type rs9468 in the other two NHP species.
Pongo differs from the rest of the NHPs at two sites
(rs11079718 and rs1396862). Both sites are homozygous
for the H2 allele in Pongo and homozygous for H1 in the
other species that we have data on. Hylobates differs from
the NHP consensus of inversion marker SNPs at one site
(rs1528072), which is homozygous for the H1 allele,
whereas all other NHP in this study were homozygous
for the H2 allele at this site.
Also in the NHP, we looked at the SNPs that are polymor-
phic only on H1 chromosomes and compared the results
to see whether the allele in NHP was the same allele that
is found on the human inversion. We were able to type
some of the NHPs at 62 of the 65 sites. All but four of the
62 H1 polymorphic sites had the same genotype in all
species. At two sites (rs171443 and rs2066899), Hylobates
and Pongo differed from the Gorilla and Pan samples. At
n Journal of Human Genetics 86, 161–171, February 12, 2010 163

Table 1. Populations
Population Abbrev. N
Africa (15)a
Biaka BIA 70
Mbuti MBU 39
Lisongo LIS 8
Yoruba YOR 78
Ibo IBO 48
Hausa HAS 39
Mandenka MND 24
Masai MAS 22
Chagga CGA 45
Sandawe SND 40
Zaramo ZRM 40
Somali SOM 22
Ethiopian Jews ETJ 32
African Americans AAM 90
Mozabite MZB 30
Siberia (3)a
Komi Zyriane KMZ 47
Khanty KTY 50
Yakut YAK 51
Europe (26)a
Ashkenazi Jews ASH 83
Greeks GRK 56
Sardinians SRD 35
Roman Jews RMJ 27
Toscani TOS 90
ITALIANS ITL 22
Brescia Italiansb BIT 50
Catalan CAT 42
Spanish Basque SPB 76
French Basque FRB 24
French FRE 29
Adygei ADY 54
Chuvash CHV 42
Hungarians HGR 87
Russians, Vologda RUV 48
Russians, Archangelsk RUA 34
Finns FIN 36
Serbsc SRB 156
Germansc GER 162
Norwegiand NOR 68
Danes DAN 51
Englishe ENG 169
Irish IRI 118
Orcadians ORC 16
Icelandicf ICE 1,880
European Americans EAM 92
Central Asia (12)a
Balochi BAL 25
Brahui BRH 25
Negroid Makrani NMK 28
Sindhi SIN 25
Pathan PTH 23
Burusho BRS 25
Kalash KAL 25
Hazara HAZ 32
Mohanna MOH 54
Thoti THT 14
Keralite KER 30
Kachari KCH 17
Pacific Islands (4)a
Nasioi Melanesians NAS 23
Paupa-New Guineans PNG 22
Micronesians MCR 37
Samoans SMN 8
East Asia (14)a
Malaysians MLY 11
Laotians LAO 119
Cambodians CBD 25
Chinese, San Fransisco CHS 60
Chinese, Taiwan CHT 49
Hakka HKA 41
MONGOL MNG 19
MANCHU MNC 28
LOLO LOL 39
HMONG HMG 20
Koreans KOR 66
Japanese JPN 51
Ami AMI 40
Atayal ATL 42
North America (4)a
Cheyenne CHY 56
Pima, Arizona PMA 51
Pima, Mexico PMM 50
Maya MAY 52
164 The American Journal of Human Genetics 86, 161–171, February 12, 2010

Table 1. Continued
Population Abbrev. N
South America (5)a
Guihiba GHB 13
Quechua QUE 22
Ticuna TIC 65
Rondonian Surui SUR 47
Karitiana KAR 57
Southwest Asia (6)a
Yemenite Jews YMJ 43
Kuwaiti KWT 16
Druze DRU 95
Samaritans SAM 41
Palestinians PAL 51
Palestinian Arabs PLA 66
Italicized population data was taken from the HGDP data unless otherwisestated.ITALIANS: HGDP Northern Italians and Tuscans.MONGOL: HGDP Mongolian and Daur.MANCHU: HGDP Hezhen, Orogen, and Xibo.LOLO: HGDP Lahu, Naxi, Tujia, and Yiza.HMONG: HGDP Miaozu and She.a Population region. Number in parentheses denotes number of populations.b Ghidoni et al.5c Winkler et al.17
d Skipper et al.16
e Pittman et al.15
f Stefansson et al.1
Table 2. Twenty-One Inversion-Marking SNPs
SNP NameH2Allele
H1Allele
UCSCAbsolutePosition (bp)
No. ofPopulationsWith Data
rs241039 T A 41,070,456 62
rs434428 A G 41,081,467 49
rs241027 G A 41,091,261 46
rs2049515 T C 41,117,639 49
rs10491144 C A 41,128,907 49
rs10514879 A G 41,158,754 63
rs2902662 A G 41,162,708 46
rs11079718 T A 41,195,723 46
rs1396862 A G 41,258,778 46
rs1078830 C T 41,301,901 46
rs916793 A G 41,310,477 55
rs17650901 C T 41,395,527 46
rs17651213 A G 41,407,760 46
rs1052553 G A 41,429,725 46
E_TAUIVS11_10 C T 41,447,563 46
rs9468 C T 41,457,408 63
rs12150447 C A 41,483,977 59
rs2838 G A 41,497,167 63
rs1468241 C A 41,551,932 46
rs1528075 G T 41,576,231 46
rs1528072 A C 41,592,502 58
another site (rs2301732), Hylobates alone was different incomparison to the other four species. At the final site
(rs878917), Gorilla differed from all other species. At 55
of the 62 sites, the NHP allele was the same as the H2 allele,
suggesting that the inversion arose on a chromosome that
was mostly ancestral but that a few mutations accumulated
before the inversion occurred. Of the SNPs that are poly-
morphic only on human H1 chromosomes, five showed
a pattern in which the allele found on H2 chromosomes
was rare on the H1 chromosomes. The H2 allele was also
the allele that was identified as ancestral in four out of
five of these SNPs. These results support the hypothesis
that the inversion initially arose on an ancient chromo-
some or is the ancient chromosome (Table S3).
Inversion Distribution
On the basis of haplotypes composed of SNPs that have an
inversion-specific allele in our populations as well as in 24
additional populations found in the literature1,5,13–15,17
(Figure 3), we show that the inversion is primarily found
in Europeans and Southwest Asians. Other studies in the
literature duplicate inference on some samples with the
use of different SNPs.25,26 It also is observed at low levels
in Africans, Northwest Asians, Central Asians, Siberians,
and Amerindians. The inversion is almost completely
absent in East Asia and the Pacific Islands.
The America
The inversion haplotype is found at highest frequency in
Mediterranean regions of Southwest Asia and Europe
(31.6% in Druze, 31% in Samaritans, 23.5% in Palesti-
nians, 26% in Bedouins, 23.9% in French Basques, 32.2%
in Spanish Basques, 20.9% in Catalans, 27.7% in Greeks,
37.5% in Sardinians, 31.9% in Toscani, and 36.8% in
Roman Jews) and at moderately high levels in Northern
Africa (13.3% in the Mozabite). It is also found at a high
frequency in Ashkenazi Jews (25.6%), which we have
shown to group with the Southwest Asians.27 Elsewhere
in Europe, we see that the frequency is high in Western,
Central, and Southeast Europe (18.9% in French, 15% in
Danes, 17.7% in the Irish, 28% in Orcadians, 21.4% in
European Americans, 23.9% in Hungarians, and 15.7%
in the Adygei) and much lower in Eastern and Northern
Europe (9.8% in the Chuvash, 6% in the Archangel
Russians, 9.4% in the Vologda Russians, and 4.3% in the
Finns) and on the Arabian Peninsula (11.9% in the Yemen-
ite Jews and 9.4% in Kuwaitis).
Outside of Europe and Southwest Asia, the inversion
haplotype is found at low frequencies. In Africa it occurs
in Mandenka (4%), Biaka Pygmies (0.7%), Mbuti Pygmies
(5.1%), Chagga (1.1%), Sandawe (6.3%), Somali (2.5%),
and Ethiopian Jews (1.6%); it is also seen in African
n Journal of Human Genetics 86, 161–171, February 12, 2010 165

Figure 1. MAPT Inversion FrequenciesThis graph shows the frequencies of the H2 (red) haplotype in 90 populations. The populations are grouped by regions: Africa, SouthwestAsia, Europe, Central Asia, the Pacific, East Asia, North America, and South America. As we see, the H2 haplotype is found most predom-inantly in Southwest Asia, Europe, and Central Asia. All four Mbuti inversion chromosomes have the H1 allele at site rs9468, and twohave the H1 allele at rs2049515. In rs9468, the H1 allele is found in P. paniscus but the H2 allele is found in P. troglodytes and G. gorilla. Inrs2049515, the H1 allele is found in all of our NHPs.
Americans (4%), probably from European admixture,
given that it is not seen in our Nigerian samples. The pres-
ence of the inversion haplotype in Africans can be ex-
plained in three ways: by the inversion initially arising in
Africa (or having persisted in the ancestral primate orienta-
tion, as suggested by Zody et al.12) and drifting to high
levels in Europe; by being introduced by gene flow from
Europe; or by being the ancestral haplotype to the inver-
sion but being in the noninverted orientation. A combina-
tion of all three is also possible. However, more evidence is
needed to determine whether or not the inversion origi-
nated in Africa.
The presence of the inversion in the Komi Zyrianes
(2.2%), Khanty (3%), Balochi (12%), Brahui (6%), Sindhi
(8%), Pathan (8.7%), Burusho (6%), Kalash (10%), Mo-
hanna (12.2%), Negroid Makrani (5.6%), Hazara (3.3%),
166 The American Journal of Human Genetics 86, 161–171, February
and Keralites (3.3%) is consistent with a clinal distribution
across Asia. In East Asia it is seen only at extremely low
frequencies in three populations (Mongols, Taiwan
Chinese, and Japanese) and could be the result of admix-
ture or just a very low frequency in the region, making it
unlikely to be seen in any sample of only about 100 chro-
mosomes. In Amerindians, the inversion is seen in the
Maya (6.4%), Quechua (6.5%), and Rondonian Surui
(1.1%). Again, this is probably the result of European
admixture, especially in our samples of Maya and
Quechua, in which many other loci also indicate small
amounts of historic (not recent) European admixture.
Inversion Origin
To better understand the origin of the inversion, we deter-
mined on which H1 background it initially arose. We
Figure 2. FiberFISH in a Single Inversion-Heterozygous Individual from Ireland(A) The H1 orientation with a schematic atthe top. The red and green probes fallwithin the inversion, and the yellow probeis outside the inversion. The H1 orienta-tion is, from left to right, BAC 413P22(red), BAC 243L6 (green), BAC 79O18(yellow).(B) The H2 orientation with a schematic atthe top. The H2 orientation is, from left toright, BAC 243L6 (green), BAC 413P22(red), BAC 79O18 (yellow).
12, 2010

Figure 3. Global Distribution of the MAPT InversionThe global distribution of H2 frequencies graphed on a world map, with an enlarged section showing Europe, Northern Africa, andCentral Asia. In the enlarged map, populations are marked with stars; red stars represent data on populations typed in the Kidd lab,and green stars represent frequencies taken from the literature.
studied 11-SNP haplotypes that contained three inversion
marker SNPs and eight SNPs that are polymorphic only on
H1 chromosomes (Figure 4). We chose the eight SNPs
because they showed the greatest difference in allele
frequency between Africa and Southwest Asia, the two
most likely regions in which the inversion may have arisen
given its distribution. We identified an H1 haplotype (blue
stripes) that differs from the H2 haplotype (red stripes)
only at the inversion marker sites and is therefore the likely
haplotype on which the inversion initially arose. This
haplotype is found throughout the world at an average
frequency of 7.8%. It is most frequent in Africa ranging
from 6.9% in the Mbuti Pygmies to 25% in the Biaka
Pygmies with an average frequency of 14.8%. It is much
less frequent in Southwest Asia, ranging from 4.8%–9.2%
with an average frequency of 6.5%. These data support
an African origin of the inversion, but are not sufficient
to rule out a Southwest Asian origin.
Most Recent Common Ancestor of the Inversion
We used four STRPs that fall within the inversion region
(Table 3) to estimate the date of the MRCA of the inversion.
The America
Haplotype frequencies were estimated with the use of the
four STRPs and six of the inversion-marking SNPs, for
a total of 3968 total chromosomes. There were 3657 H1
chromosomes and 311 H2 chromosomes. There were
360 different H1 haplotypes and 47 H2 haplotypes, for
a total of 407 different haplotypes. Of the 47 H2 haplo-
types, we found that there are two possible ancestral haplo-
types: the most common haplotype and another haplotype
that accounts for most of the African inversion chromo-
somes. The two possible ancestral haplotypes have a one-
repeat difference at one STRP. Both STRP alleles can also
be found on H1 chromosomes. The most common H2
haplotype of the 311 inversion chromosomes was found
at a frequency of 0.519. On the other hand, the most
common haplotype in Africa accounts for six out of seven
of the non-African-American African H2 chromosomes. It
also accounts for 23.7% of the Southwest Asian H2 chromo-
somes. To calculate the number of generations to the
MCRA, we estimated the STR mutation rate to fall in the
range of 0.0005–0.001 and, given that the STRPs fall within
the inversion, we set the recombination rate at 0. If we
assume that the most common haplotype is the ancestral
n Journal of Human Genetics 86, 161–171, February 12, 2010 167

Figure 4. Eight H1 Polymorphic SNPs and Three Inversion-Marking SNPsThe frequencies of haplotypes composed of eight H1 polymorphic SNPs that display a difference in frequency between Africa and South-west Asia and three inversion marking SNPs. The inversion (red stripes) is most similar to the blue-striped haplotype (different only at thethree inversion-marking sites). The blue-striped haplotype is more common in Africa than in Southwest Asia. The three inversion-marking SNPs are rs11079718, rs1396862, and rs1078830, with alleles marked in red for the inversion. The eight other SNPs, in order,are: rs242924, rs242940, rs171440, rs173365, rs171443, rs4616318, rs962885, and rs242933.
haplotype, we get an estimate of 656.8–1313.6 generations.
Assuming an average generation time of 25 years, this puts
the MCRA at 16,400–32,800 years ago. However, if we
assume that the African haplotype is the ancestral haplo-
type, we get an estimate of 2167.4–4334.7 generations.
With 25 years per generation, this puts the MCRA at
54,200–108,400 years ago.
This recent date for the MRCA is also supported by our
SNP data. Of the 90 SNPs typed, only four were variable
on the H2 chromosomes, whereas 68 of the 90 are variable
on the H1 chromosomes. This lack of polymorphism on
the H2 chromosomes in comparison to H1 chromosomes
would suggest that the H2 inversion is younger than the
H1 orientation.
Table 3. STRPs in 17q21 Inversion
STRP Base Position Base-Pair Repeats Distance to Next STR
MAPT07 41,328,075 2 7979
MAPT08 41,320,096 4 16,495
MAPT09 41,303,601 2 139,891
MAPT14 41,163,710 4
168 The American Journal of Human Genetics 86, 161–171, February
Discussion
Global Distribution of Inversion
We show that the 17q21 inversion, often thought to be
found at levels of ~20% throughout Europe, actually shows
a great range of frequencies within Europe (~ 5%–37.5%).
The H2 haplotype identifies the inversion and shows
that the inversion is most frequent around the Mediterra-
nean and decreases outward in all directions (Figure 2).
The H2 haplotype is found at its highest African frequency
in the Mozabite of North Africa, at low levels in Northwest
Africa, Central Africa, and Eastern Africa, and is absent in
West Africa, except in the Mandenka. In Central Asia, we
see very low (< 5%) frequencies in Northern regions and
P (bp) No. of Populations Size Range Most-Common H2
46 15–25 19
46 7–13 11
46 13–23 14
46 10–20 10
12, 2010

in India, with the exception of the Kachari. In Pakistan, we
see frequencies similar to those in Northern and Eastern
Europe. The inversion is practically absent in East Asia
and the Pacific (three chromosomes total, one each in
Chinese from Taiwan, Mongolians, and Japanese). In
Amerindians, the H2 haplotype is seen predominantly
in the Maya and the Quechua, two population samples
in which we have evidence of European admixture. A caveat
is that we are inferring the inversion from haplotypes and
not actually detecting the inversion directly through cyto-
genetics. Given the distinct allelic-haplotype pattern for
the H2 haplotype, the restricted STRP alleles, and the cyto-
genetic validation in four studies—Steffanson et al.,1 Gijse-
linck et al.24 Zody et al.,12 and ours—this seems justified.
It should be noted that related pairs occur in the HGDP
sample but the inclusion of related individuals does not
bias allele-frequency estimates. The likely related sets as
estimated by Rosenberg in 2006 have been checked, and
their genotypes are summarized in Table S5.28
Inversion Origin
Zody et al. proposed a model suggesting that the H2 orien-
tation is the ancestral orientation by using FISH to deter-
mine orientation in NHPs.12 We attempted to confirm
whether the H1 or the H2 haplotype was ancestral by using
SNPs in 15 NHPs. Using our 21 inversion-marker SNPs, we
see both runs (contiguous intervals) of H2 alleles and runs
of H1 alleles. The longest run of H2 covers the MAPT gene.
We also looked at the 65 SNPs that are only polymorphic
on the H1 chromosome in humans. Most of the NHP
alleles matched the allele found on the H2 chromosomes.
Some of the SNPs showed different alleles across the
different species, including differences between the two
Pan species (see Supplemental Data). These results are
inconclusive in determining the ancestral orientation of
this region; however, the results with the 65 H1 polymor-
phic SNPs on H2 chromosomes suggest that the H2 inver-
sion is on an ancient haplotype. This confirms the caveat
mentioned by Iyengar et al. that using NHP genotypes to
determine the ancestral alleles for Homo sapiens may not
always be an effective method.29
Given the global distribution described here combined
with the data of Zody et al., we propose a model in which
the H2 orientation is the NHP ancestral orientation;
however, the H1 orientation is ancestral in humans. Under
this theory, sometime after the divergence of Pan and
Homo the region inverted to the H1 orientation in the
Homo line. The H1 then rose to fixation. Then, in modern
humans the inversion occurred once again, leading to the
H2 chromosomes found in humans. Zody et al. showed
that the region is susceptible to inversion, so it is not
impossible to imagine an inversion occurring twice on
the Homo line, and this model may also explain the differ-
ence in the structure between the H2-oriented chromo-
somes in Homo and Pan (the duplication region flanking
the human H2 is 331.5 kb larger than the nonhuman
primate H2, whereas the human H1 duplication region is
The America
only 59.5 kb larger than the nonhuman primate H2).12
Completion of the Neanderthal genome may be able to
supply more evidence with respect to these models.
Our data can support an African or Southwest Asian
origin for the inversion. In the African scenario, the inver-
sion event occurred in Africa (likely an East or Central
African population). It then crossed into Southwest Asia,
where it rose to high frequencies either by genetic drift
or by positive selection, and it then entered Europe, where
it exists at low to moderate levels. This scenario is supported
by the presence of an African-specific haplotype of SNPs
polymorphic on the inversion background that is identical
to the most common H1 haplotype (Figure 3). We also
looked at which H1-only polymorphic SNP haplotype back-
ground is most similar to the H2 inversion haplotype. The
background haplotype matching the inversion is more
common in Africa compared to Southwest Asia. This result
adds support to an African origin (Figure 4 and Figure S1).
The other scenario, a Southwest Asian origin, argues that
the inversion occurred in Southwest Asia, where it rose to
moderately high frequencies, then entered Europe. Under
this scenario, the presence of the H2 haplotype in Africa
could be explained in either or both of two ways. The first
is via gene flow back into Africa. The second is that the H2
haplotype chromosomes in Africa are actually in the H1
noninverted orientation. Cytogenetic determination in
African chromosomes would be needed to test for this possi-
bility. Under either scenario, the occurrence of the inver-
sion in Europe is probably due to the Neolithic inversion.
A third theory has been posited for the origin of the
inversion. Hardy et al. suggested that the H2 orientation
may have been introduced to humans by Neanderthal.30
This model would fit with a Southwest Asian model of orig-
ination, because some of the highest frequencies of the
inversions are found in Israel and Neanderthal fossils
have been found in Israel. Though we think that this
scenario is unlikely, more evidence is needed with respect
to Neanderthal’s genetic contribution to modern humans
before any strong conclusion can be made. Once again,
this scenario can best be addressed once the Neanderthal
genome is completed.
Selection or Neutral Evolution?
Stefansson et al. proposed that high frequencies of the
inversion in Europe are due to positive or balancing selec-
tion.1 Their analyses are limited to the Icelandic popula-
tions and are based on the fertility rate of women with at
least one copy of the H2 chromosome compared to those
without. Though the frequency of the H2 chromosome is
high in Iceland, it is much higher in Southern Europe
and Southwest Asia. It would be important to test these
regions for selection in a similar manner to confirm the
Icelandic result.
Though we cannot rule out selection occurring at this
locus, the cline that we present here can just as easily be ex-
plained by a demographic event that occurred during the
Neolithic expansion out of Southwest Asia into Europe
n Journal of Human Genetics 86, 161–171, February 12, 2010 169
without invoking natural selection.31 Under this neutral
model, the inversion initially arose in Africa or Southwest
Asia. It then rose to high levels in the Mediterranean region
of Southwest Asia. From there, it entered Southern Europe.
From Southern Europe, the frequencies lessened as migra-
tion carried the inversion throughout the rest of Europe.
The absence of the inversion in East Asia can be ex-
plained by the founder event(s) that eliminated alleles at
multiple loci in the eastward expansion of modern hu-
mans from Southwest Asia. Alternatively, the origin in
Southwest Asia could have occurred after this expansion.
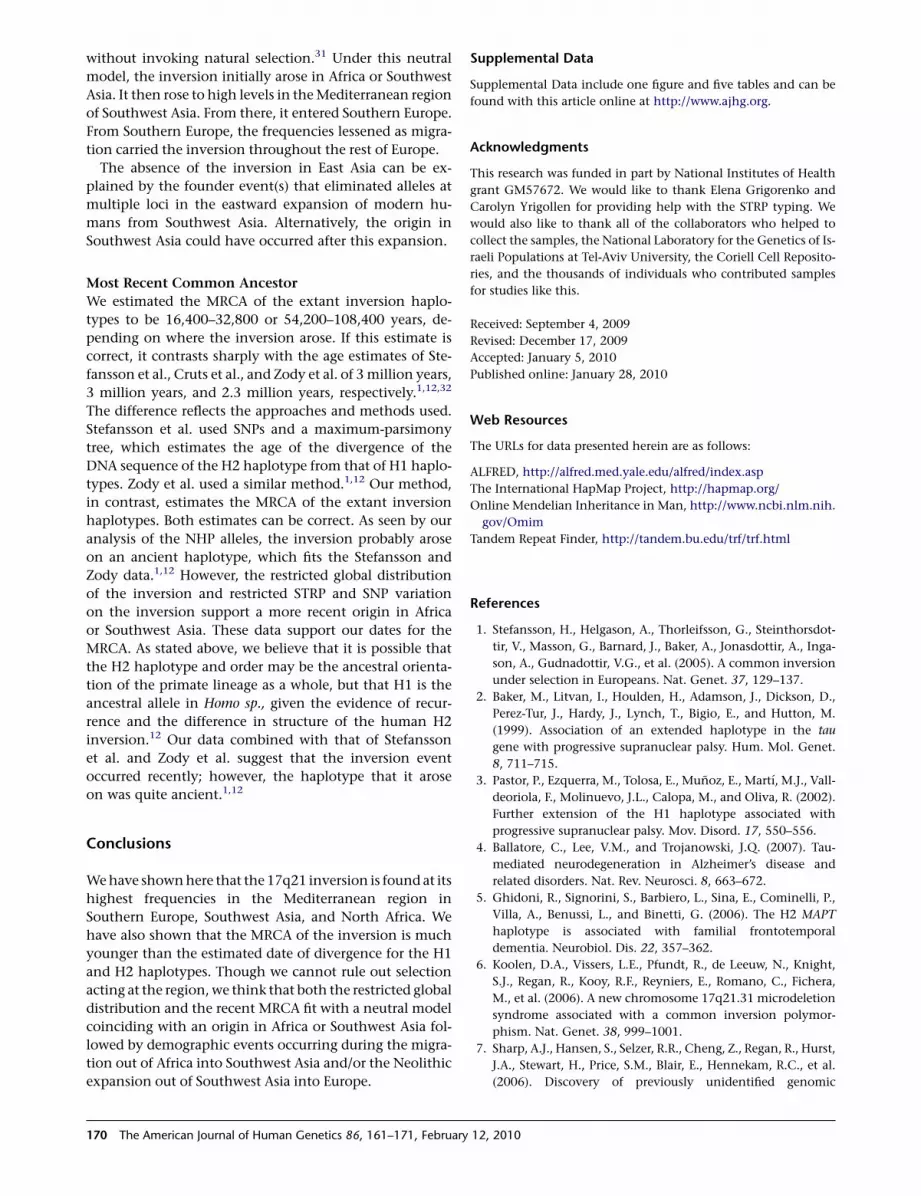
Most Recent Common Ancestor
We estimated the MRCA of the extant inversion haplo-
types to be 16,400–32,800 or 54,200–108,400 years, de-
pending on where the inversion arose. If this estimate is
correct, it contrasts sharply with the age estimates of Ste-
fansson et al., Cruts et al., and Zody et al. of 3 million years,
3 million years, and 2.3 million years, respectively.1,12,32
The difference reflects the approaches and methods used.
Stefansson et al. used SNPs and a maximum-parsimony
tree, which estimates the age of the divergence of the
DNA sequence of the H2 haplotype from that of H1 haplo-
types. Zody et al. used a similar method.1,12 Our method,
in contrast, estimates the MRCA of the extant inversion
haplotypes. Both estimates can be correct. As seen by our
analysis of the NHP alleles, the inversion probably arose
on an ancient haplotype, which fits the Stefansson and
Zody data.1,12 However, the restricted global distribution
of the inversion and restricted STRP and SNP variation
on the inversion support a more recent origin in Africa
or Southwest Asia. These data support our dates for the
MRCA. As stated above, we believe that it is possible that
the H2 haplotype and order may be the ancestral orienta-
tion of the primate lineage as a whole, but that H1 is the
ancestral allele in Homo sp., given the evidence of recur-
rence and the difference in structure of the human H2
inversion.12 Our data combined with that of Stefansson
et al. and Zody et al. suggest that the inversion event
occurred recently; however, the haplotype that it arose
on was quite ancient.1,12
Conclusions
We have shown here that the 17q21 inversion is found at its
highest frequencies in the Mediterranean region in
Southern Europe, Southwest Asia, and North Africa. We
have also shown that the MRCA of the inversion is much
younger than the estimated date of divergence for the H1
and H2 haplotypes. Though we cannot rule out selection
acting at the region, we think that both the restricted global
distribution and the recent MRCA fit with a neutral model
coinciding with an origin in Africa or Southwest Asia fol-
lowed by demographic events occurring during the migra-
tion out of Africa into Southwest Asia and/or the Neolithic
expansion out of Southwest Asia into Europe.
170 The American Journal of Human Genetics 86, 161–171, February
Supplemental Data
Supplemental Data include one figure and five tables and can be
found with this article online at http://www.ajhg.org.
Acknowledgments
This research was funded in part by National Institutes of Health
grant GM57672. We would like to thank Elena Grigorenko and
Carolyn Yrigollen for providing help with the STRP typing. We
would also like to thank all of the collaborators who helped to
collect the samples, the National Laboratory for the Genetics of Is-
raeli Populations at Tel-Aviv University, the Coriell Cell Reposito-
ries, and the thousands of individuals who contributed samples
for studies like this.
Received: September 4, 2009
Revised: December 17, 2009
Accepted: January 5, 2010
Published online: January 28, 2010
Web Resources
The URLs for data presented herein are as follows:
ALFRED, http://alfred.med.yale.edu/alfred/index.asp
The International HapMap Project, http://hapmap.org/
Online Mendelian Inheritance in Man, http://www.ncbi.nlm.nih.
gov/Omim
Tandem Repeat Finder, http://tandem.bu.edu/trf/trf.html
References
1. Stefansson, H., Helgason, A., Thorleifsson, G., Steinthorsdot-
tir, V., Masson, G., Barnard, J., Baker, A., Jonasdottir, A., Inga-
son, A., Gudnadottir, V.G., et al. (2005). A common inversion
under selection in Europeans. Nat. Genet. 37, 129–137.
2. Baker, M., Litvan, I., Houlden, H., Adamson, J., Dickson, D.,
Perez-Tur, J., Hardy, J., Lynch, T., Bigio, E., and Hutton, M.
(1999). Association of an extended haplotype in the tau
gene with progressive supranuclear palsy. Hum. Mol. Genet.
8, 711–715.
3. Pastor, P., Ezquerra, M., Tolosa, E., Munoz, E., Martı, M.J., Vall-
deoriola, F., Molinuevo, J.L., Calopa, M., and Oliva, R. (2002).
Further extension of the H1 haplotype associated with
progressive supranuclear palsy. Mov. Disord. 17, 550–556.
4. Ballatore, C., Lee, V.M., and Trojanowski, J.Q. (2007). Tau-
mediated neurodegeneration in Alzheimer’s disease and
related disorders. Nat. Rev. Neurosci. 8, 663–672.
5. Ghidoni, R., Signorini, S., Barbiero, L., Sina, E., Cominelli, P.,
Villa, A., Benussi, L., and Binetti, G. (2006). The H2 MAPT
haplotype is associated with familial frontotemporal
dementia. Neurobiol. Dis. 22, 357–362.
6. Koolen, D.A., Vissers, L.E., Pfundt, R., de Leeuw, N., Knight,
S.J., Regan, R., Kooy, R.F., Reyniers, E., Romano, C., Fichera,
M., et al. (2006). A new chromosome 17q21.31 microdeletion
syndrome associated with a common inversion polymor-
phism. Nat. Genet. 38, 999–1001.
7. Sharp, A.J., Hansen, S., Selzer, R.R., Cheng, Z., Regan, R., Hurst,
J.A., Stewart, H., Price, S.M., Blair, E., Hennekam, R.C., et al.
(2006). Discovery of previously unidentified genomic
12, 2010

disorders from the duplication architecture of the human
genome. Nat. Genet. 38, 1038–1042.
8. Shaw-Smith, C., Pittman, A.M., Willatt, L., Martin, H., Rick-
man, L., Gribble, S., Curley, R., Cumming, S., Dunn, C., Kalait-
zopoulos, D., et al. (2006). Microdeletion encompassing MAPT
at chromosome 17q21.3 is associated with developmental
delay and learning disability. Nat. Genet. 38, 1032–1037.
9. Kwok, J.B., Teber, E.T., Loy, C., Hallupp, M., Nicholson, G.,
Mellick, G.D., Buchanan, D.D., Silburn, P.A., and Schofield,
P.R. (2004). Tau haplotypes regulate transcription and are asso-
ciated with Parkinson’s disease. Ann. Neurol. 55, 329–334.
10. Myers, A.J., Pittman, A.M., Zhao, A.S., Rohrer, K., Kaleem, M.,
Marlowe, L., Lees, A., Leung, D., McKeith, I.G., Perry, R.H.,
et al. (2007). The MAPT H1c risk haplotype is associated
with increased expression of tau and especially of 4 repeat
containing transcripts. Neurobiol. Dis. 25, 561–570.
11. Holzer, M., Craxton, M., Jakes, R., Arendt, T., and Goedert, M.
(2004). Tau gene (MAPT) sequence variation among primates.
Gene 341, 313–322.
12. Zody, M.C., Jiang, Z., Fung, H.C., Antonacci, F., Hillier, L.W.,
Cardone, M.F., Graves, T.A., Kidd, J.M., Cheng, Z., Abouelleil,
A., et al. (2008). Evolutionary toggling of the MAPT 17q21.31
inversion region. Nat. Genet. 40, 1076–1083.
13. Li, J.Z., Absher, D.M., Tang, H., Southwick, A.M., Casto, A.M.,
Ramachandran, S., Cann, H.M., Barsh, G.S., Feldman, M.,
Cavalli-Sforza, L.L., and Myers, R.M. (2008). Worldwide
human relationships inferred from genome-wide patterns of
variation. Science 319, 1100–1104.
14. Jakobsson, M., Scholz, S.W., Scheet, P., Gibbs, J.R., VanLiere,
J.M., Fung, H.C., Szpiech, Z.A., Degnan, J.H., Wang, K., Guer-
reiro, R., et al. (2008). Genotype, haplotype and copy-number
variation in worldwide human populations. Nature 451, 998–
1003.
15. Pittman, A.M., Myers, A.J., Duckworth, J., Bryden, L., Hanson,
M., Abou-Sleiman, P., Wood, N.W., Hardy, J., Lees, A., and de
Silva, R. (2004). The structure of the tau haplotype in controls
and in progressive supranuclear palsy. Hum. Mol. Genet. 13,
1267–1274.
16. Skipper, L., Wilkes, K., Toft, M., Baker, M., Lincoln, S., Huli-
han, M., Ross, O.A., Hutton, M., Aasly, J., and Farrer, M.
(2004). Linkage disequilibrium and association of MAPT H1
in Parkinson disease. Am. J. Hum. Genet. 75, 669–677.
17. Winkler, S., Konig, I.R., Lohmann-Hedrich, K., Vieregge, P.,
Kostic, V., and Klein, C. (2007). Role of ethnicity on the asso-
ciation of MAPT H1 haplotypes and subhaplotypes in Parkin-
son’s disease. Eur. J. Hum. Genet. 15, 1163–1168.
18. Anderson, M.A., and Gusella, J.F. (1984). Use of cyclosporin A
in establishing Epstein-Barr virus-transformed human lym-
phoblastoid cell lines. In Vitro 20, 856–858.
19. Sambrook, J., Fritsch, E.F., and Maniatis, T. (1989). Quantita-
tion of DNA and RNA. In Molecular cloning: a laboratory
manual, Second Edition, N. Ford, C. Nolan, and M. Ferguson,
eds. (Cold Spring Harbor, NY: Cold Spring Harbor Laboratory
Press).
The America
20. Scheet, P., and Stephens, M. (2006). A fast and flexible statis-
tical model for large-scale population genotype data: applica-
tions to inferring missing genotypes and haplotypic phase.
Am. J. Hum. Genet. 78, 629–644.
21. Stephens, M., Smith, N.J., and Donnelly, P. (2001). A new
statistical method for haplotype reconstruction from popula-
tion data. Am. J. Hum. Genet. 68, 978–989.
22. Stephens, M., and Donnelly, P. (2003). A comparison of
bayesian methods for haplotype reconstruction from popula-
tion genotype data. Am. J. Hum. Genet. 73, 1162–1169.
23. Stephens, J.C., Reich, D.E., Goldstein, D.B., Shin, H.D., Smith,
M.W., Carrington, M., Winkler, C., Huttley, G.A., Allikmets,
R., Schriml, L., et al. (1998). Dating the origin of the CCR5-
Delta32 AIDS-resistance allele by the coalescence of haplo-
types. Am. J. Hum. Genet. 62, 1507–1515.
24. Gijselinck, I., Bogaerts, V., Rademakers, R., van der Zee, J., Van
Broeckhoven, C., and Cruts, M. (2006). Visualization of MAPT
inversion on stretched chromosomes of tau-negative fronto-
temporal dementia patients. Hum. Mutat. 27, 1057–1059.
25. Evans, W., Fung, H.C., Steele, J., Eerola, J., Tienari, P., Pittman,
A., Silva, R., Myers, A., Vrieze, F.W., Singleton, A., and Hardy, J.
(2004). The tau H2 haplotype is almost exclusively Caucasian
in origin. Neurosci. Lett. 369, 183–185.
26. Fung, H.C., Evans, J., Evans, W., Duckworth, J., Pittman, A.,
de Silva, R., Myers, A., and Hardy, J. (2005). The architecture
of the tau haplotype block in different ethnicities. Neurosci.
Lett. 377, 81–84.
27. Kidd, K.K., and Kidd, J.R. (2008). Human genetic variation of
medical significance. Evolution in Health and Disease, Second
Edition, S.C. Stearns and J.C. Koella, eds. (New York: Oxford
University Press), pp. 51–62, 363 pp.
28. Rosenberg, N.A. (2006). Standardized subsets of the HGDP-
CEPH Human Genome Diversity Cell Line Panel, accounting
for atypical and duplicated samples and pairs of close relatives.
Ann. Hum. Genet. 70, 841–847.
29. Iyengar, S., Seaman, M., Deinard, A.S., Rosenbaum, H.C., Sir-
ugo, G., Castiglione, C.M., Kidd, J.R., and Kidd, K.K. (1998).
Analyses of cross species polymerase chain reaction products
to infer the ancestral state of human polymorphisms. Mito-
chondrial DNA 8, 317–327.
30. Hardy, J., Pittman, A., Myers, A., Gwinn-Hardy, K., Fung, H.C.,
de Silva, R., Hutton, M., and Duckworth, J. (2005). Evidence
suggesting that Homo neanderthalensis contributed the H2
MAPT haplotype to Homo sapiens. Biochem. Soc. Trans. 33,
582–585.
31. Cavalli-Sforza, L.L., Menozzi, P., and Piazza, A. (1994). The
History and Geography of Human Genes (Princeton, New
Jersey: Princeton University Press).
32. Cruts, M., Rademakers, R., Gijselinck, I., van der Zee, J., Der-
maut, B., de Pooter, T., de Rijk, P., Del-Favero, J., and van
Broeckhoven, C. (2005). Genomic architecture of human
17q21 linked to frontotemporal dementia uncovers a highly
homologous family of low-copy repeats in the tau region.
Hum. Mol. Genet. 14, 1753–1762.
n Journal of Human Genetics 86, 161–171, February 12, 2010 171