Coastal sediments under the influence of multiple organic enrichment sources: An evaluation using...
11
Coastal sediments under the influence of multiple organic enrichment sources: An evaluation using carbon and nitrogen stable isotopes Leandro Sampaio a , Rosa Freitas a , Cristina Máguas b , Ana Rodrigues a , Victor Quintino a, * a CESAM (Centro de Estudos do Ambiente e Mar), Departamento de Biologia, Universidade de Aveiro, Campus Universitário de Santiago, 3810-193 Aveiro, Portugal b CBA (Centro de Biologia Ambiental), Faculdade de Ciências da Universidade de Lisboa, Campo Grande, 1749-016 Lisboa, Portugal article info Keywords: Stable carbon and nitrogen isotopes Total volatile solids Redox potential Sediments grain size Organic enrichment Abra alba abstract Sediment descriptors (grain size, total volatile solids, redox potential) and stable carbon and nitrogen iso- topes were used to trace the origin of organic matter in a coastal area under multiple organic enrichment sources (urban outfall and a major estuary). The sediments fines content and total volatile solids were similar to outfall pre-operation period (1994), but the incorporation of terrestrial organic matter within the sediments located closer to the outfall was diagnosed by depleted 13 C values (24.2 ± 0.38‰) and 15 N values (2.4 ± 0.93‰). Data also indicated depleted nitrogen signature at larger distances from the outfall than the carbon signature, due to confounding sediment grain size properties. Analysis in the bivalve Abra alba gave the same results for both isotopes and thus allowed a coherent interpretation of the spatial extent of the organic enrichment, highlighting the importance of bringing a biological element into the environmental assessment. Ó 2009 Elsevier Ltd. All rights reserved. 1. Introduction Organic enrichment and contaminant inputs from urban and industrial sewage effluent discharges, aquaculture waste, storm water and agriculture runoff, have become common stressors to the marine environment, and in particular to the sedimentary hab- itat and biotopes (Pearson and Rosenberg, 1978; Sweeney et al., 1980; McClelland and Valiela, 1998; Kauppila et al., 2005; Tewfik et al., 2005; Vizzini and Mazzola, 2006). The extent and dispersal of anthropogenic inputs depend namely on the quantity and type of waste, local hydrography, hydrodynamic regime and other environmental features of the dis- posal area (Sarà et al., 2006; Vizzini and Mazzola, 2006). Organic matter concentrations in sediments, in particular, may depend on the deposition rate, the nature of organic sources and their flux rates, their preservation potential during transport and burial, min- eralization and degradation (Owen and Lee, 2004; Ogrinc et al., 2005; Gao et al., 2008). The sedimentary organic matter is a heter- ogeneous and complex mixture of organic compounds with differ- ent chemical characteristics, originating from different sources (Tesi et al., 2007). Stable isotopes techniques can help to identify the origin of organic matter by discriminating between terrestrial and marine sources (Deegan and Garritt, 1997; Vizzini and Mazzo- la, 2003; Ogrinc et al., 2005; Vizzini et al., 2005; Usui et al., 2006; Tesi et al., 2007; Gao et al., 2008). The stable isotope approach con- siders the existence of differences among natural abundances of carbon and nitrogen stable isotopes and C/N elemental ratios in or- ganic matter from terrigenous and marine origin (Liu et al., 2006). This approach relies on the assumption that isotopic and C/N ratios from sedimentary organic matter are conservative and that their natural distribution reflects the mixing of material from distinct end-member sources (Machás et al., 2003; Liu et al., 2006). In gen- eral, terrestrial organic matter has depleted d 13 C and d 15 N values when compared to marine organic matter (Vizzini et al., 2005). As such, a typical sewage effluent may present d 13 C values in the range of 22.4‰ to 26.5‰ and d 15 N values between +1.8‰ and +3.8‰ (Sweeney et al., 1980; Spies et al., 1989; Gearing et al., 1991; Van Dover et al., 1992; Rogers, 1999; Conlan et al., 2006) whereas marine organic matter presents d 13 C values in the range of 18‰ to 24‰ and d 15 N values between +4‰ and +9‰ (Fry and Sherr, 1984; Tucker et al., 1999). The different isotopic composition of organic matter in sewage waste, relative to the marine autochthonous organic matter, may help to trace the extension of sewage waste in coastal areas. In fact, stable isotopes studies have supplied evidence of sewage particu- lates accumulation in sediments and subsequent incorporation in marine food webs (Van Dover et al., 1992). Consequently, this method has been successfully used to indicate sediment recovery to background values after cessation of sewage discharges (Tucker et al., 1999). Nevertheless, some studies have reported no signs of sewage impact on the sediments while detected on the biota (Wal- dron et al., 2001). Also, when looking for carbon and nitrogen sig- natures to trace the origin of organic sources to the coastal 0025-326X/$ - see front matter Ó 2009 Elsevier Ltd. All rights reserved. doi:10.1016/j.marpolbul.2009.09.008 * Corresponding author. Tel.: +351 234370769; fax: +351 234372587. E-mail address: [email protected] (V. Quintino). Marine Pollution Bulletin 60 (2010) 272–282 Contents lists available at ScienceDirect Marine Pollution Bulletin journal homepage: www.elsevier.com/locate/marpolbul
Transcript of Coastal sediments under the influence of multiple organic enrichment sources: An evaluation using...
Marine Pollution Bulletin 60 (2010) 272–282
Contents lists available at ScienceDirect
Marine Pollution Bulletin
journal homepage: www.elsevier .com/locate /marpolbul
Coastal sediments under the influence of multiple organic enrichment sources:An evaluation using carbon and nitrogen stable isotopes
Leandro Sampaio a, Rosa Freitas a, Cristina Máguas b, Ana Rodrigues a, Victor Quintino a,*
a CESAM (Centro de Estudos do Ambiente e Mar), Departamento de Biologia, Universidade de Aveiro, Campus Universitário de Santiago, 3810-193 Aveiro, Portugalb CBA (Centro de Biologia Ambiental), Faculdade de Ciências da Universidade de Lisboa, Campo Grande, 1749-016 Lisboa, Portugal
a r t i c l e i n f o
Keywords:Stable carbon and nitrogen isotopesTotal volatile solidsRedox potentialSediments grain sizeOrganic enrichmentAbra alba
0025-326X/$ - see front matter � 2009 Elsevier Ltd.doi:10.1016/j.marpolbul.2009.09.008
* Corresponding author. Tel.: +351 234370769; faxE-mail address: [email protected] (V. Quintino
a b s t r a c t
Sediment descriptors (grain size, total volatile solids, redox potential) and stable carbon and nitrogen iso-topes were used to trace the origin of organic matter in a coastal area under multiple organic enrichmentsources (urban outfall and a major estuary). The sediments fines content and total volatile solids weresimilar to outfall pre-operation period (1994), but the incorporation of terrestrial organic matter withinthe sediments located closer to the outfall was diagnosed by depleted 13C values (�24.2 ± 0.38‰) and 15Nvalues (2.4 ± 0.93‰). Data also indicated depleted nitrogen signature at larger distances from the outfallthan the carbon signature, due to confounding sediment grain size properties. Analysis in the bivalve Abraalba gave the same results for both isotopes and thus allowed a coherent interpretation of the spatialextent of the organic enrichment, highlighting the importance of bringing a biological element into theenvironmental assessment.
� 2009 Elsevier Ltd. All rights reserved.
1. Introduction
Organic enrichment and contaminant inputs from urban andindustrial sewage effluent discharges, aquaculture waste, stormwater and agriculture runoff, have become common stressors tothe marine environment, and in particular to the sedimentary hab-itat and biotopes (Pearson and Rosenberg, 1978; Sweeney et al.,1980; McClelland and Valiela, 1998; Kauppila et al., 2005; Tewfiket al., 2005; Vizzini and Mazzola, 2006).
The extent and dispersal of anthropogenic inputs dependnamely on the quantity and type of waste, local hydrography,hydrodynamic regime and other environmental features of the dis-posal area (Sarà et al., 2006; Vizzini and Mazzola, 2006). Organicmatter concentrations in sediments, in particular, may depend onthe deposition rate, the nature of organic sources and their fluxrates, their preservation potential during transport and burial, min-eralization and degradation (Owen and Lee, 2004; Ogrinc et al.,2005; Gao et al., 2008). The sedimentary organic matter is a heter-ogeneous and complex mixture of organic compounds with differ-ent chemical characteristics, originating from different sources(Tesi et al., 2007). Stable isotopes techniques can help to identifythe origin of organic matter by discriminating between terrestrialand marine sources (Deegan and Garritt, 1997; Vizzini and Mazzo-la, 2003; Ogrinc et al., 2005; Vizzini et al., 2005; Usui et al., 2006;Tesi et al., 2007; Gao et al., 2008). The stable isotope approach con-
All rights reserved.
: +351 234372587.).
siders the existence of differences among natural abundances ofcarbon and nitrogen stable isotopes and C/N elemental ratios in or-ganic matter from terrigenous and marine origin (Liu et al., 2006).This approach relies on the assumption that isotopic and C/N ratiosfrom sedimentary organic matter are conservative and that theirnatural distribution reflects the mixing of material from distinctend-member sources (Machás et al., 2003; Liu et al., 2006). In gen-eral, terrestrial organic matter has depleted d13C and d15N valueswhen compared to marine organic matter (Vizzini et al., 2005).As such, a typical sewage effluent may present d13C values in therange of �22.4‰ to �26.5‰ and d15N values between +1.8‰ and+3.8‰ (Sweeney et al., 1980; Spies et al., 1989; Gearing et al.,1991; Van Dover et al., 1992; Rogers, 1999; Conlan et al., 2006)whereas marine organic matter presents d13C values in the rangeof �18‰ to �24‰ and d15N values between +4‰ and +9‰ (Fryand Sherr, 1984; Tucker et al., 1999).
The different isotopic composition of organic matter in sewagewaste, relative to the marine autochthonous organic matter, mayhelp to trace the extension of sewage waste in coastal areas. In fact,stable isotopes studies have supplied evidence of sewage particu-lates accumulation in sediments and subsequent incorporation inmarine food webs (Van Dover et al., 1992). Consequently, thismethod has been successfully used to indicate sediment recoveryto background values after cessation of sewage discharges (Tuckeret al., 1999). Nevertheless, some studies have reported no signs ofsewage impact on the sediments while detected on the biota (Wal-dron et al., 2001). Also, when looking for carbon and nitrogen sig-natures to trace the origin of organic sources to the coastal

L. Sampaio et al. / Marine Pollution Bulletin 60 (2010) 272–282 273
sedimentary environment, few studies include data on baselinevariables, such as grain size or total volatile solids, nor discuss theirpotential confounding role. Gao et al. (2008) namely found a linearcorrelation in uncontaminated estuarine and coastal sediments be-tween carbon and nitrogen stable isotopes and mean sedimentgrain size and considered this factor to be of influence to the isoto-pic distributions.
In this study, carbon and nitrogen stable isotopes were used totrace organic sources to sediments in a coastal shelf area off Lisbonsubject to organic matter inputs from an urban wastewater marineoutfall serving a population around 800,000, the largest in Portu-gal, from the Tagus River, the largest in the Iberian Peninsula,and from autochthon primary production (Silva et al., 2004). Atthe moment of conducting this study, the effluent from the waste-water marine outfall only received a preliminary treatment mainlyconsisting in the screening and removal of grit and non-degradablematerials. Before released into the coastal area, the effluent passesthrough a series of sand retention and sieving systems, the last ofwhich corresponds to a rotating drum equipped with a 5 mm sieve.This situation will soon be altered as an enhanced primary treat-ment coupled to a disinfection system is about to enter into oper-ation. Previous studies have shown no organic matteraccumulation near the outfall discharge area or a relevant alter-ation of sediment properties and contaminants concentrations,with the exception of a proximate redox potential decrease whencompared to the reference situation (Quintino et al., 2001), denot-ing the dispersive rather than accumulative characteristics of thiscoastal area. Also, although the outfall diffusers are located in anarea of fine sand with less than 5% fines content, with increasingdepth or towards the Tagus Estuary this sediment gradually shiftsto very fine sand with larger fines content and to mud with fines upto 80% of the total sediment (Freitas et al., 2006). The potentiallyconfounding role of such heterogeneous seabed seascape in thepatterns of the stable isotopes is addressed in this study.
Spa
inAtla
ntic
Oce
an
Port
ugal
0 10
Guia
9°30'0"W 9°28'0"W
38°40'0"N
38°42'0"N
0 1000 2000 4000 Meters
987
6
543 2
1
28
2726
25
23
2422
21
1615
14
13 12
11
1017
Fig. 1. Study area showing the positioning of the double branch marine outfall and the 3which 4 replicate samples were taken for the study of the sediment isotopic composition.and 20; A5 = sites 19, 25 and 28.
2. Methodology
2.1. Study area and sampling
The study area is located in the coastal shelf off Lisbon at waterdepth ranging from 30 to 90 m. A marine sewage outfall is placedabout 15 km west of the mouth of the Tagus estuary and the efflu-ents are discharged in the final 400 m of a double branch system,approximately between 2350 and 2750 m offshore at an averagedepth of 40 m. A baseline characterization of the sediments inthe study area prior to the operation of the outfall was undertakenin 1994 and is reported namely in Quintino et al. (2001) and Silvaet al. (2004). All 20 sampling sites described in those studies wererevisited in this study, which also includes samples taken in extra10 sites (21–30), 1 replicate per site, positioned according to Fig. 1.The sediment baseline characterization included grain size, totalvolatile solids and on board measurement of redox potential. Thesesamples were used to describe the overall seabed seascape in thestudy area and to assist the decision of where to take replicatesamples for the subsequent sediment analysis including the isoto-pic composition. An additional 60 sediment samples were then ta-ken, in 15 sites arranged in 5 areas placed at increasing distancefrom the outfall, 3 sites per area and 4 replicates per site (cf.Fig. 1). Sediment grain size, total volatile solids, redox potentialand carbon and nitrogen isotopes were determined in these 60samples. For the isotopic analysis and the total volatile solidsdetermination, sediment samples were collected from the upper5 cm layer and stored in Whirl-Pak bags and frozen on board at�20 �C. The remaining sediment was washed on board over a2 mm-mesh sieve in order to collect a representative species ofthe resident macrofauna community, also for the analysis of car-bon and nitrogen isotopes. All sediment samples were collectedusing a 0.1 m2 Smith-McIntyre grab. The macrofauna sample wasstored in Whirl-Pak bags and immediately frozen at �20 �C. The
20Kilometers
Lisbon
Tagus estuary
9°26'0"W 9°24'0"W
20 m
30 m50 m
10 m
3029
2019
18
0 sampling sites, indicating the 5 areas (A1 to A5) and the 15 sites (white circles), atA1 = sites 3, 4 and 5; A2 = sites 6, 8 and 10; A3 = sites 18, 23 and 27; A4 = sites 15, 16

274 L. Sampaio et al. / Marine Pollution Bulletin 60 (2010) 272–282
criterion used to select the biological material was the constancy ofthe species presence in the majority of the 15 sampling sites. Spec-imens of the bivalve Abra alba were selected for this analysis.
2.2. Laboratory analysis
Sediment grain size was analyzed by wet and dry sieving, fol-lowing the procedure described in Quintino et al. (1989). The siltand clay fraction (fine particles, with diameter below 0.063 mm)and the gravel fraction (particles with diameter above2.000 mm), were expressed as a percentage of the total sediment,dry weight. The sand fraction (0.063–2.000 mm) was dry sievedthrough a battery of sieves spaced at 1 phi (/) unit interval (/= �log2 the particle diameter in mm). Total volatile solids weredetermined on 1 g of sediment sample, dried at 60 �C, by loss onignition at 450 �C during 5 h (Byers et al., 1978). Redox potentialwas measured on board with dedicated probes, before emptyingthe grab, at �4 cm from the sediment surface (Pearson and Stanley,1979).
A. alba specimens were sorted and immediately frozen untilpreparation for isotopic analysis. Isotopic analysis followed a mod-ification of the procedures described in Teece and Fogel (2004) andCarabel et al. (2006). The sediment samples were dried at 60 �C toconstant weight, and ground to fine powder with a grinding mill,for approximately 5 min, to ensure homogenization. The groundsediments were treated for carbonate removal by acidifying sub-samples of 0.15 g with drop-by-drop addition of 1 M HCl (Rybaand Burgess, 2002). The cessation of bubbling was used as a crite-rion to determine the amount of acid to add (Jacob et al., 2005; Car-abel et al., 2006). Acidified samples were agitated for 1 h using anultrasonic cleaner containing Mili-Q water to facilitate the aciddigestion and were left in the acid solution to settle for another2 h. Subsequently they were rinsed 3 times with Mili-Q water for1 h to eliminate acid remains. All samples were re-dried at 60 �Cto constant weight, ground and stored in glass vials to be analyzed.For the bivalve, the specimens (size range: 5.7–16.7 mm) were re-moved from their shells and muscle tissue from the foot was dis-sected for analysis. Animal tissue samples for d13C and d15Nanalysis were rinsed several times with Mili-Q water to wash awaydirt and debris. Animal samples were also dried at 60 �C to a con-stant weight but were homogenized using a mortar and pestle. Inorder to minimize the influence of lipids upon the determinationof d13C (Bodin et al., 2007), these were removed by immersion ofthe ground samples in a chloroform–methanol solution (2:1) (Tee-ce and Fogel, 2004). Within a given sample, individuals from thesame species were pooled to ensure that sample mass was suffi-cient to enable isotope analysis. In the sites where the specieswas collected, the biological material was sufficient to analyzeone sample per site.
The isotopic compositions (d13C and d15N) were measured onanimal samples weighted from 1 to 3 mg and sediment samplesweighted from 10 to 20 mg, according to variable content of Cand N, with a stable isotope ratio mass spectrometer (IsoPrime,GV Instruments, Manchester, UK), operating in continuous-flowmethod coupled to an elemental analyzer EuroEA (Eurovector, It).Isotopic ratios for carbon and nitrogen were calculated using thestandard d notation:
dX ¼ ððRsample=RreferenceÞ � 1Þ � 1000 ð‰Þ
where X = C (carbon) or N (nitrogen) and R = 13C/12C for carbon and15N/14N for nitrogen. The reference for carbon was Vienna Pee DeeBelemnite (VPDB) with an assigned d13C value of 0‰. The referencefor nitrogen was atmospheric nitrogen that has also been assigned ad15N of 0‰. The analytical precision for the measurement was 0.2‰
for both d13C and d15N.
2.3. Data analysis
For each sampling site, the amount of sediment in each grain sizeclass was expressed as a percentage of the whole sediment, dryweight. The data were used to calculate the median value, P50, ex-pressed in phi (/) units, corresponding to the diameter that has halfthe grains (dry weight) finer and half coarser. Given that no detailedgrain size analysis was performed for the fines fraction (particleswith diameter below 63 lm), the median could not be calculatedfor the samples with more than 50% fines content. These sedimentsamples were classified as mud. Sands (sediments with less than50% fines) were classified using the median, expressed in phi (/)units, according to the Wentworth scale (Doeglas, 1968): very finesand (median between 3–4 /); fine sand (2–3 /); medium sand(1–2 /) or coarse sand (0–1 /). The final classification adopted thedescription ‘‘clean”, ‘‘silty” or ‘‘very silty”, when fines were rangingfrom 0% to 5%, from 5% to 25%, and from 25% to 50%, respectively, ofthe total sediment, dry weight (Quintino et al., 1989).
The sediment baseline data per site for the characterization ofthe study area includes the variables: gravel, sand, fines, median,total volatile solids and redox potential. These data were analyzedby classification and ordination analysis using the software PRI-MER v6 (Clarke and Gorley, 2006). The normalized Euclidean dis-tance was used to produce a [sites � sites] distance matrixsubmitted to classification analysis using the average-clusteringalgorithm and to ordination analysis using non-metric multidi-mensional scaling (NMDS). The NMDS diagrams are accompaniedby a stress value which quantifies the mismatch between the dis-tances among data points in the Euclidean distance matrix and inthe ordination diagram. Ordination diagrams with stress value be-low 0.10 are considered to represent very accurately the originaldistance matrix (Clarke and Warwick, 2001).
The data from the 15 sites organized in areas at increasing dis-tance from the outfall, (cf. Fig. 1), were analyzed according to atwo-way hierarchical design, with sites nested in areas and theseas the main, fixed factor using permutation multivariate analysisof variance (Anderson, 2001a), employing the PERMANOVA+ add-on in PRIMER v6 (Anderson et al., 2008). This method allows parti-tioning the variability from a dissimilarity matrix, in this case ob-tained with the Euclidean distance between samples, and testsindividual terms, including interactions, using permutations(Anderson and ter Braak, 2003). A permutation test calculates theprobability of getting a value equal to or more extreme than an ob-served value of a test statistic under a specified null hypothesis byrecalculating the test statistic after random re-orderings of thedata (Anderson, 2001b). The two-way nested design was used totest the null hypothesis of no significant differences between theareas, separately for the grain size, the total volatile solids, the re-dox potential and the carbon and nitrogen isotopic compositiondata. A simplified design was used to test the bivalve A. alba isoto-pic data, given that a single sample was taken at each site. Becausethe five areas comprehend a range of sediment types, the test fordifferences between areas also included total volatile solids or finescontent as covariate. When using a covariate, a type I sums ofsquares was always used, allowing fitting first the covariate. Signif-icant terms were investigated using posteriori pairwise compari-sons between the five areas with the PERMANOVA t-statistic andpermutations under a reduced model (Anderson et al., 2008).
3. Results
3.1. Baseline sedimentary gradients
The distribution of the sediment types according to the medianand fines content is shown in Fig. 2. With the exception of site 21,

20 m
30 m50 m
10 m
Sediment classification
Clean fine sand
Clean medium sand
Silty fine sand
Clean coarse sand
Very silty very fine sand
Silty very fine sand
Mud
Fig. 2. Distribution of the sediment types in the study area, according to the median and the fines content.
L. Sampaio et al. / Marine Pollution Bulletin 60 (2010) 272–282 275
coarse sand, and site 13, medium sand, the others correspond to fi-ner sediments. With increasing depth and towards the estuary,sediments become finer and with higher fines content, rangingfrom fine sand with less than 5% fines in sites surrounding the out-fall, to mud with up to 80% fines content, in the sites located deeperor closer to the estuary.
The results obtained from the classification and the ordinationanalysis of the baseline sediment data are displayed in Fig. 3, whichalso shows the distribution of the identified sedimentary affinitygroups in the study area. The mean values for the sediment grainsize, median, total volatile solids and redox potential, relative tothe identified affinity groups, are given in Table 1. The distributionof the samples in the ordination diagram defines a sediment suc-cession, from coarse sand to mud. Coarser sediments with thehighest redox potential values were observed in sites 21 and 13,classified respectively as coarse and medium sand, both with finescontent below 1% (cf. Table 1). Site 12 and the sites in group A andin group B correspond to fine sand with fines content below orclose to 5%. The difference between these 3 groups is related tothe redox potential (cf. Table 1). Very fine sand characterizes thesites in group C and site 22, the later with higher fines content.Group D includes all the sampling sites classified as mud, withthe highest values for fines content (>70%), total volatile solidsand the median grain size. The spatial distribution of the sedimen-tary affinity groups (cf. Fig. 3) is in close agreement with the distri-bution of the sediment types based in the median value alone (cf.Fig. 2). Along the axis site 21 ? 13 ? 12 ? group A ? B ? C ? site22 ? group D, the superficial sediments show a gradual increase inthe median value, the fines content and the total volatile solidscontent, with decreasing values of redox potential. Group A,although correctly positioned along this gradient, both geographi-cally and in terms of the sediment grain size and total volatile sol-ids, presents much lower redox potential than the neighboringgroups. This is also seen in Fig. 4, representing the relationship be-tween total volatile solids and fines content, and between redoxpotential and total volatile solids. The relationship between totalvolatile solids and fines content is strongly linear and direct. Therelationship between redox potential and total volatile solids wasalso clear, although inverse, with the data obtained before theoperation of the outfall (cf. Fig. 4 and Quintino et al., 2001). Asshown in Fig. 4, present day samples, in particular the sandy sedi-ments surrounding the outfall, show fines and total volatile solidswith similar values to the pre-discharge moment, but much lower,even negative, redox potential values.
The sedimentary affinity groups shown in Fig. 3 were used toassist the set-up of relatively homogeneous areas placed atincreasing distance from the outfall, where sediment samples weretaken for the detailed study of the carbon and nitrogen isotopiccompositions. These areas are named A1 to A5 and are shown in
Fig. 1. Area A1 comprises sites 3, 4 and 5, all included in the affinitygroup A. Area A2 comprises sites 6, 8 and 10, all included in theaffinity group B. Area A3 corresponds to sites 18, 23 and 27, fromwhich site 18 is included in affinity group C and sites 23 and 27in the affinity group B. Area A4 comprises sites 15, 16 and 20, allincluded in the affinity group C. Area A5 includes sites 19, 25and 28, all from affinity group D.
3.2. Carbon and nitrogen stable isotopes
At each of the 15 sites placed in the areas A1 to A5, 4 replicatesediment samples were taken for the analysis of carbon and nitro-gen isotopes, grain size, total volatile solids and redox potential.Carbon and nitrogen isotopes were also measure in the bivalve A.alba, in one replicate per site in areas A1 to A4, as the specieswas not present in none of the sites of area A5, presumably dueto the high fines content of the superficial sediment. The mean val-ues of each sediment descriptor in the 5 areas are given in Table 2and show that these areas cross the full range of the sedimenttypes in the study area. As expected, all baseline sediment vari-ables rejected the null hypothesis of no significant differenceamong the areas. The PERMANOVA main test results show highto very high significant differences among areas, over and abovesignificant differences among sites within areas (p < 0.01 orp < 0.001), for grain size, total volatile solids and redox potential(Table 3). The gradual grain-size modification from area A1 to A5is indicated in the results of the pairwise comparisons, given in Ta-ble 4, by an absence of significant differences between adjacentareas, with increasing values of the t-statistic as the pairwise com-parisons are made between areas located further apart from eachother (cf. Table 4, column A). A similar situation is shown by totalvolatile solids, confirming the close relationship between this var-iable and fines (cf. Table 4, columns A and B and Fig. 4). A rupturein the sedimentary seascape is seen from areas A4 to A5, indicatedby the significant p-value in the comparison of the two areas (cf.Table 4, columns A and B), and corresponds to a sediment changefrom very fine sand with approximately 17% fines and 3% total vol-atile solids content, to mud with over 75% fines and 6% total vola-tile solids content (cf. Table 2). Grain size and total volatile solidsindicate no significant difference between areas A1, A2 and A3,the closer to the outfall. A different conclusion is reached whenanalysing redox potential, for which area A1 is significantly differ-ent from all other areas (cf. Table 4, column C). Although there is apotential linear relationship between total volatile solids and redoxpotential (cf. Fig. 4, for the pre-operation period), the introductionof total volatile solids as covariate in the analysis of the redox po-tential had no effect on the main results, as shown in Table 3, andonly a little effect on the pairwise comparisons between areas,with area A1 being still significantly different from most of the

21 13 22 3 4 2 5 12 14 9 27 10 17 24 23 11 1 6 7 8 15 20 30 16 18 26 29 19 25 28
0
2
4
6
8
AB C
D
Nor
mal
ised
Euc
lidea
n di
stan
ce
(a)
Stress: 0.01
Sedimentary affinity groupsSite 12Site 21 Site 13 Site 22
A CB D
(b)
20 m
30 m50 m
10 m
Sedimentary affinity groups
Site 12
A
Site 22
Site 21
Site 13
D
C
B
(c)
Fig. 3. Sedimentary affinity groups, shown in the (a) classification diagram, (b) NMDS ordination and (c) study area.
Table 1Mean values for the sedimentary affinity groups identified by classification and ordination analysis, represented in Fig. 3. The affinity groups are presented in order of increasingmean fines content. Eh – redox potential; TVS – total volatile solids. Group A = sites 2, 3, 4 and 5. Group B = sites 1, 6–11, 14, 17, 23, 24 and 27. Group C = sites 15, 16, 18, 20, 26and 30. Group D = sites 19, 25, 28 and 29.
Affinity group Gravel (%) Sand (%) Fines (%) Median (/) Eh (mV) TVS (%)
Site 21 7.1 92.3 0.4 0.4 338 1.2Site 13 0.3 99.1 0.5 1.1 313 1.3Site 12 0.1 96.6 3.2 2.5 212 1.3Group A 0.3 96.1 3.6 2.6 �121.9 1.3Group B 0.2 94.6 5.1 2.7 52.1 1.4Group C 0.4 84.8 14.8 3.1 49.8 2.1Site 22 0.3 64.9 34.8 3.7 42 2.6Group D 0.2 27.5 72.3 >4.0 21.6 5.0
276 L. Sampaio et al. / Marine Pollution Bulletin 60 (2010) 272–282

0.01.02.03.04.05.06.07.0
0.0 10.0 20.0 30.0 40.0 50.0 60.0 70.0 80.0 90.0
Fines (%)
TVS
(%)
20071994
-200.0
-100.0
0.0
100.0
200.0
300.0
400.0
500.0
2.0 4.0 6.0 8.0 10.0 12.0
Eh (m
V)
TVS (%)A
Fig. 4. Relationship between the sediment total volatile solids and fines content (top) and between the sediment redox potential and total volatile solids (bottom), the latterincluding values from the pre-discharge period (1994), taken from Quintino et al. (2001). In the bottom graph, the sites comprising group A from Fig. 3 are encircled by adashed line.
Table 2Sediment descriptors per area (A1 to A5, mean ± standard deviation; n = 12, except for A. alba, where n = 3). Eh – redox potential; TVS – total volatile solids; d15N – nitrogen stableisotope; d13C – carbon stable isotope.
Descriptors Areas (sites)
A1 (3, 4, 5) A2 (6, 8, 10) A3 (18, 23, 27) A4 (15, 16, 20) A5 (19, 25, 28)
1 mm (%) 2.2 ± 0.79 1.6 ± 0.58 0.7 ± 0.34 0.9 ± 0.96 0.1 ± 0.030.5 mm (%) 4.2 ± 1.20 3.8 ± 1.28 1.8 ± 0.98 0.8 ± 0.52 0.2 ± 0.070.25 mm (%) 7.4 ± 2.30 7.9 ± 3.47 4.0 ± 1.78 1.8 ± 1.69 0.4 ± 0.330.125 mm (%) 61.3 ± 5.26 58.6 ± 4.27 56.5 ± 5.37 40.4 ± 10.52 4.6 ± 4.240.063 mm (%) 21.8 ± 3.46 24.3 ± 6.25 31.3 ± 5.35 38.8 ± 9.35 18.9 ± 3.94Fines (%) 3.0 ± 0.60 3.7 ± 1.99 5.8 ± 2.67 17.2 ± 3.65 75.8 ± 6.72Median (/) 2.6 ± 0.04 2.6 ± 0.12 2.8 ± 0.13 3.2 ± 0.16 >4.0Eh (mV) �115.3 ± 37.96 45.6 ± 64.93 58.7 ± 42.44 48.3 ± 31.72 2.8 ± 29.09TVS (%) 1.6 ± 0.20 1.5 ± 0.23 1.9 ± 0.32 3.1 ± 0.39 6.2 ± 0.29d15N (‰) – sediment 2.4 ± 0.93 2.7 ± 0.74 2.8 ± 0.97 4.1 ± 1.10 4.6 ± 1.57d13C (‰) – sediment �24.2 ± 0.38 �23.4 ± 0.55 �22.9 ± 0.43 �23.2 ± 0.40 �23.4 ± 0.42d15N (‰) – A. alba 5.0 ± 0.21 6.0 ± 0.45 6.9 ± 0.50 7.8 ± 0.58 –d13C (‰) – A. alba �22.4 ± 1.01 �20.2 ± 0.50 �18.7 ± 0.46 �18.3 ± 0.35 –
L. Sampaio et al. / Marine Pollution Bulletin 60 (2010) 272–282 277
others (cf. Table 4, columns C and E). This result reinforces themuch lower (negative) redox potential values observed in areaA1 when compared to the remaining areas (cf. Table 2). On the con-trary, the total volatile solids significant differences between theareas are almost all eliminated when fines content are introducedas covariate in the model (cf. Table 3 and Table 4, column D).
Similar to the main test results for the baseline sediment vari-ables, the nitrogen and carbon isotope composition values maintest results also show high significant differences (p < 0.01) amongthe areas, but with no significant differences among sites withinthe areas (cf. Table 3). The pairwise comparisons between areasfor the carbon isotope composition values show a clear distinctionbetween area A1 and all the others (cf. Table 4, column G), area A1having more depleted d13C values (cf. Table 2). No distinction be-tween areas A2 to A5 was detected for the carbon isotope compo-sition values, excepting for a significant difference (p < 0.05)between areas A3 and A5 (cf. Table 4, column G) due to more en-riched d13C values in area A3 (cf. Table 2). The pairwise compari-sons between areas for the nitrogen isotope composition valuesisolate a group comprising areas A1, A2 and A3 (cf. Table 4, columnF), in which the overall mean value for d15N is 2.7‰, more depleted
than in area A4 (4.1‰) or in area A5 (4.6‰). This indicates that thetwo isotopes isolate different areas surrounding the outfall wherethey show the most depleted values, up to 250 m distance fromthe diffusers for carbon and up to 1.5 km for nitrogen.
No obvious relationship exists between the pairwise results ob-served for the carbon isotope composition values and the baselinesedimentary descriptors. Note namely that areas A2 to A5, forwhich no significant differences were found in the carbon isotopecomposition values, cover the full range of sediment types existingin the study area, from clean fine sand (area A2) to mud (area A5).No such conclusion can be reached for the nitrogen isotope compo-sition values, because the similarity among areas A1 to A3 andtheir distinction from the other areas, closely resembles the super-ficial sediments, with areas A1 to A3 corresponding to fine sandwith mean fines content ranging from 3% to 6%, area A4 corre-sponding to very fine sand with 17% mean fines content and areaA5 to mud with over 70% mean fines content (cf. Table 2). This per-ceived relationship between the sediment nitrogen stable isotopecomposition and grain size is confirmed by introducing fines ascovariate in the analysis of the nitrogen data. Fines eliminate thesignificance of the main factor (areas), as shown in the

Table 3PERMANOVA results for the main tests. df – degrees of freedom; SS – sums of squares;MS – mean square; p – significance level obtained under permutation (ns = nonsignificant).
Tests df SS MS Pseudo-F p
Grain sizeAreas 4 77013 19253 55.088 0.0002Sites (Areas) 10 3495 349.5 8.4979 0.0001Residuals 45 1850.8 41.128Total 59 82359
Total volatile solidsAreas 4 188.55 47.138 243.77 0.0001Sites (Areas) 10 1.9337 0.1934 3.1256 0.0034Residuals 45 2.784 0.0619Total 59 193.27
Total volatile solids with fines content as covariateCovariate 1 184.56 184.56 1236.7 0.0001Areas 4 4.8342 1.2085 8.5053 0.0028Sites (Areas) 10 1.3778 0.1378 2.4285 0.0217Residuals 44 2.4964 0.0567Total 59 193.27
Redox potentialAreas 4 250050 62512 11.126 0.0058Sites (Areas) 10 56183 5618.2 5.4687 0.0001Residuals 45 46231 1027.4Total 59 352460
Redox potential with total volatile solids as covariateCovariate 1 2549.6 2549.6 0.4616 0.5231 (ns)Areas 4 249540 62386 12.567 0.0012Sites (Areas) 10 54354 5435.4 5.1974 0.0003Residuals 44 46015 1045.8Total 59 352460
Nitrogen stable isotopeAreas 4 42.16 10.54 7.63 0.0057Sites (Areas) 10 13.814 1.3814 1.1877 0.3244 (ns)Residuals 45 52.341 1.1631Total 59 108.31
Nitrogen stable isotope with fines as covariateCovariate 1 28.844 28.844 19.881 0.0006Areas 4 13.737 3.4343 2.5022 0.1112 (ns)Sites (Areas) 10 13.44 1.344 1.1308 0.3527 (ns)Residuals 44 52.294 1.1885Total 59 108.31
Carbon stable isotopeAreas 4 10.892 2.7231 10.107 0.0031Sites (Areas) 10 2.6943 0.2694 1.526 0.1569 (ns)Residuals 45 7.9453 0.1766Total 59 21.532
278 L. Sampaio et al. / Marine Pollution Bulletin 60 (2010) 272–282
PERMANOVA main results table (cf. Table 3). Whether the depletednitrogen isotopic signature in the areas located closer to the outfallis a response to a sediment characteristic or whether it can actuallyreflect a terrestrial origin of the organic matter in these areas,should then be better perceived in a biological element living
Table 4Values for the t-statistic in the pairwise comparisons between areas (A1 to A5) for the analywith fines as covariate; (E) redox potential with total volatile solids as covariate; (F) nitrog***p < 0.001).
A B C
A1 vs. A2 0.6035 0.2638 3.7167*
A1 vs. A3 1.8354 1.2409 7.9361**
A1 vs. A4 3.7936* 10.444*** 8.5241***
A1 vs. A5 13.838*** 30.07*** 6.6131**
A2 vs. A3 1.2394 1.4195 0.3012A2 vs. A4 3.1806* 10.44*** 0.0653A2 vs. A5 12.436*** 29.582*** 1.0291A3 vs. A4 2.4448 6.1654** 0.5289A3 vs. A5 12.135*** 20.561*** 3.0628*
A4 vs. A5 8.0646*** 21.151*** 3.0656*
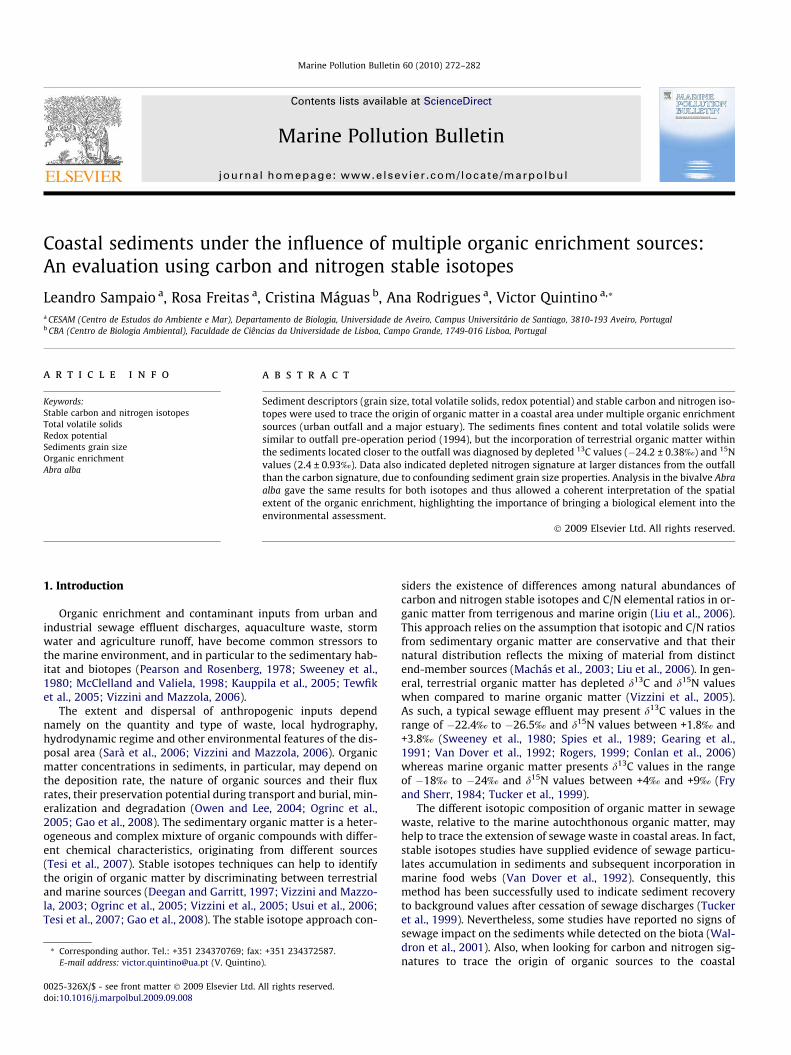
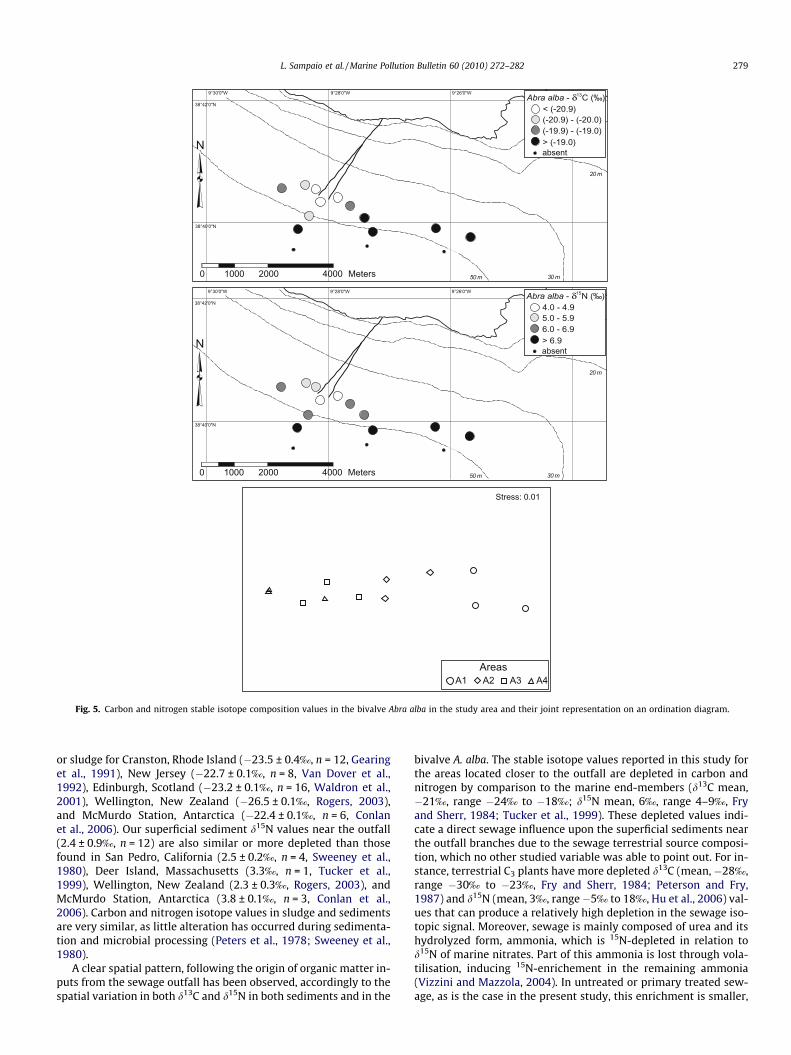
there. This is shown in Fig. 5 (cf. also Table 2), representing the car-bon and nitrogen stable isotope composition data analyzed in thebivalve A. alba. The results obtained in this analysis show consis-tently more depleted values for both isotopes in area A1, confirm-ing the terrestrial origin of the food source for the species in theareas closer to the outfall. Both carbon and nitrogen stable isotopesdata obtained with this species show high significant differences(p < 0.001) among areas (Table 5). The pairwise comparisons be-tween the areas also present similar results for both isotopes, dif-ferentiating 3 groups comprised by area A1, area A2 and areasA3 + A4 (cf. Table 5). This shows that the species tracks the carbonand the nitrogen isotopic signals similarly and furthest than thesediment itself. In the area closer to the outfall, A. alba mean d13Cvalues were around �22‰ and enriched to �20‰ in area A2. Inthe farthest areas the carbon signal was closer to �18‰. For nitro-gen, the mean d15N values enriched from 5.0‰ in area A1 to 6.0‰
in area A2 and close to 7.5‰ in areas A3 + A4 (cf. Table 2). We alsonotice a larger amplitude in the data obtained with A. alba thanwith the sediment. The ordination of the isotopic data for A. alba(cf. Fig. 5), illustrates these results with a clear separation of thesamples representing area A1, area A2 and the superimpose be-tween samples from areas A3 and A4.
4. Discussion
In this study, baseline sediment descriptors namely the median,fines content and total volatile solids gradually augmented withincreasing depth and towards the estuary, with the exception of re-dox potential. In fact, the redox potential values reported in thisstudy for the fine sand sites located close to the outfall are muchlower (negative), when compared to those reported for the samesites before the operation of this system, in the range of +200 mVto +300 mV (Quintino et al., 2001). Knowing that the values herereported for the fines content, median and total volatile solids con-tent are within the same range as those reported for 1994, beforethe outfall was operating (Quintino et al., 2001; Silva et al.,2004), leads to the conclusion that this sewage discharge systemhas not introduced significant alterations to the coastal sedimentsas far as these baseline descriptors are concerned. The only alter-ation is restricted to the area close to the outfall branches, possibledue to diminishing dissolved oxygen in the upper layers of the sed-iment due to microbial processing of the organic input, as high-lighted by the lower redox potential values.
The use of carbon and nitrogen stable isotopes data gave a newinsight to the identification and traceability of carbon and nitrogensources to sediment near and away from the outfall in this coastalarea. The surface sediments d13C values encountered close to theoutfall branches (�24.2 ± 0.4‰, n = 12) are typical of sewage dis-charges sites in coastal areas. Reinforcing a terrestrial origin, theywere similar or more depleted than values reported in sediments
sis of (A) grain size; (B) total volatile solids; (C) redox potential; (D) total volatile solidsen stable isotope; (G) carbon stable isotope (significance values: *p < 0.05; **p < 0.01;
D E F G
0.1924 3.9961* 0.9815 2.8341*
0.2422 6.1139** 0.6636 7.1047**
1.6382 3.2684** 5.8019** 6.9970**
3.1046* 0.5613 5.1820** 4.7624**
0.9327 0.0921 0.0968 1.52692.3362 1.0425 3.8685* 0.69683.1809* 1.3066 3.9785* 0.00101.734 0.1840 2.2190 2.09021.9738 0.0776 2.6994* 2.8074*
2.7124 0.9517 1.0907 1.6076
AreasA1 A2 A3 A4
Stress: 0.01
9°30'0"W 9°28'0"W 9°26'0"W9°24'0"W
38°40'0"N
38°42'0"N
0 1000 2000 4000 Meters
20 m
30 m50 m
10 m
Abra alba - δ C (‰)< (-20.9)(-20.9) - (-20.0)(-19.9) - (-19.0)> (-19.0)absent
13
9°30'0"W 9°28'0"W 9°26'0"W9°24'0"W
38°40'0"N
38°42'0"N
0 1000 2000 4000 Meters
20 m
30 m50 m
10 m
Abra alba - δ N (‰)4.0 - 4.95.0 - 5.96.0 - 6.9> 6.9absent
15
Fig. 5. Carbon and nitrogen stable isotope composition values in the bivalve Abra alba in the study area and their joint representation on an ordination diagram.
L. Sampaio et al. / Marine Pollution Bulletin 60 (2010) 272–282 279
or sludge for Cranston, Rhode Island (�23.5 ± 0.4‰, n = 12, Gearinget al., 1991), New Jersey (�22.7 ± 0.1‰, n = 8, Van Dover et al.,1992), Edinburgh, Scotland (�23.2 ± 0.1‰, n = 16, Waldron et al.,2001), Wellington, New Zealand (�26.5 ± 0.1‰, Rogers, 2003),and McMurdo Station, Antarctica (�22.4 ± 0.1‰, n = 6, Conlanet al., 2006). Our superficial sediment d15N values near the outfall(2.4 ± 0.9‰, n = 12) are also similar or more depleted than thosefound in San Pedro, California (2.5 ± 0.2‰, n = 4, Sweeney et al.,1980), Deer Island, Massachusetts (3.3‰, n = 1, Tucker et al.,1999), Wellington, New Zealand (2.3 ± 0.3‰, Rogers, 2003), andMcMurdo Station, Antarctica (3.8 ± 0.1‰, n = 3, Conlan et al.,2006). Carbon and nitrogen isotope values in sludge and sedimentsare very similar, as little alteration has occurred during sedimenta-tion and microbial processing (Peters et al., 1978; Sweeney et al.,1980).
A clear spatial pattern, following the origin of organic matter in-puts from the sewage outfall has been observed, accordingly to thespatial variation in both d13C and d15N in both sediments and in the
bivalve A. alba. The stable isotope values reported in this study forthe areas located closer to the outfall are depleted in carbon andnitrogen by comparison to the marine end-members (d13C mean,�21‰, range �24‰ to �18‰; d15N mean, 6‰, range 4–9‰, Fryand Sherr, 1984; Tucker et al., 1999). These depleted values indi-cate a direct sewage influence upon the superficial sediments nearthe outfall branches due to the sewage terrestrial source composi-tion, which no other studied variable was able to point out. For in-stance, terrestrial C3 plants have more depleted d13C (mean, �28‰,range �30‰ to �23‰, Fry and Sherr, 1984; Peterson and Fry,1987) and d15N (mean, 3‰, range�5‰ to 18‰, Hu et al., 2006) val-ues that can produce a relatively high depletion in the sewage iso-topic signal. Moreover, sewage is mainly composed of urea and itshydrolyzed form, ammonia, which is 15N-depleted in relation tod15N of marine nitrates. Part of this ammonia is lost through vola-tilisation, inducing 15N-enrichement in the remaining ammonia(Vizzini and Mazzola, 2004). In untreated or primary treated sew-age, as is the case in the present study, this enrichment is smaller,

Table 5PERMANOVA results for the main tests and values for the t-statistic in the pairwisecomparisons between areas (A1 to A4) for the analysis of Abra alba. df – degrees offreedom; SS – sums of squares; MS – mean square; d15N – nitrogen stable isotope;d13C – carbon stable isotope; significance: *p < 0.05; **p < 0.01; ***p < 0.001.
Source df SS MS Pseudo-F
Nitrogen stable isotope main testAreas 3 13.08 4.36 21.012***
Residuals 8 1.66 0.2075Total 11 14.74
Carbon stable isotope main testAreas 3 31.203 10.401 25.735***
Residuals 8 3.2333 0.4042Total 11 34.437
Pairwise comparisonsAreas d15N d13CA1 vs. A2 3.4874* 3.4146*
A1 vs. A3 6.1828** 5.7991**
A1 vs. A4 7.9021** 6.6221**
A2 vs. A3 2.401 3.8032*
A2 vs. A4 4.2558* 5.2915**
A3 vs. A4 1.9654 1.1
280 L. Sampaio et al. / Marine Pollution Bulletin 60 (2010) 272–282
contributing to depleted d15N values in sewage effluents in com-parison to secondary or tertiary treated sewage (Gaston andSuthers, 2004). Away from the outfall d13C and d15N values startedto be more enriched either due to increase mixing with marineautochthonous sources or to biogeochemical processes that causevariable fractionation effects (Cifuentes et al., 1988). Our d13C val-ues remain fairly constant in the remaining areas, although stillslightly depleted up to 3 km away from the outfall reflecting asmall mixing with marine organic matter. Moreover, the influenceof the Tagus estuary terrestrial organic matter inputs may alsohave contributed to a higher depletion in the d13C values fromthe sediments in areas located further apart from the outfall,namely in the muddy sediments located offshore and closer tothe estuary. Conlan et al. (2006) found significantly depletedd13C, 600 m down current of a sewage outfall in front of McMurdoStation in Antarctica. Nitrogen isotopic values became more en-riched away from the outfall and closer to the marine end-member(mean, 6‰, Tucker et al., 1999) in the farthest areas. In our case,the influence of sewage on this descriptor seemed still very strong1.5 km away from the outfall. Other studies report sewage nitrogeninfluence even further away from the point of discharge. Sweeneyand Kaplan (1980) found organic nitrogen to be predominantly ofsewage origin within 3 km of the outfall pipes near Whites Pointon the San Pedro shelf. In Himmerfjärden, the most elevated d15Nvalues were found within 10 km of the outfall (Savage et al.,2004) and Tucker et al. (1999) noticed some sewage influence insediments at 15 km distance from the outfall in MassachusettsBay. On the other end, nitrogen isotopic values reached referencevalues at a distance of 600 m near the McMurdo Station (Conlanet al., 2006). These studies, however, either do not specify the char-acteristics of the superficial sediments or explicitly mention theirgrain size similarity, or do not relate the isotopic values to thesuperficial sediment type. It is clear from our study that sedimentgrain size may act as a confounding factor in the analysis of nitro-gen. d15N more enriched values appeared in areas with finer sedi-ments. This relationship has not always been observed. Usui et al.(2006) namely, found a correlation between d13C and silt/clay con-tent but not a similar correlation involving d15N, in superficialuncontaminated sediments on the shelf and slope off Tokachi,Western North Pacific. A recent study by Gao et al. (2008) showedlinear correlations between total organic carbon, total nitrogen,and organic carbon and nitrogen stable isotopes in uncontami-nated sediments with mean grain size. Nonetheless, Falcão andVale (1990) refer to higher rates of denitrification that occur in
mud or sandy mud estuarine sediments and this process is associ-ated with the enrichment of the remaining nitrate (Aravena et al.,1993). Biogeochemical processes could be responsible for thishigher nitrogen enrichment (Cifuentes et al., 1988) but consider-able mixing with marine organic matter can also be expected be-cause these values are on the lower limit of the range (4–9‰;Tucker et al., 1999) for organic matter marine sources. A mixingwith the terrestrial organic matter transported by the Tagus Riveroutflow cannot be ruled out and might contribute to keep the d15Nvalues more depleted than the mean marine sources values.
The introduction of analysis of the isotopes in a biological ele-ment, the bivalve A. alba, was important to perceive the extensionof the sewage signal beyond the physical dispersion. The carbonisotopic composition values become more enriched with increas-ing distance from the outfall and show a remarkable variation be-tween the areas closer to the outfall and the farthest areas whencompared to the sediment. This could be related with a switch inthe species feeding mode as we move away from the outfall andnutrient availability decreases. Dame (1996) denotes that A. albacan switch back and forth from suspension feeding and depositfeeding, depending upon the conditions of the environment. In factthe species may take advantage of the turbidity occurrence ordetritus ‘‘rain” near the outfall to assimilate, directly from thewater column, food which has a larger contribution from sew-age-derived terrestrial organic matter, therefore having more de-pleted values of carbon isotope, taking in account the carbonisotope fractionation with trophic level (0–1‰, Fry and Sherr,1984). At larger distances, the contribution from sediment marinedetritus and benthic microalgae (d13C mean, �14.9‰, range �8.5‰
to �20.6‰; d15N mean, +2.2‰, range �1.0‰ to +6.1‰, Currin et al.,1995) is higher and gradually increases the carbon isotope values.A similar trend can be seen in the nitrogen isotopic values taking inaccount the higher enrichment with trophic level (3.4‰, Petersonand Fry, 1987). There is a lower variation with increasing distancefrom the outfall because variation between natural sources is smal-ler with respect to the nitrogen isotope (Currin et al., 1995; Tuckeret al., 1999). Our species isotopic values in the farthest areas arecloser to those reported for that species in Santa Giusta Lagoon,an organic-enriched system connected to the sea to allow nutrientremoval from sewage industrial discharges, after a dystrophicevent in the summer of 2004 (d13C, �16.1 ± 0.1‰; d15N,+9.4 ± 0.1‰; Magni et al., 2008). Waldron et al. (2001) reported�20.5‰ for d13C values and 6.6‰ for d15N values for a similar spe-cies, Abra nitida, beneath a sewage outfall (0 m) discharging in theFirth of Forth into a maximum water depth of 12 m. These valuesare similar to the ones we obtained for A. alba at 500 m away fromthe outfall. They also found an increase in the species isotope val-ues with increasing distance from the outfall and although thenitrogen amplitude was similar to ours, the carbon variation waslesser. The analysis of other benthic species stable isotopes couldoffer a helpful insight towards the sewage-derived isotopic distri-bution in this zone and the species behaviour or adaptation tothe various carbon sources in this coastal environment.
In conclusion, carbon and nitrogen stable isotope ratios analysiswere able to reveal the predominance of organic matter of terres-trial origin near the outfall branches where no other direct variablepointed out the influence of this discharge system to the coastalsediments. Redox potential was so far the single indirect descriptorcapable of showing local alterations to the environmental condi-tions in the vicinity of the outfall branches. Therefore the stableisotope approach contributed to clarify the extension of the sewageimpact in the sediments and confirm that such influence is tracedat up to 250 m away from the diffusers, for sediment bound organ-ic material, and at up to 500 m distance, in the flesh of the bivalveA. alba. This study also reveals the importance of bringing a biolog-ical element into the analysis, as sediment type acted as a con-

L. Sampaio et al. / Marine Pollution Bulletin 60 (2010) 272–282 281
founding factor in the analysis of nitrogen. In conjunction withother monitoring tools, isotopic analysis can thus strengthen theability of coastal resource managers to detect and quantify changesin anthropogenic inputs to the aquatic systems (i.e., Bannon andRoman, 2008), in particular when such inputs are mostly degrad-able and, as in this case, discharged into a coastal area with disper-sive rather than accumulative properties.
Acknowledgements
Leandro Sampaio benefited from a Ph.D. grant (SFRH/BD/18272/2004), given by the Portuguese FCT (Fundação para a Ciência eTecnologia). This work was financed by CESAM own research fundsand by SANEST, S. A. (Project ‘‘Programa de Monitorização Ambien-tal do Emissário Submarino e da ETAR da Guia do Sistema Multi-municipal de Saneamento da Costa do Estoril”).
References
Anderson, M.J., 2001a. A new method for non-parametric multivariate analysis ofvariance. Austral Ecology 26, 32–46.
Anderson, M.J., 2001b. Permutation tests for univariate or multivariate analysis ofvariance and regression. Canadian Journal of Fisheries and Aquatic Sciences 59,514–530.
Anderson, M.J., ter Braak, C.J.F., 2003. Permutation tests for multifactorial analysis ofvariance. Journal of Statistical Computation and Simulation 73, 85–113.
Anderson, M.J., Gorley, R.N., Clarke, K.R., 2008. PERMANOVA+ for PRIMER: Guide toSoftware and Statistical Methods. PRIMER-E, Plymouth, UK. 214 pp.
Aravena, R., Evans, M.L., Cherry, J.A., 1993. Stable isotopes of oxygen and nitrogen insource identification of nitrate from septic systems. Ground Water 31, 180–186.
Bannon, R.O., Roman, C.T., 2008. Using stable isotopes to monitor anthropogenicnitrogen inputs to estuaries. Ecological Applications 18, 22–30.
Bodin, N., Le Loc’h, F., Hily, C., 2007. Effect of lipid removal on carbon and nitrogenstable isotope ratios in crustacean tissues. Journal of Experimental MarineBiology and Ecology 341, 168–175.
Byers, C., Mills, E.L., Stewart, P.L., 1978. A comparison of methods of determiningorganic carbon in marine sediments with suggestions for a standard method.Hydrobiologia 58, 43–47.
Carabel, S., Godinez-Dominguez, E., Verisimo, P., Fernandez, L., Freire, J., 2006. Anassessment of sample processing methods for stable isotope analyses of marinefood webs. Journal of Experimental Marine Biology and Ecology 336, 254–261.
Cifuentes, L.A., Sharp, J.H., Fogel, M.L., 1988. Stable carbon and nitrogen isotopebiogeochemistry in the Delaware estuary. Limnology and Oceanography 33,1102–1115.
Clarke, K.R., Gorley, R.N., 2006. PRIMER v6: User Manual/Tutorial. PRIMER-E,Plymouth, UK. 190 pp.
Clarke, K.R., Warwick, R.M., 2001. Change in Marine Communities: An Approach toStatistical Analysis and Interpretation, second ed. PRIMER-E, Plymouth, UK. 172pp.
Conlan, K.E., Rau, G.H., Kvitek, R.G., 2006. d13C and d15N shifts in benthicinvertebrates exposed to sewage from McMurdo Station, Antarctica. MarinePollution Bulletin 52, 1695–1707.
Currin, C.A., Newell, S.Y., Paerl, H.W., 1995. The role of standing dead Spartinaalterniflora and benthic microalgae in salt marsh food webs: considerationsbased on multiple stable isotope analysis. Marine Ecology Progress Series 121,99–116.
Dame, R.F., 1996. Ecology of Marine Bivalves: An Ecosystem Approach. CRC Press,Boca Raton, Florida, USA. 254 pp.
Deegan, L.A., Garritt, R.H., 1997. Evidence for spatial variability in estuarine foodwebs. Marine Ecology-Progress Series 147, 31–47.
Doeglas, D.J., 1968. Grain-size indices, classification and environment.Sedimentology 10, 8–82.
Falcão, M., Vale, C., 1990. Study of the Ria Formosa ecosystem: benthic nutrientremineralisation and tidal variability of nutrients in the water. Hydrobiologia207, 137–146.
Freitas, R., Sampaio, L., Oliveira, J., Rodrigues, A.M., Quintino, V., 2006. Validation ofsoft bottom benthic habitats identified by single beam acoustics. MarinePollution Bulletin 53, 72–79.
Fry, B., Sherr, E.B., 1984. d13C measurements as indicators of carbon flow in marineand fresh-water ecosystems. Contributions in Marine Science 27, 13–47.
Gao, J.H., Wang, Y.P., Pan, S.M., Zhang, R., Li, J., Bai, F.L., 2008. Spatial distributions oforganic carbon and nitrogen and their isotopic compositions in sediments of theChangjiang Estuary and its adjacent sea area. Journal of Geographical Sciences18, 46–58.
Gaston, T.F., Suthers, I.M., 2004. Spatial variation in d13C and d15N of liver, muscleand bone in a rocky reef planktivorous fish: the relative contribution of sewage.Journal of Experimental Marine Biology and Ecology 304, 17–33.
Gearing, P.J., Gearing, J.N., Maughan, J.T., Oviatt, C.A., 1991. Isotopic distribution ofcarbon from sewage sludge and eutrophication in the sediments and food webof estuarine ecosystems. Environmental Science and Technology 25, 295–301.
Hu, J., Peng, P., Jia, G., Mai, B., Zhang, G., 2006. Distribution and sources of organiccarbon, nitrogen and their isotopes in sediments of the subtropical Pearl Riverestuary and adjacent shelf, Southern China. Marine Chemistry 98, 274–285.
Jacob, U., Mintenbeck, K., Brey, T., Knust, R., Beyer, K., 2005. Stable isotope food webstudies: a case for standardized sample treatment. Marine Ecology-ProgressSeries 287, 251–253.
Kauppila, P., Weckstrom, K., Vaalgamaa, S., Korhola, A., Pitkanen, H., Reuss, N., Drew,S., 2005. Tracing pollution and recovery using sediments in an urban estuary,northern Baltic Sea: are we far from ecological reference conditions? MarineEcology-Progress Series 290, 35–53.
Liu, M., Hou, L.J., Xu, S.Y., Ou, D.N., Yang, Y., Yu, J., Wang, Q., 2006. Organic carbonand nitrogen stable isotopes in the intertidal sediments from the YangtzeEstuary, China. Marine Pollution Bulletin 52, 1625–1633.
Machás, R., Santos, R., Peterson, B., 2003. Tracing the flow of organic matter fromprimary producers to filter feeders in Ria Formosa lagoon, southern Portugal.Estuaries 26, 846–856.
Magni, P., Rajagopal, S., van der Velde, G., Fenzi, G., Kassenberg, J., Vizzini, S.,Mazzola, A., Giordani, G., 2008. Sediment features, macrozoobenthicassemblages and trophic relationships (d13C and d15N analysis) followinga dystrophic event with anoxia and sulphide development in the SantaGiusta lagoon (western Sardinia, Italy). Marine Pollution Bulletin 57, 125–136.
McClelland, J.W., Valiela, I., 1998. Changes in food web structure under the influenceof increased anthropogenic nitrogen inputs to estuaries. Marine Ecology-Progress Series 168, 259–271.
Ogrinc, N., Fontolan, G., Faganeli, J., Covelli, S., 2005. Carbon and nitrogen isotopecompositions of organic matter in coastal marine sediments (the Gulf of Trieste,N Adriatic Sea): indicators of sources and preservation. Marine Chemistry 95,163–181.
Owen, R.B., Lee, R., 2004. Human impacts on organic matter sedimentation in aproximal shelf setting, Hong Kong. Continental Shelf Research 24, 583–602.
Pearson, T.H., Rosenberg, R., 1978. Macrobenthic succession in relation to organicenrichment and pollution of the marine environment. Oceanography andMarine Biology Annual Review 16, 229–311.
Pearson, T.H., Stanley, S.O., 1979. Comparative measurement of the redox potentialof marine sediments as a rapid means of assessing the effect of organicpollution. Marine Biology 53, 371–379.
Peters, K.E., Sweeney, R.E., Kaplan, I.R., 1978. Correlation of carbon and nitrogenstable isotope ratios in sedimentary organic matter. Limnology andOceanography 23, 598–604.
Peterson, B.J., Fry, B., 1987. Stable isotopes in ecosystem studies. Annual Review ofEcology and Systematics 18, 293–320.
Quintino, V., Rodrigues, A.M., Gentil, F., 1989. Assessment of macrozoobenthiccommunities in the lagoon of Óbidos, western coast of Portugal. Scientia Marina53, 645–654.
Quintino, V., Rodrigues, A.M., Ré, A., Pestana, M.A., Silva, S., Castro, H., 2001.Sediment alterations in response to marine outfall operation off Lisbon,Portugal: a Sediment Quality Triad study. Journal of Coastal Research SpecialIssue 34, 535–549.
Rogers, K.M., 1999. Effects of sewage contamination on macro-algae and shellfish atMoa Point, New Zealand using stable carbon and nitrogen isotopes. NewZealand Journal of Marine and Freshwater Research 33, 181–188.
Rogers, K.M., 2003. Stable carbon and nitrogen isotope signatures indicate recoveryof marine biota from sewage pollution at Moa point, New Zealand. MarinePollution Bulletin 46, 821–827.
Ryba, S.A., Burgess, R.M., 2002. Effects of sample preparation on the measurement oforganic carbon, hydrogen, nitrogen, sulfur, and oxygen concentrations inmarine sediments. Chemosphere 48, 139–147.
Sarà, G., Scilipoti, D., Milazzo, M., Modica, A., 2006. Use of stable isotopes toinvestigate dispersal of waste from fish farms as a function of hydrodynamics.Marine Ecology-Progress Series 313, 261–270.
Savage, C., Leavitt, P.R., Elmgren, R., 2004. Distribution and retention of effluentnitrogen in surface sediments of a coastal bay. Limnology and Oceanography 49,1503–1511.
Silva, S., Ré, A., Pestana, P., Rodrigues, A., Quintino, V., 2004. Sediment disturbanceoff the Tagus Estuary, Western Portugal: chronic contamination, sewage outfalloperation and runoff events. Marine Pollution Bulletin 49, 154–162.
Spies, R.B., Kruger, H., Ireland, R., Rice, D.W., 1989. Stable isotope ratios andcontaminant concentrations in a sewage-distorted food web. Marine Ecology-Progress Series 54, 157–170.
Sweeney, R.E., Kalil, E.K., Kaplan, I.R., 1980. Characterization of domestic andindustrial sewage in Southern-California coastal sediments using nitrogen,carbon, sulfur and uranium tracers. Marine Environmental Research 3, 225–243.
Sweeney, R.E., Kaplan, I.R., 1980. Tracing flocculent industrial and domestic sewagetransport on San Pedro Shelf, Southern California, by nitrogen and sulphurisotope ratios. Marine Environmental Research 3, 215–224.
Teece, M.A., Fogel, M.L., 2004. Preparation of ecological and biochemical samples forisotope analysis. In: De Groot, P.A. (Ed.), Handbook of Stable Isotope AnalyticalTechniques, Vol. 1. Elsevier, Amsterdam, pp. 177–202.
Tesi, T., Miserocchi, S., Goni, M.A., Langone, L., Boldrin, A., Turchetto, M., 2007.Organic matter origin and distribution in suspended particulate materials andsurficial sediments from the western Adriatic Sea (Italy). Estuarine Coastal andShelf Science 73, 431–446.
Tewfik, A., Rasmussen, J.B., McCann, K.S., 2005. Anthropogenic enrichment alters amarine benthic food web. Ecology 86, 2726–2736.

282 L. Sampaio et al. / Marine Pollution Bulletin 60 (2010) 272–282
Tucker, J., Sheats, N., Giblin, A.E., Hopkinson, C.S., Montoya, J.P., 1999. Using stableisotopes to trace sewage-derived material through Boston Harbor andMassachusetts Bay. Marine Environmental Research 48, 353–375.
Usui, T., Nagao, S., Yamamoto, M., Suzuki, K., Kudo, I., Montani, S., Noda, A.,Minagawa, M., 2006. Distribution and sources of organic matter in surficialsediments on the shelf and slope off Tokachi, western North Pacific, inferredfrom C and N stable isotopes and C/N ratios. Marine Chemistry 98, 241–259.
Van Dover, C.L., Grassle, J.F., Fry, B., Garritt, R.H., Starczak, V.R., 1992. Stable isotopeevidence for entry of sewage-derived organic material into a deep-sea foodweb. Nature 360, 153–156.
Vizzini, S., Mazzola, A., 2003. Seasonal variations in the stable carbon andnitrogen isotope ratios (13C/12C and 15N/14N) of primary producers andconsumers in a western Mediterranean coastal lagoon. Marine Biology 142,1009–1018.
Vizzini, S., Mazzola, A., 2004. Stable isotope evidence for the environmental impactof a land-based fish farm in the western Mediterranean. Marine PollutionBulletin 49, 61–70.
Vizzini, S., Mazzola, A., 2006. The effects of anthropogenic organic matter inputs onstable carbon and nitrogen isotopes in organisms from different trophic levelsin a southern Mediterranean coastal area. Science of the Total Environment 368,723–731.
Vizzini, S., Savona, B., Caruso, M., Savona, A., Mazzola, A., 2005. Analysis of stablecarbon and nitrogen isotopes as a tool for assessing the environmental impactof aquaculture: a case study from the western Mediterranean. AquacultureInternational 13, 157–165.
Waldron, S., Tatner, P., Jack, I., Arnott, C., 2001. The impact of sewage discharge in amarine embayment: a stable isotope reconnaissance. Estuarine Coastal andShelf Science 52, 111–115.